what’s at the heart of bapcor?
TRANSCRIPT

BA
PC
OR
| An
nu
Al R
ep
oR
t 2021
WHAT’S AT THE HEART OF BAPCOR?
Annual Report 2021

WE ARE THE UNSEEN PARTS OF EVERY JOURNEY
At the heart of Bapcor 02
performance Highlights 14
Chair’s Report 16
Ceo’s Report 18
Strategic priorities and targets 20
Business update 22
Sustainability Report 31
Board of Directors 38
Management team 40
Directors’ Report 42
Financial Report 82
Shareholder Information 142
Corporate Directory 145
CONTENTS

WHO IS BAPCOR?Bapcor Limited is Asia Pacific’s leading provider of vehicle parts, accessories, equipment, service and solutions. From our origins as Burson Auto Parts in 1971, Bapcor has since grown into a vertically integrated business servicing trade, wholesale and retail customers. Bapcor’s reach now extends across c.1,100 locations and employs approximately 5,000 team members across Australia, New Zealand and Asia.
1
BApCoR / AnnuAl RepoRt 2021

WE ARE ASIA PACIFIC’S LEADING PROVIDER OF VEHICLE PARTS, ACCESSORIES, EQUIPMENT, SERVICE AND SOLUTIONS
750K+ CAR PARTS
400K+ TRUCK PARTS
2
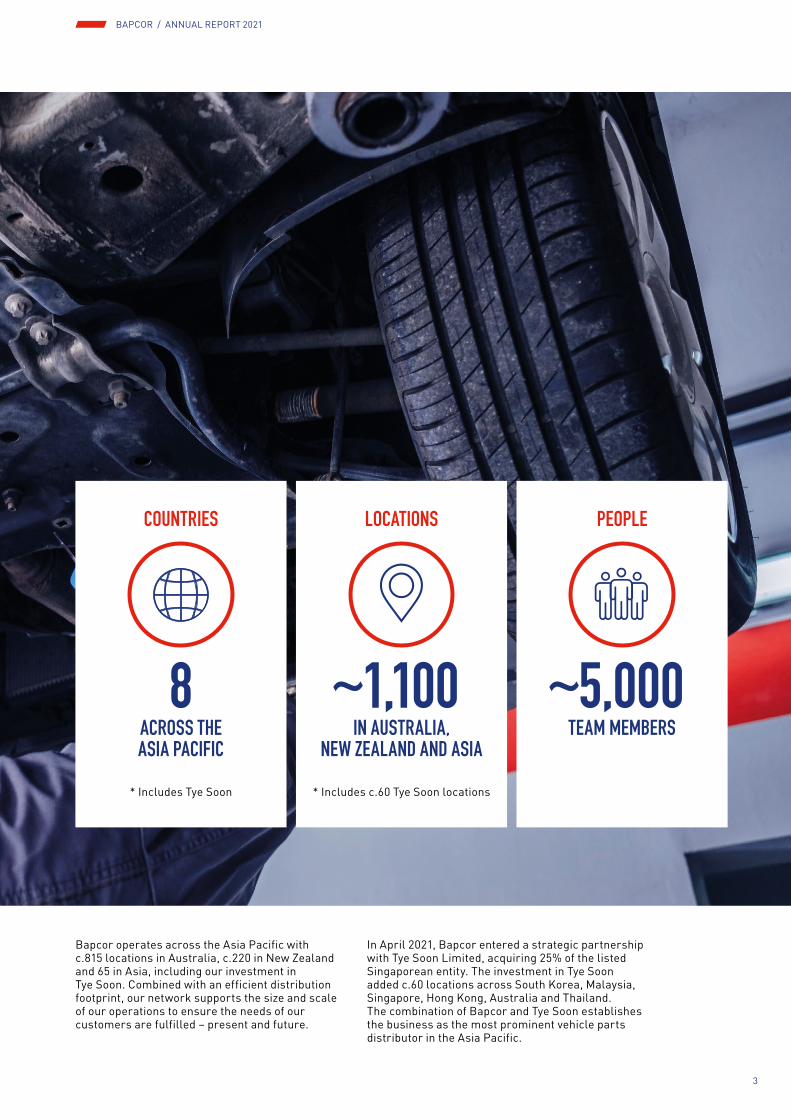
Bapcor operates across the Asia pacific with c.815 locations in Australia, c.220 in new Zealand and 65 in Asia, including our investment in tye Soon. Combined with an efficient distribution footprint, our network supports the size and scale of our operations to ensure the needs of our customers are fulfilled – present and future.
In April 2021, Bapcor entered a strategic partnership with tye Soon limited, acquiring 25% of the listed Singaporean entity. the investment in tye Soon added c.60 locations across South Korea, Malaysia, Singapore, Hong Kong, Australia and thailand. the combination of Bapcor and tye Soon establishes the business as the most prominent vehicle parts distributor in the Asia pacific.
LOCATIONS
IN AUSTRALIA, NEW ZEALAND AND ASIA
* Includes c.60 tye Soon locations
~1,100
COUNTRIES
8ACROSS THE ASIA PACIFIC
* Includes tye Soon
PEOPLE
TEAM MEMBERS~5,000
3
BApCoR / AnnuAl RepoRt 2021

WE ARE A GROUP OF SPECIALIST BUSINESSES Bapcor has businesses spanning the automotive aftermarket supply chain covering the Trade, Specialist Wholesale, Retail and Service activities.
Greater than 80% of the Bapcor business is trade based.
We differentiate ourselves from our competitors through a clear delineation of our segments across the aftermarket supply chain. Our segments fulfil the needs of our customers and deliver an exceptional product and service offering through specialist knowledge and expertise in:
TRADE › specific focus on supplying automotive trade workshops
in Australia, New Zealand and Thailand
SPECIALIST WHOLESALE › product focused, specialist businesses with
market leading knowledge, product range and depth in automotive electrical, batteries, suspension, braking, engine management/electronics, diesel, cooling and 4WD as well as commercial vehicles
RETAIL › omni-channel experience through a modernised
brick wand mortar store network and digital retail offering
4

DELIVERING SPECIALIST PRODUCTS AND ADVICE FOR RESPECTIVE CUSTOMER GROUPS
CUSTOMER GROUP
BAPCOR ENTITIES SERVING
RESPECTIVE CUSTOMER
GROUP
DISTRIBUTOR/ RESELLER WORKSHOP END CONSUMER
5
BApCoR / AnnuAl RepoRt 2021

WE HAVE A PLAN AND ARE WELL POSITIONED TO GROWBapcor has a clear growth strategy that has been consistently delivering since listing in 2014 and significant growth potential still remains in Australia, New Zealand and Asia.
Drive expansion of network footprint – physical and online
› Grow existing store sales
› Develop our network footprint
– Grow absolute number of stores
– Roll out improved concepts to differentiate against our competitors
– provide customers with online offering to supplement physical stores
› Geographic expansion in Asia
Supplement market leading brands with Bapcor own brand products
› Moving closer to the manufacturer where capability exists and consistent with trade and Retail strategies
› Implement in-field marketing resources to promote brands
WITH OUR TEAM MEMBERS, SAFETY, THE ENVIRONMENT AND OUR CUSTOMERS ALWAYS AT THE CORE OF WHAT WE DO
6

Realise benefits and efficiencies of the Bapcor Group
› eSG > develop and deliver deep commitments to become net carbon neutral
› Invest in key systems, digital solutions & data driven analytics
› procurement > utilise Bapcor’s scale to deepen supply relationships and financial benefits
› leverage group logistics capability > deliver operational excellence and optimise supply chain benefits
› Cohesive brand architecture > effective marketing spend
› utilise store networks to reach customers > increase addressable market
Invest in our team members
› enhance organisational capability by investing in our team member’s development
– Structured learning and development across the group
– Key functional capabilities – sales excellence, pricing, procurement, product capability, brand management
– leadership development
– online training and development
– Be an employer of choice
7
BApCoR / AnnuAl RepoRt 2021

SOUTH KOREALocations 20 tye Soon limited branches (operating as Sejong parts plus limited liability Company)
MALAYSIA Locations 15 tye Soon limited branches (operating as naga Jaya Group)
THAILANDLocations 6 plus 1 tye Soon limited branch (operating as pal everts Co., ltd)Team members 70FY21 Revenue $5m
AUSTRALIALocations c.815. plus 20 tye Soon limited branches (operating as Imparts Group)Distribution centres 26Team members 4,400FY21 Revenue $1,587m*
* Includes intersegment sales.
8

WE ARE GROWING OUR FOOTPRINT
HONG KONGLocations 1 tye Soon limited branch (operating as tSC enterprise (HK) ltd)
SINGAPORELocations 2 tye Soon limited branches
INDONESIAWholesale distribution
NEW ZEALANDLocations c.220Distribution centres 2Team members 560FY21 Revenue $170m
9
BApCoR / AnnuAl RepoRt 2021

WE ARE RESPONSIBLE AND COMMITTEDBapcor recognises that a sustainable and successful business is integrated in the health and safety of our team members and optimising business operations in a socially and environmentally responsible manner.
Positively impact our community › Engage stakeholders and support
the communities in which we operate
› Every Bapcor location supports at least two local community groups
Environmental sustainability › Aspire to be net carbon neutral
› Efficiently use resources
› Optimise our fleet
› Environmental benefits from the Victorian DC – to be replicated in Queensland
› Streamlined waste and recycling initiatives
› Continued contribution to Australia reforestation projects
ESG AND SUSTAINABILITY COMMITMENT WITH ASPIRATIONS TO BE NET CARBON NEUTRAL
10

Ethical supply chain/ procurement › Ethical sourcing
› Forge strong supplier relationships
› Enhance transparency in our supply chain through use of supplier self-assessment and/or independent audits
› Continued developments and improvements to our Modern Slavery Framework
Good governance – supporting and developing our people › Uphold our values and code of conduct
› Enhance the health, safety, training and development of our team members
› Foster a diverse, engaging and inclusive workplace
› Focus on four key areas of diversity – gender, age, disability & ethnicity
› Pay fair share of tax in all jurisdictions
11
BApCoR / AnnuAl RepoRt 2021
WE ARE A RESILIENT TEAM
DIVERSITY
INCLUSION
RESILIENCE
Bapcor prides itself in the diversity, resilience, and adaptability of its workforce. Employing approximately 5,000 team members across Australia, New Zealand and Asia, our team delivered record financial outcomes for the business and our shareholders in FY21.
12

DIVERSITY, RESILIENCE AND ADAPTABILITY
EMPOWERMENT
TEAM WORK
SAFETY
COMMUNITY
LEADERSHIP
ADAPTABILITY
ENGAGEMENT
13
BApCoR / AnnuAl RepoRt 2021

WE DELIVER RESULTS
REVENUE EPS EBITDA
NPAT – PRO-FORMA
DIVIDENDS
26%18%
31%
34%
15%
FY14 TO FY21 CAGR FY14 TO FY21 CAGR
FY14 TO FY21 CAGR
FY14 TO FY21 CAGR
FY15 TO FY21 CAGR
SHARE PRICE 30 JUNE
22%FY14 TO FY21 CAGR
14

FY14 FY15 FY16 FY17 FY18 FY19 FY20 FY21
Revenue ($’m) 342 375 686 1,014 1,237 1,297 1,463 1,762
EPS (cents) 11.9 13.6 17.9 24.4 31.0 33.4 30.2 38.3
EBITDA ($’m) 36.0 41.5 77.0 117.4 150.0 164.6 217.1 279.5
Pro-forma NPAT ($’m) 19.4 23.1 43.6 65.8 86.5 94.3 88.7 130.1
Dividends (cents) 0 8.7 11.0 13.0 15.5 17.0 17.5 20.0
Share price 30 June ($) 2.12 3.40 5.52 5.49 6.55 5.58 5.90 8.50
Note: 1. The above table presents the pro-forma results of the Group between FY14 and FY21.2. FY14 to FY19 EBITDA excludes the impact of AASB16 Leases. At a NPAT level, the impact of AASB16 Leases is negligible.
BApCoR / AnnuAl RepoRt 2021
15

CHAIR’S REPORT
We bolstered our presence in Asia, acquiring a 25% interest in Tye Soon Limited in April 2021 to further establish Bapcor as the leading provider of vehicle parts, accessories, service and solutions in Asia Pacific.
16
I am delighted to present my first annual report for the year ended 30 June 2021 (FY21) as Chair of Bapcor Limited.
the 2021 financial year delivered record results across Bapcor despite ongoing challenges and uncertainty in a Covid environment. the Bapcor team delivered record annual revenue and earnings proving their resilience, dedication, and adaptability with a strong response to the unprecedented circumstances.
A final fully franked dividend of 11.0 cents per share has been announced by the Board. this brings the full year fully franked dividend to 20.0 cents per share in FY21, representing a 14.3% increase on the prior year.
the safety and well-being of our team members remain at the forefront of Bapcor’s priorities. We reviewed our workplace Covid safe plans, rolled out wellness programs focused on mental health, introduced paid pandemic leave and encouraged working from home where possible. Succession planning and individual development plans were also completed across the business over the course of the year.
In September 2020 Bapcor welcomed two new Independent Directors to the Board, Mark powell and James todd, as part of the Board renewal and succession planning. We anticipate in FY22 adding a further Independent Director.
At the 2020 Annual General Meeting, shareholders delivered a first strike on Bapcor’s Remuneration Report. the Board acknowledges the sentiments of shareholders with the Chair of the Board and the Chair of the nomination and Remuneration Committee subsequently meeting with major shareholders and proxy advisers to gain a better understanding of their concerns. In response, Bapcor has changed and strengthened many parts of its Remuneration practices, which are outlined in detail in the 2021 Remuneration Report included in this Annual Report.
the Board and the executive team are committed to accelerating our work to deliver on our environmental, social and governance (eSG) strategy as outlined on page 32. to emphasise the importance of this area the scope of the nomination and Remuneration Committee has been expanded to include eSG and as such the committee has been renamed the nomination, Remuneration, environmental, Social and Governance Committee (“nReSGC”). the nReSGC charter has been expanded to ensure a focus by the committee in these areas. the initiatives underway in the Group include a continuation of the successful activities
implemented to date as well as new initiatives that will enable Bapcor to further enhance the company’s eSG efforts and deliver tangible outcomes, consistent with the vision that Bapcor aspires to be net carbon neutral.
In line with our strategic priorities, Bapcor continued to expand its physical footprint in FY21. Bapcor now operates approximately 1,100 locations and employs approximately 5,000 team members across Australia, new Zealand and Asia. Burson celebrated its 50th anniversary and opened its 200th store in Delacombe, Victoria. We bolstered our presence in Asia, acquiring a 25% interest in tye Soon limited in April 2021 to further establish Bapcor as the leading provider of vehicle parts, accessories, service and solutions in Asia pacific.
In line with the annual review of Bapcor’s strategy and reflecting the exceptional progress made in FY21, the 5-year strategic targets for Bapcor have been updated and are outlined on page 20. physical store and own brand targets have been revised upwards. Annual new store and refurbishment/relocation targets have also been added. the revised 5-year strategic targets will ensure Bapcor maintains its strong growth trajectory.
to bring our renewed strategic targets to fruition and ensure stability during these challenging times, our Chief executive officer and Managing Director, Darryl Abotomey and the Board agreed to extend Darryl’s leadership of Bapcor through to 31 october 2023.
I would also like to acknowledge Andrew Harrison’s outstanding contribution in shaping Bapcor to be the business it is today. Andrew retired from his position as Chairman after 7 years with the company, including 4 years as an Independent non-executive Director. We extend Andrew and his family our very best wishes for his retirement.
the success of Bapcor is in our people. on behalf of the Board, I wish to express my gratitude to our leadership team and to all Bapcor team members for an exceptional year. We also thank our shareholders, franchisees, customers and suppliers for their ongoing support and contribution to the continued success of Bapcor.
Margaret Haseltine Chair
17
BApCoR / AnnuAl RepoRt 2021

CEO’S REPORT
FY21 was an incredible year – full of many highs and many lows. The lows were around the impact of the Covid pandemic; however, it was our team members that rose to the occasion and enabled Bapcor to deliver record results and many other achievements throughout the year – despite the ongoing challenges of the pandemic.
our team members, supported by our suppliers, franchisees and customers make Bapcor the highly successful business it has been since listing on the ASX in 2014 – with FY21 being the pinnacle so far in the company’s performance.
During FY21, an increased number of our team members accessed our employee Assistance program, as the rigours of the Covid pandemic and the frustration of the continual lockdowns took their toll. the health and safety of our team members is of paramount importance. We introduced pandemic leave to assist during the lockdowns.
We introduced the Bapcor Champion Awards to recognise and acknowledge team members who live our Values – ‘We give a damn, We are in it together, We get it done, We do the right thing’ – each and every day. nominated by the people, for the people. Since inception in october 2020 over 483 nominations have been received from fellow team members and we have awarded 35 winners.
We were very pleased to announce that given Bapcor’s highly successful year, all eligible full-time team members will receive a special bonus of $300 in August 2021 and another $300 in March 2022, with eligible part time and casual team members to receive $150 on each occasion.
What were the record results referred to?
› Revenue of $1,762m was up 20% on the prior year;
› pro-forma earnings before interest, tax, depreciation and amortisation “eBItDA” of $280m was up 29%;
› pro-forma net profit after tax “npAt” of $130m was up 47%;
› earnings per share of 38.3c was up 27% despite the fact we issued an additional 19% in equity at the end of FY20; and
› Shareholders benefitted from a 44% increase in the share price between 30 June 2020 and 30 June 2021, as well as an increase of 14.3% in full year dividend.
OPERATIONAL PERFORMANCEevery Bapcor business segment recorded record revenue and record profit. Strong revenue growth, notably in trade, Specialist Wholesale and Retail was underpinned by increased market share, ongoing network expansion, growth in own brand products and elevated market demand. profit growth resulted from top line sales growth, a focus on managing costs, constrained expenditure due to Covid restrictions including training and travel as well as the group delivering profitable expansion of the store networks.
In FY21 the group also invested in and upgraded the technology to support growth in the business, including:
› launching new or upgraded eCommerce systems in Retail B2C, trade B2B in Australia, new Zealand and thailand;
› launched a new online booking platform for vehicle servicing;
18

› Implemented an inventory forecasting and management system, as well as upgraded numerous eRp systems, expanded the data warehouse and implemented a new safety incident reporting system; and
› Commenced work on a new CRM system and a time & attendance system.
SUPPLY CHAINone of the major focuses of the group is to have the most efficient supply chain in our market. In pursuit of this goal we have built a state-of-the-art distribution centre (“DC”) at tullamarine in Victoria. the current 13 DCs the group operates in Victoria will progressively be merged into this new facility during the current financial year. the DC commenced operating in April 2021 with the retail DC being transitioned into it. the “Goods to person” system (a semi-automated highly efficient picking system) was commissioned in June 2021.
the new DC has been built to be environmentally efficient in lighting, water, energy, waste and will significantly reduce transport emissions. When fully operational, it is expected that the DC will reduce operating costs by $10m per annum and also reduce inventory levels by $8m.
Also, as part of the long-term plan for our supply chain, we will be building another state-of-the-art DC in Brisbane, Queensland, that will further enhance our efficiencies in costs and in sustainability.
BAPCOR ASIAover the last three years Bapcor has been establishing a trade business in thailand, where we now have six stores operating. unfortunately, the Covid pandemic has hit thailand hard, restricting the business operations and our ability to expand. once we get through the Covid impact we plan to expand the business further in thailand.
In April 2021, Bapcor acquired a 25% ownership of the Singapore listed tye Soon ltd. tye Soon has revenues of SGD 220 million per annum, with c.60 trade stores operating in Australia, Malaysia, South Korea, Singapore and wholesale operations in Singapore, Hong Kong and Indonesia. tye Soon is the most prominent vehicle parts distributor in Asia. the opportunity to work with tye Soon provides an excellent platform for Bapcor and tye Soon to become the largest vehicle parts distributor in the Asia pacific.
OUTLOOKBapcor’s businesses operate in vehicle parts distribution, an industry that continues to grow, with solid market fundamentals, including significant opportunities for network expansion (both physical & online), improved supply chain efficiencies as well as growth in our own brand products. Bapcor’s team members have consistently executed on our strategy and delivered strong growth and returns to shareholders. We are excited that there is a lot more to come, with opportunities across every segment of our business. We have released our updated five-year strategic targets which are included on page 20 of this report.
Bapcor is committed to growing shareholder value which we believe requires consideration of all key stakeholders – our team, customers, suppliers, community, environment and by doing the right thing. Bapcor focuses on delivering these everyday through our Values.
the vehicle parts distribution industry is not a cyclical business but is dependent on vehicle utilisation, which does not tend to vary significantly regardless of economic conditions. the fundamentals of the industry remain strong, with trends established during Covid likely to continue, including the increased level of vehicles in use with record sales of secondhand cars, travelers seeking social distancing and moving away from public transport, as well as people spending their holidays domestically and utilising their vehicles. Whilst lockdowns and government restrictions are unpredictable and do have an impact on the business, in FY22, Bapcor aims to deliver pro-forma earnings at least at the level of FY21.
I would particularly like to acknowledge the contribution of our team members, franchisees, suppliers, and customers as it is this group that makes Bapcor the great business it is today – the only Asia pacific business that supplies parts for all on road vehicles.
Darryl Abotomey Managing Director & Chief Executive Officer
19
BApCoR / AnnuAl RepoRt 2021

WE HAVE STRATEGIC PRIORITIES AND TARGETSUnderpinned by our core strategic pillars (highlighted on page 6) are a clear set of targets to drive future growth and shareholder value.
ESG
Accelerate our efforts in ESG with a long-term view of being
NET CARBON NEUTRAL
With a record result in FY21, strong balance sheet and
robust cash flows, Bapcor is well positioned to deliver
on these targets to ensure the continued growth and sustained
success of the Bapcor Group.
20

OWN BRAND
GROW OUR OWN BRAND PROGRAMS
GROWTH
GROW THE NETWORK
INVEST
INVEST IN STORE REFURBISHMENTS & RELOCATIONS Maintain our competitive advantage with regard to location concepts
SUPPLY CHAIN INITIATIVES
DELIVER SUPPLY CHAIN INITIATIVES AND INVEST IN TECHNOLOGY Support growth, drive profitability and be a competitive advantage for Bapcor
Increase market penetration of own brand products and improve intercompany sourcing between Bapcor businesses
Increase our footprint from c.1,100 locations to over 1,500 locations across Australia, New Zealand and Asia
OVER THE NEXT 5 YEARS, BAPCOR SEEKS TO
5 year Target
FY21RetailSWGNZTrade
40.0%
30.9%
45.0%
51.7%
65.0%
32.7%
45.0%
29.1%
Retail Asia
Trade
Total ~1,100
Total ›1,500
NZ SWG
5 year Target
FY21RetailSWGNZTrade
40.0%
30.9%
45.0%
51.7%
65.0%
32.7%
45.0%
29.1%
Retail Asia
Trade
Total ~1,100
Total ›1,500
NZ SWG
BApCoR / AnnuAl RepoRt 2021
21

AN OVERVIEWBUSINESS UPDATE
The financial year ended 30 June 2021 (FY21) was a year of record results. Amidst ongoing challenges in the market, Bapcor delivered strong growth in revenue and EBITDA across all business segments. The results achieved in FY21 reinforces the resilience, dedication, and adaptability of our team members who are the foundation of our success.
In line with our business fundamentals, Bapcor continued to:
› Drive network growth to c.1,100 locations across Australia, new Zealand and Asia through new store openings and acquisitions;
› Increase own brand programs and penetration across our segments;
› Invest in technology and infrastructure to improve operational efficiencies; and
› Support the wellbeing of our team members.
Combined with market share gains and elevated market demand, Bapcor increased revenue by 20% to $1,762m and pro-forma eBItDA by 29% to $280m in FY21 – an all-time high for the business.
At 30 June 2021, Bapcor held $447m in inventory (30 June 2020: $363m). Albeit temporary, the high levels of inventory enabled the business to meet increased market demand and achieve record results despite availability constraints from suppliers and global supply chain disruptions.
With higher commodity and fuel prices, Bapcor’s inventory holdings at year end puts the business in a position to meet the continued elevated market demand in FY22. In addition, collections from debtors improved with overdue debts being well below prior year levels.
Intercompany sales across the Group were up 26% relative to the prior comparable period. This increase was driven by continued expansion of our own brand range including the launch of Chicane (hand tools) and Vyking Force (pressure washers and generators) in addition to the implementation of intercompany initiatives to improve alignment on product supply across our business segments.
Consistent with our growth strategy in Asia, Bapcor acquired 25% of the issued equity of tye Soon limited in April 2021. tye Soon limited is an independent automotive parts distributor and is listed on the Singapore Securities exchange. With approximately 60 locations in South Korea,
22

Malaysia, Singapore, Hong Kong, Australia and thailand and an annual revenue of SGD 220 million, the acquisition in tye Soon limited expands our presence in Asia and further establishes Bapcor as the most prominent vehicle parts distributor in Asia pacific.
During the year, Bapcor established a state-of-the-art, environmentally efficient distribution centre located in tullamarine, Victoria. the 50,000m2 Victorian Distribution Centre commenced operating in April 2021 with the transition of the Retail business and in June 2021, the highly automated Goods to person system was commissioned.
this new facility is expected to improve efficiency significantly, with the Goods to person system capable of picking 600 lines per hour compared to 600 lines per day under traditional operations. the Victorian Distribution Centre will also deliver efficiencies in lighting, water, and energy in addition to reducing packing waste and transport greenhouse gas emissions.
13 distribution centres in Melbourne will be consolidated into the new warehouse. Approximately 10,500 pallets were transitioned from the nunawading operations in April 2021 with the remaining Melbourne distribution centres to be relocated progressively in the current financial year. Bapcor will continue to plan for the future and long-term benefit of the Group, with the consolidated distribution centre project to be replicated in Brisbane, Queensland.
Investments in technology progressed, with the launch of upgraded or new B2B and B2C eCommerce platforms in Bapcor trade, Bapcor new Zealand, Bapcor Retail and Bapcor Asia in addition to eRp and CRM system upgrades and consolidations.
With the ongoing impacts of Covid in FY21, Bapcor continued to focus on the health and safety of our team members. Covid safe plans were reviewed, on-site health and safety checks and paid pandemic leave were introduced, and wellness programs were rolled out. We enhanced the development of our team members through the roll out of leadership, succession planning and individual development programs in FY21. Bapcor will also pay a $600 bonus to eligible full time team members in FY22 – incremental to any other incentives they earned – recognising their contribution to a highly successful year.
Revenue EBITDA1
FY21 $’m
FY20 $’m
Change %
FY21 $’m
FY20 $’m
Change %
TRADE 648.9 561.7 15.5% 115.0 96.7 19.0%
NEW ZEALAND 170.0 156.3 8.8% 32.6 26.9 21.2%
SPECIALIST WHOLESALE 659.8 520.4 26.8% 89.5 63.0 42.2%
RETAIL 369.2 292.7 26.1% 65.3 54.3 20.1%
UNALLOCATED/HO (86.2) (68.4) (26.4%) (22.9) (23.8) 3.6%
TOTAL 1,761.7 1,462.7 20.4% 279.5 217.1 28.8%
1. Pro-forma results including AASB16 Leases.
23
BApCoR / AnnuAl RepoRt 2021

2015Burson Group Limited acquires Opposite Lock, a distributor of 4WD parts and accessories.
GOING BACK 50 YEARSBUSINESS UPDATE
Burson Auto Parts was founded by Garry Johnson and Ron Burgoine in 1971 and celebrated 50 years of success during FY21. Burson initially conducted business out of vans, distributing automotive accessories to service stations and automotive outlets on a regular delivery cycle. Burson expanded its product offering by introducing a range of automotive carpet mats as well as other selected lines including car parts.
As the business grew, Garry and Ron soon discovered that workshop customers required parts on call. this resulted in the opening of Burson’s first store in Braybrook, Victoria in 1978. the vans were progressively replaced with auto parts stores where customer requirements could be met within the hour.
In 1986, Garry Johnson acquired Ron Burgoine’s interest in the business before expanding interstate with the opening of Albury, nSW. the business quickly gained momentum opening its 25th store in 1996 and 50th store in 2004.
In 2011, Darryl Abotomey, Bapcor’s current Chief executive officer and Managing Director, led a management buyout, supported by private equity firm, Quadrant private equity, to acquire Burson from Garry. this was followed by listing on the Australian Stock exchange in April 2014 with 114 company-owned stores, 1,200 employees and a turnover of approximately $300m.
Burson continued to expand by acquiring businesses such as Metcash Automotive Holdings, opposite lock, precision equipment, Bearing Wholesalers and Sprint Auto parts. these acquisitions provided additional avenues for growth and broadened the products and services offered.
As the business expanded its product and service offering beyond the scope of the trade automotive aftermarket, Burson was renamed to Bapcor limited in 2016. Burson continues to operate as part of Bapcor trade and has grown to be the largest trade distributor in Australia with 200 locations, providing the highest quality service to automotive workshops for vehicle parts.
24

1971Burson Auto Parts is founded.
1986Garry Johnson buys out Ray Burgoine’s 50% holding.Burson opens its first interstate store in Albury, NSW.
1996Burson opens its 25th store.
2005Burson moves into purpose-built head office and distribution centre in Preston, Victoria.
2011Garry Johnson sells Burson to Management and Quadrant Private Equity.
2014Burson Group Limited lists on the Australian Stock Exchange.
2015Burson Group Limited acquires Metcash Automotive Holdings which encompasses retail and service businesses such as Autobarn, Autopro, Midas, ABS and AAD.
2016Burson Group Limited acquires Precision Equipment, Bearing Wholesalers, and Sprint Auto PartsBurson Group Limited becomes Bapcor Limited.
2021Burson celebrates its 50th anniversaryBurson opens its 200th store.Bapcor celebrates a record year in all measures.
1978Burson opens its first store in Braybrook, Victoria.
2017Bapcor acquires Hellaby New Zealand in an on market “hostile” acquisition and divests non-core businesses in footwear and resource maintenance.
2004Burson opens its 50th store.
BApCoR / AnnuAl RepoRt 2021
25

TRADEBUSINESS UPDATE
FY21 was a year of milestones for Bapcor Trade, delivering record revenue and EBITDA in addition to the celebration of Burson’s 50th anniversary serving the Australian automotive aftermarket and opening of its 200th store.
Bapcor trade, consisting of Burson Auto parts and precision Automotive equipment, increased revenue by 16% driven by ongoing expansion of the Burson network, adding a further 14 stores to reach 200 stores nationwide. Same store sales for Bapcor trade were also up 14%, demonstrating the strength of the underlying network as well as precision equipment contributing a record revenue of $54m in FY21.
eBItDA increased by 19% to $115m and margins expanded to 18% through lower levels of discretionary spending especially in travel and training due to Covid and operating efficiencies.
Burson made continued progress driving own brand sales in FY21. While the relative amount as a percentage of sales remained stable compared with FY20 due to the strong sales growth in FY21, the absolute value of own brand sales still increased by $36m.
Significant progress was made in the area of customer facing technology. Burson’s upgraded B2B eCommerce platform, ezyparts, was launched in April. the new system will improve the customer experience and ease of which customers can transact with Burson by significantly reducing the time required for workshops to identify and order the correct parts for any job.
Burson continued to invest in our team members throughout the year despite Covid restrictions. Adapting to the circumstances, a range of online courses were developed in FY21 including “Managing, leading, and developing people” for all store managers and the “Burselling” sales program for all store managers and sales representatives.
Burson’s involvement in the local communities in which we operate is part of our DnA. We continued to support local community clubs and organisations in FY21 with each Burson store committed to supporting at least two local organisations. Burson also actively invests in grass roots motorsport in Australia with one program being Girls on track – a global, not-for-profit initiative launched by former Formula 1 development driver Susie Wolff. Backed by Motorsport Australia and Burson, the program is offered to schoolgirls aged 8 – 18 with the aim of increasing participation of women in automotive motorsport and grow interest in science, technology, engineering, and mathematics (SteM) subjects and provides an opportunity to experience all components of motorsport.
precision equipment sales of $54m in FY21, up from $39m in FY20 was driven by the successful implementation of precision and Burson equipment programs backed by a pipeline of large workshop projects.
precision equipment opened a new head office and national training facility in Queensland. this training facility is unlike any other in the sector in Australia and aimed at improving effectiveness and quality of workmanship as well as on team member retention.
OWN BRAND SALES 29.1%
LOCATIONS 200
EBITDA MARGIN 17.7%
SAME STORE SALES GROWTH +14.3%
EBITDA $115M
REVENUE $649M
26

NEW ZEALANDBUSINESS UPDATE
FY21 saw Bapcor New Zealand recover above pre-Covid levels despite difficult trading conditions caused by ongoing snap lockdowns and restrictions imposed by the Government.
Comprising trade and Specialist Wholesale businesses, Bapcor new Zealand operates 222 locations across new Zealand. the business continues to build on its existing network footprint, with 10 new locations in FY21 including a “supersite” in Whangarei encompassing Bnt, HCB and Autolign. this new “supersite” in Whangarei adds to existing “supersites” in Auckland, Wellington and Christchurch.
Revenue increased by 9% to $170m and eBItDA was up by 21% to $33m compared to FY20. the financial performance of the business benefitted from a renewed approach to market and focus on sales via marketing campaigns and targeted investments in key inventory groups. Same store sales across Bapcor new Zealand’s trade businesses performed strongly, increasing by 11% in FY21 versus a decline of 9% in FY20. eBItDA margin was 19% in FY21, representing an increase of 2 percentage points relative to the prior period. this margin improvement reflects reduced operating costs and higher levels of own brand sales, with own brand penetration increasing to 31% in FY21 compared to 30% in FY20.
Bapcor new Zealand launched a new B2B eCommerce platform, ezyparts. the user-friendly platform enables trade customers to quickly access, search and order from online catalogues, complete with colour images and specifications. Compatible with smartphones, tablets or desktop computers, the new B2B eCommerce platform will enhance workshops’ ease of doing business.
the precision equipment business experienced excellent growth in automotive and commercial workshop segments, coupled with significant market gains in the new car dealership market, where several large new and refurbishment projects were secured for supply in FY22.
OWN BRAND SALES 30.9%
LOCATIONS 222
EBITDA MARGIN 19.2%
SAME STORE SALES GROWTH: BNT +11.3%
EBITDA $33M
REVENUE $170M
27
BApCoR / AnnuAl RepoRt 2021
SPECIALIST WHOLESALE
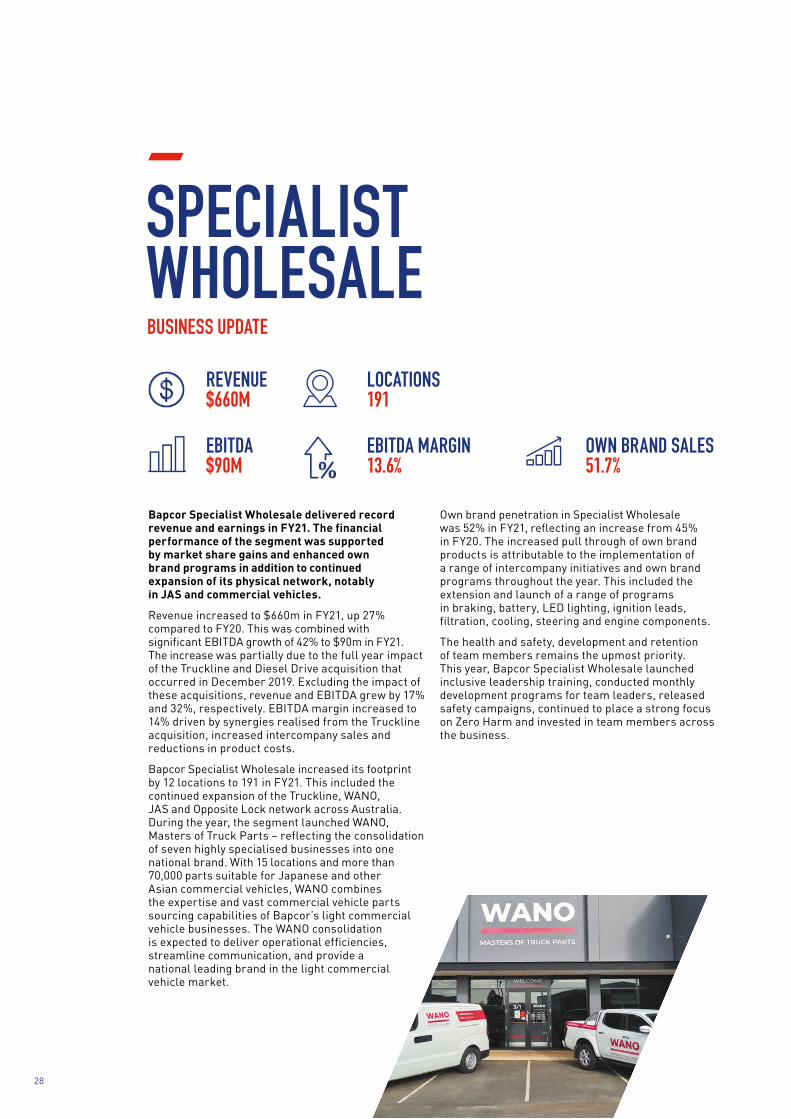
Bapcor Specialist Wholesale delivered record revenue and earnings in FY21. The financial performance of the segment was supported by market share gains and enhanced own brand programs in addition to continued expansion of its physical network, notably in JAS and commercial vehicles.
Revenue increased to $660m in FY21, up 27% compared to FY20. this was combined with significant eBItDA growth of 42% to $90m in FY21. the increase was partially due to the full year impact of the truckline and Diesel Drive acquisition that occurred in December 2019. excluding the impact of these acquisitions, revenue and eBItDA grew by 17% and 32%, respectively. eBItDA margin increased to 14% driven by synergies realised from the truckline acquisition, increased intercompany sales and reductions in product costs.
Bapcor Specialist Wholesale increased its footprint by 12 locations to 191 in FY21. this included the continued expansion of the truckline, WAno, JAS and opposite lock network across Australia. During the year, the segment launched WAno, Masters of truck parts – reflecting the consolidation of seven highly specialised businesses into one national brand. With 15 locations and more than 70,000 parts suitable for Japanese and other Asian commercial vehicles, WAno combines the expertise and vast commercial vehicle parts sourcing capabilities of Bapcor’s light commercial vehicle businesses. the WAno consolidation is expected to deliver operational efficiencies, streamline communication, and provide a national leading brand in the light commercial vehicle market.
own brand penetration in Specialist Wholesale was 52% in FY21, reflecting an increase from 45% in FY20. the increased pull through of own brand products is attributable to the implementation of a range of intercompany initiatives and own brand programs throughout the year. this included the extension and launch of a range of programs in braking, battery, leD lighting, ignition leads, filtration, cooling, steering and engine components.
the health and safety, development and retention of team members remains the upmost priority. this year, Bapcor Specialist Wholesale launched inclusive leadership training, conducted monthly development programs for team leaders, released safety campaigns, continued to place a strong focus on Zero Harm and invested in team members across the business.
BUSINESS UPDATE
OWN BRAND SALES 51.7%
EBITDA MARGIN 13.6%
LOCATIONS 191
EBITDA $90M
REVENUE $660M
28
RETAIL
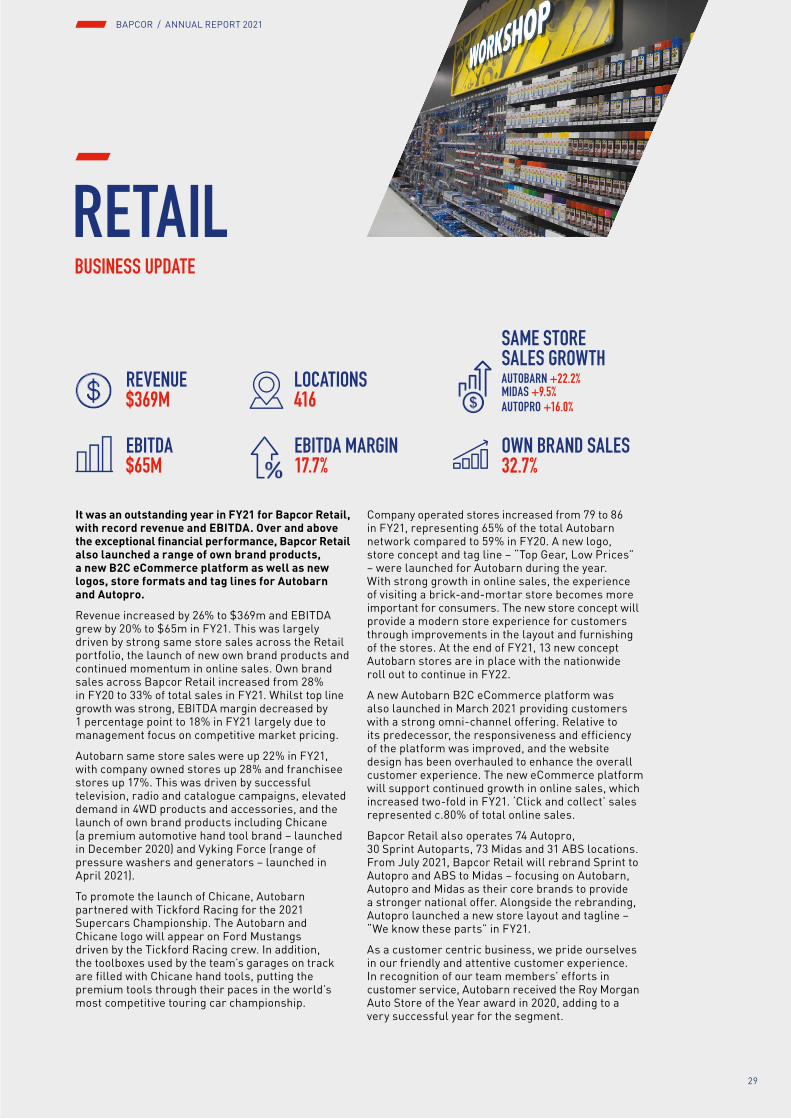
It was an outstanding year in FY21 for Bapcor Retail, with record revenue and EBITDA. Over and above the exceptional financial performance, Bapcor Retail also launched a range of own brand products, a new B2C eCommerce platform as well as new logos, store formats and tag lines for Autobarn and Autopro.
Revenue increased by 26% to $369m and eBItDA grew by 20% to $65m in FY21. this was largely driven by strong same store sales across the Retail portfolio, the launch of new own brand products and continued momentum in online sales. own brand sales across Bapcor Retail increased from 28% in FY20 to 33% of total sales in FY21. Whilst top line growth was strong, eBItDA margin decreased by 1 percentage point to 18% in FY21 largely due to management focus on competitive market pricing.
Autobarn same store sales were up 22% in FY21, with company owned stores up 28% and franchisee stores up 17%. this was driven by successful television, radio and catalogue campaigns, elevated demand in 4WD products and accessories, and the launch of own brand products including Chicane (a premium automotive hand tool brand – launched in December 2020) and Vyking Force (range of pressure washers and generators – launched in April 2021).
to promote the launch of Chicane, Autobarn partnered with tickford Racing for the 2021 Supercars Championship. the Autobarn and Chicane logo will appear on Ford Mustangs driven by the tickford Racing crew. In addition, the toolboxes used by the team’s garages on track are filled with Chicane hand tools, putting the premium tools through their paces in the world’s most competitive touring car championship.
Company operated stores increased from 79 to 86 in FY21, representing 65% of the total Autobarn network compared to 59% in FY20. A new logo, store concept and tag line – “top Gear, low prices” – were launched for Autobarn during the year. With strong growth in online sales, the experience of visiting a brick-and-mortar store becomes more important for consumers. the new store concept will provide a modern store experience for customers through improvements in the layout and furnishing of the stores. At the end of FY21, 13 new concept Autobarn stores are in place with the nationwide roll out to continue in FY22.
A new Autobarn B2C eCommerce platform was also launched in March 2021 providing customers with a strong omni-channel offering. Relative to its predecessor, the responsiveness and efficiency of the platform was improved, and the website design has been overhauled to enhance the overall customer experience. the new eCommerce platform will support continued growth in online sales, which increased two-fold in FY21. ‘Click and collect’ sales represented c.80% of total online sales.
Bapcor Retail also operates 74 Autopro, 30 Sprint Autoparts, 73 Midas and 31 ABS locations. From July 2021, Bapcor Retail will rebrand Sprint to Autopro and ABS to Midas – focusing on Autobarn, Autopro and Midas as their core brands to provide a stronger national offer. Alongside the rebranding, Autopro launched a new store layout and tagline – “We know these parts” in FY21.
As a customer centric business, we pride ourselves in our friendly and attentive customer experience. In recognition of our team members’ efforts in customer service, Autobarn received the Roy Morgan Auto Store of the Year award in 2020, adding to a very successful year for the segment.
REVENUE $369M
LOCATIONS 416
AUTOBARN +22.2%
AUTOPRO +16.0% MIDAS +9.5%
SAME STORE SALES GROWTH
EBITDA $65M
EBITDA MARGIN 17.7%
OWN BRAND SALES 32.7%
BUSINESS UPDATE
29
BApCoR / AnnuAl RepoRt 2021

ASIA
THAILANDPerformance continued to be heavily impacted by the pandemic in FY21 as Thailand dealt with multiple waves of Covid infections.
At 30 June 2021, Burson thailand comprises six locations in addition to a procurement office in Bangkok. expansion of the store footprint was postponed in FY21 and will continue until the impact of the Covid pandemic dissipates. A seventh store is ready to be opened when pandemic restrictions ease.
TYE SOONBapcor continued its expansion into Asia through a 25% acquisition of Tye Soon Limited in April 2021.
established in 1993, tye Soon limited is a distributor of genuine and aftermarket automotive parts in South east and north east Asia. operating c.60 locations in South Korea, Malaysia, Hong Kong, Singapore, Australia and thailand – the acquisition enables Bapcor to access new markets in Asia through key brands such as Sejong parts plus, naga Jaya Group and Imparts Group in Australia.
the complementary expertise of tye Soon and Bapcor will bring a range of opportunities for both businesses to collaborate and further grow their markets.
BUSINESS UPDATE
30

31
BApCoR / AnnuAl RepoRt 2021
WE UNDERSTAND THAT SUSTAINABILITY MATTERS
OUR VISIONBapcor Limited recognises that a sustainable and successful business is enhanced by engaging stakeholders, delivering shareholder wealth and optimising business operations in a socially and environmentally responsible manner. Bapcor seeks to take an integrated approach towards economic, environmental and social sustainability, aligning company values and strategic direction with positive outcomes for Bapcor’s stakeholders and the wider communities in which we operate.
Consistent with this vision, Bapcor aspires to be net carbon neutral and, after establishing a detailed baseline in FY22, we will present our roadmap to achieving this goal.
ESG GOVERNANCEThe Board has incorporated the environmental, social and governance (ESG) function into the Nomination and Remuneration Committee, which has now been renamed to Nomination, Remuneration and ESG Committee. This will serve to further ensure oversight of all ESG matters by the Board and that the long-term strategy of Bapcor is achieved in a sustainable manner that will create value for the Company and shareholders.
OUR FOCUS IN SUSTAINABILITYWith our commitment to the UN Global Compact and following the UN’s implementation framework, we have assessed our key risks and opportunities with regard to the 10 principles to focus our efforts in sustainability. The assessment was undertaken based on our strategy and business model as a vehicle parts distributor through both trade and retail channels – we don’t manufacture products ourselves and we typically procure our products from suppliers in the USA, Japan, Taiwan, Germany, Australia and China.
Given Bapcor’s business model the external focus is on the environmental and social impact of the movement of our products throughout the supply chain. This includes the energy requirements of our warehouses and store network. Sourcing products is the other critical area of focus and we work with our many suppliers, including the likes of GUD, NGK, KYB and Bosch, to ensure that our partners comply with our expectations regarding ethical sourcing. Beyond the attributes of our business model, the success of our business is predicated on our people, our customers and the communities within which we operate.
BUSINESS UPDATE

WE UNDERSTAND THAT SUSTAINABILITY MATTERS (CONT.)
ACCELERATING IMPLEMENTATION OF OUR SUSTAINABILITY STRATEGY
Ethical Supply Chain/Procurement
ethical sourcing, forging strong supplier relationships and enhanced transparency.
ensuring products are sourced from ethical suppliers who comply with requirements such as the Modern Slavery Act.
Environmental Sustainability
Making efficient use of our resources, optimising our fleet, and reducing waste.
net carbon neutral.
Practise Good Governance – Supporting & Developing Our Team Members
upholding our values and code of conduct, enhancing health and safety, training and developing our team members, and fostering a diverse and welcoming workplace.
Positively Impact Our Community
engaging stakeholders and supporting the communities in which we operate.
Our Values
Our Code of Conduct
Bapcor’s ESG Strategy
We give a damn
We are in it together
We get it done
We do the right thing
While Bapcor has invested significant effort in sustainability in the past, in FY21 the Board and management team have made the decision to accelerate our work across each of the four pillars of our sustainability strategy.
The acceleration of Bapcor’s strategy involves both a continuation of the successful activities already implemented as well as new initiatives.
the environmental Sustainability pillar is a particular area of increased focus. to deliver tangible outcomes relating to environmental sustainability an accurate baseline is required to provide the foundation and establish ambitious but realistic targets and a roadmap and timeframe.
We will measure the carbon emissions for the Victorian warehouse network and track the improvements as our current thirteen Victorian warehouses are consolidated into the one distribution centre in tullamarine in Victoria. We expect the consolidation into one distribution centre will materially reduce the amount of freight movements throughout the network and significantly reduce our emissions. In addition, the new Victorian distribution centre has been designed to be highly energy efficient which will result in utilisation of less energy and water as well as use less packaging and more recycling.
A comprehensive overview of all our objectives and initiatives to deliver on our sustainability strategy are outlined in the table on page 36.
32

FY21 SUSTAINABILITY ACTIVITY REVIEWPillar 1: Ethical Supply Chain/Procurement – Publication of Modern Slavery Statement
Modern slavery is incorporated as part of Bapcor’s Governance policies, including in Bapcor’s environmental, Social and Governance (eSG) policy, ethical Supply Chain/procurement (eSC/p) policy and Human Rights policy. these policies acknowledge the impact that our business can have on the communities in which we operate, specifically in the sourcing of products we sell.
Bapcor’s Modern Slavery Statement was approved by the Board of Directors and published in March 2021 and shared with all staff to raise awareness and ensure it is front of mind for our employees when dealing with our suppliers.
Bapcor has a Modern Slavery working group that meets regularly to progress our work in the area with further actions including implementing a risk-based approach to improve transparency in our supply chain through use of supplier self-assessment and/or independent audits.
Pillar 2: Environmental sustainability – Ongoing program delivery
In addition to the Victoria DC consolidation, during the course of FY21 Bapcor has continued with the important initiatives that carried over from FY20 including the Greenfleet Carbon offset program, continued the roll-out of leD replacements across our store network, and realised further positive environmental outcomes through our streamlined waste and recycling initiatives.
Bapcor continues to reduce its carbon footprint and offset emissions by contributing to Australian reforestation projects that protect the local environment, capture carbon emissions, improve soil and water quality, and restore habitat for native wildlife.
Bapcor’s partnership with Greenfleet continues its focus on offsetting greenhouse gas emissions associated with the company vehicle fleet. In 2021, Bapcor has increased its commitment to offset an additional 100 vehicles with Greenfleet, now covering over 1,100 vehicles.
the continued roll-out of the leD replacement program brings the total energy saving to a total of 3.7 million KWh per annum. the waste reduction initiative also continued with the total amount of waste recycled increasing by c.20% compared with FY20. Since inception, this initiative has diverted c.6,200 tonnes of waste (or c.50% of total waste) from landfill.
BAPCOR’S RENEWED COMMITMENT OFFSETS ANOTHER 6,400 TONNES OF CARBON EMISSIONS THROUGH
THE PLANTING OF MORE THAN 40,000 NATIVE TREES PER YEARthat cover an area equivalent to twenty football fields.
33
BApCoR / AnnuAl RepoRt 2021
WE UNDERSTAND THAT SUSTAINABILITY MATTERS (CONT.)
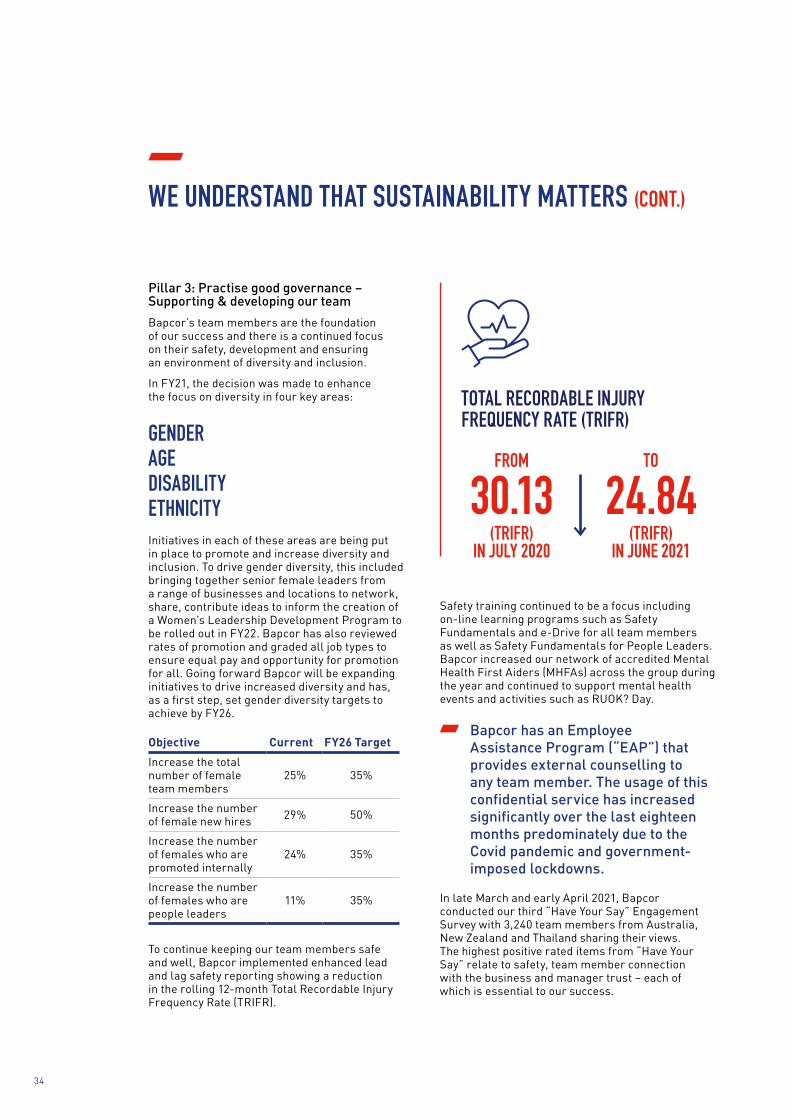
Safety training continued to be a focus including on-line learning programs such as Safety Fundamentals and e-Drive for all team members as well as Safety Fundamentals for people leaders. Bapcor increased our network of accredited Mental Health First Aiders (MHFAs) across the group during the year and continued to support mental health events and activities such as RuoK? Day.
Bapcor has an Employee Assistance Program (“EAP”) that provides external counselling to any team member. The usage of this confidential service has increased significantly over the last eighteen months predominately due to the Covid pandemic and government-imposed lockdowns.
In late March and early April 2021, Bapcor conducted our third “Have Your Say” engagement Survey with 3,240 team members from Australia, new Zealand and thailand sharing their views. the highest positive rated items from “Have Your Say” relate to safety, team member connection with the business and manager trust – each of which is essential to our success.
FROM
30.13 (TRIFR)
IN JULY 2020
TO
24.84 (TRIFR)
IN JUNE 2021
TOTAL RECORDABLE INJURY FREQUENCY RATE (TRIFR)
Pillar 3: Practise good governance – Supporting & developing our team
Bapcor’s team members are the foundation of our success and there is a continued focus on their safety, development and ensuring an environment of diversity and inclusion.
In FY21, the decision was made to enhance the focus on diversity in four key areas:
GENDERAGEDISABILITYETHNICITYInitiatives in each of these areas are being put in place to promote and increase diversity and inclusion. to drive gender diversity, this included bringing together senior female leaders from a range of businesses and locations to network, share, contribute ideas to inform the creation of a Women’s leadership Development program to be rolled out in FY22. Bapcor has also reviewed rates of promotion and graded all job types to ensure equal pay and opportunity for promotion for all. Going forward Bapcor will be expanding initiatives to drive increased diversity and has, as a first step, set gender diversity targets to achieve by FY26.
Objective Current FY26 Target
Increase the total number of female team members
25% 35%
Increase the number of female new hires 29% 50%
Increase the number of females who are promoted internally
24% 35%
Increase the number of females who are people leaders
11% 35%
to continue keeping our team members safe and well, Bapcor implemented enhanced lead and lag safety reporting showing a reduction in the rolling 12-month total Recordable Injury Frequency Rate (tRIFR).
34

01Christmas gift boxes in support of local businesses
02NRMA – Frontier Services Outback Links volunteer program
engagement remained steady at 64% which is the middle of the benchmark, with a number of business units in the top quartile or decile.
our engagement score in 2021 is a satisfactory result for Bapcor during challenging and changing times, especially with the Covid impact, however we will be focusing on ongoing improvement with a target of 75% by FY26.
ENGAGEMENT TARGET
75% BY FY26
06Fraser Island K’gari Clean Up
04Burson Grassroot Racing
At Bapcor, recognising our team members is an important part of our culture and to support this the Bapcor Champion Awards, which are aligned to our Values, were launched in october 2020. Any team member can nominate a Bapcor Champion and so far we have received over 483 nominations with 35 winners.
As a part of our approach to talent and capability, Bapcor continued to develop our current and future leaders through various Managing, leading and Developing people (MlDp) programs and introduced a top talent program for high potential leaders.
providing support for our team members throughout the challenges of the Covid pandemic saw the implementation of a paid pandemic leave policy with team members being financially supported if they were unable to attend work due to government restrictions.
Pillar 4: Positively impacting our community – continued grass roots support
Despite the challenging environment caused by the Covid pandemic, Bapcor Group team members continued to support the local community through various social, charitable, and sporting initiatives in FY21. our objective is for every one of our c.1,100 locations to support at least two local community groups.
03Girls on Track
05Men’s mental health
07Novita River Run
35
BApCoR / AnnuAl RepoRt 2021

WE UNDERSTAND THAT SUSTAINABILITY MATTERS (CONT.)
SUSTAINABILITY STRATEGY SPECIFIC ACTION ITEMS/TARGETSConsistent with the decision to accelerate our efforts in eSG, Bapcor’s updated action items and targets are set out below:
Sustainability strategy pillar Key topic Objective/initiative Time-line
Most relevant UN SDG
Ethical sourcing
Modern slavery
publish Modern Slavery Statement In place and ongoing
An active Modern Slavery Working Group In place and ongoing
Further develop risk-based approach to improve transparency in the supply chain through use of supplier self-assessment and/or independent audit
FY23
Environmental sustainability
Carbon emission measurement and reduction
Measure baseline carbon emissions to inform roadmap and reduction targets
FY22
Phase I: Victorian DC consolidation, reducing from 13 DC’s to 1, resulting in significant reductions in emissions, water, energy and packaging usage, as well as increase in waste recycling
FY22
Phase II: Measure scope 1, 2 and 3 carbon emissions for entire business
FY22
Develop road map to reduce identified carbon emissions to specified targets
FY23
establish Queensland distribution centre to consolidate 7 warehouses and achieve significant reductions in emissions, water, energy and packaging usage, as well as increase in waste recycling
FY22/FY23
Bapcor vehicle fleet review to accelerate transition to reduce vehicle emissions
FY22
Increase level of renewable energy to at least 50% of total requirements
FY24
Continue installation of energy efficient lighting in stores/branches and evaluate use of local solar panels (already reduced over 3.7 million kw/annum)
ongoing
Renew and expand carbon offset program to offset vehicle fleet emissions (currently offsetting 6,400 tonnes of carbon emissions p.a. by planting 40,000 native trees each year)
ongoing
36

Sustainability strategy pillar Key topic Objective/initiative Time-line
Most relevant UN SDG
Waste/recycling
Further review of waste management and commitment to reduce waste going to landfill (to date diverted c.6,200 tonnes from landfill)
FY23
Review of packaging used across the group with view to shift to fully recycled/recyclable packaging
ongoing
Supporting and developing our people
Safety Continue to invest in and develop safety processes, systems and education to reduce tRIFR (tRIFR reduced from 30.1 to 24.8 in FY21)
ongoing
employee engagement
Improve employee engagement score to 75% (In FY21 64%)
FY26
Development Invest in learning and development for our team to ensure industry leading workforce
ongoing
Diversity Implement initiatives to improve gender, age, ethnicity and ability diversity across the group including:
FY22
› unconscious bias training for senior leaders FY22
› Female leaders networking sessions and development program
FY22
› Graduate program and experienced team member program
FY22
total number of female team members to 35% (FY21 25%)
FY26
number of female new hires to 50% (FY21 29%)
FY26
number of female internal promotions to 35% (FY21 24%)
FY26
number of female people leaders to 35% (FY21 11%)
FY26
Positively impacting communities
Community support
each location to support at least two community clubs or organisations within their local area
ongoing
37
BApCoR / AnnuAl RepoRt 2021

BOARD OF DIRECTORS
APPOINTEDChair – 17 February 2021 Board – 30 May 2016
17 october 2011 1 September 2018
EXPERTISE, EXPERIENCE & SKILLSDuring her career, Margaret gained extensive leadership and human capital management skills, which she brings to her role as Chair of the Board.
Margaret has spent more than 30 years in various senior executive roles in FMCG, including senior roles at Mars Food Australia, subsidiary of Mars Inc., where she was responsible for strategy, risk management, product innovation & brand launching, and implementation of new systems.
From 2002 to 2007, Margaret served as the Ceo of Mars Food Australia, with responsibility for the ApAC market and was also responsible for ensuring sustainability of the business and its supply chain.
Margaret currently serves as a non-executive director of ASX listed Metcash limited, and was a director of various government and not-for-profit boards, including national Food precinct, Central Coast Grammar school and AGRIFooD Skills.
Darryl brings over 30 years of executive leadership and financial expertise to the Board of Bapcor, gained at various roles across manufacturing, global paper and packaging distribution and automotive aftermarket industry.
Darryl was a former Chief Financial officer at Sunclipse Inc., a subsidiary of Amcor based in the uSA and held roles of regional and group general manager at Amcor Fibre packaging and Amcor printing papers Group in Australia, where he was responsible for international trade, including logistics and supply chain. Darryl also gained extensive experience in strategy, business restructuring, information technology and product launching.
From 2000, Darryl served as a Board Director and CFo of paperlinx limited, where he led the due diligence, funding and settlement negotiations for international acquisitions and successfully transitioned the business involving multi-country legal, financial, statutory, business culture, cultural, tax and insurance issues.
Between 2006 and 2010, he served as CFo/Coo and Director of the Board of exego Group pty limited (Repco), as well as being an independent director of CpI Group ltd.
Jennifer brings extensive expertise in corporate finance, accounting, and auditing, coupled with a strong focus on and understanding of market trends, customer and consumer behaviour. She has a proven track record in developing and implementing strategy with a focus on risk management, growth, and value creation.
Jennifer spent her executive career in customer facing organisations primarily in technology, retail, travel services and manufacturing, where she was responsible for strategic turnaround and digital transformation.
Her last executive role was CFo and interim Ceo at Helloworld limited, where she oversaw the merger with Aot Group to create the second largest integrated travel distribution business in Australia and new Zealand. prior to that, Jennifer was the CFo and General Manager International of the ReA Group, with responsibility for the financial growth strategy and execution for operations in South east Asia and parts of europe, having delivered record revenue and net profit for the company.
SPECIAL RESPONSIBILITIESChair
nomination, Remuneration and eSG Committee member
Audit and Risk Committee Chair
nomination, Remuneration and eSG Committee member
MARGARET HASELTINEIndependent, Non-Executive Director and Chair
JENNIFER MACDONALDIndependent, Non-Executive Director
DARRYL ABOTOMEYManaging Director & Chief Executive Officer
38

APPOINTED1 September 2020 31 March 2014 1 September 2020
EXPERTISE, EXPERIENCE & SKILLSMark brings over 30 years of leadership and executive experience in retail, wholesale, logistics and distribution. the key areas of Mark’s expertise are in development and execution of business strategy, business growth, organisational turnaround and change management as well as acquisition integration.
Mark’s career started in underground coal mining where he had direct responsibility for operations and health & safety. He later transitioned into global retail, wholesale and logistics, having held executive roles at Iceland plc, Booker Wholesale and tesco in the uK; logistics services provider tibbett & Britten in Spain and Canada (including running of Walmart Canada’s logistics operations); and the Warehouse Group in Australia and new Zealand.
Between 2009 and 2016, Mark was Ceo of Warehouse Stationary and then Group Ceo for nZX-listed retailer the Warehouse Group, where he oversaw a return to organic growth, online/digital strategy implementation and a number of acquisitions.
therese has extensive experience as a senior business executive and commercial lawyer working in widely diversified businesses in Australia and internationally. She brings strong commercial sense, risk management and strategic thinking, complemented by 45 years of legal experience in the automotive, petrochemical, insurance, superannuation and other industries.
therese spent most of her later executive career in General Motors, including as General Counsel and Company Secretary of GM Holden, based in Australia; and based in Shanghai, as Vice president and General Counsel for GM’s Asia pacific operations, and later as Vice president, General Counsel and member of Strategy Board for GM’s International operations outside north America; and as Assistant Company Secretary of General Motors Corporation.
In these various roles, therese was responsible for corporate legal actions related to M&A, refinancing, product stewardship, franchising, Ip, procurement, joint ventures, acquisitions, and integration. She also chaired and had functional responsibility for GM Holden’s employee superannuation fund.
James is an experienced company director, corporate adviser, and investor. James has over 30 years’ experience in finance across various entities, including Hambros Banking Group and Wolseley private equity.
James’ last executive role was as Managing Director of Wolseley private equity, an independent private equity firm which he co-founded in 1999 and served in until 2018.
through his extensive private equity experience, James had exposure across various sectors including retail, media, FMCG, business services, and international supply chains. His corporate transaction and investment experience has been gained across multiple markets including Australia, new Zealand and Asia (including Hong Kong, China, Singapore, Vietnam, Cambodia, thailand, and Indonesia).
SPECIAL RESPONSIBILITIESnomination, Remuneration and eSG Committee Chair
Audit and Risk Committee member
nomination, Remuneration and eSG Committee member
Audit and Risk Committee member
THERESE RYANIndependent, Non-Executive Director
MARK POWELLIndependent, Non-Executive Director
JAMES TODDIndependent, Non-Executive Director
39
BApCoR / AnnuAl RepoRt 2021
YOUR MANAGEMENT TEAM
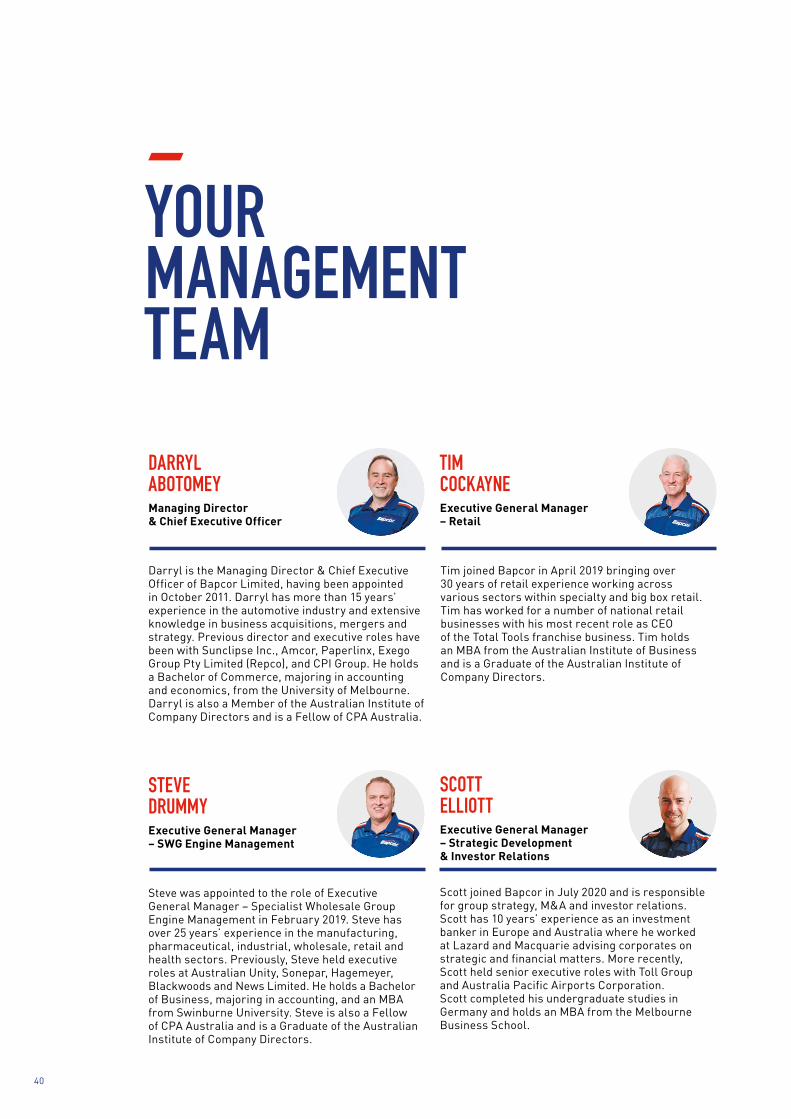
Steve was appointed to the role of executive General Manager – Specialist Wholesale Group engine Management in February 2019. Steve has over 25 years’ experience in the manufacturing, pharmaceutical, industrial, wholesale, retail and health sectors. previously, Steve held executive roles at Australian unity, Sonepar, Hagemeyer, Blackwoods and news limited. He holds a Bachelor of Business, majoring in accounting, and an MBA from Swinburne university. Steve is also a Fellow of CpA Australia and is a Graduate of the Australian Institute of Company Directors.
tim joined Bapcor in April 2019 bringing over 30 years of retail experience working across various sectors within specialty and big box retail. tim has worked for a number of national retail businesses with his most recent role as Ceo of the total tools franchise business. tim holds an MBA from the Australian Institute of Business and is a Graduate of the Australian Institute of Company Directors.
STEVE DRUMMYExecutive General Manager – SWG Engine Management
TIM COCKAYNEExecutive General Manager – Retail
Darryl is the Managing Director & Chief executive officer of Bapcor limited, having been appointed in october 2011. Darryl has more than 15 years’ experience in the automotive industry and extensive knowledge in business acquisitions, mergers and strategy. previous director and executive roles have been with Sunclipse Inc., Amcor, paperlinx, exego Group pty limited (Repco), and CpI Group. He holds a Bachelor of Commerce, majoring in accounting and economics, from the university of Melbourne. Darryl is also a Member of the Australian Institute of Company Directors and is a Fellow of CpA Australia.
DARRYL ABOTOMEYManaging Director & Chief Executive Officer
Scott joined Bapcor in July 2020 and is responsible for group strategy, M&A and investor relations. Scott has 10 years’ experience as an investment banker in europe and Australia where he worked at lazard and Macquarie advising corporates on strategic and financial matters. More recently, Scott held senior executive roles with toll Group and Australia pacific Airports Corporation. Scott completed his undergraduate studies in Germany and holds an MBA from the Melbourne Business School.
SCOTT ELLIOTTExecutive General Manager – Strategic Development & Investor Relations
40

Martin joined Bnt in September 2016 as Group General Manager, before being appointed as executive General Manager – Bapcor new Zealand in october 2018 to lead all our new Zealand businesses. Martin was previously at Fletcher Building for 15 years, holding several senior sales and general management positions over this time.
MARTIN STOREYExecutive General Manager – Bapcor New Zealand
noel joined Bapcor on 1 July 2020, following a successful career as Chief Financial officer at toll Group and treasury Wine estates limited. He also held executive roles at orica limited and Qantas. noel is a Fellow of the Australian Society of Certified practising Accountants and is a Member of the Australian Institute of Company Directors. noel holds a Bachelor of Science (Honours) in Mathematics & planning and Administration from the university of leeds and completed the Advanced Management program at Harvard Business School.
NOEL MEEHANChief Financial Officer
Jeff joined Bapcor in July 2019 as Chief operating officer. Jeff has 20 years’ experience as a senior executive having operated at Managing Director, Ceo and General Manager level with commercial and consumer-facing companies including Coates Hire and Bunnings. Jeff holds an MBA and completed the Advanced Management programme at Insead, France. He is a Graduate of the Australian Institute of Company Directors.
Alison joined Bapcor in May 2017. With more than 20 years’ human resources experience, Alison has spent much of her career partnering with senior leaders to develop team capability and drive business outcomes and has worked with organisations such as orora, paperlinx and Coles Myer. Alison holds a Bachelor of Commerce, majoring in management and industrial relations, from the university of newcastle.
Craig joined Bapcor in February 2012 and is responsible for all aspects of the trade segment. Craig has an extensive career in the automotive aftermarket industry, spanning more than 25 years. Before joining Bapcor, he was the General Manager of RAC automotive workshops in Western Australia, which was preceded by many years at Repco. He holds a Master of enterprise from Melbourne university.
ALISON LAINGExecutive General Manager – Human Resources
CRAIG MAGILLExecutive General Manager – Trade
JEFF NICOLChief Operating Officer
41
BApCoR / AnnuAl RepoRt 2021

DIRECTORS’ REPORT30 JUNE 2021
The directors present their report, together with the financial statements, on the consolidated entity (‘consolidated entity’) consisting of Bapcor Limited (‘company’ or ‘parent entity’) and the entities it controlled at the end of, or during, the year ended 30 June 2021 (‘FY21’).
1. DIRECTORSThe following persons were directors of Bapcor Limited during the whole of the financial year and up to the date of this report, unless otherwise stated:
Margaret Haseltine Independent, Non-Executive Chair (appointed to Chair 17 February 2021)
Darryl Abotomey Chief Executive Officer and Managing Director
Therese Ryan Independent, Non-Executive Director
Jennifer Macdonald Independent, Non-Executive Director
James Todd Independent, Non-Executive Director (appointed 1 September 2020)
Mark Powell Independent, Non-Executive Director (appointed 1 September 2020)
Andrew Harrison Independent, Non-Executive Chair (retired 16 February 2021)
2. PRINCIPAL ACTIVITIESThe principal activities of Bapcor were the sale and distribution of vehicle parts, accessories, automotive equipment, service and solutions.
Bapcor is one of the largest suppliers of vehicle parts, accessories, equipment, service and solutions in Asia Pacific with an operational network covering c. 1,100 locations and employing c. 5,000 team members.
3. SIGNIFICANT CHANGES IN THE STATE OF AFFAIRSDuring FY21 Bapcor has invested in new technology with the construction of the state-of-the-art distribution centre at Tullamarine, Victoria. Over the period to January 2022, it is planned that thirteen current distribution centres will be merged in the new consolidated location.
In addition, during FY21, Bapcor has opened a net additional 31 company stores and implemented new eCommerce platforms for both business-to-business and business-to-customer solutions.
In March 2021, Bapcor announced an expansion in Asia through the agreement to acquire 25% of the issued equity of Tye Soon Limited, a company listed on the Singapore Securities Exchange. This strategic investment brings a range of opportunities for both businesses to work together and grow their markets. The investment was completed in April 2021.
4. DIVIDENDSFully franked dividends paid during the financial year were as follows:
11 September 2020 $32,244,000 (9.5 cents per share)
12 March 2021 $30,547,000 (9 cents per share)
The Board has declared a final dividend in respect of FY21 of 11 cents per share, fully franked. The final dividend will be paid on 14 September 2021 to shareholders registered on 31 August 2021.
The final dividend takes the total dividends declared in relation to FY21 to 20 cents per share, fully franked, representing an increase of dividends paid of 14.3% compared to the prior financial year. Dividends paid and declared in relation to FY21 represents 52.2% of pro-forma net profit after tax.
42

5. REVIEW OF OPERATIONSStatutory: › Revenue increased by 20.4% from $1,463M to $1,762M
› Statutory earnings before interest, taxes, depreciation and amortisation (‘EBITDA’) increased by 28.8% to $271.9M
› Statutory net profit after tax (‘NPAT’) increased by 50.0% to $118.8M
› Statutory earnings per share (‘EPS’) increased by 29.8% to 34.99 cents per share
Pro-forma: › Revenue increased by 20.4% from $1,463M to $1,762M
› Pro-forma EBITDA increased by 28.8% to $279.5M
› Pro-forma NPAT increased by 46.5% to $130.1M
› Pro-forma EPS increased by 26.8% to 38.32 cents per share
Net debt: › Pro-forma net debt1 at 30 June 2021 was $164.1M representing a leverage ratio of approximately 0.74X (pro-forma net
debt : last twelve months pro-forma EBITDA).
The tables below reconcile the pro-forma results to the statutory results for FY21 and FY20:
CONSOLIDATED$’M NOTE FY21 FY20
Statutory NPAT 2 118.8 79.2
Victorian DC Consolidation 3 9.9 11.6
Other activities 4 – 1.7
Investment impairment 5 4.4 –
Tax adjustment 6 (3.0) (3.8)
Pro-forma NPAT 130.1 88.7
CONSOLIDATED$’M NOTE FY21 FY20
Statutory net profit before tax (‘NPBT’) 171.4 111.4
Add back depreciation and amortisation 85.4 80.1
Add back finance costs 15.2 19.8
Statutory EBITDA 271.9 211.2
Victorian DC Consolidation 3 3.2 4.2
Other activities 4 – 1.7
Investment impairment 5 4.4 –
Pro-forma EBITDA 279.5 217.1
1 Pro-forma net debt is calculated as statutory net debt excluding the impact of lease liabilities and adjusting for the net derivative financial instruments position which is consistent with banking covenant requirements. Refer to note 16 of the financial report for a reconciliation between statutory and pro-forma net debt.
BAPCOR / AnnuAl RePORt 2021
43

DIRECTORS’ REPORT continued
CONSOLIDATED FY21 FY20
$’M NOTE STAT PRO-FORMA STAT PRO-FORMA
NPAT 2 118.8 130.1 79.2 88.7
Weighted average number of ordinary shares
7 339.4 339.4 293.6 293.6
Earnings per share (cps) 34.99 38.32 26.97 30.23
1 These tables are subject to rounding.
2 NPAT attributable to members of Bapcor Limited.
3 The Victorian DC Consolidation relates to the significant transition items incurred in relation to the new Tullamarine Victoria Distribution Centre and includes the accelerated depreciation of property, plant and equipment and right-of-use assets.
4 The other activities in prior period relates to one off consulting costs incurred relating to acquisitions that did not proceed.
5 The investment impairment relates to the 30 June 2021 mark-to-market revaluation of the investment in Tye Soon Ltd.
6 The tax adjustment reflects the tax effect of the above adjustments based on local effective tax rates.
7 In April / May 2020, 53.7M shares were issued, increasing issued shares by 19%.
The Directors’ Report includes references to pro-forma results to exclude the impact of the adjustments detailed above. The directors believe the presentation of non-IFRS financial measures are useful for the users of this financial report as they provide additional and relevant information that reflect the underlying financial performance of the business. Non-IFRS financial measures contained within this report are not subject to audit or review.
Revenue and pro-forma EBITDA by segment is as follows:
REVENUE PRO-FORMA EBITDAFY21
$’MFY20
$’MCHANGE
%FY21
$’MFY20
$’MCHANGE
%
Bapcor Trade 648.9 561.7 15.5% 115.0 96.7 19.0%
Bapcor NZ 170.0 156.3 8.8% 32.6 26.9 21.2%
Bapcor Specialist Wholesale
659.8 520.4 26.8% 89.5 63.0 42.2%
Bapcor Retail 369.2 292.7 26.1% 65.3 54.3 20.1%
Unallocated / Head Office1 (86.2) (68.4) (26.4%) (22.9) (23.8) 3.6%
Total 1,761.7 1,462.7 20.4% 279.5 217.1 28.8%
1 Revenue relates to intersegment sales eliminations and Thailand operations. EBITDA relates to Bapcor head office costs, intersegment EBITDA elimination and costs associated with the Thailand operations.
5.1 Operating and financial review – Bapcor TradeThe Bapcor Trade segment consists of the Burson Auto Parts and Precision Automotive Equipment business units. This segment is a distributor of:
› Automotive aftermarket parts and consumables to trade workshops for the service and repair of passenger and commercial vehicles.
› Automotive workshop equipment such as vehicle hoists and scanning equipment, including servicing of the equipment.
› Automotive accessories and maintenance products to do-it-yourself vehicle owners.
Compared to FY20, the Bapcor Trade segment recorded record revenue and earnings with revenue growth of 15.5% and EBITDA growth of 19.0%.
The increase in revenue of 15.5% included same store sales growth of 14.3% (6.0% in FY20). Bapcor Trade’s EBITDA to revenue percentage was 0.5 percentage points above FY20 reflecting low level of discretionary spending especially in travel and training and operating efficiencies.
44

During FY21, Burson continued to expand its store network with the number of stores increasing from 186 at 30 June 2020 to 200 at 30 June 2021. The increase of fourteen stores consisted of twelve greenfield store developments and two conversions of Autopro stores from Bapcor Retail. The average cost per new store including inventory was $797,000.
The new stores are located in Albany, Bunbury and Geraldton in Western Australia, Young in New South Wales, North Lakes and Ormeau in Queensland, Seaford in South Australia and Cobram, Delacombe, Kilmore, Kyneton, Rosebud, Traralgon and Wodonga in Victoria.
The Precision Equipment business achieved record revenue of $53.6M for the year ($39.4M in FY20), continuing its solid growth despite a decline in demand from new car dealerships.
During the year, inventory holdings increased across Bapcor Trade by $2.8M (excluding new stores) due to new product ranges, expansion of existing ranges and increased stockholdings to minimise the impacts of issues with suppliers and shipping delays.
5.2 Operating and financial review – Bapcor New ZealandBapcor New Zealand (‘Bapcor NZ’) consists of Trade and Specialist Wholesale businesses based in New Zealand operating across 85 locations, as well as 102 Battery Town locations.
BNT is the predominant business with 76 stores supplying automotive parts and accessories to workshops, truck and trailer parts through the Truck and Trailer Parts brand. BNT is similar in nature to Bapcor’s Burson Auto Parts business in Australia.
Bapcor NZ also includes the specialist wholesale businesses of HCB – batteries, Autolign – steering and suspension, JAS – auto electrical and Precision Equipment NZ – vehicle workshop equipment.
Bapcor NZ achieved revenue growth of 8.8% and EBITDA growth of 21.2% compared to FY20. EBITDA to revenue percentage was 2.0 percentage points above FY20 reflecting the impact of reduced operating costs and higher levels of own brand product sales.
Same store sales growth in FY21 for Bapcor NZ’s largest business, BNT, was 11.3% (declined by 9.0% in FY20). There was an increase of one store in the BNT network since 30 June 2020.
During the year, inventory holdings across Bapcor NZ increased by $4.2M (adjusted for foreign currency) due to the build-up of new product ranges, expansion of existing ranges and to mitigate delays receiving product from manufacturers.
5.3 Operating and financial review – Bapcor Specialist WholesaleThe Bapcor Specialist Wholesale segment consists of operations that specialise in automotive aftermarket wholesale and include AAD, Bearing Wholesalers, Opposite Lock, Baxters/MTQ, Roadsafe, JAS Oceania, Premier Auto Trade, Federal Batteries, Diesel Distributors, AADi and the Commercial Truck Parts group comprising Truckline and WANO.
The Bapcor Specialist Wholesale segment achieved record revenue and earnings with revenue growth of 26.8% and EBITDA growth of 42.2% compared to FY20. FY21 included the full year benefit of the acquisition of the Truckline and Diesel Drive acquisitions made in December 2020. Excluding these acquisitions, revenue grew by 17.3% and EBITDA increased by 32.0%.
EBITDA to revenue percentage increased 1.5 percentage points above FY20 as a result of synergies realised from the Truckline acquisition, increased intercompany sales and reductions in product costs. The volume and product groups that the Specialist Wholesale segment supplies into other Bapcor group businesses grew by c. 25% on FY20.
During the year, inventory holdings across Bapcor Specialist Wholesale increased by $31.1M (excluding acquisitions) due to the build-up of existing and new product ranges and to mitigate delays in receiving product from manufacturers and shipping constraints.
5.4 Operating and financial review – Bapcor RetailThe Bapcor Retail segment consists of business units that are retail customer focused, and include the Autobarn, Autopro and Sprint Auto Parts brands, and the Midas and ABS workshop service brands. This segment is comprised of franchised stores and workshops, as well as an increasing proportion of Autobarn and Autopro stores that are now company owned.
The Bapcor Retail segment achieved record revenue and earnings with revenue growth of 26.1% compared to FY20. Autobarn same store sales growth for company owned stores was 28.0% (14.5% in FY20) and for franchise stores was 16.8% (6.6% in FY20). Same store sales growth for Autopro and Sprint stores was 16.0%.
BAPCOR / AnnuAl RePORt 2021
45

DIRECTORS’ REPORT continued
FY21 EBITDA to revenue percentage of 17.7% was 0.9 percentage points lower than FY20 due mainly to product mix and competitive pricing. EBITDA in FY21 was 20.1% higher compared to FY20, predominately reflecting the focus on promotions, catalogues, greater product range and in-store experience.
Bapcor Retail has continued to grow the number of company owned Autobarn stores via both greenfield Autobarn stores as well as some select conversion of franchise stores to company owned stores. The total number of Autobarn stores at 30 June 2021 was 133 stores, a decrease of one from the 134 as at 30 June 2020. During the period three franchise stores were rebranded as Autopro, seven new greenfield company stores were opened, two franchise stores closed and three company stores closed. The number of company owned stores increased from 79 to 86. The percentage of company owned Autobarn stores at 30 June 2021 was 65%, up from 59% at 30 June 2020. A new format Autobarn store was launched during the year as well as a new tagline – “Top Gear, Low Prices”.
At 30 June 2021 the total number of company owned and franchise stores in the Bapcor Retail segment was 341 consisting of Autobarn 133 stores, Autopro 74 stores, Sprint Auto Parts 30 stores and Midas and ABS 104 stores.
From July 2021, Sprint stores are being rebranded to Autopro, along with a new store layout, updated logo and new tagline – “We know these parts”. Retail will now focus on Autobarn, Autopro and Midas as their core brands.
During the year, inventory holdings across Bapcor Retail increased by $29.1M (excluding new stores) due to product range extensions especially with the launch of many own brand products including Chicane, Vyking Force and Streetwise, and a deliberate strategy of increasing stock holdings in the stores to support increased sales levels and to mitigate global supply chain challenges.
5.5 Operating and financial review – Unallocated / Head OfficeThe Unallocated / Head Office segment consists of all elimination and head office costs or adjustments that are not in the control of the other segments, as well as the results of the Thailand operations. It also includes the elimination of intercompany sales and EBITDA. Unallocated costs decreased from $23.8M in FY20 to $22.9M in FY21 which was primarily due to increased investment in support functions such as human resources, legal, governance and IT offset by additional provisions taken up in prior year in light of Covid for potential impacts to debtor collections and stock obsolescence.
Intercompany sales increased by 25.8% compared to FY20, reflecting a higher proportion of sourcing product internally and increasing the volume of “own brand” product.
The Unallocated / Head Office segment result includes the Thailand operations which recorded revenue of $4.8M and an EBITDA loss of $0.2M (severely impacted by Covid) with Bapcor’s share of the Thailand business being 51%. During the year, inventory holdings for the Thailand based operations remained flat (adjusted for foreign currency).
5.6 Financial Position – Capital Raising and DebtThere have been no issue of new shares during the year. As a result, ordinary shares on issue remains at 339,412,500 as at 30 June 2021.
AASB 16 Leases increases reportable net debt by the inclusion of $226.3M of finance leases as at 30 June 2021. Given this is excluded from a banking covenant perspective, pro-forma net debt has also been disclosed. Pro-forma net debt at 30 June 2021 was $164.1M representing a leverage ratio of approximately 0.74X (pro-forma net debt : last twelve months pro-forma EBITDA).
6. STRATEGYBapcor’s strategy is to be Asia Pacific’s leading provider of vehicle parts, accessories, equipment, service and solutions. The five-year strategic targets are explained by business segment.
Bapcor TradeTrade consists of the businesses Burson Auto Parts and Precision Automotive Equipment. The business units are trade-focussed “parts professionals” businesses supplying service workshops. Bapcor’s target is to grow Burson Auto Parts’ store numbers via acquisitions and greenfields from 200 stores at the end of June 2021 to 260 stores with at least 40% own brand product content.
Bapcor NZBapcor NZ’s operations consist of its automotive aftermarket businesses of BNT, Precision Automotive Equipment (NZ), Autolign and Truck and Trailer Parts, as well as the automotive electrical businesses of HCB, JAS Oceania and Diesel Distributors (NZ).
46

The strategy is to grow the BNT business from its current 76 stores to over 90, as well as grow its electrical businesses organically and potentially through acquisition. Bapcor NZ also has a target to grow own brand content to more than 45%.
Bapcor Specialist WholesaleThe Specialist Wholesale business strategy is to be the number one or number two industry category specialists in the parts programs in which it operates. The parts programs in which the specialist wholesale segment operates are brake, bearings, electrical, suspension, 4WD, cooling, diesel, engine control systems and parts for light and heavy commercial vehicles.
The Specialist Wholesale businesses are focused on maximising internal sales, developing own brand product ranges, and the evaluation of its distribution footprint including opportunities for shared facilities. Specialist Wholesale growth may also include acquisitions where they are complementary to the current product group offerings.
Bapcor RetailAutobarn – The premium retailer of automotive accessories, Autobarn had 133 stores at the end of 30 June 2021 including 86 company owned stores. The target is to grow to 200 Autobarn stores, with a majority of growth being company owned stores. Own brand content is also targeted to exceed 45%.
Autopro – Autopro now consists of Autopro and the former Sprint Auto Parts stores totalling 104 stores. The group comprises both franchise and company owned stores. The aim is to grow the network to c. 200 stores, predominately in areas with smaller populations. The Autopro stores will carry a similar but smaller range of products than Autobarn.
Independents – The independents group consists of the stores that do not carry a Bapcor brand. The strategy is to supply the independent parts stores via Bapcor’s extensive supply chain capabilities. Bapcor’s strategy is to strongly support these independent stores. Currently there are c. 75 independents.
Service – The service business consists of the brands Midas and ABS and aims to be experts at scheduled car servicing at affordable prices. There were 104 stores at 30 June 2021 of which 101 were franchised. Bapcor considers Service a potential growth area due to the industry consolidation opportunities and the potential to vertically integrate supply of product through its Trade and Specialist Wholesale segments and will actively expand this segment.
AsiaBapcor commenced its expansion into South East Asia, initially into Thailand. Currently there are six greenfield stores selling automotive parts and accessories to workshops and retail customers. Bapcor sees significant potential to grow this footprint. The initial three years of operations has achieved positive momentum, however held back by the impact of Covid throughout the last 18 months. Bapcor has plans to open two new stores in the first half of FY22.
During FY21, Bapcor continued the expansion into Asia through the acquisition of 25% of Tye Soon Limited. Established in 1933, Tye Soon Limited is the most prominent independent automotive parts distributor in South East and North East Asia and operates out of c. 60 locations throughout Singapore, South Korea, Malaysia, Australia and Thailand.
Supply ChainBapcor’s objective is to have the most efficient and effective supply chain in the industry. The new state-of-the-art distribution centre at Tullamarine, Victoria opened in April 2021. This distribution centre will absorb thirteen distribution centres in Melbourne, dramatically increasing efficiency. Further consolidations are likely in Brisbane and Auckland.
The consolidated distribution centres will enable Bapcor to reach customers that have not been possible historically.
Bapcor is also consolidating all non-distribution centre team members across Melbourne to an office complex in Mt Waverley, Victoria, which will bring together all the business segments for the first time.
Competitive advantagesTeam Members – Our team members are the key to our success. Bapcor has a strong and experienced management team and a proven record of attracting, retaining and growing key talent across the group. Training and development of team members is a priority for the group.
Diversification – Extensive breadth and depth of product range and capability across the group provides multiple revenue streams and continues to drive intercompany sales and margin improvements opportunities, whilst spreading reliance on profitability. Increasing the proportion of own brand products is a core target, as these products generally achieve greater margins than the alternatives.
BAPCOR / AnnuAl RePORt 2021
47

DIRECTORS’ REPORT continued
7. INDUSTRY TRENDSThe automotive aftermarket parts market in Australia, NZ and Asia continues to experience growth based on:
(a) population growth;
(b) increasing number of vehicles per person;
(c) change in the age mix and complexity of vehicles (i.e. more vehicles in the four years or older range);
(d) an increase in the value of parts sold; and
(e) increased domestic travel due to Covid.
Demand for automotive parts, accessories and services continues to be resilient as vehicle maintenance is critical to operating a vehicle. Vehicle servicing is predominately driven by the number of kilometres travelled, with the number of kilometres travelled by passenger and light commercial vehicles not normally significantly impacted by economic conditions. Volatility in new vehicle sales does not directly impact demand as parts distributed by Bapcor are predominantly used to service vehicles that are aged four years or older. With the impact of Covid, demand for second hand vehicles has increased as people seek to ensure social distancing with reduced reliance on public transport, as well as the expected increase in domestic holidays utilising motor vehicles. All of these factors lead to more demand for vehicle servicing, replacement parts and maintenance.
Online channels to market is now a common medium for retail businesses albeit only a small percentage of automotive retail sales are online. Through our retail businesses Bapcor has online sales channels, including ‘click and collect’ and ‘click and deliver’. In the trade and wholesale channels the group offers electronic ‘B2B’ trading including an extensive parts catalogue. Bapcor is investing in expanding its online capabilities, including in a new eCommerce platform which was launched in FY21.
In the trade business Bapcor’s fast delivery capabilities, wide product range and knowledgeable people are the key to Bapcor’s customer offering which on-line businesses cannot match. Bapcor does not currently believe online competition will have a material impact on Bapcor’s trade business over the next few years.
There is increased interest and production of electric vehicles. As Bapcor’s target market is parts and accessories for vehicles greater than four years old, and due to the large size of the conventional vehicle car parc (approximately 19 million) and how long it would take for electric and hybrid vehicles to become a meaningful percentage of the total number of vehicles on the road (currently less than two percent), Bapcor considers any impact to the Bapcor business within the next ten years is likely to be minimal. However, Bapcor is researching the reliability of electric and hybrid vehicles and will stock replacement parts for them as we do for most vehicles.
8. KEY BUSINESS RISKSThere are a number of factors that could have an effect on the financial prospects of Bapcor. These include:
Pandemic risk – As has been shown over the last 18 months, a pandemic which results in restrictions on doing business, will have an impact on Bapcor. Pandemic, as well as other risks such as bushfires are unpredictable by their very nature. Once such situations are evident Bapcor will move swiftly to minimise the impact on its revenue, profitability and cash.
Competition risk – The Australian, NZ and Thai automotive aftermarket parts and accessories distribution industries are competitive and Bapcor may face increased competition from existing competitors (including through downward price pressure), new competitors that enter the industry, vehicle manufacturers, and new technologies or technical advances in vehicles or their parts. Increased competition could have an adverse effect on the financial performance, industry position and future prospects of Bapcor.
Increased bargaining power of customers – A significant majority of Bapcor’s sales are derived from repeat orders from customers. Bapcor may experience increased bargaining power from customers due to consolidation of existing workshops forming larger chains, greater participation of existing workshops in purchasing and buying groups, and closure of independent workshops resulting in greater market share of larger chains. An increase in bargaining power of customers may result in a decrease in prices or loss of customer accounts, which may in turn adversely affect Bapcor’s sales and profitability.
Supplier pressure or relationship damage – Bapcor’s business model depends on having access to a wide range of automotive parts, in particular parts with established brands that drive customer orders. An increase in pricing pressure from suppliers or a damaged relationship with a supplier may increase the prices at which Bapcor procures parts or limit Bapcor’s ability to procure parts from that supplier. If prices of parts increase, Bapcor will be required to pass on or absorb the price increases, which may result in a decreased demand for Bapcor’s products or a decrease in profitability. If Bapcor
48
is no longer able to order parts from a key supplier, Bapcor may lose customer orders and accounts, resulting in lower sales. Any decline in demand, sales or profitability may have an adverse effect on Bapcor’s business and financial performance.
Exchange rate risk – A large proportion of Bapcor’s parts are sourced from overseas, either indirectly through local suppliers or directly by Bapcor. This exposes Bapcor to potential changes in the purchase price of products due to exchange rate movements. Historically Bapcor has been able to pass on the majority of the impact of foreign exchange movements through to the market. If the situation arises where Bapcor is not able to recoup foreign exchange driven cost increases, this may lead to a decrease in profitability. To mitigate this risk, Bapcor enters into forward exchange contracts based on expected purchases for the upcoming twelve months.
Managing growth and integration risk – The integration of acquired businesses and the continued strategy of growing the store network will require Bapcor to integrate these businesses and where appropriate upscale its operational and financial systems, procedures and controls and expand and retain, manage and train its employees. There is a risk of a material adverse impact on Bapcor if it is not able to manage its expansion and growth efficiently and effectively, or if the performance of new stores or acquisitions does not meet expectations. Bapcor senior management take an active role in the integration of acquired businesses.
Expansion – A key part of Bapcor’s growth strategy is to increase the size of its store network, which it intends to achieve through store acquisitions and greenfield developments. If suitable acquisition targets are not able to be identified; acquisitions are not able to be made on acceptable terms; or suitable greenfield sites are not available, this may limit Bapcor’s ability to execute its growth strategy within its expected timeframe. Further, new stores may not prove to be as successful as Bapcor anticipates including due to issues arising from integrating new businesses. This could negatively impact Bapcor’s financial performance and its capacity to pursue further acquisitions. Bapcor senior management take an active role in the rollout and progress of store expansion.
Franchise regulations – Bapcor has a large franchise network. Changes in franchise law or regulations may have an impact on the responsibilities of the franchisor or the operations of these franchise businesses. Bapcor senior management seek ongoing professional advice to monitor any developments and implement appropriate changes.
People risk – Bapcor is a highly focussed customer service business and its staff and senior management are key to maintaining the level of operational service to its customers, as well as executing Bapcor’s strategy. Any significant turnover of staff or loss of key senior management has the potential to disrupt the profitability and growth of the business. Senior management risk is somewhat managed through notice period and non-compete contractual obligations, succession planning and long-term incentives.
Information technology – All of Bapcor’s business operations rely on information technology platforms. Any sustained unplanned downtime due to system failures, cyber-attack or any other reason has the potential to have a material impact on the ability for Bapcor to service its customers. Bapcor’s business units operate with a number of different operating systems making it less likely that any unplanned downtime will occur across the entire business.
Sustainability – An actual or perceived failure to adequately address sustainability-related issues has the ability to impact Bapcor’s financial performance, reputation and operations. To address this Bapcor seeks to take an integrated approach towards economic, environmental and social sustainability. Ensuring this approach is effective means ensuring a range of practices are maintained and continually improved, including managing potential issues in our supply chain (including modern slavery practices), sourcing sustainable products and packaging, and reducing carbon emissions.
Legal and regulatory compliance – Bapcor is required to maintain compliance with all applicable laws and regulations. These include requirements related to consumer protection, product quality, and transport safety. Failure to comply with such laws and regulations could result in regulatory action or other claims which could have an adverse impact on the Group’s reputation, financial performance and profitability.
9. LIKELY DEVELOPMENT AND EXPECTED RESULTS OF OPERATIONSBapcor continues to implement its five-year strategy. As part of that strategy, 50 to 60 new locations are expected to be opened each year. Investments in supply chain and technology will continue to deliver improved results to Bapcor.
The financial performance of Bapcor over the FY22 financial year may be impacted by lockdowns that have become a common occurrence during the Covid pandemic. In the absence of any major restrictions on business, Bapcor aims to deliver pro-forma earnings at least at the level of FY21.
BAPCOR / AnnuAl RePORt 2021
49

DIRECTORS’ REPORT continued
10. INFORMATION ON DIRECTORSNAME: Margaret Haseltine
TITLE: Independent Non-Executive Director and Chair
QUALIFICATIONS: Bachelor of Arts Degree Diploma of Secondary Teaching (Auckland University) Fellow of the Australian Institute of Company Directors
EXPERIENCE AND EXPERTISE: During her career, Margaret gained extensive leadership and human capital management skills, which she brings to her role as Chair of the Board.
Margaret has spent more than 30 years in various senior executive roles in FMCG, including senior roles at Mars Food Australia, subsidiary of Mars Inc., where she was responsible for strategy, risk management, product innovation & brand launching, and implementation of new systems.
From 2002 to 2007, Margaret served as the CEO of Mars Food Australia, with responsibility for the Asia Pacific market and was also responsible for ensuring sustainability of the business and its supply chain.
Margaret currently serves as a non-executive director of ASX listed Metcash Limited, and was a director of various government and not-for-profit boards, including National Food Precinct, Central Coast Grammar school and AGRIFOOD Skills.
OTHER CURRENT DIRECTORSHIPS: Metcash Limited (ASX: MTS) Newcastle Permanent Building Society Limited (a Mutual bank)
FORMER DIRECTORSHIPS (LAST 3 YEARS): None
SPECIAL RESPONSIBILITIES: Chair Nomination, Remuneration and ESG Committee member
INTERESTS IN SHARES: 49,849 ordinary shares
NAME: Darryl Abotomey
TITLE: Chief Executive Officer and Managing Director
QUALIFICATIONS: Bachelor of Commerce (University of Melbourne) Member of the Australian Institute of Company Directors Fellow of CPA Australia
EXPERIENCE AND EXPERTISE: Darryl brings over 30 years of executive leadership and financial expertise to the Board of Bapcor, gained at various roles across manufacturing, global paper and packaging distribution and automotive aftermarket industry.
Darryl was a former CFO at Sunclipse Inc., a subsidiary of Amcor based in the USA and held roles of regional and group general manager at Amcor Fibre Packaging and Amcor Printing Papers Group in Australia, where he was responsible for international trade, including logistics and supply chain. Darryl also gained extensive experience in strategy, business restructuring, information technology and product launching.
From 2000, Darryl served as a Board Director and CFO of Paperlinx Limited, where he led the due diligence, funding and settlement negotiations for international acquisitions and successfully transitioned the business involving multi-country legal, financial, statutory, business culture, cultural, tax and insurance issues.
Between 2006 and 2010, he served as CFO / COO and Director of the Board of Exego Group Pty Limited (Repco), as well as being an independent director of CPI Group Ltd.
OTHER CURRENT DIRECTORSHIPS: None
FORMER DIRECTORSHIPS (LAST 3 YEARS): None
SPECIAL RESPONSIBILITIES: 1,441,154 ordinary shares
INTERESTS IN SHARES: 680,950 performance rights
50
NAME: Therese Ryan
TITLE: Independent, Non-Executive Director
QUALIFICATIONS: Bachelor of Laws (University of Melbourne) Graduate Member of the Australian Institute of Company Directors
EXPERIENCE AND EXPERTISE: Therese has extensive experience as a senior business executive and commercial lawyer working in widely diversified businesses in Australia and internationally. She brings strong commercial sense, risk management and strategic thinking, complemented by 45 years of legal experience in the automotive, petrochemical, insurance, superannuation and other industries.
Therese spent most of her later executive career in General Motors, including as General Counsel and Company Secretary of GM Holden, based in Australia; and based in Shanghai, as Vice President and General Counsel for GM’s Asia Pacific operations, and later as Vice President, General Counsel and member of Strategy Board for GM’s International Operations outside North America; and as Assistant Company Secretary of General Motors Corporation.
In these various roles, Therese was responsible for corporate legal actions related to mergers and acquisitions, refinancing, product stewardship, franchising, intellectual property, procurement, joint ventures, acquisitions, and integration. She also chaired and had functional responsibility for GM Holden’s employee superannuation fund.
OTHER CURRENT DIRECTORSHIPS: Therese serves as a non-executive director on a number of unlisted boards including Sustainable Timber Tasmania, Central Gippsland Region Water Corporation (Chair), and VicForests (Deputy Chair), and is an independent member of the Audit and Risk committee for City of Melbourne.
FORMER DIRECTORSHIPS (LAST 3 YEARS): None
SPECIAL RESPONSIBILITIES: Audit and Risk Committee member Nomination, Remuneration and ESG Committee member
INTERESTS IN SHARES: 40,256 ordinary shares
BAPCOR / AnnuAl RePORt 2021
51

DIRECTORS’ REPORT continued
NAME: Jennifer Macdonald
TITLE: Independent, Non-Executive Director
QUALIFICATIONS: Masters of Entrepreneurship and Innovation (Swinburne University) Bachelor of Commerce (Deakin University) Graduate of the Australian Institute of Company Directors Chartered Accountant
EXPERIENCE AND EXPERTISE: Jennifer brings extensive expertise in corporate finance, accounting, and auditing, coupled with a strong focus on and understanding of market trends, customer and consumer behaviour. She has a proven track record in developing and implementing strategy with a focus on risk management, growth, and value creation.
Jennifer spent her executive career in customer facing organisations primarily in technology, retail, travel services and manufacturing, where she was responsible for strategic turnaround and digital transformation.
Her last executive role was CFO and interim CEO at Helloworld Limited, where she oversaw the merger with AOT Group to create the second largest integrated travel distribution business in Australia and New Zealand. Prior to that, Jennifer was the CFO and General Manager International of the REA Group, with responsibility for the financial growth strategy and execution for operations in South East Asia and parts of Europe, having delivered record revenue and net profit for the company.
OTHER CURRENT DIRECTORSHIPS: Healius Limited (ASX:HLS) Redbubble Limited (ASX:RBL) Australian Pharmaceutical Industries Limited (ASX:API)
FORMER DIRECTORSHIPS (LAST 3 YEARS): Redflow Limited (ASX:RFX) until 2019
SPECIAL RESPONSIBILITIES: Audit and Risk Committee Chair Nomination, Remuneration and ESG Committee member
INTERESTS IN SHARES: 30,013 ordinary shares
NAME: James Todd
TITLE: Independent, Non-Executive Director
QUALIFICATIONS: Bachelor of Commerce and Bachelor of Laws (University of NSW) Graduate Diploma of Applied Finance and Investment from the Financial Services Institute of Australasia, where he remains a Fellow Member of the Australian Institute of Company Directors
EXPERIENCE AND EXPERTISE: James is an experienced company director, corporate adviser, and investor. James has over 30 years’ experience in finance across various entities, including Hambros Banking Group and Wolseley Private Equity.
James’ last executive role was as Managing Director of Wolseley Private Equity, an independent private equity firm which he co-founded in 1999 and served in until 2018.
Through his extensive private equity experience, James had exposure across various sectors including retail, media, FMCG, business services, and international supply chains. His corporate transaction and investment experience has been gained across multiple markets including Australia, New Zealand and Asia (including Hong Kong, China, Singapore, Vietnam, Cambodia, Thailand, and Indonesia).
OTHER CURRENT DIRECTORSHIPS: IVE Group Limited (ASX:IGL) HRL Holdings Limited (ASX:HRL) Coventry Group Limited (ASX:CYG)
FORMER DIRECTORSHIPS (LAST 3 YEARS): None
SPECIAL RESPONSIBILITIES: Audit and Risk Committee member
INTERESTS IN SHARES: 20,000 ordinary shares
52

NAME: Mark Powell
TITLE: Independent, Non-Executive Director
QUALIFICATIONS: Master of Science (Logistics) Master of Business Administration (Lean Supply Chain) Master of Arts (Theology) Bachelor of Science (Mining Engineering) Bachelor of Applied Theology Graduate Member of the Australian Institute of Company Directors (AICD) Chartered Member NZ Institute of Directors Fellow of the Chartered Institute of Logistics and Transport
EXPERIENCE AND EXPERTISE: Mark brings over 30 years of leadership and executive experience in retail, wholesale, logistics and distribution. The key areas of Mark’s expertise are in development and execution of business strategy, business growth, organisational turnaround and change management as well as acquisition integration.
Mark’s career started in underground coal mining where he had direct responsibility for operations and health & safety. He later transitioned into global retail, wholesale and logistics, having held executive roles at Iceland plc, Booker Wholesale and Tesco in the UK; logistics services provider Tibbett & Britten in Spain and Canada (including running of Walmart Canada’s logistics operations); and The Warehouse Group in Australia and New Zealand.
Between 2009 and 2016, Mark was CEO of Warehouse Stationary and then Group CEO for NZX-listed retailer The Warehouse Group, where he oversaw a return to organic growth, online/digital strategy implementation and a number of acquisitions.
OTHER CURRENT DIRECTORSHIPS: JB Hi-Fi Group Limited (ASX: JBH) Kiwi Property Group Limited (NZX: KPG)
FORMER DIRECTORSHIPS (LAST 3 YEARS): None
SPECIAL RESPONSIBILITIES: Nomination, Remuneration and ESG Committee Chair
INTERESTS IN SHARES: 13,000 ordinary shares
Note: ‘former directorships (last 3 years)’ quoted above are directorships held in the last 3 years for listed entities only and excludes directorships of all other types of entities.
11. COMPANY SECRETARY AND OFFICERSCurrent Chief Financial Officer and Previous Company SecretaryNoel Meehan (Chief Financial Officer 2 July 2020 – present; Company Secretary 2 July 2020 – 1 February 2021) Noel joined Bapcor on 2 July 2020 as Chief Financial Officer and Company Secretary following a successful career as Chief Financial Officer at Toll Group, Chief Finance Officer at Treasury Wines Estates Limited, Executive Director Finance and other roles at Orica Limited and various positions at Qantas. Noel is a Fellow of the Australian Society of Certified Practising Accountants and a Member of the Australian Institute of Company Directors. Noel resigned as Company Secretary effective 1 February 2021 and continues in the role of Chief Financial Officer.
Current Company Secretary and General CounselGeorge Sakoufakis (General Counsel 13 May 2019 – present; Company Secretary 1 February 2021 – present) George commenced with Bapcor on 13 May 2019 as General Counsel following a successful career as Legal Director at Carlton and United Breweries and is an admitted solicitor and holds a Bachelor of Commerce / Bachelor of Laws from Deakin University. George was appointed Company Secretary effective 1 February 2021.
BAPCOR / AnnuAl RePORt 2021
53

DIRECTORS’ REPORT continued
12. MEETINGS OF DIRECTORSThe number of meetings of the company’s Board of Directors (‘the Board’) and of each Board committee held during the year ended 30 June 2021, and the number of meetings attended by each director were:
BOARDNOMINATION, REMUNERATION
AND ESG COMMITTEE AUDIT AND RISK COMMITTEEATTENDED HELD* ATTENDED HELD* ATTENDED HELD*
Andrew Harrison 6 6 1 1 3 3
Margaret Haseltine 10 10 4 4 3 3
Darryl Abotomey** 9 10 – – – –
Therese Ryan 10 10 4 4 4 4
Jennifer Macdonald 10 10 4 4 4 4
James Todd 8 8 – – 3 3
Mark Powell 8 8 3 3 – –
* ‘Held’ represents the number of meetings held during the time the director held office or was a member of the relevant committee.** Darryl Abotomey did not attend one of the Board meetings because the meeting related to the extension of the MD/CEO tenure
As at the date of this report, the current members of the Audit and Risk Committee are Jennifer Macdonald (Chair), Therese Ryan and James Todd. Margaret Haseltine was a member during FY21 until she retired as a member of the Committee on 16 February 2021 (when she became Chair of the Board). Andrew Harrison was a Committee member during FY21 up until his resignation as Director on 16 February 2021. Darryl Abotomey, whilst not a member of the Audit and Risk Committee, attended all Audit and Risk Committee meetings by invitation from the Committee.
As at the date of this report, the current members of the Nomination, Remuneration and ESG Committee are Mark Powell (Chair from 17 February 2021), Margaret Haseltine (Chair until 16 February 2021), Therese Ryan and Jennifer Macdonald. Andrew Harrison was a Committee member during FY21 until he retired as a member on 20 October 2020. Darryl Abotomey, whilst not a member of the Nomination and Remuneration Committee, attended all Nomination and Remuneration Committee meetings by invitation from the Committee.
13. REMUNERATION REPORTDear Shareholders,
On behalf of the Board, we are pleased to present Bapcor’s FY21 Remuneration Report.
This year has been like no other – our business has continued to be significantly challenged by the impacts of Covid and therefore we would like to start by thanking our team members for their dedication and commitment in delivering the most outstanding results for Bapcor.
Despite Covid restrictions, supply and shipping difficulties, our team has responded and delivered increased revenue and earnings right across our business – breaking many records along the way – through lockdowns, travel restrictions, going live with a new warehouse management system and commissioning the first stage of our business into the state-of-the-art distribution centre at Tullamarine in Victoria – all while ensuring that the health and well-being of our team was top of mind.
In recognition of their dedication and performance all eligible team members are being rewarded with up to $600 in gift cards as a token of our appreciation.
Bapcor did not access the Australian Government’s Job Keeper subsidy program and, at our cost, provided paid pandemic leave to team members to sustain them through Covid lockdowns.
As a customer focused and people centric business offering exceptional service to our customers in trade, retail, commercial vehicles and wholesale, our team members are key to the success of Bapcor. It is therefore essential that Bapcor is able to attract, motivate, and retain world-class talent and foster a customer oriented and excellence in execution culture. Bapcor relies on our leadership team to deliver our strategies and ensure Bapcor is a sustainable and profitable business bringing wealth and value to our shareholders. The Board’s objective is to retain our talent and build excellent succession planning whilst remunerating and paying our people fairly at market medians.
54

There is no doubt the FY21 financial year has been a difficult one and challenging for all, especially in Victoria where our major businesses are based. On behalf of the Board we would like to thank all our team members, franchisees, customers, suppliers and shareholders for supporting us through such a difficult year.
Following the shareholder strike vote against the Remuneration Report at the 2020 AGM, the Board has engaged extensively with shareholders and proxy advisors to further understand their feedback. This has been complemented by a robust review of the remuneration framework and disclosures, completed both internally and with external advisors. Throughout this review process, the Board has focused on ensuring all material shareholder concerns have been addressed and the following table summarises the positive changes that have been implemented as a result of this review. We thank our shareholders for their feedback. You will see we have implemented many changes with most of these being effective in FY21. We recognise that the impact of these changes on our senior executives this year is significant so we are phasing any additional changes in over a three-year period.
The following table details what changes have been made:
REMUNERATION AREA FEEDBACK RECEIVED BAPCOR RESPONSEFixed remuneration High fixed
remuneration with fixed pay increases
There has been no increase to fixed remuneration for the MD/CEO or Non-Executive Director’s base fees in FY21. There were only four Executive Key Management Personnel (‘KMP’) out of nine that received an increase where there has been a significant increase in role complexity and responsibility or where the Executive KMP was new to role and had not been reviewed since appointment and was below market median based on role benchmarking (refer section 14.5.2).
The remuneration of the MD/CEO reflects his significant commitment to the success of Bapcor. He has led the delivery of strategic outcomes and shareholder returns over an extended period of time, well in excess of the average market tenure for similar roles.
The Board undertakes independent benchmarking each year as a guide for any remuneration changes.
STI – Q1 Additional Q1 STI award for FY21
The previously documented Q1 short-term incentive (‘STI’) award for FY21 has been absorbed into the full year FY21 STI award. There has been no increase in the potential maximum STI for the FY21 year. Bapcor acknowledges the Q1 STI was out of step with market expectations.
STI – disclosure Insufficient disclosure of STI metrics and outcomes against each measure in the STI
The Board has undertaken a thorough review of the disclosure of STI metrics with regards to performance measures and outcomes. The FY21 remuneration report has been written in a manner to improve disclosure and transparency on all performance measures, weightings and outcomes.
From FY22 there will be an increased emphasis in STI’s on Environmental, Social & Governance and even more transparent and measurable non-financial key performance indicators.
STI – governance Discretion applied to waive the financial gateway or lower threshold.
The Board has reviewed the use of discretion for FY20 and acknowledges the feedback from both proxy advisors and investors. The Board acknowledges this was not fully aligned to investor and proxy advisor sentiment. The Board will develop a more robust set of guidelines to help with potential decision making which will ensure that any decision is better aligned to shareholder expectations.
STI – deferral No STI deferral into equity (below target achievement)
For FY21, 25% of all STI awarded will be deferred for twelve months into either cash or equity. From FY22, the 25% deferred component will be paid in equity until the equivalent of one year’s fixed remuneration is reached.
LTI plan Rigour of the EPS targets as part of the LTI plan
The earnings per share (‘EPS’) targets have remained consistent since the company was listed in 2014. They require a minimum EPS increase of 7.5% compounded per year. The Board reviews long-term incentive (‘LTI’) targets annually and ensures they are set in order to align with long-term sustainable shareholder value creation. At an EPS CAGR of 7.5% only 20% of the rights vest.
BAPCOR / AnnuAl RePORt 2021
55

DIRECTORS’ REPORT continued
REMUNERATION AREA FEEDBACK RECEIVED BAPCOR RESPONSE
Minimum shareholding guidelines
No minimum shareholding guidelines
Minimum shareholding guidelines have been introduced in FY21 for all KMP – executives and non-executive directors. This amounts to 100% of fixed annual remuneration for executives and annual Board fees for non-executive directors to be acquired over five and three years respectively.
KMP Too many KMP’s We acknowledge that we are out of step with most corporates with nine Executive KMP. Legislation outlines the requirements that need to be disclosed in remuneration reports. Historically Bapcor has disclosed all direct reports to the MD/CEO. The Board is reviewing the disclosure requirements and which Executives meet the definitions. It is anticipated that in FY22 the number of KMP’s will be reduced. This will enable more focused disclosure.
MD/CEO Tenure Clarity regarding MD/CEO tenure
The Board and MD/CEO agreed in February 2021 to extend the MD/CEO’s contract to October 2023, during which time the major initiatives underway will be well progressed and allow for a smooth transition.
We believe the positive changes outlined above address the main concerns raised by stakeholders, however we recognise that there needs to be ongoing improvement to further respond to concerns raised while ensuring we appropriately reward and motivate our executive team.
The Board is currently considering additional changes for FY22 and beyond to further enhance the remuneration framework. We thank shareholders and proxy advisors for their diverse feedback, and we have endeavoured to take a balanced view for all stakeholders. The balance is not always easy, and we appreciate ongoing feedback.
During the past year, the Nomination & Remuneration Committee Chair role has passed from Margie Haseltine to Mark Powell as Margie stepped into the Board Chair role. We have at all times worked closely as a Board to ensure we kept the change and momentum to adjust our remuneration practices in keeping with market expectations, while ensuring we are able to attract and retain a talented team that will continue to deliver outstanding results for our shareholders.
During the year the scope of the Nomination & Remuneration Committee was broadened to include Environmental, Social & Governance (‘ESG’) signifying the importance of this remit. The ESG report is a part of the Annual Report.
We still have much work to do and will continue to seek input to ensure ongoing shareholder alignment and best practice whilst attracting, retaining, and developing the best people for Bapcor. We will ensure Bapcor is an employer of choice and that we keep our team members safe every day at the same time as actively progressing our environment, social and governance agenda.
Sincerely,
Mark Powell Margaret Haseltine Chair of the Nomination, Non-Executive Chair of Bapcor Ltd Remuneration and ESG Committee
18 August 2021 Melbourne
56

14. REMUNERATION REPORT (AUDITED)The directors present the Remuneration Report setting out the principles, policy and practices adopted by the Bapcor Board in respect of remuneration for the Group’s non-executive Directors and Executive Key Management Personnel (‘KMP’) in accordance with the requirements of the Corporations Act 2001 and its Regulations.
The Remuneration Report is set out under the following main headings:
14.1 Nomination, Remuneration and Environment, Social & Governance Committee
14.2 Financial performance and relationship to remuneration
14.3 Key management personnel
14.4 Remuneration governance
14.5 Remuneration framework and outcomes
14.6 Cash and realisable remuneration (non-statutory)
14.7 Statutory details of remuneration
The information provided in this Remuneration Report, which forms part of the Directors’ Report, has been audited as required by section 308(3C) of the Corporations Act 2001.
14.1 Nomination, Remuneration and Environment, Social & Governance CommitteeThe Board has established a Nomination, Remuneration and Environment, Social and Governance Committee (‘NRESGC’) which operates under the delegated authority of the Board of Directors. The NRESGC charter is included on the Bapcor website (www.bapcor.com.au). Non-executive Directors of Bapcor who are members of the NRESGC as of the date of this report are as follows:
Mark Powell Non-executive Committee Chair (from 17 February 2021) Non-executive Committee Member (from 1 September 2020 to 16 February 2021)
Margaret Haseltine Non-executive Committee Member (from 17 February 2021) Non-executive Committee Chair (to 16 February 2021)
Therese Ryan Non-executive Committee Member
Jennifer Macdonald Non-executive Committee Member
The Committee is chaired by Mark Powell, an independent Non-executive Director. The Committee is authorised by the Board to obtain external professional advice, and to secure the attendance of advisers with relevant experience and expertise if it considers this necessary.
BAPCOR / AnnuAl RePORt 2021
57
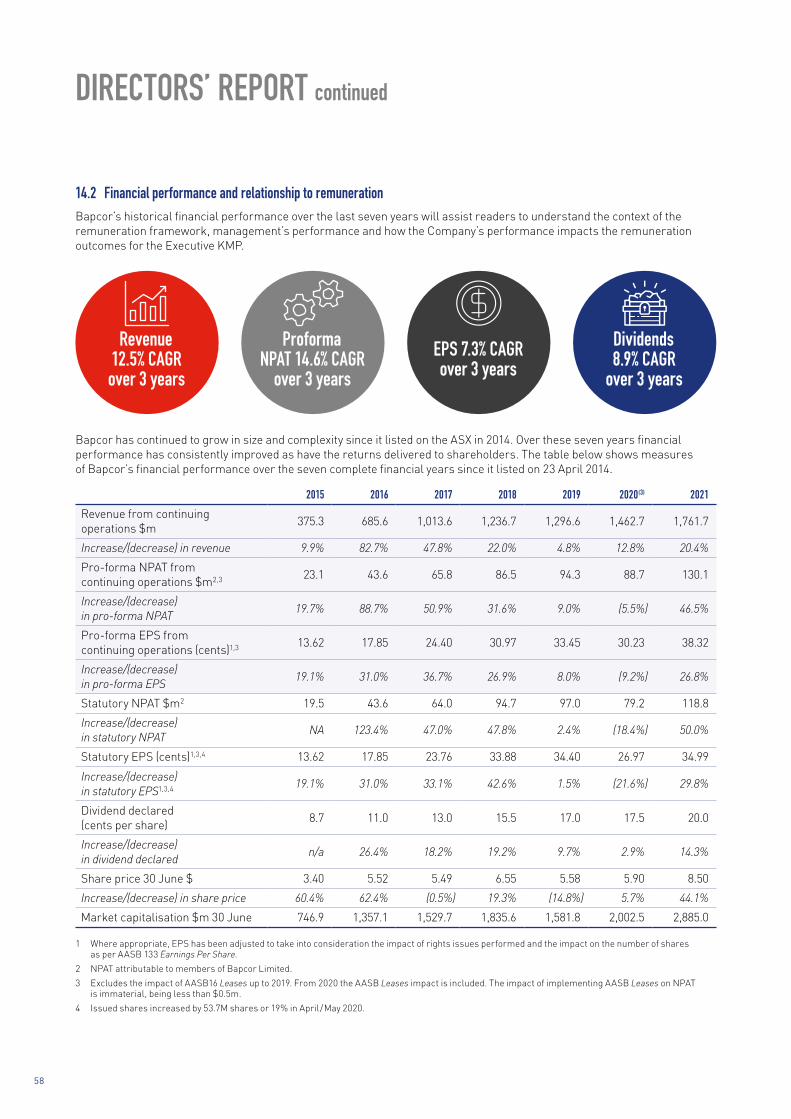
DIRECTORS’ REPORT continued
14.2 Financial performance and relationship to remunerationBapcor’s historical financial performance over the last seven years will assist readers to understand the context of the remuneration framework, management’s performance and how the Company’s performance impacts the remuneration outcomes for the Executive KMP.
Revenue 12.5% CAGR over 3 years
Proforma NPAT 14.6% CAGR
over 3 yearsEPS 7.3% CAGR over 3 years
Dividends 8.9% CAGR
over 3 years
Bapcor has continued to grow in size and complexity since it listed on the ASX in 2014. Over these seven years financial performance has consistently improved as have the returns delivered to shareholders. The table below shows measures of Bapcor’s financial performance over the seven complete financial years since it listed on 23 April 2014.
2015 2016 2017 2018 2019 2020(3) 2021Revenue from continuing operations $m
375.3 685.6 1,013.6 1,236.7 1,296.6 1,462.7 1,761.7
Increase/(decrease) in revenue 9.9% 82.7% 47.8% 22.0% 4.8% 12.8% 20.4%
Pro-forma NPAT from continuing operations $m2,3 23.1 43.6 65.8 86.5 94.3 88.7 130.1
Increase/(decrease) in pro-forma NPAT
19.7% 88.7% 50.9% 31.6% 9.0% (5.5%) 46.5%
Pro-forma EPS from continuing operations (cents)1,3 13.62 17.85 24.40 30.97 33.45 30.23 38.32
Increase/(decrease) in pro-forma EPS
19.1% 31.0% 36.7% 26.9% 8.0% (9.2%) 26.8%
Statutory NPAT $m2 19.5 43.6 64.0 94.7 97.0 79.2 118.8
Increase/(decrease) in statutory NPAT
NA 123.4% 47.0% 47.8% 2.4% (18.4%) 50.0%
Statutory EPS (cents)1,3,4 13.62 17.85 23.76 33.88 34.40 26.97 34.99
Increase/(decrease) in statutory EPS1,3,4 19.1% 31.0% 33.1% 42.6% 1.5% (21.6%) 29.8%
Dividend declared (cents per share)
8.7 11.0 13.0 15.5 17.0 17.5 20.0
Increase/(decrease) in dividend declared
n/a 26.4% 18.2% 19.2% 9.7% 2.9% 14.3%
Share price 30 June $ 3.40 5.52 5.49 6.55 5.58 5.90 8.50
Increase/(decrease) in share price 60.4% 62.4% (0.5%) 19.3% (14.8%) 5.7% 44.1%
Market capitalisation $m 30 June 746.9 1,357.1 1,529.7 1,835.6 1,581.8 2,002.5 2,885.0
1 Where appropriate, EPS has been adjusted to take into consideration the impact of rights issues performed and the impact on the number of shares as per AASB 133 Earnings Per Share.
2 NPAT attributable to members of Bapcor Limited.
3 Excludes the impact of AASB16 Leases up to 2019. From 2020 the AASB Leases impact is included. The impact of implementing AASB Leases on NPAT is immaterial, being less than $0.5m.
4 Issued shares increased by 53.7M shares or 19% in April / May 2020.
58

Over the past seven years Bapcor’s fixed remuneration increases have remained well below all performance measures, including growth in Market Capitalisation, Net Profit after Tax and Revenue. The following graph shows how the relationships have moved relative to each other over the last seven years.
Remuneration Analysis FY14 – FY21
800%
700%
500%
600%
400%
200%
100%
300%
000%
FY14 FY173.91
9435
FY162.87
7410
FY151.87
6312
1.665
333
E-KMP fixed $ME-KMP roles at year end
Avg fixed $000’s
FY184.96
9551
FY20 1
5.079
564
FY215.32
9591
% In
crea
se
1. FY20 E-KMP fixed $M includes two months of Covid related salary sacrifice.
FY194.89
9543
Market Cap NPAT Revenue E-KMP Fixed Rem
14.3 Key management personnelAs defined by AASB 124 Related Party Disclosures, Bapcor’s key management personnel (‘KMP’) are those leaders with the authority and responsibility for planning, directing and controlling the activities of the consolidated entity, directly or indirectly. This includes non-executive and executive directors as well as executive leaders. The KMP during FY21 and their positions are those in the following table.
NAME POSITION
Non-executive Directors
Margaret Haseltine Board Chair (from 17 February 2021)
Member of Nomination, Remuneration, Environment, Safety & Governance Committee (‘NRESGC’) (from 17 February 2021)
Chair of NRESGC (until 16 February 2021)
Member Audit and Risk Committee (‘ARC’) (until 16 February 2021)
Therese Ryan Member NRESGC
Member ARC
Jennifer Macdonald Chair ARC
Member NRESGC
Mark Powell1 Chair NRESGC (from 17 February 2021)
Member NRESGC (from 20 October 2020, until 16 February 2021)
James Todd1 Member ARC (from 20 October 2020)
BAPCOR / AnnuAl RePORt 2021
59

DIRECTORS’ REPORT continued
NAME POSITION
Andrew Harrison Board Chair (retired 16 February 2021)
Member ARC (retired 16 February 2021)
Member NRESGC (retired 16 February 2021)
Executive Director
Darryl Abotomey Managing Director and Chief Executive Officer
Executive KMP
Noel Meehan Chief Financial Officer (appointed 2 July 2020)
Craig Magill Executive General Manager, Trade
Martin Storey Executive General Manager, Bapcor NZ
Mathew Cooper Executive General Manager, Specialist Wholesale – Mechanical
Steve Drummy Executive General Manager, Specialist Wholesale – Engine Management
Tim Cockayne Executive General Manager, Retail
Jeff Nicol Chief Operating Officer
Alison Laing Executive General Manager, Human Resources
Notes:
1 Mark Powell and James Todd were appointed as Independent, Non-Executive Directors 1 September 2020.
2 Greg Fox was Chief Financial Officer and Company Secretary in FY20 and retired on 2 July 2020. He was no longer considered a KMP for FY21.
60

14.4 Remuneration governance The following chart outlines Bapcor’s approach to remuneration governance.
BAPCOR BOARD › Overall accountability for Bapcor’s remuneration approach
› Determines remuneration quantum and structure for executive and non-executive KMP after considering recommendations made by the NRESGC
› Has ultimate discretion in determining the outcomes of incentive arrangements to ensure anomalous outcomes do not arise. This discretion may be exercised to ensure these outcomes reflect the experience of shareholders
› Has discretion to exercise clawback provisions should any material financial misstatements arise
NOMINATION, REMUNERATION AND ENVIRONMENT, SOCIAL & GOVERNANCE COMMITTEE (‘NRESGC’)
Meets regularly to:
› understand and review the effectiveness of the remuneration arrangements
› review the remuneration framework to ensure it remains fit for purpose
› make recommendations to the Board on the structure of the remuneration framework
› make recommendations to the Board regarding fixed remuneration, STI awards and outcomes, and LTI awards and outcomes
› has discretion in determining the outcomes of incentive arrangements to ensure anomalous outcomes do not arise, and recommending any changes to the Board
› assess executive KMP performance
The NRESGC charter can be found at www.bapcor.com.au/about/governance
EXTERNAL ADVISORS 1
› NRESGC seeks external advice and assistance from independent remuneration consultants as it considers appropriate
› Protocols are in place with the Board and NRESGC to ensure the engagement of remuneration advisors is independent of management and is able to be carried out free of any undue influence
› During FY21 the NRESGC engaged Guerdon Associates to provide benchmarking reports in respect of executive KMP remuneration and NED fees as well as other information
› No remuneration recommendations as defined in section 9B of the Corporations Act 2001 were received
CONS
ULTA
TION W
ITH SH
AREH
OLDE
RS AN
D OTH
ER KE
Y STA
KEHO
LDER
S
1 The following arrangements are made to ensure that all engagements of remuneration advisors are independent of management and are able to be carried out free of any undue influence:
– They are engaged directly by the Chair of the NRESGC under delegated authority on behalf of the Board,
– Reports are provided directly to the Chair of the NRESGC, and
– They have unobstructed access to Bapcor personnel throughout the engagement.
As a consequence the Board is satisfied that any advice and assistance received are made free from any undue influence.
BAPCOR / AnnuAl RePORt 2021
61

DIRECTORS’ REPORT continued
14.5 Remuneration framework and outcomesThe following sections explain FY21 Executive KMP remuneration:
14.5.1 FY21 maximum remuneration mix
14.5.2 Fixed remuneration – principles
14.5.3 Short-term incentive – principles
14.5.4 Short-term incentive – performance measurement
14.5.5 Short-term incentive – outcomes
14.5.6 Long-term incentive plan – principles
14.5.7 Long-term incentive plan – vesting scales
14.5.8 Long-term incentive plan – FY21 comparator group
14.5.9 Long-term incentive plan – FY21 grants
14.5.10 Long-term incentive plan – outcomes
14.5.1 FY21 maximum remuneration mixThere are three components that make up the total remuneration for each Executive KMP – fixed remuneration, variable short-term incentive and variable long-term incentive. The maximum potential remuneration by component for Executive KMP is shown in the following chart.
FY21 Executive KMP Potential Maximum Pay Mix
0% 10% 20% 30% 40% 50% 60% 70% 80% 90% 100%
Other KMP
CEO
33% 22%45%
35% 35% 30%
Fixed remuneration Maximum STI Maximum LTI
14.5.2 Fixed remuneration – principlesFixed remuneration comprises base salary, superannuation and non-cash benefits such as motor vehicles. It is set at a level to attract and retain executive talent with the appropriate capabilities to deliver Bapcor’s strategic objectives.
Fixed remuneration is generally positioned having consideration for benchmarking data, surrounding market conditions and sentiment, the trajectory of the company’s growth, strategic objectives, competency and skillset of individuals, scarcity of talent, changes in role complexities and the geographical spread of the company. Market benchmarks are typically set with reference to market capitalisation and include organisations within Bapcor’s industry sector and those that are similar in complexity as determined by the NRESGC each year. Independent benchmarking is obtained each year by NRESGC.
There were only four Executive KMP out of nine who received an increase where there has been a significant increase in role complexity and responsibility or where the Executive KMP was new to role and had not been reviewed since appointment and was below market median based on role benchmarking.
62

EXECUTIVE KMP POSITIONFY20 FIXED
REMUNERATIONFY21 FIXED
REMUNERATION% CHANGE FROM
FY20 TO FY21D Abotomey Managing Director and Chief Executive Officer 1,313,250 1,313,250 Nil
N Meehan Chief Financial Officer Not applicable 700,000 Nil
C Magill Executive General Manager, Trade 575,000 575,000 Nil
M Storey Executive General Manager, Bapcor NZ 425,000 425,000 Nil
M CooperExecutive General Manager, Specialist Wholesale – Mechanical
490,000 525,000 7.14%
S DrummyExecutive General Manager, Specialist Wholesale – Engine Management
435,000 470,000 8.05%
T Cockayne Executive General Manager, Retail 450,000 485,000 7.78%
J Nicol Chief Operating Officer 410,000 450,000 8.89%
A Laing Executive General Manager, Human Resources 380,000 380,000 Nil
14.5.3 Short-term incentive – principles
WHAT IS THE OBJECTIVE OF THE STI?
The short-term incentive (‘STI’) is an annual incentive plan designed to reward Executive KMP’s for meeting or exceeding performance-based objectives over a one-year period. The STI has been designed to support the objective of short-term outperformance in all areas of the business through the use of annual measures linked to the business strategy and set at levels that are achievable, yet challenging. These performance-based outcomes are considered to be an appropriate link between Executive KMP’s remuneration and the creation of shareholder wealth.
HOW IS IT PAID? In FY21 the plan was amended so that 25% of any STI earned is deferred for twelve months.
For FY21, the deferred amount will be paid in cash or equity at the option of the participant. From FY22, the deferred amount will be paid in equity until the participant holds at least the equivalent of one years’ fixed remuneration in equity.
The STI award to incorporate a mandatory 25% of any STI award deferred into equity for twelve months is to reinforce alignment to longer-term shareholder interests. No dividends are attached to any deferred equity.
HOW MUCH CAN EXECUTIVE KMP’S EARN?
In FY21, the Managing Director and Chief Executive Officer had a maximum STI opportunity of 100% of fixed remuneration, and other Executive KMP’s had a maximum STI opportunity of 75% of fixed remuneration.
At the end of each financial year a review by the Board of each Executive KMP’s performance against agreed performance measures that were established at the beginning of the financial year, will determine the percentage (between 0% – 100%) of the maximum potential STI that will be awarded.
HOW IS PERFORMANCE MEASURED?
A combination of specific performance targets are determined at the beginning of the financial year to reflect the core drivers of short-term performance and also to provide a framework for delivering sustainable long-term value to the Group and its shareholders.
The following performance targets were chosen for FY21:
› Financial targets:
– NPAT for CEO/CFO and
– EBIT (Group or Segment) for all Executive KMP
– Revenue (Group or Segment) for all Executive KMP
– Working Capital targets for all Executive KMP
BAPCOR / AnnuAl RePORt 2021
63

DIRECTORS’ REPORT continued
› Non-financial objectives:
– Safety & Risk Management
– Team – Succession Planning, Diversity, Talent Development
– Strategic Growth – Stores, Intercompany Sales, Own Brand growth
– Implementation of the Victorian Consolidated Distribution Centre
– Digital Development
Further details on these KPIs, the weightings respective to each member of the Executive KMP and the outcomes are presented in the outcomes section.
WHEN IS IT PAID? The STI award is determined after the end of the financial year following a review of performance over the year against the STI performance measures.
The STI award for FY21 will be paid 75% in cash following the performance assessment, with the remaining 25% deferred for 12 months and paid in cash or equity. From FY22, the deferred component into equity will be mandatory until the equivalent of one year’s fixed remuneration is reached.
WHAT HAPPENS IF AN EXECUTIVE KMP LEAVES?
Prior to STI payment date: if an Executive KMP ceases employment with Bapcor prior to any cash being paid, the Executive KMP will forfeit any awards to be paid for the performance period, unless the Board determines otherwise.
Post STI payment date: if an Executive KMP resigns from their position, they will be paid the STI on the relevant date unless they are dismissed for serious misconduct wherein any unpaid amount will be forfeited in accordance with the Clawback policy.
CHANGE OF CONTROL In the event that a ‘Change of Control Event’ (as defined in the Plan) occurs or the Company sells the whole or a substantial part of Bapcor Limited, the Board may in its discretion determine whether and in what amount to pay any STI bonuses under the FY21 STI Program.
CLAWBACK The Board retains the discretion to adjust the STI bonus payable prior to payment or to reclaim any STI Bonus after payment or issue (clawback) such as, but not limited to, instances of:
› Material financial misstatements;
› Major negligence;
› Significant legal, regulatory and/or policy noncompliance; and
› Significant harmful act by an individual.
14.5.4 Short-term incentive – performance measurementParticipants in the STI plan are eligible to earn a maximum payment that is a percentage of their fixed annual remuneration with financial and non-financial targets established at the beginning of each financial year by the Board. Actual STI payments will be at or below the maximum depending on the achievement of these financial and non-financial objectives.
The largest component of the STI opportunity is contingent on meeting financial objectives of a combination of annual Revenue, NPAT, EBIT, working capital to sales percentage and inventory to sales percentage. The FY21 objectives set by the Board were at levels higher than the previous year’s achievement.
The remaining component of the STI is subject to meeting other annual non-financial objectives.
64

TYPE OF PERFORMANCE MEASURE AND WEIGHTING AT MAXIMUM
PERFORMANCE MEASURE RATIONALE FY21 ACTUAL PERFORMANCE LEVEL OF ACHIEVEMENT
Financial
CEO 83.5%
Other KMP 80%
Group NPAT Increase more than 30% above FY20 actual and more than 25% above FY19 actual.
This is above market expectations at time it was set.
Pro-forma NPAT is:
› 46.5% above FY20 and
› 37.9% above FY19,
exceeding the maximum objective by 8.4%.
100% of maximum for group.
Business segments vary – mostly at maximum.
EBIT (Group or Segment)
Targets set by business segment reflecting the increase in the group NPAT target
Group EBIT is:
› 38.9% above FY20
exceeding the maximum objective by 8.6%
100% of maximum for group.
Business segments vary – mostly at maximum.
Revenue (Group or Segment)
Targets set by business segment reflecting the growth used for the group revenue.
Group Revenue is:
› 20.4% above FY20
100% of maximum for group.
Business segments vary – mostly at maximum.
Working Capital or Inventory to Sales Percentage
Working capital or Inventory to sales % to reduce from FY20
FY21 WC to sales 16.3% Target 16.4%
100% of target – varies by participant
Non-Financial
CEO 16.5%
Other KMP 20%
Safety & Risk Management
Ensure a safe working environment for team members. Implement improved reporting system and complete action items. Prepare and action quarterly Risk Registers.
New reporting system implemented.
Quarterly safety risk registers reviewed and actioned.
Mostly Achieved
Team – Succession planning, Diversity, Talent Development
Critical for growth of business – specific targets set by area for each individual.
Succession planning & talent management implemented by each business and group. Diversity actions behind target. Development program implemented for Leadership Team.
Part Achieved
Strategic Growth Critical for delivery of five-year strategic targets. Achieve new stores to support future growth, intercompany sales growth, own brand targets.
Net new company stores opened was 31.
Own brand at 31% – in line with target.
Mostly Achieved
BAPCOR / AnnuAl RePORt 2021
65

DIRECTORS’ REPORT continued
TYPE OF PERFORMANCE MEASURE AND WEIGHTING AT MAXIMUM
PERFORMANCE MEASURE RATIONALE FY21 ACTUAL PERFORMANCE LEVEL OF ACHIEVEMENT
Non-Financial
CEO 16.5%
Other KMP 20%
Implementation of the Victorian Consolidated DC
Key group strategic objective is to have the most efficient supply chain. In FY21, deliver on time and on budget the major project for the group which sets long-term supply chain efficiency. Program is to transition thirteen DC’s in Melbourne into one consolidated DC.
Transition of retail business was achieved smoothly with no material impact on revenue and profit. Overall program delayed due to Covid restrictions.
Mostly Achieved
Digital Development Ensuring the business moves ahead through a program utilising modern technology development to competitive advantage
Program developed and approved by Board.
Implemented new retail POS, eCommerce B2C and B2B, vehicle on line platform launched.
Other projects progressed.
Mostly Achieved
MAXIMUM POTENTIAL BY MEASURESCORECARD CATEGORY MEASURE CEO CFO EGMS COO EGM HR
Financial
Group NPAT 72.5% 13.3% – – –
Revenue – – 3.3% – –
Group EBIT 5.5% 53.4% 33.4% 46.7% 53.4%
Segment EBIT – – 37.4% 4.7% –
Working Capital or Inventory to Sales Percentage
5.5% 13.4% 6.0% 8.7% –
Non-Financial
Safety & Risk Management
1.1% 1.3% 1.3% 1.3% 2.7%
Team – Succession Planning, Diversity, Talent Development
1.65% 3.3% 2.7% 3.3% 4.0%
Strategic Growth 8.25% 15.3% 9.3% 15.3% 8.0%
Implementation of the Victorian Consolidated DC
2.75% – 3.3% 20.0% 26.6%
Digital Development 2.75% – 3.3% – 5.3%
Total 100% 100% 100% 100% 100%
Maximum % of Total Fixed Remuneration Achievable 100% 75% 75% 75% 75%
66

14.5.5 Short-term incentive – outcomesThe following table shows the estimated STI outcomes for the Executive KMP for FY21:
KMPMAXIMUM STI AS A % OF FAR
STI AS A % OF MAXIMUM
STI FORFEITED AS A % OF MAXIMUM
STI AWARDED $
DEFERRED STI $
D Abotomey 100.0% 93.6% 6.4% 1,229,587 307,397
N Meehan 75.0% 91.9% 8.1% 482,312 120,578
C Magill 75.0% 95.1% 4.9% 409,977 102,494
M Storey 75.0% 65.7% 34.3% 209,525 52,381
M Cooper 75.0% 89.7% 10.3% 353,325 88,331
S Drummy 75.0% 88.1% 11.9% 310,672 77,668
T Cockayne 75.0% 89.6% 10.4% 325,920 81,480
J Nicol 75.0% 79.6% 20.4% 268,651 67,163
A Laing 75.0% 88.4% 11.6% 251,941 62,985
Total 3,841,910 960,477
The STI performance measures are tested after the end of the relevant financial year. The resulting figures may differ from the amounts shown above.
14.5.6 Long-term incentive plan – principlesThe key terms of the LTI plan under which grants were made in FY21 and prior years are as follows:
WHAT IS THE OBJECTIVE OF THE LTI PLAN?
The long-term incentive (‘LTI’) plan focuses the efforts of the MD/CEO and other Executive KMP’s on creating sustainable long-term value. The LTI plan rewards executives for creating sustained shareholder wealth in excess of that of peer companies in our industry and absolute long-term earnings performance. The LTI plan serves to attract and retain key executives and promotes strong alignment with shareholders’ interests, aligning long-term Company and shareholder value creation.
ADMINISTRATION The LTI plan is administered by the Board.
WHO PARTICIPATES? In FY21 Executive KMP who were employed at the commencement of the financial year were invited to participate.
WHAT IS THE LTI OPPORTUNITY? The LTI opportunity is the grant of Performance Rights that will vest on satisfaction of the applicable performance, service or other vesting conditions specified in the Offer at the time of the grant. The Board sets the terms and conditions on which it will offer Performance Rights under the LTI, including the vesting conditions, at the time of the offer.
The MD/CEO is entitled to a maximum opportunity of 90% of Fixed Remuneration, whilst other executives are entitled to a maximum opportunity of 50% (60% for the CFO) of Fixed Remuneration.
INSTRUMENT The FY21 LTI opportunity provides the grant of Performance Rights to participants that will vest upon satisfaction of the performance conditions, and convert into fully paid ordinary shares. The Performance Rights do not carry any voting rights or dividend entitlements.
Performance rights that have satisfied the performance conditions vest at the election of the participant – which may be for a period up to 15 years from the satisfaction of the performance hurdles.
The Board sets the terms and conditions on which it will offer Performance Rights under the LTI, including the vesting conditions, at the time of the offer.
HOW WAS THE NUMBER OF PERFORMANCE RIGHTS DETERMINED?
For the grants made in FY21, the number of Performance Rights was determined by dividing the participants LTI opportunity by the face value of a Bapcor shares based on the weighted average share price in the ten days to 30 June 2020.
PERFORMANCE PERIOD The performance period for the LTI’s granted in FY21 is 3 years.
BAPCOR / AnnuAl RePORt 2021
67

DIRECTORS’ REPORT continued
PERFORMANCE MEASURES Each participant is granted two tranches of Performance Rights:
› 50% of the total grant value of Performance Rights are subject to the satisfaction of a total shareholder return (‘TSR’) performance hurdle for the relevant performance period (‘TSR Rights’), and
› 50% are subject to satisfaction of an earnings per share (‘EPS’) performance hurdle for the relevant performance period (‘EPS Rights’).
These are described in more detail in the section following this table.
AMENDMENTS To the extent permitted by the ASX Listing Rules, the Board retains the discretion to vary the terms and conditions of the LTI. This includes varying the number of Performance Rights or the number of shares to which a participant is entitled upon a reorganisation of the capital of Bapcor. No discretion to vary LTI terms and conditions was made in FY21 or prior years.
OTHER TERMS Shares acquired on the conversion of vested Performance Rights cannot be sold for a period of twelve months from the date the rights satisfied the performance hurdles. Performance Rights cannot be transferred, encumbered or hedged.
The LTI contains other terms relating to the administration, variation, suspension and termination of the LTI.
CHANGE OF CONTROL In the event that a ‘Change of Control Event’ (as defined in the Plan) occurs or the Company sells the whole or a substantial part of Bapcor Limited, the Board may in its discretion determine whether and in what amount of any Performance Rights vest.
DIVIDENDS AND VOTING RIGHTS Performance rights do not confer on the holder any entitlement to any dividends or other distributions by the Group or any right to attend or vote at any general meeting of the Group.
WHAT HAPPENS IF A KMP LEAVES?
The LTI Performance Rights are subject to the participant being employed (or contracted) for the full performance period of 3 years.
If the participant is a “good leaver”, as defined in the plan, the prorated number of months completed out of the three years may vest if the performance hurdles are achieved. If the participant is not a “good leaver” any unvested rights will automatically lapse on the date of the cessation of employment, subject to any determination otherwise by the Board in its sole and absolute discretion.
CLAWBACK Where, in the opinion of the Board, the participant:
› acts fraudulently, or dishonestly;
› wilfully breaches their duties to the Group; or
› is responsible for material financial misstatements, major negligence, significant legal, regulatory and/or policy non-compliance, or a significant harmful act;
the Board may, at its sole and absolute discretion, deem some or all of the unvested, or vested but unconverted, performance rights granted to that participant to be forfeited and to have lapsed. Under specific circumstances any vested equity can be clawed back from the participant.
68

14.5.7 Long-term incentive plan – vesting scalesRelative total shareholder return hurdle (‘TSR’)Fifty per cent of the Performance Rights granted to a participant will vest subject to a TSR performance hurdle that assesses performance by measuring capital growth in the share price together with income returned to shareholders, measured over the performance period against a Comparator Group of companies. The Performance Rights will vest by reference to Bapcor’s TSR performance ranking against this Comparator Group of companies, as follows:
BAPCOR’S TSR RELATIVE TO THE COMPARATOR GROUP OVER THE PERFORMANCE PERIOD PERCENTAGE OF TSR RIGHTS VESTINGLess than 50th percentile Nil
Equal to 50th percentile 50%
Greater than 50th percentile and less than 75th percentile Pro-rata straight-line vesting
Equal to or greater than 75th percentile 100%
TSR for Bapcor and the companies in the Comparator Group will be calculated as follows:
› TSR will be measured between 1 July 2020 and 30 June 2023 (the Performance Period);
› For the purpose of this measurement, dividends will be assumed to have been re-invested on the ex-dividend date;
› Tax and any franking credits (or equivalent) will be ignored; and
› For the purpose of this measurement, the share price of Bapcor and the Comparator Group companies will be averaged over the ten trading days up to and including 30 June at the start and end date of the Performance Period.
Earnings per share growth (‘EPS’)Fifty per cent of the Performance Rights granted to a participant will vest by reference to an EPS performance hurdle that measures the basic EPS on a normalised basis over the performance period. Each tranche of Performance Rights subject to an EPS hurdle will vest as follows:
› The Board has determined that the EPS hurdle will be based on a compound annual growth rate (‘CAGR’) of basic EPS of between 7.5% and 15%, respectively, over the Performance Period.
› The starting point for these EPS rights is the FY20 pro-forma basic EPS of 30.23 cents per share.
› Basic EPS is calculated in accordance with AASB 133 Earnings Per Share.
› The proportion of the EPS Rights that vest at the end of the Performance Period will be determined as follows:
BAPCOR’S COMPOUND ANNUAL EPS GROWTH OVER THE PERFORMANCE PERIOD PERCENTAGE OF EPS RIGHTS VESTINGLess than 7.5% Nil
7.5% 20%
Greater than 7.5% and less than 15% Pro-rata straight-line vesting
Equal to or greater than 15% 100%
If vesting conditions are met, Performance Rights granted in FY21 will convert into fully paid ordinary shares of the company. Shares that are allocated in respect of each tranche will be subject to a restriction on sale for twelve months from vesting of the Performance Rights.
BAPCOR / AnnuAl RePORt 2021
69
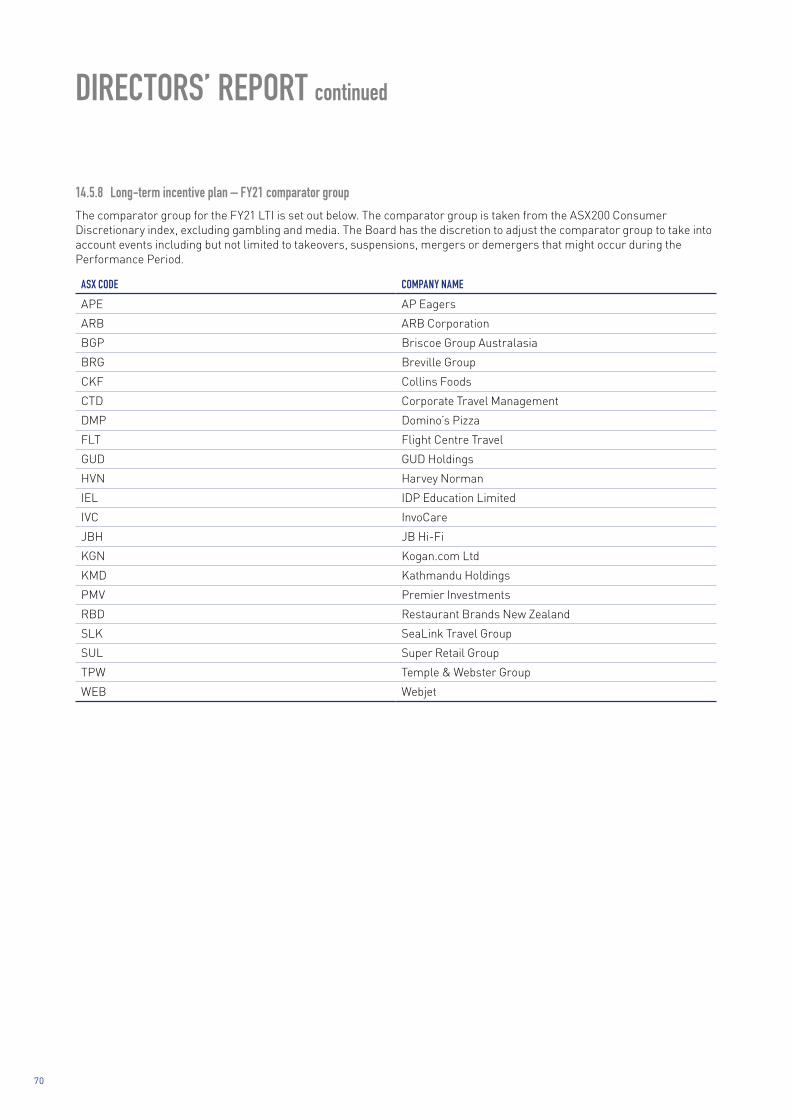
DIRECTORS’ REPORT continued
14.5.8 Long-term incentive plan – FY21 comparator groupThe comparator group for the FY21 LTI is set out below. The comparator group is taken from the ASX200 Consumer Discretionary index, excluding gambling and media. The Board has the discretion to adjust the comparator group to take into account events including but not limited to takeovers, suspensions, mergers or demergers that might occur during the Performance Period.
ASX CODE COMPANY NAMEAPE AP Eagers
ARB ARB Corporation
BGP Briscoe Group Australasia
BRG Breville Group
CKF Collins Foods
CTD Corporate Travel Management
DMP Domino’s Pizza
FLT Flight Centre Travel
GUD GUD Holdings
HVN Harvey Norman
IEL IDP Education Limited
IVC InvoCare
JBH JB Hi-Fi
KGN Kogan.com Ltd
KMD Kathmandu Holdings
PMV Premier Investments
RBD Restaurant Brands New Zealand
SLK SeaLink Travel Group
SUL Super Retail Group
TPW Temple & Webster Group
WEB Webjet
70

14.5.9 Long-term incentive plan – FY21 grantsIn relation to FY21 an offer to participate was made to nine Executive KMPs. These allocated Performance Rights have a performance period ending 30 June 2023 at which time the performance hurdles are tested. A summary of the terms is in the following table:
GRANT DATE 10/09/2020 20/10/2020
PERFORMANCE HURDLE Relative TSR EPS Relative TSR EPS
PERFORMANCE PERIOD 1/07/2020 to 30/06/2023 1/07/2020 to 30/06/2023
TEST DATE 30/06/2023 30/06/2023
EXPIRY DATE 6/09/2035 6/09/2035
QUANTITY GRANTED 170,280 170,280 100,504 100,504
EXERCISE PRICE Nil Nil
FAIR VALUE AT GRANT DATE $5.88 $5.88 $5.88 $5.88
OTHER CONDITIONS Restriction on sale to 30/06/2024 Restriction on sale to 30/06/2024
SHARE PRICE ON VALUATION DATE $6.89 $8.19
VOLATILITY 38.02% 38.31%
DIVIDEND YIELD 2.54% 2.14%
RISK FREE RATE 0.2441% 0.1269%
14.5.10 Long-term incentive plan – outcomesDuring FY21 the following Performance Rights were independently tested by third parties:
The LTI granted to six executives on 26 September 2018, was independently tested by a third party against the company’s FY21 TSR and EPS performance. The extent to which they vested is as follows:
› Relative TSR Rights: Bapcor’s TSR performance ranked at the 43.7th percentile of the comparator group. This resulted in none of the tranche vesting.
› Compound annual growth rate (‘CAGR’) of EPS: Bapcor’s CAGR of EPS was 7.3%. This resulted in none of the tranche vesting.
The LTI granted to the CEO on 29 October 2018, was independently tested by a third party against the company’s FY21 TSR and EPS performance. The extent to which they vested is as follows:
› Relative TSR Rights: Bapcor’s TSR performance ranked at the 43.7th percentile of the comparator group. This resulted in none of the tranche vesting.
› CAGR of EPS: Bapcor’s CAGR of EPS was 7.3%. This resulted in none of the tranche vesting.
TSR percentile v LTI vesting over the five years
120%
100%
80%
60%
40%
20%
000%
100%
80%
60%
40%
20%
0%FY17 FY18 FY19 FY20 FY21
% L
TI T
SR r
ight
s ve
sted
TSR
per
cent
ile
TSR percentile % LTR TSR Rights Vested
BAPCOR / AnnuAl RePORt 2021
71
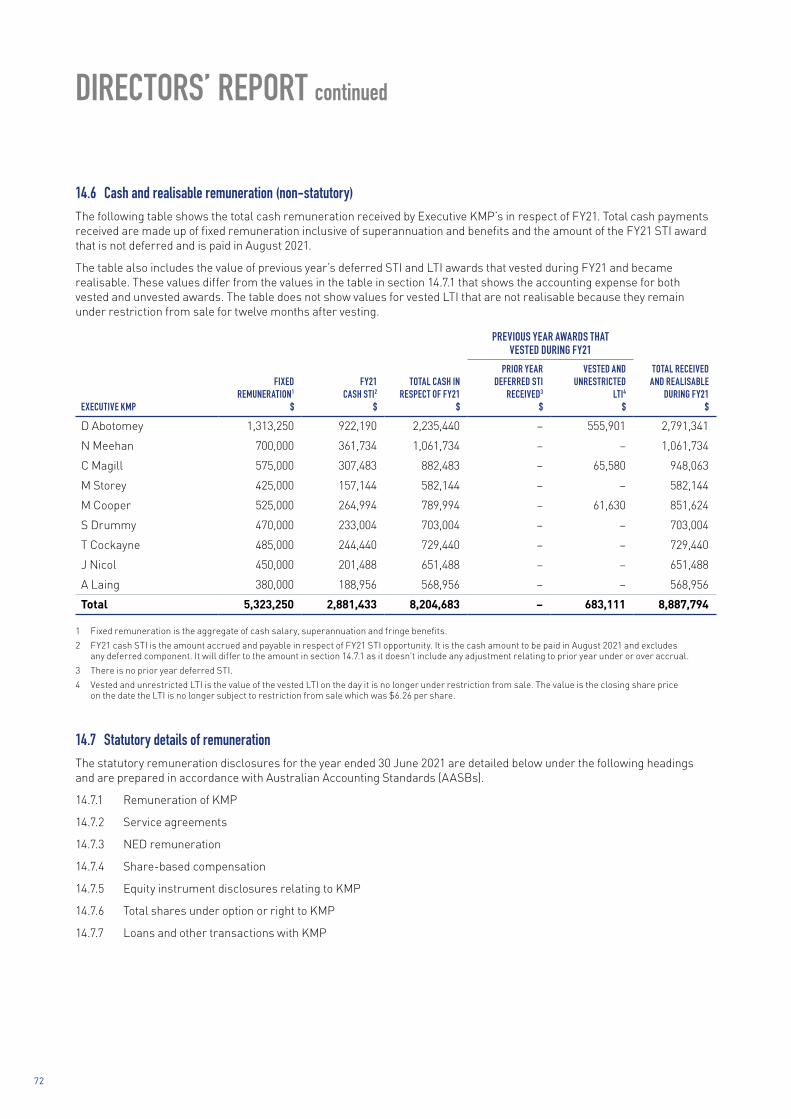
DIRECTORS’ REPORT continued
14.6 Cash and realisable remuneration (non-statutory)The following table shows the total cash remuneration received by Executive KMP’s in respect of FY21. Total cash payments received are made up of fixed remuneration inclusive of superannuation and benefits and the amount of the FY21 STI award that is not deferred and is paid in August 2021.
The table also includes the value of previous year’s deferred STI and LTI awards that vested during FY21 and became realisable. These values differ from the values in the table in section 14.7.1 that shows the accounting expense for both vested and unvested awards. The table does not show values for vested LTI that are not realisable because they remain under restriction from sale for twelve months after vesting.
PREVIOUS YEAR AWARDS THAT VESTED DURING FY21
EXECUTIVE KMP
FIXED REMUNERATION1
$
FY21 CASH STI2
$
TOTAL CASH IN RESPECT OF FY21
$
PRIOR YEAR DEFERRED STI
RECEIVED3 $
VESTED AND UNRESTRICTED
LTI4 $
TOTAL RECEIVED AND REALISABLE
DURING FY21 $
D Abotomey 1,313,250 922,190 2,235,440 – 555,901 2,791,341
N Meehan 700,000 361,734 1,061,734 – – 1,061,734
C Magill 575,000 307,483 882,483 – 65,580 948,063
M Storey 425,000 157,144 582,144 – – 582,144
M Cooper 525,000 264,994 789,994 – 61,630 851,624
S Drummy 470,000 233,004 703,004 – – 703,004
T Cockayne 485,000 244,440 729,440 – – 729,440
J Nicol 450,000 201,488 651,488 – – 651,488
A Laing 380,000 188,956 568,956 – – 568,956
Total 5,323,250 2,881,433 8,204,683 – 683,111 8,887,794
1 Fixed remuneration is the aggregate of cash salary, superannuation and fringe benefits.
2 FY21 cash STI is the amount accrued and payable in respect of FY21 STI opportunity. It is the cash amount to be paid in August 2021 and excludes any deferred component. It will differ to the amount in section 14.7.1 as it doesn’t include any adjustment relating to prior year under or over accrual.
3 There is no prior year deferred STI.
4 Vested and unrestricted LTI is the value of the vested LTI on the day it is no longer under restriction from sale. The value is the closing share price on the date the LTI is no longer subject to restriction from sale which was $6.26 per share.
14.7 Statutory details of remunerationThe statutory remuneration disclosures for the year ended 30 June 2021 are detailed below under the following headings and are prepared in accordance with Australian Accounting Standards (AASBs).
14.7.1 Remuneration of KMP
14.7.2 Service agreements
14.7.3 NED remuneration
14.7.4 Share-based compensation
14.7.5 Equity instrument disclosures relating to KMP
14.7.6 Total shares under option or right to KMP
14.7.7 Loans and other transactions with KMP
72

14.7.1 Remuneration of KMP
SHORT-TERM BENEFITS1
POST-EMPLOYMENT
BENEFITSLONG-TERM
BENEFITS
SHARE-BASED
PAYMENTSPERCENTAGE OF REMUNERATION
FIXED AND AT RISKCASH SALARY
AND FEES2 BONUS2SUPER-
ANNUATIONLONG SERVICE
LEAVEEQUITY
SETTLED TOTAL FIXED AT RISK – STI AT RISK – LTI
2021 $ $ $ $ $ $ % % %
NED
M Haseltine3 181,836 – 17,134 – – 198,970 100% – –
T Ryan 122,016 – 11,592 – – 133,608 100% – –
J Macdonald 139,719 – 13,273 – – 152,992 100% – –
J Todd4 90,082 – 8,558 – – 98,640 100% – –
M Powell4 96,124 – 9,132 – – 105,256 100% – –
A Harrison5 178,229 – 15,019 – – 193,248 100% – –
Executive Director
D Abotomey 1,301,082 1,322,456 25,961 20,638 1,145,225 3,815,362 35% 35% 30%
Other KMP
N Meehan6 713,400 497,312 21,694 11,305 130,118 1,373,829 55% 36% 9%
C Magill 542,053 451,527 22,529 9,222 266,632 1,291,963 44% 35% 21%
M Storey 405,111 231,017 11,808 – 190,726 838,662 49% 28% 23%
M Cooper 506,158 388,500 21,694 8,388 223,206 1,147,946 47% 34% 19%
S Drummy 458,590 331,372 21,694 7,472 139,305 958,433 50% 35% 15%
T Cockayne 479,343 358,095 21,694 7,722 144,110 1,010,964 51% 35% 14%
J Nicol 436,541 317,826 21,694 7,138 131,300 914,499 51% 35% 14%
A Laing 362,044 278,866 22,529 5,972 172,512 841,923 47% 33% 20%
Total 6,012,328 4,176,971 266,005 77,857 2,543,134 13,076,295
1 There were no non-monetary benefits to KMP in FY21.
2 Cash salary and fees includes accrued annual leave. Bonus includes any prior year variance for accrual estimate versus actual cash paid.
3 M Haseltine was appointed Chair 17 February 2021.
4 J Todd and M Powell were appointed 1 September 2020.
5 A Harrison retired 16 February 2021.
6 N Meehan was appointed 2 July 2020.
BAPCOR / AnnuAl RePORt 2021
73

DIRECTORS’ REPORT continued
SHORT-TERM BENEFITS1
POST-EMPLOYMENT
BENEFITSLONG-TERM
BENEFITS
SHARE-BASED
PAYMENTSPERCENTAGE OF REMUNERATION
FIXED AND AT RISKCASH SALARY
AND FEES2 BONUS2SUPER-
ANNUATIONLONG SERVICE
LEAVEEQUITY
SETTLED TOTAL FIXED AT RISK – STI AT RISK – LTI
2020 $ $ $ $ $ $ % % %
NED
A Harrison 249,013 – 21,003 – – 270,016 100% – –
T Ryan 124,758 – 12,282 – – 137,040 100% – –
M Haseltine 116,047 – 11,425 – – 127,472 100% – –
J Macdonald 124,758 – 12,282 – – 137,040 100% – –
Executive Director
D Abotomey 1,239,306 593,070 25,000 20,638 955,810 2,833,824 45% 21% 34%
Other KMP
G Fox3 672,816 302,438 21,003 11,400 354,848 1,362,505 52% 22% 26%
C Magill 547,173 280,025 21,003 9,233 236,544 1,093,978 52% 26% 22%
M Storey 406,791 181,927 16,002 – 124,891 729,611 58% 25% 17%
M Cooper 450,984 192,568 21,003 7,816 197,858 870,229 55% 22% 23%
S Drummy 406,623 183,878 21,003 6,900 71,922 690,326 63% 27% 10%
T Cockayne 419,114 198,902 21,003 7,150 74,402 720,571 62% 28% 10%
J Nicol4 385,931 163,207 21,003 6,483 67,789 644,413 64% 25% 11%
A Laing 337,337 155,762 21,003 5,983 149,761 669,846 55% 23% 22%
Total 5,480,651 2,251,777 245,015 75,603 2,233,825 10,286,871
1 There were no non-monetary benefits to KMP in FY20.
2 Cash salary and fees includes accrued annual leave. Bonus includes any prior year variance for accrual estimate versus actual cash paid. For two months KMP’s voluntarily reduced their base salary and NED fees by up to 30% due to Covid.
3 G Fox retired 2 July 2020 and was no longer a KMP in FY21.
4 J Nicol was appointed 8 July 2019.
14.7.2 Service agreementsRemuneration and other terms of employment for KMP are formalised in service agreements. Details of these agreements are as follows.
Chief Executive Officer & Managing DirectorName: Darryl Abotomey Title: Chief Executive Officer and Managing Director Agreement commenced: 1 May 2019 Term of agreement: To 31 October 2023
Details: Fixed annual remuneration is $1,313,250 (inclusive of superannuation). No increase was applied in FY21. Fixed remuneration is reviewed annually. Fixed remuneration and incentives were based on independent benchmarking received from Guerdon Associates.
Bapcor or Darryl may terminate his employment contract by giving the other twelve months’ written notice before the proposed date of termination, or in Bapcor’s case, payment in lieu of notice. Bapcor may terminate Darryl’s employment immediately and without payment in lieu of notice in certain circumstances including for any serious misconduct. Darryl’s employment contract also includes a restraint of trade period of twelve months. Other than any amounts accrued and earned such as annual leave, long service leave, STI and LTI (subject to vesting conditions and Board approval) there are no termination payments included in his contract.
74
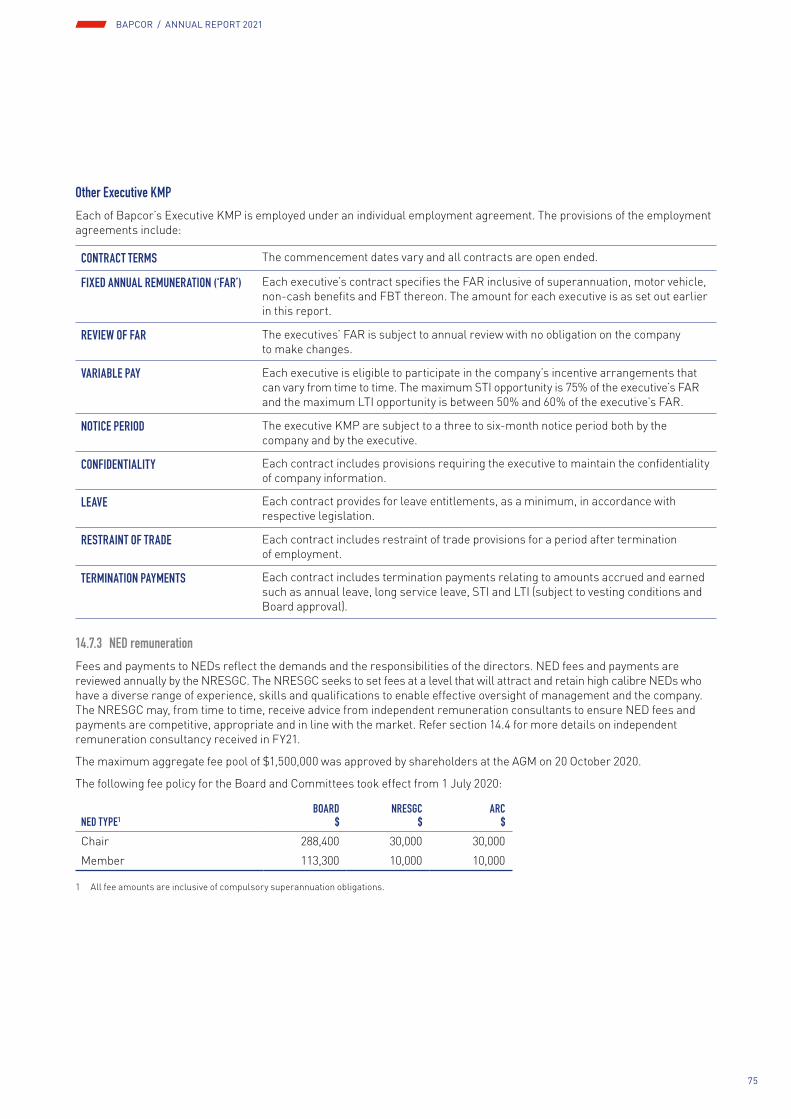
Other Executive KMPEach of Bapcor’s Executive KMP is employed under an individual employment agreement. The provisions of the employment agreements include:
CONTRACT TERMS The commencement dates vary and all contracts are open ended.
FIXED ANNUAL REMUNERATION (‘FAR’) Each executive’s contract specifies the FAR inclusive of superannuation, motor vehicle, non-cash benefits and FBT thereon. The amount for each executive is as set out earlier in this report.
REVIEW OF FAR The executives’ FAR is subject to annual review with no obligation on the company to make changes.
VARIABLE PAY Each executive is eligible to participate in the company’s incentive arrangements that can vary from time to time. The maximum STI opportunity is 75% of the executive’s FAR and the maximum LTI opportunity is between 50% and 60% of the executive’s FAR.
NOTICE PERIOD The executive KMP are subject to a three to six-month notice period both by the company and by the executive.
CONFIDENTIALITY Each contract includes provisions requiring the executive to maintain the confidentiality of company information.
LEAVE Each contract provides for leave entitlements, as a minimum, in accordance with respective legislation.
RESTRAINT OF TRADE Each contract includes restraint of trade provisions for a period after termination of employment.
TERMINATION PAYMENTS Each contract includes termination payments relating to amounts accrued and earned such as annual leave, long service leave, STI and LTI (subject to vesting conditions and Board approval).
14.7.3 NED remunerationFees and payments to NEDs reflect the demands and the responsibilities of the directors. NED fees and payments are reviewed annually by the NRESGC. The NRESGC seeks to set fees at a level that will attract and retain high calibre NEDs who have a diverse range of experience, skills and qualifications to enable effective oversight of management and the company. The NRESGC may, from time to time, receive advice from independent remuneration consultants to ensure NED fees and payments are competitive, appropriate and in line with the market. Refer section 14.4 for more details on independent remuneration consultancy received in FY21.
The maximum aggregate fee pool of $1,500,000 was approved by shareholders at the AGM on 20 October 2020.
The following fee policy for the Board and Committees took effect from 1 July 2020:
NED TYPE1BOARD
$NRESGC
$ARC
$Chair 288,400 30,000 30,000
Member 113,300 10,000 10,000
1 All fee amounts are inclusive of compulsory superannuation obligations.
BAPCOR / AnnuAl RePORt 2021
75

DIRECTORS’ REPORT continued
Fees paid to NEDs in FY21 are set out in the following table. Fees are paid in cash and NEDs were not granted options or share rights. NEDs are not entitled to any payment on retirement or resignation from the Board. Directors may also be reimbursed for expenses properly incurred by the director in connection with the affairs of Bapcor including travel and other expenses whilst attending to company affairs.
NED FINANCIAL YEAR BOARD FEES4 COMMITTEE FEES SUPERANNUATION TOTALM Haseltine1 2021 157,753 24,083 17,134 198,970
2020 98,636 17,411 11,425 127,472
T Ryan 2021 103,709 18,307 11,592 133,608
2020 98,640 26,118 12,282 137,040
J Macdonald 2021 103,263 36,456 13,273 152,992
2020 98,640 26,118 12,282 137,040
M. Powell2 2021 83,038 13,086 9,132 105,256
J. Todd2 2021 83,899 6,183 8,558 98,640
A Harrison3 2021 178,229 – 15,019 193,248
2020 249,013 – 21,003 270,016
1 M Haseltine was appointed Chair 17 February 2021.
2 M Powell and J Todd were appointed as an Independent, Non-Executive Director 1 September 2020.
3 A Harrison retired on 16 February 2021.
4 For two months in FY20 during the initial Covid crisis NED’s took a 30% voluntary fee reduction.
Shares held by NEDsThe Board has a guideline that non-executive directors increase their holding of shares in the company so that within three years of appointment it reaches a minimum level of one times the base board fees. The current shareholding interests of the NEDs is set out in section 14.7.5.
76

14.7.4 Share-based compensationThe following table outlines the details of the LTI grants outstanding for each Executive KMP participant and other movements in options and performance rights in the year. As options will not vest if the performance conditions are not satisfied, the minimum value of the option yet to vest is nil. LTI grants made to FY17 were on the basis of fair value calculated in accordance with Bapcor’s accounting policy. From FY18 the weighted average face value of shares is used to calculate the number of LTI Performance Rights granted. There were no amounts paid and there were no amounts outstanding or due from KMP in relation to the grant of options during the year.
KMPGRANT DATE
QUANTITY GRANTED VEST DATE
EXERCISE PRICE
$
VALUE AT GRANT
DATE $1
QUANTITY VESTED
QUANTITY FORFEITED/
LAPSEDQUANTITY
REMAININGVESTED
%
FORFEITED/ LAPSED
%
VALUE EXPENSED THIS YEAR
$2
D Abotomey 4/12/17 201,002 30/06/20 – 834,972 99,496 101,506 – 50% 50% –
29/10/18 170,886 30/06/21 – 863,829 – 170,886 – – 287,943
1/11/19 209,560 30/06/22 – 1,230,117 – – 209,560 – – 410,039
20/10/20 201,008 30/06/23 – 1,341,728 – – 201,008 – – 447,243
N Meehan 10/09/20 71,428 30/06/23 – 390,354 – – 71,428 – – 130,118
C Magill 4/12/17 45,981 30/06/20 – 191,008 22,760 23,221 – 49% 51% –
26/09/18 41,698 30/06/21 – 247,478 – – 41,698 – – 82,493
6/09/19 50,976 30/06/22 – 285,211 – – 50,976 – – 95,070
10/09/20 48,894 30/06/23 – 267,206 – – 48,894 – – 89,069
M Storey 26/09/18 27,610 30/06/21 – 163,865 – – 27,610 – – 54,622
6/09/19 37,678 30/06/22 – 210,808 – – 37,678 – – 70,269
10/09/20 36,140 30/06/23 – 197,505 – – 36,140 – – 65,835
M Cooper 4/12/17 39,412 30/06/20 – 163,719 19,509 19,903 – 50% 50% –
26/09/18 33,507 30/06/21 – 198,865 – – 33,507 – – 66,288
6/09/19 43,440 30/06/22 – 243,047 – – 43,440 – – 81,016
10/09/20 41,666 30/06/23 – 227,705 – – 41,666 – – 75,902
A Laing 4/12/17 28,152 30/06/20 – 116,945 13,935 14,217 – 49% 51% –
26/09/18 25,689 30/06/21 – 152,465 – – 25,689 – – 50,822
6/09/19 33,688 30/06/22 – 188,484 – – 33,688 – – 62,828
10/09/20 32,312 30/06/23 – 176,585 – – 32,312 – – 58,862
T Cockayne 6/09/19 39,894 30/06/22 – 223,207 – – 39,894 – – 74,402
10/09/20 38,266 30/06/23 – 209,124 – – 38,266 – – 69,708
S Drummy 6/09/19 38,564 30/06/22 – 215,766 – – 38,564 – – 71,922
10/09/20 36,990 30/06/23 – 202,150 – – 36,990 – – 67,383
J Nicol 6/09/19 36,348 30/06/22 – 203,367 – – 36,348 – – 67,789
10/09/20 34,864 30/06/23 – 190,532 – – 34,864 – – 63,511
Total 1,645,653 8,936,042 155,700 158,847 1,331,106 2,543,134
1 Value at grant date has been determined as the fair value of performance rights at grant.
2 Value expensed this year is the current years expense calculated by allocating the fair value (determined at grant), of the performance rights, over the relevant vesting period as required by the Accounting Standards.
BAPCOR / AnnuAl RePORt 2021
77

DIRECTORS’ REPORT continued
14.7.5 Equity instrument disclosures relating to KMPThe numbers of ordinary voting shares in the company held during the financial year by each director and other KMP, including their personally related parties, are set out below.
BALANCE AT START OF THE
YEAR
RECEIVED DURING THE
YEAR
DIVIDEND REINVESTMENT
PLANPURCHASE OF SHARES
SALE OF SHARES
RESIGNED / CEASED TO
BE KMP
BALANCE AT THE END OF
THE YEAR
2021
Directors
M Haseltine 39,849 – – 10,000 – – 49,849
T Ryan 40,256 – – – – – 40,256
J Macdonald 23,363 – – 6,650 – – 30,013
D Abotomey 1,431,154 – – 10,000 – – 1,441,154
J Todd – – – 20,000 – – 20,000
M Powell – – – 13,000 13,000
A Harrison 85,389 – – – – (85,389) –
Other KMP
G Fox 232,997 – – – – (232,997) –
N Meehan – – – 14,000 – – 14,000
C Magill 448,719 – – – – – 448,719
M Cooper 27,518 19,509 – – – – 47,027
A Laing – – – 3,000 – – 3,000
T Cockayne – – – 14,184 – – 14,184
S Drummy – – – 5,750 – – 5,750
J Nicol – – – 690 – – 690
Total 2,329,245 19,509 – 97,274 – (318,386) 2,127,642
2020
Directors
A Harrison 68,570 – – 16,819 – – 85,389
T Ryan 34,730 – 980 4,546 – – 40,256
M Haseltine 32,125 – 905 6,819 – – 39,849
J Macdonald 10,254 – 290 12,819 – – 23,363
D Abotomey 1,641,323 88,802 – 6,819 (305,790) – 1,431,154
Other KMP
G Fox 390,553 18,143 – 6,819 (182,518) – 232,997
C Magill 631,424 10,476 – 6,819 (200,000) – 448,719
M Cooper 62,306 9,845 – 9,173 (53,806) – 27,518
Total 2,871,285 127,266 2,175 70,633 (742,114) – 2,329,245
78

14.7.6 Total shares under option or right to KMP
DATE GRANTED VEST DATE EXPIRY DATE EXERCISE PRICE OF RIGHTS QUANTITYPerformance rights plans
26/09/18 30/06/21 26/09/33 $0.00 128,504
29/10/18 30/06/21 29/10/33 $0.00 170,886
6/09/19 30/06/22 6/09/34 $0.00 280,588
1/11/19 30/06/22 6/09/34 $0.00 209,560
10/09/20 30/06/23 6/09/35 $0.00 340,560
20/10/20 30/06/23 6/09/35 $0.00 201,008
Total shares under option or right 1,331,106
14.7.7 Loans and other transactions with KMPNo loans were made to any KMP in FY21 and there are no outstanding loans to any KMP. No other transactions occurred in FY21 with any KMP.
15. MATTERS SUBSEQUENT TO THE END OF THE FINANCIAL YEARApart from the dividend declared and the ongoing uncertainty around Covid related restrictions, no other matter or circumstance has arisen since 30 June 2021 that has significantly affected, or may significantly affect the consolidated entity’s operations, the results of those operations, or the consolidated entity’s state of affairs in future financial years.
16. ENVIRONMENTAL REGULATIONThe consolidated entity is not subject to any significant environmental regulation under Australian Commonwealth or State law.
17. INDEMNITY AND INSURANCE OF OFFICERSThe company has indemnified the directors and executives of the company for costs incurred, in their capacity as a director or executive, for which they may be held personally liable, except where there is a lack of good faith.
During the financial year, the company paid a premium in respect of a contract to insure the directors and executives of the company against a liability to the extent permitted by the Corporations Act 2001. The contract of insurance prohibits disclosure of the nature of the liability and the amount of the premium.
18. PROCEEDINGS ON BEHALF OF THE COMPANYNo person has applied to the Court under section 237 of the Corporations Act 2001 for leave to bring proceedings on behalf of the company, or to intervene in any proceedings to which the company is a party for the purpose of taking responsibility on behalf of the company for all or part of those proceedings.
19. AUDITORPricewaterhouseCoopers continues in office in accordance with section 327 of the Corporations Act 2001.
20. NON-AUDIT SERVICESThere were no non-audit services provided during the financial year by the auditor.
BAPCOR / AnnuAl RePORt 2021
79

DIRECTORS’ REPORT continued
21. AUDITOR’S INDEPENDENCE DECLARATIONA copy of the auditor’s independence declaration as required under section 307C of the Corporations Act 2001 is set out on page 81 of the Directors’ Report.
22. INDEMNITY OF AUDITORThe company has agreed to indemnify their auditors, PricewaterhouseCoopers, to the extent permitted by law, against any claim by a third party arising from the company’s breach of their agreement with PricewaterhouseCoopers. The indemnity stipulates that the company will meet the full amount of any such liabilities including a reasonable amount of legal costs.
23. ROUNDING OF AMOUNTSThe company is of a kind referred to in Corporations Instrument 2016/191, issued by the Australian Securities and Investments Commission, relating to ‘rounding-off’. Amounts in this report have been rounded off in accordance with that Corporations Instrument to the nearest thousand dollars, or in certain cases, the nearest dollar.
This report is made in accordance with a resolution of directors, pursuant to section 298(2)(a) of the Corporations Act 2001.
On behalf of the directors
Margaret Haseltine Darryl Abotomey Chair Chief Executive Officer and Managing Director
18 August 2021 Melbourne
80

PricewaterhouseCoopers, ABN 52 780 433 757 2 Riverside Quay, SOUTHBANK VIC 3006, GPO Box 1331, MELBOURNE VIC 3001 T: 61 3 8603 1000, F: 61 3 8603 1999, www.pwc.com.au
Liability limited by a scheme approved under Professional Standards Legislation.
Auditor’s Independence Declaration As lead auditor for the audit of Bapcor Limited for the year ended 30 June 2021, I declare that to the best of my knowledge and belief, there have been:
(a) no contraventions of the auditor independence requirements of the Corporations Act 2001 in relation to the audit; and
(b) no contraventions of any applicable code of professional conduct in relation to the audit.
This declaration is in respect of Bapcor Limited and the entities it controlled during the period.
Jason Perry
Melbourne Partner PricewaterhouseCoopers
18 August 2021
AUDITOR’S INDEPENDENCE DECLARATION
BAPCOR / AnnuAl RePORt 2021
81
BAPCOR / AnnuAl RePORt 2021
81
FINANCIAL REPORT
GENERAL INFORMATIONThe financial statements cover Bapcor Limited as a consolidated entity consisting of Bapcor Limited and the entities it controlled at the end of, or during, the year. The financial statements are presented in Australian dollars, which is Bapcor Limited’s functional and presentation currency.
Bapcor Limited is a listed public company limited by shares, incorporated and domiciled in Australia. Its registered office and principal place of business is:
127-139 Link Road, Melbourne Airport VIC 3045 Australia
A description of the nature of the consolidated entity’s operations and its principal activities are included in the Directors’ Report, which is not part of the financial statements.
The financial statements were authorised for issue, in accordance with a resolution of directors, on 18 August 2021. The directors have the power to amend and reissue the financial statements.
CONTENTSConsolidated statement of comprehensive income 83Consolidated statement of financial position 84Consolidated statement of changes in equity 85Consolidated statement of cash flows 86Notes to the consolidated financial statements 87Directors’ declaration 135Independent auditor’s report 136Shareholder Information 142Corporate directory 145
82

CONSOLIDATED STATEMENT OF COMPREHENSIVE INCOMEFOR THE YEAR ENDED 30 JUNE 2021
CONSOLIDATED
NOTE2021
$’0002020
$’000
Revenue
4 1,761,673 1,462,747
Share of profits of associates 13 102 –
Other income 5 2,388 3,222
Expenses
Impairment of investments 13 (4,379) –
Cost of sales (949,283) (782,473)
Employee expenses (373,084) (321,565)
Advertising (36,974) (30,885)
Freight (26,364) (21,762)
IT and communications (20,615) (18,393)
Motor vehicles (11,435) (12,001)
Other expenses (70,080) (67,701)
Depreciation and amortisation expense 6 (85,380) (80,052)
Finance costs 6 (15,153) (19,765)
Profit before income tax expense 171,416 111,372
Income tax expense 7 (52,857) (32,655)
Profit after income tax expense for the year 118,559 78,717
Other comprehensive income
Items that may be reclassified to profit or loss
Foreign currency translation (944) (4,640)
Changes in the fair value of cash flow hedges 4,389 (3,216)
Other comprehensive income for the year, net of tax 3,445 (7,856)
Total comprehensive income for the year 122,004 70,861
Profit for the year is attributable to:
Non-controlling interest (206) (455)
Owners of Bapcor Limited 22 118,765 79,172
118,559 78,717
Total comprehensive income for the year is attributable to:
Non-controlling interest (407) (421)
Owners of Bapcor Limited 122,411 71,282
122,004 70,861
CENTS CENTS
Basic earnings per share 25 34.99 26.97
Diluted earnings per share 25 34.86 26.85
The above consolidated statement of comprehensive income should be read in conjunction with the accompanying notes
BAPCOR / AnnuAl RePORt 2021
83

CONSOLIDATED STATEMENT OF FINANCIAL POSITIONAS AT 30 JUNE 2021
CONSOLIDATED
NOTE2021
$’0002020
$’000
Assets
Current assets
Cash and cash equivalents 39,598 126,300
Trade and other receivables 8 193,094 163,993
Inventories 9 447,059 363,049
Derivative financial instruments 18 2,732 131
Other assets 297 297
Total current assets 682,780 653,770
Non-current assets
Right-of-use assets 10 197,983 158,871
Property, plant and equipment 11 99,988 75,179
Intangibles 12 763,884 757,437
Investments accounted for using the equity method 13 8,102 –
Deferred tax 7 36,430 34,710
Total non-current assets 1,106,387 1,026,197
Total assets 1,789,167 1,679,967
Liabilities
Current liabilities
Trade and other payables 14 243,160 222,204
Provisions 15 45,011 41,871
Lease liabilities 17 64,117 58,672
Derivative financial instruments 18 1,007 4,652
Income tax 10,375 2,030
Total current liabilities 363,670 329,429
Non-current liabilities
Provisions 15 15,858 16,271
Borrowings 16 204,231 229,072
Lease liabilities 17 162,213 123,136
Total non-current liabilities 382,302 368,479
Total liabilities 745,972 697,908
Net assets 1,043,195 982,059
Equity
Issued capital 20 867,972 869,418
Reserves 21 8,412 1,397
Retained profits 22 165,406 109,432
Equity attributable to the owners of Bapcor Limited 1,041,790 980,247
Non-controlling interest 23 1,405 1,812
Total equity 1,043,195 982,059
The above consolidated statement of financial position should be read in conjunction with the accompanying notes
84

CONSOLIDATED STATEMENT OF CHANGES IN EQUITYFOR THE YEAR ENDED 30 JUNE 2021
CONSOLIDATEDCONTRIBUTED
EQUITY OTHER RESERVESRETAINED EARNINGS
NON-CONTROLLING
INTERESTS TOTAL EQUITY$’000 $’000 $’000 $’000 $’000 $’000
Balance at 1 July 2019 631,697 (8,161) 7,308 79,954 2,233 713,031
Profit/(loss) after income tax expense for the year – – – 79,172 (455) 78,717
Other comprehensive income for the year, net of tax
– – (7,890) – 34 (7,856)
Total comprehensive income for the year – – (7,890) 79,172 (421) 70,861
Transactions with owners in their capacity as owners:
Contributions of equity, net of transaction costs (note 20)
246,955 – – – – 246,955
Share-based payments (note 21) – – 1,979 – – 1,979
Treasury shares (note 20) – (1,073) – – – (1,073)
Dividends paid (note 24) – – – (49,694) – (49,694)
Balance at 30 June 2020 878,652 (9,234) 1,397 109,432 1,812 982,059
CONSOLIDATEDCONTRIBUTED
EQUITY OTHER RESERVESRETAINED EARNINGS
NON-CONTROLLING
INTERESTS TOTAL EQUITY$’000 $’000 $’000 $’000 $’000 $’000
Balance at 1 July 2020 878,652 (9,234) 1,397 109,432 1,812 982,059
Profit/(loss) after income tax expense for the year – – – 118,765 (206) 118,559
Other comprehensive income for the year, net of tax
– – 3,646 – (201) 3,445
Total comprehensive income for the year – – 3,646 118,765 (407) 122,004
Transactions with owners in their capacity as owners:
Share-based payments (note 21) – – 3,369 – – 3,369
Treasury shares (note 20) – (1,446) – – – (1,446)
Dividends paid (note 24) – – – (62,791) – (62,791)
Balance at 30 June 2021 878,652 (10,680) 8,412 165,406 1,405 1,043,195
The above consolidated statement of changes in equity should be read in conjunction with the accompanying notes
BAPCOR / AnnuAl RePORt 2021
85

CONSOLIDATED STATEMENT OF CASH FLOWSFOR THE YEAR ENDED 30 JUNE 2021
CONSOLIDATED
NOTE2021
$’0002020
$’000
Cash flows from operating activities
Receipts from customers (inclusive of GST) 1,912,040 1,616,318
Payments to suppliers and employees (inclusive of GST) (1,704,279) (1,364,672)
Net cash converted 207,761 251,646
Payments for new store initial inventory purchases (16,048) (2,023)
Payments relating to restructuring activities (433) (449)
Borrowing costs (7,775) (11,607)
Transaction costs relating to acquisition of business (606) (1,827)
Income taxes paid (47,037) (35,487)
Net cash from operating activities 26 135,862 200,253
Cash flows from investing activities
Payment for purchase of business, net of cash and cash equivalents (2,662) (55,697)
Payment for deferred settlements (1,000) (16,911)
Payments for investment in associates (12,282) –
Payments for property, plant and equipment 11 (43,034) (30,528)
Payments for intangibles 12 (12,010) (8,020)
Proceeds from disposal of property, plant and equipment 395 1,334
Net cash used in investing activities (70,593) (109,822)
Cash flows from financing activities
Proceeds from issue of shares 20 – 236,147
Share issue transaction costs 20 – (4,623)
Purchase of treasury shares 20 (1,446) (1,073)
Net repayments of borrowings (25,500) (152,200)
Dividends paid 24 (62,791) (35,650)
Repayment of lease liabilities (61,104) (54,552)
Net cash used in financing activities (150,841) (11,951)
Net increase/(decrease) in cash and cash equivalents (85,572) 78,480
Cash and cash equivalents at the beginning of the financial year 126,300 47,610
Effects of exchange rate changes on cash and cash equivalents (1,130) 210
Cash and cash equivalents at the end of the financial year 39,598 126,300
The above consolidated statement of cash flows should be read in conjunction with the accompanying notes
86
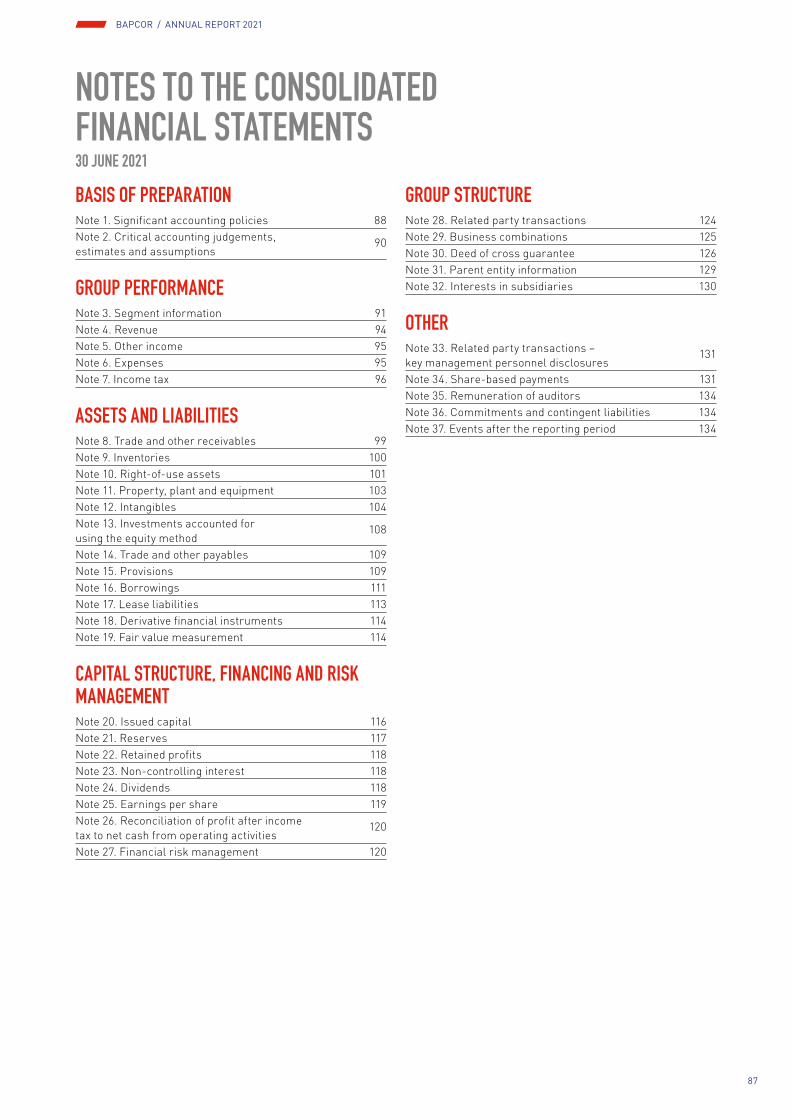
NOTES TO THE CONSOLIDATED FINANCIAL STATEMENTS30 JUNE 2021
BASIS OF PREPARATIONNote 1. Significant accounting policies 88Note 2. Critical accounting judgements, estimates and assumptions
90
GROUP PERFORMANCENote 3. Segment information 91Note 4. Revenue 94Note 5. Other income 95Note 6. Expenses 95Note 7. Income tax 96
ASSETS AND LIABILITIESNote 8. Trade and other receivables 99Note 9. Inventories 100Note 10. Right-of-use assets 101Note 11. Property, plant and equipment 103Note 12. Intangibles 104Note 13. Investments accounted for using the equity method
108
Note 14. Trade and other payables 109Note 15. Provisions 109Note 16. Borrowings 111Note 17. Lease liabilities 113Note 18. Derivative financial instruments 114Note 19. Fair value measurement 114
CAPITAL STRUCTURE, FINANCING AND RISK MANAGEMENTNote 20. Issued capital 116Note 21. Reserves 117Note 22. Retained profits 118Note 23. Non-controlling interest 118Note 24. Dividends 118Note 25. Earnings per share 119Note 26. Reconciliation of profit after income tax to net cash from operating activities
120
Note 27. Financial risk management 120
GROUP STRUCTURENote 28. Related party transactions 124Note 29. Business combinations 125Note 30. Deed of cross guarantee 126Note 31. Parent entity information 129Note 32. Interests in subsidiaries 130
OTHERNote 33. Related party transactions – key management personnel disclosures
131
Note 34. Share-based payments 131Note 35. Remuneration of auditors 134Note 36. Commitments and contingent liabilities 134Note 37. Events after the reporting period 134
BAPCOR / AnnuAl RePORt 2021
87

NOTES TO THE CONSOLIDATED FINANCIAL STATEMENTS continued
NOTE 1. SIGNIFICANT ACCOUNTING POLICIESThe principal accounting policies adopted in the preparation of the financial statements are set out either in the respective notes or below. These policies have been consistently applied to all the years presented, unless otherwise stated.
New or amended Accounting Standards and Interpretations adoptedThe consolidated entity has adopted all of the new or amended Accounting Standards and Interpretations issued by the Australian Accounting Standards Board (‘AASB’) that are mandatory for the current reporting period.
Any new or amended Accounting Standards or Interpretations that are not yet mandatory have not been early adopted.
Reclassifications in prior yearThe financial statements contain some reclassifications of prior year disclosures to ensure comparability with the current year.
Basis of preparationThese general-purpose financial statements have been prepared in accordance with Australian Accounting Standards and Interpretations issued by the AASB and the Corporations Act 2001, as appropriate for for-profit oriented entities. These financial statements also comply with International Financial Reporting Standards (‘IFRS’) as issued by the International Accounting Standards Board (‘IASB’).
Historical cost conventionThe financial statements have been prepared under the historical cost convention, except for, where applicable, the revaluation of financial assets and liabilities at fair value through profit or loss, financial assets at fair value through other comprehensive income and derivative financial instruments.
Critical accounting estimatesThe preparation of the financial statements requires the use of certain critical accounting estimates. It also requires management to exercise its judgement in the process of applying the consolidated entity’s accounting policies. The areas involving a higher degree of judgement or complexity, or areas where assumptions and estimates are significant to the financial statements, are disclosed in note 2.
Parent entity informationIn accordance with the Corporations Act 2001, these financial statements present the results of the consolidated entity only. Supplementary information about the parent entity is disclosed in note 31.
Principles of consolidationThe consolidated financial statements incorporate the assets and liabilities of all subsidiaries of Bapcor Limited (‘company’ or ‘parent entity’) as at 30 June 2021 and the results of all subsidiaries for the year then ended. Bapcor Limited and its subsidiaries together are referred to in these financial statements as the ‘consolidated entity’.
Subsidiaries are all those entities over which the consolidated entity has control. The consolidated entity controls an entity when the consolidated entity is exposed to, or has rights to, variable returns from its involvement with the entity and has the ability to affect those returns through its power to direct the activities of the entity. Subsidiaries are fully consolidated from the date on which control is transferred to the consolidated entity. They are de-consolidated from the date that control ceases.
Intercompany transactions, balances and unrealised gains on transactions between entities in the consolidated entity are eliminated on consolidation. Unrealised losses are also eliminated unless the transaction provides evidence of the impairment of the asset transferred. Accounting policies of subsidiaries have been changed where necessary to ensure consistency with the policies adopted by the consolidated entity.
The acquisition of subsidiaries is accounted for using the acquisition method of accounting. A change in ownership interest, without the loss of control, is accounted for as an equity transaction, where the difference between the consideration transferred and the book value of the share of the non-controlling interest acquired is recognised directly in equity attributable to the parent.
8888
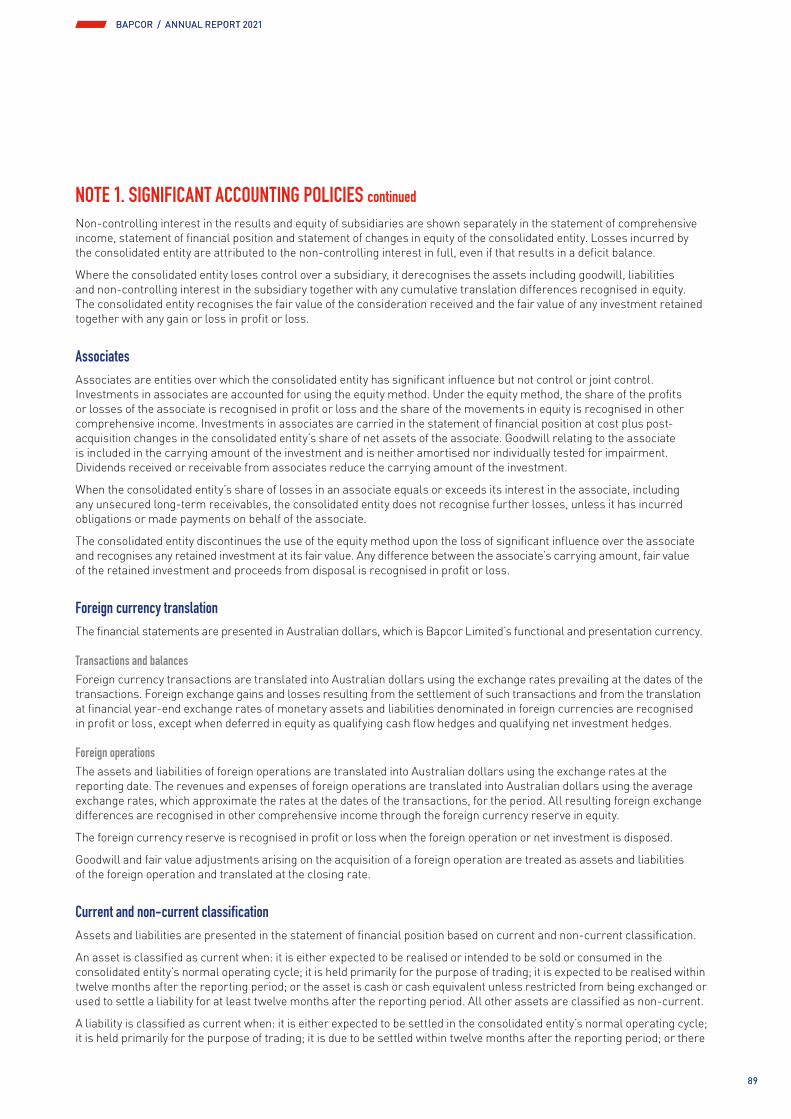
Non-controlling interest in the results and equity of subsidiaries are shown separately in the statement of comprehensive income, statement of financial position and statement of changes in equity of the consolidated entity. Losses incurred by the consolidated entity are attributed to the non-controlling interest in full, even if that results in a deficit balance.
Where the consolidated entity loses control over a subsidiary, it derecognises the assets including goodwill, liabilities and non-controlling interest in the subsidiary together with any cumulative translation differences recognised in equity. The consolidated entity recognises the fair value of the consideration received and the fair value of any investment retained together with any gain or loss in profit or loss.
AssociatesAssociates are entities over which the consolidated entity has significant influence but not control or joint control. Investments in associates are accounted for using the equity method. Under the equity method, the share of the profits or losses of the associate is recognised in profit or loss and the share of the movements in equity is recognised in other comprehensive income. Investments in associates are carried in the statement of financial position at cost plus post-acquisition changes in the consolidated entity’s share of net assets of the associate. Goodwill relating to the associate is included in the carrying amount of the investment and is neither amortised nor individually tested for impairment. Dividends received or receivable from associates reduce the carrying amount of the investment.
When the consolidated entity’s share of losses in an associate equals or exceeds its interest in the associate, including any unsecured long-term receivables, the consolidated entity does not recognise further losses, unless it has incurred obligations or made payments on behalf of the associate.
The consolidated entity discontinues the use of the equity method upon the loss of significant influence over the associate and recognises any retained investment at its fair value. Any difference between the associate’s carrying amount, fair value of the retained investment and proceeds from disposal is recognised in profit or loss.
Foreign currency translationThe financial statements are presented in Australian dollars, which is Bapcor Limited’s functional and presentation currency.
Transactions and balancesForeign currency transactions are translated into Australian dollars using the exchange rates prevailing at the dates of the transactions. Foreign exchange gains and losses resulting from the settlement of such transactions and from the translation at financial year-end exchange rates of monetary assets and liabilities denominated in foreign currencies are recognised in profit or loss, except when deferred in equity as qualifying cash flow hedges and qualifying net investment hedges.
Foreign operationsThe assets and liabilities of foreign operations are translated into Australian dollars using the exchange rates at the reporting date. The revenues and expenses of foreign operations are translated into Australian dollars using the average exchange rates, which approximate the rates at the dates of the transactions, for the period. All resulting foreign exchange differences are recognised in other comprehensive income through the foreign currency reserve in equity.
The foreign currency reserve is recognised in profit or loss when the foreign operation or net investment is disposed.
Goodwill and fair value adjustments arising on the acquisition of a foreign operation are treated as assets and liabilities of the foreign operation and translated at the closing rate.
Current and non-current classificationAssets and liabilities are presented in the statement of financial position based on current and non-current classification.
An asset is classified as current when: it is either expected to be realised or intended to be sold or consumed in the consolidated entity’s normal operating cycle; it is held primarily for the purpose of trading; it is expected to be realised within twelve months after the reporting period; or the asset is cash or cash equivalent unless restricted from being exchanged or used to settle a liability for at least twelve months after the reporting period. All other assets are classified as non-current.
A liability is classified as current when: it is either expected to be settled in the consolidated entity’s normal operating cycle; it is held primarily for the purpose of trading; it is due to be settled within twelve months after the reporting period; or there
NOTE 1. SIGNIFICANT ACCOUNTING POLICIES continued
BAPCOR / AnnuAl RePORt 2021
89
BAPCOR / AnnuAl RePORt 2021
89
NOTES TO THE CONSOLIDATED FINANCIAL STATEMENTS continued
is no unconditional right to defer the settlement of the liability for at least twelve months after the reporting period. All other liabilities are classified as non-current.
Deferred tax assets and liabilities are always classified as non-current.
Impairment of assetsGoodwill and other intangible assets that have an indefinite useful life are not subject to amortisation and are tested annually for impairment, or more frequently if events or changes in circumstances indicate that they might be impaired. Other assets are reviewed for impairment whenever events or changes in circumstances indicate that the carrying amount may not be recoverable. An impairment loss is recognised for the amount by which the asset’s carrying amount exceeds its recoverable amount.
Recoverable amount is the higher of an asset’s fair value less costs of disposal and value-in-use. The value-in-use is the present value of the estimated future cash flows relating to the asset using a pre-tax discount rate specific to the asset or cash-generating unit to which the asset belongs. Assets that do not have independent cash flows are grouped together to form a cash-generating unit.
Goods and Services Tax (‘GST’) and other similar taxesRevenues, expenses and assets are recognised net of the amount of associated GST, unless the GST incurred is not recoverable from the tax authority. In this case it is recognised as part of the cost of the acquisition of the asset or as part of the expense.
Receivables and payables are stated inclusive of the amount of GST receivable or payable. The net amount of GST recoverable from, or payable to, the tax authority is included in other receivables or other payables in the statement of financial position.
Cash flows are presented on a gross basis. The GST components of cash flows arising from investing or financing activities which are recoverable from, or payable to the tax authority, are presented as operating cash flows.
Rounding of amountsThe company is of a kind referred to in Corporations Instrument 2016/191, issued by the Australian Securities and Investments Commission, relating to ‘rounding-off’. Amounts in this report have been rounded off in accordance with that Corporations Instrument to the nearest thousand dollars, or in certain cases, the nearest dollar.
NOTE 2. CRITICAL ACCOUNTING JUDGEMENTS, ESTIMATES AND ASSUMPTIONSThe preparation of the financial statements requires management to make judgements, estimates and assumptions that affect the reported amounts in the financial statements. Management continually evaluates its judgements and estimates in relation to assets, liabilities, contingent liabilities, revenue and expenses. Management bases its judgements, estimates and assumptions on historical experience and on other various factors, including expectations of future events, management believes to be reasonable under the circumstances. The resulting accounting judgements and estimates will seldom equal the related actual results. The judgements, estimates and assumptions that have a significant risk of causing a material adjustment to the carrying amounts of assets and liabilities within the next financial year are included in the following notes to the consolidated financial statements:
› Note 8 – Trade and other receivables
› Note 9 – Inventories
› Note 11 – Property, plant and equipment
› Note 12 – Intangibles
› Note 15 – Provisions
› Note 17 – Lease liabilities
› Note 29 – Business combinations
› Note 34 – Share-based payments
NOTE 1. SIGNIFICANT ACCOUNTING POLICIES continued
9090

NOTE 3. SEGMENT INFORMATIONDescription of segmentsThe consolidated entity has identified four operating segments based on the internal reports that are reviewed and used by the Managing Director and CEO (who is identified as the Chief Operating Decision Maker (‘CODM’)) and is supported by the other members of the Executive KMP and the Board of Directors where required in assessing performance and in determining the allocation of resources including capital allocations.
The operating results of the consolidated entity are currently reviewed by the CODM and decisions are based on four operating segments which also represent the four reporting segments, as follows:
BAPCOR TRADE Represents the trade focused automotive aftermarket parts distribution to independent and chain mechanic workshops. Includes the operations of Burson Auto Parts and Precision Automotive Equipment.
BAPCOR NZ Includes the operations of Brake & Transmission, Autolign and HCB Technologies.
BAPCOR SPECIALIST WHOLESALE
Includes the specialised wholesale distribution areas of the organisation that focus on a specific automotive area. Includes the operations of AAD, Baxters, Bearing Wholesalers, MTQ Engine Systems, Roadsafe, Diesel Distributors, Federal Batteries, JAS Oceania, Premier Auto Trade, Toperformance, Commercial Truck Parts group comprising Truckline and WANO.
BAPCOR RETAIL Represents the retail focused accessory stores that are positioned as the first choice destination for both the everyday consumer and automotive enthusiast as well as the service areas of Bapcor. Includes the operations of Autobarn, Autopro, Sprint Auto Parts, Midas and ABS.
The consolidated entity’s Thailand based operations have been included in the Unallocated/Head Office supporting segment as they are considered immaterial in nature for the financial periods.
Segment revenueIntersegment transactions are carried out at arm’s length and eliminated on consolidation. The revenue from external parties reported to the CODM is measured in a manner consistent with that in the statement of comprehensive income.
Segment EBITDASegment performance is assessed on the basis of segment EBITDA. Segment EBITDA comprises expenses which are incurred in the normal trading activity of the segments and excludes the impact of depreciation, amortisation, interest and other items which are determined to be outside of the control of the respective segments.
BAPCOR / AnnuAl RePORt 2021
91
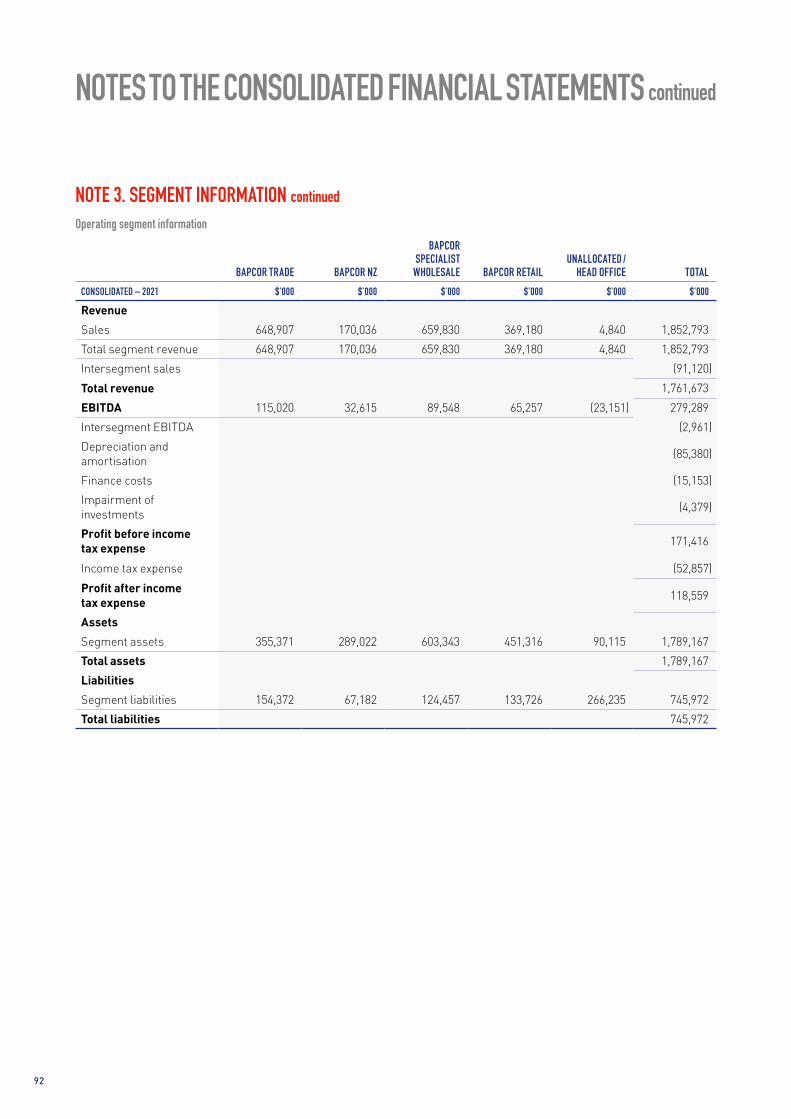
NOTES TO THE CONSOLIDATED FINANCIAL STATEMENTS continued
Operating segment information
BAPCOR TRADE BAPCOR NZ
BAPCOR SPECIALIST
WHOLESALE BAPCOR RETAILUNALLOCATED /
HEAD OFFICE TOTALCONSOLIDATED – 2021 $’000 $’000 $’000 $’000 $’000 $’000
Revenue
Sales 648,907 170,036 659,830 369,180 4,840 1,852,793
Total segment revenue 648,907 170,036 659,830 369,180 4,840 1,852,793
Intersegment sales (91,120)
Total revenue 1,761,673
EBITDA 115,020 32,615 89,548 65,257 (23,151) 279,289
Intersegment EBITDA (2,961)
Depreciation and amortisation
(85,380)
Finance costs (15,153)
Impairment of investments
(4,379)
Profit before income tax expense 171,416
Income tax expense (52,857)
Profit after income tax expense 118,559
Assets
Segment assets 355,371 289,022 603,343 451,316 90,115 1,789,167
Total assets 1,789,167
Liabilities
Segment liabilities 154,372 67,182 124,457 133,726 266,235 745,972
Total liabilities 745,972
NOTE 3. SEGMENT INFORMATION continued
9292

BAPCOR TRADE BAPCOR NZ
BAPCOR SPECIALIST
WHOLESALE BAPCOR RETAILUNALLOCATED /
HEAD OFFICE TOTALCONSOLIDATED – 2020 $’000 $’000 $’000 $’000 $’000 $’000
Revenue
Sales 561,651 156,317 520,359 292,685 4,185 1,535,197
Total segment revenue 561,651 156,317 520,359 292,685 4,185 1,535,197
Intersegment sales (72,450)
Total revenue 1,462,747
EBITDA* 96,678 26,903 62,694 54,327 (28,311) 212,291
Intersegment EBITDA (1,102)
Depreciation and amortisation
(80,052)
Finance costs (19,765)
Profit before income tax expense 111,372
Income tax expense (32,655)
Profit after income tax expense 78,717
Assets
Segment assets 336,050 268,829 557,039 378,845 139,204 1,679,967
Total assets 1,679,967
Liabilities
Segment liabilities* 147,398 63,358 118,598 133,801 234,753 697,908
Total liabilities 697,908
* EBITDA split between Bapcor Retail and Unallocated / Head Office adjusted as incorrectly presented in the previous year. Acquisition costs have also been aggregated into Unallocated / Head Office’s EBITDA to be consistent with current year’s disclosure approach.
Geographical informationGEOGRAPHICAL NON-CURRENT ASSETS
2021 $’000
2020 $’000
Australia 882,648 800,310
New Zealand 186,290 189,908
Other 1,019 1,269
1,069,957 991,487
The geographical non-current assets above are exclusive of, where applicable, financial instruments, deferred tax assets and balances such as intercompany and investments that are eliminated on consolidation.
Significant accounting policiesOperating segments are presented using the ‘management approach’, where the information presented is on the same basis as the internal reports provided to the Chief Operating Decision Makers (‘CODM’). The CODM is responsible for the allocation of resources to operating segments and assessing their performance.
NOTE 3. SEGMENT INFORMATION continued
BAPCOR / AnnuAl RePORt 2021
93
BAPCOR / AnnuAl RePORt 2021
93

NOTES TO THE CONSOLIDATED FINANCIAL STATEMENTS continued
NOTE 4. REVENUECONSOLIDATED
2021$’000
2020$’000
Revenue from contracts with customers 1,761,673 1,462,747
Disaggregation of revenueThe disaggregation of revenue from contracts with customers is as follows:
CONSOLIDATED2021
$’0002020
$’000
Geographical regions
Australia 1,677,917 1,374,695
New Zealand 170,036 156,317
Thailand 4,840 4,185
Intersegment sales (91,120) (72,450)
1,761,673 1,462,747
Timing of revenue recognition
Goods transferred at a point in time 1,821,794 1,506,734
Services transferred over time 30,999 28,463
Intersegment sales (91,120) (72,450)
1,761,673 1,462,747
Significant accounting policiesRevenue is recognised at an amount that reflects the consideration to which the consolidated entity is expected to be entitled in exchange for transferring goods or services to a customer. For each contract with a customer, the consolidated entity: identifies the contract with a customer; identifies the performance obligations in the contract; determines the transaction price which takes into account estimates of variable consideration and the time value of money; allocates the transaction price to the separate performance obligations on the basis of the relative stand-alone selling price of each distinct good or service to be delivered; and recognises revenue when or as each performance obligation is satisfied in a manner that depicts the transfer to the customer of the goods or services promised.
Sale of goodsRevenue from the sale of goods is recognised at the point in time when the customer obtains control of the goods, which is generally at the time of delivery.
Rendering of services – franchise and service feesRevenue from services are recognised over time as the services are rendered in line with the customer contract terms.
9494

NOTE 5. OTHER INCOMECONSOLIDATED
2021$’000
2020$’000
Rental income 2,388 3,222
Rental income relates to rental recoveries from franchise locations.
NOTE 6. EXPENSESCONSOLIDATED
2021$’000
2020$’000
Profit before income tax includes the following specific expenses:
Depreciation and amortisation expense
Plant and equipment 11,933 10,818
Motor vehicles 5,604 5,126
Properties right-of-use assets 58,852 57,116
Motor vehicles right-of-use assets 1,395 1,431
Amortisation 7,641 3,640
Make good provision (45) 1,921
85,380 80,052
Finance costs
Interest and finance charges paid/payable 7,889 13,441
Interest and finance charges paid/payable on lease liabilities 7,264 6,324
15,153 19,765
Superannuation expense
Defined contribution superannuation expense 23,281 20,502
BAPCOR / AnnuAl RePORt 2021
95

NOTES TO THE CONSOLIDATED FINANCIAL STATEMENTS continued
NOTE 7. INCOME TAXCONSOLIDATED
2021$’000
2020$’000
Income tax expense
Current tax on profits for the year 53,036 36,685
Deferred tax expense (380) (2,929)
Adjustment recognised for prior periods 201 (1,101)
Total income tax expense 52,857 32,655
Deferred tax included in income tax expense comprises:
Increase in deferred tax assets (10,035) (6,045)
Increase in deferred tax liabilities 9,655 3,116
Deferred tax expense (380) (2,929)
Numerical reconciliation of income tax expense and tax at the statutory rate
Profit before income tax expense 171,416 111,372
Tax at the statutory tax rate of 30% 51,425 33,412
Tax effect amounts which are not deductible/(taxable) in calculating taxable income:
Impairment of investment 1,314 –
Adjustment recognised for prior periods 201 (1,101)
Difference in overseas tax rates (470) (347)
Other 387 691
Income tax expense 52,857 32,655
9696

CONSOLIDATED2021
$’0002020
$’000
Deferred tax asset
Deferred tax asset comprises temporary differences attributable to:
Amounts recognised in profit or loss:
Property, plant and equipment 4,944 1,155
Employee benefits 13,336 12,765
Trade and other receivables 2,654 3,144
Inventory 18,186 18,584
Lease liabilities 67,047 53,908
Other 8,416 10,974
114,583 100,530
Amounts recognised in equity:
Transaction costs on share issue 856 1,366
Cash flow hedge – 1,351
Share-based payment 1,931 1,425
2,787 4,142
Deferred tax asset 117,370 104,672
Set-off deferred tax liabilities pursuant to set-off provisions (80,940) (69,962)
Net deferred tax asset 36,430 34,710
Movements:
Opening balance 104,672 42,131
Credited to profit or loss 10,035 6,045
Credited/(charged) to equity (509) 536
Additions through business combinations 1,037 7,836
Charged to other comprehensive income (845) 920
Adjustment recognised for prior periods 2,980 –
Adjustment for change in accounting policy – 47,204
Closing balance 117,370 104,672
NOTE 7. INCOME TAX continued
BAPCOR / AnnuAl RePORt 2021
97
BAPCOR / AnnuAl RePORt 2021
97

NOTES TO THE CONSOLIDATED FINANCIAL STATEMENTS continued
CONSOLIDATED2021
$’0002020
$’000
Deferred tax liability
Deferred tax liability comprises temporary differences attributable to:
Amounts recognised in profit or loss:
Customer contracts 4,678 5,206
Trademarks 17,111 17,514
Right-of-use assets 58,559 47,242
80,348 69,962
Amounts recognised in equity:
Cash flow hedge 592 –
Deferred tax liability 80,940 69,962
Set-off deferred tax liabilities pursuant to set-off provisions (80,940) (69,962)
Net deferred tax liability – –
Movements:
Opening balance 69,962 23,707
Charged/(credited) to profit or loss 9,655 3,116
Charged/(credited) to equity 592 (156)
Additions through business combinations 731 –
Adjustment on change in accounting policy – 43,295
Closing balance 80,940 69,962
Significant accounting policiesThe income tax expense or benefit for the period is the tax payable on that period’s taxable income based on the applicable income tax rate for each jurisdiction, adjusted by the changes in deferred tax assets and liabilities attributable to temporary differences, unused tax losses and the adjustment recognised for prior periods, where applicable.
Deferred tax assets and liabilities are recognised for temporary differences at the tax rates expected to be applied when the assets are recovered or liabilities are settled, based on those tax rates that are enacted or substantively enacted, except for:
› When the deferred income tax asset or liability arises from the initial recognition of goodwill or an asset or liability in a transaction that is not a business combination and that, at the time of the transaction, affects neither the accounting nor taxable profits; or
› When the taxable temporary difference is associated with interests in subsidiaries, associates or joint ventures, and the timing of the reversal can be controlled and it is probable that the temporary difference will not reverse in the foreseeable future.
Deferred tax assets are recognised for deductible temporary differences and unused tax losses only if it is probable that future taxable amounts will be available to utilise those temporary differences and losses.
The carrying amount of recognised and unrecognised deferred tax assets are reviewed at each reporting date. Deferred tax assets recognised are reduced to the extent that it is no longer probable that future taxable profits will be available for the carrying amount to be recovered. Previously unrecognised deferred tax assets are recognised to the extent that it is probable that there are future taxable profits available to recover the asset.
Deferred tax assets and liabilities are offset only where there is a legally enforceable right to offset current tax assets against current tax liabilities and deferred tax assets against deferred tax liabilities; and they relate to the same taxable authority on either the same taxable entity or different taxable entities which intend to settle simultaneously.
NOTE 7. INCOME TAX continued
9898

NOTE 8. TRADE AND OTHER RECEIVABLESCONSOLIDATED
2021$’000
2020$’000
Current assets
Trade receivables 166,844 147,925
Less: Allowance for credit notes (1,526) (1,623)
Less: Allowance for expected credit losses (trade receivables) (7,068) (8,522)
158,250 137,780
Customer loans 313 562
Less: Allowance for expected credit losses (customer loans) (313) (562)
– –
Other receivables 23,158 17,436
Prepayments 11,686 8,777
34,844 26,213
193,094 163,993
Trade receivables are non-interest bearing and repayment terms vary by business unit. The total allowance for expected credit losses is $7,381,000 (2020: $9,084,000). This includes specifically identified provisions of $6,706,000 (2020: $7,562,000) and an estimated credit loss provision of $675,000 (2020: $1,522,000).
Customer loans relate to loans with franchisees. Loans with repayment terms of less than twelve months are classified as current. Of the total customer loans balance, $94,000 (2020: $343,000) are non-interest bearing. $219,000 (2020: $219,000) of loans have a weighted average annual interest rate of 10.5% (2020: 10.5%).
Other receivables relate to rebates and other non-trading receivables which are non-interest bearing. Receivables with repayment terms of less than twelve months are classified as current. These receivables are all neither past due nor impaired.
The ageing of the net trade receivables and loans above are as follows:
CONSOLIDATED2021
$’0002020
$’000
Current and not due 106,953 98,709
31 – 60 days 38,745 32,246
61 – 90 days 7,311 5,202
91+ days 5,241 1,623
158,250 137,780
Movements in the allowance for expected credit losses of trade receivables and customer loans are as follows:
CONSOLIDATED2021
$’0002020
$’000
Opening balance 9,084 6,235
Net additional provisions recognised/(released) (767) 3,882
Additions through business combinations – 1,080
Amounts utilised for debt write-off (934) (2,102)
Foreign currency translation (2) (11)
Closing balance 7,381 9,084
Bapcor recognised a net gain of $767,000 (2020: loss of $3,882,000) in respect of impaired receivables during the financial year. This recognised gain was due to the release of a Covid related provision taken up in FY20 of $907,000.
BAPCOR / AnnuAl RePORt 2021
99

NOTES TO THE CONSOLIDATED FINANCIAL STATEMENTS continued
Significant accounting policiesTrade receivables are initially recognised at fair value and subsequently measured at amortised cost using the effective interest method, less any allowance for specific debtors and general expected credit losses. Trade receivables are generally due for settlement within 30 to 60 days.
Other receivables are recognised at amortised cost, less any allowance for specific debtors and general expected credit losses.
ImpairmentThe impairment methodology applied depends on whether there has been a significant increase in credit risk, whereby specific provision will be applied to trade and other receivables not expected to be collected and expected credit losses associated with the trade and other receivables.
In assessing the expected credit losses, the consolidated entity first considers any specific debtors that have objective evidence that the consolidated entity will not be able to collect all amounts due according to the original terms of the receivables, taking into consideration the indicators of significant financial difficulties of the debtor, probability that the debtor will enter bankruptcy and default or delinquency in payments. The consolidated entity then applies the simplified approach to measuring expected credit losses, which uses a lifetime expected loss allowance, on the balance of receivables. To measure the expected credit losses, trade receivables have been grouped based on aging.
Critical accounting judgements, estimates and assumptionsThe allowance for expected credit losses assessment requires a degree of estimation and judgement. It is assessed by taking into account the ageing of receivables, historical collection rates and specific knowledge of the individual debtor’s financial position.
NOTE 9. INVENTORIESCONSOLIDATED
2021$’000
2020$’000
Current assets
Stock in transit – at cost 31,649 23,863
Stock on hand – at cost 469,202 395,039
Less: Provision for slow moving inventory (53,792) (55,853)
415,410 339,186
447,059 363,049
Total stock on hand and in transit has increased by $81.9M since 30 June 2020, of which new greenfield stores, business acquisitions, unrealised profit in stock and foreign currency translation account for $14.7M of the movement. The remaining $67.2M relates to investment in new and existing ranges as well as holdings to minimise supplier, manufacturer and shipping delays as discussed in the ‘Operating and financial review’ section of the Directors’ Report.
NOTE 8. TRADE AND OTHER RECEIVABLES continued
100100

Movements in provision for slow moving inventoryCONSOLIDATED
2021$’000
2020$’000
Opening balance (55,853) (43,647)
Additional provisions recognised against profit (223) (4,857)
Additions through business combinations (413) (9,333)
Inventory written off against provision 2,678 1,844
Foreign currency translation 19 140
Closing balance (53,792) (55,853)
Significant accounting policiesStock in transit is stated at the lower of cost and net realisable value. Cost comprises of purchase and delivery costs, net of rebates and discounts received or receivable.
Stock on hand is stated at the lower of cost and net realisable value. Cost comprises of purchase and delivery costs, net of rebates and discounts received or receivable.
Net realisable value is the estimated selling price in the ordinary course of business less the estimated costs of completion and the estimated costs necessary to make the sale.
Critical accounting judgements, estimates and assumptionsThe provision for slow moving inventory assessment requires a degree of estimation and judgement. The level of the provision is assessed by taking into account the recent sales experience, the ageing of inventories and other factors that affect inventory obsolescence.
NOTE 10. RIGHT-OF-USE ASSETSCONSOLIDATED
2021$’000
2020$’000
Non-current assets
Properties – right-of-use 309,545 211,454
Less: Accumulated depreciation (112,852) (55,055)
196,693 156,399
Motor vehicles – right-of-use 4,290 3,786
Less: Accumulated depreciation (3,000) (1,314)
1,290 2,472
197,983 158,871
The large increase in property right-of-use assets in FY21 was primarily due to $45.1M recognised on commencement of the Tullamarine, Victoria distribution centre lease. This was offset by an increase to the property lease liability by the same amount. Refer to note 17.
NOTE 9. INVENTORIES continued
BAPCOR / AnnuAl RePORt 2021
101
BAPCOR / AnnuAl RePORt 2021
101

NOTES TO THE CONSOLIDATED FINANCIAL STATEMENTS continued
ReconciliationsReconciliations of the written down values at the beginning and end of the current and previous financial year are set out below:
PROPERTY MOTOR VEHICLES TOTALCONSOLIDATED $’000 $’000 $’000
Balance at 1 July 2019 142,250 2,814 145,064
Additions 24,731 557 25,288
Additions through business combinations 16,150 1,042 17,192
Disposals (2,945) (13) (2,958)
Remeasurements** 32,982 (474) 32,508
Foreign currency translation (534) (23) (557)
Depreciation expense (52,027) (1,431) (53,458)
Accelerated depreciation expense*** (5,089) – (5,089)
Balance at 30 June 2020 155,518 2,472 157,990
Make good asset transfer* 881 – 881
Adjusted balance at 1 July 2020 156,399 2,472 158,871
Additions 70,425 – 70,425
Additions through business combinations 2,441 – 2,441
Disposals (5,275) (7) (5,282)
Remeasurements** 31,442 219 31,661
Foreign currency translation 113 1 114
Depreciation expense (53,468) (1,395) (54,863)
Accelerated depreciation expense*** (5,384) – (5,384)
Balance at 30 June 2021 196,693 1,290 197,983
* The make-good asset balance has been reclassified to reflect current disclosure methodology as allowed under AASB 16 Leases. The prior year has been adjusted to allow comparability between periods.
** Remeasurements occur when options to renew that were previously excluded are subsequently included or when rentals change due to non-fixed rent reviews, causing an adjustment to both right-of-use asset and lease liability balances.
*** Accelerated depreciation relates to the Victorian DC Consolidation project and is based on the estimated exit dates of each site.
Significant accounting policiesA right-of-use asset is recognised at the commencement date of a lease. The right-of-use asset is measured at cost, which comprises the initial amount of the lease liability, adjusted for, as applicable, any lease payments made at or before the commencement date net of any lease incentives received, any initial direct costs incurred, and, except where included in the cost of inventories, an estimate of costs expected to be incurred for dismantling and removing the underlying asset, and restoring the site or asset.
Right-of-use assets are depreciated on a straight-line basis over the unexpired period of the lease or the estimated useful life of the asset, whichever is the shorter. Where the consolidated entity expects to obtain ownership of the leased asset at the end of the lease term, the depreciation is over its estimated useful life. Right-of use assets are subject to impairment or adjusted for any remeasurement of lease liabilities.
The consolidated entity has elected not to recognise a right-of-use asset and corresponding lease liability for short-term leases with terms of twelve months or less and leases of low-value assets. Lease payments on these assets are expensed to profit or loss as incurred.
NOTE 10. RIGHT-OF-USE ASSETS continued
102102

NOTE 11. PROPERTY, PLANT AND EQUIPMENTCONSOLIDATED
2021$’000
2020$’000
Non-current assets
Plant and equipment – at cost 134,710 99,960
Less: Accumulated depreciation (55,980) (45,114)
78,730 54,846
Motor vehicles – at cost 41,296 36,963
Less: Accumulated depreciation (20,038) (16,630)
21,258 20,333
99,988 75,179
The amount of work in progress included in plant and equipment is $28,795,000 (2020: $11,663,000) and relates to projects that are not yet completed and therefore are not being depreciated. $26,797,000 of this balance relates to the Victorian DC consolidation project (2020: $11,286,000).
ReconciliationsReconciliations of the written down values at the beginning and end of the current and previous financial year are set out below:
PLANT AND EQUIPMENT
MOTOR VEHICLES TOTAL
CONSOLIDATED $’000 $’000 $’000
Balance at 1 July 2019 41,350 19,395 60,745
Adjustment for change in accounting policy – (691) (691)
Restated balance at 1 July 2019 41,350 18,704 60,054
Additions 22,621 7,907 30,528
Additions through business combinations 1,204 130 1,334
Disposals (436) (824) (1,260)
Transfers in/(out) 988 (419) 569
Foreign currency translation (63) (39) (102)
Accelerated depreciation expense* (983) – (983)
Depreciation expense (9,835) (5,126) (14,961)
Balance at 30 June 2020 54,846 20,333 75,179
Additions 35,822 7,212 43,034
Additions through business combinations 203 – 203
Disposals (79) (669) (748)
Foreign currency translation (129) (14) (143)
Accelerated depreciation expense* (1,311) – (1,311)
Depreciation expense (10,622) (5,604) (16,226)
Balance at 30 June 2021 78,730 21,258 99,988
* Accelerated depreciation relates to the Victorian DC Consolidation project and is based on the estimated exit dates of each site.
BAPCOR / AnnuAl RePORt 2021
103

NOTES TO THE CONSOLIDATED FINANCIAL STATEMENTS continued
Significant accounting policiesPlant and equipment is stated at historical cost less accumulated depreciation and impairment. Historical cost includes expenditure that is directly attributable to the acquisition of the items.
Subsequent costs are included in the asset’s carrying amount or recognised as a separate asset, as appropriate, only when it is probable that future economic benefits associated with the item will flow to the consolidated entity and the cost of the item can be measured reliably. The carrying amount of any component accounted for as a separate asset is derecognised when replaced. All other repairs and maintenance are charged to profit or loss during the reporting period in which they are incurred.
Depreciation is calculated on a straight-line basis to write off the net cost of each item of plant and equipment over their expected useful lives as follows:
Plant and equipment 2-15 years
Motor vehicles 3-7 years
The residual values, useful lives and depreciation methods are reviewed, and adjusted if appropriate, at each reporting date.
An item of plant and equipment is derecognised upon disposal or when there is no future economic benefit to the consolidated entity. Gains and losses between the carrying amount and the disposal proceeds are taken to profit or loss. Any revaluation surplus reserve relating to the item disposed of is transferred directly to retained profits.
Critical accounting judgements, estimates and assumptionsThe consolidated entity determines the estimated useful lives and related depreciation charges for its property, plant and equipment assets. The useful lives could change significantly as a result of technical innovations or some other relevant event. The depreciation will increase where the useful lives are less than previously estimated lives, or technically obsolete or non-strategic assets that have been abandoned or sold will be written off or written down.
NOTE 12. INTANGIBLESCONSOLIDATED
2021$’000
2020$’000
Non-current assets
Goodwill 667,879 665,712
Trademarks 59,087 59,069
Less: Accumulated amortisation (1,346) –
57,741 59,069
Customer contracts 25,884 25,872
Less: Accumulated amortisation (10,248) (8,450)
15,636 17,422
Software 36,041 24,150
Less: Accumulated amortisation (13,413) (8,916)
22,628 15,234
763,884 757,437
The amount of work in progress included in software is $5,951,000 (2020: $12,679,000) and relates to projects that are not yet completed and therefore are not being amortised.
NOTE 11. PROPERTY, PLANT AND EQUIPMENT continued
104104
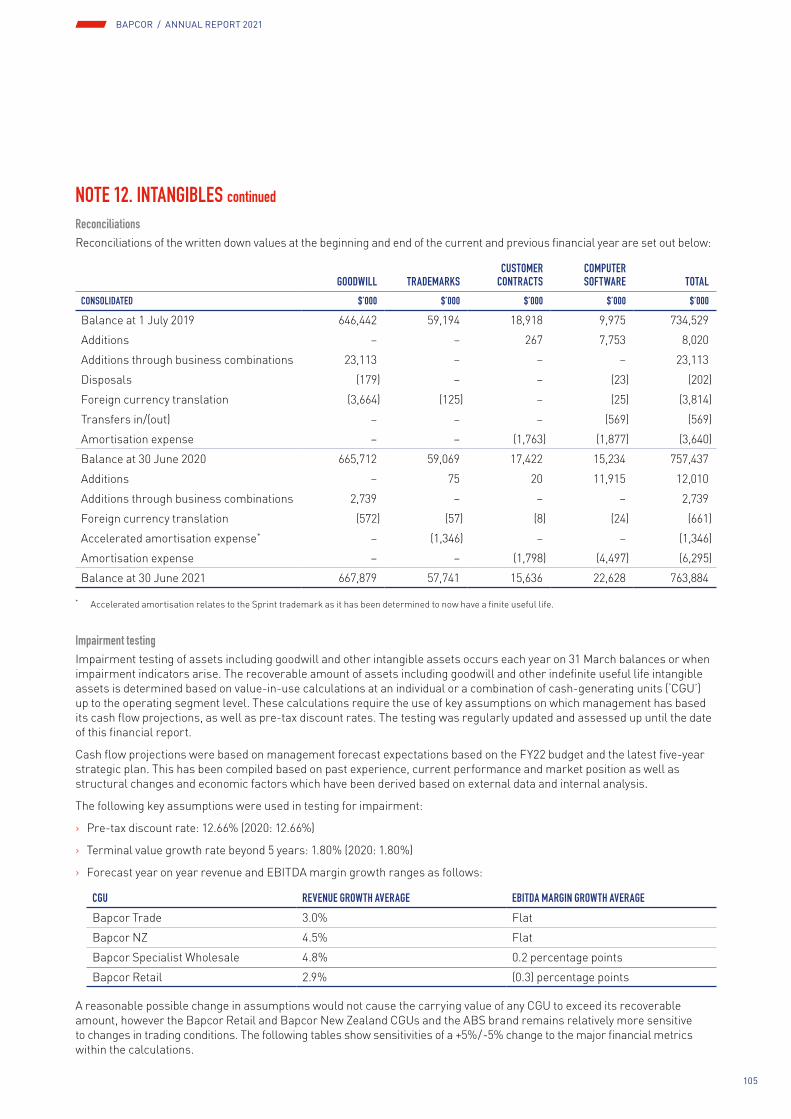
ReconciliationsReconciliations of the written down values at the beginning and end of the current and previous financial year are set out below:
GOODWILL TRADEMARKSCUSTOMER
CONTRACTSCOMPUTER SOFTWARE TOTAL
CONSOLIDATED $’000 $’000 $’000 $’000 $’000
Balance at 1 July 2019 646,442 59,194 18,918 9,975 734,529
Additions – – 267 7,753 8,020
Additions through business combinations 23,113 – – – 23,113
Disposals (179) – – (23) (202)
Foreign currency translation (3,664) (125) – (25) (3,814)
Transfers in/(out) – – – (569) (569)
Amortisation expense – – (1,763) (1,877) (3,640)
Balance at 30 June 2020 665,712 59,069 17,422 15,234 757,437
Additions – 75 20 11,915 12,010
Additions through business combinations 2,739 – – – 2,739
Foreign currency translation (572) (57) (8) (24) (661)
Accelerated amortisation expense* – (1,346) – – (1,346)
Amortisation expense – – (1,798) (4,497) (6,295)
Balance at 30 June 2021 667,879 57,741 15,636 22,628 763,884
* Accelerated amortisation relates to the Sprint trademark as it has been determined to now have a finite useful life.
Impairment testingImpairment testing of assets including goodwill and other intangible assets occurs each year on 31 March balances or when impairment indicators arise. The recoverable amount of assets including goodwill and other indefinite useful life intangible assets is determined based on value-in-use calculations at an individual or a combination of cash-generating units (‘CGU’) up to the operating segment level. These calculations require the use of key assumptions on which management has based its cash flow projections, as well as pre-tax discount rates. The testing was regularly updated and assessed up until the date of this financial report.
Cash flow projections were based on management forecast expectations based on the FY22 budget and the latest five-year strategic plan. This has been compiled based on past experience, current performance and market position as well as structural changes and economic factors which have been derived based on external data and internal analysis.
The following key assumptions were used in testing for impairment:
› Pre-tax discount rate: 12.66% (2020: 12.66%)
› Terminal value growth rate beyond 5 years: 1.80% (2020: 1.80%)
› Forecast year on year revenue and EBITDA margin growth ranges as follows:
CGU REVENUE GROWTH AVERAGE EBITDA MARGIN GROWTH AVERAGEBapcor Trade 3.0% Flat
Bapcor NZ 4.5% Flat
Bapcor Specialist Wholesale 4.8% 0.2 percentage points
Bapcor Retail 2.9% (0.3) percentage points
A reasonable possible change in assumptions would not cause the carrying value of any CGU to exceed its recoverable amount, however the Bapcor Retail and Bapcor New Zealand CGUs and the ABS brand remains relatively more sensitive to changes in trading conditions. The following tables show sensitivities of a +5% / -5% change to the major financial metrics within the calculations.
NOTE 12. INTANGIBLES continued
BAPCOR / AnnuAl RePORt 2021
105

NOTES TO THE CONSOLIDATED FINANCIAL STATEMENTS continued
Bapcor Retail CGUThe recoverable amount of the Retail CGU is estimated to exceed its carrying amount at 30 June 2021 by $21.9M.
FINANCIAL METRIC + 5% CHANGE -5 % CHANGEDiscount rate Decrease headroom to $2.9M Increase headroom to $43.4M
Revenue growth (average) Increase headroom to $24.2M Decrease headroom to $19.6M
EBITDA margin (average) Increase headroom to $39.7M Decrease headroom to $4.1M
Terminal growth rate Increase headroom to $24.1M Decrease headroom to $19.7M
As per the above table, none of these sensitivities individually cause impairment for the Bapcor Retail CGU.
Bapcor New Zealand CGU (NZD)The recoverable amount of the Bapcor New Zealand CGU is estimated to exceed its carrying amount at 30 June 2021 by $25.1M.
FINANCIAL METRIC + 5% CHANGE -5 % CHANGEDiscount rate Decrease headroom to $10.0M Increase headroom to $42.1M
Revenue growth (average) Increase headroom to $28.2M Decrease headroom to $21.9M
EBITDA margin (average) Increase headroom to $39.8M Decrease headroom to $10.4M
Terminal growth rate Increase headroom to $27.0M Decrease headroom to $23.2M
As per the above table, none of these sensitivities individually cause impairment for the Bapcor New Zealand CGU.
ABS brandThe recoverable amount of the ABS brand is estimated to approximate its carrying amount at 30 June 2021.
FINANCIAL METRIC + 5% CHANGE -5 % CHANGEDiscount rate Impairment of $0.2M No material change
Revenue growth (average) No material change Impairment of $0.1M
Terminal growth rate No material change No material change
As per the above table, the sensitivities could cause impairment of up to $0.2M for the ABS brand.
There have been no further indicators of impairment after the impairment testing date of 31 March 2021 up until the date of this report.
NOTE 12. INTANGIBLES continued
106106

The balances of goodwill and other intangible assets excluding computer software allocated to each segment as at 30 June were:
CONSOLIDATED2021
$’0002020
$’000
Goodwill:
Trade 111,806 111,274
Bapcor NZ 149,361 149,857
Specialist Wholesale 270,094 268,348
Retail 136,618 136,233
667,879 665,712
CONSOLIDATED2021
$’0002020
$’000
Other intangible assets:
Bapcor NZ 5,330 5,448
Specialist Wholesale 20,782 20,804
Retail 47,222 50,172
Unallocated 43 67
73,377 76,491
Significant accounting policiesIntangible assets acquired as part of a business combination, other than goodwill, are initially measured at their fair value at the date of the acquisition. Intangible assets acquired separately are initially recognised at cost. Indefinite life intangible assets are not amortised and are subsequently measured at cost less any impairment. Finite life intangible assets are subsequently measured at cost less amortisation and any impairment. The gains or losses recognised in profit or loss arising from the derecognition of intangible assets are measured as the difference between net disposal proceeds and the carrying amount of the intangible asset. The method and useful lives of finite life intangible assets are reviewed annually. Changes in the expected pattern of consumption or useful life are accounted for prospectively by changing the amortisation method or period.
GoodwillGoodwill arises on the acquisition of a business. Goodwill is not amortised. Instead, goodwill is tested annually for impairment, or more frequently if events or changes in circumstances indicate that it might be impaired, and is carried at cost less accumulated impairment losses. Impairment losses on goodwill are taken to profit or loss and are not subsequently reversed.
TradenamesTradenames (including brands) are recognised as intangible assets where a registered trademark is acquired with attributable value. They are valued using a relief from royalty method and are considered indefinite life intangibles and are not amortised unless there is an intention to discontinue their use in which it is amortised over the estimated remaining useful life.
Customer contractsCustomer contracts acquired in a business combination are amortised on a straight-line basis over the period of their expected benefit, being their finite life which is currently between 10 and 20 years.
NOTE 12. INTANGIBLES continued
BAPCOR / AnnuAl RePORt 2021
107
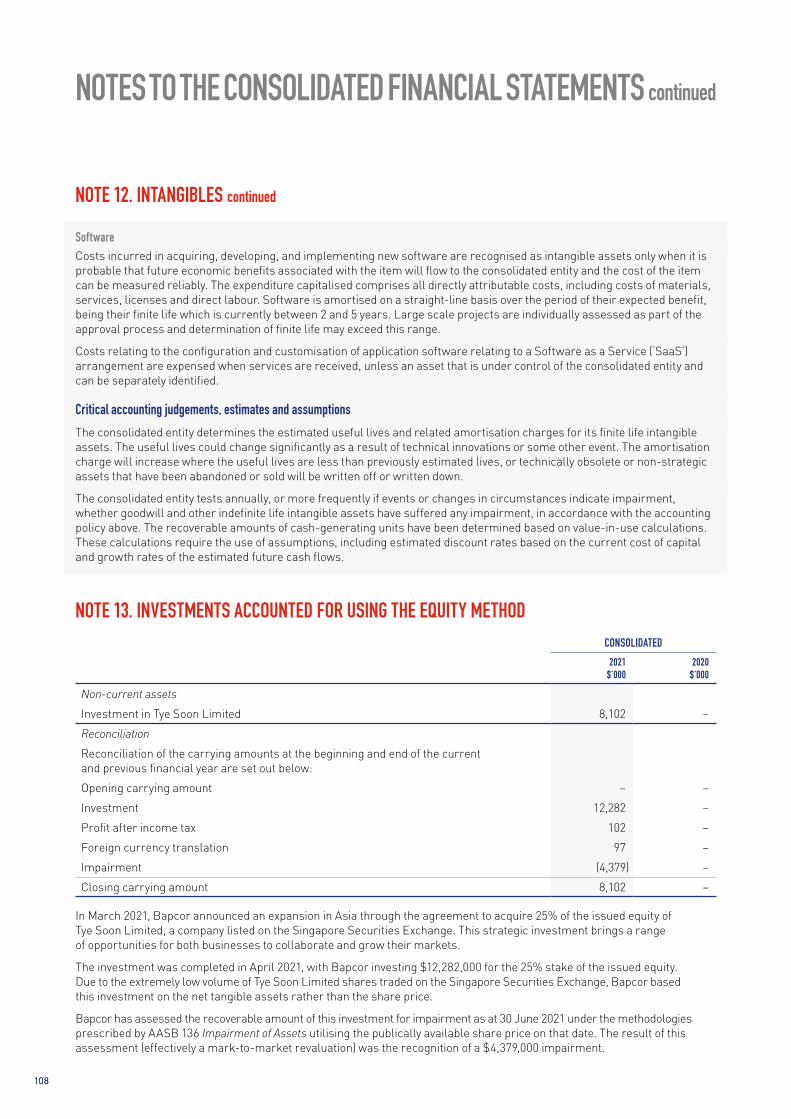
NOTES TO THE CONSOLIDATED FINANCIAL STATEMENTS continued
SoftwareCosts incurred in acquiring, developing, and implementing new software are recognised as intangible assets only when it is probable that future economic benefits associated with the item will flow to the consolidated entity and the cost of the item can be measured reliably. The expenditure capitalised comprises all directly attributable costs, including costs of materials, services, licenses and direct labour. Software is amortised on a straight-line basis over the period of their expected benefit, being their finite life which is currently between 2 and 5 years. Large scale projects are individually assessed as part of the approval process and determination of finite life may exceed this range.
Costs relating to the configuration and customisation of application software relating to a Software as a Service (‘SaaS’) arrangement are expensed when services are received, unless an asset that is under control of the consolidated entity and can be separately identified.
Critical accounting judgements, estimates and assumptionsThe consolidated entity determines the estimated useful lives and related amortisation charges for its finite life intangible assets. The useful lives could change significantly as a result of technical innovations or some other event. The amortisation charge will increase where the useful lives are less than previously estimated lives, or technically obsolete or non-strategic assets that have been abandoned or sold will be written off or written down.
The consolidated entity tests annually, or more frequently if events or changes in circumstances indicate impairment, whether goodwill and other indefinite life intangible assets have suffered any impairment, in accordance with the accounting policy above. The recoverable amounts of cash-generating units have been determined based on value-in-use calculations. These calculations require the use of assumptions, including estimated discount rates based on the current cost of capital and growth rates of the estimated future cash flows.
NOTE 13. INVESTMENTS ACCOUNTED FOR USING THE EQUITY METHODCONSOLIDATED
2021$’000
2020$’000
Non-current assets
Investment in Tye Soon Limited 8,102 –
Reconciliation
Reconciliation of the carrying amounts at the beginning and end of the current and previous financial year are set out below:
Opening carrying amount – –
Investment 12,282 –
Profit after income tax 102 –
Foreign currency translation 97 –
Impairment (4,379) –
Closing carrying amount 8,102 –
In March 2021, Bapcor announced an expansion in Asia through the agreement to acquire 25% of the issued equity of Tye Soon Limited, a company listed on the Singapore Securities Exchange. This strategic investment brings a range of opportunities for both businesses to collaborate and grow their markets.
The investment was completed in April 2021, with Bapcor investing $12,282,000 for the 25% stake of the issued equity. Due to the extremely low volume of Tye Soon Limited shares traded on the Singapore Securities Exchange, Bapcor based this investment on the net tangible assets rather than the share price.
Bapcor has assessed the recoverable amount of this investment for impairment as at 30 June 2021 under the methodologies prescribed by AASB 136 Impairment of Assets utilising the publically available share price on that date. The result of this assessment (effectively a mark-to-market revaluation) was the recognition of a $4,379,000 impairment.
NOTE 12. INTANGIBLES continued
108108

NOTE 14. TRADE AND OTHER PAYABLESCONSOLIDATED
2021$’000
2020$’000
Current liabilities
Trade payables 173,438 171,478
Accrued expenses 69,722 50,726
243,160 222,204
Refer to note 27 for further information on financial risk management.
Significant accounting policiesTrade payable and accrued expense amounts represent liabilities for goods and services provided to the consolidated entity prior to the end of the financial year and which are unpaid. Due to their short-term nature they are measured at amortised cost and are not discounted. The amounts are unsecured and are usually paid within 30 to 90 days of recognition.
NOTE 15. PROVISIONSCONSOLIDATED
2021$’000
2020$’000
Current liabilities
Employee benefits 36,717 34,896
Deferred settlements 2,046 969
Lease make good 2,630 2,017
Restructuring 3,618 3,989
45,011 41,871
Non-current liabilities
Employee benefits 4,253 3,306
Deferred settlements 882 1,500
Lease make good 10,723 11,465
15,858 16,271
60,869 58,142
Deferred settlementsThis provision represents the obligation to pay consideration following the acquisition of a business. It is measured at the present value of the estimated liability.
As at 30 June 2021, the following deferred settlements are provided for:
› AADi; nil provided (2020: $969,000)
› Commercial Truck Parts group of entities; currently provided at $1,500,000 (2020: $1,500,000)
› Adams Transport Equipment; currently provided at $1,428,000 (2020: nil)
Lease make good The provision represents the present value of the estimated costs to make good the premises leased by the consolidated entity at the end of the respective lease terms.
BAPCOR / AnnuAl RePORt 2021
109
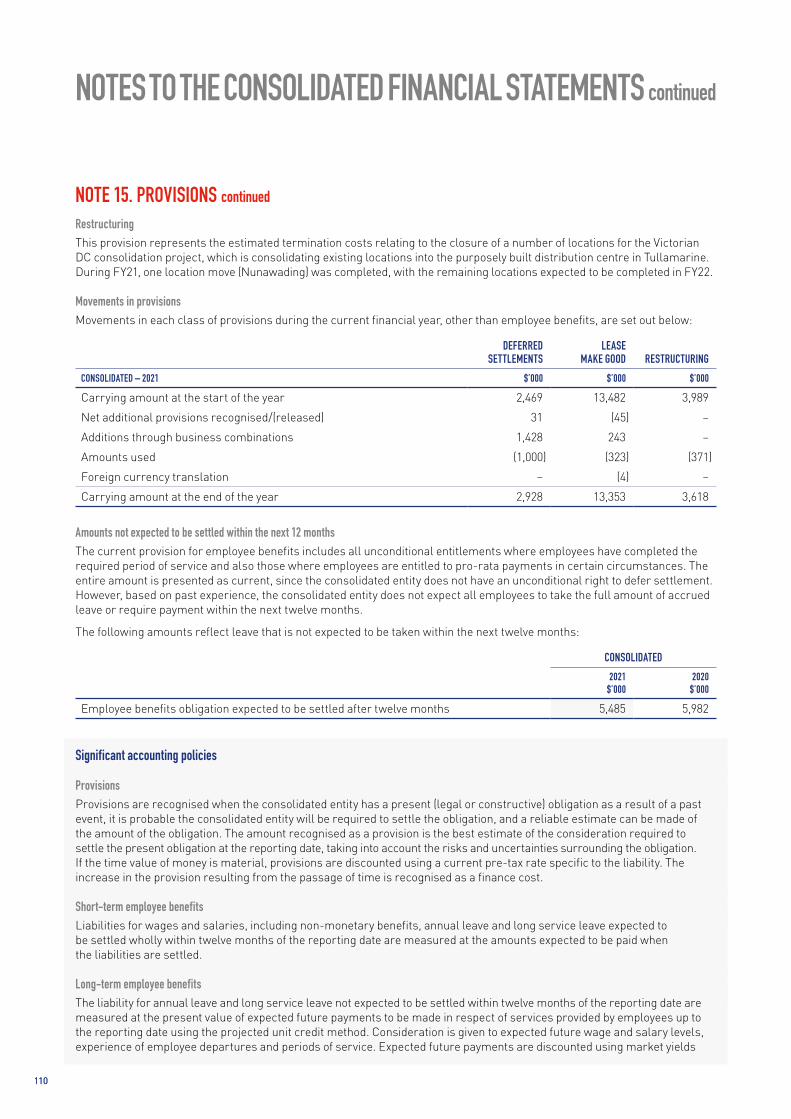
NOTES TO THE CONSOLIDATED FINANCIAL STATEMENTS continued
RestructuringThis provision represents the estimated termination costs relating to the closure of a number of locations for the Victorian DC consolidation project, which is consolidating existing locations into the purposely built distribution centre in Tullamarine. During FY21, one location move (Nunawading) was completed, with the remaining locations expected to be completed in FY22.
Movements in provisionsMovements in each class of provisions during the current financial year, other than employee benefits, are set out below:
DEFERRED SETTLEMENTS
LEASE MAKE GOOD RESTRUCTURING
CONSOLIDATED – 2021 $’000 $’000 $’000
Carrying amount at the start of the year 2,469 13,482 3,989
Net additional provisions recognised/(released) 31 (45) –
Additions through business combinations 1,428 243 –
Amounts used (1,000) (323) (371)
Foreign currency translation – (4) –
Carrying amount at the end of the year 2,928 13,353 3,618
Amounts not expected to be settled within the next 12 monthsThe current provision for employee benefits includes all unconditional entitlements where employees have completed the required period of service and also those where employees are entitled to pro-rata payments in certain circumstances. The entire amount is presented as current, since the consolidated entity does not have an unconditional right to defer settlement. However, based on past experience, the consolidated entity does not expect all employees to take the full amount of accrued leave or require payment within the next twelve months.
The following amounts reflect leave that is not expected to be taken within the next twelve months:
CONSOLIDATED2021
$’0002020
$’000
Employee benefits obligation expected to be settled after twelve months 5,485 5,982
Significant accounting policies
ProvisionsProvisions are recognised when the consolidated entity has a present (legal or constructive) obligation as a result of a past event, it is probable the consolidated entity will be required to settle the obligation, and a reliable estimate can be made of the amount of the obligation. The amount recognised as a provision is the best estimate of the consideration required to settle the present obligation at the reporting date, taking into account the risks and uncertainties surrounding the obligation. If the time value of money is material, provisions are discounted using a current pre-tax rate specific to the liability. The increase in the provision resulting from the passage of time is recognised as a finance cost.
Short-term employee benefitsLiabilities for wages and salaries, including non-monetary benefits, annual leave and long service leave expected to be settled wholly within twelve months of the reporting date are measured at the amounts expected to be paid when the liabilities are settled.
Long-term employee benefitsThe liability for annual leave and long service leave not expected to be settled within twelve months of the reporting date are measured at the present value of expected future payments to be made in respect of services provided by employees up to the reporting date using the projected unit credit method. Consideration is given to expected future wage and salary levels, experience of employee departures and periods of service. Expected future payments are discounted using market yields
NOTE 15. PROVISIONS continued
110110

at the reporting date on corporate bonds with terms to maturity and currency that match, as closely as possible, the estimated future cash outflows.
Critical accounting judgements, estimates and assumptionsThe deferred settlements liability is the difference between the total purchase consideration, usually on an acquisition of a business combination, and the amounts paid or settled up to the reporting date, discounted to net present value. The consolidated entity applies provisional accounting for any business combination. Any reassessment of the liability during the provisional period is adjusted for retrospectively as part of the fair value of consideration. Thereafter, at each reporting date, the deferred settlement liability is reassessed against revised estimates and any increase or decrease in the net present value of the liability will result in a corresponding gain or loss to profit or loss. The increase in the liability resulting from the passage of time is recognised as a finance cost.
NOTE 16. BORROWINGSCONSOLIDATED
2021$’000
2020$’000
Non-current liabilities
Secured bank loans 205,472 230,982
Less: unamortised transaction costs capitalised (1,241) (1,910)
204,231 229,072
Refer to note 27 for further information on financial risk management.
Bapcor has a $520M debt facility with ANZ, Westpac, MUFG Bank, HSBC and MetLife. The debt facility comprises funding in three, five and seven-year tranches commencing from June 2019 as follows:
› $200M three-year tranche, available for general corporate purposes;
› $150M five-year tranche, available for general corporate purposes;
› $100M seven-year tranche, available for general corporate purposes; and
› $70M three-year tranche, available for working capital purposes
The facility is secured by way of a fixed and floating charge over Bapcor’s assets. There were no changes to the debt covenants with the net leverage ratio required to be less than 3.0X and the fixed cover charge ratio required to be greater than 1.75X.
Financing arrangementsUnrestricted access was available at the reporting date to the following lines of credit:
CONSOLIDATED2021
$’0002020
$’000
Total facilities
Bank loans including overdraft* 517,500 517,500
Used at the reporting date
Bank loans including overdraft* 205,472 230,982
Unused at the reporting date
Bank loans including overdraft* 312,028 286,518
* Total facilities available at 30 June was $520M (2020: $520M). The amount used in the above table excludes $2.5M (2020: $2.5M) of facility which relates to bank guarantees under the working capital tranche.
NOTE 15. PROVISIONS continued
BAPCOR / AnnuAl RePORt 2021
111

NOTES TO THE CONSOLIDATED FINANCIAL STATEMENTS continued
Net debt reconciliationsCONSOLIDATED
2021$’000
2020$’000
Cash and cash equivalents 39,598 126,300
Lease liabilities (226,330) (181,808)
Borrowings excluding unamortised transaction costs capitalised (205,472) (230,982)
Net debt (392,204) (286,490)
Add: Lease liabilities 226,330 181,808
Add/(less): Net derivative financial instruments 1,725 (4,521)
Pro-forma net debt as per debt facility agreement (164,149) (109,203)
A reconciliation of statutory net debt at the beginning and end of the current and previous financial year is set out below:
CASH LEASE LIABILITIES BORROWINGS TOTALCONSOLIDATED $’000 $’000 $’000 $’000
Balance at 30 June 2019 47,610 (159,649) (382,960) (494,999)
Cash flows 78,480 54,552 152,200 285,232
Other 210 (76,711) (222) (76,723)
Balance at 30 June 2020 126,300 (181,808) (230,982) (286,490)
Cash flows (85,572) 61,104 25,500 1,032
Other (1,130) (105,626) 10 (106,746)
Balance at 30 June 2021 39,598 (226,330) (205,472) (392,204)
Significant accounting policiesLoans and borrowings are initially recognised at the fair value of the consideration received, net of transaction costs. They are subsequently measured at amortised cost using the effective interest method.
Where there is an unconditional right to defer settlement of the liability for at least twelve months after the reporting date, the loans or borrowings are classified as non-current.
Fees paid on the establishment of loan facilities are recognised as transaction costs of the loan to the extent that it is probable that some or all of the facility will be drawn down. In this case, the fee is deferred until the draw down occurs. To the extent there is no evidence that it is probable that some or all of the facility will be drawn down, the fee is amortised on a straight-line basis over the term of the facility.
NOTE 16. BORROWINGS continued
112112

NOTE 17. LEASE LIABILITIESCONSOLIDATED
2021$’000
2020$’000
Current liabilities
Lease liability – Properties 63,233 57,149
Lease liability – Motor vehicles 884 1,523
64,117 58,672
Non-current liabilities
Lease liability – Property 161,816 122,173
Lease liability – Motor vehicles 397 963
162,213 123,136
226,330 181,808
The large increase in property lease liabilities in FY21 was primarily due to $45.1M recognised on commencement of the Tullamarine, Victoria distribution centre lease. This was offset by an increase to the right-of-use assets by the same amount. Refer to note 10.
Refer to note 27 for further information on financial risk management.
Significant accounting policiesA lease liability is recognised at the commencement date of a lease. The lease liability is initially recognised at the present value of the lease payments to be made over the term of the lease, discounted using the interest rate implicit in the lease or, if that rate cannot be readily determined, the consolidated entity’s incremental borrowing rate. Lease payments comprise of fixed payments less any lease incentives receivable, variable lease payments that depend on an index or a rate, amounts expected to be paid under residual value guarantees, exercise price of a purchase option when the exercise of the option is reasonably certain to occur, and any anticipated termination penalties. The variable lease payments that do not depend on an index or a rate are expensed in the period in which they are incurred.
Lease liabilities are measured at amortised cost using the effective interest method. The carrying amounts are remeasured if there is a change in the following: future lease payments arising from a change in an index or a rate used; residual guarantee; lease term; certainty of a purchase option and termination penalties. When a lease liability is remeasured, an adjustment is made to the corresponding right-of use asset, or to profit or loss if the carrying amount of the right-of-use asset is fully written down.
Critical accounting judgements, estimates and assumptionsIn determining the lease term, the consolidated entity considers all facts and circumstances that create an economic incentive to exercise an extension option, or not exercise a termination option. Extension options (or periods after termination options) are only included in the lease term if the lease is reasonably certain to be extended (or not terminated). The assessment is reviewed on an ongoing basis as well as if there is a significant event or change in circumstances that is within its control and affects its ability to exercise (or not to exercise) any option to renew.
BAPCOR / AnnuAl RePORt 2021
113

NOTES TO THE CONSOLIDATED FINANCIAL STATEMENTS continued
NOTE 18. DERIVATIVE FINANCIAL INSTRUMENTSCONSOLIDATED
2021$’000
2020$’000
Current assets
Forward foreign exchange contracts – cash flow hedges 2,732 131
2,732 131
Current liabilities
Forward foreign exchange contracts – cash flow hedges (1,007) (4,576)
Interest rate swap contracts – cash flow hedges – (76)
(1,007) (4,652)
1,725 (4,521)
Refer to note 27 for further information on financial risk management.
Refer to note 19 for further information on fair value measurement.
Significant accounting policiesDerivatives are initially recognised at fair value on the date a derivative contract is entered into and are subsequently remeasured to their fair value at each reporting date. The accounting for subsequent changes in fair value depends on whether the derivative is designated as a hedging instrument, and if so, the nature of the item being hedged.
Derivatives are classified as current or non-current depending on the expected period of realisation.
Cash flow hedgesCash flow hedges are used to cover the consolidated entity’s exposure to variability in cash flows that is attributable to particular risks associated with a recognised asset or liability or a firm commitment which could affect profit or loss. The effective portion of the gain or loss on the hedging instrument is recognised in other comprehensive income through the cash flow hedges reserve in equity, whilst the ineffective portion is recognised in profit or loss. Amounts taken to equity are transferred out of equity and included in the measurement of the hedged transaction when the forecast transaction occurs.
Cash flow hedges are tested for effectiveness on a regular basis both retrospectively and prospectively to ensure that each hedge is highly effective and continues to be designated as a cash flow hedge. If the forecast transaction is no longer expected to occur, the amounts recognised in equity are transferred to profit or loss.
If the hedging instrument is sold, terminated, expires, exercised without replacement or rollover, or if the hedge becomes ineffective and is no longer a designated hedge, the amounts previously recognised in equity remain in equity until the forecast transaction occurs.
NOTE 19. FAIR VALUE MEASUREMENTFair value hierarchyThe following tables detail the consolidated entity’s financial instruments, measured or disclosed at fair value, using a three-level hierarchy, based on the lowest level of input that is significant to the entire fair value measurement, being:
› Level 1: Quoted prices (unadjusted) in active markets for identical assets or liabilities that the entity can access at the measurement date.
› Level 2: Inputs other than quoted prices included within Level 1 that are observable for the asset or liability, either directly or indirectly.
› Level 3: Unobservable inputs for the asset or liability.
114114

LEVEL 1 LEVEL 2 LEVEL 3 TOTALCONSOLIDATED – 2021 $’000 $’000 $’000 $’000
Assets
Derivative financial instruments – 2,732 – 2,732
Total assets – 2,732 – 2,732
Liabilities
Derivative financial instruments – 1,007 – 1,007
Deferred consideration – – 2,928 2,928
Total liabilities – 1,007 2,928 3,935
LEVEL 1 LEVEL 2 LEVEL 3 TOTALCONSOLIDATED – 2020 $’000 $’000 $’000 $’000
Assets
Derivative financial instruments – 131 – 131
Total assets – 131 – 131
Liabilities
Derivative financial instruments – 4,652 – 4,652
Deferred consideration – – 2,469 2,469
Total liabilities – 4,652 2,469 7,121
There were no transfers between levels during the financial year.
Derivative financial instruments carried at fair value are forward foreign exchange contracts and floating interest rate to fixed interest rate swaps. These are considered to be Level 2 financial instruments because their measurement is derived from inputs other than quoted prices included within Level 1 that are observable for the asset or liability, either directly or indirectly.
Deferred settlements are considered to be a Level 3 financial instrument because inputs in valuing this instrument are not based on observable market data. The fair value of this instrument is determined based on an estimated discounted cash flow analysis.
Significant accounting policiesWhen an asset or liability, financial or non-financial, is measured at fair value for recognition or disclosure purposes, the fair value is based on the price that would be received to sell an asset or paid to transfer a liability in an orderly transaction between market participants at the measurement date; and assumes that the transaction will take place either: in the principal market; or in the absence of a principal market, in the most advantageous market.
Fair value is measured using the assumptions that market participants would use when pricing the asset or liability, assuming they act in their economic best interests. For non-financial assets, the fair value measurement is based on its highest and best use. Valuation techniques that are appropriate in the circumstances and for which sufficient data are available to measure fair value, are used, maximising the use of relevant observable inputs and minimising the use of unobservable inputs.
Assets and liabilities measured at fair value are classified into three levels, using a fair value hierarchy that reflects the significance of the inputs used in making the measurements. Classifications are reviewed at each reporting date and transfers between levels are determined based on a reassessment of the lowest level of input that is significant to the fair value measurement.
For recurring and non-recurring fair value measurements, external valuers may be used when internal expertise is either not available or when the valuation is deemed to be significant. External valuers are selected based on market knowledge and reputation. Where there is a significant change in fair value of an asset or liability from one period to another, an analysis is undertaken, which includes a verification of the major inputs applied in the latest valuation and a comparison, where applicable, with external sources of data.
NOTE 19. FAIR VALUE MEASUREMENT continued
BAPCOR / AnnuAl RePORt 2021
115

NOTES TO THE CONSOLIDATED FINANCIAL STATEMENTS continued
NOTE 20. ISSUED CAPITALCONSOLIDATED
2021SHARES
2020SHARES
2021$’000
2020$’000
Ordinary shares 339,412,500 339,412,500 878,652 878,652
Treasury shares – – (10,680) (9,234)
339,412,500 339,412,500 867,972 869,418
Movements in ordinary share capitalDETAILS DATE SHARES $’000Balance 1 July 2019 283,480,597 631,697
Issue for Dividend Reinvestment Plan 26 September 2019 1,054,992 7,274
Issue for Dividend Reinvestment Plan 13 March 2020 1,205,595 6,770
Issue from Capital Raising – Institutional Placement 22 April 2020 40,909,091 180,000
Issue from Capital Raising – Retail Placement 25 May 2020 12,762,225 56,147
Share issue transactions costs April – June 2020 – (4,623)
Deferred tax credit recognised directly in equity April – June 2020 – 1,387
Balance 30 June 2020 339,412,500 878,652
Balance 30 June 2021 339,412,500 878,652
There were no movements in ordinary share capital during the current year.
During the prior financial year, Bapcor raised $236.1M of share capital to strengthen its balance sheet and increase funding flexibility through the issue of 40,909,091 shares under a placement to institutional investors, and the issue of 12,762,225 shares under a share purchase plan offer to existing shareholders. The total cost of this capital raising was $4,623,000 which was recognised as a reduction to the proceeds in equity.
Movements in treasury sharesDETAILS DATE SHARES $’000Balance 1 July 2019 – (8,161)
Purchase of treasury shares 9-12 September 2019 (154,875) (1,073)
Utilisation of treasury shares for LTI 17 September 2019 154,875 –
Balance 30 June 2020 – (9,234)
Purchase of treasury shares 10 September 2020 210,744 (1,446)
Utilisation of treasury shares for LTI 14 September 2020 (210,744) –
Balance 30 June 2021 – (10,680)
Ordinary sharesOrdinary shares entitle the holder to participate in dividends and the proceeds on the winding up of the company in proportion to the number of and amounts paid on the shares held. The fully paid ordinary shares have no par value and the company does not have a limited amount of authorised capital.
On a show of hands every member present at a meeting in person or by proxy shall have one vote and upon a poll each share shall have one vote.
Treasury sharesThe average purchase price of treasury shares during the period was $6.86 (2020: $6.94) per share.
116116

Significant accounting policiesOrdinary shares are classified as equity.
Incremental costs directly attributable to the issue of new shares or options are shown in equity as a deduction, net of tax, from the proceeds.
NOTE 21. RESERVESCONSOLIDATED
2021$’000
2020$’000
Foreign currency reserve (6,883) (6,140)
Cash flow hedge reserve 1,208 (3,181)
Share-based payments reserve 14,087 10,718
8,412 1,397
Foreign currency reserveThis reserve is used to recognise exchange differences arising from the translation of the financial statements of foreign operations to Australian dollars.
Cash flow hedge reserveThis reserve is used to recognise the effective portion of the gain or loss of cash flow hedge instruments that is determined to be an effective hedge.
Share-based payments reserveThis reserve is used to recognise the value of equity benefits provided to employees and directors as part of their remuneration, and other parties as part of their compensation for services.
Movements in reservesMovements in each class of reserve during the current and previous financial year are set out below:
FOREIGN CURRENCY
RESERVE
CASH FLOW HEDGE
RESERVE
SHARE-BASED PAYMENTS
RESERVE TOTALCONSOLIDATED $’000 $’000 $’000 $’000
Balance at 1 July 2019 (1,466) 35 8,739 7,308
Revaluation – (4,543) – (4,543)
Deferred tax – 1,327 (240) 1,087
Share-based payment expense – – 2,219 2,219
Foreign currency translation (4,674) – – (4,674)
Balance at 30 June 2020 (6,140) (3,181) 10,718 1,397
Revaluation – 6,332 – 6,332
Deferred tax – (1,943) 505 (1,438)
Share-based payment expense – – 2,864 2,864
Foreign currency translation (743) – – (743)
Balance at 30 June 2021 (6,883) 1,208 14,087 8,412
NOTE 20. ISSUED CAPITAL continued
BAPCOR / AnnuAl RePORt 2021
117

NOTES TO THE CONSOLIDATED FINANCIAL STATEMENTS continued
NOTE 22. RETAINED PROFITSCONSOLIDATED
2021$’000
2020$’000
Retained profits at the beginning of the financial year 109,432 89,110
Adjustment for change in accounting policy – (9,156)
Retained profits at the beginning of the financial year – restated 109,432 79,954
Profit after income tax expense for the year 118,765 79,172
Dividends paid (note 24) (62,791) (49,694)
Retained profits at the end of the financial year 165,406 109,432
NOTE 23. NON-CONTROLLING INTERESTCONSOLIDATED
2021$’000
2020$’000
Investment in Car Bits Asia, Thailand
Opening balance 1,812 2,233
Non-controlling interest loss for the financial year (206) (455)
Foreign currency revaluation (201) 34
Closing balance 1,405 1,812
In March 2018, the consolidated group entered into a tri-party joint venture in Thailand holding 51% of the shares of the incorporated entity Car Bits Asia., Co. Ltd for the purposes of opening the Burson stores in Thailand. The consolidated group is considered to have effective control.
NOTE 24. DIVIDENDSDividendsDividends paid during the financial year were as follows:
CONSOLIDATED2021
$’0002020
$’000
Final dividend for the year ended 30 June 2020 (2020: 30 June 2019) of 9.5 cents (2020: 9.5 cents) per ordinary share* 32,244 26,931
Interim dividend for the year ended 30 June 2021 (2020: 30 June 2020) of 9.0 cents (2020: 8.0 cents) per ordinary share** 30,547 22,763
62,791 49,694
* Nil amount (2020: $7,274,000) of the final dividend for the year ended 30 June 2020 (2020: 30 June 2019) was settled under the Dividend Reinvestment Plan.** Nil amount (2020: $6,770,000) of the interim dividend for the year ended 30 June 2021 (2020: 30 June 2020) was settled under the Dividend Reinvestment Plan.
The Board has declared a final dividend in respect of FY21 of 11 cents per share, fully franked. The final dividend will be paid on 14 September 2021 to shareholders registered on 31 August 2021.
The final dividend takes the total dividends declared in relation to FY21 to 20 cents per share, fully franked, representing an increase of dividends paid of 14.3% compared to the prior financial year. Dividends paid and declared in relation to FY21 represents 52.2% of pro-forma net profit after tax.
118118

Franking creditsCONSOLIDATED
2021$’000
2020$’000
Franking credits available for subsequent financial years based on a tax rate of 30% 107,586 90,797
The above amounts represent the balance of the franking account as at the end of the financial year, adjusted for:
› franking credits that will arise from the payment of the amount of the provision for income tax at the reporting date;
› franking debits that will arise from the payment of dividends recognised as a liability at the reporting date; and
› franking credits that will arise from the receipt of dividends recognised as receivables at the reporting date.
Significant accounting policiesDividends are recognised when declared during the financial year and no longer at the discretion of the company.
NOTE 25. EARNINGS PER SHARECONSOLIDATED
2021$’000
2020$’000
Profit after income tax 118,559 78,717
Non-controlling interest 206 455
Profit after income tax attributable to the owners of Bapcor Limited 118,765 79,172
CENTS CENTS
Basic earnings per share 34.99 26.97
Diluted earnings per share 34.86 26.85
NUMBER NUMBER
Weighted average number of ordinary shares used in calculating basic earnings per share 339,412,500 293,608,644
Adjustments for calculation of diluted earnings per share:
Options over ordinary shares 1,298,981 1,291,262
Weighted average number of ordinary shares used in calculating diluted earnings per share
340,711,481 294,899,906
Significant accounting policies
Basic earnings per shareBasic earnings per share is calculated by dividing the profit attributable to the owners of Bapcor Limited, excluding any costs of servicing equity other than ordinary shares, by the weighted average number of ordinary shares outstanding during the financial year, adjusted for bonus elements in ordinary shares issued during the financial year and excluding treasury shares.
Diluted earnings per shareDiluted earnings per share adjusts the figures used in the determination of basic earnings per share to take into account the after income tax effect of interest and other financing costs associated with dilutive potential ordinary shares and the weighted average number of shares assumed to have been issued for no consideration in relation to dilutive potential ordinary shares.
NOTE 24. DIVIDENDS continued
BAPCOR / AnnuAl RePORt 2021
119

NOTES TO THE CONSOLIDATED FINANCIAL STATEMENTS continued
NOTE 26. RECONCILIATION OF PROFIT AFTER INCOME TAX TO NET CASH FROM OPERATING ACTIVITIESCONSOLIDATED
2021$’000
2020$’000
Profit after income tax expense for the year 118,559 78,717
Adjustments for:
Depreciation and amortisation 85,380 80,052
Impairment of investments 4,379 –
Net loss/(gain) on disposal of property, plant and equipment 353 (50)
Share of profit – associates (102) –
Unwinding of the discount on deferred settlements – 134
Amortisation of capitalised borrowing costs 669 670
Non-cash share-based payment expense 2,864 2,219
Finance lease interest unwind 7,264 6,324
Change in operating assets and liabilities:
Decrease/(increase) in trade and other receivables (23,672) 3,605
Increase in inventories (82,419) (10,574)
Decrease/(increase) in other operating assets (5,041) 1,234
Increase in trade and other payables 19,581 33,732
Increase/(decrease) in provision for income tax 6,205 (1,190)
Increase in other operating liabilities 1,842 5,380
Net cash from operating activities 135,862 200,253
Significant accounting policiesCash and cash equivalents includes cash on hand, deposits held at call with financial institutions, other short-term, highly liquid investments with original maturities of three months or less that are readily convertible to known amounts of cash and which are subject to an insignificant risk of changes in value.
NOTE 27. FINANCIAL RISK MANAGEMENTFinancial risk management objectivesThe consolidated entity’s activities expose it to a variety of financial risks: market risk (including foreign currency risk, price risk and interest rate risk), credit risk and liquidity risk. The consolidated entity’s overall risk management program focuses on the unpredictability of financial markets and seeks to minimise potential adverse effects on the financial performance of the consolidated entity. The consolidated entity uses derivative financial instruments such as forward foreign exchange contracts to hedge certain risk exposures. Derivatives are exclusively used for hedging purposes, i.e. not as trading or other speculative instruments. The consolidated entity uses different methods to measure different types of risk to which it is exposed. These methods include sensitivity analysis in the case of interest rate, foreign exchange and other price risks, ageing analysis for credit risk and beta analysis in respect of investment portfolios to determine market risk.
Risk management is carried out by senior finance executives (‘finance’) under policies approved by the Board of Directors (‘the Board’). These policies include identification and analysis of the risk exposure of the consolidated entity and appropriate procedures, controls and risk limits. Finance identifies, evaluates and manages financial risks within the consolidated entity’s operating units. Finance reports to the Board on a monthly basis.
120120

The consolidated entity holds the following financial instruments:
CONSOLIDATED2021
$’0002020
$’000
Financial assets
Cash and cash equivalents 39,598 126,300
Trade and other receivables* 181,408 155,216
Derivative financial instruments 2,732 131
Total financial assets 223,738 281,647
Financial liabilities
Trade and other payables 243,160 222,204
Derivative financial instruments 1,007 4,652
Deferred settlements 2,928 2,469
Borrowings** 205,472 230,982
Lease liabilities 226,330 181,808
Total financial liabilities 678,897 642,115
* Trade and other receivables in the table excludes prepayments which are not classified as financial instruments.** Borrowings excludes any unamortised transaction costs capitalised.
Market riskForeign currency riskThe consolidated entity undertakes certain transactions denominated in foreign currency and is exposed to foreign currency risk through foreign exchange rate fluctuations, primarily with respect to the United States dollar and the New Zealand dollar.
Foreign exchange risk arises from future commercial transactions, primarily the purchase of inventory for sales, recognised financial assets and financial liabilities and net investments in foreign operations.
In order to protect against exchange rate movements, the consolidated entity has entered into forward foreign exchange contracts. These contracts are hedging highly probable forecasted cash flows for the ensuing financial year. Management has a risk management policy to hedge between 25% and 100% of anticipated foreign currency transactions for the subsequent twelve months.
The following table demonstrates the sensitivity to a change in the Australian dollar against other currencies, with all other variables held constant. The impact on profit before tax is due to changes in the fair value of monetary assets and liabilities. The pre-tax impact on equity is due to changes in the fair value of forward exchange contracts designated as cash flow hedges as well as foreign currency loans designated as net investment hedges.
AUD STRENGTHENED AUD WEAKENED
CONSOLIDATED – 2021 % CHANGEEFFECT ON PROFIT
BEFORE TAX EFFECT ON EQUITY % CHANGEEFFECT ON PROFIT
BEFORE TAX EFFECT ON EQUITY
Derivative financial instruments
1% – 1,294 (1%) – (1,321)
Other financial assets 1% (642) – (1%) 655 –
Other financial liabilities 1% 585 – (1%) (597) –
(57) 1,294 58 (1,321)
NOTE 27. FINANCIAL RISK MANAGEMENT continued
BAPCOR / AnnuAl RePORt 2021
121

NOTES TO THE CONSOLIDATED FINANCIAL STATEMENTS continued
AUD STRENGTHENED AUD WEAKENED
CONSOLIDATED – 2020 % CHANGEEFFECT ON PROFIT
BEFORE TAX EFFECT ON EQUITY % CHANGEEFFECT ON PROFIT
BEFORE TAX EFFECT ON EQUITY
Derivative financial instruments
1% – 666 (1%) – (681)
Other financial assets 1% (500) – (1%) 510 –
Other financial liabilities 1% 567 – (1%) (579) –
67 666 (69) (681)
Price riskThe consolidated entity is not exposed to any significant price risk.
Interest rate riskThe consolidated entity’s main interest rate risk arises from long-term borrowings. The interest rate and term for bank borrowings is determined at the date of each drawdown.
Borrowings obtained at variable rates expose the consolidated entity to cash flow interest rate risk. The consolidated entity, from time to time, enters into interest rate swap contracts under which it receives interest at variable rates and pays interest at fixed rates to manage the risk of adverse fluctuations in the floating interest rate on its borrowings. There were no interest rate swap contracts in place as at 30 June 2021.
As at the reporting date, the consolidated entity had the following variable rate borrowings and interest rate swap contracts outstanding:
2021 2020
CONSOLIDATED
WEIGHTED AVERAGE INTEREST RATE
%BALANCE
$’000
WEIGHTED AVERAGE INTEREST RATE
%BALANCE
$’000
Borrowings (principal) 1.94% 205,472 2.56% 230,982
Less: amounts covered by interest rate swaps – – 2.54% (20,000)
Net exposure to cash flow interest rate risk 205,472 210,982
As at 30 June, if the weighted average interest rate of the bank borrowings had changed by a factor of + /- 10%, interest expense would increase / decrease by $400,000 (2020: $590,000).
The amount recognised in other comprehensive income net of tax in relation to interest rate swaps was nil (2020: $104,000).
Credit riskCredit risk refers to the risk that a counterparty will default on its contractual obligations resulting in financial loss to the consolidated entity. Credit risk is managed in the following ways:
1) The consolidated entity has a strict code of credit for all customers, including obtaining agency credit information, confirming references and setting appropriate credit limits.
2) Derivative counterparties and cash transactions are limited to high quality independently rated financial institutions with a minimum rating of ‘A’.
3) Concentrations of credit risk are minimised by undertaking transactions with a large number of customers.
4) In some instances the consolidated entity holds collateral over its trade receivables and loans in the form of personal guarantees and charges under the Personal Property Securities Register.
The maximum exposure to credit risk at the reporting date to recognised financial assets is the carrying amount, net of any provisions for impairment of those assets, as disclosed in the statement of financial position and note 8. No trade receivables have an external credit rating, and management classify trade receivables on aging profiles.
NOTE 27. FINANCIAL RISK MANAGEMENT continued
122122

As well as identifying specific expected credit losses, the consolidated entity has adopted a lifetime expected loss allowance in estimating expected credit losses on the remaining trade receivable balances through the use of a provisions matrix using fixed rates of credit loss provisioning. These provisions are considered representative across all customers of the consolidated entity based on recent sales experience, historical collection rates and forward-looking information that is available.
Generally, trade receivables are written off when there is no reasonable expectation of recovery. Indicators of this include the failure of a debtor to engage in a repayment plan, no active enforcement activity and a failure to make contractual payments for a period greater than one year.
Liquidity riskVigilant liquidity risk management requires the consolidated entity to maintain sufficient liquid assets (mainly cash and cash equivalents) and available borrowing facilities to be able to pay debts as and when they become due and payable.
The consolidated entity manages liquidity risk by maintaining adequate cash reserves and available borrowing facilities by continuously monitoring actual and forecast cash flows and matching the maturity profiles of financial assets and liabilities.
Financing arrangementsUnused borrowing facilities at the reporting date:
CONSOLIDATED2021
$’0002020
$’000
Bank loans including overdraft* 312,028 286,518
* The unused facility value excludes any facility that relates to bank guarantees. Refer to note 16 for further information.
Remaining contractual maturitiesThe following tables detail the consolidated entity’s remaining contractual maturity for its financial instrument liabilities. The tables have been drawn up based on the undiscounted cash flows of financial liabilities based on the earliest date on which the financial liabilities are required to be paid. The tables include both interest and principal cash flows disclosed as remaining contractual maturities and therefore these totals may differ from their carrying amount in the statement of financial position.
1 YEAR OR LESSBETWEEN
1 AND 2 YEARSBETWEEN
2 AND 5 YEARS OVER 5 YEARS
REMAINING CONTRACTUAL
MATURITIESCONSOLIDATED – 2021 $’000 $’000 $’000 $’000 $’000
Trade and other payables 243,160 – – – 243,160
Borrowings* 6,087 109,656 11,724 100,000 227,467
Deferred consideration 2,046 882 – – 2,928
Lease liabilities 64,117 53,957 77,558 104,982 300,614
Total non-derivatives 315,410 164,495 89,282 204,982 774,169
Derivatives
Forward foreign exchange contracts 1,007 – – – 1,007
Total derivatives 1,007 – – – 1,007
NOTE 27. FINANCIAL RISK MANAGEMENT continued
BAPCOR / AnnuAl RePORt 2021
123

NOTES TO THE CONSOLIDATED FINANCIAL STATEMENTS continued
1 YEAR OR LESSBETWEEN
1 AND 2 YEARSBETWEEN
2 AND 5 YEARS OVER 5 YEARS
REMAINING CONTRACTUAL
MATURITIESCONSOLIDATED – 2020 $’000 $’000 $’000 $’000 $’000
Trade and other payables 222,204 – – – 222,204
Borrowings* 8,345 120,327 32,507 103,770 264,949
Deferred consideration 1,000 1,500 – – 2,500
Lease liabilities 59,490 49,317 68,110 17,419 194,336
Total non-derivatives 291,039 171,144 100,617 121,189 683,989
Derivatives
Interest rate swaps 76 – – – 76
Forward foreign exchange contracts 4,576 – – – 4,576
Total derivatives 4,652 – – – 4,652
* Borrowings contractual cash flows includes an interest component based on the drawn/undrawn ratio and interest rate applicable as at reporting date until maturity of the loan facility.
Fair value of financial instrumentsThe fair value of financial assets and liabilities disclosed in the statement of financial position do not differ materially from their carrying values.
Capital risk managementThe consolidated entity’s policy is to maintain a capital structure for the business which ensures sufficient liquidity and support for business operations, maintains shareholder and market confidence, provides strong stakeholder returns, and positions the business for future growth. In assessing capital management both equity and debt instruments are taken into consideration.
The ongoing maintenance of this policy is characterised by:
› ongoing cash flow forecast analysis and detailed budgeting processes which, combined with continual development of banking relationships, is directed at providing a sound financial positioning for the consolidated entity’s operations and financial management activities; and
› a capital structure that provides adequate funding for potential acquisition and investment strategies, building future growth in shareholder value. The loan facility can be partly used to fund significant investments as part of this growth strategy.
The consolidated entity is not subject to externally imposed capital requirements, other than contractual banking covenants and obligations. All bank lending requirements have been complied with during the year and at the date of this report, which include the following covenants:
› Net leverage ratio not exceeding 3.00:1 (Net Debt : EBITDA); and
› Fixed charge cover ratio not below 1.75:1 (EBITDA plus Rent : Net Total Cash Interest plus Rent).
NOTE 28. RELATED PARTY TRANSACTIONSParent entityBapcor Limited is the parent entity. Refer to note 31 for supplementary information about the parent entity including internal dividends received.
SubsidiariesInterests in subsidiaries are set out in note 32.
Key management personnelDisclosures relating to key management personnel are set out in note 33 and the Remuneration Report included in the Directors’ Report.
NOTE 27. FINANCIAL RISK MANAGEMENT continued
124124
NOTE 29. BUSINESS COMBINATIONSCurrent financial year acquisitionsThe consolidated entity acquired the net assets of the following businesses:
› Adams Transport Equipment (Pty Ltd)
› Autobarn Melton
› Autobarn Townsville
› Autopro Castlemaine
› Autopro Kyneton
› Opposite Lock Hobart
› Opposite Lock Welshpool
› Truckparts Dubbo
These acquisitions were made to strengthen the Bapcor offering as well as increase the company store network presence.
Total consideration (cash paid, debts forgiven and deferred payments recognised) relating to these acquisitions was $4,382,000, acquiring net assets of $1,643,000 and goodwill of $2,739,000.
Acquisition accounting is provisional at the time of this report and the fair values are to be finalised within the acquisition period of twelve months from acquisition date.
Prior financial year acquisitionsNo material changes have occurred to the prior financial year acquisitions.
Significant accounting policiesThe acquisition method of accounting is used to account for all business combinations, regardless of whether equity instruments or other assets are acquired. The consideration transferred for the acquisition of a subsidiary comprises the fair values of the assets transferred, the liabilities incurred and the equity interests issued. The consideration transferred also includes the fair value of any asset or liability resulting from a contingent consideration arrangement and the fair value of any pre-existing equity interest in the subsidiary.
Acquisition-related costs are expensed as incurred. Identifiable assets acquired and liabilities and contingent liabilities assumed in a business combination are, with limited exceptions, measured initially at their fair values at the acquisition-date. On an acquisition-by-acquisition basis, any non-controlling interest in the acquiree is recognised either at fair value or at the non-controlling interest’s proportionate share of the acquiree’s net identifiable assets.
The excess of the consideration transferred and the amount of any non-controlling interest in the acquiree over the fair value of the net identifiable assets acquired is recorded as goodwill. If those amounts are less than the fair value of the net identifiable assets of the subsidiary acquired and the measurement of all amounts has been reviewed, the difference is recognised directly in profit or loss as a bargain purchase.
Where settlement of any part of cash consideration is deferred, the amounts payable in the future are discounted to their present value as at the date of exchange. The discount rate used is the entity’s incremental borrowing rate, being the rate at which a similar borrowing could be obtained from an independent financier under comparable terms and conditions.
Contingent consideration is classified either as equity or a financial liability. Amounts classified as a financial liability are subsequently remeasured to fair value with changes in fair value recognised in profit or loss.
Critical accounting judgements, estimates and assumptionsBusiness combinations are initially accounted for on a provisional basis. The fair value of assets acquired, liabilities and contingent liabilities assumed are initially estimated by the consolidated entity taking into consideration all available information at the reporting date. Fair value adjustments on the finalisation of the business combination accounting is retrospective, where applicable, to the period the combination occurred and may have an impact on the assets and liabilities, depreciation and amortisation reported.
BAPCOR / AnnuAl RePORt 2021
125

NOTES TO THE CONSOLIDATED FINANCIAL STATEMENTS continued
NOTE 30. DEED OF CROSS GUARANTEEThe following entities are party to a deed of cross guarantee entered into in August 2020 under which each company guarantees the debts of the others. The companies below represent a ‘Closed Group’ for the purposes of the class order outlined below.
Bapcor Limited
Bapcor Finance Pty Ltd
Bapcor Services Pty Ltd
Burson Automotive Pty Ltd
Car Bitz & Accessories Pty Ltd
Aftermarket Network Australia Pty Ltd
Bapcor Retail Pty Ltd (previously Automotive Brands Group Pty Ltd)
Midas Australia Pty Ltd
Specialist Wholesalers Pty Ltd
MTQ Engine Systems (Aust) Pty Ltd
Baxters Pty Ltd
Diesel Distributors Australia Pty Ltd
Ryde Batteries (Wholesale) Pty Ltd
Federal Batteries Qld Pty Ltd
Premier Auto Trade Pty Ltd
JAS Oceania Pty Ltd
Australian Automotive Electrical Wholesale Pty Ltd
Low Voltage Pty Ltd
Bapcor Australia Pty Ltd
AADi Australia Pty Ltd *
Commercial Parts Pty Ltd *
Commercial Spares Pty Ltd *
Don Kyatt Spare Parts (QLD) Pty Ltd *
He Knows Truck Parts Pty Ltd *
I Know Parts and Wrecking Pty Ltd *
* These entities were added to the deed of cross guarantee in August 2020. The prior year comparatives have been amended as if they were part of the deed to ensure comparability.
By entering into the deed, the wholly-owned entities have been relieved from the requirement to prepare financial statements and Directors’ Report under Corporations Instrument 2016/785 issued by the Australian Securities and Investments Commission.
126126

Set out below is a consolidated statement of comprehensive income and statement of financial position of the Closed Group.
2021 2020$’000 $’000
Statement of comprehensive income
Revenue 1,586,797 1,302,244
Share of profits of associates accounted for using the equity method 102 –
Other income 2,388 3,222
Expenses (1,440,559) (1,211,131)
Profit before income tax expense 148,728 94,335
Income tax expense (46,386) (27,729)
Profit after income tax expense 102,342 66,606
Other comprehensive income
3,644 (7,890)
Other comprehensive income for the year, net of tax 3,644 (7,890)
Total comprehensive income for the year 105,986 58,716
2021 2020$’000 $’000
Equity – retained profits
Retained profits at the beginning of the financial year 62,774 45,862
Profit after income tax expense 102,342 66,606
Dividends paid (62,791) (49,694)
Retained profits at the end of the financial year 102,325 62,774
NOTE 30. DEED OF CROSS GUARANTEE continued
BAPCOR / AnnuAl RePORt 2021
127

NOTES TO THE CONSOLIDATED FINANCIAL STATEMENTS continued
2021 2020$’000 $’000
Statement of financial position
Current assets
Cash and cash equivalents 3,435 106,269
Trade and other receivables 170,886 144,606
Inventories 399,468 319,458
Derivative financial instruments 2,525 89
Other 297 297
576,611 570,719
Non-current assets
Right-of-use assets 174,417 133,201
Property, plant and equipment 91,689 66,416
Intangibles 608,108 600,692
Deferred tax 31,737 31,988
Intercompany 14,555 5,189
Investments 337,326 337,326
1,257,832 1,174,812
Total assets 1,834,443 1,745,531
Current liabilities
Trade and other payables 214,508 199,704
Lease liabilities 57,356 51,452
Derivative financial instruments 800 4,341
Income tax 7,536 1,569
Provisions 42,972 39,783
323,172 296,849
Non-current liabilities
Borrowings 192,259 217,090
Lease liabilities 144,052 102,163
Provisions 14,702 15,054
351,013 334,307
Total liabilities 674,185 631,156
Net assets 1,160,258 1,114,375
Equity
Issued capital 867,972 869,418
Reserves 189,961 182,183
Retained profits 102,325 62,774
Total equity 1,160,258 1,114,375
NOTE 30. DEED OF CROSS GUARANTEE continued
128128

NOTE 31. PARENT ENTITY INFORMATIONSet out below is the supplementary information about the parent entity.
Statement of comprehensive incomePARENT
2021$’000
2020$’000
Statement of comprehensive income
Loss after income tax (24,364) (13,830)
Internal dividend income – –
Total comprehensive income (24,364) (13,830)
PARENT2021
$’0002020
$’000
Statement of financial position
Total current assets – –
Total assets 768,312 853,543
Total current liabilities – –
Total liabilities – –
Equity
Issued capital 867,972 869,418
Other reserves 14,088 10,718
Current year profits/(losses) (24,364) (13,830)
Dividends paid (62,791) (49,694)
Prior years retained earnings (26,593) 36,931
Total equity 768,312 853,543
Subsequent to 30 June 2021, the subsidiaries have declared and paid internal dividends to the parent of $165,000,000 which takes the available retained earnings from ($113,748,000) to $51,252,000.
BAPCOR / AnnuAl RePORt 2021
129
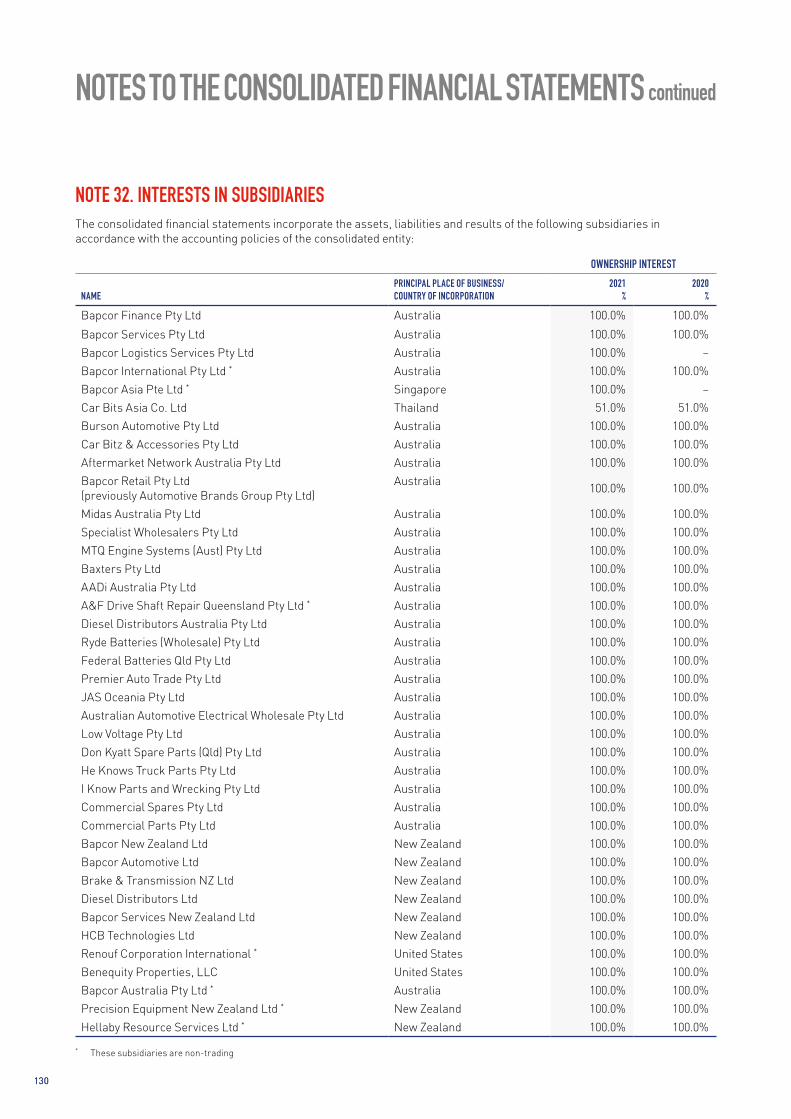
NOTES TO THE CONSOLIDATED FINANCIAL STATEMENTS continued
NOTE 32. INTERESTS IN SUBSIDIARIESThe consolidated financial statements incorporate the assets, liabilities and results of the following subsidiaries in accordance with the accounting policies of the consolidated entity:
OWNERSHIP INTEREST
NAMEPRINCIPAL PLACE OF BUSINESS/ COUNTRY OF INCORPORATION
2021%
2020%
Bapcor Finance Pty Ltd Australia 100.0% 100.0%
Bapcor Services Pty Ltd Australia 100.0% 100.0%
Bapcor Logistics Services Pty Ltd Australia 100.0% –
Bapcor International Pty Ltd * Australia 100.0% 100.0%
Bapcor Asia Pte Ltd * Singapore 100.0% –
Car Bits Asia Co. Ltd Thailand 51.0% 51.0%
Burson Automotive Pty Ltd Australia 100.0% 100.0%
Car Bitz & Accessories Pty Ltd Australia 100.0% 100.0%
Aftermarket Network Australia Pty Ltd Australia 100.0% 100.0%
Bapcor Retail Pty Ltd (previously Automotive Brands Group Pty Ltd)
Australia100.0% 100.0%
Midas Australia Pty Ltd Australia 100.0% 100.0%
Specialist Wholesalers Pty Ltd Australia 100.0% 100.0%
MTQ Engine Systems (Aust) Pty Ltd Australia 100.0% 100.0%
Baxters Pty Ltd Australia 100.0% 100.0%
AADi Australia Pty Ltd Australia 100.0% 100.0%
A&F Drive Shaft Repair Queensland Pty Ltd * Australia 100.0% 100.0%
Diesel Distributors Australia Pty Ltd Australia 100.0% 100.0%
Ryde Batteries (Wholesale) Pty Ltd Australia 100.0% 100.0%
Federal Batteries Qld Pty Ltd Australia 100.0% 100.0%
Premier Auto Trade Pty Ltd Australia 100.0% 100.0%
JAS Oceania Pty Ltd Australia 100.0% 100.0%
Australian Automotive Electrical Wholesale Pty Ltd Australia 100.0% 100.0%
Low Voltage Pty Ltd Australia 100.0% 100.0%
Don Kyatt Spare Parts (Qld) Pty Ltd Australia 100.0% 100.0%
He Knows Truck Parts Pty Ltd Australia 100.0% 100.0%
I Know Parts and Wrecking Pty Ltd Australia 100.0% 100.0%
Commercial Spares Pty Ltd Australia 100.0% 100.0%
Commercial Parts Pty Ltd Australia 100.0% 100.0%
Bapcor New Zealand Ltd New Zealand 100.0% 100.0%
Bapcor Automotive Ltd New Zealand 100.0% 100.0%
Brake & Transmission NZ Ltd New Zealand 100.0% 100.0%
Diesel Distributors Ltd New Zealand 100.0% 100.0%
Bapcor Services New Zealand Ltd New Zealand 100.0% 100.0%
HCB Technologies Ltd New Zealand 100.0% 100.0%
Renouf Corporation International * United States 100.0% 100.0%
Benequity Properties, LLC United States 100.0% 100.0%
Bapcor Australia Pty Ltd * Australia 100.0% 100.0%
Precision Equipment New Zealand Ltd * New Zealand 100.0% 100.0%
Hellaby Resource Services Ltd * New Zealand 100.0% 100.0%
* These subsidiaries are non-trading
130130

NOTE 33. RELATED PARTY TRANSACTIONS – KEY MANAGEMENT PERSONNEL DISCLOSURESCompensation
CONSOLIDATED2021
$2020
$
Short-term employee benefits 10,189 7,733
Post-employment benefits 266 245
Long-term benefits 78 76
Share-based payments 2,543 2,234
13,076 10,288
LoansCONSOLIDATED
2021$
2020$
Opening balance – 601
Amounts repaid – (601)
Closing balance – –
Refer to the audited Remuneration Report within the Directors’ Report for further details on key management personnel compensation. There are no other transactions with key management personnel.
NOTE 34. SHARE-BASED PAYMENTSThe Long-Term Incentive (‘LTI’) plan is intended to assist in the motivation, retention and reward of nominated senior executives. The LTI is a payment contingent on three-year performance and the payments are rights to acquire shares (‘Performance Rights’). Refer to the audited Remuneration Report within the Directors’ Report for further information on the LTI.
In relation to the FY21 year an offer to participate in the LTI was made to ten of Bapcor’s senior executives. These allocated Performance Rights have a performance period that ends on 30 June 2023 at which time the performance hurdles are tested.
A summary of the terms for the Performance Rights granted in the current financial year are set out in the following tables:
GRANT DATE 10/09/20 20/10/20PERFORMANCE HURDLE Relative TSR EPS Relative TSR EPS
PERFORMANCE PERIOD 1/07/20 to 30/06/23 1/07/20 to 30/06/23
TEST DATE 30/06/23 30/06/23
EXPIRY DATE 6/9/35 6/9/35
QUANTITY GRANTED 187,287 187,287 100,504 100,504
EXERCISE PRICE Nil Nil
FAIR VALUE AT GRANT DATE * $4.51 $6.42 $5.61 $7.74
OTHER CONDITIONS Restriction on sale to 30/06/24 Restriction on sale to 30/06/24
SHARE PRICE ON VALUATION DATE $6.89 $8.19
VOLATILITY 38.02% 38.31%
DIVIDEND YIELD 2.54% 2.14%
RISK-FREE RATE 0.2441% 0.1269%
* The fair value represents the value used to calculate the accounting expense as required by accounting standards.
BAPCOR / AnnuAl RePORt 2021
131
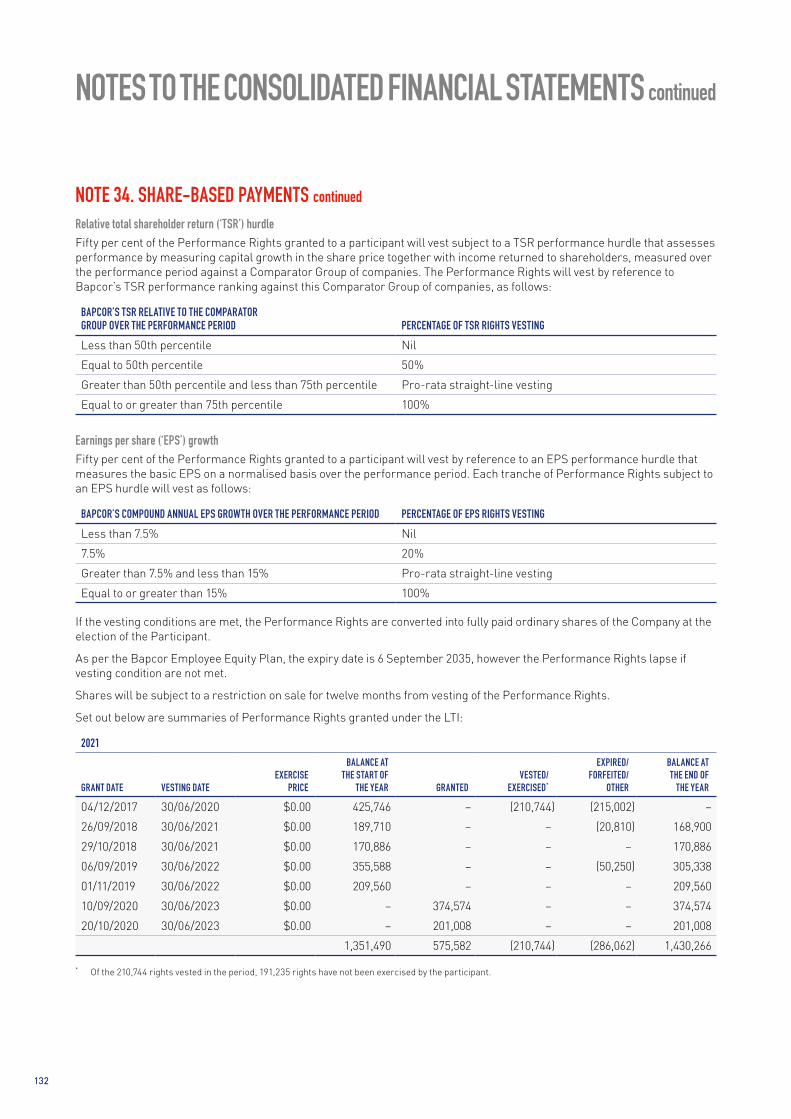
NOTES TO THE CONSOLIDATED FINANCIAL STATEMENTS continued
Relative total shareholder return (‘TSR’) hurdleFifty per cent of the Performance Rights granted to a participant will vest subject to a TSR performance hurdle that assesses performance by measuring capital growth in the share price together with income returned to shareholders, measured over the performance period against a Comparator Group of companies. The Performance Rights will vest by reference to Bapcor’s TSR performance ranking against this Comparator Group of companies, as follows:
BAPCOR’S TSR RELATIVE TO THE COMPARATOR GROUP OVER THE PERFORMANCE PERIOD PERCENTAGE OF TSR RIGHTS VESTINGLess than 50th percentile Nil
Equal to 50th percentile 50%
Greater than 50th percentile and less than 75th percentile Pro-rata straight-line vesting
Equal to or greater than 75th percentile 100%
Earnings per share (‘EPS’) growthFifty per cent of the Performance Rights granted to a participant will vest by reference to an EPS performance hurdle that measures the basic EPS on a normalised basis over the performance period. Each tranche of Performance Rights subject to an EPS hurdle will vest as follows:
BAPCOR’S COMPOUND ANNUAL EPS GROWTH OVER THE PERFORMANCE PERIOD PERCENTAGE OF EPS RIGHTS VESTINGLess than 7.5% Nil
7.5% 20%
Greater than 7.5% and less than 15% Pro-rata straight-line vesting
Equal to or greater than 15% 100%
If the vesting conditions are met, the Performance Rights are converted into fully paid ordinary shares of the Company at the election of the Participant.
As per the Bapcor Employee Equity Plan, the expiry date is 6 September 2035, however the Performance Rights lapse if vesting condition are not met.
Shares will be subject to a restriction on sale for twelve months from vesting of the Performance Rights.
Set out below are summaries of Performance Rights granted under the LTI:
2021
GRANT DATE VESTING DATEEXERCISE
PRICE
BALANCE AT THE START OF
THE YEAR GRANTEDVESTED/
EXERCISED*
EXPIRED/ FORFEITED/
OTHER
BALANCE AT THE END OF
THE YEAR
04/12/2017 30/06/2020 $0.00 425,746 – (210,744) (215,002) –
26/09/2018 30/06/2021 $0.00 189,710 – – (20,810) 168,900
29/10/2018 30/06/2021 $0.00 170,886 – – – 170,886
06/09/2019 30/06/2022 $0.00 355,588 – – (50,250) 305,338
01/11/2019 30/06/2022 $0.00 209,560 – – – 209,560
10/09/2020 30/06/2023 $0.00 – 374,574 – – 374,574
20/10/2020 30/06/2023 $0.00 – 201,008 – – 201,008
1,351,490 575,582 (210,744) (286,062) 1,430,266
* Of the 210,744 rights vested in the period, 191,235 rights have not been exercised by the participant.
NOTE 34. SHARE-BASED PAYMENTS continued
132132

2020
GRANT DATE VESTING DATEEXERCISE
PRICE
BALANCE AT THE START OF
THE YEAR GRANTEDVESTED/
EXERCISED*
EXPIRED/ FORFEITED/
OTHER
BALANCE AT THE END OF
THE YEAR
20/12/2016 30/06/2019 $0.00 182,220 – (66,073) (116,147) –
04/12/2017 30/06/2019 $0.00 177,603 – (88,802) (88,801) –
04/12/2017 30/06/2020 $0.00 466,097 – – (40,351) 425,746
26/09/2018 30/06/2021 $0.00 226,195 – – (36,485) 189,710
29/10/2018 30/06/2021 $0.00 170,886 – – – 170,886
06/09/2019 30/06/2022 $0.00 – 355,588 – – 355,588
01/11/2019 30/06/2022 $0.00 – 209,560 – – 209,560
1,223,001 565,148 (154,875) (281,784) 1,351,490
The weighted average exercise price for the Performance Rights exercised in the current financial year was $6.86 (2020: $6.94).
The weighted average contractual lives are 1.67 years (2020: 1.76 years).
The expense arising from share-based payment transactions relating to the LTI during the year as part of employee benefits expense was $2,864,000 (2020: $2,219,000).
Note: The numbers in the disclosures above include amounts relating to employees that are not key management personnel and therefore differ to those presented in audited Remuneration Report within the Directors’ Report.
Employee Salary Sacrifice Share PlanDuring the financial year, Bapcor issued shares to employees via an Employee Salary Sacrifice Share Plan (‘ESSSP’). The ESSSP allowed eligible employees to acquire up to $1,000 of shares from their pre-tax wages. The value of this share-based payment transaction is deemed immaterial to the financial statements.
Significant accounting policiesShare-based compensation benefits are provided to employees via the Long-Term Incentive (‘LTI’) plan. The fair value of performance rights granted under the LTI is recognised as an employee benefit expense over the period during which the employees become unconditionally entitled to the rights and options with a corresponding increase in equity.
The total amount to be expensed is determined by reference to the fair value of the rights and options granted, which includes any market performance conditions and the impact of any non-vesting conditions but excludes the impact of any service and non-market performance vesting conditions. Non-market vesting conditions are included in assumptions about the number of options that are expected to vest which are revised at the end of each reporting period. The impact of the revision to original estimates, if any, is recognised in profit or loss, with a corresponding adjustment to equity.
The fair value is measured at grant date and the expense recognised over the life of the plan. The fair value is independently determined using a Black-Scholes or similar option pricing model that takes into account the exercise price, the term of the option, the impact of dilution, the share price at grant date and expected price volatility of the underlying share, the expected dividend yield and the risk-free interest rate for the term of the option.
Critical accounting judgements, estimates and assumptionsThe consolidated entity measures the cost of equity-settled transactions with employees by reference to the fair value of the equity instruments at the date at which they are granted. The fair value is determined by using either the Binomial or Black-Scholes model taking into account the terms and conditions upon which the instruments were granted. The accounting estimates and assumptions relating to equity-settled share-based payments would have no impact on the carrying amounts of assets and liabilities within the next annual reporting period but may impact profit or loss and equity.
NOTE 34. SHARE-BASED PAYMENTS continued
BAPCOR / AnnuAl RePORt 2021
133

NOTES TO THE CONSOLIDATED FINANCIAL STATEMENTS continued
NOTE 35. REMUNERATION OF AUDITORSDuring the financial year the following fees were paid or payable for services provided by PricewaterhouseCoopers, the auditor of the company:
CONSOLIDATED2021
$2020
$
Audit services – PricewaterhouseCoopers
Audit or review of the financial statements – relating to current financial year 608,838 603,502
Audit or review of the financial statements – relating to previous financial year 15,000 –
623,838 603,502
NOTE 36. COMMITMENTS AND CONTINGENT LIABILITIESCommitments
CONSOLIDATED2021
$2020
$
Commitments
Committed at the reporting date but not recognised as liabilities, payable:
Guarantees in relation to leases 4,255 4,454
Guarantees in relation to performance of contracts* 5,130 5,130
Supply of equipment* 978 12,718
10,363 22,302
* The commitments of guarantees in relation to performance of contracts and supply of equipment relate to the Victorian DC Consolidation project.
Contingent liabilitiesThere are no contingent liabilities (2020: Nil).
The divestment of the non-core businesses of Footwear and Contract Resources as well as the TRS business unit in previous financial years include standard indemnity and warranty clauses as is customary in these types of transactions.
NOTE 37. EVENTS AFTER THE REPORTING PERIODApart from the dividend declared and the ongoing uncertainty around Covid related restrictions, no other matter or circumstance has arisen since 30 June 2021 that has significantly affected, or may significantly affect the consolidated entity’s operations, the results of those operations, or the consolidated entity’s state of affairs in future financial years.
134134

DIRECTORS’ DECLARATION30 JUNE 2021
In the directors’ opinion:
› the attached financial statements and notes comply with the Corporations Act 2001, the Accounting Standards, the Corporations Regulations 2001 and other mandatory professional reporting requirements;
› the attached financial statements and notes comply with International Financial Reporting Standards as issued by the International Accounting Standards Board as described in note 1 to the financial statements;
› the attached financial statements and notes give a true and fair view of the consolidated entity’s financial position as at 30 June 2021 and of its performance for the financial year ended on that date;
› there are reasonable grounds to believe that the company will be able to pay its debts as and when they become due and payable; and
› at the date of this declaration, there are reasonable grounds to believe that the members of the Extended Closed Group will be able to meet any obligations or liabilities to which they are, or may become, subject by virtue of the deed of cross guarantee described in note 30 to the financial statements.
The directors have been given the declarations required by section 295A of the Corporations Act 2001.
Signed in accordance with a resolution of directors made pursuant to section 295(5)(a) of the Corporations Act 2001.
On behalf of the directors
Margaret Haseltine Darryl Abotomey Chair Chief Executive Officer and Managing Director
18 August 2021 Melbourne
BAPCOR / AnnuAl RePORt 2021
135

PricewaterhouseCoopers, ABN 52 780 433 757 2 Riverside Quay, SOUTHBANK VIC 3006, GPO Box 1331, MELBOURNE VIC 3001 T: 61 3 8603 1000, F: 61 3 8603 1999, www.pwc.com.au
Liability limited by a scheme approved under Professional Standards Legislation.
Independent auditor’s report To the members of Bapcor Limited
Report on the audit of the financial report
Our opinion In our opinion:
The accompanying financial report of Bapcor Limited (the Company) and its controlled entities (together the Group) is in accordance with the Corporations Act 2001, including:
(a) giving a true and fair view of the Group's financial position as at 30 June 2021 and of itsfinancial performance for the year then ended
(b) complying with Australian Accounting Standards and the Corporations Regulations 2001.
What we have audited The Group financial report comprises:
• the consolidated statement of financial position as at 30 June 2021• the consolidated statement of comprehensive income for the year then ended• the consolidated statement of changes in equity for the year then ended• the consolidated statement of cash flows for the year then ended• the notes to the consolidated financial statements, which include significant accounting policies
and other explanatory information• the directors’ declaration.
Basis for opinion We conducted our audit in accordance with Australian Auditing Standards. Our responsibilities under those standards are further described in the Auditor’s responsibilities for the audit of the financial report section of our report.
We believe that the audit evidence we have obtained is sufficient and appropriate to provide a basis for our opinion.
Independence We are independent of the Group in accordance with the auditor independence requirements of the Corporations Act 2001 and the ethical requirements of the Accounting Professional & Ethical Standards Board’s APES 110 Code of Ethics for Professional Accountants (including Independence Standards) (the Code) that are relevant to our audit of the financial report in Australia. We have also fulfilled our other ethical responsibilities in accordance with the Code.
INDEPENDENT AUDITOR’S REPORT TO THE MEMBERS OF BAPCOR LIMITED
136136

Our audit approach An audit is designed to provide reasonable assurance about whether the financial report is free from material misstatement. Misstatements may arise due to fraud or error. They are considered material if individually or in aggregate, they could reasonably be expected to influence the economic decisions of users taken on the basis of the financial report.
We tailored the scope of our audit to ensure that we performed enough work to be able to give an opinion on the financial report as a whole, taking into account the geographic and management structure of the Group, its accounting processes and controls and the industry in which it operates.
Materiality
• For the purpose of our audit we used overall Group materiality of $8.9 million, which representsapproximately 5% of the Group’s profit before tax adjusted for the Victorian DC Consolidation costs.
• We applied this threshold, together with qualitative considerations, to determine the scope of our auditand the nature, timing and extent of our audit procedures and to evaluate the effect of misstatements onthe financial report as a whole.
• We chose adjusted Group profit before tax because, in our view, it is the benchmark against which theperformance of the Group is most commonly measured.
• We utilised a 5% threshold based on our professional judgement, noting it is within the range of commonlyacceptable thresholds.
Audit Scope
• Our audit focused on where the Group made subjective judgements; for example, significant accountingestimates involving assumptions and inherently uncertain future events.
• Audit procedures were performed on the Australian and New Zealand operations assisted by localcomponent auditors in New Zealand under the supervision of the Group engagement team.
Key audit matters Key audit matters are those matters that, in our professional judgement, were of most significance in our audit of the financial report for the current period. The key audit matters were addressed in the context of our audit of the financial report as a whole, and in forming our opinion thereon, and we do not provide a separate opinion on these matters. Further, any commentary on the outcomes of a particular audit procedure is made in that context. We communicated the key audit matters to the Audit and Risk Committee.
BAPCOR / AnnuAl RePORt 2021
137
BAPCOR / AnnuAl RePORt 2021
137

INDEPENDENT AUDITOR’S REPORT continued
Key audit matter How our audit addressed the key audit matter
Carrying value of goodwill and intangible assets with indefinite lives (Refer to note 12) $725.6m
At 30 June 2021, the Group recognised $667.9 million of goodwill and $57.7 million of intangible assets with indefinite lives.
At least annually, an impairment test is performed by the Group over the goodwill and intangible assets with indefinite lives, in each of the Group’s cash generating units (CGUs) based on ‘value in use’ discounted cash flow models (the models). Impairment losses for identified shortfalls in value are recognised in the consolidated statement of comprehensive income. Significant judgement is required by the Group to estimate the key assumptions in the models to determine the recoverable amount of the goodwill and intangible assets with indefinite lives, and the amount of any resulting impairment (if applicable). The key assumptions applied by the Group include:
• the terminal value growth rate beyond 5years
• forecast year on year revenue and EBITDAmargin growth ranges
• the discount rate adopted in the models
Given the level of judgement applied by the Group, and the financial significance of the goodwill and intangible assets with indefinite lives recognised in the Group’s consolidated statement of financial position, we determined that this continues to be a key audit matter.
Our audit procedures included, amongst others:
• Assessing whether the allocation of theGroup’s goodwill and intangible assets intoCGUs was consistent with our knowledge ofthe Group’s operations and internal Groupreporting
• Assessing whether the grouping of CGUsappropriately included the assets, liabilitiesand cash flows directly attributable to eachCGU and an allocation of corporate assetsand overheads
• Evaluating the reliability of forecast cashflows used in the models throughcomparison to the Group’s most up-to-datebudgets and business plans formallyapproved by the Board of Directors
• Assessing the Group’s historical ability toforecast cash flows by comparing budgets toreported actual results for the past 3 years
• Considering whether the cash flows used inthe models were appropriate and based onsupportable assumptions by comparingactual cash flows for previous years toforecast cash flows and evaluating thesupport available from the Group fordifferences in actual and forecast cash flows
• Comparing forecast year on year revenuegrowth ranges to industry forecasts preparedby independent third parties
• Assessing the reasonableness of disclosuresrelated to sensitivity to a change in keyassumptions used in the models that eitherindividually or collectively would result inthe impairment of assets
• Together with PwC valuation experts,evaluating whether:
138138

Key audit matter How our audit addressed the key audit matter
o discount rates used in the modelsappropriately reflected the risks ofthe CGUs by considering relevantindustry and market factors
o the models applied to test goodwilland intangible assets with indefinitelives for impairment included theappropriate data inputs as requiredunder Australian AccountingStandards
• Testing the mathematical accuracy of themodels on a sample basis.
We also considered the reasonableness of disclosures in note 12, including those regarding the key assumptions, in accordance with the requirements of the Australian Accounting Standards.
Carrying value of Inventory (Refer to note 9) $447.1m
At 30 June 2021, the Group recorded a provision for aged and slow-moving inventory of $53.8 million. The provision is calculated by applying judgemental provisioning rates to aged and slow-moving inventory categories. A specific provision is also recorded for items where the known net realisable value is lower than cost.
We considered this to be a key audit matter because of the significant judgement required by the Group in determining the net realisable value of inventory and the potentially material impact that changes in the provision could have on the financial report.
Our audit procedures included the following, amongst others:
• Considering whether all the necessaryinventory balances were included in theinventory provision calculation
• Evaluating whether the methodology appliedto the provision calculation was appropriateand consistent with that applied in the prioryear and was in accordance with AustralianAccounting Standards
• Evaluating the reliability and relevance ofunderlying data inputs used to calculate themovement in the inventory provision,including agreeing a sample of inventorywritten off to supporting documentationsuch as Board approvals
• Considering the reasonableness ofdisclosures in note 9 in light of therequirements of the Australian AccountingStandards
BAPCOR / AnnuAl RePORt 2021
139
BAPCOR / AnnuAl RePORt 2021
139

INDEPENDENT AUDITOR’S REPORT continued
Other information The directors are responsible for the other information. The other information comprises the information included in the annual report for the year ended 30 June 2021, but does not include the financial report and our auditor’s report thereon. Prior to the date of this auditor's report, the other information we obtained included the Directors’ Report and Corporate Directory. We expect the remaining other information to be made available to us after the date of this auditor's report.
Our opinion on the financial report does not cover the other information and we do not and will not express an opinion or any form of assurance conclusion thereon.
In connection with our audit of the financial report, our responsibility is to read the other information and, in doing so, consider whether the other information is materially inconsistent with the financial report or our knowledge obtained in the audit, or otherwise appears to be materially misstated.
If, based on the work we have performed on the other information that we obtained prior to the date of this auditor’s report, we conclude that there is a material misstatement of this other information, we are required to report that fact. We have nothing to report in this regard.
When we read the other information not yet received, if we conclude that there is a material misstatement therein, we are required to communicate the matter to the directors and use our professional judgement to determine the appropriate action to take.
Responsibilities of the directors for the financial report The directors of the Company are responsible for the preparation of the financial report that gives a true and fair view in accordance with Australian Accounting Standards and the Corporations Act 2001 and for such internal control as the directors determine is necessary to enable the preparation of the financial report that gives a true and fair view and is free from material misstatement, whether due to fraud or error.
In preparing the financial report, the directors are responsible for assessing the ability of the Group to continue as a going concern, disclosing, as applicable, matters related to going concern and using the going concern basis of accounting unless the directors either intend to liquidate the Group or to cease operations, or have no realistic alternative but to do so.
Auditor’s responsibilities for the audit of the financial report Our objectives are to obtain reasonable assurance about whether the financial report as a whole is free from material misstatement, whether due to fraud or error, and to issue an auditor’s report that includes our opinion. Reasonable assurance is a high level of assurance, but is not a guarantee that an audit conducted in accordance with the Australian Auditing Standards will always detect a material misstatement when it exists. Misstatements can arise from fraud or error and are considered material if, individually or in the aggregate, they could reasonably be expected to influence the economic decisions of users taken on the basis of the financial report.
A further description of our responsibilities for the audit of the financial report is located at the Auditing and Assurance Standards Board website at:
140140
https://www.auasb.gov.au/admin/file/content102/c3/ar1_2020.pdf. This description forms part of our auditor's report.
Report on the remuneration report
Our opinion on the remuneration report We have audited the remuneration report included in pages 54 to 79 of the directors’ report for the year ended 30 June 2021.
In our opinion, the remuneration report of Bapcor Limited for the year ended 30 June 2021 complies with section 300A of the Corporations Act 2001.
Responsibilities The directors of the Company are responsible for the preparation and presentation of the remuneration report in accordance with section 300A of the Corporations Act 2001. Our responsibility is to express an opinion on the remuneration report, based on our audit conducted in accordance with Australian Auditing Standards.
PricewaterhouseCoopers
Jason Perry Melbourne Partner 18 August 2021
BAPCOR / AnnuAl RePORt 2021
141
BAPCOR / AnnuAl RePORt 2021
141

SHAREHOLDER INFORMATION
In accordance with ASX Listing Rule 4.10, the Company provides the following information to shareholders not elsewhere disclosed in this Annual Report. The information provided is current as at 18 August 2021 (‘Reporting Date’).
1. CORPORATE GOVERNANCE STATEMENTBapcor (‘the Company’) has prepared a Corporate Governance Statement which sets out the corporate governance practices that were in operation throughout the financial year for the Company. In accordance with ASX Listing Rule 4.10.3, the Corporate Governance Statement will be available for review on the Company’s website www.bapcor.com.au, and will be lodged with ASX at the same time that this Annual Report is lodged with ASX.
2. DISTRIBUTION AND NUMBER OF SHAREHOLDERS OF EQUITY SECURITIESThe distribution and number of holders of equity securities on issue in the Company as at the Reporting Date, and the number of holders holding less than a marketable parcel of the Company’s ordinary shares, based on the closing market price as at the Reporting Date, is as follows:
2.1 Distribution of ordinary shareholdersRANGE TOTAL HOLDERS SHARES % OF ISSUED CAPITAL
1 – 1,000 8,877 3,832,819 1.13
1,001 – 5,000 7,895 19,544,151 5.76
5,001 – 10 000 1,743 12,290,443 3.62
10,001 – 100,000 1,077 22,857,957 6.73
100,001 + 54 280,887,130 82.76
Total 19,646 339,412,500 100.00
Holders of less than a marketable parcel of $500 included in above total 402 6,310
2.2 Distribution of holders of performance rights
RANGE TOTAL HOLDERSPERFORMANCE
RIGHTS %
1 – 1,000 – – –
1,001 – 5,000 – – –
5,001 – 10 000 – – –
10,001 – 100,000 9 563,915 47.13
100,001 + 2 632,694 52.87
Total 11 1,196,609 100.00
142

3. TWENTY LARGEST QUOTED EQUITY SECURITY HOLDERS The Company only has one class of quoted securities, being ordinary shares. The names of the twenty largest holders of ordinary shares, the number of ordinary shares and the percentage of capital held by each holder is as follows:
ORDINARY SHARES
NAME NUMBER HELD% OF ISSUED
CAPITAL
HSBC Custody Nominees (Australia) Limited 98,033,240 28.88
J P Morgan Nominees Australia Limited 81,499,391 24.01
Citicorp Nominees Pty Limited 43,053,798 12.68
National Nominees Limited 19,879,038 5.86
BNP Paribas Nominees Pty Ltd 18,719,102 5.52
Garrmar Investments Pty Ltd 5,800,000 1.71
Sandhurst Trustees Ltd 2,546,634 0.75
Netwealth Investments Limited 1,695,854 0.50
D Abotomey 1,441,154 0.42
AMP Life Limited 1,078,841 0.32
Brispot Nominees Pty Ltd 947,133 0.28
Equity Trustees Wealth Services Limited 898,566 0.26
Glendale Investment Group Pty Ltd 670,000 0.20
Neweconomy Com Au Nominees Pty Limited 640,259 0.19
Broadgate Investments Pty Ltd 575,034 0.17
Schram Investments Pty Ltd 510,619 0.15
Buttonwood Nominees Pty Ltd 458,652 0.14
C Magill 448,719 0.13
JMB Family Investments Pty Ltd 330,000 0.10
Sir Moses Montefiore Jewish Home 263,319 0.08
279,489,353 82.35
Other Shareholders 59,923,147 17.65
Total Shareholders 339,412,500 100.00
4. SUBSTANTIAL HOLDERSAs at the Reporting Date, the names of the substantial holders of the Company and the number of equity securities in which those substantial holders and their associates have a relevant interest, as disclosed in substantial holding notices given to the Company, are as follows:
NAME NUMBER HELD% OF ISSUED
CAPITAL
Challenger Limited 25,904,112 7.63
Australian Super Pty Ltd 24,130,659 7.11
Alphinity Investment Management Pty Ltd 20,602,969 6.07
Vanguard Group 16,974,862 5.00
BAPCOR / AnnuAl RePORt 2021
143
SHAREHOLDER INFORMATION continued
5. VOTING RIGHTSThe voting rights attaching to each class of equity securities are set out below:
5.1 Ordinary sharesAt a general meeting of the Company, every holder of ordinary shares present in person or by proxy, attorney or representative has one vote on a show of hands and on a poll, one vote for each ordinary share held.
5.2 Performance rightsPerformance rights do not carry any voting rights.
6. UNQUOTED EQUITY SECURITIESThere are 1,196,609 unlisted performance rights that have been granted to 11 persons. Of this, 191,235 have vested but are yet to be exercised. The Company issued 201,008 performance rights during the financial year ended 30 June 2021, pursuant to shareholder approval obtained by the Company under ASX Listing Rule 10.14. There are no persons who hold 20% or more of performance rights that were not issued or acquired under an employee incentive scheme.
7. VOLUNTARY ESCROWThere are no securities subject to voluntary escrow in the Company, nor are there any restricted securities on issue in the Company, as at the Reporting Date.
8. ON-MARKET BUY-BACKThe Company is not currently conducting an on-market buy-back.
144144

DIRECTORSMargaret Haseltine (Independent, non-executive Director and Chair)
Darryl Abotomey (Managing Director and Chief executive officer)
Jennifer Macdonald (Independent, non-executive Director)
Mark Powell (Independent, non-executive Director)
Therese Ryan (Independent, non-executive Director)
James Todd (Independent, non-executive Director)
COMPANY SECRETARYGeorge Sakoufakis
email: [email protected]
NOTICE OF ANNUAL GENERAL MEETINGthe details of the annual general meeting of Bapcor limited are:
Date: 19 october 2021
time: 1:30pm (AeSt)
Address: Via virtual technology
REGISTERED OFFICE127-139 link Road Melbourne Airport VIC 3045 Australia
SHARE REGISTERComputershare Investor Services pty ltd 452 Johnston Street Abbotsford VIC 3067 Australia
ph: +61 3 9415 4000 or 1300 850 505 (within Australia)
AUDITORpricewaterhouseCoopers 2 Riverside Quay Southbank VIC 3006 Australia
STOCK EXCHANGE LISTINGBapcor limited shares are listed on the Australian Securities exchange (ASX: BAp)
WEBSITEwww.bapcor.com.au
CORPORATE DIRECTORY
BApCoR / AnnuAl RepoRt 2021
145
