annual report 2018/2019 - eolus vind
TRANSCRIPT

Annual Report 2018/2019

2 ANNUAL REPORT EOLUS VIND AB 2018/2019
THE PAST YEAR
Significant events during the fiscal year
Divestment of 400 MW in the Øyfjellet projectIn July 2019, Eolus signed an agreement with Aquila Capital to sell 100% of the shares in the subsidiary that owns all rights to establish the Øyfjellet wind farm in Norway, comprising 400 MW. The agreement also includes the 15-year PPA that Eolus signed with Alcoa. Eolus will manage the construction of the wind farm on behalf of Aquila and manage the facility’s assets on behalf of Aquila Capital when the facility is completed. In October 2018, the wind farm’s conces-sion was increased from 330 MW to 400 MW.
First solar-plus-storage projectIn September 2018, Eolus acquired a solar-plus-storage project in the western US region through its subsidiary, Eolus North America Inc. This early-phase project has a planned capacity of 500 MW and storage capacity of 250 MW. The project is Eolus’s first acquisi-tion with these technologies in any market.
Total 115 MW of wind power completedDuring the fiscal year, Eolus completed a total of three wind farms with a combined capacity of 115 MW. The Anneberg wind farm (11 MW) was completed and handed over in January 2019, while Nylandsbergen (68 MW) and Sötter- fällan (36 MW) were completed and handed over in August 2019.
New credit agreement with SwedbankIn September 2018, Eolus signed a new credit agreement with Swedbank. The agreement comprises liquidity and construction loans totaling SEK 1,050 M with a four-year term. The loans have secured funding for ongoing and future establishments in which Eolus is responsible for financing during the installation phase, as well as strong liquidity in the ongoing operations.
130 MW to be built in BäckhammarIn October 2018, Eolus signed an agreement with KGAL regarding divestment of the Bäckhammar wind farm, located on the border between the municipality of Kristinehamn and the municipality of Degerfors. The farm will comprise 22 Vestas V136-4.2 MW and nine Vestas V150-4.2 MW wind turbines with a total capacity of 130 MW. When the wind farm is completed, which is scheduled for August 2020, Eolus will manage the facili-ty’s assets on behalf of KGAL. In turn, KGAL has signed a power purchase agreement (PPA) with Amazon Web Services for deliveries of renewable electricity to their Swedish data centers when the facility is completed.

ANNUAL REPORT EOLUS VIND AB 2018/2019 3
THE PAST YEAR
FIVE-YEAR SUMMARY
SEK M 2018/2019 2017/2018 2016/2017 2015/2016 2014/2015
Net sales 2,031.9 1,366.0 1,065.7 693.4 1,502.1
Operating profit/loss 118.3 202.4 40.2 -15.9 90.0
Profit/loss before tax 116.0 198.9 34.2 -29.1 75.2
Net profit/loss for the year 132.8 194.3 24.5 -23.9 80.0
Earnings/loss per share, before and after dilution, SEK 5.33 7.81 1.02 -0.92 3.25
No. of turbines constructed and deployed 31 25 25 14 33
Turbines constructed and deployed, MW 115.2 83.8 72.2 37.7 68.6
Managed turbines, MW 524 415 351 293 303
Own electricity generation, GWh 11.7 30.2 58.6 123.6 242.3
EOLUS’S CUMULATIVE INSTALLED CAPACITY
MW
2013/2014 2014/2015 2015/2016 2016/2017 2017/2018 2018/20190
200
400
600
800
1, 000
1, 200
Installed capacity during the fiscal year + Total installed capacity
CONTENTSSignificant events during the fiscal year .............................................. 2
Five-year summary ................................... 3
Message from the CEO ............................ 4
Eolus in brief ...............................................6
Market ............................................................ 8
Customer groups...................................... 11
Project development ..............................12
Projects established during the year ...................................... 14
High-priority projects ........................16
Eolus around the world .................... 20
Development activities .....................22
Asset management .................................24
Electricity generation ........................... 26
Sustainability ............................................28
Financial summary ................................ 31
Key figures for the Group ..................... 31
Share and ownership structure ........32
Group Management ...............................34
Directors’ Report ......................................36
Corporate Governance Report ...........41
Consolidated statement of income .................................................... 46
Consolidated statement of other comprehensive income .......47
Consolidated statement of financial position .............................. 48
Consolidated statement of changes in equity .............................. 50
Consolidated statement of cash flows ........................ 51
Parent Company income statement ....................................................52
Parent Company statement of other comprehensive income .......53
Parent Company balance sheet ........54
Parent Company statement of changes in equity ...............................56
Parent Company cash flow statement ............................... 57
Notes .............................................................58
Signatures ...................................................88
Auditor’s Report ...................................... 89
Board of Directors ...................................92
Glossary....................................................... 94
Annual General Meeting, financial calendar, definitions of alternative performance measures .........................95
120400 115
Did you know that the rotor blades of a Vestas V136 wind turbine weigh 15 tonnes each? The crane that lifts them into place has a capacity of 36 tonnes.
During the fiscal year, the equivalent of 34 wind
turbines with a total capacity of 120 MW were
handed over to customers.
During the fiscal year, Eolus’s concession for
Øyfjellet was expanded from 330 MW to
400 MW.
During the fiscal year, Eolus deployed
31 wind turbines with a total capacity
of 115 MW.

4 ANNUAL REPORT EOLUS VIND AB 2018/2019
MESSAGE FROM THE CEO
A year with strong commitment and high-quality projects
The competitiveness of wind power has continued to strengthen and the effects of investment decisions in recent years are becoming clearer. Since the Swedish Energy Agreement was adopted in 2016, decisions to invest in Swedish wind power projects have corresponded to approximately SEK 80 billion. Over the past 12-month period, electricity generated from Swedish wind power has exceeded 20 TWh. According to forecasts from Swedish Wind Energy, wind power generation is expected to almost double by 2022.
Establishment of Swedish wind power facilities Eolus has been a major player in the wind farm market for a long time and will contin-ue to play a key role in the realization of sustainable, efficient and profitable facili-ties in all of our markets. During the fiscal year, the Anneberg, Nylandsbergen and Sötterfällan farms were deployed, totaling 31 turbines with a capacity of 115 MW and estimated annual generation of about 398 GWh. Since its inception, Eolus has sub-sequently established wind power facilities with a capacity of more than 1,000 MW in Sweden. By the end of 2021, Eolus expects to deploy an additional 800 MW in Sweden, Norway and the US. In August, the Sötterfällan (36 MW) and Nylandsbergen (68 MW) wind farms
were handed over to KGAL and Aquila Capi-tal, respectively. Both wind farms were handed over on schedule at the end of Au-gust, which gave rise to a high cash flow on the balance sheet date, mainly because some project- related liabilities were not paid until after the balance sheet date.
Outstanding efforts by employees and sub-contractorsDuring the spring, the establishment of our Sundsvall projects, Nylandsbergen and Kråktorpet, was affected by some delays and cost increases when the completed contract work did not meet our functional require-ments. Thanks to the outstanding efforts of our own employees and sub-contractors, we are now back on schedule. At the end of August, Nylandsbergen was handed over to Aquila as planned. In Kråktorpet, all tur-bines are now in full commercial operation and the farm is scheduled for handover to Aquila during the autumn. Speeding up the projects and defects in the underlying con-tract work led to additional costs for the projects, as well as demands from the turbine manufacturer. While reasonable to a certain extent, these demands had a nega-tive impact on both projects, as well as the expected project margin for Kråktorpet. Eolus has now filed a claim against the con-tractor that was engaged to construct roads and crane sites.
“Eolus has been a major player in the wind farm market for a long time and will continue to play a key role in the realization of sustainable, efficient and profitable facilities in all of our markets.”

ANNUAL REPORT EOLUS VIND AB 2018/2019 5
Divestment of the Øyfjellet projectIn July, we announced that Eolus had en-tered into a conditional agreement with Aquila Capital regarding divestment and construction of the Øyfjellet project in Norway. The Norwegian Government has granted a concession for the project, com-prising 400 MW and estimated generation of more than 1.3 TWh per year. The project has signed a 15-year PPA with Alcoa, and the agreement is backed by a credit guarantee from the Norwegian Export Credit Guaran-tee Agency (GIEK). A procurement process is under way for wind turbines and contractors for roads, foundations and grid connection. In combination with approved zoning plans, these agreements provide the conditions for Aquila’s access to shares in the project com-pany. Construction is expected to commence before the end of the year and the wind farm is scheduled for completion in autumn 2021. The construction is fully financed by our customer.
Wind Wall, first construction in the USIn June, we announced our conclusion of a wind turbine supply agreement for our first US project in California. Eolus owns 60% of the rights to replace about 400 old wind turbines from the mid-1980s with up to 13 new turbines. The total capacity will remain largely unchanged, but the new wind farm’s
generation will be about three times higher than the former facility. This gives some in-dication of the fantastic advancements in wind turbine technology over the past few decades! The 15-year PPA that we signed with Amazon Web Services has made the project even more attractive. The divestment process has commenced. Construction start-ed in the autumn and the farm is scheduled for deployment during summer 2020. In addition to the above, agreements with customers and construction start-ups of the Bäckhammar (130 MW) and Stiga-fjellet (30 MW) projects were milestones during the fiscal year. Both projects are scheduled for deployment in early autumn 2020. That means that seven of our eight high-priority projects for 2021 have now been divested to customers. As a result, the focus on final development of the portfolio as of 2022 is a top priority for the company.
Asset management in strong growthEolus now manages wind power assets with a capacity of more than 500 MW on behalf of its customers. Asset management is show-ing strong growth and generating a continu-ous stream of revenue and cash flow for the company with less capital tied-up. In addi-tion to operational farms, agreements were also concluded for all of the farms that Eolus is currently installing. In recent years, our
strategy has been to divest essentially all our own wind turbines and invest the freed-up funds in new and modern projects under development. Because we have succeeded with that goal, our third operating segment, Electricity Generation, now has very little significance for the operations. As of the next quarter, Electricity Generation will therefore be included in the Project Develop-ment segment and not reported separately.
Due to a strong financial position, high- quality projects and highly skilled and de-dicated employees, Eolus is well-equipped to remain a leading player in the ongoing energy revolution.
PER WITALISSON Chief Executive Officer
The Sötterfällan Wind Farm
MESSAGE FROM THE CEO

Experience, expertise and a focus on profitability make Eolus an attractive partnerEolus is one of the leading wind farm developers in the Nordic region. Eolus creates value at every level of project development, establishment and operation of facilities for renewable energy and energy storage. The company offers attractive and competitive investment opportunities in the Nordic region, Baltic countries and the US to both local and international investors. Since the company’s inception in 1990, Eolus has been involved in the construction of 572 wind turbines across Sweden and Estonia, with a combined capacity of 1,044 MW. Eolus divests most of its projects to customers as turnkey facilities. At the end of the fiscal year, Eolus’s asset management organization managed 524 MW on behalf of customers.
Business conceptEolus aims to create value at every level of project development, establishment and operation of facilities for renewable energy and energy storage, and to offer attractive and competitive investment objects to both local and international investors.
Extensive experienceSince the company’s inception in 1990, Eolus has developed, installed and divested turnkey wind power facilities to investors. Eolus therefore has extensive experience and expertise in the installation of wind power facilities and a broad network of con-tacts within the framework of commenced project development through to facility completion and deployment. The company’s success and strong market position are largely attributable to its diverse and strong customer base as well as the ability to adapt the company’s business strategy to meet ex-isting demand. Eolus has established a total capacity of 1,044 MW, which is about 13% of the wind power constructed in Sweden.
Business modelEolus’s mission is to develop and install wind power facilities in favorable wind loca-tions. Projects are mainly realized through the divestment of turnkey facilities. The business model also allows parts of the proj-ect portfolio to be realized through sales of project rights for permitted projects and projects under development. Similarly, proj-ects under development may be acquired. In 2017, the Articles of Association were amended to also include activities related to other forms of renewable energy, as well as energy storage – which has broadened the range of business opportunities. The compa-ny currently conducts operations in the Nordic region, Baltic countries and the US. Eolus offers a full range of asset manage-ment services to investors, enabling carefree ownership of wind power facilities installed by either Eolus or other operators. During the year, the company had three operating segments: Project Development, Asset Management and Electricity Genera-tion. Project Development is by far the most dominant segment. The Asset Management segment is growing steadily, while the Elec-tricity Generation segment has declined in line with the strategy to reduce Eolus’s own wind power holding.
The Eolus GroupThe Group comprises the Parent Company, Eolus Vind AB (publ), as well as such wholly owned subsidiaries as Ekovind AB, Svenska Vindbolaget AB, Eolus Elnät AB, Eolus Wind Power Management AB, SIA Eolus, Eolus
EOLUS IN BRIEF
6 ANNUAL REPORT EOLUS VIND AB 2018/2019 The Kråktorpet wind farm

ANNUAL REPORT EOLUS VIND AB 2018/2019 7
Vind Norge Holding A/S, Eolus North America Inc, Eolus Oy and the sub-subsidiary OÜ Baltic Wind Energy. In addition to the above companies, the Group also includes partly owned Blekinge Offshore AB and several other companies that have been formed to manage the devel-opment of specific wind power projects. Eolus owns 56% of Blekinge Offshore. The remaining shares are owned by Vingkraft and Vindin. In December 2016, the Swedish Government decided not to grant a permit for the project under the Environmental Code. Although the activities of Blekinge Offshore have been reduced, the company will continue to monitor future potential business opportunities for the project. At August 31, 2019, Eolus’s Swedish project portfolio contained sites for 624 on-shore wind turbines with a potential capaci-ty of approximately 2,377 MW in the pre-study, project development, granted permits and establishment phases. Most projects in the foreign project portfolio are in the pre-study or project development phase, except in Norway, where Øyfjellet (Eolus’s largest permitted project to date) and Stigafjellet are currently in the establishment phase. The US project portfolio is the largest foreign portfolio in terms of volume, and also in-cludes solar-and-storage projects. Overall, the portfolio of wind power projects in coun-tries other than Sweden comprises 1,581 MW. Refer to pages 20-21 for more information about the foreign business operations, and to page 13 for more information about the project portfolio.
ObjectivesVisionEolus’s vision is to be the most profitable re-newable energy developer and an attractive business partner in the transition to a sus-tainable society.
Eolus’s overall objectives for the next three-year period (2019-2021) are: • that our stakeholders (customers, employ-
ees, suppliers and shareholders) perceive us as an attractive and leading renewable energy player in all of the markets in which we operate.
• an average return of at least 10% of equity after tax.
• to broaden the technological platform of our operations by participating in the establishment of at least one solar PV farm or energy storage facility.
• to initiate the development of new wind power projects in Nordic and Baltic coun-tries to secure a long-term and commer-cially viable portfolio for establishment from 2022 and onwards.
• to evaluate new markets with the aim of enabling establishment in at least one more geographic market from 2022.
Strategy Eolus’s core business is to install turnkey wind power facilities in favorable wind loca-tions and transfer them to customers. At present, the company is also active in early- phase solar-and-storage projects. The strategy for the company’s project development activities is to focus on proj-ects that are most likely to be realized, regardless of technology and market, and to develop them with the highest possible quality at the lowest possible cost. This in-creases opportunities for offering end- investors facilities that provide the lowest- possible cost per megawatt-hour generated
over the life span of the facility. A careful selection process based on access to wind or solar, opportunities for grid connection, and constructability in terms of roads and foun-dations is paramount, combined with a commercial focus in the early stages. This ensures that projects with the greatest po-tential receive sufficient priority. To assess wind resources, Eolus conducts wind mea-surements for all large projects. Eolus nor-mally secures user rights through leasehold agreements, rather than owning the land on which turbines are installed. Eolus’s strategy is to offer landowners a commercial lease that is normally paid as an annual lease equivalent to a certain percentage of the value of the electricity generated by the facility. In some projects, neighboring land-owners are also offered lease revenue.
We take responsibility for the transition to a sustainable society. We act responsibly in our contact with authorities, local residents, customers and shareholders.
We strive for dialog and engagement with stakeholders affected by
our wind power projects and offer opportunities
for investment in renewable energy.
By acting in a consistent manner in
regard to responsibility, participation and results,
we will inspire the trust of shareholders, customers,
banks, authorities, land owners and the public.
Our income statement is positive and our balance sheet shows financial strength. With our wind power facilities, we also aim to offer our customers a profitable investment and favorable terms for the landowners affected.
RESULTS C
ONFID
ENC
E
EOLUS’S
CORE VALUES
EOLUS IN BRIEF
RES
PO
NSIBILITY COMM
ITMEN
T
MARKET
The global energy market is undergoing a major shift, driven by political ambitions to reduce greenhouse gas emissions and eco-nomic motives. The rapidly declining cost of establishing renewable energy sources, such as wind power and solar PV, is driving the trend toward an increasingly higher share of renewables in the energy mix. This is strictly for economic reasons, as the costs per mega-watt-hour from solar and wind are the low-est, or among the lowest, in many markets The argument that wind and solar are too expensive is no longer valid. The shift is now moving faster than many predicted and according to the New Energy Outlook 2019 report by Bloomberg New Energy Finance (BNEF), zero-carbon sources will account for two-thirds of the power generation mix by 2050, compared with today’s systems, in which fossil fuels account for two-thirds of the mix.
Innovators will winAccording to BNEF, wind (26%) and solar (22%) combined will make up almost 50% of world electricity in 2050. Hydropower will only show modest growth, while nuclear power will stay flat. The prices for energy storage systems will decline steeply and, in combination with systems for demand- side flexibility, help wind and solar reach more than 80% penetration in some mar-kets. According to BNEF, Europe will be one of these markets and is generally considered the market that will transition fastest. BNEF predicts that 77% of investments will go to renewables until 2050, and wind will attract most investment. Coal will be the biggest loser and not even increases in Asia can stop coal from peaking globally in the mid-2020s. BNEF also expects there will be more wind and solar electricity in the world than coal-fired
electricity by 2032. The declining cost of wind and solar will reduce the need for sub-sidies in the market and technologies will be able to stand on their own feet moving forward. This trend is challenging existing business models and presenting new busi-ness opportunities for anyone who wishes to embrace change, rather than sticking to past truths and old business models.
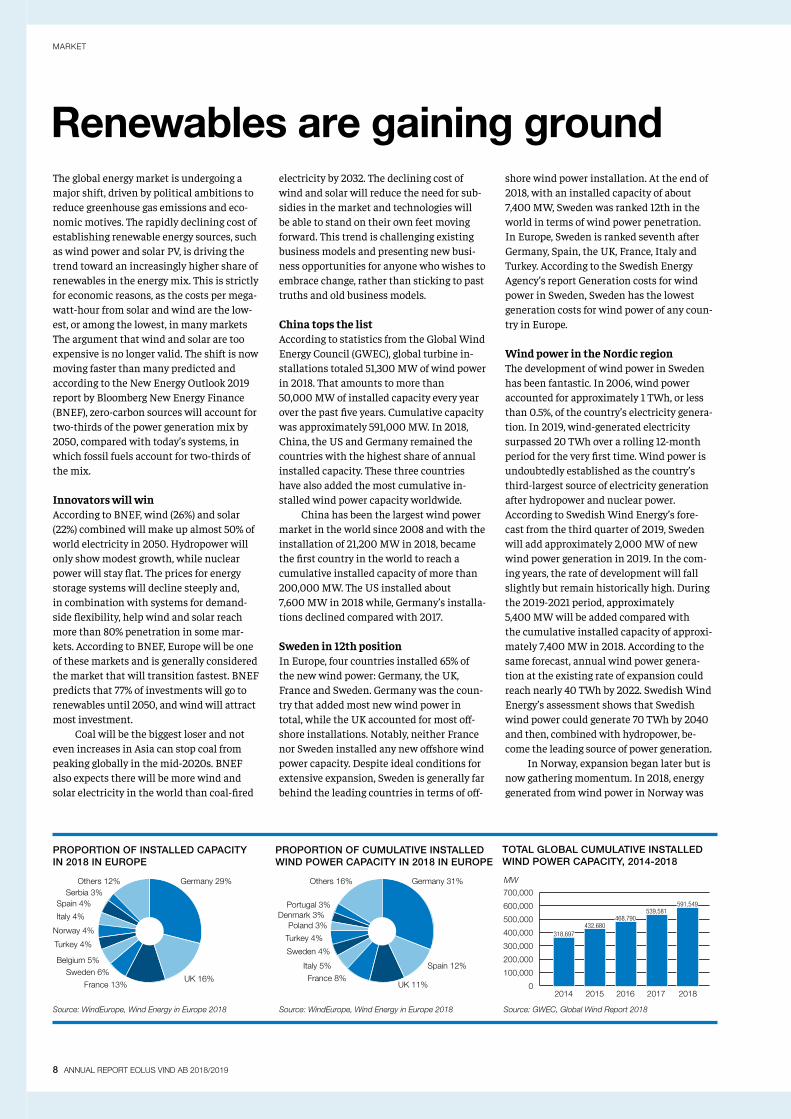
China tops the listAccording to statistics from the Global Wind Energy Council (GWEC), global turbine in-stallations totaled 51,300 MW of wind power in 2018. That amounts to more than 50,000 MW of installed capacity every year over the past five years. Cumulative capacity was approximately 591,000 MW. In 2018, China, the US and Germany remained the countries with the highest share of annual installed capacity. These three countries have also added the most cumulative in-stalled wind power capacity worldwide. China has been the largest wind power market in the world since 2008 and with the installation of 21,200 MW in 2018, became the first country in the world to reach a cumulative installed capacity of more than 200,000 MW. The US installed about 7,600 MW in 2018 while, Germany’s installa-tions declined compared with 2017.
Sweden in 12th positionIn Europe, four countries installed 65% of the new wind power: Germany, the UK, France and Sweden. Germany was the coun-try that added most new wind power in total, while the UK accounted for most off-shore installations. Notably, neither France nor Sweden installed any new offshore wind power capacity. Despite ideal conditions for extensive expansion, Sweden is generally far behind the leading countries in terms of off-
shore wind power installation. At the end of 2018, with an installed capacity of about 7,400 MW, Sweden was ranked 12th in the world in terms of wind power penetration. In Europe, Sweden is ranked seventh after Germany, Spain, the UK, France, Italy and Turkey. According to the Swedish Energy Agency’s report Generation costs for wind power in Sweden, Sweden has the lowest generation costs for wind power of any coun-try in Europe.
Wind power in the Nordic regionThe development of wind power in Sweden has been fantastic. In 2006, wind power accounted for approximately 1 TWh, or less than 0.5%, of the country’s electricity genera-tion. In 2019, wind-generated electricity surpassed 20 TWh over a rolling 12-month period for the very first time. Wind power is undoubtedly established as the country’s third-largest source of electricity generation after hydropower and nuclear power. According to Swedish Wind Energy’s fore-cast from the third quarter of 2019, Sweden will add approximately 2,000 MW of new wind power generation in 2019. In the com-ing years, the rate of development will fall slightly but remain historically high. During the 2019-2021 period, approximately 5,400 MW will be added compared with the cumulative installed capacity of approxi-mately 7,400 MW in 2018. According to the same forecast, annual wind power genera-tion at the existing rate of expansion could reach nearly 40 TWh by 2022. Swedish Wind Energy’s assessment shows that Swedish wind power could generate 70 TWh by 2040 and then, combined with hydropower, be-come the leading source of power generation. In Norway, expansion began later but is now gathering momentum. In 2018, energy generated from wind power in Norway was
Renewables are gaining ground
8 ANNUAL REPORT EOLUS VIND AB 2018/2019
PROPORTION OF CUMULATIVE INSTALLED WIND POWER CAPACITY IN 2018 IN EUROPE
Germany 31%
Spain 12%
UK 11%France 8%
Italy 5%
Sweden 4%
Turkey 4%
Poland 3%Denmark 3%
Portugal 3%
Others 16%
Source: WindEurope, Wind Energy in Europe 2018 Source: WindEurope, Wind Energy in Europe 2018 Source: GWEC, Global Wind Report 2018
PROPORTION OF INSTALLED CAPACITY IN 2018 IN EUROPE
Germany 29%
UK 16%France 13%
Sweden 6%Belgium 5%
Turkey 4%
Norway 4%
Italy 4%
Spain 4%Serbia 3%
Others 12%
2014 2015 2016 2017 2018
MW
432,680
0
100,000
200,000
300,000
400,000
500,000
600,000
700,000
318,697
468,790539,581
591,549
TOTAL GLOBAL CUMULATIVE INSTALLED WIND POWER CAPACITY, 2014-2018

ANNUAL REPORT EOLUS VIND AB 2018/2019 9
3.9 TWh and by early 2019, additional capacity of 7 TWh was under construc-tion.
Good chance for net exportsIn recent years, more electricity has been generated than consumed in the Swedish market, enabling Sweden to be-come a net exporter of electricity and create another export industry. Norway and Sweden combined have major po-tential to become Europe’s green battery, with large-scale carbon-free electricity generation that can replace the dirty fos-sil-fuel energy used by other countries. Further opportunities to export electric-ity are positive for Sweden and Norway, making expansion of the transmission capacity even more important, not only within these countries but also to other countries, in addition to the transmis-sion opportunities that already exist or
are under construction to Germany and the UK, for example. The future poten-tial to store electricity will present major opportunities for Sweden and Norway to increase their share of intermittent energy sources, such as wind and solar.
Renewables include more than windSince 2017, Eolus’s Articles of Associa-tion have included other types of renew-able energy in addition to wind power, as well as energy storage. This is a natu-ral change in order to be part of a trend in which solar power, for example, accounts for an increasingly larger and more important share of the global ener-gy mix. The rapidly falling costs of re-newable generation from wind and solar are presenting exciting combination solutions in terms of both generation and storage, as well as market offers with two independent sources of energy.
MARKET
NET GENERATION OF ELECTRICITY IN SWEDEN, 2014-2018
TWh 2014 2015 2016 2017 2018
Hydropower 64.2 73.9 61.2 63.9 61.0
Nuclear power 62.2 54.3 60.5 63.0 65.8
Wind power 11.5 16.6 15.4 17.3 16.6
Cogeneration 6.9 7.1 7.8 7.9 8.1
Cogeneration in industry 5.9 5.9 5.9 6.1 5.9
Condensation power 0.5 0.4 0.6 1.0 1.0
Total net generation 151.2 158.3 151.5 159.1 158.4
TRENDS IN THE SWEDISH WIND POWER MARKET:
• Fewer but larger establishments
• Foreign investors account for a major share of the expansion
• Power purchase agreements (PPA) are becoming more common
• Sharp decline in establishment costs
• Major need for professional asset management for facilities, including long-term service agreements
Electricity storage – falling costs and new opportunitiesElectricity can be stored in a variety of forms including batteries, hydrogen and pumped storage. The electrification of vehicle fleets has led to a focus on the development and cost of both small and industrial-scale batteries. Costs are falling fast, in line with the trend for renewable electricity generation from solar and wind. Between 2010 and 2016 alone, prices for lithium-ion batteries decreased by approximately 75%, according to McKinsey, and will continue to fall. Rocky Mountain Institute predicts that prices for lithium-ion batteries will fall to USD 87 per kWh by 2025, compared with USD 1,000 per kWh in 2010.
More reliable electricity systems with large-scale storageThe rapidly falling costs of electricity storage are presenting opportunities for a major trans-formation of the electricity market. In addition to small-scale battery storage for vehicles and households, large-scale battery storage is also possible. This type of storage can con-tribute to increased intermittent renewable energy generation, provide opportunities for balancing capacity, reduce consumption peaks and improve the reliability of electricity systems by simply replacing generation facili-ties because of their availability.
Source: Statistics Sweden
In 2019, wind-generated electricity surpassed 20 TWh over a rolling 12-month period for
the very first time.
20
The Nylandsbergen wind farm

Power purchase agreements – a growing trend in the Nordic regionPower purchase agreements (PPA) are a growing trend in the Swedish and Eu-ropean electricity markets. A corporate PPA is a contract between an electricity generator and an electricity purchaser to buy electricity directly from specific facili-ties, usually from wind power or photo-voltaic (PV) facilities. The contractual terms can vary from five years and up-wards, with fixed predetermined prices for all electricity generated by the facility. Long-term contracts with predetermined prices provide security for electricity pur-chasers and clarity in relation to costs during the contractual term. They also provide security for both the owner of the facility and the builder by defining the revenue terms.
Highly significant agreementsThis type of contract is already common in the US, and becoming increasingly common in Europe, particularly for facili-ties owned by institutional investors that do not have electricity generation as their core business. PPAs have played a pivotal role in the rapid expansion of wind power in the Nordic market and will continue to do so for the continued financing of the expansion of facilities for renewable electricity generation. In the Nordic market, such companies as Google, Norsk Hydro, Vattenfall, Alcoa and Amazon Web Services have actively sourced wind power facilities for PPAs. According to BNEF, the volume of cor-porate PPAs reached 6,873 MW globally in 2018. 60% of these agreements were concluded in North America, and the largest purchasers were AT&T, Walmart and Facebook. Google, which has signed two PPAs with Eolus in Sweden, is the largest corporate buyer of renew-able electricity in the world.
10 ANNUAL REPORT EOLUS VIND AB 2018/2019
Rapid technological advancementsModern wind power technology is relatively new compared with hydro or nuclear power. Technological improvements in recent years include longer rotor blades, higher towers and higher generating capacity, resulting in more efficient turbines that can harness more energy from the wind. Rapid technological advancements combined with more efficient construction methods, for example, have reduced the investment cost per megawatt-hour by approxi-mately 75% since the advent of wind power in the 1980s. Onshore wind power is one of the cheapest methods for adding new generation capacity. The cost of establishing new wind power has been lower than the cost of establishing new nuclear power for several years. Offshore wind power holds major potential in both the Nordic region and globally, and plays a key role in the shift toward more renewable electricity generation. Once high, the cost of establishing offshore wind power is now falling rapidly and some of the winning bids in auctions conducted recently in Europe have not required subsidies.
MARKET
Batteries in focusThe rising share of intermittent energy sources in the energy mix is also creating a growing need to identify smart solutions for storing energy. New market conditions are presenting opportunities for a range of storage solutions. In general, both large-scale industrial batteries and small-scale flexible battery solutions are expected to offer major opportunities for storage. Just like wind and solar, battery costs are falling fast and helping to change market condi-tions. Eolus’s first introduction to tech-nologies other than wind took place in September 2018 when an early-phase solar-plus- storage project was acquired in south-western US. The project comprises up to 500 MW of solar capacity and 250 MW of battery storage.
Profitable establishmentsEolus’s objective is to continue pushing down costs per megawatt-hour. The aim is to reach a position where no extra support is needed to make the establishment of new facilities profitable for investors in the markets where Eolus is currently active or may enter in the future. Investments are now being made in the Nordic region with-out the presence of subsidies. Value-chain efficiencies throughout the lifespan of a wind power project are essential for meet-ing investors’ ROI requirements. By signifi-cantly reducing the costs of wind power establishment, projects can be profitable for end-investors in a range of markets.
The Sötterfällan wind farm
Rotor diameter 44 48 82 112 136 150 (m)
Hub height 50 65 98 94 122 125 (m)
Generator output 0.6 0.85 2.0 3.3 3.8 4.2 (MW)
Year 1999 2004 2009 2014 2019 2020
TECHNICAL DEVELOPMENT OF WIND TURBINES ESTABLISHED BY EOLUS

ANNUAL REPORT EOLUS VIND AB 2018/2019 11
CUSTOMER GROUPS
Since its inception in 1990, Eolus has built trust and credibility with customers, land-owners, shareholders, creditors and employ-ees. Creating and maintaining a high level of trust is a prerequisite for attracting both capital and the expertise required for con-tinued growth and new business. With a flexible business model and strong balance sheet, Eolus has adapted to market fluctua-tions and existing market conditions to best meet investors’ past and future demands. The customer base is broad and diverse – from global investors in the form of insur-ance companies, pension funds, infrastruc-ture funds and energy companies, to small businesses and private individuals. Due to the trend toward larger projects, the vast majority of sales in recent years have been generated by major investors. Eolus offers asset management services to all customer groups.
Institutional investorsInternational institutional investors, such as various types of funds, insurance companies and reinsurance companies, now account for the majority of investments in the Nordic wind power market. Ownership of public in-frastructure, such as wind power and PV facilities, is driven by long-term investments with relatively stable returns and cash flows. This, in turn, generates security in compa-nies’ commitments to their customers in reinsurance and pension investment seg-ments. Anyone who invests in renewable electricity generation is also supporting the transition to fossil-free electricity genera-tion, which reduces CO2 emissions and, in the long term, reduces risk in other climate- related investments and insurance commit-ments. In recent years, major global players such as Aquila Capital, Munich Re, KGAL, Allianz, Black Rock, Mirova and HG Capital have made extensive investments in Swed-ish wind power.
Major consumersMajor consumers are companies and organi-zations that consume large amounts of elec-tricity but do not have energy generation as their core business. This customer group is growing – partly because electricity from wind power provides secure, low and stable electricity costs over time, but also because wind power is a sustainable option.
More and more companies want to be recognized for their role in the transition to a fossil-free future. Investments can take the form of direct investments, or long-term PPAs, which are common in the US. A PPA is a contract whereby a party agrees to pur-chase the power generated by a specific facil-ity for a certain period of time and can there-by contribute to expanded capacity without owning any facilities. This type of agreement has become increasingly common in the Nordic region in recent years and Eolus, for example, has entered into two PPAs with Google and one with Alcoa. In the US, Eolus has entered into a PPA with Amazon Web Services.
Energy companiesOnshore wind power is one of the most cost-efficient methods for adding new gener-ation capacity and is therefore attractive to companies with energy generation as their core business. In addition to adding cost- efficient generation capacity, by investing in wind power, energy companies are able to offer customers green electricity from their own facilities. Over the years, Eolus has divested both turnkey facilities and opera-tional turbines to both Swedish and inter-national energy companies.
Public-sector investorsPublic-sector investors are mainly munici-palities, county councils/regions and munic-ipal companies. Ownership of electricity generation facilities creates predictability and control over costs for electricity con-sumption in their own operations. Invest-ments in wind power contribute to sustain-
able development and thus meet the environmental and energy objectives that many public-sector players have set for their operations.
Wind turbine cooperativesEolus has been selling shares in wind tur-bines to customers almost since the compa-ny was founded, enabling thousands of pri-vate individuals and companies to become wind power shareholders. This cooperative model has also been a critical success factor for Eolus over the years. However, new mar-ket conditions and a greater focus on large establishments have led to a decline in the number of shared-ownership projects being established.
Clear customer benefitsWith nearly 30 years of experience and par-ticipation in the installation of 572 wind tur-bines with a capacity of 1,044 MW at August 31, 2019, Eolus has built up expertise across the entire value chain and a financial posi-tion that makes the company a strong and stable partner. Eolus’s project portfolio pres-ents major opportunities to offer facilities tailored to the specific needs of individual investors at the lowest possible cost per megawatt-hour. Eolus’s full range of asset management services ensures professional management that maximizes revenue for both large and small investors. As one of the largest players in the industry, Eolus can push investment and operating expenses down, which benefits investors in all cus-tomer groups.
Benefits for everyone in the broad and diverse customer base
The Jenåsen wind farm

EOLUS IN BRIEF
12 ANNUAL REPORT EOLUS VIND AB 2018/2019
Biggest climate gains at lowest possible cost per megawatt-hour
The aim of project development is to deploy renewable energy projects that are possible to establish at the lowest possible cost per megawatt-hour. That is a basic requirement for meeting the strong demand for sustain-able and profitable investments. In addition to contributing to attractive investment op-tions, socio-economic benefits are created in the form of an opportunity, in harmony with other social interests, to contribute to envi-ronmentally friendly electricity generation. In turn, that creates conditions for the tran-sition that is necessary for meeting the challenge of climate change. This should be carried out as profitably as possible for the company, which requires a clear focus on the projects with the greatest chance of being realized, regardless of technology or market.
High-priority projectsEolus has an extensive project portfolio with wind power projects in various phases. Overall, this provides good opportunities for meeting various categories of investor requirements and demands. Within the framework of project development activi-ties, a number of projects have been classi-fied as high priority in the coming years, three of which have been completed and handed over. The remaining projects on the list are described on pages 16-19. Alongside of efforts to complete and divest these high-priority projects in the coming years, new high-priority projects are also being advanced for subsequent establishment in the markets in which Eolus operates.
Four phasesProjects have four phases: pre-study, project development, construction and divestment of the facilities. Projects are realized either by selling the project rights combined with a construction contract for installation of the wind farm, or by establishing wind tur-bines that are then divested as turnkey facil-ities to investors. In both cases, revenue is recognized over time in accordance with the degree of completion, which means that revenue and expenses are reported over the life of the project. Sales and earnings vary between individual quarters and fiscal years, depending on the pace of wind farm instal-lation, and the structure of the agreements.
Costs and financingThe most costly item when establishing a facility is the actual wind turbines. Eolus mainly purchases turbines in EUR, which entails an element of risk. This is managed with currency futures to hedge the cash flow in foreign currency (by raising loans in EUR) or by divestment to customers in EUR. Over-
The Kråktorpet wind farm12 ANNUAL REPORT EOLUS VIND AB 2018/2019
PROJECT DEVELOPMENT
ANNUAL REPORT EOLUS VIND AB 2018/2019 13
all, the wind turbines account for 65-75% of the costs for a turnkey facility. Other costs include project development, road and foun-dation construction, and grid connection. Project development activities are mainly financed with advance payments from customers, construction loans or equity. Eolus is currently conducting project devel-opment in Sweden, Norway, Finland, the US and Baltic countries. Establishments are under way in Sweden, Norway and the US.
Turbines are getting biggerDue to new market conditions in terms of technological advancements, electricity prices and investors, Eolus is now establish-ing fewer but larger facilities, with larger wind turbines. The largest wind turbines currently under installation are nine Vestas V150-4.2 MW wind turbines for the Bäck-hammar wind farm. The largest wind tur-bines ever installed by Eolus are the Vestas V136-3.8 MW model for the Nylandsbergen wind farm.
The company also offers sales of project rights only, and acquires project rights for projects in various phases of development. In addition, Eolus can provide various types of consultancy services related to the estab-lishment of wind power facilities.
Generation and storageAt the company’s Annual General Meeting in 2017, the Articles of Association were amended to include project development, installation and operation of facilities for renewable energy and energy storage. Eolus’s business model was thereby expanded into more areas than wind power. In September 2018, the subsidiary, Eolus North America Inc, subsequently acquired a solar-plus- storage project in the western US region. This early-phase project has a planned ca-pacity of 500 MW and storage capacity of 250 MW. Over the past five fiscal years, project development activities have accounted for 92-99% of Eolus’s overall revenue.
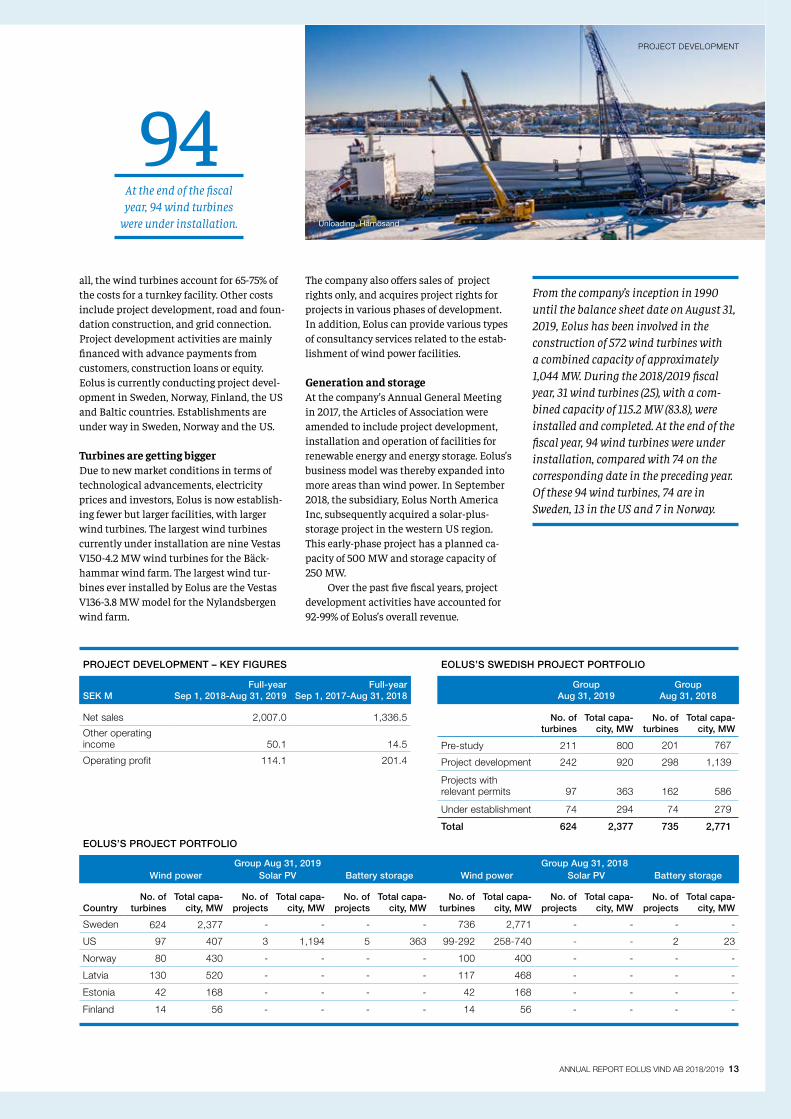
94At the end of the fiscal year, 94 wind turbines
were under installation.
PROJECT DEVELOPMENT – KEY FIGURES
SEK MFull-year
Sep 1, 2018-Aug 31, 2019Full-year
Sep 1, 2017-Aug 31, 2018
Net sales 2,007.0 1,336.5
Other operating income 50.1 14.5
Operating profit 114.1 201.4
EOLUS’S SWEDISH PROJECT PORTFOLIO
Group Aug 31, 2019
Group Aug 31, 2018
No. of turbines
Total capa-city, MW
No. of turbines
Total capa-city, MW
Pre-study 211 800 201 767
Project development 242 920 298 1,139
Projects with relevant permits 97 363 162 586
Under establishment 74 294 74 279
Total 624 2,377 735 2,771
EOLUS’S PROJECT PORTFOLIO
Group Aug 31, 2019 Group Aug 31, 2018Wind power Solar PV Battery storage Wind power Solar PV Battery storage
CountryNo. of
turbinesTotal capa-
city, MWNo. of
projectsTotal capa-
city, MWNo. of
projectsTotal capa-
city, MWNo. of
turbinesTotal ca pa-
city, MWNo. of
projectsTotal capa-
city, MWNo. of
projectsTotal capa-
city, MW
Sweden 624 2,377 - - - - 736 2,771 - - - -
US 97 407 3 1,194 5 363 99-292 258-740 - - 2 23
Norway 80 430 - - - - 100 400 - - - -
Latvia 130 520 - - - - 117 468 - - - -
Estonia 42 168 - - - - 42 168 - - - -
Finland 14 56 - - - - 14 56 - - - -
From the company’s inception in 1990 until the balance sheet date on August 31, 2019, Eolus has been involved in the construction of 572 wind turbines with a combined capacity of approximately 1,044 MW. During the 2018/2019 fiscal year, 31 wind turbines (25), with a com-bined capacity of 115.2 MW (83.8), were installed and completed. At the end of the fiscal year, 94 wind turbines were under installation, compared with 74 on the corresponding date in the preceding year. Of these 94 wind turbines, 74 are in Sweden, 13 in the US and 7 in Norway.
Unloading, Härnösand
PROJECT DEVELOPMENT

14 ANNUAL REPORT EOLUS VIND AB 2018/2019
PROJECT DEVELOPMENT – PROJECTS ESTABLISHED DURING THE YEAR
Projects established during the year During the fiscal year, Eolus completed and handed over three wind farms with a total in-stalled capacity of 115 MW. A total of 31 wind turbines were established, compared with 25 wind turbines with a capacity of 84 MW in
the preceding fiscal year. The wind farms were established in Electricity Price Areas 2 and 3, and divestment agreements had been signed for all three farms when construction started.
INSTALLED DURING THE 2018/2019 FISCAL YEAR
Name Municipality Capacity in MW
Anneberg Tidaholm 10.8
Nylandsbergen Sundsvall 68.4
Sötterfällan Jönköping 36.0
Total 115.2
AnnebergThis wind farm is located in the Municipality of Tidaholm, in an upland agricultural land-scape about 250 meters above sea level. There were already a number of wind turbines in the area. The original permit was for six wind turbines but after an optimization process with newer and larger turbines, three Vestas V136-3.6 MW were established. When the wind farm was completed and handed over in January 2019, the first Vestas V136 wind turbines were deployed in Sweden. Eolus manages the facility’s assets on behalf of KGAL
No. of turbines: 3 Vestas V136-3.6 MWHub height: 105 meters Installed capacity: 10.8 MWOwner: KGAL
Anneberg
Sötterfällan
Nylandsbergen
14 ANNUAL REPORT EOLUS VIND AB 2018/2019

EOLUS IN BRIEF
ANNUAL REPORT EOLUS VIND AB 2018/2019 15
NylandsbergenThe Nylandsbergen wind farm is situated in a cluster of wind farms that Eolus has estab-lished, or is currently establishing, in the Municipality of Sundsvall (Electricity Price Area 2). The total capacity of the three wind farms (Kråktorpet, Nylandsbergen and Jenåsen) is 311 MW, of which Nylandsbergen accounts for approximately 68 MW. The wind farm is connected to the national grid substation in Nysäter, which was dimen-sioned and installed for transmission of the wind power capacity that Eolus and other players are building in the area. The wind farm site is located in forest areas with altitudes ranging from 300 to 390 meters above sea level. Eolus entered into a divestment agreement with Aquila Capital in December 2017, and the wind farm was hand-ed over in August 2019. Eolus manages the facility’s assets on behalf of Aquila Capital.
No. of turbines: 18 Vestas V136-3.8 MWHub height: 112 meters Installed capacity: 68.4 MWOwner: Aquila Capital
SötterfällanThe Sötterfällan wind farm site is located about 14 km west of Jönköping in Electricity Price Area 3. The turbines have been placed at heights ranging from 265 to 305 meters above sea level at a treeline altitude, sur-rounded by relatively flat terrain. Lake Vättern is located to the east, at a signifi-cantly lower altitude than the wind farm. Eolus entered into a divestment agree-ment with KGAL in December 2017, and the wind farm was handed over in August 2019. Eolus manages the facility’s assets on behalf of KGAL
No. of turbines: 10 Vestas V136-3.6 MWHub height: 122 meters Installed capacity: 36 MWOwner: KGAL
ANNUAL REPORT EOLUS VIND AB 2018/2019 15
PROJECT DEVELOPMENT – PROJECTS ESTABLISHED DURING THE YEAR
16 ANNUAL REPORT EOLUS VIND AB 2018/2019
PROJECT DEVELOPMENT – HIGH-PRIORITY PROJECTS
Eolus’s high-priority projectsMarket conditions are changing fast in terms of technological advancements, elec-tricity prices and investors. Eolus’s strategic focus is to concentrate on the development, divestment and establishment of several high-priority projects in the coming years, meaning those with the best potential to be realized at the lowest cost per megawatt- hour. With fewer but larger established wind farms, fluctuations between periods will be greater in relation to wind turbines installed, capital tied-up, sales and earnings. At the same time, fluctuations will decrease due to the recognition of revenue using the percentage of completion accounting method.
Continuous status reportsTo highlight information about the status of these high-priority projects, they will be reported under a separate heading in Eolus’s interim reports. Corresponding information
is presented on Eolus’s website. The website is updated following the publication of quar-terly reports, or due to other significant proj-ect events that have been announced in a press release.
Current statusThe following projects are currently a top priority for the coming years. However, this compilation does not rule out the establish-ment of other projects from Eolus’s high- quality project portfolio that meet investor demands and requests. The Jenåsen, Nylands - bergen and Sötterfällan wind farms are no longer included in this compilation of high- priority projects. Jenåsen was completed and handed over during the 2017/2018 fiscal year, while Nylandsbergen and Sötterfällan were completed and handed over in 2018/2019.
HIGH-PRIORITY PROJECTS
Project LocationNo. of
turbinesCapacity,
MWEstimated
generation, GWhPlanned
deployment Comments
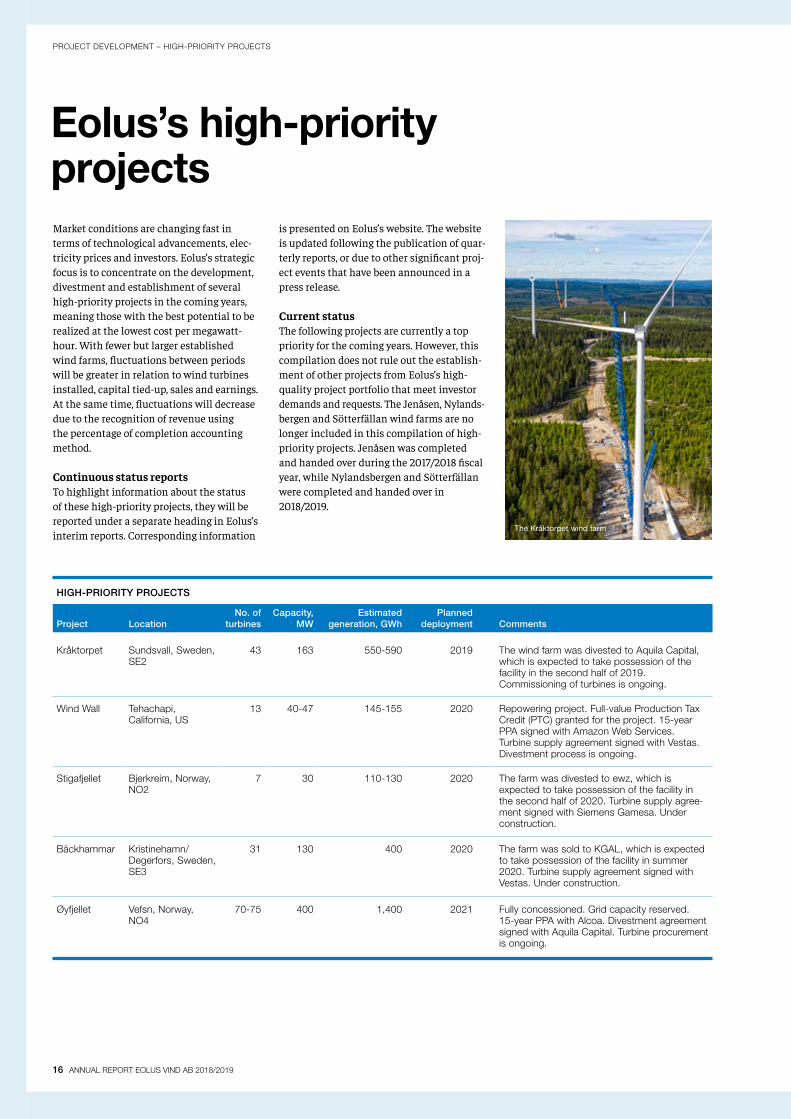
Kråktorpet Sundsvall, Sweden, SE2
43 163 550-590 2019 The wind farm was divested to Aquila Capital, which is expected to take possession of the facility in the second half of 2019. Commissioning of turbines is ongoing.
Wind Wall Tehachapi, California, US
13 40-47 145-155 2020 Repowering project. Full-value Production Tax Credit (PTC) granted for the project. 15-year PPA signed with Amazon Web Services. Turbine supply agreement signed with Vestas. Divestment process is ongoing.
Stigafjellet Bjerkreim, Norway, NO2
7 30 110-130 2020 The farm was divested to ewz, which is expected to take possession of the facility in the second half of 2020. Turbine supply agree-ment signed with Siemens Gamesa. Under construction.
Bäckhammar Kristinehamn/ Degerfors, Sweden, SE3
31 130 400 2020 The farm was sold to KGAL, which is expected to take possession of the facility in summer 2020. Turbine supply agreement signed with Vestas. Under construction.
Øyfjellet Vefsn, Norway, NO4
70-75 400 1,400 2021 Fully concessioned. Grid capacity reserved. 15-year PPA with Alcoa. Divestment agreement signed with Aquila Capital. Turbine procurement is ongoing.
The Kråktorpet wind farm

ANNUAL REPORT EOLUS VIND AB 2018/2019 17
PROJECT DEVELOPMENT – HIGH-PRIORITY PROJECTS
ØyfjelletØyfjellet is Eolus’s first Norwegian project and the largest permitted project that the company has ever developed. The project is located just south of Mosjøen in the Munici-pality of Vefsn. The project site comprises 55 km² of montane area, with altitudes rang-ing from 600 to 800 meters above sea level and good wind resources.
Extended and optimized Originally a local initiative, Eolus acquired the rights to the project in 2012. The original concession from the Norwegian Water Resources and Energy Directorate (NVE) was for 330 MW, but this was extended to 400 MW in October 2018. Due to the rapid advancements in wind turbine technology, the extension will result in the establish-ment of fewer but larger wind turbines than the original concession. In the optimization
of the farm and its layout, the actual Øy-fjellet site was excluded and the 70-75 wind turbines will be installed on other parts of the project site. Deployment is scheduled for late 2021, which means that the project will qualify for inclusion in the Swedish- Norwegian Electricity Certificate System.
Agreements enable locally generated electricityIn March 2018, Eolus signed a 15-year PPA with Alcoa Norway AS for all electricity generated by the completed wind farm. The wind farm will subsequently supply Alcoa’s production facility in Mosjøen with local renewable electricity. As part of the arrange-ment, Eolus has signed a power guarantee with the Norwegian Export Credit Guaran-tee Agency (GIEK). The guaranteed amount is EUR 256 M.
Buyer: Aquila Capital In July 2019, Eolus concluded an agreement with Aquila Capital regarding divestment of the wind farm. This agreement involves a conditional sale of 100% of the shares in the subsidiary that owns all of the rights to establish the wind farm, including the 15-year PPA with Alcoa, and an outsourcing agreement whereby Eolus will manage construction of the wind farm on behalf of Aquila Capital.
The photo has been modified.
The photo has been modified.
ANNUAL REPORT EOLUS VIND AB 2018/2019 17
EOLUS IN BRIEF
18 ANNUAL REPORT EOLUS VIND AB 2018/2019
KråktorpetWith a capacity of 163 MW, this is the largest facility ever established by Eolus, and means that Eolus has now installed over 600 wind turbines and reached more than 1,200 MW of installed capacity. The wind farm site is located in the Municipality of Sundsvall (Electricity Price Area 2) about 50 km west of Sundsvall/Timrå. The wind farm has been established in forest areas with altitudes ranging from 400 to 450 meters above sea level. The area features good wind resources and is sparsely populated, which has en-abled the establishment. The wind farm comprises 43 Vestas V136-3.8 MW turbines. The Kråktorpet, Jenåsen (79 MW) and Nylandsbergen (68 MW) wind farms make up Eolus’s Sundsvall cluster of 311 MW. The establishment of these wind farms also re-quired construction of a new national grid substation in Nysäter to ensure sufficient transmission capacity. As well as enabling the construction of projects developed by Eolus, the substation has also meant that other players in the area can establish wind power facilities.
Part of the Sundsvall clusterAquila Capital purchased Kråktorpet in December 2017. Eolus will manage the facili-ty’s assets on behalf of Aquila Capital, which has signed a 15-year PPA with Vattenfall for the electricity generated by Kråktorpet.
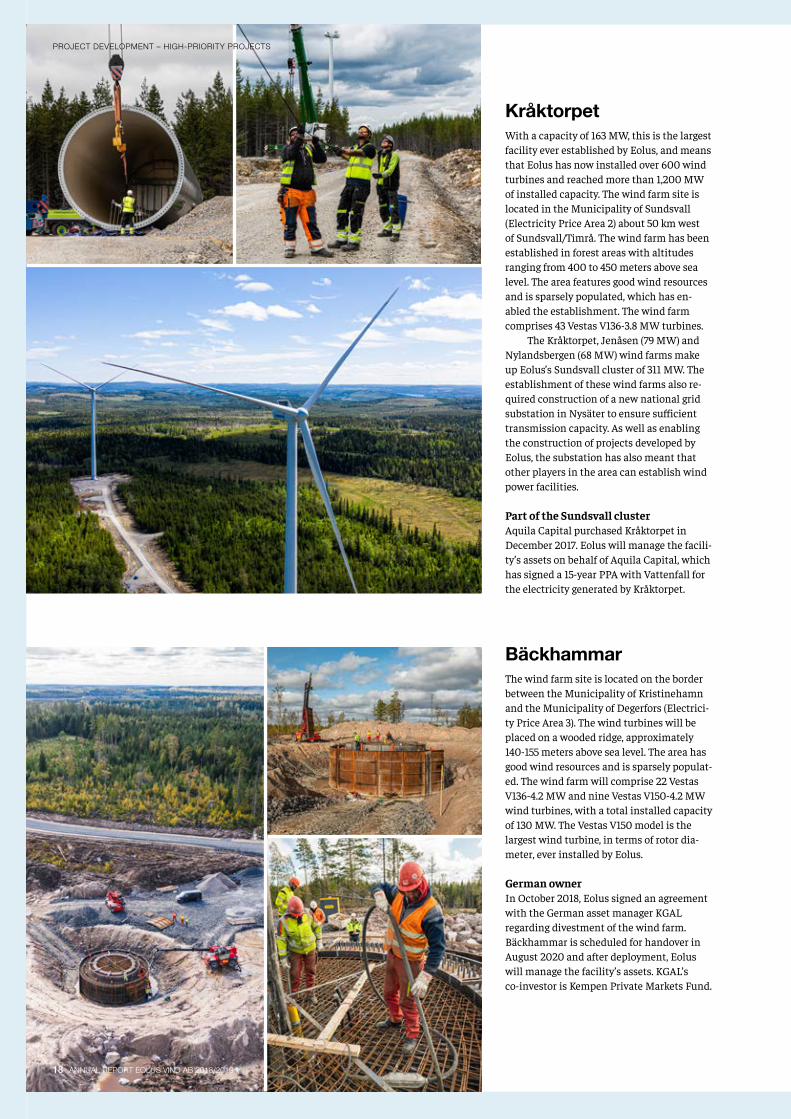
BäckhammarThe wind farm site is located on the border between the Municipality of Kristinehamn and the Municipality of Degerfors (Electrici-ty Price Area 3). The wind turbines will be placed on a wooded ridge, approximately 140-155 meters above sea level. The area has good wind resources and is sparsely populat-ed. The wind farm will comprise 22 Vestas V136-4.2 MW and nine Vestas V150-4.2 MW wind turbines, with a total installed capacity of 130 MW. The Vestas V150 model is the largest wind turbine, in terms of rotor dia-meter, ever installed by Eolus.
German ownerIn October 2018, Eolus signed an agreement with the German asset manager KGAL regarding divestment of the wind farm. Bäckhammar is scheduled for handover in August 2020 and after deployment, Eolus will manage the facility’s assets. KGAL’s co-investor is Kempen Private Markets Fund.
18 ANNUAL REPORT EOLUS VIND AB 2018/2019
PROJECT DEVELOPMENT – HIGH-PRIORITY PROJECTS

EOLUS IN BRIEF
ANNUAL REPORT EOLUS VIND AB 2018/2019 19
StigafjelletStigafjellet is the first wind farm that Eolus has established in Norway. The wind farm is located some 35 km south-east of Stavanger, relatively close to the Norwegian coast. The wind farm site is mainly hilly, with altitudes ranging from 395 to 440 meters above sea level, and has good wind resources. When the farm is completed, which is scheduled for August 2020, it will comprise seven Siemens Gamesa SWT-DD-130 4.3 MW wind turbines, with an installed capacity of approximately 30 MW. The turbines estab-lished in Stigafjellet will be the largest, in terms of capacity, ever installed by Eolus. When Stigafjellet is completed, it will be handed over to ewz, which signed a di-vestment agreement with Eolus in July 2018. Eolus will manage the facility’s assets on behalf of ewz.
Wind WallIn December 2016, Eolus acquired 60% of the Wind Wall project in Tehachapi, Cali-fornia, in the US. This is a repowering proj-ect, in which old turbines are being replaced by new modern turbines. The farm currently comprises about 400 old wind turbines with an installed capacity of approximately 36 MW. The old wind turbines will be re-placed by up to 13 new wind turbines, with a total capacity of up to 47 MW. Electricity generation in the new wind farm will be approximately 3-3.5 times higher than in the current facility. Wind Wall is a textbook example of advancements in wind turbine technology
Long-term agreement with AmazonEolus signed turbine supply agreements with Vestas for up to 13 V126 model turbines with a capacity of 3.45-3.8 MW per turbine. The project received the full amount of a PTC and Eolus’s subsidiary, Eolus North America Inc (ENA), signed a long-term PPA with Amazon Web Services, Inc (AWS).
PROJECT DEVELOPMENT – HIGH-PRIORITY PROJECTS
ANNUAL REPORT EOLUS VIND AB 2018/2019 19

20 ANNUAL REPORT EOLUS VIND AB 2018/2019
PROJECT DEVELOPMENT – EOLUS AROUND THE WORLD
In addition to Sweden, Eolus also develops projects in Norway, the US, Latvia, Estonia and Finland. Projects are currently under establishment in the US and Norway. At the balance sheet date of August 31, 2019, 13 wind turbines were under establishment in the US and seven in Norway. These are also the two markets that Eolus currently considers most interesting for the company in addition to Sweden. As the company de-velops projects and completes facilities in
countries other than Sweden, the operations will become less dependent on a geographic breakdown and it will be easier to see where the most profitable projects can be estab-lished regardless of technology. As with project development activities in Sweden, Eolus will be able to start its own projects, or acquire projects under develop-ment in the markets where the company is active. Projects outside Sweden are generally in earlier phases of development than most
projects in the Swedish portfolio, which is understandable because Sweden is Eolus’s original market. These markets are diverse in terms of wind capacity currently under establishment, or under development. The countries also have varying conditions in terms of their geography, infrastructure, grid capacity and support systems for renewable electricity generation.
Eolus around the world
NorwayNorway joined the Swedish-Norwegian Electri-city Certificate System on January 1, 2012. Facili-ties must be deployed by the end of 2021 to qual-ify for inclusion in the Electricity Certificate System. Projects in the Norwegian market are often characterized by challenging terrain and complex infrastructure, but also by high average wind speeds, enabling high generation rates in established facilities. Eolus began operating in Norway in 2012 following the acquisition of the Øyfjellet project.
Time is a key aspectIn recent years, the pace of development has been high in Norway and many facilities are un-der establishment. One reason for the high pace of development is the ambition to commission wind farms before the Electricity Certificate System stops accepting new facilities. According to statistics from NVE, Norway’s installed wind power capacity was approximately 1,425 MW in October 2018. In October 2019, installed capacity amounted to 2,130 MW with an estimated annu-al generation of 6.75 TWh.
Eolus’s largest to dateIn the 2017/2018 fiscal year, Eolus signed its first wind farm divestment agreement in this market, regarding divestment of the Stigafjellet project, comprising 30 MW, to ewz. In the 2018/2019 fiscal year, a conditional divestment agreement was signed with Aquila Capital to sell 100% of the shares in the subsidiary that owns all of the rights to establish Øyfjellet. Øyfjellet is Eolus’s larg-est-ever permitted project, regardless of market. The Norwegian project portfolio currently comprises a potential capacity of 430 MW, of which the largest project is Øyfjellet. Eolus’s ambition is to expand the portfolio, which could involve the start-up of completely new projects as well as acquisitions of projects under develop-ment.
20 ANNUAL REPORT EOLUS VIND AB 2018/2019

ANNUAL REPORT EOLUS VIND AB 2018/2019 21
PROJECT DEVELOPMENT – EOLUS AROUND THE WORLD
USEolus established operations in the US during the 2015/2016 fiscal year. The opera-tions are conducted by the subsidiary Eolus North America Inc. The project portfolio in the US comprises both wind, solar and stor-age projects, which means that Eolus has its broadest portfolio of technologies in this market. Eolus has up to 13 wind turbines with a capacity of up to 47 MW under establish-ment in the Wind Wall project in California. The project is covered by a PPA with Amazon Web Services. In addition, the wind port-folio comprises about 400 MW. The port-folio also includes solar and storage pro jects, including the first solar-and- storage project acquired in September 2018. This early- phase project in the western US region features 500 MW of solar PV generation and 250 MW of battery storage.
Changed incentives and a higher tempoThe current federal support system for wind energy, Production Tax Credits (PTC), will be phased out in 2019. A tax credit is provided for the first ten years of electricity genera-tion and the amount depends on when the project was started. Wind facilities that commenced construction in 2015 and 2016 qualify for the full tax credit amount. The tax credit is phased down the closer to 2019 that a facility commences construction. In addi-tion to the federal PTC incentive, a number of US states have offensive targets for the development of renewable energy. The US has the highest amount of in-stalled wind power capacity after China. In 2018, 7,588 MW of new wind power was add-ed, representing an 8% increase compared with 2017. In the first three quarters of 2019, new capacity additions rose 123% compared with the same period in 2018. According to statistics from AWEA, 22,651 MW was under construction at the end of the third quarter of 2019.
The five states with the most wind power in-stalled to date are Texas, Iowa, Oklahoma, Kansas and California. According to statis-tics from the AWEA, Texas has the largest installed capacity by far, with 27,000 MW at the end of the third quarter of 2019, which is over 18,000 MW more than Iowa.
Strong solar PV in a heterogeneous marketIn the US, solar PV accounted for 36% of all new electricity generating capacity addi-tions in the first half of 2019, according to statistics from the Solar Energy Industries Association (SEIA). The installations com-prise both utility-scale solar PV farms and small-scale privately owned establishments. The US market should really be seen as several different markets because of its geog-raphy, and the regulatory diversity in regard to permitting, grid connection, electricity trading and renewable energy targets. Eolus has initially chosen to focus on the western US region.
Finland and the Baltic countriesOf the other markets in which Eolus is active, the country with the most wind power in-stalled is Finland. According to statistics from WindEurope, Finland’s installed capac-ity was 2,041 MW at the end of 2018. Eolus’s project portfolio in Finland comprises 56 MW.
Investments in Dobele and TukumsNo new wind power was added in Latvia and Estonia in 2018. Latvia has excellent wind conditions in both the western and central regions of the country, which offers great potential for wind power. At present, Eolus is one of the few active project developers in
the country and, at the end of the fiscal year, had a project portfolio with an estimated capacity of approximately 468 MW. In 2019, the Latvian Environmental Agency present-ed its conclusions on the environmental im-pact assessment carried out for the Dobele and Tukums wind farms, and granted a per-mit to construct 35 wind turbines. Of these 35 turbines, 22 may be built in Tukums and 13 in Dobele. The next stage of the potential construction process is to receive approval for the projects from local authorities. According to statistics from WindEurope, Latvia’s total installed wind power capacity was 66 MW at the end of 2018.
Delays caused by radar disruptionsIn Estonia, severe restrictions on the con-struction of large wind turbines due to interference with the Armed Forces’ radar activities have led to a decline in project development activities, thereby making investments impossible. According to Wind-Europe’s statistics, Estonia’s total installed capacity is 310 MW. 1.6 MW of this capacity is divided between two wind turbines in-stalled and owned by Eolus on the island of Saaremaa, where Eolus also owns land. Eolus’s project portfolio in Estonia amounts to 168 MW.
22 ANNUAL REPORT EOLUS VIND AB 2018/2019
PROJECT DEVELOPMENT – DEVELOPMENT ACTIVITIES
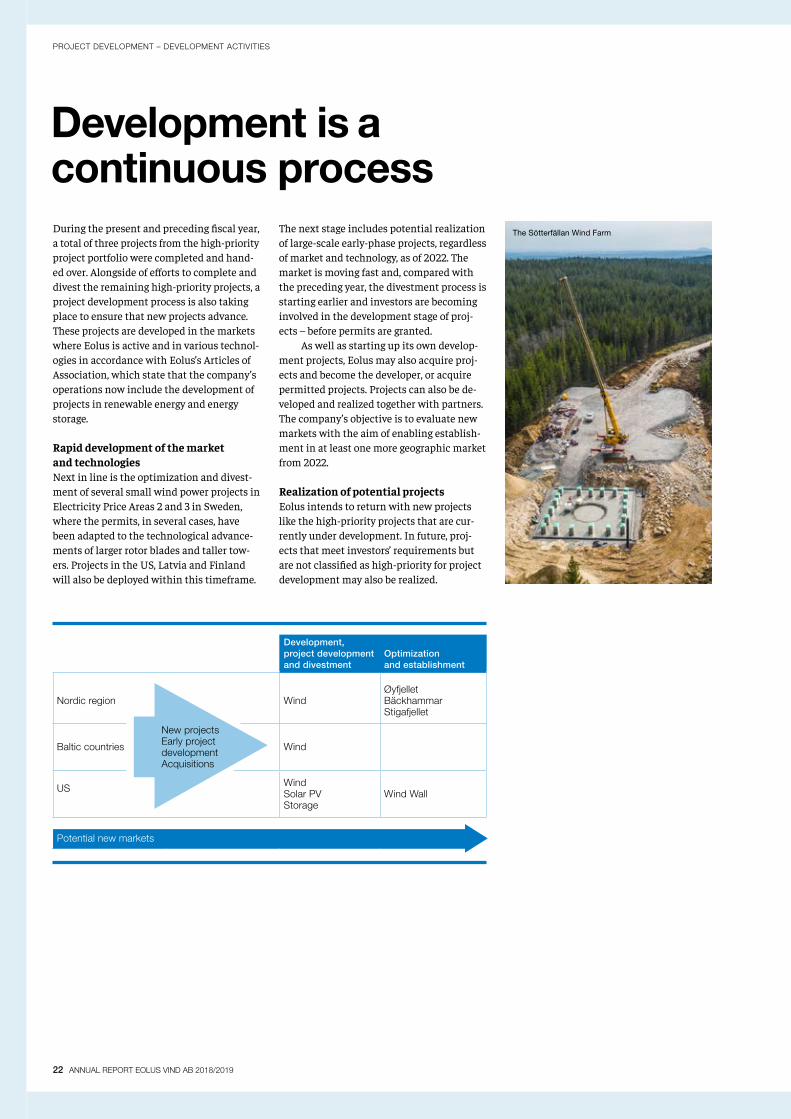
Development is a continuous process During the present and preceding fiscal year, a total of three projects from the high-priority project portfolio were completed and hand-ed over. Alongside of efforts to complete and divest the remaining high-priority projects, a project development process is also taking place to ensure that new projects advance. These projects are developed in the markets where Eolus is active and in various technol-ogies in accordance with Eolus’s Articles of Association, which state that the company’s operations now include the development of projects in renewable energy and energy storage.
Rapid development of the market and technologiesNext in line is the optimization and divest-ment of several small wind power projects in Electricity Price Areas 2 and 3 in Sweden, where the permits, in several cases, have been adapted to the technological advance-ments of larger rotor blades and taller tow-ers. Projects in the US, Latvia and Finland will also be deployed within this timeframe.
The next stage includes potential realization of large-scale early-phase projects, regardless of market and technology, as of 2022. The market is moving fast and, compared with the preceding year, the divestment process is starting earlier and investors are becoming involved in the development stage of proj-ects – before permits are granted. As well as starting up its own develop-ment projects, Eolus may also acquire proj-ects and become the developer, or acquire permitted projects. Projects can also be de-veloped and realized together with partners. The company’s objective is to evaluate new markets with the aim of enabling establish-ment in at least one more geographic market from 2022.
Realization of potential projectsEolus intends to return with new projects like the high-priority projects that are cur-rently under development. In future, proj-ects that meet investors’ requirements but are not classified as high-priority for project development may also be realized.
Development, project development and divestment
Optimization and establishment
Nordic region WindØyfjelletBäckhammarStigafjellet
Baltic countries Wind
US WindSolar PVStorage
Wind Wall
Potential new markets
New projectsEarly project developmentAcquisitions
The Sötterfällan Wind Farm
EOLUS IN BRIEF
ANNUAL REPORT EOLUS VIND AB 2018/2019 23 ANNUAL REPORT EOLUS VIND AB 2018/2019 23
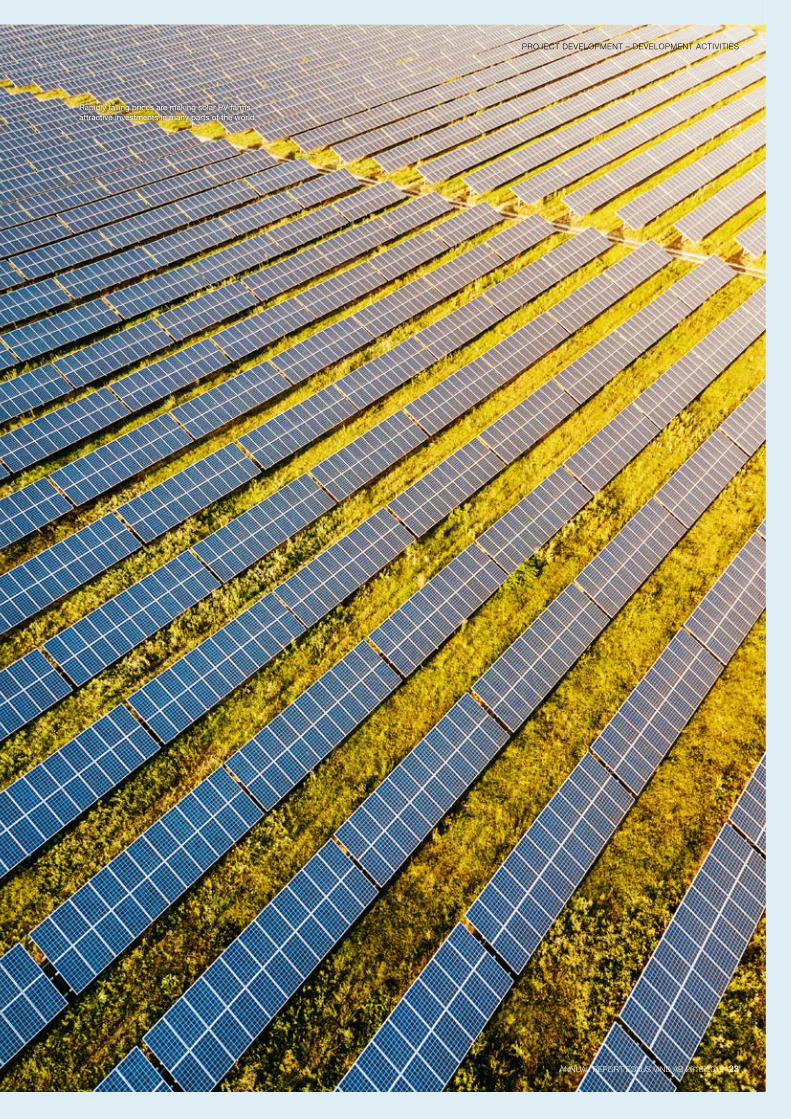
Rapidly falling prices are making solar PV farms attractive investments in many parts of the world.
PROJECT DEVELOPMENT – DEVELOPMENT ACTIVITIES

24 ANNUAL REPORT EOLUS VIND AB 2018/2019
ASSET MANAGEMENT
Eolus offers wind power owners of various sizes a complete package of asset manage-ment services to maximize the revenue generated by their facilities. The goal of our asset management services is to ensure that the owner receives professional manage-ment of all aspects related to the operation of a facility, including surveillance, control, monitoring, administration and contact with the owner’s contracted service supplier. As asset manager, Eolus works closely with a range of service suppliers. In partnership with them, Eolus ensures that the facility’s availability is high and that downtime is minimized.
Expertise centerEolus’s driving force is that we want our customers to see the company as a partner that will do anything to maximize availabili-ty and minimize operating expenses over the life span of their facility. Eolus also takes care of all other practical and administrative aspects. Since its inception in 1990, Eolus has built up extensive expertise in wind farm operation. The company has developed and packaged this experience and expertise, and offers it to customers. This has also meant that Eolus’s asset management de-partment has evolved into a center for exper-tise, and can offer knowledge on a consulta-
tive basis, both externally to turbine customers and manufacturers, and internal-ly within the organization during the project development and installation phases.
Established source of energy with major potentialNot only does wind power hold a firm posi-tion in a total energy mix, it is also one of the fastest-growing sources of energy. This has also led a more professional approach to, and view of, asset management for wind power facilities, regardless of their size. Eolus sees significant market demand, from inter-national investors as well as other players, for professional management of operational facilities. Investors whose core operations are neither wind power nor energy genera-tion offer strong growth potential. Parties without any business operations in the rele-vant geogra phic market also offer potential. Institutional investors that invest in the Nordic market often belong to both of these categories.
Managed wind power is growingDuring the fiscal year, the Nylandsbergen, Sötterfällan and Anneberg wind farms in-creased the volume of Eolus’s asset manage-ment portfolio from 415 MW to 524 MW, up approximately 26%. 521 MW of these wind
power assets is managed on behalf of exter-nal customers. At the end of the fiscal year, asset management agreements had also been signed with external customers for the Kråktorpet (163 MW), Stigafjellet (30 MW), Bäckhammar (130 MW) and Øyfjellet (400 MW) wind farms, which are scheduled for deployment between 2019 and 2021. When these farms are deployed, the estimat-ed annual generation of Eolus’s managed assets will be more than 3.9 TWh, compared with 1.6 TWh at the end of the fiscal year. This operating segment provides recurring, stable and long-term revenue streams for Eolus.
Outsourced management for maximum revenue and problem-free ownership
At August 31, 2019, Eolus had signed asset management
agreements for 1,250 MW. These have either been deployed,
or will be deployed between 2019 and 2021.
1,250
24 ANNUAL REPORT EOLUS VIND AB 2018/2019
Operations center, Halmstad

EOLUS IN BRIEF
ANNUAL REPORT EOLUS VIND AB 2018/2019 25
MW managed capacity.
MW managed capacity, signed but not yet deployed.
At the end of the fiscal year, Eolus had asset management assignments on both its own behalf and that of custom-ers of 524 MW, plus signed agreements for an additional 723 MW. Investors that have chosen Eolus’s asset management concept include Aquila Capital, ewz, Munich Re, KGAL, Tolvmanstegen Drift AB, Mirova/European Investment Bank and a range of public-sector investors.
Secure and profitable. A competent asset management partner Eolus’s services in this segment offer technical operation and all administration of a facility, such as responsibility for elec-trical operations, occupational health and safety, accounting and financial state-ments and insurance. The company also serves as the point of contact for the facility’s relevant suppliers, regulators and insurance companies. Eolus’s staff check and monitor the facility via the company’s operations center, follow up planned and unplanned service, make regular visits to the site, conduct annual inspections of the facility and ensure compliance with regulatory conditions and requirements. Customers can purchase either a total solution or some of the services offered by Eolus and this offer is not limited to the Swedish market.
ASSET MANAGEMENT
1 Estonia
The Nylandsbergen wind farm
163159
40
4515
254531 4
13025
2630
4524
24
14
ELECTRICITY PRICE AREA 4
Malmö
ELECTRICITY PRICE AREA 3
Stockholm
ELECTRICITY PRICE AREA 2
Sundsvall
ELECTRICITY PRICE AREA 1
Luleå
ASSET MANAGEMENT – KEY FIGURES
SEK MFull-year
Sep 1, 2018-Aug 31, 2019Full-year
Sep 1, 2017-Aug 31, 2018
Net sales 20.0 16.3
Other operating income 8.1 6.8
Operating profit 2.6 2.5
Managed turbines, MW 524 415
Signed agreements, not yet deployed farms, MW 723 309
400
26 ANNUAL REPORT EOLUS VIND AB 2018/2019
ELECTRICITY GENERATION
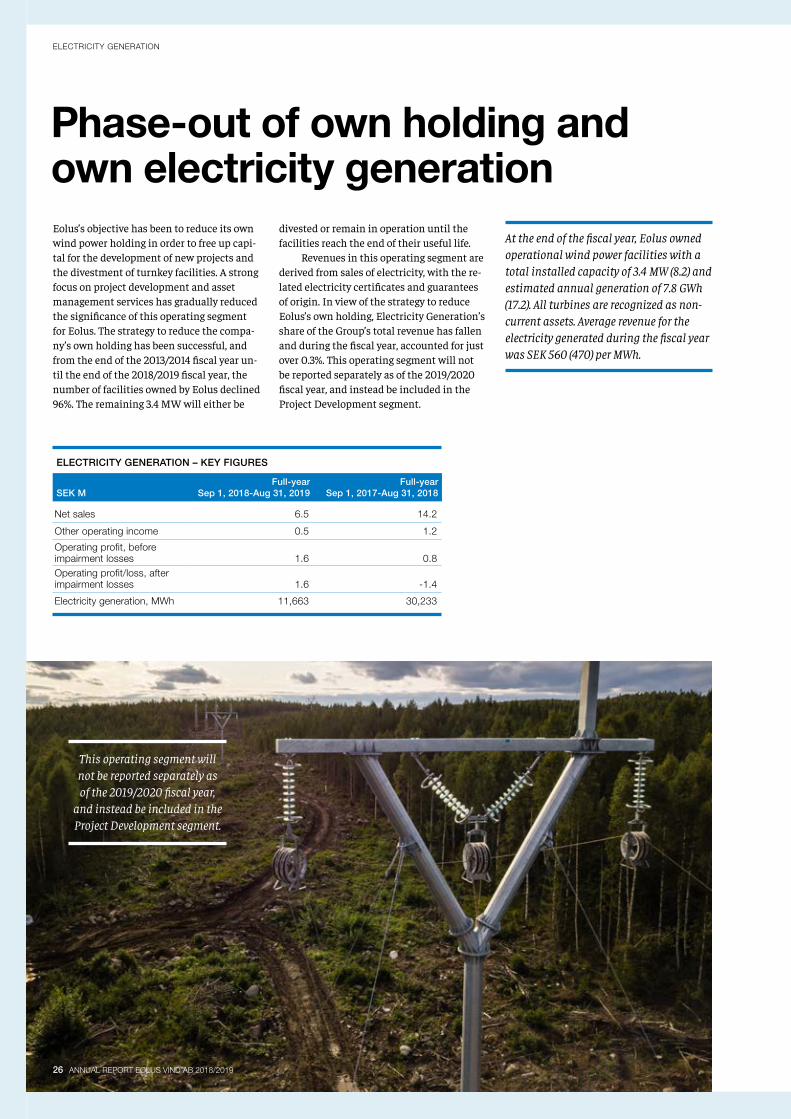
Phase-out of own holding and own electricity generation Eolus’s objective has been to reduce its own wind power holding in order to free up capi-tal for the development of new projects and the divestment of turnkey facilities. A strong focus on project development and asset management services has gradually reduced the significance of this operating segment for Eolus. The strategy to reduce the compa-ny’s own holding has been successful, and from the end of the 2013/2014 fiscal year un-til the end of the 2018/2019 fiscal year, the number of facilities owned by Eolus declined 96%. The remaining 3.4 MW will either be
divested or remain in operation until the facilities reach the end of their useful life. Revenues in this operating segment are derived from sales of electricity, with the re-lated electricity certificates and guarantees of origin. In view of the strategy to reduce Eolus’s own holding, Electricity Generation’s share of the Group’s total revenue has fallen and during the fiscal year, accounted for just over 0.3%. This operating segment will not be reported separately as of the 2019/2020 fiscal year, and instead be included in the Project Development segment.
This operating segment will not be reported separately as of the 2019/2020 fiscal year,
and instead be included in the Project Development segment.
At the end of the fiscal year, Eolus owned operational wind power facilities with a total installed capacity of 3.4 MW (8.2) and estimated annual generation of 7.8 GWh (17.2). All turbines are recognized as non- current assets. Average revenue for the electricity generated during the fiscal year was SEK 560 (470) per MWh.
26 ANNUAL REPORT EOLUS VIND AB 2018/2019
ELECTRICITY GENERATION – KEY FIGURES
SEK MFull-year
Sep 1, 2018-Aug 31, 2019Full-year
Sep 1, 2017-Aug 31, 2018
Net sales 6.5 14.2
Other operating income 0.5 1.2
Operating profit, before impairment losses 1.6 0.8Operating profit/loss, after impairment losses 1.6 -1.4
Electricity generation, MWh 11,663 30,233

EOLUS IN BRIEF
ANNUAL REPORT EOLUS VIND AB 2018/2019 27
Unloading, Härnösand
ANNUAL REPORT EOLUS VIND AB 2018/2019 27
28 ANNUAL REPORT EOLUS VIND AB 2018/2019
SUSTAINABILITY
The company’s operations touch all parts of the sus-tainability concept: environmental, economic and social sustainability. Eolus therefore has a corporate social responsibility – in addition to generating a profit for our shareholders, offering cost-efficient solutions to our customers and providing meaningful, stimulating work for our employees. This responsible approach is not contradictory. On the contrary – it is a competitive advantage and a prerequisite for our future success.
Socio-economic benefitsThe transition to a sustainable society is one of today’s most important issues. Eolus considers the company and its operations an important part of the infrastruc-ture development that is benefiting society and creat-ing a range of jobs and employment opportunities. Electricity generation from wind is also helping to make our society more sustainable. Wind power is a popular source of energy in Sweden, and the third- largest source of electricity in Sweden after hydro-power and nuclear power. In 2019, wind-generated electricity surpassed 20 TWh over a rolling 12-month period for the very first time. Swedish Wind Energy predicts that wind power capacity will reach almost 40 TWh by 2022. Wind power will play an increasing-ly important role in the transition to a sustainable en-ergy system, where the political target is 100% renew-able electricity generation by 2040.
Built-in value creationEolus has been a leading Nordic player in the transi-tion to renewable energy since 1990. The company has driven the trend toward higher efficiency and has extensive knowledge of where and how wind farms should be planned for optimal electricity generation while showing consideration for other community interests. Value creation is inherent to our long ex-perience – including the ability to account for people, the landscape, the environment and society across the entire value chain. With a large order backlog and attractive projects under development, Eolus will continue to contribute to the transition in both Sweden and other countries. Eolus aims to be a respected company that cre-ates value for its stakeholders. The company’s employ-ees are expected to act properly, fairly and honestly. The same standards are imposed on consultants, sup-pliers and other business partners. Impartiality shall prevail in all business relationships. Eolus aims for a high degree of transparency when communicating with shareholders and society in general. Our vision is to be the most profitable wind power developer and an attractive business partner in the transition to a sustainable society.
Sustainability – part of Eolus’s offering
Sustainability targetsGiven the material topics with high importance identified by the company, Eolus’s targets for the coming fiscal year are as follows.
Climate impacts of the company’s activitiesEolus does not conduct any manufacturing or construction activities with own staff. Wind turbines and other components for the operation of facilities for renewable electri-city generation and transmission are purchased from long-established manufacturers. Eolus has a limited ability to influence greenhouse gas emissions in these stages. Like other parts of society, however, the company’s activities are a source of greenhouse gas emissions. These range from the environmental impact of offices, traveling with private vehicles or public transport, and various types of purchasing. Gathering knowledge about the current situation provides opportunities for making well-informed decisions about the company’s climate impact.
Target: In 2019/2020, map the company’s carbon footprint and create an action plan proposal.
Fulfillment of the targets in the preceding year’s Sustainability ReportIn Eolus’s first Sustainability Report (for the 2017/2018 fiscal year), three sustainability topics were identified and prioritized. These were the supply chain, an attractive employer and anti-corruption. Within the framework of these material topics, three targets were determined for 2018/2019. A summary of the company’s target fulfillment is presented below.
The supply chain
Target: In 2018/2019, prepare a Code of Conduct for the companies that are contracted for the establishment of facilities installed by Eolus.
Target fulfillment: This target was fully achieved when Eolus’s Board of Directors, at a Board meeting in October 2019, adopted the Code of Conduct drafted by Group Management. This Code of Conduct applies to employees as well as Eolus’s sub-contractors.
Attractive employer
Target: In 2018/2019, Group Management will assess the need for a separate HR position and should a need exist, propose the duties involved in such a position.
Target fulfillment: In March 2019, a part-time (30%) HR position was introduced after Group Management confirmed the need for such a position in the company. Since assuming the role, the HR Manager has completed an HR mapping process, created guidelines for the payroll process and salary setting, created a new OHS plan and started working on a diversity plan and action plan to combat discrimination.
Anti-corruption
Target: In 2018/2019, the company will create anti-corruption guidelines and set a target of zero corruption cases per year.
Target fulfillment: Efforts to create anti-corruption guidelines were incorporated into the Code of Conduct process and the guidelines have therefore been adopted.

ANNUAL REPORT EOLUS VIND AB 2018/2019 29
SUSTAINABILITY
UN Sustainable Development GoalsOur work with sustainable development is based on the 2030 Agenda for Sustainable Development and its 17 Sustainable Develop-ment Goals (SDGs) set by the United Nations General Assembly in 2015. The SDGs affect all sectors of society, and the business sector has a key role to play in their achievement. Eolus’s business concept embraces several SDGs, such as combating climate change, ensuring access to sustainable energy for all, and promoting decent working conditions and sustainable economic growth.
Climate action
Take urgent action to combat climate change and its impacts
Through its business concept of developing, installing and managing facilities for renew-able energy and energy storage, Eolus, as a company, is contributing to the social transi-tion. By continuously striving to establish facilities at the lowest cost per megawatt- hour, Eolus is creating attractive investment opportunities for our customers. This was initially confined to Sweden, but Eolus has also installed two wind turbines in Estonia, and has 13 wind turbines under installation in the US and seven wind turbines under in-stallation in Norway.
Affordable and clean energy
Ensure access to affordable, reliable, sustainable and modern energy for all
Continued technological improvements and reduced costs for renewable energy are fun-damental for reaching the target of sustain-able energy for all. Eolus does not develop or manufacture technology, but contributes to these advancements by adopting new tech-nologies and continuously seeking innova-tive business solutions that suit the needs of our customers. As one of the leading Nordic project developers, Eolus has been first to establish new wind turbine models in Sweden on several occasions.
Decent work and economic growth
Promote sustained, inclusive and sustainable economic growth, full and productive employ-ment and decent work for all
As a company, Eolus strives to create value not only for its shareholders and employees, but also for society as a whole. Since the company’s inception in 1990, Eolus has only posted negative results for one fiscal year, which has helped to build a strong and healthy company.
Eolus is a knowledge-intensive company with a small-scale organization. This means that the experience, knowledge, creativity and commitment of our employees is im-portant for the company, and for the develop-ment of Eolus’s market offering. Achieving this target requires a corporate culture in which every employee is able to find a bal-ance between work, life and personal devel-opment. Our corporate culture also enables us to recruit and retain the best employees.
Sustainability ReportEolus’s Sustainability Report has been pre-pared as a separate document. The Sustain-ability Report, and this Annual Report, are available on the company’s website www.eolusvind.com When preparing the first Sustainability Report in the preceding fiscal year, the company performed a materi-ality assessment to identify the most im-portant sustainability topics for Eolus and where the company has the greatest impact. This year’s Sustainability Report has contin-ued to build on these efforts by adding one new target, and also includes a presentation of Eolus’s target fulfillment.
ANNUAL REPORT EOLUS VIND AB 2018/2019 29
The Jenåsen wind farm

EOLUS IN BRIEF
30 ANNUAL REPORT EOLUS VIND AB 2018/2019
The Bäckhammar wind farm
30 ANNUAL REPORT EOLUS VIND AB 2018/2019
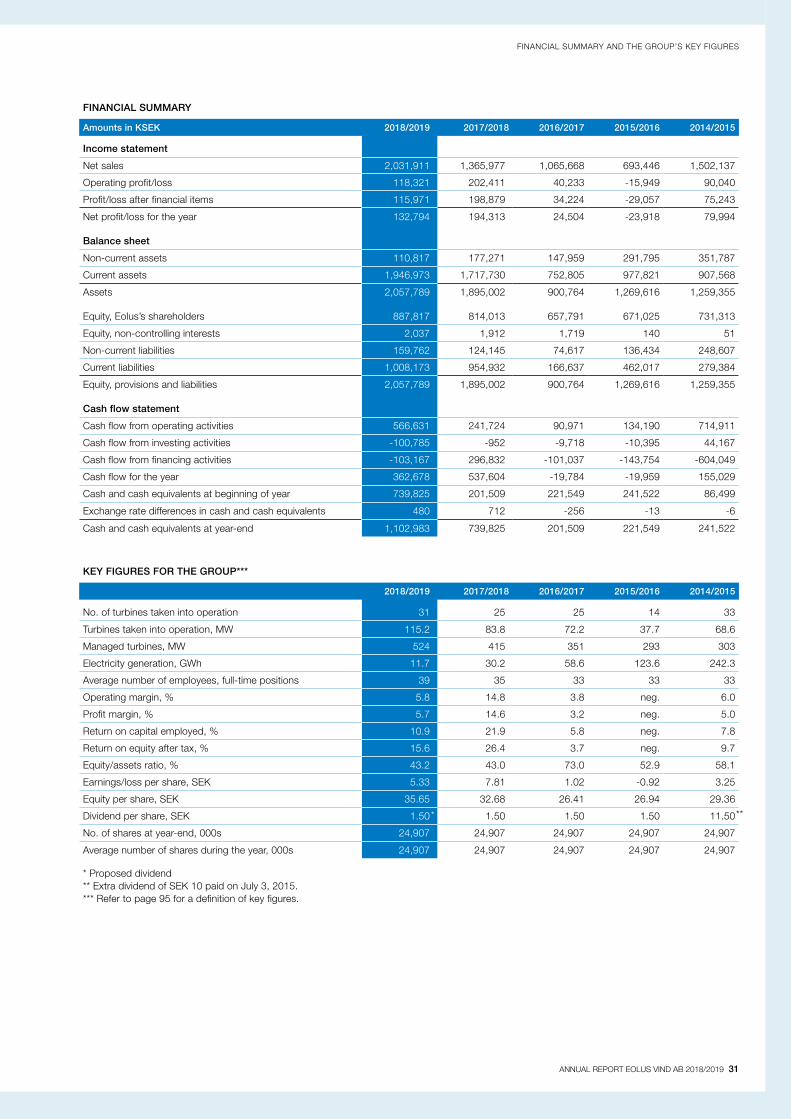
ANNUAL REPORT EOLUS VIND AB 2018/2019 31
FINANCIAL SUMMARY AND THE GROUP’S KEY FIGURES
FINANCIAL SUMMARY
Amounts in KSEK 2018/2019 2017/2018 2016/2017 2015/2016 2014/2015
Income statement
Net sales 2,031,911 1,365,977 1,065,668 693,446 1,502,137
Operating profit/loss 118,321 202,411 40,233 -15,949 90,040
Profit/loss after financial items 115,971 198,879 34,224 -29,057 75,243
Net profit/loss for the year 132,794 194,313 24,504 -23,918 79,994
Balance sheet
Non-current assets 110,817 177,271 147,959 291,795 351,787
Current assets 1,946,973 1,717,730 752,805 977,821 907,568
Assets 2,057,789 1,895,002 900,764 1,269,616 1,259,355
Equity, Eolus’s shareholders 887,817 814,013 657,791 671,025 731,313
Equity, non-controlling interests 2,037 1,912 1,719 140 51
Non-current liabilities 159,762 124,145 74,617 136,434 248,607
Current liabilities 1,008,173 954,932 166,637 462,017 279,384
Equity, provisions and liabilities 2,057,789 1,895,002 900,764 1,269,616 1,259,355
Cash flow statement
Cash flow from operating activities 566,631 241,724 90,971 134,190 714,911
Cash flow from investing activities -100,785 -952 -9,718 -10,395 44,167
Cash flow from financing activities -103,167 296,832 -101,037 -143,754 -604,049
Cash flow for the year 362,678 537,604 -19,784 -19,959 155,029
Cash and cash equivalents at beginning of year 739,825 201,509 221,549 241,522 86,499
Exchange rate differences in cash and cash equivalents 480 712 -256 -13 -6
Cash and cash equivalents at year-end 1,102,983 739,825 201,509 221,549 241,522
KEY FIGURES FOR THE GROUP***
2018/2019 2017/2018 2016/2017 2015/2016 2014/2015
No. of turbines taken into operation 31 25 25 14 33
Turbines taken into operation, MW 115.2 83.8 72.2 37.7 68.6
Managed turbines, MW 524 415 351 293 303
Electricity generation, GWh 11.7 30.2 58.6 123.6 242.3
Average number of employees, full-time positions 39 35 33 33 33
Operating margin, % 5.8 14.8 3.8 neg. 6.0
Profit margin, % 5.7 14.6 3.2 neg. 5.0
Return on capital employed, % 10.9 21.9 5.8 neg. 7.8
Return on equity after tax, % 15.6 26.4 3.7 neg. 9.7
Equity/assets ratio, % 43.2 43.0 73.0 52.9 58.1
Earnings/loss per share, SEK 5.33 7.81 1.02 -0.92 3.25
Equity per share, SEK 35.65 32.68 26.41 26.94 29.36
Dividend per share, SEK 1.50 1.50 1.50 1.50 11.50
No. of shares at year-end, 000s 24,907 24,907 24,907 24,907 24,907
Average number of shares during the year, 000s 24,907 24,907 24,907 24,907 24,907
* Proposed dividend ** Extra dividend of SEK 10 paid on July 3, 2015.*** Refer to page 95 for a definition of key figures.
* **

32 ANNUAL REPORT EOLUS VIND AB 2018/2019
SHARE AND OWNERSHIP STRUCTURE
Eolus’s share and ownership structure Eolus Vind has two share classes, Class A and Class B. The company’s Class B share has been traded on Nasdaq Stockholm Small Cap since February 2, 2015, under the ticker EOLU B. Prior to that, the company’s Class B share had been traded on Nasdaq OMX First North since May 28, 2009, and on Nasdaq First North Premier since May 5, 2014.
Share price performanceDuring the fiscal year, the share price fluctu-ated from the lowest price of SEK 36.55 on October 25, 2018, and the highest price of SEK 84.70 on July 3, 2019. At the end of the fiscal year, on August 31, 2019, the closing price was SEK 78.70. Eolus’s share price rose approximately 104.9% during the fiscal year, compared with the Nasdaq Stockholm Small Cap’s index, which rose about 4.3% during the same period. A total of 16,388,226 Class B shares were traded. The turnover rate in-creased about 115.6% compared with the preceding 12-month period.
Ownership structureAt August 31, 2019, the company had 13,897 shareholders, up 5,720 during the fiscal year. The ten largest shareholders accounted for 30.4% (33.9) of the capital, and 49.0% (51.4) of the voting rights. The largest shareholders were mainly Domneåns Kraftaktiebolag and Hans-Göran Stennert. At the end of the 2018/2019 fiscal year, Eolus Vind AB did not hold any treasury shares.
Share capitalAt August 31, 2019, the nominal amount of share capital in Eolus Vind AB was SEK 24,907,000. The total number of shares was 24,907,000 (24,907,000), divided between 1,285,625 Class A shares carrying one (1) voting right per share, and 23,621,375 Class B shares, carrying one-tenth (1/10) of a vot-ing right per share. All shares outstanding are fully paid and entitle the holder to an equal share of the company’s assets and earnings. Each share has a quotient value of SEK 1.00. Shareholders are entitled to divi-dend payments in amounts determined by the Annual General Meeting. There are no restrictions on the transfer of shares or the voting rights of each shareholder at Annual General Meetings due to provisions in the Articles of Association. Eolus has imple-mented 11 new share issues since the com-pany was founded in 1990. The purpose of all new share issues has been to facilitate faster expansion than the company’s earnings growth has enabled. The share capital trend for the 1990-2019 period is presented in the table on page 33.
DividendsEolus’s long-term dividend policy entails that dividends over a long period of time will be determined by earnings and correspond to 20-50% of the company’s profit after tax. However, dividends will be adapted to the company’s investment requirements and
financial position. Eolus may incur net debt over time in order to continue developing the company. For a company such as Eolus, in which the development and divestment of wind turbines is an essential part of the business, maintaining a strong financial po-sition is imperative. The Board will therefore consider the company’s long-term financing requirements on each occasion. In view of Eolus’s strong financial position, the Board of Directors proposes that a dividend of SEK 1.50 (1.50) per share be adopted by the Annual General Meeting. That corresponds to a transfer of SEK 37.4 M (37.4), and a direct yield of 1.9%.
Financial informationEolus’s Investor Relations (IR) communica-tion is characterized by open, relevant and accurate information to shareholders, in-vestors and analysts with the aim of raising awareness of the Group’s operations and share. Eolus communicates information in the form of interim reports, annual reports and relevant press releases and provides detailed information about the company in the IR section of the company’s website, www.eolusvind.com Shareholders and other stakeholders may subscribe to press releases and financial reports via the company’s web-site. Company presentations and interviews with the CEO of Eolus are also available on the website.
2018-09-03 2019-08-30
SEK
30
40
50
60
70
80
90
SHARE PRICE PERFORMANCE
Dividend, SEK Direct yield, % Eolus B Nasdaq Stockholm, Small Cap
DIVIDEND PER SHARE AND DIRECT YIELD
2012 2013 2014 2015 2016 2014/2015
2015/2016
2016/2017
2017/2018
2018/2019
MW
050000
100000150000200000250000300000350000400000450000500000 486 790
432 680
369 862
318 697282 850
0123456789
10
0123456789
10
SEK %
25
30
35
40
012345678910
KEY FIGURES PER SHARE
2018/2019
2017/2018
Earnings per share, before and after dilution, SEK 5.33 7.81
Ordinary dividend, SEK 1.50 1.50
Direct yield, %2 1.9 3.9
Share price at year-end, SEK 78.7 38.4
Market capitalization, SEK M 1,960 956
No. of shares outstanding, 000s 24,907 24,907
Average number of shares during the year, 000s 24,907 24,907
1 Based on the Board of Director’s dividend proposal. 2 Dividend divided by the closing price for each fiscal year.
1
* The 2018/2019 dividend is based on the Board’s proposal to the Annual General Meeting.
** During the 2014/2015 fiscal year, an extra dividend of SEK 10 was paid in the form of a share split with a redemption procedure. Direct yield including the extra dividend was 46.9%.
**
*

ANNUAL REPORT EOLUS VIND AB 2018/2019 33
SHARE AND OWNERSHIP STRUCTURE
SHAREHOLDERS AT AUG 31, 2019
ShareholderNo. of
Class A sharesNo. of Class
B sharesTotal
no. of shares% of
capital% of
votes
Domneåns Kraftaktiebolag 357,900 2,012,869 2,370,769 9.5% 15.3%
Hans-Göran Stennert, directly and through endowment insurance 380,100 518,984 899,084 3.6% 11.8%
Åke Johansson 194,720 567,200 761,920 3.1% 6.9%
Hans Johansson and Borgunda bygghandel, through companies 169,520 59,168 228,688 0.9% 4.8%
Försäkringsaktiebolaget Avanza Pension 0 1,411,324 1,411,324 5.7% 3.9%
Ingvar Svantesson 43,750 200,175 243,925 1.0% 1.7%
Nordnet Pensionsförsäkring AB 500 480,955 481,455 1.9% 1.3%
Swedbank Försäkring AB 0 477,468 477,468 1.9% 1.3%
Stiftelsen Riksbankens Jubileumsfond 0 347,198 347,198 1.4% 1.0%
Kieryd Gård AB 0 340,392 340,392 1.4% 0.9%
Other shareholders 139,135 17,205,642 17,344,777 69.6% 51.0%
Total 1,285,625 23,621,375 24,907,000 100.0% 100.0%
IntervalsNo. of
shares% of
capitalNo. of
shareholders% of
shareholders
1-500 1,222,877 4.9% 11,098 79.9%
501-1,000 860,613 3.5% 1,069 7.7%
1,001-5,000 2,769,964 11.1% 1,219 8.8%
5,001-10,000 1,722,033 6.9% 236 1.7%
10,001-15,000 702,609 2.8% 57 0.4%
15,001-20,000 941,450 3.8% 53 0.4%
20,001- 16,687,454 67.0% 165 1.2%
24,907,000 100.0% 13,897 100.0%
SHARE CAPITAL TREND
Year EventTotal share
capital, SEKChange in share
capital, SEKNo. of Class
A sharesNo. of Class
B sharesChange in
Class A sharesChange in
Class B sharesQuotient
value, SEK
1990 Company foundation 1,200,000 1,200,000 5,000 7,000 5,000 7,000 100.00
1991 New share issue 3,000,000 1,800,000 5,000 25,000 - 18,000 100.00
1996 New share issue 5,000,000 2,000,000 5,000 45,000 - 27,000 100.00
2001 New share issue 6,000,000 1,000,000 6,000 54,000 1,000 9,000 100.00
2003 New share issue 8,000,000 2,000,000 6,000 74,000 - 20,000 100.00
2005 New share issue 10,000,000 2,000,000 7,500 92,500 1,500 18,500 100.00
2006 New share issue 12,000,000 2,000,000 9,000 111,000 1,500 18,500 100.00
2007 Non-cash issue 14,100,200 2,100,200 9,000 132,002 - 21,002 100.00
2007 New share issue 16,114,400 2,014,200 10,285 150,859 1,285 18,857 100.00
2007 New share issue 18,114,400 2,000,000 10,285 170,859 - 20,000 100.00
2008 Split 100:1 18,114,400 - 1,028,500 17,085,900 1,018,215 16,915,041 1.00
2009 New share issue 22,643,000 4,528,600 1,285,625 21,357,375 257,125 4,271,475 1.00
2011 Non-cash issue 24,907,000 2,264,000 1,285,625 23,621,375 - 2,264,000 1.00
2015 Split 2:1 24,907,000 - 2,571,250 47,242,750 1,285,625 23,621,375 0.50
2015 Stock dividend 49,814,000 24,907,000 - - - - 1.00
2015 Redemption 24,907,000 -24,907,000 1,285,625 23,621,375 -1,285,625 -23,621,375 1.00
24,907,000 1,285,625 23,621,375 1.00
Source: Euroclear and Eolus

34 ANNUAL REPORT EOLUS VIND AB 2018/2019
GROUP MANAGEMENT
During the 2018/2019 fiscal year, Eolus had five senior executives: Per Witalisson, Marcus Landelin, Catharina Persson, Karl Olsson and Richard Larsson. Information regarding when these executives assumed their positions, their dates of birth, expe-rience, shareholdings in Eolus at October 31, 2019 and their ongoing assignments is presented below. Assignments within the Group and the assignments of deputy Board members are not specified. Com-pany shareholdings include own shares, both direct and indirect, and those of related parties.
PER WITALISSON CEO
Born: 1971. Employed since 2006 and CEO since August 2012. Master of Business Administration. Previously an auditor at Ernst & Young from 1996-2006, where he was an authorized public accountant from 2003-2006.Other assignments: Chairman of the Board of Rockneby Vind AB and Långmarken Wind AB. Board member of Hästhalla Wind AB and Triventus AB.Shareholding in Eolus: 15,925 Class A shares and 49,376 Class B shares
KARL OLSSON General Counsel
Born: 1963. Employed since 2011. Bachelor of Laws degree. Previously employed as a lawyer at Setterwalls and Linklaters law firms, and General Counsel in Vattenfall AB’s Group staff unit. He has also been an employee and member of the management team at Awapatent AB and, prior to joining Eolus, conducted his own business Terrier Law AB.Other assignments: Chairman of the Board of Vindkraft i Dalåsen AB. Board member and CEO of Terrier Law AB. Board member of Skogskovall AB and Rockneby Vind AB. Agent for service of process for Snickare-gatan Holding AB.Shareholding in Eolus: 6,660 Class B shares
CATHARINA PERSSON CFO
Born: 1975. Employed since 2013. Master of Business Administration and previously CFO at ACAP Invest AB (publ).Other assignments: Chairman of the Board of Wind Farms Götaland Svealand AB and Wind Farm Jenasen AB. Board member of SD Förvaltning i Malmö ABShareholding in Eolus: 4,020 Class B shares
MARCUS LANDELIN Deputy CEO and Chief Operating Officer
Born: 1978. Employed since 2015. Bachelor of Laws degree and Master of Business Admin-istration. Most recently worked at E.ON, where he was Head of Origination and Proj-ect Development for onshore wind power in Northern Europe, as well as working with offshore wind power. He also worked with export and trade issues at the Swedish Trade Council in Eastern Europe and ran his own trading and construction businesses.Other assignments: None.Shareholding in Eolus: 2,425 Class B shares
RICHARD LARSSON Head of Project Delivery
Born: 1979. Employed since 2011. Master of Electrical Engineering. Came to Eolus through the acquisition of Svenska Vind-bolaget, where he was responsible for onshore wind power project development, mainly in Sweden. Has also worked in several consultant companies, where he undertook technical assignments in the field of engineering for the power industry.Other assignments: NoneShareholding in Eolus: 3,176 Class B shares
Eolus’s Group Management
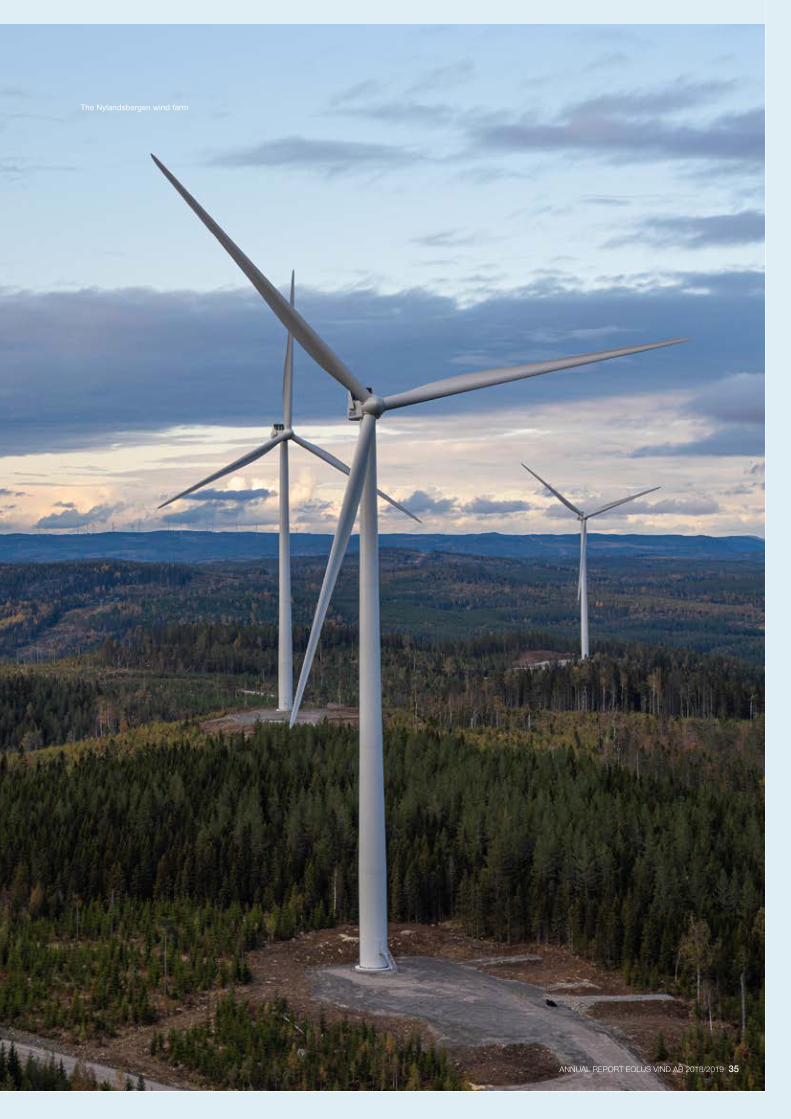
EOLUS IN BRIEF
ANNUAL REPORT EOLUS VIND AB 2018/2019 35 ANNUAL REPORT EOLUS VIND AB 2018/2019 35
The Nylandsbergen wind farm
36 ANNUAL REPORT EOLUS VIND AB 2018/2019
DIRECTORS’ REPORT
Directors’ Report
INFORMATION ABOUT BUSINESS OPERATIONSEolus aims to create value at all levels of project development, establishment and operation of facilities for renewable energy and energy storage, and to offer attractive and competitive investment objects to both local and international investors in the Nordic region, Baltic countries and the US. Eolus’s main operations are to realize projects primarily through sales of turnkey operational facilities to a broad customer base of investors. The business model also includes parts of the project portfolio to be realized through sales of project rights, meaning permitted projects, and projects under development. In these cases, sales are often supplemented with a contract for the construction of the farm. Eolus offers a full range of asset management services to wind power owners for carefree ownership where revenue is maximized and production loss is minimized. Eolus also uses its own wind power facilities to generate electricity. The importance of the segment to Eolus’s sales and earnings is limited since the company has achieved its goal of reducing the number of turbines that it owns. The Electricity Generation operating segment will not be reported separately for the 2019/2020 fiscal year, and instead will be included in the Project Development segment. The Group consists of the Parent Company, Eolus Vind AB (publ), the subsidiaries Eolus Wind Power Management AB, Ekovind AB, Svenska Vindbolaget AB, Blekinge Offshore AB, Eolus Elnät AB, SIA Eolus, Eolus Vind Norge Holding AS, Eolus Oy, Eolus North America Inc and the subsubsidiary OÜ Baltic Wind Energy. In addition to the companies above, several other companies formed to manage the development of specific wind power projects are also included.
Project developmentSince its inception in 1990, Eolus has evolved into a leading wind power developer throughout Sweden and the Nordic region. By the end of the fiscal year, Eolus had participated in the installation of 572 wind turbines with a combined capacity of 1,044 MW. Projects are realized either by selling the project rights combined with a contract for construction of the wind farm, or by establishing wind turbines that are then divested as turnkey facilities to investors. In both cases, revenue is recognized over time in accordance with the degree of completion, which means that revenue and expenses are reported over the life of the project. Sales and earnings vary between individual quarters and fiscal years, depending on the pace of wind farm construction. The project development operations are mainly financed by equity, advance payments from customers and construction loans. At present, Eolus conducts project development operations in Sweden, Norway, Finland, the Baltic countries and the US. Sales from the development, establishment and divestment of wind power facilities amounted to SEK 2,007.0 M (1,336.5). During the fiscal year, 31 (25) wind turbines with a combined capacity of 115.2 MW (83.8) were installed and completed, all of which were handed over. Other operating income of SEK 50.1 M (14.5) mainly comprised exchange rate gains.
Asset managementOver the years, Eolus has developed extensive expertise in virtually all areas related to the establishment and operation of wind turbines. Eolus offers full asset management services to wind power owners to provide carefree ownership that maximizes revenue and minimizes production loss. Eolus sees increasing demand for these services both from major institutional investors that own large wind farms, and from local opera
tors with smaller facilities. These operations provide Eolus with stable, recurring and longterm revenue streams. Sales from wind power asset management services amounted to SEK 20.0 M (16.3), of which external customers accounted for SEK 18.7 M (15.7). At the end of the fiscal year, Eolus’s customer contracts relating to asset management assignments for its own holdings and on behalf of customers totaled 524 MW (415), of which external customers accounted for 521 MW (408). In addition to these assignments, the company has signed asset management agreements for the following wind farms that have not yet been deployed: Kråktorpet (163 MW), Stigafjellet (30 MW) and Bäckhammar (130 MW). All of these farms will be deployed and handed over in 2019/2020, Kråktorpet in the first half of the year and Stigafjellet and Bäckhammar in the second half.
Electricity generationThe Group uses its own wind power facilities to generate electricity, which are recognized as either a noncurrent asset or inventories. Revenue is derived from sales of electricity, and from sales of the electricity certificates allocated to renewable electricity producers. The importance of the segment to Eolus’s sales and earnings is limited since the company has achieved its goal of reducing the number of turbines that it owns. The Electricity Generation operating segment will not be reported separately for the 2019/2020 fiscal year, and instead will be included in the Project Development segment. Sales from the Group’s electricity generation amounted to SEK 6.5 M (14.2). This decline was attributable to lower electricity generation due to the strategy to reduce the number of owned turbines. In comparable facilities, generation was in line with the yearearlier period. At the end of the fiscal year, the Group owned a combined installed capacity of 3.4 MW with estimated generation of 8 GWh per year, recognized as noncurrent assets. Average revenue for the electricity generated during the fiscal year was SEK 560 (470) per MWh.
THE GROUP’S NET SALES AND EARNINGSNet sales amounted to SEK 2,031.9 M (1,366), up SEK 665.9 M compared with the preceding year. Operating profit amounted to SEK 118.3 M (202.4), down SEK 84.1 M. The increase in sales was mainly due to a higher number of turbines and turbines with superior capacity being established and handed over, and the sale of project rights and electricity certificates. The introduction of IFRS 15 impacted comparisons with former accounting policies. Sales and operating profit for the Project Development segment were positively affected by SEK 461.2 M and SEK 11.4 M, respectively. For more information on the impact of the percentage of completion method, refer to the accounting policies and supplementary disclosures in Note 5. During the year, 31 wind turbines with a capacity of 115.2 MW were installed, all of which were handed over. In the preceding year, 25 wind turbines with a capacity of 83.8 MW were installed, all of which were handed over. Changes in the fair value of currency derivatives had a negative impact of SEK 27.0 M on operating profit, compared with a negative impact of SEK 0.4 M in the preceding year. Loss from financial items amounted to SEK 2.4 M, compared with a loss of SEK 3.5 M in the preceding year. Changes in the fair value of interest rate derivatives had a positive impact of SEK 2.1 M on operating profit, compared with a positive impact of SEK 2.8 M in the preceding year. In total, changes in the fair value of financial currency and interest rate derivatives had a negative impact of SEK 24.9 M on profit before tax, compared with a positive amount of
The Board of Directors and CEO of Eolus Vind AB (publ), Corp. Reg. No. 556389-3956, hereby submit the Annual Report and consolidated financial statements for the September 1, 2018-August 31, 2019 fiscal year. All amounts are in thousands of Swedish kronor (KSEK), unless specified otherwise. Figures in parentheses pertain to the preceding fiscal year.
36 ANNUAL REPORT EOLUS VIND AB 2018/2019

ANNUAL REPORT EOLUS VIND AB 2018/2019 37
DIRECTORS’ REPORT
EARNINGS AND FINANCIAL POSITION
Amounts in KSEK 2018/2019 2017/2018 2016/2017 2015/2016 2014/2015
Overview Group
Net sales 2,031,911 1,365,977 1,065,668 693,446 1,502,137
Operating profit/loss 118,321 202,411 40,233 15,949 90,040
Profit/loss after financial items 115,971 198,879 34,224 29,057 75,243
Return on capital employed, % 11 22 6 neg. 8
Return on equity after tax, % 16 26 4 neg. 10
Total assets 2,057,789 1,895,002 900,764 1,269,616 1,259,355
Equity/assets ratio, % 43 43 73 53 58
Average number of employees 39 35 33 33 33
Amounts in KSEK 2018/2019 2017/2018 2016/2017 2015/2016 2014/2015
Overview Parent Company
Net sales 1,412,833 1,115,620 910,062 611,873 1,348,830
Profit after financial items 206,990 288,869 82,560 26,663 160,261
Total assets 2,374,888 2,039,782 890,371 1,176,727 1,088,855
Equity/assets ratio, % 45 44 74 47 50
Average number of employees 27 25 32 31 31
DEFINITIONS OF KEY FINANCIAL FIGURES
Return on equity after tax Rolling 12month earnings relative to average equity.Equity/assets ratio Equity expressed as a percentage of total assets.Return on capital employed Profit after financial items plus interest expense expressed as a percentage of average capital employed.Capital employed Total assets minus noninterestbearing liabilities.
SEK 2.4 M in the preceding year. The effective tax rate varies considerably between periods, depending on the structure of wind turbine divestments.
FINANCIAL POSITIONTotal assets are significantly affected by the size of ongoing wind power projects, the phase they are in, and the use of credit facilities. For the construction of wind farms, the company aims to secure customer financing in pace with the project’s completion. The Group’s equity/assets ratio was 43.2% at end of the fiscal year, compared with 43.1% at the end of the preceding fiscal year.
CASH FLOW AND CASH AND CASH EQUIVALENTSCash flow from operating activities amounted to SEK 566.6 M, compared with SEK 241.7 M in the preceding year. The higher cash flow was due to a decline in ongoing projects after the handover of the Nylandsbergen and Sötterfällan wind farms. Cash flow from investing activities was a negative SEK 100.8 M, compared with a negative SEK 1.0 M in the preceding year. Cash flow from financing activities amounted to a negative SEK 103.2 M, compared with a positive SEK 296.8 M in the preceding year. The change was mainly attributable to loan repayments. At the end of the fiscal year, cash and cash equivalents amounted to SEK 1,103.0 M (739.8), an increase of SEK 363.2 M. In addition to cash and cash equivalents, there was a overdraft facility of SEK 100 M that was unutilized. Of the company’s total construction loans of SEK 950 M, SEK 150 M had been utilized. On the corresponding date in the preceding year, the overdraft facility at the time was unutilized and the framework credit agreement and construction loans had been utilized in an amount of SEK 255.0 M. At the end of the fiscal year, net cash amounted to SEK 800.1 M (371.1), up SEK 429.0 M.
WIND TURBINE INVENTORIES, WIND TURBINES UNDER CONSTRUCTION AND PROJECTS UNDER DEVELOPMENTAt the end of the fiscal year, wind turbine inventories, wind turbines under construction, projects under development and electricity certificates amounted to SEK 472.4 M (574.7), representing a decline of SEK 102.3 M. The difference is due to the number of ongoing establishments and their current phase. At the end of the fiscal year, there were 94 wind turbines under construction, of which 74 were in Sweden, seven in Norway and 13 in the US, compared with 25 in Sweden on the corresponding date in the preceding year. During the fiscal year, three wind turbines were reclassified from noncurrent assets to inventories in preparation for sale.
LIABILITIESAt the end of the fiscal year, net cash amounted to SEK 800.1 M, compared with SEK 371.1 M on the corresponding date in the preceding year. Interestbearing liabilities to credit institutions amounted to SEK 302.9 M (368.7) at the end of the fiscal year. Liabilities are affected by the size of ongoing wind power projects and the phase they are in.
SIGNIFICANT EVENTS DURING THE FISCAL YEARIn September 2018, Eolus’s wholly owned subsidiary Eolus North America, Inc acquired a solar and battery storage project in the western US with a capacity of 500 MW and 250 MW, respectively. The project is in an early stage of development and is on the waiting list for a grid connection to deliver electricity to California. In September 2018, Eolus signed an agreement with Siemens Gamesa for the delivery of seven wind turbines of the SWTDD130 model with a capacity of 4.3 MW each to the Norwegian Stigafjellet project, located in Bjerkreim south of Stavanger. This wind farm will be
ANNUAL REPORT EOLUS VIND AB 2018/2019 37

38 ANNUAL REPORT EOLUS VIND AB 2018/2019
DIRECTORS’ REPORT
deployed in the second half of 2020 and is subject to a sale agreement with ewz. In September 2018, Eolus signed a credit agreement with Swedbank comprising liquidity and construction loans totaling SEK 1,050 M. The fouryear agreement ensures financing for Eolus’s expansion in this forthcoming period in terms of both financing ongoing and future establishments for which Eolus provides the financing during the construction phase, and ensuring high liquidity for the operating activities. In October 2018, Eolus signed an agreement to divest the Bäckhammar wind farm (130 MW) in Sweden to KGAL for a preliminary purchase consideration of EUR 131 M. At the same time, Eolus placed an order for wind turbines from Vestas. Bäckhammar will comprise 22 Vestas V1364.2 MW and nine Vestas V1504.2 MW. Eolus will construct the wind farm and KGAL will provide financing during the construction process. Bäckhammar is scheduled to be completed in August 2020 and Eolus was commissioned to deliver asset management services for the facility. In October 2018, the Norwegian Water Resources and Energy Directorate extended the concession for the Øyfjellet wind farm from 330 MW to 400 MW. In January 2019, the Anneberg wind farm (11 MW) in the Municipality of Tidaholm was completed and handed over to KGAL. Anneberg was the first wind farm in Sweden to deploy a Vestas V136 wind turbine. In June 2019, Eolus North America, Inc signed an agreement with Vestas for the delivery of up to 13 Vestas V126 wind turbines with a total capacity of up to 47 MW to the Wind Wall wind farm in California, US. In July 2019, Eolus signed an agreement with Aquila Capital regarding the divestment of the Øyfjellet wind farm (400 MW) in Norway. This agreement is based on the conditional sale of 100% of the shares in the subsidiary that owns all rights to establish the wind farm, including a 15year power purchase agreement (PPA) with Alcoa Norway, and an outsourcing agreement whereby Eolus will manage construction of the wind farm on behalf of Aquila Capital. In August 2019, the Nylandsbergen (68 MW) and Sötterfällan (36 MW) wind farms were completed and handed over. Eolus will provide asset management services for both wind farms.
ENVIRONMENTAL IMPACTThrough its wind power holdings, the Parent Company and the Ekovind subsidiary conduct activities that are licensable or subject to notification requirements under the Swedish Environmental Code. The company and the Group hold the relevant environmental permits. When the duty to notify applies, notification is a prerequisite for granting a building permit under the Environmental Code. Wind power is a clean and renewable source of energy with very little environmental impact throughout the turbine’s lifespan. During operation, the environmental impact mainly consists of noise and shadow casting. Asset management of wind turbines owned by customers is performed by the subsidiary Eolus Wind Power Management. The customers hold the necessary permits for generating electricity, which is performed by Eolus Wind Power Management.
EMPLOYEESDuring the year, the average number of employees in the Group was 39 (35). The number of women employees was 12 (10), corresponding to 31% (28). For information regarding distribution of the number of employees and salaries paid, other remuneration, social security expenses pertaining to the Board and the CEO, as well as remuneration of senior executives, refer to Notes 6 and 7.
SIGNIFICANT RISKS AND UNCERTAINTIESSignificant risksA number of risk factors considered significant for the future development of Eolus are outlined below. The following risks are not ranked in order of priority and do not claim to be comprehensive.
Dependence on regulations, legislation and policy measuresThe establishment of wind power facilities is covered by a series of regu
lations. For environmental permits to be granted, the relevant municipality must actively recommend that the permit be granted. In practice, municipalities thus hold a right of veto. Both building permits and environmental permits may be appealed, which can lead to delays or make projects impossible to implement. Under the Planning and Building Act, municipalities in Sweden exercise a planning monopoly. The implementation of projects is therefore dependent on the willingness of each individual municipality to contribute to a sustainable energy supply. Political will can swing rapidly due to changing public opinion, the distribution of seats in building and planning committees, and so forth. Sweden and Norway have technologyneutral electricity certificate systems, which favor the development of renewable electricity generation. In 2008, the EU adopted the Renewable Energy Directive, through which Sweden has agreed that at least 49% of its energy consumption will be derived from renewable energy sources by 2020. Through its energy and climate agreement, the former Swedish Government raised ambitions by an additional percentage point. In October 2014, EU member states decided that the share of renewable energy should amount to at least 27% of the energy mix by 2030. Sweden introduced the Electricity Certificate System in 2003 and Norway became affiliated in 2012, and had the target of increasing renewable electricity generation by 28.4 TWh between 2012 and 2020. Within the framework of the energy agreement reached by five parliamentary parties in 2016, Sweden decided to extend the Electricity Certificate System by adding 18 TWh of new electricity certificates until 2030. In Norway, facilities established after 2021 will not be included in the System. Considering that wind power is one of the cheapest methods for adding new generation capacity, the vast majority of investing decisions have been related to wind power. In April 2017, the Swedish and Norwegian Governments reached an agreement on how the Swedish extension of the Electricity Certificate System would be designed in relation to the existing joint Swedish Norwegian certificate system. The agreement created clear incentives for further expansion and the pace of development under the System has exceeded all expectations. As can been seen in statistics from Swedish Wind Energy, the investments implemented in 2018 were likely sufficient to meet the objectives of the Electricity Certificate System. The market will therefore be able to meet the objective long before 2030. Although conditions for the wind power industry have become clearer in recent years, there is no guarantee that future Swedish parliaments will not make other decisions, entailing weaker terms for wind power in Sweden, which could affect Eolus’s operations and financial position. The division of Sweden into four electricity price areas means that the price of electricity generated varies, depending on the supply and demand situation in the relevant area.
Dependence on agreementsEolus has not concluded any operational or financial agreements with terms considered uncommon for the industry. When establishing wind farms, the company’s activities include signing agreements with manufacturers for the supply of wind turbines. Advance payments to wind turbine manufacturers can add up to considerable amounts. Since the size of the company’s wind power projects has increased in recent years, while the number of manufacturers in the market is limited and delivery times are relatively long, the inability of a particular manufacturer to fulfill agreements could have a significantly adverse effect on the company’s financial position.
Dependence on strategic partnersEolus establishes wind farms from worldclass manufacturers using the highest possible technical and overall economic efficiency. The wind power industry is undergoing rapid growth and the number of manufacturers that want to establish a market presence has increased in recent years. This competition among manufacturers has led to better terms and reduced dependence on individual suppliers. Although new manufacturers are becoming established in the markets where Eolus operates, it may take time for them to establish construction and service organizations.
38 ANNUAL REPORT EOLUS VIND AB 2018/2019

ANNUAL REPORT EOLUS VIND AB 2018/2019 39
DIRECTORS’ REPORT
Dependence on key individuals and employeesEolus is a knowledgebased company with a small organization, where dependence on the knowledge, experience and creativity of individual employees is high. The loss of key individuals could have significantly adverse effects on the company in the short term.
Earning capacityThe capital cost per megawatthour generated in a wind turbine varies greatly, depending on the wind conditions at the actual location. Establishing wind farms on appropriate sites and accurate generation assessments are thus crucial to the company’s earning capacity. The wind conditions at each individual farm can vary from year to year. Generation can vary up to +/ 15%, compared with a normal wind year. The market price of electricity varies over time. The price trend for electricity certificates is dependent on how rapidly renewable electricity generation is developed in proportion to the quota obligation that applies for consumers when purchasing electricity certificates. The main costs for wind turbine management are interest expense, depreciation, leases, service and maintenance costs and insurance expenses. Rising market interest rates have a negative impact on earnings. Investment decisions are usually based on an economic life of 25 years. If the actual life falls short of the estimated life, this would have a negative impact on profitability. With such a long time horizon, there is an additional risk that the future costs of service and maintenance may differ from the cost basis of the investment decision.
CompetitionSince development of the wind power industry has accelerated sharply in recent years, the number of market players has risen. Under current conditions, this has increased the supply of projects and wind farms to the market. In the project development phase, Eolus competes with smaller players, major utilities companies and international wind power developers. In terms of its offering of asset management services, Eolus competes with both major wind power developers offering complete managements services and owners who choose to carry out these services themselves. In regard to sales of electricity, wind powerbased electricity competes with all other types of electricity generation since all electricity is sold on a single market. The Electricity Certificate System is technologyneutral, which favors the generation of renewable electricity using the most costefficient technology.
FINANCIAL RISKSCapital requirements and financing abilityEolus has a large, highquality project portfolio. The planning of project development operations includes monitoring building permits and other permits to ensure they do not expire before the wind turbines are constructed. Eolus secured financing for the next four years in September. The credit agreement, signed with Swedbank, comprises liquidity and construction loans totaling SEK 1,050 M. The agreement has secured funding for Eolus’s expansion in this forthcoming period in terms of both ongoing and future establishments in which Eolus is responsible for financing during the construction phase, and ensuring strong liquidity in the ongoing operations. Of the company’s total construction loans of SEK 950 M, SEK 150 M had been utilized at the end of the fiscal year. In addition, there was an unutilized overdraft facility of SEK 100 M. On the corresponding date in the preceding year, the overdraft facility at the time was unutilized and the framework credit agreement and construction loans had been utilized in an amount of SEK 255 M. All agreements were with Handelsbanken. The Board has adopted a finance and risk policy containing guidelines for the equity/assets ratio, maturity structure of loans and the management of liquidity preparedness to reduce refinancing risk.
Exchange rate changesA large portion of Eolus’s sales of wind farms and purchases of wind turbines take place in EUR. Exchange rate fluctuations against the SEK can thus affect the profitability of wind farm construction. This is offset
by currency futures, advance payments from customers and borrowing in EUR. The Board has stated in the finance and risk policy that at least 75%, and a maximum of 125%, of the estimated net flow over a 12month period is to be hedged. On the balance sheet date, the company’s outstanding currency futures for selling contracts amounted to EUR 68.0 M (10.0). These had a negative market value of SEK 27.8 M (0.8).
Interest rate riskThe electricity generation operations are partly financed by bank loans. Changes in market interest rates may therefore affect future earnings and profitability. The Board has stated in the finance and risk policy that the average fixedinterest term in the electricity generation operations is not to be less than 2.5 years. At the end of the 2018/2019 fiscal year, more than 100% of the Group’s liabilities to credit institutions attributable to electricity generation operations were covered by interest rate hedging instruments. The Board of Directors approved this deviation from the policy. On the balance sheet date, these instruments had a negative market value of SEK 9.7 M (11.8).
OUTLOOKA social shift, with lower greenhouse gas emissions, such as CO2, is vital. The latest report from the UN Intergovernmental Panel on Climate Change (IPCC) warns that humanity has 12 years to significantly reduce carbon emissions to keep global warming to a maximum of 1.5°C. Beyond that, even half a degree could significantly worsen the risks of drought, floods, extreme heat and poverty. A transitioning energy market is playing a key role in meeting this challenge, which the IPCC claims is possible to achieve both economically and timewise. The energy market is undergoing a process of rapid and major change. The cost of renewable electricity generation is falling every year and new business models are emerging to challenge existing structures in the energy market. Although the pricing scenario is largely driven by global prices for fossilbased energy generation, investments in renewable generation methods account for a majority of the new investments at the global level. From a Swedish perspective, wind power has undergone tremendous growth. In 2006, wind power accounted for approximately 1 TWh, or less than 0.5%, of Swedish electricity generation. In 2018, Swedish wind power accounted for 17 TWh, or 11%, of Swedish electricity generation, and Swedish Wind Energy’s forecast is that generation in 2019 will be about 22 TWh. Wind power is now wellestablished as the country’s thirdhighest source of electricity generation after hydropower and nuclear power. The pace of development is currently high and, according to Swedish Wind Energy’s statistics, Swedish wind power will be able to generate almost 40 TWh in 2022. Rapid development is also taking place in Norway. In 2018, energy generated from wind power in Norway was 3.9 TWh and by early 2019, additional capacity of 7 TWh was under construction. The Swedish Energy Agreement from 2016 is based on the objective of transitioning to 100%renewable electricity generation in Sweden. The agreement contains a new development target of 18 TWh for the Electricity Certificate System between 2021 and 2030. With the current cost base for the establishment of new renewable electricity generation, most of these investments have been made in wind power. As can been seen in statistics from Swedish Wind Energy, the investments implemented in 2018 were likely sufficient to meet the objectives of the Electricity Certificate System. The market will therefore be able to meet the objective long before 2030. In recent years, more electricity has been generated than consumed in the Swedish market, enabling Sweden to become a net exporter of electricity. The Nordic region has an excellent opportunity to become a driving force for sustainability in Europe thanks to its extensive carbon free electricity generation, which could replace the dirty fossilbased power used in other countries. A continued ability to export electricity is positive for Sweden, which is why it is so important to continue expanding the transmission capacity – not only within Sweden but also to other countries. The fact that the energy agreement addresses the
ANNUAL REPORT EOLUS VIND AB 2018/2019 39
40 ANNUAL REPORT EOLUS VIND AB 2018/2019
DIRECTORS’ REPORT
need to expand the transmission capacity in order to enable exports is thus positive. The future potential to store electricity will present major opportunities for Sweden and Norway to increase their share of intermittent energy sources, such as wind and solar.
SHAREHOLDERSOn August 31, 2019, Eolus had 13,897 shareholders according to the register maintained by Euroclear Sweden AB. Shareholders with a direct and indirect shareholding who represent more than 10% of the votes are Domneåns Kraftaktiebolag and HansGöran Stennert. The largest shareholders of Eolus shares are presented on page 33. The number of shares held by individuals with an insider position are presented on Eolus’s website: www.eolusvind.com.
SHARESOn August 31, 2019, the share capital in Eolus Vind AB amounted to SEK 24,907,000, distributed between 1,285,625 Class A shares and 23,621,375 Class B shares. Class A shares carry one voting right, while Class B shares correspond to onetenth (1/10) of a voting right. All shares carry equal rights to the company’s assets, profit and dividends.
CORPORATE GOVERNANCEFor information about the company’s governance during the year, refer to the Corporate Governance Report on pages 4145.
SUSTAINABLE PERFORMANCEEolus proactively assumes responsibility for people and the environment throughout its operations. In accordance with Chapter 6, Section 11 of the Annual Accounts Act, Eolus Vind AB must prepare a Sustainability Report that is separate from the Annual Report. This Sustainability Report is available on www.eolusvind.com. The Sustainability Report was submitted to the auditor at the same time as the Annual Report. A summary of the Sustainability Report is provided on pages 2829 of this Annual Report.
DIVIDEND POLICYThe Board has adopted a dividend policy entailing that dividends issued by Eolus in the long term will be determined by the company’s earnings and correspond to 2050% of the company’s profit. However, dividends will be adapted to the company’s investment requirements and financial position. For the 2017/2018 fiscal year, the Annual General Meeting on January 26, 2019 resolved to pay dividends corresponding to SEK 1.50 (1.50) per share. Payment of the dividends took place on February 1, 2019.
PROPOSED DISTRIBUTION OF PROFITThe Board of Directors proposes a dividend of SEK 1.50 (1.50) per share for the 2018/2019 fiscal year in line with the company’s dividend policy. The proposed record date for the dividends is Tuesday, January 28, 2020. Payment of the dividend is expected to take place on Friday, January 31, 2020. The Board of Directors deems that the proposal is consistent with the prudence rule in Chapter 17, Section 3 of the Swedish Companies Act, as follows:
The following profits are at the disposal of the Annual General Meeting (amounts in SEK):
Share premium reserve 168,662,573
Retained earnings 542,756,722
Net profit for the year 193,152,422
SEK 904,571,717
The Board of Directors proposes that the profits be appropriated as follows:
dividend to the shareholders 37,360,500
to be carried forward 867,211,217
SEK 904,571,717
Statement:The proposed dividend is considered justifiable in view of the earnings trend after the end of the fiscal year. The proposed distribution of profit is also considered justifiable in view of the requirements concerning equity, consolidation requirements, liquidity and financial position in general for both the Parent Company and the Group.
DEFINITIONS OF KEY FINANCIAL FIGURESReturn on equity after tax Rolling 12month earnings relative to average equity.Equity/assets ratio Equity expressed as a percentage of total assets.
Return on capital employed Profit after financial items plus interest expense expressed as a percentage of average capital employed.Capital employed Total assets minus noninterestbearing liabilities.
40 ANNUAL REPORT EOLUS VIND AB 2018/2019

ANNUAL REPORT EOLUS VIND AB 2018/2019 41
CORPORATE GOVERNANCE REPORT
CORPORATE GOVERNANCE REPORT FOR EOLUS VIND AB (PUBL)Eolus Vind AB is a Swedish public limited liability company that has been listed on Nasdaq Stockholm since February 2, 2015. Eolus is governed through General Meetings, the Board of Directors, the CEO and Group management in accordance with the Swedish Companies Act, the Articles of Association and the rules of procedure for the Board of Directors and CEO. Representatives from the Eolus Group’s management are also members of its subsidiaries’ boards. With Nasdaq Stockholm, Eolus has committed to apply the Swedish Corporate Governance Code (the “Code”), which is to be applied by all Swedish limited liability companies whose shares are traded on a regulated market in Sweden.
ARTICLES OF ASSOCIATIONThe current Articles of Association were adopted at the Annual General Meeting on January 28, 2017. It states that the Board’s registered office is to be in Hässleholm, Sweden, that the Board’s members are to be elected every year by the Annual General Meeting for a period up to the next Annual General Meeting, and that one Class A share entitles the holder to one vote while one Class B share entitles the holder to onetenth of a vote. The complete Articles of Association are available on Eolus’s website, www.eolusvind.com.
GENERAL MEETINGSThe shareholders exercise their decisionmaking rights regarding central issues at the General Meeting. The Meeting resolves on adoption of the income statement and balance sheet, appropriation of the company’s profit or loss, discharge of liability for Board members and CEO, election of the Board of Directors and auditors, and remuneration of the Board of Directors and auditors. Notice convening the Annual General Meeting for Eolus must be issued not earlier than six weeks and not later than four weeks prior to the Meeting. The notice is to be advertised in Post och Inrikes Tidningar and on Eolus’s website. The fact that notification has been issued is to be announced in the Swedish daily Dagens Industri. Shareholders who wish to participate in the Annual General Meeting are to notify the company by no later than the date stipulated in the notice.
2019 Annual General MeetingEolus’s 2019 Annual General Meeting was held in Hässleholm, Sweden, on Saturday, January 26. Some 131 shareholders, representing 36% of the votes, attended the Meeting, personally or through proxy. General Counsel Karl Olsson was elected Chairman of the Meeting. In attendance at the Annual General Meeting were the Board members, CEO, Deputy CEO, CFO and the company’s auditor. The minutes of the Meeting are available in Swedish on Eolus’s website, www.eolusvind.com. All resolutions were made in accordance with the proposals from the Nomination Committee and the Board of Directors.
A few of the resolutions made by the Meeting include:• Dividend of SEK 1.50 per share for the 2017/2018 fiscal year.• The Board of Directors is to comprise seven members, with no deputy
members.• Reelection of Board members HansGöran Stennert, Fredrik Daveby,
Sigrun Hjelmquist, Hans Johansson, Hans Linnarson and Bodil Rosvall Jönsson. Jan Johansson elected as a new Board member.
• Reelection of HansGöran Stennert as Board Chairman.• Reelection of PricewaterhouseCoopers AB as the company’s auditors
with Eva Carlsvi as Auditor in Charge.• Fees to the Board Chairman, Board members and auditor. • Rules for the appointment and work of the Nomination Committee.
2020 Annual General MeetingThe next Annual General Meeting of Eolus’s shareholders will be held at Hässleholms Kulturhus on Saturday, January 25, 2020 at 3:00 p.m. More details about the Annual General Meeting, registration, etc. are available on page 95.
NOMINATION COMMITTEEThe Nomination Committee nominates the people who are proposed for election to Eolus’s Board of Directors at the Annual General Meeting. It also presents proposals for auditors’ fees, Board fees to the Chairman and other Board members, and remuneration for committee work. All the proposals are presented at the Annual General Meeting, in the notice and on the website ahead of the Annual General Meeting. The Nomination Committee comprises the Board Chairman and representatives for Eolus’s three largest shareholders in terms of the number of votes on May 31. HansGöran Stennert, Board Chairman, presented the composition of the Nomination Committee on July 17, 2019.
The Nomination Committee comprises the following members:Name Represents Holding on May 31, 2019HansGöran Stennert In his capacity as Chairman of the BoardIngvar Svantesson Domneåns Kraftaktiebolag 15.3%Hans Gydell (Chairman) HansGöran Stennert 11.8%Hans Johansson Åke Johansson 6.9%
The Nomination Committee held its first meeting on September 17, 2019. The Nomination Committee has held two minuted meetings ahead of the 2019 Annual General Meeting. The work of the Nomination Committee begins with the members reviewing the evaluation of the Board carried out during the year. The Nomination Committee agreed unanimously that the current composition is satisfactory. The number of Board members is considered appropriate and the expertise possessed by the Board is both complementary and relevant. The composition of the Board is also considered satisfactory in terms of equality.
THE BOARD OF DIRECTORS AND ITS WORKEolus’s Board of Directors decides on the company’s business orientation, strategy, business plan, resources and capital structure, organization, acquisitions, major investments and divestments, annual reports and interim reports, as well as other comprehensive matters of a strategic nature. The Board also appoints the CEO who is in charge of the daytoday management in accordance with the Board’s instructions.
Board membersBoard members are elected every year by the Annual General Meeting for the period up until the next Annual General Meeting. According to the Articles of Association, the Board is to comprise no fewer than four and no more than ten regular members and no more than six deputy members. The Board comprised seven members as of the Annual General Meeting on January 26, 2019. For a presentation of the Board Chairman and Board members, see pages 9293. Eolus’s CEO is not a member of the Board but participates as a rule at the Board meetings as a rapporteur, as do the Deputy CEO, CFO and General Counsel.
The work of the BoardAt the first regular Board meeting following the Annual General Meeting, Eolus’s Board adopts written instructions that describe the Board’s rules of procedure. The adopted rules of procedure stipulate the division of duties among the Board’s members and how often the Board will convene. Furthermore, the rules of procedure regulate the Board’s duties, quorum, instructions for the CEO, the division of responsibilities between
Corporate Governance Report
ANNUAL REPORT EOLUS VIND AB 2018/2019 41
42 ANNUAL REPORT EOLUS VIND AB 2018/2019
CORPORATE GOVERNANCE REPORT
the Board and the CEO, and more. The Board has also internally established a Remuneration Committee comprising three members of the Board and an Audit Committee comprising the entire Board. The Board convenes according to a oneyear plan proposed in advance and more meetings are arranged as needed. The Board held 12 minuted Board meetings during the 2018/2019 fiscal year.Items on the agenda for 2018/2019 included:• Annual accounts including the auditors’ report, the proposed distribu
tion of profit and the yearend report.• Annual report and preparations ahead of the Annual General Meeting.• Followup with the Auditor in Charge regarding the year’s audit.• Interim reports.• Rules of procedure for the Board and CEO.• Annual review of policies.• Budget.• Strategic issues and risks.• Ongoing forecasts.• Outline plans (prioritized projects for the next three years).• Liquidity planning with respect to future prioritized projects.• Economic climate and conditions.
In addition to the Board meetings, the Board Chairman and the CEO have an ongoing dialog regarding the management of the company. The CEO, Per Witalisson, is in charge of implementation of the business plan, the daytoday management of the company’s affairs and the daily operations of the company. Before Board meetings, the Board receives written information in the form of a CEO report that contains a followup of the company’s sales, operational results, liquidity forecasts, interest rate and currency hedging, details concerning order backlog, the number of wind turbines under construction as well as comments concerning the various market trends. Prior to the Board meetings, the Board will also have access to the balance sheets and cash flow statements. The Board Chairman presents to the Board the results of the annual evaluation of the Board’s work. The evaluation includes the composition of the Board, the individual Board members and the Board’s work and procedures. The Code contains rules concerning the Board members’ independence and stipulates that the majority of the Board members are to be independent in relation to the company and company management. At least two of the Board members who are independent in relation to the company and company management must also be independent in relation to all shareholders who control ten percent or more of the shares or the votes in Eolus Vind AB. No more than one person from company management may be a member of the Board.
BOARD ATTENDANCE IN 2018/2019
Function Inde-pen-dent1
Boardmeetings
Remuner-ation Committee
HansGöran Stennert Chairman 2) 12 of 12 3 of 3
Fredrik Daveby Board member X 12 of 12 3 of 3
Sigrun Hjelmquist Board member X 12 of 12 3 of 3
Hans Johansson Board member X 12 of 12
Hans Linnarson Board member X 12 of 12
Bodil Rosvall Jönsson Board member X 12 of 12
Jan Johansson* Board member X 7 of 12
*) Elected to the Board at the Annual General Meeting on January 26, 2019.1) According to the definition in the Swedish Corporate Governance Code.2) Not independent (in relation to Eolus’s major shareholders).
REMUNERATION COMMITTEEThe Remuneration Committee comprises HansGöran Stennert, Sigrun Hjelmquist and Fredrik Daveby. HansGöran Stennert is the Committee’s Chairman.
The duties of the Remuneration Committee include:• preparing and on behalf of the Board make decisions on matters
regarding the remuneration policy, remuneration and other terms of employment for senior management including submitting proposals to the Annual General Meeting on behalf of the Board on the guidelines for remuneration of senior executives that the Annual General Meeting is to resolve on,
• monitoring and evaluating any ongoing and duringtheyear adopted programs for variable remuneration to company management,
• monitoring and evaluating the application of the guidelines for remuneration of senior executives decided by the Annual General Meeting as well as relevant remuneration structures and levels in the company,
• ensuring that the company’s auditor submits a written statement to the Board no later than three weeks before the Annual General Meeting regarding whether the guidelines for remuneration of senior executives valid since the previous Annual General Meeting have been followed, and
• carrying out the other duties that are assigned the Remuneration Committee in the Swedish Corporate Governance Code and other applicable rules and regulations for the company.
The Remuneration Committee held three minuted meetings during 2018/2019 at which all members were in attendance.
AUDIT COMMITTEEThe company has decided that the Board in its entirety will carry out the Committee’s duties.
The duties that the Board will carry out in this function include:• monitoring the company’s financial reporting, • monitoring the effectiveness of the company’s internal control and risk
management in relation to financial reporting and providing recommendations and proposals to ensure the reliability of financial reporting,
• annually evaluating the need for an internal audit function that is the responsibility of the Board,
• remaining informed about the audit of the annual report and consolidated financial statements, and assessing how the audit contributed to the reliability of financial reporting,
• regularly meeting the company’s auditor for updates concerning the scope and methodology of the audit and to discuss the approach to the company’s risks,
• determining guidelines for nonauditing services that the company may request from the company’s auditor,
• reviewing and monitoring the auditor’s impartiality and independence,• assisting the Nomination Committee in preparing proposals for the
General Meeting’s decisions regarding auditors and fees for the audit assignment,
• executing the other duties of the Audit Committee required by law, the Swedish Corporate Governance Code, and other relevant rules and regulations for the company.
CEOThe CEO of Eolus is Per Witalisson (born 1971), Master of Business Administration. The Board has adopted instructions for the work and role of the CEO. The CEO is responsible for the daytoday management of the Group’s business in accordance with the Board’s guidelines. For a presentation of the CEO, refer to page 34. For remuneration of the CEO, refer to Note 7.
GROUP MANAGEMENTPer Witalisson leads the work of Group management and makes decisions in consultation with other members of management. Group management consists of five people: the CEO, Deputy CEO, CFO, General Counsel and Head of Project Delivery. During the 2018/2019 fiscal year, management convened on nine occasions in Hässleholm, Halmstad or Malmö in Sweden. The year’s meetings were dominated by continuous reconciliation of the rolling business plan, strategy issues and action plans. Standing items on the agenda are minutes from the previous
42 ANNUAL REPORT EOLUS VIND AB 2018/2019

ANNUAL REPORT EOLUS VIND AB 2018/2019 43
CORPORATE GOVERNANCE REPORT
meeting, reports from project delivery, the operational team, finances, project development, establishment, sales and marketing, operation, foreign operations, personnel, occupational health and safety, and legal issues.
AUDITAt the Annual General Meeting on January 26, 2019, PricewaterhouseCoopers AB (PwC) was reelected with Eva Carlsvi as Auditor in Charge. The auditors review the annual accounts and the annual report as well as the company’s ongoing operations and routines in order to express an opinion on the accounts and the administration of the Board of Directors and the CEO. The annual accounts and the annual report are audited in October and November. An examination is then made of whether the Annual General Meeting’s guidelines for the remuneration of senior executives have been followed. Eolus’s secondquarter report is reviewed in April and an interim review is performed in May. In addition to Eolus, Eva Carlsvi is also Auditor in Charge for Bygghemma Group First AB (publ), BE Group AB (publ), E.ON Nordic Aktiebolag and KappAhl AB (publ). Eva Carlsvi is an authorized public accountant and member of FAR. In 2018/2019, fees paid to PwC for nonaudit assignments totaled SEK 1.0 M (1.0).
REMUNERATION
Remuneration of the BoardFees and other remuneration of the Board, including the Chairman of Eolus’s Board, are determined by the Annual General Meeting. The Annual General Meeting on January 26, 2019, resolved on total annual fees of KSEK 1,425, of which KSEK 375 was to be paid to the Board Chairman and KSEK 175 to each of the other Board members. For more information about remuneration of the Board, refer to Note 7.
Remuneration of senior executivesRemuneration of the CEO and other members of Group Management (currently the Deputy CEO, CFO, General Counsel and Head of Project Delivery) is paid in accordance with the guidelines for remuneration of senior executives. The guidelines were adopted by the Annual General Meeting on January 26, 2019, for the period up until the next Annual General Meeting. According to the guidelines, senior executives shall be offered marketbased and competitive remuneration. The level of remuneration for individual executives is to be based on such factors as position, expertise, experience and performance. Remuneration includes fixed salary and pension benefits, and may also include variable salary and other nonmonetary benefits. The company shall be able to offer senior executives maximum variable remuneration of four monthly salaries for the CEO and Deputy CEO, and three monthly salaries for other senior executives. Variable salary shall be based on the achievement of one or more quantitative and/or qualitative targets. The targets shall be formulated with the objective of promoting the company’s longterm value creation. Furthermore, the company shall also be able to offer senior executives a share ownership program under which the company, three years after payment of variable remuneration, will reimburse the cost of acquiring half as many shares as the executive acquired for their variable remuneration and continues to hold, and on the condition that the executive is still employed at the company. Participation in the share ownership program is maximized to the equivalent of not more than one monthly salary for all senior executives. For more information about remuneration of senior executives, refer to Note 7.
THE BOARD PROPOSED GUIDELINES FOR FUTURE REMUNERATION OF SENIOR EXECUTIVES
The executives encompassed by and the application of the guidelinesThese guidelines encompass the individuals who are members of Eolus Vind AB’s (publ) (“Eolus”) company management. These individuals cur
rently are the CEO, Deputy CEO/Chief Operating Officer, CFO, General Counsel and Head of Project Delivery. To the extent that a Board member performs work for Eolus alongside his or her Board duties, these guidelines shall also apply to any remuneration (such as consultant’s fees) for such work. The guidelines are to be applied to remuneration that is contracted, and changes made in previously contracted remuneration, after the guidelines are adopted by the 2020 Annual General Meeting. The guidelines do not encompass remuneration resolved by the General Meeting.
How the guidelines advance the company’s business strategy, long-term interests and sustainabilityIn brief, Eolus’s business strategy is for the company, by construct turnkey facilities for renewable energy and energy storage, to create value at all levels of project development, establishment and operation of such facilities, and to offer attractive and competitive investment objects to both local and international investors. For more information about the company’s strategy, refer to the most recent Eolus Annual Report.Successful implementation of the company’s business strategy and safeguarding the company’s longterm interests, including its sustainability, require the company to recruit and retain a highly skilled management team with the capacity to achieve set targets. In order to do so, the company must offer competitive remuneration, as these guidelines permit.Variable cash remuneration encompassed by these guidelines is to be based on criteria aimed at advancing the company’s business strategy and longterm interests, including its sustainability.
Forms of remuneration, etc.Remuneration is to be marketbased and competitive and may comprise the following components: fixed cash salary, variable cash remuneration, pension benefits and other benefits. The level of remuneration for individual executives is to be based on such factors as position, expertise, experience and performance. In addition, the General Meeting can, irrespective of these guidelines, resolve on share and shareprice based remuneration, for example. It must be possible to measure fulfillment of criteria for a period of one or more years in order to receive payment of variable cash remuneration. The variable cash remuneration may amount to a maximum of four monthly salaries for the CEO and Deputy CEO, and a maximum of three monthly salaries for other senior executives. Variable remuneration may not be pensionable, unless otherwise stipulated in mandatory collective agreements. Pension benefits, including health insurance, are to be defined contribution, unless the executive is part of a definedbenefit pension according to mandatory collective agreements. The pension premiums for definedcontribution pension plans may amount to a maximum of 30% of pensionable income. Other benefits may include, for example, life assurance, medical expense insurance and company car benefits. Premiums and other costs associated with such benefits may amount to a maximum of 15% of pensionable income. For employment conditions subject to nonSwedish regulations, the appropriate adjustments must be made to pension benefits and other benefits to follow such regulations or fixed local practice, with the aim of meeting the overall purpose of the guidelines as far as possible.
Termination of employmentSenior executives are to be employed on a permanent basis or for a specific period of time. The period of notice for termination of employment is a maximum of 12 months. Severance pay is not paid. The period of notice if the CEO terminates employment is a maximum of 12 months, and six months if other senior executives terminate employment.
Criteria for payment of variable cash remuneration, etc.Variable cash remuneration is to be based on predefined and measurable financial and nonfinancial criteria determined by the Board, such as return on equity, delivery of ongoing projects, order intake and capex reduction, that are to be weighted at between 10% and 50%. The criteria
ANNUAL REPORT EOLUS VIND AB 2018/2019 43

THE PAST YEAR
44 ANNUAL REPORT EOLUS VIND AB 2018/201944 ANNUAL REPORT EOLUS VIND AB 2018/2019
CORPORATE GOVERNANCE REPORT
are to apply for periods of one fiscal year. By rewarding clear and measurable progress in relation to bonus targets linked to the company’s financial and operational development, these criteria help support and motivate employees to achieve Eolus’s established business strategies, longterm targets and sustainability. After the end of the measurement period for fulfillment of the criteria for payment of variable cash remuneration, the level of fulfillment of the criteria is assessed and confirmed. The Remuneration Committee is responsible for performing the assessment of variable cash remuneration for the CEO, and the CEO is responsible for the assessment for other senior executives. Fulfillment of financial criteria is to be confirmed based on the most recent financial information published by the company.
Salary and employment termsThe Board considers salary and employment terms of the company’s employees when preparing proposals on remuneration criteria by including information amount total employee remuneration, remuneration components and the increase and rate of increase in remuneration over time in the decisionmaking data used by the Remuneration Committee and Board to evaluate the reasonableness of the guidelines and their limitations.
Consultant’s fees to Board membersIf Board members (including through their wholly owned companies) perform services for Eolus in addition to their Board duties, special fees are paid for such work (consultant’s fees), provided that such services contribute to the implementation of Eolus’s business strategy and safeguarding of Eolus’s longterm interests, including its sustainability. The annual consultant’s fee for each Board member may never exceed the annual Board fee. The fee is to be marketbased and set in relation to the value for Eolus.
Decision-making process for establishing, reviewing and implementing the guidelinesThe Board has established a Remuneration Committee. The Committee’s duties include preparing the Board’s decisions on proposed guidelines for remuneration of senior executives. The Board is to prepare proposals for new guidelines when significant changes are required and at least once every four years, and the proposal is to be presented for resolution by the Annual General Meeting. These guidelines are to apply until new guidelines are adopted by the General Meeting. The Remuneration Committee is also to monitor and evaluate the variable remuneration program for company management, the application of the guidelines for remuneration of senior executives as well as relevant remuneration structures and levels in the company. The members of the Remuneration Committee are independent in relation to the company and company management. The CEO and other members of company management do not participate in the Board’s discussions and decisions on remunerationrelated matters that pertain to them.
Deviations from these guidelinesThe Board may decide to temporarily deviate, wholly or partly, from these guidelines if there are special reasons to do so in individual cases and such a deviation is necessary to safeguard the company’s longterm interests, including its sustainability, or to ensure the company’s financial strength. As stated above, the Remuneration Committee’s duties include preparing the Board’s decisions on remuneration matters, including decisions to deviate from these guidelines.
Information on approved remuneration not yet due for paymentNew regulations on the design of remuneration guidelines were introduced to the Swedish Companies Act on June 10, 2019. According to the transition rules for the new regulations, the proposed remuneration guidelines are to include information on previously approved remuneration not yet due for payment. Other than the commitments to pay ongoing remuneration such as salary, pension and other benefits, there is no other previously approved remuneration for any senior executives that is
not yet due for payment. For more information about remuneration of senior executives, refer to Note 6 of this Annual Report.
REMUNERATION OF AUDITORSFees for the audit assignment are paid against invoice and amounted to SEK 0.5 M for the 2018/2019 fiscal year. For the 2018/2019 fiscal year, fees paid to PwC for nonaudit assignments totaled SEK 1.0 M. For more information about the remuneration of auditors, refer to Note 8.
THE BOARD’S DESCRIPTION OF INTERNAL CONTROL OVER FINANCIAL REPORTING FOR THE 2018/2019 FISCAL YEARThe Board’s responsibility for internal control is governed by the Swedish Companies Act and Swedish Corporate Governance Code. This includes monitoring Eolus’s financial reporting and the effectiveness of the company’s internal control and risk assessment. Internal control over financial reporting aims to provide reasonable assurance of the reliability of the external financial reporting in the form of annual reports and interim reports published by Eolus every year, and that financial reporting is prepared in accordance with the law, applicable accounting standards and other requirements for listed companies. Internal control is also aimed at ensuring highquality financial reporting to company management and the Board so that decisions can be made on correct grounds. To describe internal control over financial reporting, Eolus proceeds from the five components of internal control defined in the COSO Internal ControlIntegrated Framework – Control Environment, Risk Assessment, Control Activities, Information and Communication, and Monitoring Activities. The description below therefore relates to Eolus’s internal control system in relation to the 2013 edition of the COSO Framework.
Control environmentThe Board’s rules of procedure and the Board’s instructions for the duties of the CEO and the Board’s Committees clearly define the division of responsibility and powers in order to ensure effective management of risks in the business operations. In its role as Audit Committee, the Board of Eolus reviews the instructions and procedures used in the financial reporting process as well as accounting policies and any amendments of these. The CEO reports to the Board of Directors, according to established procedures, on the operations and financial performance prior to every Board meeting. Internal control instruments for financial reporting mainly comprise the finance and risk policy, information and insider policy and the Group’s accounting manual, which defines the accounting and reporting rules.
Risk assessment Significant risks for the operations are analyzed by the Board of Directors as part of financial reporting. These are described in the company’s guidelines for risk management and internal control. The risk areas are documented on the basis of probability and their probable impact. Based on this, control processes are designed to ensure highquality financial reporting.
Control structuresThe organizational structure, and the division of responsibility and rules of authorization, are clearly described and communicated through instructions. The operations are organized into segments that are monitored. The company performs an annual selfassessment of internal controls in management, core and support processes. The results of these selfassessments form the basis for ongoing improvement initiatives within risk management and internal control.
Information and communicationAn accounting manual with guidelines and instructions for financial reporting has been produced. The accounting manual is continuously updated and issued to the concerned employees at Eolus. Prior to all quarterly financial statements and the annual accounts, specific written instructions are also provided to ensure accurate information in the ex
THE PAST YEAR
ANNUAL REPORT EOLUS VIND AB 2018/2019 45 ANNUAL REPORT EOLUS VIND AB 2018/2019 45
ternal reporting. External communication is governed by Eolus’s information and insider policy and communication plan, which address responsibilities, procedures and rules. The policy is continuously evaluated to ensure that information to the stock market maintains high quality and is in accordance with the stock exchange’s rules. Financial information such as quarterly reports, annual reports and significant events are published through press releases, and on Eolus’s website. Meetings with financial analysts are arranged regularly in conjunction with the publication of quarterly reports.
MonitoringGroup management continuously analyzes the financial performance of the Group’s segments. At all levels of the organization, continuous monitoring is generally performed through comparisons against budget, forecasts and plans, as well as evaluation of key figures. Prior to Board meetings, the Board receives financial reporting on Eolus’s performance. In addition to formal reporting, there are informal information channels to the CEO and the Board for significant information from employees. The Board continuously evaluates the information provided by the CEO. This involves ensuring that measures are taken in regard to any shortcomings and proposed measures that have arisen during the internal control and external audit.
The Board and the auditor engage in regular dialog. All members of the Board and the auditor receive a copy of interim reports before they are published. The Board and the auditor meet at least once per year, without the presence of management.
Internal audit opinionTo date, the Board has not found any reason to establish an internal audit function, as the above functions are deemed to fulfill this duty. However, the Board annually evaluates the need for such a function.
CORPORATE GOVERNANCE REPORT

46 ANNUAL REPORT EOLUS VIND AB 2018/2019
CONSOLIDATED STATEMENT OF INCOME
KSEK Note 2018/2019 2017/2018
Net sales 3 2,031,911 1,365,977
Other operating income 9 58,706 22,533
Total operating income 2,090,617 1,388,511
Change in wind turbine inventories, wind turbines under construction and projects under development
289,576
171,724
Cost of goods and project development 1,503,682 1,248,858
Other external expenses 8.15 58,141 51,542
Employee benefits expenses 6.7 39,088 32,702
Depreciation and impairment of property, plant and equipment 14 4,968 14,765
Loss from participations in associated companies 19 4,589
Other operating expenses 9 76,842 5,367
Total operating expenses -1,972,296 -1,186,100
Operating profit 118,321 202,411
Interest income 10 3,110 2,727
Interest expense 10 14,179 6,586
Other financial items 10 8,719 327
Loss from financial items -2,350 -3,532
Profit before tax 115,971 198,879
Tax 12 16,823 4,566
Net profit for the year 132,794 194,313
Attributable to Parent Company shareholders 132,876 194,460
Attributable to noncontrolling interests 82 147
Total 132,794 194,313
Earnings per share, before and after dilution 23 5.33 7.81
Consolidated statement of income
46 ANNUAL REPORT EOLUS VIND AB 2018/2019

ANNUAL REPORT EOLUS VIND AB 2018/2019 47
CONSOLIDATED STATEMENT OF OTHER COMPREHENSIVE INCOME
KSEK Note 2018/2019 2017/2018
Net profit for the year 132,794 194,313
Other comprehensive income
Other comprehensive income not to be reclassified to profit or loss in subsequent periods
Other comprehensive income to be reclassified to profit or loss in subsequent periods
Exchange differences on translation of foreign operations 1,501 538
Total other comprehensive income -1,501 -538
Comprehensive income for the year 131,293 193,775
Attributable to Parent Company shareholders 131,169 193,582
Attributable to noncontrolling interests 125 193
Total 131,293 193,775
Consolidated statement of other comprehensive income
ANNUAL REPORT EOLUS VIND AB 2018/2019 47

48 ANNUAL REPORT EOLUS VIND AB 2018/2019
CONSOLIDATED STATEMENT OF FINANCIAL POSITION
Consolidated statement of financial position
KSEK Note Aug 31, 2019 Aug 31, 2018
ASSETS
Non-current assets
Intangible assets 13 54,084 96,162
Property, plant and equipment 14 31,810 52,024
Participation in associated companies 19 37
Deferred tax assets 12 4,421 3,095
Other financial assets 26 20,502 25,953
Total non-current assets 110,817 177,271
Current assets
Wind turbine inventories, wind turbines under construction and projects under development 20 472,359 574,666
Advance payments to suppliers 277,014 307,225
Accounts receivable 21, 26 25,277 53,018
Current tax assets 5,705
Other current receivables 21, 26 35,411 37,023
Prepaid expenses and accrued income 22 28,223 5,973
Cash and cash equivalents 26 1,102,983 739,825
Total current assets 1,946,973 1,717,730
TOTAL ASSETS 2,057,789 1,895,002
48 ANNUAL REPORT EOLUS VIND AB 2018/2019

ANNUAL REPORT EOLUS VIND AB 2018/2019 49
CONSOLIDATED STATEMENT OF FINANCIAL POSITION
KSEK Note Aug 31, 2019 Aug 31, 2018
EQUITY AND LIABILITIES
Equity
Share capital 23 24,907 24,907
Additional paidin capital 190,843 190,843
Reserves 2,170 496
Retained earnings 674,240 598,759
Equity attributable to Eolus’s shareholders 887,817 814,013
Noncontrolling interests 2,037 1,912
Total equity 889,854 815,924
Non-current liabilities
Noncurrent interestbearing liabilities to credit institutions 24, 26, 28 152,400 81,780
Noncurrent provisions 25 925 2,107
Deferred tax liabilities 12 6,153 39,994
Other noncurrent liabilities 28 284 264
Total non-current liabilities 159,762 124,145
Current liabilities
Current interestbearing liabilities to credit institutions 24, 26, 28 150,533 286,960
Accounts payable 26 229,381 140,806
Derivative instruments 26 37,521 12,647
Current tax liabilities 32 35,099
Accrued expenses and deferred income 22, 26 91,585 61,606
Advance payments from customers 293,791 318,782
Other current liabilities 26 205,330 99,031
Total current liabilities 1,008,173 954,932
TOTAL EQUITY AND LIABILITIES 2,057,789 1,895,002
ANNUAL REPORT EOLUS VIND AB 2018/2019 49

50 ANNUAL REPORT EOLUS VIND AB 2018/2019
CONSOLIDATED STATEMENT OF CHANGES IN EQUITY
Consolidated statement of changes in equity
KSEK Note 23
Share capital
Additional paid-in capital
Reserves Retained earnings
Total, Eolus’s share-
holders
Non-controlling interests
Total equity
At September 1, 2018 24,907 190,843 -496 598,759 814,013 1,912 815,924
Adjustment for changed accounting policy*:
IFRS 15 Revenue from Contracts with Customers
20,000
20,000
20,000
Adjusted at September 1, 2018 24,907 190,843 -496 578,759 794,013 1,912 795,924
Net profit for the year 132,876 132,876 82 132,794
Other comprehensive income 1,674 33 1,707 206 1,501
Total comprehensive income -1,674 132,843 131,169 125 131,293
Transactions with shareholders
Dividends 37,361 37,361 37,361
At August 31, 2019 24,907 190,843 -2,170 674,240 887,817 2,037 889,854
KSEK Note 23
Share capital
Additional paid-in capital
Reserves Retained earnings
Total, Eolus’s share-
holders
Non-controlling interests
Total equity
At September 1, 2017 24,907 190,843 369 441,673 657,791 1,719 659,510
Net profit for the year 194,460 194,460 147 194,313
Other comprehensive income 864 14 878 340 538
Total comprehensive income -864 194,446 193,582 193 193,775
Transactions with shareholders
Dividends 37,361 37,361 37,361
At August 31, 2018 24,907 190,843 -496 598,759 814,013 1,912 815,924
* Based on the assessment of the financial effect of the transition to IFRS 15 and percentage of completion, Eolus’s equity was negatively impacted due to a variable parameter for determining the final price in contracts with customers. For a more detailed description of the impact of the transition to IFRS 15, refer to pages 5859.
50 ANNUAL REPORT EOLUS VIND AB 2018/2019
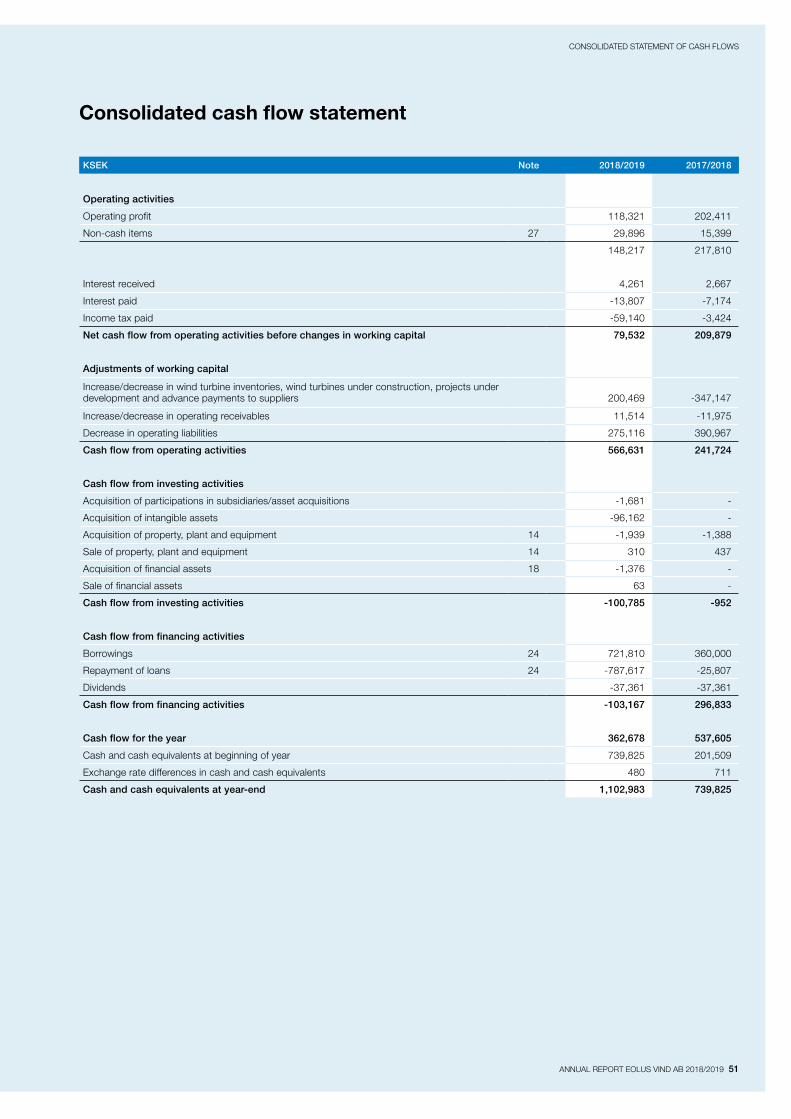
ANNUAL REPORT EOLUS VIND AB 2018/2019 51
CONSOLIDATED STATEMENT OF CASH FLOWS
KSEK Note 2018/2019 2017/2018
Operating activities
Operating profit 118,321 202,411
Noncash items 27 29,896 15,399
148,217 217,810
Interest received 4,261 2,667
Interest paid 13,807 7,174
Income tax paid 59,140 3,424
Net cash flow from operating activities before changes in working capital 79,532 209,879
Adjustments of working capital
Increase/decrease in wind turbine inventories, wind turbines under construction, projects under development and advance payments to suppliers 200,469 347,147
Increase/decrease in operating receivables 11,514 11,975
Decrease in operating liabilities 275,116 390,967
Cash flow from operating activities 566,631 241,724
Cash flow from investing activities
Acquisition of participations in subsidiaries/asset acquisitions 1,681
Acquisition of intangible assets 96,162
Acquisition of property, plant and equipment 14 1,939 1,388
Sale of property, plant and equipment 14 310 437
Acquisition of financial assets 18 1,376
Sale of financial assets 63
Cash flow from investing activities -100,785 -952
Cash flow from financing activities
Borrowings 24 721,810 360,000
Repayment of loans 24 787,617 25,807
Dividends 37,361 37,361
Cash flow from financing activities -103,167 296,833
Cash flow for the year 362,678 537,605
Cash and cash equivalents at beginning of year 739,825 201,509
Exchange rate differences in cash and cash equivalents 480 711
Cash and cash equivalents at year-end 1,102,983 739,825
Consolidated cash flow statement
ANNUAL REPORT EOLUS VIND AB 2018/2019 51
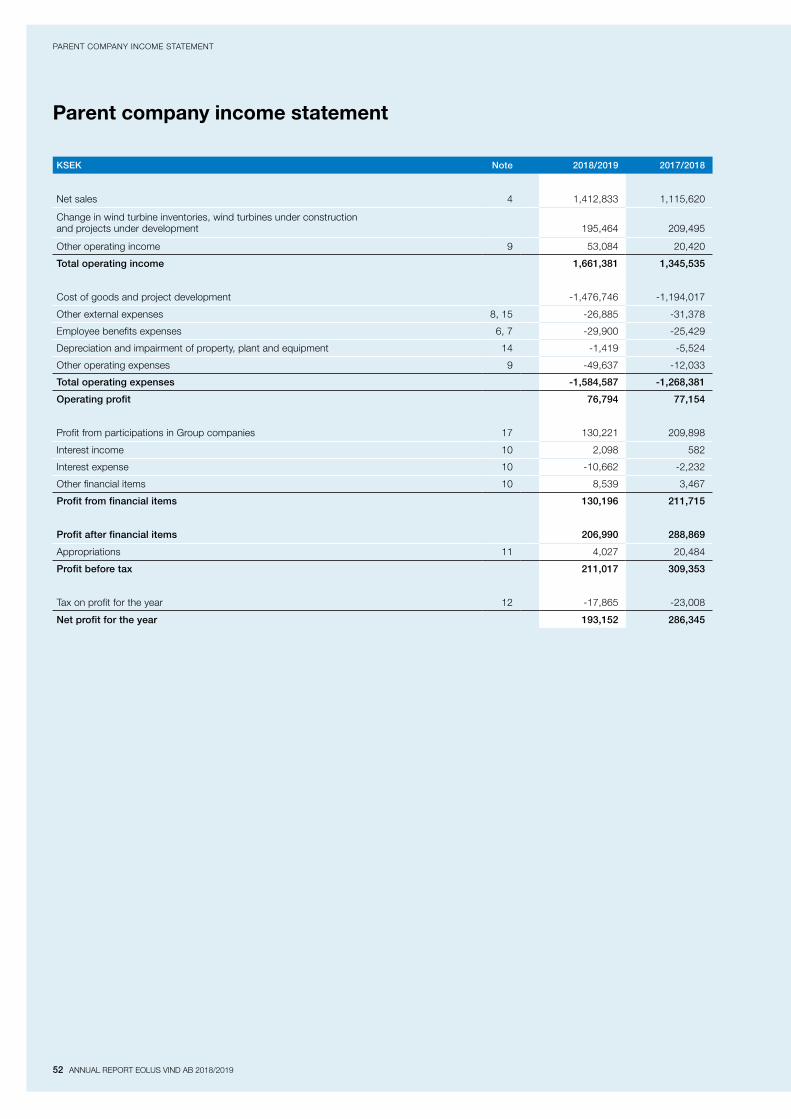
52 ANNUAL REPORT EOLUS VIND AB 2018/2019
PARENT COMPANY INCOME STATEMENT
Parent company income statement
KSEK Note 2018/2019 2017/2018
Net sales 4 1,412,833 1,115,620
Change in wind turbine inventories, wind turbines under construction and projects under development 195,464 209,495
Other operating income 9 53,084 20,420
Total operating income 1,661,381 1,345,535
Cost of goods and project development 1,476,746 1,194,017
Other external expenses 8, 15 26,885 31,378
Employee benefits expenses 6, 7 29,900 25,429
Depreciation and impairment of property, plant and equipment 14 1,419 5,524
Other operating expenses 9 49,637 12,033
Total operating expenses -1,584,587 -1,268,381
Operating profit 76,794 77,154
Profit from participations in Group companies 17 130,221 209,898
Interest income 10 2,098 582
Interest expense 10 10,662 2,232
Other financial items 10 8,539 3,467
Profit from financial items 130,196 211,715
Profit after financial items 206,990 288,869
Appropriations 11 4,027 20,484
Profit before tax 211,017 309,353
Tax on profit for the year 12 17,865 23,008
Net profit for the year 193,152 286,345
52 ANNUAL REPORT EOLUS VIND AB 2018/2019

ANNUAL REPORT EOLUS VIND AB 2018/2019 53
PARENT COMPANY STATEMENT OF OTHER COMPREHENSIVE INCOME
KSEK Note 2018/2019 2017/2018
Net profit for the year 193,152 286,345
Other comprehensive income
Other comprehensive income not to be reclassified to profit or loss in subsequent periods - -
Other comprehensive income to be reclassified to profit or loss in subsequent periods - -
Total other comprehensive income - -
Comprehensive income for the year 193,152 286,345
Parent company statement of other comprehensive income
ANNUAL REPORT EOLUS VIND AB 2018/2019 53
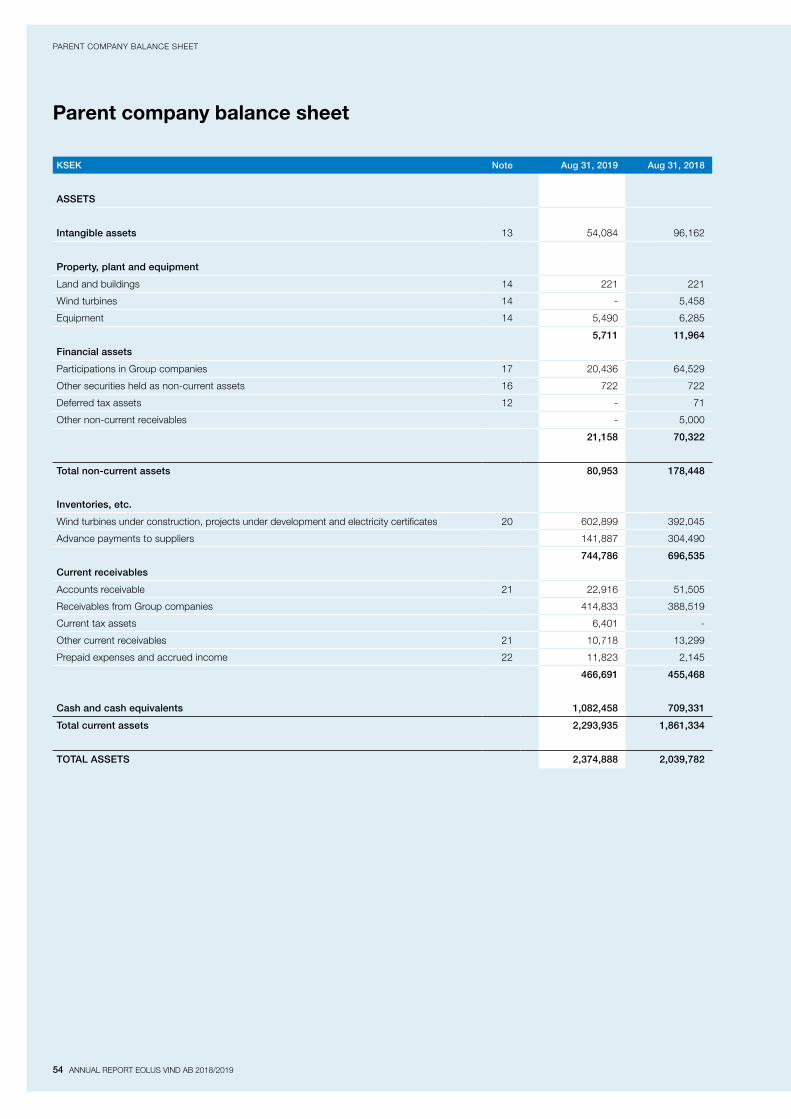
54 ANNUAL REPORT EOLUS VIND AB 2018/2019
PARENT COMPANY BALANCE SHEET
Parent company balance sheet
KSEK Note Aug 31, 2019 Aug 31, 2018
ASSETS
Intangible assets 13 54,084 96,162
Property, plant and equipment
Land and buildings 14 221 221
Wind turbines 14 5,458
Equipment 14 5,490 6,285
5,711 11,964
Financial assets
Participations in Group companies 17 20,436 64,529
Other securities held as noncurrent assets 16 722 722
Deferred tax assets 12 71
Other noncurrent receivables 5,000
21,158 70,322
Total non-current assets 80,953 178,448
Inventories, etc.
Wind turbines under construction, projects under development and electricity certificates 20 602,899 392,045
Advance payments to suppliers 141,887 304,490
744,786 696,535
Current receivables
Accounts receivable 21 22,916 51,505
Receivables from Group companies 414,833 388,519
Current tax assets 6,401 -
Other current receivables 21 10,718 13,299
Prepaid expenses and accrued income 22 11,823 2,145
466,691 455,468
Cash and cash equivalents 1,082,458 709,331
Total current assets 2,293,935 1,861,334
TOTAL ASSETS 2,374,888 2,039,782
54 ANNUAL REPORT EOLUS VIND AB 2018/2019
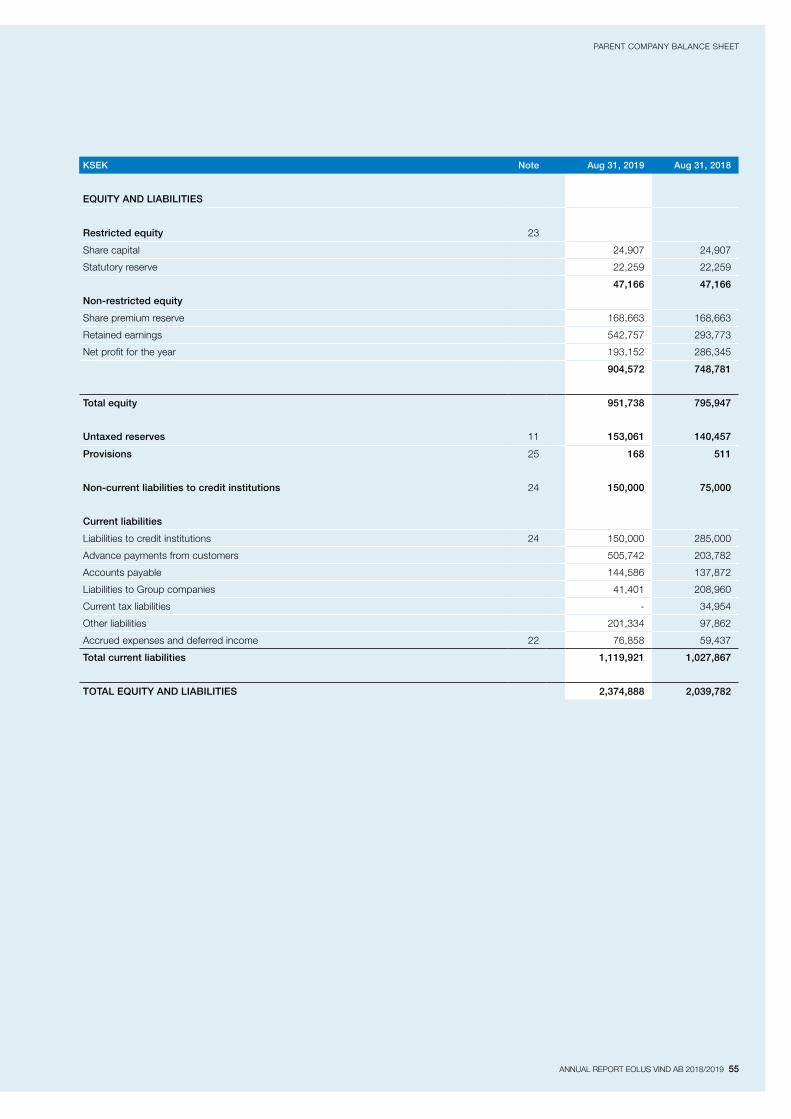
ANNUAL REPORT EOLUS VIND AB 2018/2019 55
PARENT COMPANY BALANCE SHEET
KSEK Note Aug 31, 2019 Aug 31, 2018
EQUITY AND LIABILITIES
Restricted equity 23
Share capital 24,907 24,907
Statutory reserve 22,259 22,259
47,166 47,166
Non-restricted equity
Share premium reserve 168,663 168,663
Retained earnings 542,757 293,773
Net profit for the year 193,152 286,345
904,572 748,781
Total equity 951,738 795,947
Untaxed reserves 11 153,061 140,457
Provisions 25 168 511
Non-current liabilities to credit institutions 24 150,000 75,000
Current liabilities
Liabilities to credit institutions 24 150,000 285,000
Advance payments from customers 505,742 203,782
Accounts payable 144,586 137,872
Liabilities to Group companies 41,401 208,960
Current tax liabilities 34,954
Other liabilities 201,334 97,862
Accrued expenses and deferred income 22 76,858 59,437
Total current liabilities 1,119,921 1,027,867
TOTAL EQUITY AND LIABILITIES 2,374,888 2,039,782
ANNUAL REPORT EOLUS VIND AB 2018/2019 55
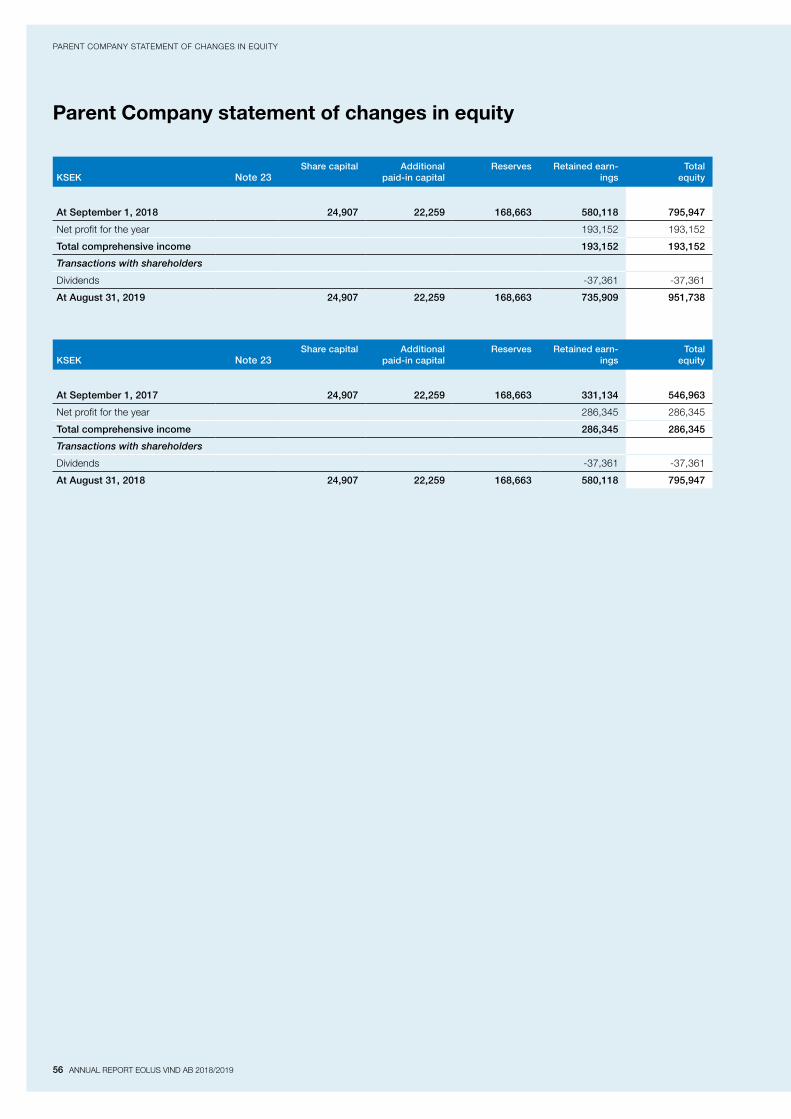
56 ANNUAL REPORT EOLUS VIND AB 2018/2019
PARENT COMPANY STATEMENT OF CHANGES IN EQUITY
Parent Company statement of changes in equity
KSEK Note 23Share capital Additional
paid-in capitalReserves Retained earn-
ingsTotal
equity
At September 1, 2018 24,907 22,259 168,663 580,118 795,947
Net profit for the year 193,152 193,152
Total comprehensive income 193,152 193,152
Transactions with shareholders
Dividends 37,361 37,361
At August 31, 2019 24,907 22,259 168,663 735,909 951,738
KSEK Note 23Share capital Additional
paid-in capitalReserves Retained earn-
ingsTotal
equity
At September 1, 2017 24,907 22,259 168,663 331,134 546,963
Net profit for the year 286,345 286,345
Total comprehensive income 286,345 286,345
Transactions with shareholders
Dividends 37,361 37,361
At August 31, 2018 24,907 22,259 168,663 580,118 795,947
56 ANNUAL REPORT EOLUS VIND AB 2018/2019

ANNUAL REPORT EOLUS VIND AB 2018/2019 57
PARENT COMPANY CASH FLOW STATEMENT
Parent Company cash flow statement
KSEK Note 2018/2019 2017/2018
Operating activities
Operating profit 76,794 77,154
Noncash items 27 195 9,234
76,989 86,388
Interest received 3,204 582
Interest paid 11,008 2,800
Income tax paid 59,149 11,580
Net cash flow from operating activities before changes in working capital 10,036 72,590
Adjustments of working capital
Decrease in wind turbine inventories, wind turbines under construction, projects under development and advance payments to suppliers 6,173 386,079
Decrease in operating receivables 4,710 246,743
Decrease in operating liabilities 448,588 644,702
Cash flow from operating activities 447,741 84,470
Cash flow from investing activities
Acquisition of participations in subsidiaries 250
Acquisition of property, plant and equipment 14 885 1,054
Sale of property, plant and equipment 14 5,644 23,101
Cash flow from investing activities 4,759 22,297
Cash flow from financing activities
Borrowings 24 721,810 360,000
Repayment of loans 24 781,810
Group contributions received/paid 17,988 98,540
Dividends 37,361 37,361
Cash flow from financing activities -79,373 421,179
Cash flow for the year 373,127 527,946
Cash and cash equivalents at beginning of year 709,331 181,385
Cash and cash equivalents at year-end 1,082,458 709,331
ANNUAL REPORT EOLUS VIND AB 2018/2019 57
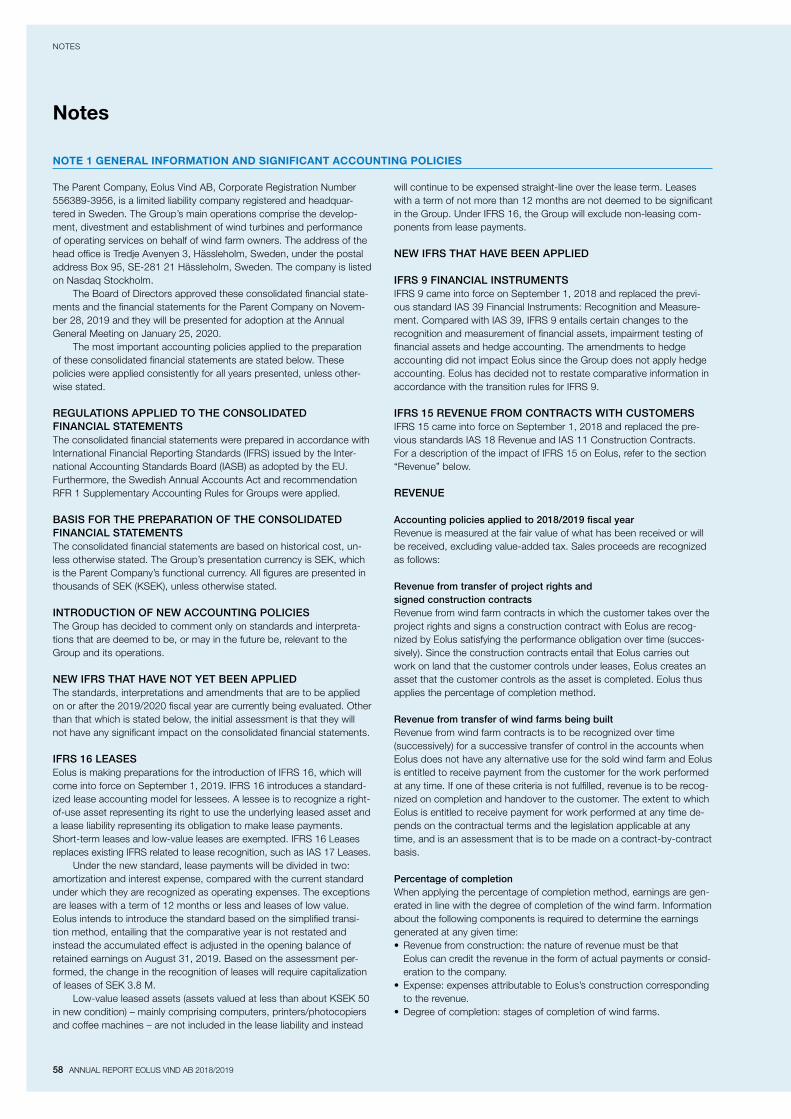
58 ANNUAL REPORT EOLUS VIND AB 2018/2019
NOTES
The Parent Company, Eolus Vind AB, Corporate Registration Number 5563893956, is a limited liability company registered and headquartered in Sweden. The Group’s main operations comprise the development, divestment and establishment of wind turbines and performance of operating services on behalf of wind farm owners. The address of the head office is Tredje Avenyen 3, Hässleholm, Sweden, under the postal address Box 95, SE281 21 Hässleholm, Sweden. The company is listed on Nasdaq Stockholm. The Board of Directors approved these consolidated financial statements and the financial statements for the Parent Company on November 28, 2019 and they will be presented for adoption at the Annual General Meeting on January 25, 2020. The most important accounting policies applied to the preparation of these consolidated financial statements are stated below. These policies were applied consistently for all years presented, unless otherwise stated.
REGULATIONS APPLIED TO THE CONSOLIDATED FINANCIAL STATEMENTSThe consolidated financial statements were prepared in accordance with International Financial Reporting Standards (IFRS) issued by the International Accounting Standards Board (IASB) as adopted by the EU. Furthermore, the Swedish Annual Accounts Act and recommendation RFR 1 Supplementary Accounting Rules for Groups were applied.
BASIS FOR THE PREPARATION OF THE CONSOLIDATED FINANCIAL STATEMENTSThe consolidated financial statements are based on historical cost, unless otherwise stated. The Group’s presentation currency is SEK, which is the Parent Company’s functional currency. All figures are presented in thousands of SEK (KSEK), unless otherwise stated.
INTRODUCTION OF NEW ACCOUNTING POLICIESThe Group has decided to comment only on standards and interpretations that are deemed to be, or may in the future be, relevant to the Group and its operations.
NEW IFRS THAT HAVE NOT YET BEEN APPLIEDThe standards, interpretations and amendments that are to be applied on or after the 2019/2020 fiscal year are currently being evaluated. Other than that which is stated below, the initial assessment is that they will not have any significant impact on the consolidated financial statements.
IFRS 16 LEASESEolus is making preparations for the introduction of IFRS 16, which will come into force on September 1, 2019. IFRS 16 introduces a standardized lease accounting model for lessees. A lessee is to recognize a rightofuse asset representing its right to use the underlying leased asset and a lease liability representing its obligation to make lease payments. Shortterm leases and lowvalue leases are exempted. IFRS 16 Leases replaces existing IFRS related to lease recognition, such as IAS 17 Leases. Under the new standard, lease payments will be divided in two: amortization and interest expense, compared with the current standard under which they are recognized as operating expenses. The exceptions are leases with a term of 12 months or less and leases of low value. Eolus intends to introduce the standard based on the simplified transition method, entailing that the comparative year is not restated and instead the accumulated effect is adjusted in the opening balance of retained earnings on August 31, 2019. Based on the assessment performed, the change in the recognition of leases will require capitalization of leases of SEK 3.8 M. Lowvalue leased assets (assets valued at less than about KSEK 50 in new condition) – mainly comprising computers, printers/photocopiers and coffee machines – are not included in the lease liability and instead
will continue to be expensed straightline over the lease term. Leases with a term of not more than 12 months are not deemed to be significant in the Group. Under IFRS 16, the Group will exclude nonleasing components from lease payments.
NEW IFRS THAT HAVE BEEN APPLIED
IFRS 9 FINANCIAL INSTRUMENTSIFRS 9 came into force on September 1, 2018 and replaced the previous standard IAS 39 Financial Instruments: Recognition and Measurement. Compared with IAS 39, IFRS 9 entails certain changes to the recognition and measurement of financial assets, impairment testing of financial assets and hedge accounting. The amendments to hedge accounting did not impact Eolus since the Group does not apply hedge accounting. Eolus has decided not to restate comparative information in accordance with the transition rules for IFRS 9.
IFRS 15 REVENUE FROM CONTRACTS WITH CUSTOMERSIFRS 15 came into force on September 1, 2018 and replaced the previous standards IAS 18 Revenue and IAS 11 Construction Contracts. For a description of the impact of IFRS 15 on Eolus, refer to the section “Revenue” below.
REVENUE
Accounting policies applied to 2018/2019 fiscal yearRevenue is measured at the fair value of what has been received or will be received, excluding valueadded tax. Sales proceeds are recognized as follows:
Revenue from transfer of project rights and signed construction contracts Revenue from wind farm contracts in which the customer takes over the project rights and signs a construction contract with Eolus are recognized by Eolus satisfying the performance obligation over time (successively). Since the construction contracts entail that Eolus carries out work on land that the customer controls under leases, Eolus creates an asset that the customer controls as the asset is completed. Eolus thus applies the percentage of completion method.
Revenue from transfer of wind farms being builtRevenue from wind farm contracts is to be recognized over time (successively) for a successive transfer of control in the accounts when Eolus does not have any alternative use for the sold wind farm and Eolus is entitled to receive payment from the customer for the work performed at any time. If one of these criteria is not fulfilled, revenue is to be recognized on completion and handover to the customer. The extent to which Eolus is entitled to receive payment for work performed at any time depends on the contractual terms and the legislation applicable at any time, and is an assessment that is to be made on a contractbycontract basis.
Percentage of completionWhen applying the percentage of completion method, earnings are generated in line with the degree of completion of the wind farm. Information about the following components is required to determine the earnings generated at any given time:• Revenue from construction: the nature of revenue must be that
Eolus can credit the revenue in the form of actual payments or consideration to the company.
• Expense: expenses attributable to Eolus’s construction corresponding to the revenue.
• Degree of completion: stages of completion of wind farms.
Notes
NOTE 1 GENERAL INFORMATION AND SIGNIFICANT ACCOUNTING POLICIES
ANNUAL REPORT EOLUS VIND AB 2018/2019 59
NOTES
The fundamental condition for the percentage of completion method is that it must be possible to reliably quantify revenue and expenses based on the degree of completion. The effect of the percentage of completion method is that the earnings trend of construction in progress is directly reflected in the accounts. Percentage of completion involves an element of uncertainty. Sometimes unforeseen events occur that make the end result of construction projects either higher and lower than expected. It is particularly difficult to assess results at the start of construction projects and for projects that extend over a long period of time. Provisions for losses are established as soon as they become known. Balance sheet items, accrued income and advance payments from customers are recognized net on a projectbyproject basis. The construction projects that have higher accrued income than advance payments from customers will be recognized as current assets, while the projects that have higher advance payments from customers than accrued income will be classified as noninterestbearing current liabilities.
Financial effects of transition to IFRS 15The percentage of completion method is applied to construction projects, once the terms have been fulfilled, for the fiscal year beginning September 1, 2018. Since work on construction in progress had commenced on September 1, 2018, but no stages had been completed, there was no change to the financial statements on the transition to IFRS 15 related to the percentage of completion method. However, opening equity was negatively impacted by approximately SEK 20 M on September 1, 2018 due to a variable parameter for determining the final price in a contract with a customer. Advance payments from customers were impacted in a corresponding amount.
Sale of administrative and technical management servicesRevenue from administrative and technical management services is recognized in the period in which the services were essentially carried out.
Sale of electricityRevenue attributable to the sale of produced electricity is recognized in the period in which delivery is made.
InterestInterest income is recognized as financial income through application of the effectiveinterest method.
DividendsDividends are recognized in profit or loss when the shareholders’ rights to receive payment have been determined.
Accounting policies applied to 2017/2018 fiscal yearRevenue is recognized to the extent that it is probable that the economic benefits will accrue to the Group and if revenue can be reliably measured. Revenue is measured at the fair value of what has been received or will be received, excluding valueadded tax. Sales proceeds are recognized when the following criteria have been fulfilled:
Sale of wind power facilitiesRevenue is recognized when the material risks and benefits associated with ownership of the facilities have been transferred to the purchaser and when the amount of revenue can be reliably measured. The projects comprise three phases: prestudy, project development and establishment. The establishment stage is completed after final commissioning. Revenue is recognized in net sales in connection with handover to the customer. For cases in which the customer takes over the project rights and signs a construction contract with Eolus, revenue is recognized on the sale of the project company that normally includes project rights and permits for the farm, and on the date of the handover of the wind farm under the construction contract with Eolus for the construction of the wind farm. Since there are relatively few, but large, projects in the establishment stage at any one time, sales and earnings may vary considerably from quarter to quarter and fiscal year to fiscal year. The project development operations are mainly financed by equity, advance payments from customers and credit facilities.
CONSOLIDATION BASISThe consolidated financial statements encompass the Parent Company and its subsidiaries. The financial statements for the Parent Company and subsidiaries included in the consolidated financial statements pertain to the same period and have been prepared in accordance with the same accounting policies as for the Group.
SubsidiariesSubsidiaries are defined as all companies over which the Group exercises a controlling influence. The Group controls a company when the Group is exposed to, or has rights to, variable returns from its holding in the company and has the ability to impact those returns through exercising its influence over the company. Subsidiaries are included in the consolidated financial statements from the acquisition date, meaning the date on which the Group gains a controlling influence, and are included in the consolidated financial statements until the date on which the controlling influence ceases. Business combinations are recognized in accordance with the acquisition method. The purchase consideration comprises the fair value of acquired assets, liabilities and issued shares. The purchase consideration also includes the fair value of all assets and liabilities that are part of any contracted, contingent purchase considerations. Acquisition related costs are expensed when they arise and are recognized as other expenses. Identifiable assets acquired and liabilities assumed are initially measured at fair value on the acquisition date. For each acquisition, the Group determines whether all noncontrolling interests in the acquired company are measured at fair value or at the proportionate share of net assets of the acquired company. The amount by which the purchase consideration, any noncontrolling interests and the fair value of previous shareholdings exceeds the fair value of the Group’s share of identifiable assets acquired is recognized as goodwill. If the amount is less than the fair value of the acquired subsidiary’s assets, the difference is recognized directly in the statement of comprehensive income. In accordance with common practice in the industry, wind power projects are often conducted in separate companies. This means that acquisitions and divestments of projects and completed wind turbines are conducted as share transactions. These transactions are classified as asset acquisitions since the main aim is to acquire or divest wind power projects and there are either no other operations or administration, or these are of minor importance. The assets that are acquired in this manner are measured at fair value in the consolidated financial statements, and no goodwill arises.
Associated companiesAssociated companies are companies over which the Group exercises a significant but not a controlling influence, which generally applies to shareholdings comprising between 20% and 50% of the votes. Holdings in associated companies are recognized in accordance with the equity method and are initially measured at cost and, thereafter, the carrying amount is increased or decreased to recognize the Group’s share of the associated company’s profit or loss after the acquisition date.
Non-controlling interestsNoncontrolling interests are the portion of the earnings and net assets of a nonwholly owned subsidiary that accrue to other owners than Parent Company shareholders. Their share of earnings is included in net profit for the year in the consolidated income statement and the share of net assets is included in equity in the consolidated statement of financial position.
Translation of accounts of foreign subsidiariesItems in the subsidiaries’ balance sheets are presented in their respective functional currencies, which is normally the same as the local currency in that specific country. The Group’s financial statements are presented in SEK, which is the Parent Company’s functional currency. The income statements and balance sheets of the foreign subsidiaries are translated to SEK. The balance sheets are translated at the closing day rate. The income statements are translated at the average exchange rate

60 ANNUAL REPORT EOLUS VIND AB 2018/2019
NOTES
for the period. Exchange rate differences arising on translation do not impact net profit for the year and instead are recognized in other comprehensive income in the consolidated financial statements. The foreign exchange rates recognized under the section “Receivables and liabilities in foreign currencies” were used.
RECEIVABLES AND LIABILITIES IN FOREIGN CURRENCIESReceivables and liabilities in foreign currencies are translated at the closing day rate, and unrealized exchange rate gains and losses are included in profit or loss.
EUR NOK USD
Closing day rate, Aug 31, 2019 10.8078 1.0750 9.7905
Average exchange rate for the period 2018/2019 10.4834 1.0794 9.2496
Closing day rate, Aug 31, 2018 10.6372 1.0929 9.1044
Average exchange rate for the period 2017/2018 10.0493 1.0497 8.4305
RELATED-PARTY TRANSACTIONSTransactions with related parties are subject to marketbased conditions. Related parties refer to the companies over which the Group exercises a controlling or significant influence in terms of operational and financial decisionmaking. The sphere of related parties also includes the companies and natural persons who have the opportunity to exercise a controlling or significant influence over the Group’s financial and operational decisions.
SEGMENT REPORTINGOperating segments are recognized in a manner that corresponds to the internal reporting to the chief operating decision maker (CODM). The CODM is the function that is responsible for allocating resources and assessing the performance of the operating segments. For the Group, this function has been identified as the CEO.
Eolus’s operating segments are described in Note 3 and comprise: • Project development involving prestudy, project development, divest
ment and establishment of wind farms. This also includes technical consultancy services for wind power stakeholders.
• Asset management which pertains to full asset management services for external and internal wind power facilities.
• Electricity generation encompassing the operation of owned wind turbines, the sale of electric power and electricity certificates pertaining to these wind turbines.
CASH FLOW STATEMENTThe cash flow statement was prepared in accordance with the indirect method. The recognized cash flow only includes transactions entailing incoming and outgoing payments. Cash and cash equivalents are included in cash and bank balances, and current investments with insignificant value fluctuations and original due dates of less than three months.
INTANGIBLE ASSETSIn connection with the divestment of the Jenåsen wind farm, Eolus acquired the right to 96% of the electricity certificates that the wind farm will generate over the 15year certificate period. This right was acquired for a nonrecurring amount and recognized as an intangible asset. Electricity certificates are recognized as inventory as they are issued, at which point productionbased amortization of the intangible asset item will take place.
PROPERTY, PLANT AND EQUIPMENTProperty, plant and equipment are recognized at cost less accumulated depreciation and any impairment. Expenses for improving the performance of the assets beyond the original level increase the carrying amount of the assets. Expenses for repairs and maintenance are recognized as costs in profit or loss.
Property, plant and equipment are depreciated systematically over the estimated useful lives of the assets. The useful life is tested at the end of every accounting period and is adjusted as necessary. Any residual value of the asset is taken into account when determining the depreciable amount of the asset. The straightline depreciation method is applied to all types of assets.
The following depreciation periods are applied: Number of yearsBuildings and land improvements 20 yearsWind turbines, foundations and electrical installations 20 yearsEquipment 35 years
IMPAIRMENT OF NON-FINANCIAL ASSETSIf there is an indication that an asset subject to depreciation has declined in value, the recoverable amount of the asset is calculated. The asset is impaired to its recoverable amount if the calculated recoverable amount is less than the carrying amount. The recoverable amount is the highest of the net realizable value and value in use in the operations. For wind power facilities recognized as noncurrent assets or inventories, impairment testing takes place at the end of every quarter by preparing calculations showing the remaining expected cash flows of each asset. The key parameters in preparing these calculations are the assumptions regarding future generation, remaining service lives, the market prices of electricity and electricity certificates, operating expenses and the discount rate.
FINANCIAL INSTRUMENTSFinancial instruments recognized in the statement of financial position include, on the assets side, derivative receivables, accounts receivable, other receivables, participations in unlisted companies, and cash and cash equivalents. The liabilities side includes derivative liabilities, accounts payable, other liabilities and accrued interest expense.
Recognition and derecognition from statement of financial position A financial asset or financial liability is recognized in the statement of financial position when Eolus becomes party to the contractual provisions of the instrument. Accounts receivable are recognized in the statement of financial position when an invoice has been sent. Liabilities are recognized when the counterparty has performed and has a contractual obligation to pay. Accounts payable are recognized when an invoice has been received. A financial instrument is derecognized from the statement of financial position when the contractual rights have been realized, expire or Eolus relinquishes control of them. A financial liability is derecognized from the statement of financial position when the contractual obligation has been discharged or otherwise extinguished. Ondemand acquisitions and sales of financial assets are recognized on the settlement date. The settlement date is the date on which an asset is delivered to or from the company.
Recognition and measurement of financial assets Purchases and sales of financial assets are recognized at the trade date, that is, the date on which the Group commits to purchase or sell the asset. Financial instruments are initially measured at fair value plus transaction costs, which applies to all financial assets not measured at fair value through profit or loss. Financial assets measured at fair value through profit or loss are initially measured at fair value, while attributable transaction costs are recognized in profit or loss. Financial assets are derecognized from the balance sheet when the right to receive cash flows from the instrument has expired or been transferred and the Group has assumed essentially all risks and benefits connected with the right of ownership. Financial assets measured at fair value through profit or loss are measured at fair value after the date of acquisition. Loan receivables and accounts receivable are initially recognized after the date of acquisition at amortized cost by applying the effective interest method. Dividend income from securities is recognized in profit or loss as a portion of financial income once the Group’s right to receive payment has been established.

ANNUAL REPORT EOLUS VIND AB 2018/2019 61
NOTES
Impairment principles for financial assets At the end of each reporting period, the Group assesses whether there is objective evidence that a financial asset or group of financial assets requires impairment. A financial asset or group of financial assets requires impairment and is impaired only if there is objective evidence of an impairment requirement due to one or more events having occurred after the asset was first recognized (a loss event) and that this event (or these events) has an effect, that can be reliably estimated, on the estimated future cash flows for the financial asset or group of financial assets. For the loan receivables and accounts receivable categories, impairment is calculated as the difference between the carrying amount of the asset and the present value of estimated future cash flows (excluding future loan losses that have not occurred), discounted to the original effective interest of the financial asset. The asset’s carrying amount is impaired and this impairment loss is recognized in the consolidated income statement.
Recognition and measurement of financial liabilitiesFinancial liabilities measured at fair value through profit or loss comprise currency and interest rate derivatives. Other financial liabilities are initially measured at fair value less any transaction costs that have arisen. In subsequent periods, these liabilities are measured at amortized cost in accordance with the effective interest method. Eolus’s accounts payable, borrowing and other current liabilities and accrued expenses are included in this category.
Recognition of financial assets and financial liabilities in 2017/2018 fiscal yearIn the 2017/2018 fiscal year, the Group’s financial assets were recognized in the following categories in accordance with IAS 39: • Availableforsale financial assets.• Financial assets measured at fair value through profit or loss. • Loan receivables and accounts receivable measured at amortized cost
using the effective interest method.
In the 2017/2018 fiscal year, the Group’s financial liabilities were recognized in the following categories in accordance with IAS 39: • Financial liabilities measured at fair value through profit or loss. • Financial liabilities measured at amortized cost.
FAIR VALUE MEASUREMENTFair value is the price that would be received at the measurement date on selling an asset or paid on transferring a liability in an orderly transaction between market participants at the measurement date. Financial instruments measured at fair value are classified either as fair value in profit or loss or available for sale. Measurement can be based on any of the following conditions:• Quoted market prices (unadjusted) in active markets for identical
assets or liabilities (level 1).• Inputs other than quoted prices that are observable for the asset or
liability, either directly (quoted prices) or indirectly (derived from quoted prices) (level 2).
• Unobservable market inputs for the asset or liability (level 3).
The fair value of financial instruments traded in an active market is based on quoted market prices on the balance sheet date. A market is considered to be active if quoted prices from a stock exchange, broker, industrial group, pricing service or supervisory authority are readily and regularly available and these prices represent actual and regularly occurring market transactions at arm’s length. The fair value of financial instruments not traded in an active market (for example, OTC derivatives) is determined using valuation techniques. Market information is used for this as far as possible when it is available, whereas companyspecific information is used as little as possible. If all significant inputs required for measurement are observable, then level 2 measurement is applied. The fair value of unquoted securities is based on cash flows discounted at an interest rate based on the market interest rate and a risk markup specific to these unquoted securities. The fair value of currency futures is determined by using the exchange rates for currency futures on the bal
ance sheet date where the resulting value is discounted to the present value, meaning level 2. Eolus currently recognizes all financial instruments at level 2. If one or more significant inputs are not based on observable market information, the instrument in question is classified as level 3. Eolus does not currently recognize any financial instruments belonging to this category. No reclassifications between the various categories took place during the period.
WIND TURBINE INVENTORIES, WIND TURBINES UNDER CONSTRUCTION, PROJECTS UNDER DEVELOPMENT AND ELECTRICITY CERTIFICATESWind turbine inventories are the wind turbines that are available for sale, but that are operational and generate electricity. At the end of every quarter, a wind turbine that has not been divested after 12 months is reclassified from an inventory to a tangible asset. An exception can be made if divestment discussions are advanced and expected to lead to divestment of the turbine in the near future. Wind turbines classified as inventories have been measured at adjusted cost, meaning that the carrying amount of each wind turbine is adjusted each quarter to meet the decline in value that takes place. The procedure is described in more detail under the heading “Impairment of nonfinancial assets.” Wind turbines classified as noncurrent assets are reclassified to wind turbine inventories before being divested. Reclassification also takes place in cases where divestment discussions are advanced and expected to lead to divestment of the turbine in the next quarter. Sales of wind turbines in inventories are recognized under net sales. Wind turbines under construction are wind turbines that are being built. Projects under development are the project development activities being conducted. All projects that have incurred costs of at least KSEK 10 are included in the portfolio. The project portfolio is reviewed at the end of every quarter and impairment losses are recognized if, for example, a project has not been approved by the regulator. Wind turbines under construction and projects under development are measured at the lowest of costs incurred and fair value. The right to electricity certificates acquired by Eolus in connection with the divestment of the Jenåsen wind farm was recognized as an intangible asset. Electricity certificates are recognized as inventory as they are issued.
PROVISIONSProvisions are recognized when the Group has a legal or informal commitment due to previous events and when it is probable that a payment will be required to settle the commitment and the amount can be reliably calculated. For cases in which the company expects an established provision to be compensated by an external party, for example, within the framework of an insurance contract, such expected compensation is recognized as a separate asset, but only when it is essentially certain that compensation will be received. If the time value is significant, the future payment is calculated at its present value. The calculations are made by applying a discount rate that reflects the shortterm market expectations taking into account specific risks associated with the commitment. An increase in the commitment is recognized as an interest expense.
Provisions for after-treatment costsAccording to the Swedish Environmental Code, the regulatory authority is entitled to require that guarantees be provided for security with respect to dismantling and aftertreatment of the wind power facility. The main costs for dismantling and aftertreatment are estimated for each facility with guidance from investigations carried out for specific turbines. Provisions are established at the present value of the calculated future cost. Provisions are continuously adjusted upward using the discount rate and this upward adjustment is recognized as a borrowing cost (interest expense). The asset’s carrying amount is adjusted if it is classified as a noncurrent asset.
62 ANNUAL REPORT EOLUS VIND AB 2018/2019
NOTES
CONTINGENT LIABILITIESContingent liabilities comprise possible commitments originating from events that have occurred and whose occurrence is confirmed only by the occurrence or nonoccurrence of one or several uncertain future events, which are not within Eolus’s control. Contingent liabilities may also be a commitment originating from events that have occurred but that have not been recognized as a liability or a provision because it is not likely that the commitment will be settled or the amount of the commitment cannot be reliably calculated.
EMPLOYEE BENEFITS
Severance paySeverance pay is paid when employment is terminated before the normal age of retirement or when the employee accepts voluntary redundancy in exchange for such remuneration. Eolus recognizes severance pay when the Group has an existing legal or informal commitment when it is more probably that an outflow of resources will be required to settle the commitment than not, and when the amount can be reliably calculated.
PensionsEolus’s pension obligations only encompass definedcontribution plans. A definedcontribution plan is a pension plan under which the Group pays fixed contributions to a separate legal entity. The Group does not have any legal or informal obligations to pay additional contributions if this legal entity does not have sufficient assets to pay all of the remuneration to the employees that is associated with the employees’ service in current and earlier periods. The Group’s payments into definedcontribution pension plans are charged to net profit for the year in the year to which they are attributable.
LeasesNoncurrent assets utilized under leases are classified in accordance with the financial implication of the lease. The leasing of noncurrent assets, whereby the Group essentially assumes the risks and benefits associated with ownership, are classified as finance leases. Financial leases are recognized at the start of the lease term at the lower of the fair value of the leasing object and the present value of the minimum leasing fees. Other leases are classified as operating leases. Payments made over the lease period are expensed in profit or loss in a straight line over the lease term. Eolus only has leases classified as operating leases.
INCOME TAXThe tax expense for the period includes current and deferred tax. Tax is recognized in profit or loss, except when the tax pertains to items recognized in other comprehensive income or directly in equity. In such cases, the tax is also recognized in other comprehensive income and equity, respectively. All tax liabilities and tax assets are valued at nominal amounts in accordance with the tax rules and at the tax rates decided or announced and which, with all likelihood, will be adopted. Deferred tax is recognized on the balance sheet date in accordance with the balance sheet method for temporary differences between the tax and accounting values of the assets and liabilities. Deferred tax assets are recognized for all deductible temporary differences, including loss carryforwards, to the extent that it is probable that a taxable profit will be available against which the deductible temporary differences can be utilized.
ASSESSMENTS, ESTIMATES AND ASSUMPTIONSCertain estimates and assumptions are made when the Board of Directors and CEO prepare the financial statements in accordance with applicable accounting policies that affect the carrying amounts of assets, liabilities, income and costs. The areas in which estimates and assumptions are of great significance to the Group and that could impact the income statement and balance sheet if they were to change are described below:
Percentage of completionPercentage of completion involves an element of uncertainty. Sometimes unforeseen events occur that make the end result of construction proj
ects either higher and lower than expected. It is particularly difficult to assess results at the start of construction projects and for projects that extend over a long period of time. Provisions for losses are established as soon as they become known.
Provisions for doubtful receivablesAccounts receivable are initially measured at fair value and thereafter at the expected realizable value. An estimate of doubtful receivables is based on the conduct of an objective evaluation of all amounts outstanding at the end of the year. Losses attributable to doubtful receivables are recognized in profit or loss under other operating expenses. Refer to Note 10.
After-treatment costsThe costs for dismantling and aftertreatment are estimated for each facility with guidance from investigations carried out for specific turbines. The basis is a standard value per megawatt (MW) of installed capacity. The residual value is handled as a deductible item in the disposal analysis and is taken into account in these standard amounts. The time factor is taken into account through discounting. The price trend can be assumed to be equal to the longterm inflation target of 2%, while a certain level of technological progress should reduce the cost trend. These assumptions are continuously evaluated.
Legal disputesProvisions for disputes are estimates of the future cash flows required to settle obligations. Disputes primarily refer to contractual obligations pertaining to agreements with customers and suppliers, but other types of disputes also arise in the course of normal business activities.
ASSESSMENT OF USEFUL LIVES FOR PROPERTY, PLANT AND EQUIPMENTBased on experience gained and in light of improvements in technological performance, the Board has deemed that a depreciation period of 20 years reflects the expected useful life of wind turbines. These assumptions that form the basis of the assessment are continuously reevaluated and local differences are also taken into consideration. The useful lives for all components of the wind turbines, foundations and electrical installations are deemed to be the same, which is why there is no further division.
ASSESSMENT OF IMPAIRMENT REQUIREMENTS FOR WIND POWER PROJECTSAt the end of every quarter, the carrying amounts of the Group’s project portfolio are analyzed to determine whether any indications exist that these carrying amounts have declined. Should such an indication exist, a comparison is made between the estimated final establishment cost and the project’s acquisition value to an investor. An impairment requirement exists if the estimated establishment cost is higher than the acquisition value of the project to an investor. Other factors, such as permits, could also impact the realizability of the project and thus its value. Any impairment is recognized directly in profit or loss.
PARENT COMPANY’S ACCOUNTING POLICIES The Parent Company prepares its annual reports in accordance with the Swedish Annual Accounts Act and the Swedish Financial Accounting Standards Board’s recommendation RFR 2 Accounting for Legal Entities. RFR 2 entails that the Parent Company’s annual report for the legal entity is to apply all IFRSs and statements approved by the EU as far as possible under the framework of the Annual Accounts Act and by taking into account the connection between accounting and taxation. The recommendation also states the exceptions and additions that may be made compared with reporting under IFRS. The Group’s and the Parent Company’s accounting policies have the following differences. Participations in subsidiaries are recognized in the Parent Company according to the cost method. Certain financial assets are measured at fair value in the consolidated financial statements. These are measured at the lower of cost and fair value in the Parent Company’s accounts. The Parent Company recognizes appropriations in

ANNUAL REPORT EOLUS VIND AB 2018/2019 63
NOTES
FINANCIAL RISK MANAGEMENT AT EOLUSThrough its operations, Eolus is exposed to a variety of financial risks: market risk (interest rate risk, currency risk and energy price risk), credit risk and liquidity and refinancing risk. The Group’s overall risk management focuses on the unpredictably of the financial markets and seeks to minimize potentially adverse effects on the Group’s earnings. These financial risks include the impact of changed interest expense for floating interest loans, the impact of sales in EUR on wind farms, the impact of exchange rate fluctuations on wind turbine purchases in EUR, the risk of changes in electricity and electricity certificate prices, the risk of the company not having access to the necessary financing for future projects and the company having insufficient shortterm liquidity to meet its existing payment commitments. Risk is managed by the finance function following a written finance and risk policy that is adopted every year by the Board of Directors if changes are made, otherwise its current form applies. Followups of the Group’s finance and risk policy are reported to the Board every quarter.
MARKET RISKEolus’s primary operations comprise developing and divesting wind farms. Most of the company’s market risks are both direct and indirect since Eolus’s customers also need to manage these risks and Eolus may thus be indirectly impacted by lower demand and/or lower sales prices.
Interest rate riskEolus’s customers usually borrow for their investments in wind power. Consequently, interest rates affect demand for wind farms. The Group’s loans are primarily attributable to the construction of wind farms. Interest on these credit facilities is currently floating, refer to Note 24. Borrowing raised at fixed interest rates exposes the Group to interest rate risk pertaining to fair value. Changes in market interest rates can have an impact on future earnings and profitability, mainly regarding wind farms under construction if they are financed by bank loans. Under the adopted finance and risk policy, the average fixedinterest term linked to electricity generation is not to be less than 2.5 years and the nominal amount for interest rate derivatives is not to exceed 100% of interestbearing liabilities to credit institutions. This can be achieved by a combination of fixedinterest loans, loans at variable interest rates and derivative instruments. The aim of interest rate derivatives is to swap floating interest rates for fixed interest rates. At August 31, 2019, the Group had interest rate derivatives outstanding that amounted to a nominal SEK 90 M (90), of which SEK 45 M falls due in 2020 and SEK 45 M in 2023. Including interest rate derivatives, the loan portfolio had an average fixedinterest period of 0.7 years on the closing date. Interestbearing liabilities amounted to SEK 302.9 M (368.7) at August 31, 2019. On the closing date, more than 100% (100) of the Group’s liabilities to credit institutions, attributable to electricity generation operations, were covered by interest rate hedging instruments. The deviations from the finance and risk policy were approved by the Board of Directors. Excluding interest rate derivatives, the average interest rate was 2.0% (1.85). Including interest rate derivatives, the average interest rate was 2.5% (2.3). A change in interest rates of +/ 1 percentage point would have an earnings impact of +/ SEK 3.0 M (3.7). A corresponding change would have an earnings impact of +/ SEK 2.1 M (11) attributable to the market value of interest rate derivatives.
Currency riskEolus’s currency risk exposure primarily arises through a large portion of sales of wind farms and purchases of wind turbines taking place in EUR. Exchange rate fluctuations can thus affect the profitability of wind farm projects. The Group’s finance and risk policy stipulates how the risk of negative effects of changes in exchange rates is to be managed. The policy entails that at least 75% and at most 125% of the forecast net flow (inward and outward payments in EUR) within 12 months is to be managed using, for example, currency futures, currency swaps, loans in foreign currency or currency deposits. Calculated flows later than 12 months but within 24 months may be managed at a maximum of 75%. The risk inherent in forecast flows later than 24 months is not managed. At August 31, 2019, the Group had outstanding currency hedges amounting to a nominal EUR 68.0 M (10.0). All currency futures fall due within 12 months and pertain to sales forwards. Signed currency futures, together with forecast inflows for the next 12 months, amount to about 91% of forecast outflows. The forecast net inflow includes the agreed purchase consideration for wind farms under construction, and raised and repaid loans in EUR. The EUR/SEK and EUR/NOK rates were hedged during the year. A change in the EUR/SEK exchange rate of SEK 1 at the end of the fiscal year would result in an earnings impact of +/ SEK 60.5 M (2.9), given the translation of currency accounts and currency futures outstanding at August 31, 2019. A change in the EUR/NOK exchange rate of NOK 1 at the end of the fiscal year would result in an earnings impact of +/ SEK 7.5 M.
Energy price riskThe market price of electricity varies over time and the price trend of electricity certificates depends on the rate at which the generation of renewable electricity is expanded in relation to the quota obligation that consumers have to purchase electricity certificates. The future transfer price of electricity and electricity certificates is the single most important parameter in customers’ investment calculations. As a result, fluctuations in the price of electricity affect the Group’s potential customers. Accordingly, Eolus’s operations are affected in both the short and long term by trends in the forward market for electricity and electricity certificates. Eolus closely follows the market to understand how it works and its correlation to the price of other energy sources and business cycles, etc.
CREDIT RISKCredit risk, or counterparty risk, is defined as the risk of incurring a loss if the counterparty does not fulfill its commitments. Commercial credit risk encompasses customers’ solvency and is managed by closely monitoring payment behavior, following up customers’ financial statements and maintaining regular communication. The Group’s total credit risk is divided each year between a small number of customers that account for a relatively large percentage of the Group’s accounts receivable, refer to Note 21. All customers are highly transparent. During periods of temporary excess liquidity, investments may only be made by deposits with banks that are under the supervision of a financial supervisory agency in a Nordic country or by deposits with or purchases of instruments issued by the Swedish National Debt Office. The fixedterm period for each individual investment of surplus liquidity may not be longer than three months. Investments with longer fixedterm periods require separate decisions.
NOTE 2 FINANCIAL RISK MANAGEMENT
accordance with the alternative method stated in RFR 2 Accounting for Legal Entities. The amounts deposited in untaxed reserves comprise taxable temporary differences. Deferred tax liabilities attributable to the untaxed reserves are not recognized separately in the Parent Company due to the connection between accounting and taxation. The amounts are included in untaxed reserves instead. None of the amendments to RFR 2 Accounting for Legal Entities have impacted the Parent Company’s financial statements.
AMENDMENTS TO RFR 2 THAT HAVE NOT YET COME INTO FORCENone of the coming amendments to RFR 2 are expected to have a significant impact on the Parent Company’s financial statements.

64 ANNUAL REPORT EOLUS VIND AB 2018/2019
NOTES
InvestmentsThe Group’s cash flow generated from operating activities and from the divestment of wind farms is used for developing new projects and financing operating activities. Surplus liquidity is to be invested with counterparties that have high credit ratings and thus low credit risk. The Group’s risks regarding interest income are relatively limited. The current interest rate of 0% on bank balances entails that there is no interest income from credit institutions for the 2018/2019 fiscal year.
LIQUIDITY AND REFINANCING RISKThe company’s operations are financed by borrowings from credit institutions in addition to equity. Liquidity risk is defined as the risk of the Group being adversely affected by shortcomings in managing and controlling cash and cash equivalents and payment flows. Refinancing risk pertains to the risk of experiencing difficulties in securing financing for the operations at a given point in time. Eolus’s project operations largely comprise establishing wind farms for which customer contracts have already been signed. The company works continuously on preparing 36month cashflow forecasts for the Group. The management closely monitors rolling forecasts for trends in net debt/cash flows and to ensure that the Group has sufficient liquidity available to meet operational needs. For wind farms that are sold as operational to customers, the company endeavors to match payment plans, in terms of liquidity, from customers with the plans that the company has with the largest suppliers of each specific project.Eolus secured financing for the next four years in September. The credit agreement, signed with Swedbank, comprises liquidity and construction loans totaling SEK 1,050 M. The agreement has secured funding for Eolus’s expansion in this forthcoming period in terms of both ongoing and future establishments in which Eolus is responsible for financing during the construction phase, and ensuring strong liquidity in the ongoing operations. Given that some wind turbines are available for sale and that the mortgaged facilities that conduct electricity generation are covered by
separate loans, the Board stipulated in its finance and risk policy that new loans are to be raised with short tenors. However, the company has previous credit facilities of SEK 2.9 M (8.7) with long tenors, and that fall due later than five years. Loans are to be raised with different credit institutions to reduce refinancing risk. A shorter term structure requires a higher equity/assets ratio and liquidity preparedness. The Group’s equity/assets ratio may not fall below 30%. Continuous dialog is maintained with credit institutions for renegotiating new facilities in good time prior to due dates. To achieve optimal and costefficient access to financing, such financing is to be matched to the plans for forthcoming wind power projects. Separate covenants are in place for liabilities to credit institutions. Covenants for current credit agreements pertain to the equity/assets ratio and available liquidity. If these undertakings are not met, the bank can withdraw the credit facilities. In the 2018/2019 fiscal year, all of the covenants to credit institutions were met. Interestbearing liabilities amounted to SEK 302.9 M (368.7), of which SEK 2.9 M (8.7) is noncurrent. The fixedterm period for loans amounted to about one year (one) at the end of the fiscal year, with an average interest rate of 2.0% (1.85) excluding interest rate derivatives. Refer to Note 18 for disclosures about remaining liquidity flows pertaining to financial liabilities.
CAPITAL RISKThe Group’s targets for its capital structure are to safeguard the Group’s ability to pursue its operations so that it can generate returns for shareholders and value for stakeholders, and to maintain an optimal capital structure to keep costs for capital down. To maintain or adjust its capital structure, the Group can change the dividends it pays to shareholders, repay capital to shareholders, issue new shares or sell assets to reduce its liabilities.
GROUP PARENT COMPANYLoan maturity structure Aug 31, 2019 Aug 31, 2018 Aug 31, 2019 Aug 31, 2018
6 months or less 150,267 255,000 150,000 255,000
612 months 266 30,000 30,000
15 years 152,133 75,000 150,000 75,000
More than 5 years 267 8,740
Total 302,933 368,740 300,000 360,000
Project development involving prestudy, project development, divestment and establishment of wind farms. This also includes technical consultancy services for wind power stakeholders.
Asset management which pertains to full asset management services for external and internal wind power facilities.
Electricity generation encompassing the operation of wind turbines, the sale of electric power and electricity certificates pertaining to these wind turbines.
NOTE 3 OPERATING SEGMENTS

ANNUAL REPORT EOLUS VIND AB 2018/2019 65
NOTES
2018/2019Project
developmentAsset
managementElectricity
generationJoint
eliminationsTotal
Group
Segment revenue
Net sales, external customers 2,006,686 18,693 6,532 2,031,911
Intersegment transactions 279 1,342 1,621
Other revenue 50,112 8,093 501 58,706
Expenses 1,942,993 25,520 5,403 1,621 1,972,296
(of which depreciation and impairment) (1,576) (90) (3,302) (4,968)
Operating profit 114,084 2,608 1,629 - 118,321
Financial items 2,350
Profit before tax 115,971
Tax 16,823
Net profit for the year 132,794
Segment’s assets at August 31, 2019 863,450 9,878 11,812 1,172,649 2,057,789
Assets include:Purchase of noncurrent assets 1,713 227 1,940
Following a review of the project portfolio, projects that are deemed to have lower potential for future realization were impaired. The effect on operating profit for the Project Development segment was KSEK 30,227 (24,694).
2017/2018Project
developmentAsset
managementElectricity
generationJoint
eliminationsTotal
Group
Segment revenue
Net sales, external customers 1,336,048 15,722 14,207 1,365,977
Intersegment transactions 405 606 1,011
Other revenue 14,492 6,835 1,206 22,533
Expenses 1,149,589 20,692 16,829 1,011 1,186,100
(of which depreciation and impairment) (5,297) (70) (9,398) (14,765)
Operating profit 201,356 2,471 -1,416 - 202,411
Financial items 3,532
Profit before tax 198,879
Tax 4,566
Net profit for the year 194,313
Segment’s assets at August 31, 2018 1,026,806 4,655 32,180 831,361 1,895,002
Assets include:Purchase of noncurrent assets 1,388 1,388
99% (100) of the Group’s revenue is attributable to Sweden. Two customers account for 95% of revenue: 62% and 33%. In the preceding year, one customer accounted for 83% of revenue.
Non-current assets Aug 31, 2019 Aug 31, 2018
Sweden 16,301 35,531
Estonia 15,509 16,530
Total 31,810 52,061

66 ANNUAL REPORT EOLUS VIND AB 2018/2019
NOTES
NOTE 4 REVENUE
2018/2019Project
developmentAsset
managementElectricity
generationTotal
Group
Time of revenue recognition
Over time (successively)1) 1,890,225 18,693 1,908,918
At a point in time 116,461 6,532 122,993
Net sales, external customers 2,006,686 18,693 6,532 2,031,911
Geographic market
Sweden 1,980,964 18,693 4,582 2,004,239
Norway 25,722 25,722
Baltic countries 1,950 1,950
Net sales, external customers 2,006,686 18,693 6,532 2,031,911
Type of contract
Transfer of project rights and signed construction contracts 528,851 528,851
Transfer of wind farms under construction 1,447,447 1,447,447
Electricity certificates 30,388 1,185 31,573
Asset management 18,693 18,693
Electricity generation 5,347 5,347
Net sales, external customers 2,006,686 18,693 6,532 2,031,911
1) Eolus has applied IFRS 15 by applying the modified retrospective approach, which means that comparative figures are not restated.
GROUPContract assets Aug 31, 2019 Aug 31, 2018
Wind turbines under construction 155,887 338,301
Advance payments to suppliers 276,820 306,736
Accounts receivable 24,168
Accrued contract income 15,386
Total 448,093 669,205
Contract liabilities Aug 31, 2019 Aug 31, 2018
Advance payments from customers 296,254 298,782
Invoiced but not accrued revenue
Total 296,254 298,782
All contract liabilities recognized on August 31, 2018 were recognized as revenue in the fiscal year.
No information is provided about the transaction price allocated to the outstanding performance obligations since at August 31, 2019 no such obligations existed with an expected term of more than one year.

ANNUAL REPORT EOLUS VIND AB 2018/2019 67
NOTES
NOTE 5 IMPACT OF IFRS 15
Impact on consolidated income statement 2018/2019
KSEKRecognized Adjustment
Total
Excluding impact
of IFRS 15
Net sales 2,031,911 461,178 1,570,733
Other operating income 58,706 58,706
2,090,617 -461,178 1,629,439
Operating expenses
Change in wind turbine inventories, wind turbines under construction and projects under development 289,576 289,576
Cost of goods and project development 1,503,682 449,753 1,053,929
Other external expenses 58,141 58,141
Employee benefits expenses 39,088 39,088
Depreciation and impairment of property, plant and equipment 4,968 4,968
Other operating expenses 76,842 76,842
Operating profit 118,321 -11,425 106,896
Profit from financial items 2,350 2,350
Profit before tax 115,971 -11,425 104,546
Tax on net profit for the period 16,823 6,317 23,140
Net profit for the period 132,794 -5,108 127,686
Impact on consolidated working capital Aug 31, 2019
KSEKRecognized Adjustment
Total
Excluding impact
of IFRS 15
Wind turbine inventories, wind turbines under construction, projects under development and electricity certificates 472,359 449,753 922,112
Advance payments to suppliers 277,014 277,014
Accounts receivable 25,277 25,277
Other current receivables 35,411 35,411
Prepaid expenses and accrued income 28,223 15,386 12,837
Accounts payable 229,381 229,381
Accrued expenses and deferred income 91,585 91,585
Advance payments from customers 293,791 425,792 719,583
Other current liabilities 205,330 205,330
18,198 8,575 26,773
Degree of completion per wind farm under construction Aug 31, 2019Wind farm Degree of completion
Kråktorpet 73%
Bäckhammar 14%
IFRS 15 is based on revenue being recognized when control of the good or service is passed to the customer, as opposed to former standards related to revenue recognition for which the transfer of risks and benefits is central. Eolus has two significant revenue streams that are impacted by IFRS 15: Revenue from the transfer of project rights and signed construction contracts and revenue from the transfer of wind farms under construction. When applying the percentage of completion method, earnings are generated in line with the degree of completion of the wind farm.
Under former standards, revenue from the construction of wind farms was not recognized until the completed wind farm had been handed over. For a more detailed description of the percentage of completion method and IFRS 15, refer to pages 5859.

68 ANNUAL REPORT EOLUS VIND AB 2018/2019
NOTES
NOTE 6 SALARIES, REMUNERATION AND NUMBER OF EMPLOYEES
The members of the Parent Company’s management team also comprise Group Management.
2018/2019 2017/2018Salaries
and other remuneration
Social security expenses (of which
pension costs)
Salaries and other
remuneration
Social security expenses (of which
pension costs)
Sweden – Parent Company 25,627 11,150 20,931 9,907
(3,507) (2,600)
Sweden – subsidiaries 5,762 2,516 4,521 1,978
(453) (418)
Estonia 315 105 281 100
() ()
Norway 764 79
(38) ()
Group 32,468 13,850 25,733 11,985
(3,998) (3,018)
2018/2019 2017/2018Salaries and other
remuneration(of which bonus)
Pensionexpenses
Salaries and other remuneration
(of which bonus)
Pension costs
Board of Directors and CEO 4,565 610 3,726 527
() ()
Other employees 27,903 3,388 22,007 2,491
() ()
Group 32,468 3,998 25,733 3,018
() ()
Aug 31, 2019 Aug 31, 2018
Gender distribution, Board of Directors and other senior executives
Number at balance sheet
date
Of whom menNumber at
balance sheet date
Of whom men
Board of Directors 7 5 6 4
CEO and other senior executives 5 4 4 3
Group and Parent Company 12 9 10 7
2018/2019 2017/2018
Average number of employeesAverage number
of employeesOf whom men Average number
of employeesOf whom men
Sweden – Parent Company 27 17 25 17
Sweden – subsidiaries 10 8 9 7
Estonia 1 1 1 1
Norway 1 1
Group 39 27 35 25
Eolus has established a bonus and share ownership program for all of the company’s employees. A bonus is paid if the company achieves earnings targets set by the Board of Directors. The bonus corresponds to half a month’s salary and is paid in the form of a cash payment and/or shares. As regards senior executives, the company is able to offer maximum variable remuneration of four monthly salaries for the CEO and Deputy CEO, and three monthly salaries for other senior executives. Participation in the share ownership program for senior executives is maximized to the equivalent of not more than one monthly salary for
all senior executives. Under the share ownership program, an additional bonus may be paid in the form of bonus shares to individuals acquiring shares in the company, retaining them for three years and remaining employed at the company, for a portion or their entire bonus payment instead of a cash payment. The liabilities under this program amount to insignificant amounts on each balance sheet date. There is no dilution for existing shareholders since no new shares are issued under the program.
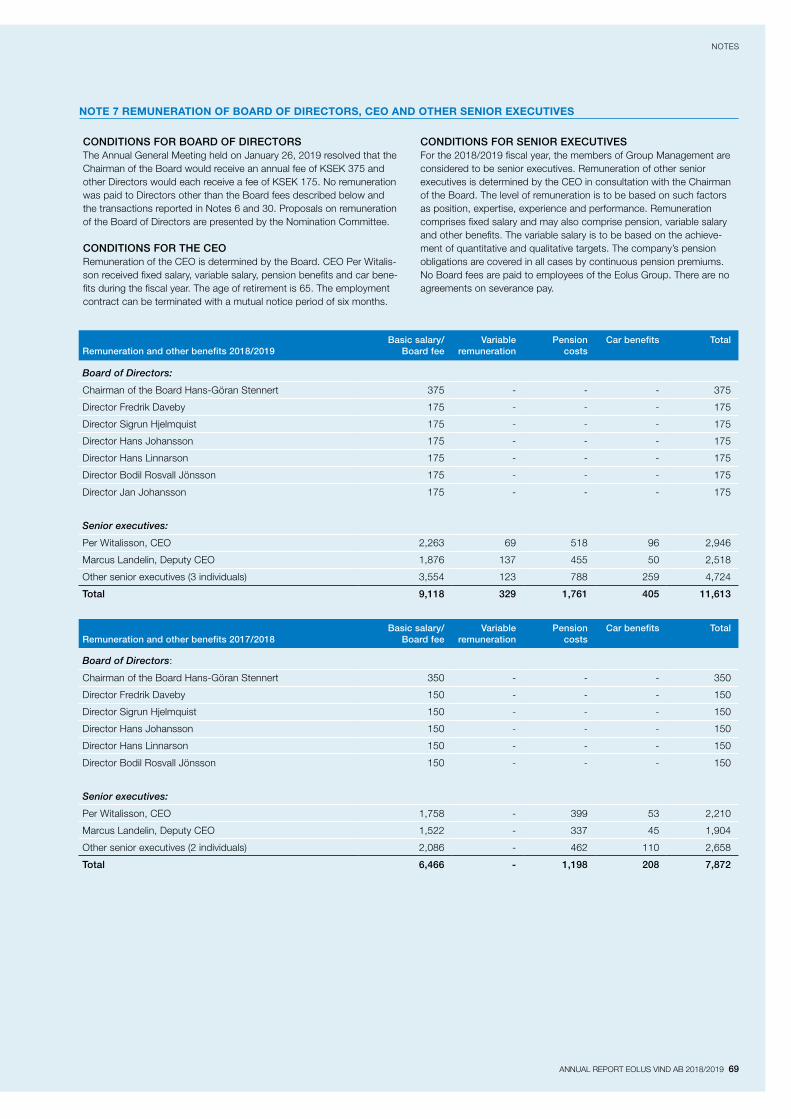
ANNUAL REPORT EOLUS VIND AB 2018/2019 69
NOTES
NOTE 7 REMUNERATION OF BOARD OF DIRECTORS, CEO AND OTHER SENIOR EXECUTIVES
CONDITIONS FOR BOARD OF DIRECTORSThe Annual General Meeting held on January 26, 2019 resolved that the Chairman of the Board would receive an annual fee of KSEK 375 and other Directors would each receive a fee of KSEK 175. No remuneration was paid to Directors other than the Board fees described below and the transactions reported in Notes 6 and 30. Proposals on remuneration of the Board of Directors are presented by the Nomination Committee.
CONDITIONS FOR THE CEORemuneration of the CEO is determined by the Board. CEO Per Witalisson received fixed salary, variable salary, pension benefits and car benefits during the fiscal year. The age of retirement is 65. The employment contract can be terminated with a mutual notice period of six months.
CONDITIONS FOR SENIOR EXECUTIVESFor the 2018/2019 fiscal year, the members of Group Management are considered to be senior executives. Remuneration of other senior executives is determined by the CEO in consultation with the Chairman of the Board. The level of remuneration is to be based on such factors as position, expertise, experience and performance. Remuneration comprises fixed salary and may also comprise pension, variable salary and other benefits. The variable salary is to be based on the achievement of quantitative and qualitative targets. The company’s pension obligations are covered in all cases by continuous pension premiums. No Board fees are paid to employees of the Eolus Group. There are no agreements on severance pay.
Remuneration and other benefits 2018/2019
Basic salary/ Board fee
Variable remuneration
Pension costs
Car benefits Total
Board of Directors:
Chairman of the Board HansGöran Stennert 375 375
Director Fredrik Daveby 175 175
Director Sigrun Hjelmquist 175 175
Director Hans Johansson 175 175
Director Hans Linnarson 175 175
Director Bodil Rosvall Jönsson 175 175
Director Jan Johansson 175 175
Senior executives:
Per Witalisson, CEO 2,263 69 518 96 2,946
Marcus Landelin, Deputy CEO 1,876 137 455 50 2,518
Other senior executives (3 individuals) 3,554 123 788 259 4,724
Total 9,118 329 1,761 405 11,613
Remuneration and other benefits 2017/2018
Basic salary/ Board fee
Variable remuneration
Pension costs
Car benefits Total
Board of Directors:
Chairman of the Board HansGöran Stennert 350 350
Director Fredrik Daveby 150 150
Director Sigrun Hjelmquist 150 150
Director Hans Johansson 150 150
Director Hans Linnarson 150 150
Director Bodil Rosvall Jönsson 150 150
Senior executives:
Per Witalisson, CEO 1,758 399 53 2,210
Marcus Landelin, Deputy CEO 1,522 337 45 1,904
Other senior executives (2 individuals) 2,086 462 110 2,658
Total 6,466 - 1,198 208 7,872

70 ANNUAL REPORT EOLUS VIND AB 2018/2019
NOTES
NOTE 8 REMUNERATION OF AUDITORS
GROUP PARENT COMPANY2018/2019 2017/2018 2018/2019 2017/2018
PricewaterhouseCoopers
Audit assignment 550 484 480 484
Audit activities in addition to the audit assignment 391 165 391 165
Tax consultancy
Other services 610 890 419 890
Total 1,551 1,539 1,290 1,539
EY
Other services 150 150
Total 150 150
Assertum Audit OÜ
Audit assignment 21 20
Total 21 20
Revisorgruppen Trøndelag AS
Audit assignment 18
Total 18
Total 1,572 1,727 1,290 1,689
NOTE 9 OTHER OPERATING INCOME AND OTHER OPERATING EXPENSES
GROUP PARENT COMPANYOther operating income 2018/2019 2017/2018 2018/2019 2017/2018
Exchange rate gains attributable to project activities 47,087 13,835 44,442 13,832
Capital gains attributable to other noncurrent assets 77 232 76 101
Invoiced expenses 9,589 8,051 7,319 6,247
Other 1,952 416 1,247 240
Total 58,706 22,533 53,084 20,420
Other operating expenses 2018/2019 2017/2018 2018/2019 2017/2018
Exchange rate losses attributable to project activities 49,884 5,016 49,637 4,972
Capital losses attributable to sale of wind power facilities 2,553
Capital losses attributable to other noncurrent assets 4,508
Fair value of change in currency derivatives 26,958 351
Total -76,842 -5,367 -49,637 -12,033
Eolus hedges future forecast payment flows in accordance with an established finance and risk policy. The difference between the price paid and forward rate on maturity results in exchange rate gains and exchange rate losses, which are recognized as other operating income and other operating expenses, respectively.

ANNUAL REPORT EOLUS VIND AB 2018/2019 71
NOTES
NOTE 10 FINANCIAL INCOME AND EXPENSES
GROUP PARENT COMPANYInterest income 2018/2019 2017/2018 2018/2019 2017/2018
Loans and receivables 3,110 2,727 505 10
Loans and receivables to Group companies 1,593 592
Total financial income 3,110 2,727 2,098 582
Interest expense 2018/2019 2017/2018 2018/2019 2017/2018
Bank loans 14,179 6,586 10,365 1,951
Liabilities to Group companies 297 281
Total financial expenses -14,179 -6,586 -10,662 -2,232
Other financial items 2018/2019 2017/2018 2018/2019 2017/2018
Exchange rate differences intraGroup receivables and liabilities 14,337 15,574 13,698 13,819
Exchange rate differences in cash and cash equivalents 592 914 592 81
Exchange rate differences, other 5,751 8,478 5,751 8,846
Other financial expenses 2,543 10,484 1,425
Fair value of change in interest rate derivatives 2,084 2,801
Total financial expenses 8,719 327 8,539 3,467
of which attributable to balance sheet items measured at fair value 2,084 2,801
NOTE 11 APPROPRIATIONS AND UNTAXED RESERVES
W PARENT COMPANYAppropriations 2018/2019 2017/2018
Change in tax allocation reserve 18,857 21,068
Depreciation in excess of plan 6,253 23,564
Group contributions received/paid 16,631 17,988
Total 4,027 20,484
Untaxed reserves Aug 31, 2019 Aug 31, 2018
Tax allocation reserve 147,571 128,714
Accumulated depreciation in excess of plan 5,490 11,743
Total 153,061 140,457

72 ANNUAL REPORT EOLUS VIND AB 2018/2019
NOTES
NOTE 12 INCOME TAX
GROUP PARENT COMPANY2018/2019 2017/2018 2018/2019 2017/2018
Current tax:
Current tax on net profit for the year 15,682 22,927 17,794 22,842
Current tax attributable to prior periods
Total current tax -15,682 -22,927 -17,794 -22,842
Deferred tax:
Origination and reversal of temporary differences 32,903 15,395 71 166
Deferred tax due to changes in tax rate 399 2,966
Total deferred tax 32,504 18,361 -71 -166
Tax 16,823 -4,566 -17,865 -23,008
GROUP
2018/2019 2017/2018
Specification of deferred tax assets and tax liabilities:
Deferred tax
assets
Deferred tax
liabilities
Deferred tax
assets
Deferred tax
liabilities
Property, plant and equipment 60 57
Assets measured at fair value 8,799 5,218
Provisions 74 141
Untaxed reserves 33,409 33,681
Wind turbine inventories, wind turbines under construction and projects under development 4,285 457 9,614
Temporary differences: 20,893
Recognized tax losses: 6,136 523
Total 35,962 37,694 6,396 43,295
of which to be utilized/paid after more than 12 months 6,270 37,694 1,178 43,295
of which to be utilized/paid within 12 months 29,692 5,218
GROUP PARENT COMPANYReconciliation of effective tax rate 2018/2019 2017/2018 2018/2019 2017/2018
Profit before tax 115,971 198,879 211,017 309,353
Tax calculated at applicable tax rate in Sweden 25,514 43,753 46,424 68,058
Difference between Swedish and foreign tax rates 246 96
Nontaxable income 45,147 39,948 38,704 66,141
Nondeductible expenses 979 3,141 10,040 21,006
Interest surcharge for tax allocation reserve 105 85 105 85
Deferred tax due to changes in tax rate 399 2,966
Noncapitalized loss carryforwards 1,081 405
Total tax expense/tax income 16,823 -4,566 -17,865 -23,008
No tax pertains to components of other comprehensive income or has been recognized in equity.

ANNUAL REPORT EOLUS VIND AB 2018/2019 73
NOTES
PARENT COMPANY
Specification of deferred tax assets: 2018/2019 2017/2018
Provisions 71
Total - 71
Recognized in the statement of financial position/balance sheet:
GROUP PARENT COMPANY2018/2019 2017/2018 2018/2019 2017/2018
Deferred tax assets 4,421 3,095 71
Deferred tax liabilities 6,153 39,994
Deferred tax liabilities (assets), net -1,732 -36,899 - 71
Change in deferred taxesGROUP PARENT COMPANY
2018/2019 2017/2018 2018/2019 2017/2018
At September 1 -36,899 -55,053 71 238
Tax income/expenses recognized in profit or loss 32,504 18,344 71 166
Reclassification to current tax 2,663 190
At August 31 -1,732 -36,899 - 71
The Group’s noncapitalized loss carryforwards attributable to the Swedish operations amounted to KSEK 64 (142) on August 31, 2019. Deferred tax assets for the Group were recognized on tax deficits amounting to KSEK 6,137 (3,137). Deficits have no determined maturity date.
NOTE 13 INTANGIBLE ASSETS
GROUP PARENT COMPANYCertificates 2018/2019 2017/2018 2018/2019 2017/2018
Opening accumulated cost 96,162 - 96,162 -
Investments 96,162 96,162
Reclassifications 42,078 42,078
Closing accumulated cost 54,084 96,162 54,084 96,162
In connection with the divestment of the Jenåsen wind farm, Eolus acquired the right to 96% of the electricity certificates that the wind farm will generate over the 15year certificate period. This intellectual property right was acquired for a nonrecurring amount of EUR 9 M, corresponding to SEK 96.2 M. The total acquired volume is expected to amount to 264,000 electricity certificates per year over a 15year period, meaning a total of 3,960,000 electricity certificates. Electricity certificates are recognized as inventory as they are issued, at which point the intangible asset item will be impaired.

74 ANNUAL REPORT EOLUS VIND AB 2018/2019
NOTES
NOTE 14 PROPERTY, PLANT AND EQUIPMENT
GROUP PARENT COMPANY
2018/2019
Land and
build-ings
Wind turbines
Equip-ment
Construc-tions in
progress and
advance payments
Total Land and
build-ings
Wind turbines
Equip-ment
Construc-tions in
progress and
advance payments
Total
Opening accumulated cost 15,056 110,115 29,116 - 154,288 2,533 6,822 24,543 - 33,898
Investments 52 1,887 1,940 885 885
Sales and disposals 406 406 6,822 368 7,190
Reclassifications 53,110 53,110
Exchange rate differences 193 352 43 588
Closing accumulated cost 15,302 57,357 30,640 - 103,299 2,533 - 25,060 - 27,593
Opening accumulated depreciation - -70,134 -22,017 - -92,150 - -1,364 -18,258 - -19,622
Depreciation for the year 3,302 1,665 4,967 90 1,329 1,419
Sales and disposals 55 1,509 1,454 17 1,471
Reclassifications 28,315 26,861
Exchange rate differences 317 5 322
Closing accumulated depreciation - -45,437 -23,632 - -69,069 - - -19,570 - -19,570
Opening accumulated impairment -2,312 -7,801 - - -10,113 -2,312 - - - -2,312
Impairment for the year
Reclassifications 7,695 7,695
Exchange rate differences 2 2
Closing accumulated impairment -2,312 -108 - - -2,420 -2,312 - - - -2,312Net carrying amount at year-end 12,990 11,812 7,009 - 31,810 221 - 5,490 - 5,711
During the fiscal year, 0 (0) wind turbines previously recognized as inventories were reclassified as noncurrent assets.
During the fiscal year, 3 (5) new wind turbines recognized as noncurrent assets were reclassified to inventories and subsequently sold.
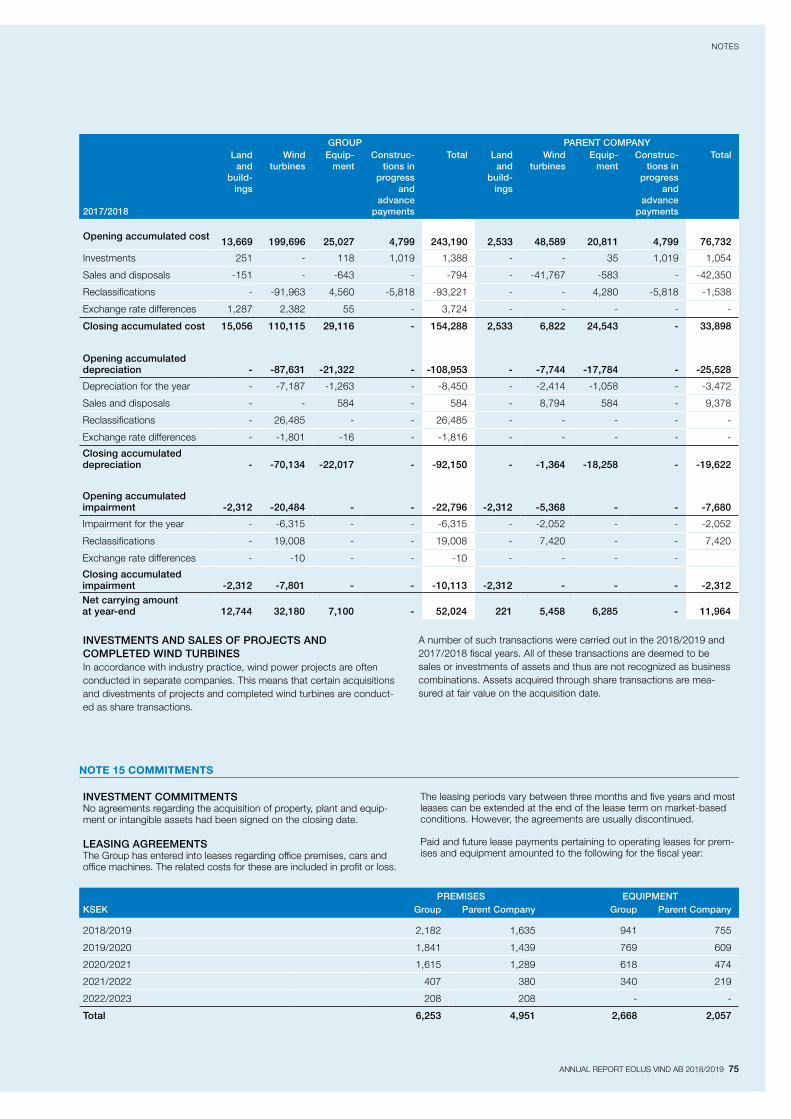
ANNUAL REPORT EOLUS VIND AB 2018/2019 75
NOTES
GROUP PARENT COMPANY
2017/2018
Land and
build-ings
Wind turbines
Equip-ment
Construc-tions in
progress and
advance payments
Total Land and
build-ings
Wind turbines
Equip-ment
Construc-tions in
progress and
advance payments
Total
Opening accumulated cost 13,669 199,696 25,027 4,799 243,190 2,533 48,589 20,811 4,799 76,732
Investments 251 118 1,019 1,388 35 1,019 1,054
Sales and disposals 151 643 794 41,767 583 42,350
Reclassifications 91,963 4,560 5,818 93,221 4,280 5,818 1,538
Exchange rate differences 1,287 2,382 55 3,724
Closing accumulated cost 15,056 110,115 29,116 - 154,288 2,533 6,822 24,543 - 33,898
Opening accumulated depreciation - -87,631 -21,322 - -108,953 - -7,744 -17,784 - -25,528
Depreciation for the year 7,187 1,263 8,450 2,414 1,058 3,472
Sales and disposals 584 584 8,794 584 9,378
Reclassifications 26,485 26,485
Exchange rate differences 1,801 16 1,816
Closing accumulated depreciation - -70,134 -22,017 - -92,150 - -1,364 -18,258 - -19,622
Opening accumulated impairment -2,312 -20,484 - - -22,796 -2,312 -5,368 - - -7,680
Impairment for the year 6,315 6,315 2,052 2,052
Reclassifications 19,008 19,008 7,420 7,420
Exchange rate differences 10 10
Closing accumulated impairment -2,312 -7,801 - - -10,113 -2,312 - - - -2,312Net carrying amount at year-end 12,744 32,180 7,100 - 52,024 221 5,458 6,285 - 11,964
PREMISES EQUIPMENTKSEK Group Parent Company Group Parent Company
2018/2019 2,182 1,635 941 755
2019/2020 1,841 1,439 769 609
2020/2021 1,615 1,289 618 474
2021/2022 407 380 340 219
2022/2023 208 208
Total 6,253 4,951 2,668 2,057
INVESTMENT COMMITMENTSNo agreements regarding the acquisition of property, plant and equipment or intangible assets had been signed on the closing date.
LEASING AGREEMENTS The Group has entered into leases regarding office premises, cars and office machines. The related costs for these are included in profit or loss.
The leasing periods vary between three months and five years and most leases can be extended at the end of the lease term on marketbased conditions. However, the agreements are usually discontinued.
Paid and future lease payments pertaining to operating leases for premises and equipment amounted to the following for the fiscal year:
INVESTMENTS AND SALES OF PROJECTS AND COMPLETED WIND TURBINES In accordance with industry practice, wind power projects are often conducted in separate companies. This means that certain acquisitions and divestments of projects and completed wind turbines are conducted as share transactions.
A number of such transactions were carried out in the 2018/2019 and 2017/2018 fiscal years. All of these transactions are deemed to be sales or investments of assets and thus are not recognized as business combinations. Assets acquired through share transactions are measured at fair value on the acquisition date.
NOTE 15 COMMITMENTS
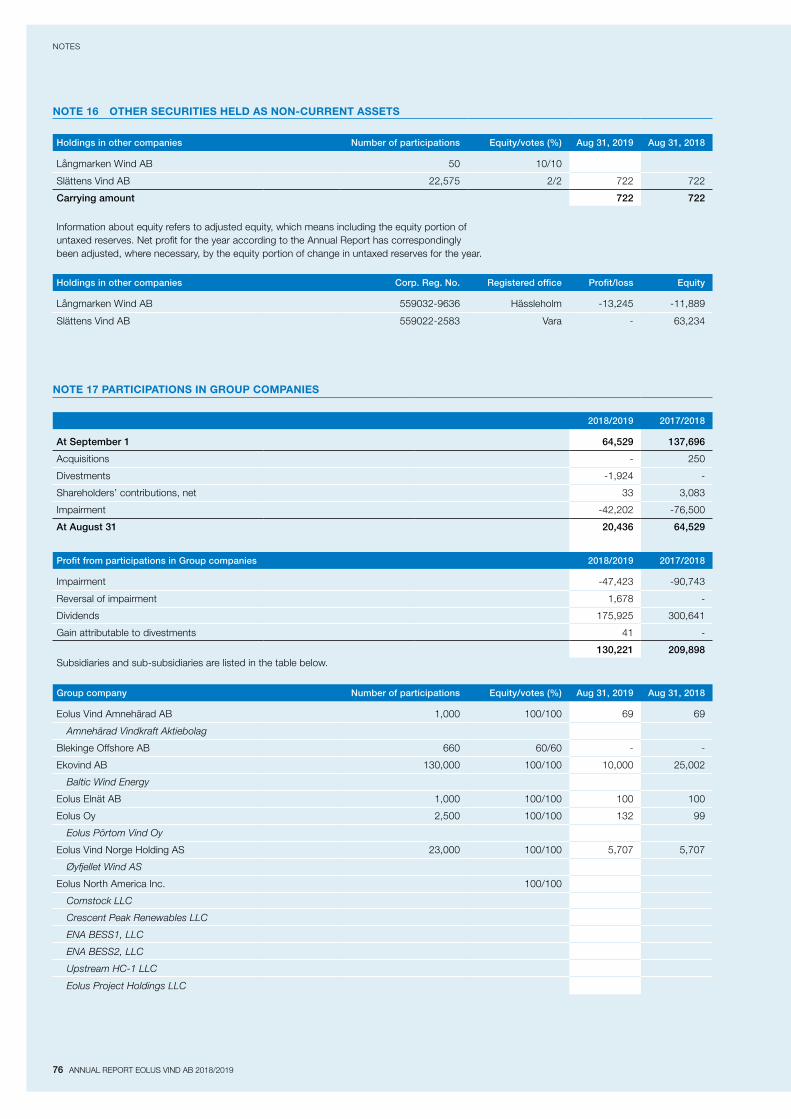
76 ANNUAL REPORT EOLUS VIND AB 2018/2019
NOTES
NOTE 16 OTHER SECURITIES HELD AS NON-CURRENT ASSETS
Holdings in other companies Number of participations Equity/votes (%) Aug 31, 2019 Aug 31, 2018
Långmarken Wind AB 50 10/10
Slättens Vind AB 22,575 2/2 722 722
Carrying amount 722 722
Information about equity refers to adjusted equity, which means including the equity portion of untaxed reserves. Net profit for the year according to the Annual Report has correspondingly been adjusted, where necessary, by the equity portion of change in untaxed reserves for the year.
Holdings in other companies Corp. Reg. No. Registered office Profit/loss Equity
Långmarken Wind AB 5590329636 Hässleholm 13,245 11,889
Slättens Vind AB 5590222583 Vara 63,234
NOTE 17 PARTICIPATIONS IN GROUP COMPANIES
2018/2019 2017/2018
At September 1 64,529 137,696
Acquisitions 250
Divestments 1,924
Shareholders’ contributions, net 33 3,083
Impairment 42,202 76,500
At August 31 20,436 64,529
Profit from participations in Group companies 2018/2019 2017/2018
Impairment 47,423 90,743
Reversal of impairment 1,678
Dividends 175,925 300,641
Gain attributable to divestments 41
130,221 209,898Subsidiaries and subsubsidiaries are listed in the table below.
Group company Number of participations Equity/votes (%) Aug 31, 2019 Aug 31, 2018
Eolus Vind Amnehärad AB 1,000 100/100 69 69
Amnehärad Vindkraft Aktiebolag
Blekinge Offshore AB 660 60/60
Ekovind AB 130,000 100/100 10,000 25,002
Baltic Wind Energy
Eolus Elnät AB 1,000 100/100 100 100
Eolus Oy 2,500 100/100 132 99
Eolus Pörtom Vind Oy
Eolus Vind Norge Holding AS 23,000 100/100 5,707 5,707
Øyfjellet Wind AS
Eolus North America Inc. 100/100
Comstock LLC
Crescent Peak Renewables LLC
ENA BESS1, LLC
ENA BESS2, LLC
Upstream HC-1 LLC
Eolus Project Holdings LLC

ANNUAL REPORT EOLUS VIND AB 2018/2019 77
NOTES
Group company Number of participations Equity/votes (%) Aug 31, 2019 Aug 31, 2018
Wind Wall Development LLC
Wind Wall 1 LLC
Eolus Vindpark Ett AB 500 100/100 50 50
Eolus Vindpark Fem AB 500 100/100 50 50
Eolus Vindpark Sju AB 500 100/100 50 50
Eolus Vindpark Nio AB 500 100/100 50 50
Eolus Vindpark Elva AB 500 100/100 50 50
Eolus Vindpark Tretton AB 500 100/100 50 50
Eolus Vindpark Femton AB 500 100/100 50 50
Eolus Vindpark Sjutton AB 500 100/100 50 50
Eolus Vindpark Nitton AB 500 100/100 50 50
Eolus Vindpark 23 AB 500 100/100 50 50
Eolus Vindpark 25 AB 500 100/100 50 50
Eolus Vindpark 26 AB
Eolus Vindpark 27 AB 500 100/100 50 50
Eolus Vindpark 28 AB
Eolus Vindpark 29 AB 500 100/100 50 50
Eolus Vindpark 31 AB 500 100/100 50 50
Eolus Vindpark 33 AB 500 100/100 50 50
Eolus Vindpark 34 AB
Eolus Vindpark 35 AB 500 100/100 50 50
Eolus Vindpark 36 AB
Eolus Vindpark 37 AB 500 100/100 50 50
Eolus Vindpark 38 AB
Eolus Wind Power Management AB 500 100/100 50 50
Kattegatt Vindkraft AB 16,500 100/100 1,724
Lunnekullen Vindkraft AB 1,000 100/100
Linusvind AB 50,000 100/100 50 50
Långmarken Vindkraft AB 1,000 100/100 100
Lärkeskogen Vindkraft AB 1,000 100/100 93 93
Näset Vindkraft AB 1,000 100/100
SIA Eolus 2,000 100/100 25 25
Andruves wind SIA
Virzas wind SIA
Gulbji wind SIA
Melderi wind SIA
Pienava wind SIA
Unas wind SIA
Dobele wind SIA
Osi wind SIA
Mekji wind SIA
Valpene wind SIA
Skogaryd Vindkraft AB 1,000 100/100 100 100
Skuggetorp Vindkraft AB 1,000 100/100 100 100
Svenska Vindbolaget AB 1,430 100/100 27,200
Eolus Vindpark Tjugoett AB
Uddevalla Vind AB 1,000 100/100 102 102
Vingkraft Rönnerum AB 1,000 100/100 100
Ölme Vindkraft AB 1,000 100/100 3,058 3,058
Carrying amount 20,436 64,529
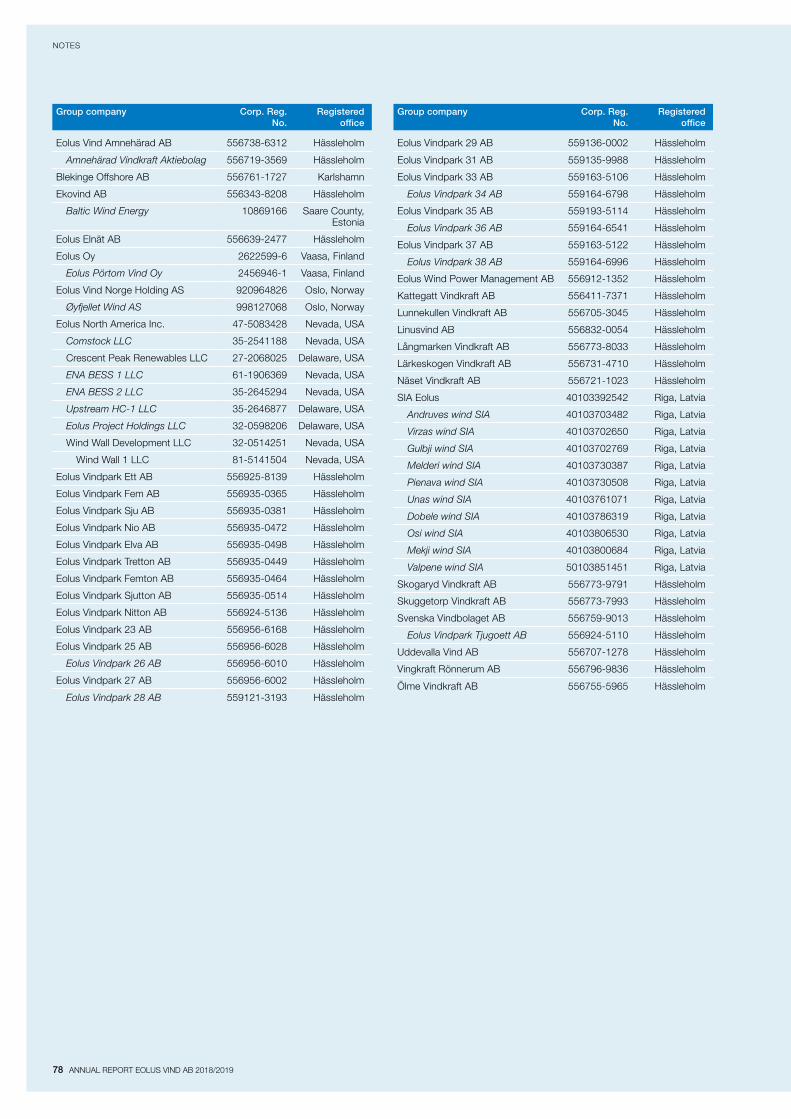
78 ANNUAL REPORT EOLUS VIND AB 2018/2019
NOTES
Group company Corp. Reg. No.
Registered office
Eolus Vind Amnehärad AB 5567386312 Hässleholm
Amnehärad Vindkraft Aktiebolag 5567193569 Hässleholm
Blekinge Offshore AB 5567611727 Karlshamn
Ekovind AB 5563438208 Hässleholm
Baltic Wind Energy 10869166 Saare County,Estonia
Eolus Elnät AB 5566392477 Hässleholm
Eolus Oy 26225996 Vaasa, Finland
Eolus Pörtom Vind Oy 24569461 Vaasa, Finland
Eolus Vind Norge Holding AS 920964826 Oslo, Norway
Øyfjellet Wind AS 998127068 Oslo, Norway
Eolus North America Inc. 475083428 Nevada, USA
Comstock LLC 352541188 Nevada, USA
Crescent Peak Renewables LLC 272068025 Delaware, USA
ENA BESS 1 LLC 611906369 Nevada, USA
ENA BESS 2 LLC 352645294 Nevada, USA
Upstream HC-1 LLC 352646877 Delaware, USA
Eolus Project Holdings LLC 320598206 Delaware, USA
Wind Wall Development LLC 320514251 Nevada, USA
Wind Wall 1 LLC 815141504 Nevada, USA
Eolus Vindpark Ett AB 5569258139 Hässleholm
Eolus Vindpark Fem AB 5569350365 Hässleholm
Eolus Vindpark Sju AB 5569350381 Hässleholm
Eolus Vindpark Nio AB 5569350472 Hässleholm
Eolus Vindpark Elva AB 5569350498 Hässleholm
Eolus Vindpark Tretton AB 5569350449 Hässleholm
Eolus Vindpark Femton AB 5569350464 Hässleholm
Eolus Vindpark Sjutton AB 5569350514 Hässleholm
Eolus Vindpark Nitton AB 5569245136 Hässleholm
Eolus Vindpark 23 AB 5569566168 Hässleholm
Eolus Vindpark 25 AB 5569566028 Hässleholm
Eolus Vindpark 26 AB 5569566010 Hässleholm
Eolus Vindpark 27 AB 5569566002 Hässleholm
Eolus Vindpark 28 AB 5591213193 Hässleholm
Group company Corp. Reg. No.
Registered office
Eolus Vindpark 29 AB 5591360002 Hässleholm
Eolus Vindpark 31 AB 5591359988 Hässleholm
Eolus Vindpark 33 AB 5591635106 Hässleholm
Eolus Vindpark 34 AB 5591646798 Hässleholm
Eolus Vindpark 35 AB 5591935114 Hässleholm
Eolus Vindpark 36 AB 5591646541 Hässleholm
Eolus Vindpark 37 AB 5591635122 Hässleholm
Eolus Vindpark 38 AB 5591646996 Hässleholm
Eolus Wind Power Management AB 5569121352 Hässleholm
Kattegatt Vindkraft AB 5564117371 Hässleholm
Lunnekullen Vindkraft AB 5567053045 Hässleholm
Linusvind AB 5568320054 Hässleholm
Långmarken Vindkraft AB 5567738033 Hässleholm
Lärkeskogen Vindkraft AB 5567314710 Hässleholm
Näset Vindkraft AB 5567211023 Hässleholm
SIA Eolus 40103392542 Riga, Latvia
Andruves wind SIA 40103703482 Riga, Latvia
Virzas wind SIA 40103702650 Riga, Latvia
Gulbji wind SIA 40103702769 Riga, Latvia
Melderi wind SIA 40103730387 Riga, Latvia
Pienava wind SIA 40103730508 Riga, Latvia
Unas wind SIA 40103761071 Riga, Latvia
Dobele wind SIA 40103786319 Riga, Latvia
Osi wind SIA 40103806530 Riga, Latvia
Mekji wind SIA 40103800684 Riga, Latvia
Valpene wind SIA 50103851451 Riga, Latvia
Skogaryd Vindkraft AB 5567739791 Hässleholm
Skuggetorp Vindkraft AB 5567737993 Hässleholm
Svenska Vindbolaget AB 5567599013 Hässleholm
Eolus Vindpark Tjugoett AB 5569245110 Hässleholm
Uddevalla Vind AB 5567071278 Hässleholm
Vingkraft Rönnerum AB 5567969836 Hässleholm
Ölme Vindkraft AB 5567555965 Hässleholm

ANNUAL REPORT EOLUS VIND AB 2018/2019 79
NOTES
Aug 31, 2019 <3 months 3 months-1 year 1-2 years 2-5 years >5 years Total
Borrowing 151,351 3,004 3,994 154,772 268 313,389
Accounts payable 229,381 229,381
Derivatives 862 2,586 3,449 5,691 12,588
Other financial liabilities 206,158 8 284 206,450
Total 587,752 5,598 7,443 160,747 268 761,808
Aug 31, 2018 <3 months 3 months-1 year 1-2 years 2-5 years >5 years Total
Borrowing 257,199 33,434 4,137 83,191 812 378,773
Accounts payable 140,806 140,806
Derivatives 950 2,850 3,800 6,261 13,861
Other financial liabilities 99,840 8 264 100,112
Total 498,795 36,292 7,937 89,716 812 633,552
The table below presents the remaining contractual maturities of the financial liabilities. The amounts stated in the table are the contractual and undiscounted cash flows. All currency derivatives have negative market values. The total negative market value of currency derivatives
was KSEK 27,772 (neg: 814) on the closing date. Contractual interest rate derivatives had negative market values on the closing date. The total negative market value of interest rate derivatives was KSEK 9,749 (neg: 11,833) on the closing date.
NOTE 19 PARTICIPATIONS IN ASSOCIATED COMPANIES
GROUP
CARRYING AMOUNT
Participations in associated companiesCorp. Reg.
No.Registered
officeCapital/votes
(%)Aug 31, 2019 Aug 31, 2018
Isgrannatorp Drift AB 5567876833 Kristianstad 33/33 37
Triventus AB 5566273016 Falkenberg 40/40
Carrying amount - 37
Change in participations in associated companies 2018/2019 2017/2018
At September 1 37 3,761
Share in profits 3,725
Divestments 37
Other 1
At August 31 - 37
PARENT COMPANY
CARRYING AMOUNT
Participations in associated companiesCorp. Reg.
No.Registered
officeCapital/votes
(%)Aug 31, 2019 Aug 31, 2018
Triventus AB 5566273016 Falkenberg 40/40
Carrying amount - -
NOTE 18 FINANCIAL RISK MANAGEMENT
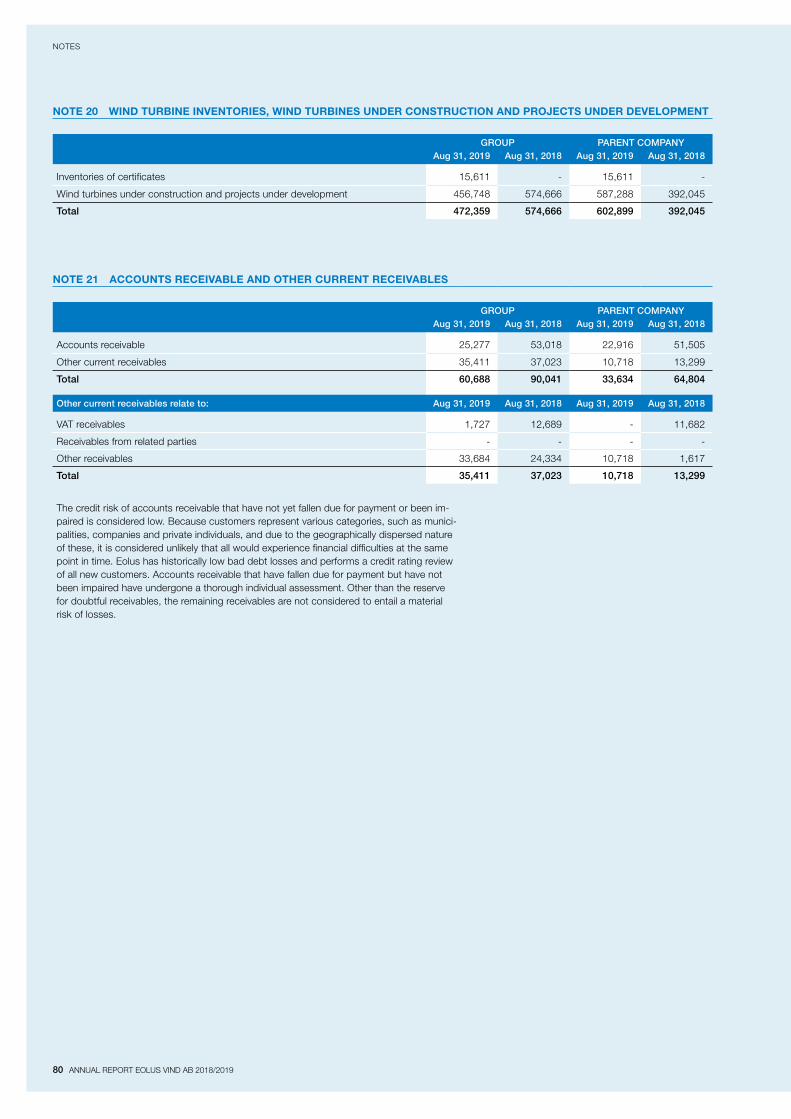
80 ANNUAL REPORT EOLUS VIND AB 2018/2019
NOTES
NOTE 21 ACCOUNTS RECEIVABLE AND OTHER CURRENT RECEIVABLES
GROUP PARENT COMPANYAug 31, 2019 Aug 31, 2018 Aug 31, 2019 Aug 31, 2018
Accounts receivable 25,277 53,018 22,916 51,505
Other current receivables 35,411 37,023 10,718 13,299
Total 60,688 90,041 33,634 64,804
Other current receivables relate to: Aug 31, 2019 Aug 31, 2018 Aug 31, 2019 Aug 31, 2018
VAT receivables 1,727 12,689 11,682
Receivables from related parties
Other receivables 33,684 24,334 10,718 1,617
Total 35,411 37,023 10,718 13,299
The credit risk of accounts receivable that have not yet fallen due for payment or been impaired is considered low. Because customers represent various categories, such as municipalities, companies and private individuals, and due to the geographically dispersed nature of these, it is considered unlikely that all would experience financial difficulties at the same point in time. Eolus has historically low bad debt losses and performs a credit rating review of all new customers. Accounts receivable that have fallen due for payment but have not been impaired have undergone a thorough individual assessment. Other than the reserve for doubtful receivables, the remaining receivables are not considered to entail a material risk of losses.
NOTE 20 WIND TURBINE INVENTORIES, WIND TURBINES UNDER CONSTRUCTION AND PROJECTS UNDER DEVELOPMENT
GROUP PARENT COMPANYAug 31, 2019 Aug 31, 2018 Aug 31, 2019 Aug 31, 2018
Inventories of certificates 15,611 15,611
Wind turbines under construction and projects under development 456,748 574,666 587,288 392,045
Total 472,359 574,666 602,899 392,045

ANNUAL REPORT EOLUS VIND AB 2018/2019 81
NOTES
GROUP PARENT COMPANYCredit exposure Aug 31, 2019 Aug 31, 2018 Aug 31, 2019 Aug 31, 2018
Accounts receivable, not yet fallen due or impaired 6,482 9,386 1,176 9,152
Accounts receivable, past due but not impaired 23,795 43,632 21,740 42,353
Reserve for doubtful receivables 5,000
Total accounts receivable 25,277 53,018 22,916 51,505
At August 31, 2019, past due accounts receivable for which no reserve was considered necessary amounted to KSEK 18,795 (43,632).KSEK 0 (24,169) in past due accounts receivable was settled after the balance sheet date.
Age analysis of accounts receivable, past due but not impaired Aug 31, 2019 Aug 31, 2018 Aug 31, 2019 Aug 31, 2018
<30 days 3,741 24,169 3,741 24,169
3090 days 429 840 235 643
91180 days 194 195
>180 days 19,431 18,428 17,764 17,541
Total past due but not impaired accounts receivable 23,795 43,632 21,740 42,353
Age analysis of accounts receivable, past due and impaired Aug 31, 2019 Aug 31, 2018 Aug 31, 2019 Aug 31, 2018
>180 days 5,000
Total past due and impaired accounts receivable 5,000 - - -
Provisions for doubtful receivables correspond to 16% (0) of the total accounts receivable.
Provision for doubtful receivables Aug 31, 2019 Aug 31, 2018 Aug 31, 2019 Aug 31, 2018
Provision at beginning of year 30
Provision for doubtful receivables for the year 5,000
Writtenoff receivables 30
Amount at year-end 5,000 - - -
Provisions for the reversals of reserves for doubtful receivables are included in the item “Other operating expenses” in profit or loss.
Recognized amount for accounts receivable per currency including the reserve for doubtful receivables
GROUP PARENT COMPANYAug 31, 2019 Aug 31, 2018 Aug 31, 2019 Aug 31, 2018
SEK 12,889 15,098 5,528 13,585
EUR 12,388 37,920 17,388 37,920
Total KSEK 25,277 53,018 22,916 51,505
The ten largest customers represent 95% (99) of the Group’s total accounts receivable. A single customer accounts for 59% (46).
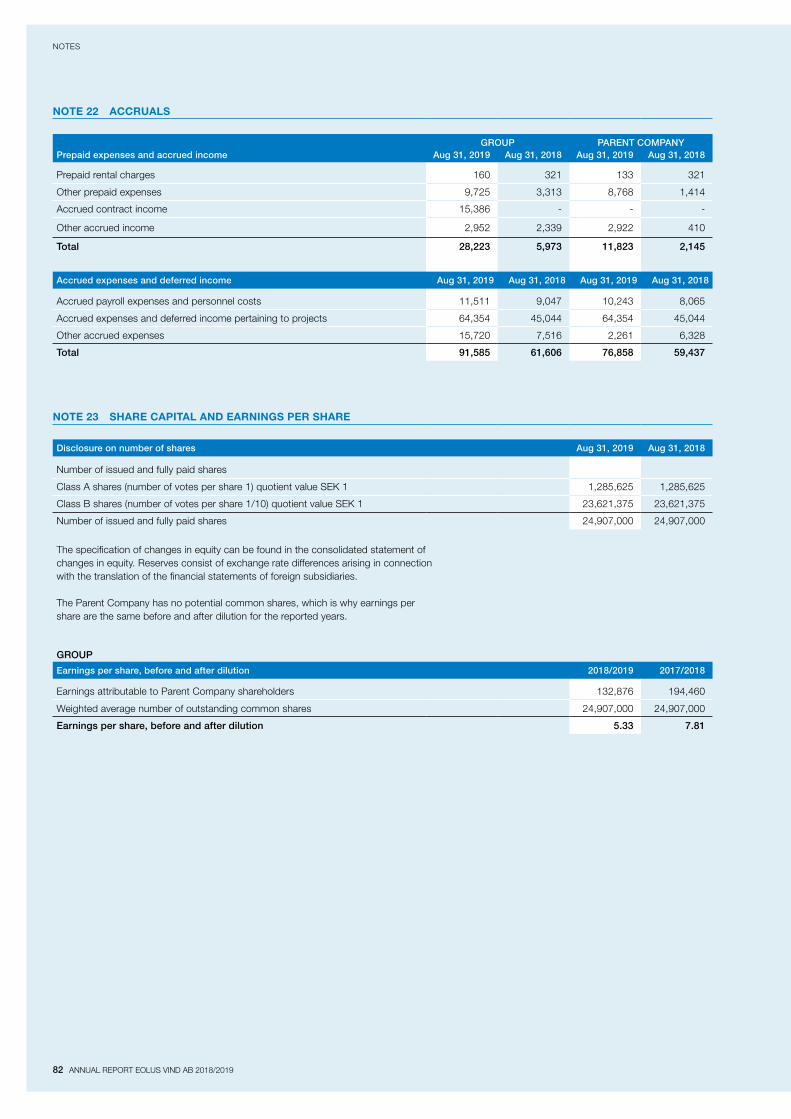
82 ANNUAL REPORT EOLUS VIND AB 2018/2019
NOTES
NOTE 22 ACCRUALS
GROUP PARENT COMPANYPrepaid expenses and accrued income Aug 31, 2019 Aug 31, 2018 Aug 31, 2019 Aug 31, 2018
Prepaid rental charges 160 321 133 321
Other prepaid expenses 9,725 3,313 8,768 1,414
Accrued contract income 15,386
Other accrued income 2,952 2,339 2,922 410
Total 28,223 5,973 11,823 2,145
Accrued expenses and deferred income Aug 31, 2019 Aug 31, 2018 Aug 31, 2019 Aug 31, 2018
Accrued payroll expenses and personnel costs 11,511 9,047 10,243 8,065
Accrued expenses and deferred income pertaining to projects 64,354 45,044 64,354 45,044
Other accrued expenses 15,720 7,516 2,261 6,328
Total 91,585 61,606 76,858 59,437
NOTE 23 SHARE CAPITAL AND EARNINGS PER SHARE
Disclosure on number of shares Aug 31, 2019 Aug 31, 2018
Number of issued and fully paid shares
Class A shares (number of votes per share 1) quotient value SEK 1 1,285,625 1,285,625
Class B shares (number of votes per share 1/10) quotient value SEK 1 23,621,375 23,621,375
Number of issued and fully paid shares 24,907,000 24,907,000
The specification of changes in equity can be found in the consolidated statement of changes in equity. Reserves consist of exchange rate differences arising in connection with the translation of the financial statements of foreign subsidiaries.
The Parent Company has no potential common shares, which is why earnings per share are the same before and after dilution for the reported years.
GROUP
Earnings per share, before and after dilution 2018/2019 2017/2018
Earnings attributable to Parent Company shareholders 132,876 194,460
Weighted average number of outstanding common shares 24,907,000 24,907,000
Earnings per share, before and after dilution 5.33 7.81
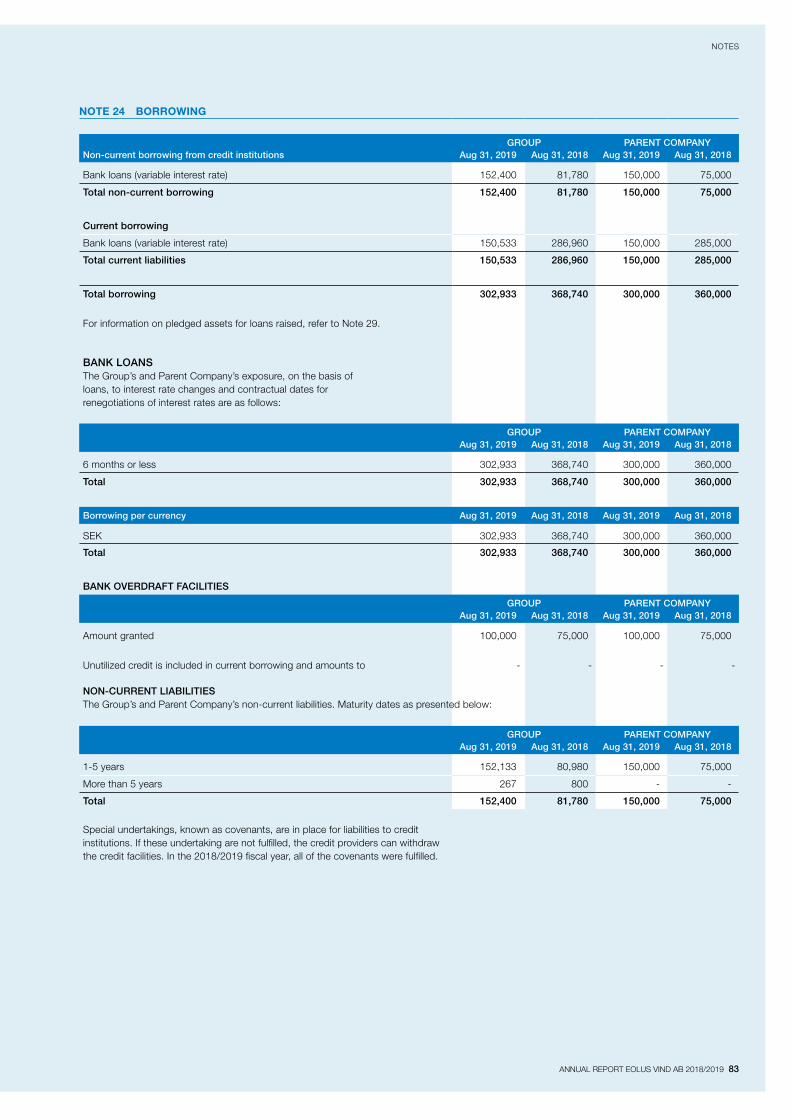
ANNUAL REPORT EOLUS VIND AB 2018/2019 83
NOTES
NOTE 24 BORROWING
GROUP PARENT COMPANYNon-current borrowing from credit institutions Aug 31, 2019 Aug 31, 2018 Aug 31, 2019 Aug 31, 2018
Bank loans (variable interest rate) 152,400 81,780 150,000 75,000
Total non-current borrowing 152,400 81,780 150,000 75,000
Current borrowing
Bank loans (variable interest rate) 150,533 286,960 150,000 285,000
Total current liabilities 150,533 286,960 150,000 285,000
Total borrowing 302,933 368,740 300,000 360,000
For information on pledged assets for loans raised, refer to Note 29.
BANK LOANSThe Group’s and Parent Company’s exposure, on the basis of loans, to interest rate changes and contractual dates for renegotiations of interest rates are as follows:
GROUP PARENT COMPANYAug 31, 2019 Aug 31, 2018 Aug 31, 2019 Aug 31, 2018
6 months or less 302,933 368,740 300,000 360,000
Total 302,933 368,740 300,000 360,000
Borrowing per currency Aug 31, 2019 Aug 31, 2018 Aug 31, 2019 Aug 31, 2018
SEK 302,933 368,740 300,000 360,000
Total 302,933 368,740 300,000 360,000
BANK OVERDRAFT FACILITIES
GROUP PARENT COMPANYAug 31, 2019 Aug 31, 2018 Aug 31, 2019 Aug 31, 2018
Amount granted 100,000 75,000 100,000 75,000
Unutilized credit is included in current borrowing and amounts to
NON-CURRENT LIABILITIESThe Group’s and Parent Company’s noncurrent liabilities. Maturity dates as presented below:
GROUP PARENT COMPANYAug 31, 2019 Aug 31, 2018 Aug 31, 2019 Aug 31, 2018
15 years 152,133 80,980 150,000 75,000
More than 5 years 267 800
Total 152,400 81,780 150,000 75,000
Special undertakings, known as covenants, are in place for liabilities to credit institutions. If these undertaking are not fulfilled, the credit providers can withdraw the credit facilities. In the 2018/2019 fiscal year, all of the covenants were fulfilled.

84 ANNUAL REPORT EOLUS VIND AB 2018/2019
NOTES
NOTE 25 PROVISIONS
Group
After-treatment costs for disposal of wind turbines
Lease fees
Total
At September 1, 2018 1,921 186 2,107
Recognized in profit or loss
additional provisions, interest 30 30
reversed amounts pertaining to divested turbines 1,194 18 1,212
At August 31, 2019 757 168 925
After-treatment costs for disposal of wind turbines
Lease fees
Total
At September 1, 2017 3,421 368 3,789
Recognized in profit or loss
additional provisions, interest 115 115
reversed amounts pertaining to divested turbines 1,615 182 1,797
At August 31, 2018 1,921 186 2,107
COMMITMENTS REGARDING AFTER-TREATMENTAccording to the Swedish Environmental Code, financial guarantees must be provided as security for dismantling and aftertreating the locations of wind turbines. The costs for dismantling and aftertreatment are estimated for each facility with guidance from investigations carried out for particular turbines. The basis is a normal value of SEK 250 per megawatt (MW) of installed capacity for steel hubs. About SEK 100 per MW is added if the turbine is constructed in concrete. The amounts apply to the cost scenario at September 1, 2011. The residual value is handled as a deductible item in the disposal analysis and is taken into account in these standard amounts. The time factor is taken into account through discounting. The price trend can be assumed to be equal to the longterm inflation target of 2%, while a certain level of technological progress should reduce the cost trend. Provisions are estab
lished at the present value of the calculated future cost. In accordance with IAS 37, point 60, provisions are continuously adjusted upward using the discount rate and this upward adjustment is recognized as a borrowing cost (interest expense).
COMMITMENTS REGARDING FUTURE LEASINGThe provision pertains to the commitment to pay future leases for turbines that have been sold.
PARENT COMPANYThe Parent Company’s provisions at August 31, 2019 comprise KSEK 0 (325) in aftertreatment costs and KSEK 168 (186) in lease fees, or a total of KSEK 168 (511).
NOTE 26 FINANCIAL INSTRUMENTS – DISCLOSURE ON FAIR VALUE PER CATEGORY
GROUP
Aug 31, 2019 Carrying amount Fair value Level
Assets in the balance sheet
Loan receivables and accounts receivable
Cash and cash equivalents 1,102,983 1,102,983 2
Accounts receivable 25,277 25,277 2
Other financial assets 20,502 20,502 2
Liabilities in the balance sheet
Liabilities measured at fair value through profit or loss
Derivate liabilities
Currency futures 27,719 27,719 2
Currency swaps 53 53 2
Interest rate swaps 9,749 9,749 2
Liabilities measured at amortized cost
Interestbearing liabilities 302,933 302,933 2
Accounts payable 229,381 229,381 2
Accrued interest expense 836 836 2

ANNUAL REPORT EOLUS VIND AB 2018/2019 85
NOTES
Aug 31, 2018 Carrying amount Fair value Level
Assets in the balance sheet
Loan receivables and accounts receivable
Cash and cash equivalents 739,825 739,825 2
Accounts receivable 53,018 53,018 2
Other current receivables 25 25 2
Blocked bank balances 5,000 5,000 2
Other financial assets 20,953 20,953 2
Accrued interest income 388 388 2
Liabilities in the balance sheet
Liabilities measured at fair value through profit or loss
Derivate liabilities
Currency futures 814 814 2
Interestrate swaps 11,833 11,833 2
Liabilities measured at amortized cost
Interestbearing liabilities 368,740 368,740 2
Accounts payable 140,806 140,806 2
Accrued interest expense 849 849 2
DERIVATIVE INSTRUMENTSEolus does not apply hedge accounting. Derivative instruments for managing currency and interest rate risk are recognized as current assets or current liabilities and classified as held for trading. Changes in the value of currency derivatives are recognized in profit or loss as other operating income or other operating expenses. Changes in the value of interest rate derivatives are recognized in net financial items.
DESCRIPTION OF FAIR VALUEInterest-bearing liabilitiesThe fair value of interestbearing liabilities is calculated by discounting future cash flows of capital amounts and interest discounted to the current market interest rate.
DerivativesCurrency futures are measured at fair value by discounting the difference between the contracted forward rate and the forward rate and can be agreed on the balance sheet date for the remaining contract period. The fair value of interestrate swaps is based on a discounting of expected future cash flows according to the contracts’ terms and conditions and due dates, using the market interest rate as the baseline.
Other financial assets and liabilitiesFor accounts receivable, other receivables/liabilities, accrued income and expenses and accounts payable with a remaining term of less than six months, the carrying amount is considered to reflect the fair value.
NOTE 27 RECONCILIATION BETWEEN PROFIT BEFORE TAX AND NET CASH FLOW
GROUP PARENT COMPANYNon-cash items Aug 31, 2019 Aug 31, 2018 Aug 31, 2019 Aug 31, 2018
Depreciation and impairment of property, plant and equipment 4,967 14,765 1,419 1,896
Unrealized exchange rate differences 915 2,195 958 2,195
Capital gains from divestment of noncurrent assets 75 231 75 9,871
Changes in provisions 1,180 1,682 341 936
Measurement of derivatives at fair value 26,958 351
Total 29,896 15,399 195 9,234

86 ANNUAL REPORT EOLUS VIND AB 2018/2019
NOTES
NOTE 29 PLEDGED ASSETS AND CONTINGENT LIABILITIES
GROUP PARENT COMPANYPledged assets for liabilities to credit institutions 2018/2019 2017/2018 2018/2019 2017/2018
Chattel mortgages 648,000 603,000 625,000 580,000
Wind turbines and leases used as collateral 6,230 15,288
Shares in associated companies 34
Total 654,230 618,322 625,000 580,000
CONTINGENT LIABILITIESThe Group has contingent liabilities pertaining to legal claims that have arisen in the normal business operations. No significant liabilities, other than those for which provisions have been made (Note 25), are expected to arise on the basis of these.
PARENT COMPANYContingent liabilities 2018/2019 2017/2018
Contingent liabilities for the benefit of subsidiaries 5,000 5,000
Total 5,000 5,000
NOTE 28 CHANGES IN LIABILITIES ATTRIBUTABLE TO FINANCING ACTIVITIES
Loan liabilities
falling due within 1 year
Loan liabilities
falling due after 1 year
Other liabilities
Total
At September 1, 2018 -286,960 -81,780 -264 -369,004
Cash flow 136,427 70,620 65,807
Exchange rate differences 20 20
At August 31, 2019 -150,533 -152,400 -284 -303,217
Loan liabilities
falling due within 1 year
Loan liabilities
falling due after 1 year
Other liabilities
Total
At September 1, 2017 -21,169 -12,740 -797 -34,706
Cash flow 265,752 69,040 599 334,193
Exchange rate differences 39 66 105
At August 31, 2018 -286,960 -81,780 -264 -369,004

ANNUAL REPORT EOLUS VIND AB 2018/2019 87
NOTES
NOTE 30 RELATED-PARTY TRANSACTIONS
OWNER STRUCTURE AT AUGUST 31, 2019
Largest shareholders
No. ofClass A shares
No. ofClass B shares
Share of equity (%)
Share of votes (%)
Domneåns Kraftaktiebolag 357,900 2,012,869 9.5 15.3
Stennart, HansGöran Total 380,100 518,984 3.6 11.8
Johansson, Åke 194,720 567,200 3.1 6.9
Borgunda Total 169,520 59,168 0.9 4.8
Försäkringsaktiebolaget Avanza Pension 1,411,324 5.7 3.9
Svantesson, Ingvar 43,750 200,175 1.0 1.7
Nordnet Pensionsförsäkring AB 500 480,955 1.9 1.3
Swedbank Försäkring AB 477,468 1.9 1.3
Stiftelsen Riksbankens, Jubileumsfond 347,198 1.4 1.0
Kieryd Gård AB 340,392 1.4 0.9
Other shareholders 139,135 17,205,642 69.6 51.1
Total 1,285,625 23,621,375 100.0 100.0
No Board members or other senior executives had any direct or indirect share transactions with the Group in 2018/2019 or 2017/2018, other than the remuneration stated in Note 7.
PARENT COMPANY’S TRANSACTIONS WITH OTHER GROUP COMPANIES0.0% (0.0) of the Parent Company’s sales pertain to intraGroup invoicing. The Parent Company’s operating expenses include intraGroup purchases at only insignificant amounts. The same pricing policies apply to both purchases and sales between Group companies as to transactions with external parties.
No significant events took place after the end of the fiscal year.
NOTE 31 SIGNIFICANT EVENTS AFTER THE END OF THE REPORTING PERIOD

88 ANNUAL REPORT EOLUS VIND AB 2018/2019
SIGNATURES
The undersigned affirm that these consolidated financial statements and this Annual Report have been prepared in accordance with International Financial Reporting Standards (IFRS) as adopted by the EU and generally accepted accounting principles, and provide a
true and fair view of the Group’s and the Parent Company’s financial position and earnings, and that the Directors’ Report provides a fair review of the Group’s and Parent Company’s
operations, financial position and earnings and describes the material risks and uncertainty factors faced by the companies included in the Group.
Hässleholm, November 28, 2019
Hans-Göran Stennert
Chairman
Hans Linnarson
Board member
Jan Johansson
Board member
Fredrik Daveby
Board member
Hans Johansson
Board member
Sigrun Hjelmquist
Board member
Bodil Rosvall Jönsson
Board member
Per Witalisson
CEO
Our auditor’s report was submitted on November 28, 2019.
Eva Carlsvi
Authorised Public Accountant
PricewaterhouseCoopers AB

ANNUAL REPORT EOLUS VIND AB 2018/2019 89
AUDITOR’S REPORT
Auditor’s reportTo the general meeting of the shareholders of Eolus Vind AB (publ), corporate identity number 556389-3956
REPORT ON THE ANNUAL ACCOUNTS AND CONSOLIDATED ACCOUNTS
OpinionsWe have audited the annual accounts and consolidated accounts of Eolus Vind AB (publ) for the year 1st September 2018 to 31 August 2019, excluding the corporate governance report on pages 4145. The annual accounts and consolidated accounts of the company are included on pages 3688 in this document. In our opinion, the annual accounts have been prepared in accordance with the Annual Accounts Act and present fairly, in all material respects, the financial position of the parent company as of 31 August 2019 and its financial performance and cash flow for the year then ended in accordance with the Annual Accounts Act. The consolidated accounts have been prepared in accordance with the Annual Accounts Act and present fairly, in all material respects, the financial position of the group as of 31 August 2019 and their financial performance and cash flow for the year then ended in accordance with International Financial Reporting Standards (IFRS), as adopted by the EU, and the Annual Accounts Act. Our opinion does not include the corporate governance report on pages 4145. The statutory administration report is consistent with the other parts of the annual accounts and consolidated accounts. We therefore recommend that the general meeting of shareholders adopts the income statement and balance sheet for the parent company and the group. Our opinions in this report on the annual accounts and consolidated accounts are consistent with the content of the supplementary report that has been submitted to the Parent Company’s Audit Committee in accordance with Article 11 of the Auditors Ordinance (537/2014).
Basis for OpinionsWe conducted our audit in accordance with International Standards on Auditing (ISA) and generally accepted auditing standards in Sweden. Our responsibilities under those standards are further described in the Auditor’s Responsibilities section. We are independent of the parent company and the group in accordance with professional ethics for accountants in Sweden and have otherwise fulfilled our ethical responsibilities in accordance with these requirements. This means that, based on our best knowledge and belief, no prohibited services referred to in Article 5.1 of the Auditors Ordinance (537/2014) have been provided to the audited company or, as the case may be, its parent company or its controlled company within the EU. We believe that the audit evidence we have obtained is sufficient and appropriate to provide a basis for our opinions.
Our audit approachAudit focus and scopeWe designed our audit by determining materiality and assessing the risks of material misstatement in the consolidated financial statements. In particular, we considered where management made subjective judgements; for example, in respect of significant accounting estimates that involved making assumptions and considering future events that are inherently uncertain. As in all of our audits, we also addressed the risk of management override of internal controls, including among other matters consideration of whether there was evidence of bias that represented a risk of material misstatement due to fraud. We tailored the scope of our audit in order to perform sufficient work to enable us to provide an opinion on the consolidated financial statements as a whole, taking into account the structure of the Group, the accounting processes and controls, and the industry in which the group operates.
MaterialityThe scope of our audit was influenced by our application of materiality. An audit is designed to obtain reasonable assurance whether the financial statements are free from material misstatement. Misstatements may arise due to fraud or error. They are considered material if individually or in aggregate, they could reasonably be expected to influence the economic decisions of users taken on the basis of the financial statements.Based on our professional judgement, we determined certain quantitative thresholds for materiality, including the overall materiality for the financial statements as a whole. These, together with qualitative considerations, helped us to determine the scope of our audit and the nature, timing and extent of our audit procedures and to evaluate the effect of misstatements, both individually and in aggregate on the financial statements as a whole.
Key audit mattersKey audit matters of the audit are those matters that, in our professional judgment, were of most significance in our audit of the annual accounts and consolidated accounts of the current period. These matters were addressed in the context of our audit of, and in forming our opinion thereon, the annual accounts and consolidated accounts as a whole, but we do not provide a separate opinion on these matters.

90 ANNUAL REPORT EOLUS VIND AB 2018/2019
AUDITOR’S REPORT
Valuation of projects in progressEolus Vind reports projects in progress in its balance sheet associated with the design of wind farms. The projects are realized when Eolus Vind sells the project as a constructionready project or when the wind farm is already constructed and is either sold to a client or moved to the inventory. A project can also be realized through the sale of project rights.The reported value of projects in progress amounted at 31 August 2019 to MSEK 472.
This balance sheet item is significant in its size and with the current electricity prices and prices of electricity certificates, the valuation of projects in progress is a focus area in our audit.
Each project is valued individually, and the company considers the realization potential of the project in the long and short term. The value of a project which is not seen to be realizable is written down immediately. This takes place, for example, when a project is rejected in the working permit process.
We have studied company management’s assessments and have challenged them as regarding these assessments.
In performing our audit, we have obtained an understanding of the manner in which macro economic developments impact Eolus Vind and how the Board of Directors and company management work to compile information to serve as the basis of their decision making. Projects in progress have been audited on the basis of our:
• detailed testing to determine that the costs referring to the projects actually refer to relevant project costs
• studied the company’s assessment of the realization of projects in the short and long term
• assessed the inherent parameters, such as the time plans and budgets, in the projects for which a contract has already been signed with a client
• discussed and assessed projects included in the business plan and budget with management and followed up the outcome against last year’s business plan and budget
• performed random sample testing for the remaining projects included in the project portfolio and obtained comments from project managers regarding the status and assessed value of the projects.
In performing our audit, we have noted no significant deviations.
Other Information than the annual accounts and consolidated accountsThis document also contains other information than the annual accounts and consolidated accounts and is found on pages 135 and 9295. The Board of Directors and the Managing Director are responsible for this other information. Our opinion on the annual accounts and consolidated accounts does not cover this other information and we do not express any form of assurance conclusion regarding this other information. In connection with our audit of the annual accounts and consolidated accounts, our responsibility is to read the information identified above and consider whether the information is materially inconsistent with the annual accounts and consolidated accounts. In this procedure we also take into account our knowledge otherwise obtained in the audit and assess whether the information otherwise appears to be materially misstated.
If we, based on the work performed concerning this information, conclude that there is a material misstatement of this other information, we are required to report that fact. We have nothing to report in this regard.
Responsibilities of the Board of Directors and the Managing DirectorThe Board of Directors and the Managing Director are responsible for the preparation of the annual accounts and consolidated accounts and that they give a fair presentation in accordance with the Annual Accounts Act and, concerning the consolidated accounts, in accordance with IFRS as adopted by the EU. The Board of Directors and the Managing Director are also responsible for such internal control as they determine is necessary to enable the preparation of annual accounts and consolidated accounts that are free from material misstatement, whether due to fraud or error. In preparing the annual accounts and consolidated accounts, The Board of Directors and the Managing Director are responsible for the
KEY AUDIT MATTER
Revenue recognition – sale of wind farmsEolus Vind has a business plan and strategy which implies the construction and sale of wind farms, either directly or via companies.
During the financial year, Eolus completed the projects Anneberg, Sötterfällan and Nylandsbergen, sold the project rights for Bäckhammar and Stigafjellet and started the construction of Kråktorpet and Bäckhammar.
Each separate transaction is individually produced and the contracts contain specific terms and conditions which, amongst other things, stipulate the payment model to apply and which also stipulate the respective parties’ commitments and requirements for completion of the contract within the determined time period.
The business approach and associated contract comprises a complex area where various interpretations of the executed transaction and the associated contract terms can have a significant impact on the company’s accounting and revenue recognition.
HOW OUR AUDIT ADDRESSED THE KEY AUDIT MATTER
Each separate contract for the sale of a wind farm, either directly or via a company, is individually produced and contains various regulations and clauses. In our audit we have:
• Audited the company’s calculation of capital gains by reconciling the calculation against the sales contracts
• Audited the company’s bookkeeping regarding sales at company level• Audited the company’s assessments of percentageofcompletion
method at group level and reviewed that the bookkeeping of percentageofcompletion method has been handled correctly.
• Examined to determine if the classification of capital gains has been handled correctly in accordance with the company’s accounting principles.
In performing our audit, we have noted no significant deviations.
ANNUAL REPORT EOLUS VIND AB 2018/2019 91
AUDITOR’S REPORT
assessment of the company’s and the group’s ability to continue as a going concern. They disclose, as applicable, matters related to going concern and using the going concern basis of accounting. The going concern basis of accounting is however not applied if the Board of Directors and the Managing Director intends to liquidate the company, to cease operations, or has no realistic alternative but to do so. The Board's Audit Committee shall, without affecting the other tasks and responsibilities of the Board, monitor the company's financial reporting, among other things.
Auditor’s responsibilityOur objectives are to obtain reasonable assurance about whether the annual accounts and consolidated accounts as a whole are free from material misstatement, whether due to fraud or error, and to issue an auditor’s report that includes our opinions. Reasonable assurance is a high level of assurance but is not a guarantee that an audit conducted in accordance with ISAs and generally accepted auditing standards in Sweden will always detect a material misstatement when it exists. Misstatements can arise from fraud or error and are considered material if, individually or in the aggregate, they could reasonably be expected to influence the economic decisions of users taken on the basis of these annual accounts and consolidated accounts. A further description of our responsibility for the audit of the annual accounts and consolidated accounts is available on Revisorsinspektionen’s website: www.revisorsinspektionen.se/revisornsansvar. This description is part of the auditor´s report.
REPORT ON OTHER LEGAL AND REGULATORY REQUIREMENTS
OpinionsIn addition to our audit of the annual accounts and consolidated accounts, we have also audited the administration of the Board of Directors and the Managing Director of Eolus Vind AB (publ) for the year 1 September 2018 to 31 August 2019 and the proposed appropriations of the company’s profit or loss. We recommend to the general meeting of shareholders that the profit be appropriated in accordance with the proposal in the statutory administration report and that the members of the Board of Directors and the Managing Director be discharged from liability for the financial year.
Basis for OpinionsWe conducted the audit in accordance with generally accepted auditing standards in Sweden. Our responsibilities under those standards are further described in the Auditor’s Responsibilities section. We are independent of the parent company and the group in accordance with professional ethics for accountants in Sweden and have otherwise fulfilled our ethical responsibilities in accordance with these requirements.We believe that the audit evidence we have obtained is sufficient and appropriate to provide a basis for our opinions.
Responsibilities of the Board of Directors and the Managing DirectorThe Board of Directors is responsible for the proposal for appropriations of the company’s profit or loss. At the proposal of a dividend, this includes an assessment of whether the dividend is justifiable considering the requirements which the company's and the group’s type of operations, size and risks place on the size of the parent company's and the group’s equity, consolidation requirements, liquidity and position in general. The Board of Directors is responsible for the company’s organization and the administration of the company’s affairs. This includes among other things continuous assessment of the company’s and the group’s financial situation and ensuring that the company's organization is designed so that the accounting, management of assets and the company’s financial affairs otherwise are controlled in a reassuring manner. The Managing Director shall manage the ongoing administration according to the Board of Directors’ guidelines and instructions and among
other matters take measures that are necessary to fulfil the company’s accounting in accordance with law and handle the management of assets in a reassuring manner.
Auditor’s responsibilityOur objective concerning the audit of the administration, and thereby our opinion about discharge from liability, is to obtain audit evidence to assess with a reasonable degree of assurance whether any member of the Board of Directors or the Managing Director in any material respect:
• has undertaken any action or been guilty of any omission which can give rise to liability to the company, or
• in any other way has acted in contravention of the Companies Act, the Annual Accounts Act or the Articles of Association.
Our objective concerning the audit of the proposed appropriations of the company’s profit or loss, and thereby our opinion about this, is to assess with reasonable degree of assurance whether the proposal is in accordance with the Companies Act. Reasonable assurance is a high level of assurance, but is not a guarantee that an audit conducted in accordance with generally accepted auditing standards in Sweden will always detect actions or omissions that can give rise to liability to the company, or that the proposed appropriations of the company’s profit or loss are not in accordance with the Companies Act. A further description of our responsibility for the audit of the administration is available on Revisorsinspektionen’s website: www.revisorsinspektionen.se/revisornsansvar. This description is part of the auditor’s report.
Audit of the corporate governance reportThe Board of Directors is responsible for the corporate governance report on pages 4145 and for ensuring that it is prepared in accordance with the Annual Accounts Act. Our examination of the corporate governance statement is conducted in accordance with FAR’s auditing standard RevU 16 The auditor’s examination of the corporate governance statement. This means that our examination of the corporate governance statement is different and substantially less in scope than an audit conducted in accordance with International Standards on Auditing and generally accepted auditing standards in Sweden. We believe that the examination has provided us with sufficient basis for our opinions. A corporate governance report has been prepared. Disclosure in accordance with Chapter 6. § 6 subparagraphs 26 of the Annual Accounts Act and Chapter 7. § 31, second paragraph of the same Act are consistent with the annual accounts and consolidated accounts and are in accordance with the Annual Accounts Act. PricewaterhouseCoopers AB was appointed Eolus Vind AB (publ)'s auditor at the Annual General Meeting on 26 January 2019 and has been the company's auditor since 24 January 2015.
Hässleholm, 28 November 2019PricewaterhouseCoopers AB
Eva CarlsviAuthorised Public Accountant
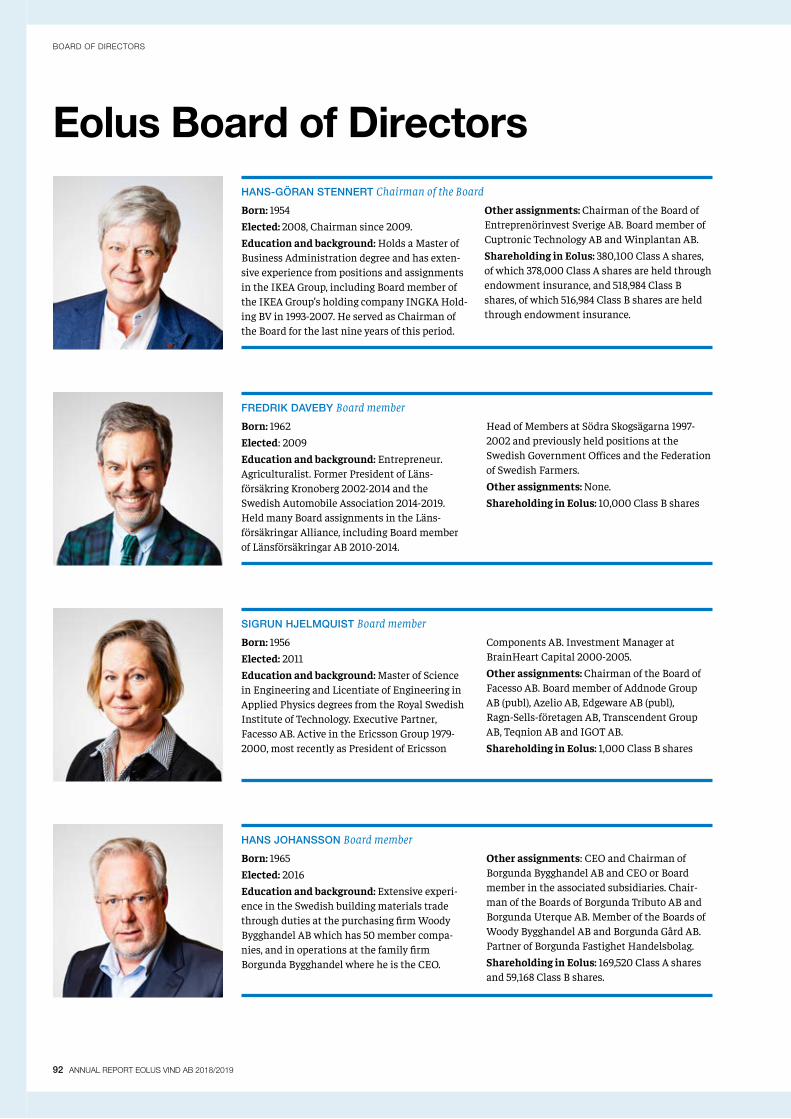
92 ANNUAL REPORT EOLUS VIND AB 2018/2019
BOARD OF DIRECTORS
Eolus Board of DirectorsHANS-GÖRAN STENNERT Chairman of the Board
Born: 1954Elected: 2008, Chairman since 2009.Education and background: Holds a Master of Business Administration degree and has exten-sive experience from positions and assignments in the IKEA Group, including Board member of the IKEA Group’s holding company INGKA Hold-ing BV in 1993-2007. He served as Chairman of the Board for the last nine years of this period.
Other assignments: Chairman of the Board of Entreprenörinvest Sverige AB. Board member of Cuptronic Technology AB and Winplantan AB.Shareholding in Eolus: 380,100 Class A shares, of which 378,000 Class A shares are held through endowment insurance, and 518,984 Class B shares, of which 516,984 Class B shares are held through endowment insurance.
FREDRIK DAVEBY Board member
Born: 1962Elected: 2009Education and background: Entrepreneur. Agriculturalist. Former President of Läns- försäkring Kronoberg 2002-2014 and the Swedish Automobile Association 2014-2019. Held many Board assignments in the Läns-försäkringar Alliance, including Board member of Länsförsäkringar AB 2010-2014.
Head of Members at Södra Skogsägarna 1997-2002 and previously held positions at the Swedish Government Offices and the Federation of Swedish Farmers.Other assignments: None.Shareholding in Eolus: 10,000 Class B shares
SIGRUN HJELMQUIST Board member
Born: 1956Elected: 2011Education and background: Master of Science in Engineering and Licentiate of Engineering in Applied Physics degrees from the Royal Swedish Institute of Technology. Executive Partner, Facesso AB. Active in the Ericsson Group 1979-2000, most recently as President of Ericsson
Components AB. Investment Manager at BrainHeart Capital 2000-2005.Other assignments: Chairman of the Board of Facesso AB. Board member of Addnode Group AB (publ), Azelio AB, Edgeware AB (publ), Ragn-Sells-företagen AB, Transcendent Group AB, Teqnion AB and IGOT AB.Shareholding in Eolus: 1,000 Class B shares
HANS JOHANSSON Board member
Born: 1965Elected: 2016Education and background: Extensive experi-ence in the Swedish building materials trade through duties at the purchasing firm Woody Bygghandel AB which has 50 member compa-nies, and in operations at the family firm Borgunda Bygghandel where he is the CEO.
Other assignments: CEO and Chairman of Borgunda Bygghandel AB and CEO or Board member in the associated subsidiaries. Chair-man of the Boards of Borgunda Tributo AB and Borgunda Uterque AB. Member of the Boards of Woody Bygghandel AB and Borgunda Gård AB. Partner of Borgunda Fastighet Handelsbolag.Shareholding in Eolus: 169,520 Class A shares and 59,168 Class B shares.
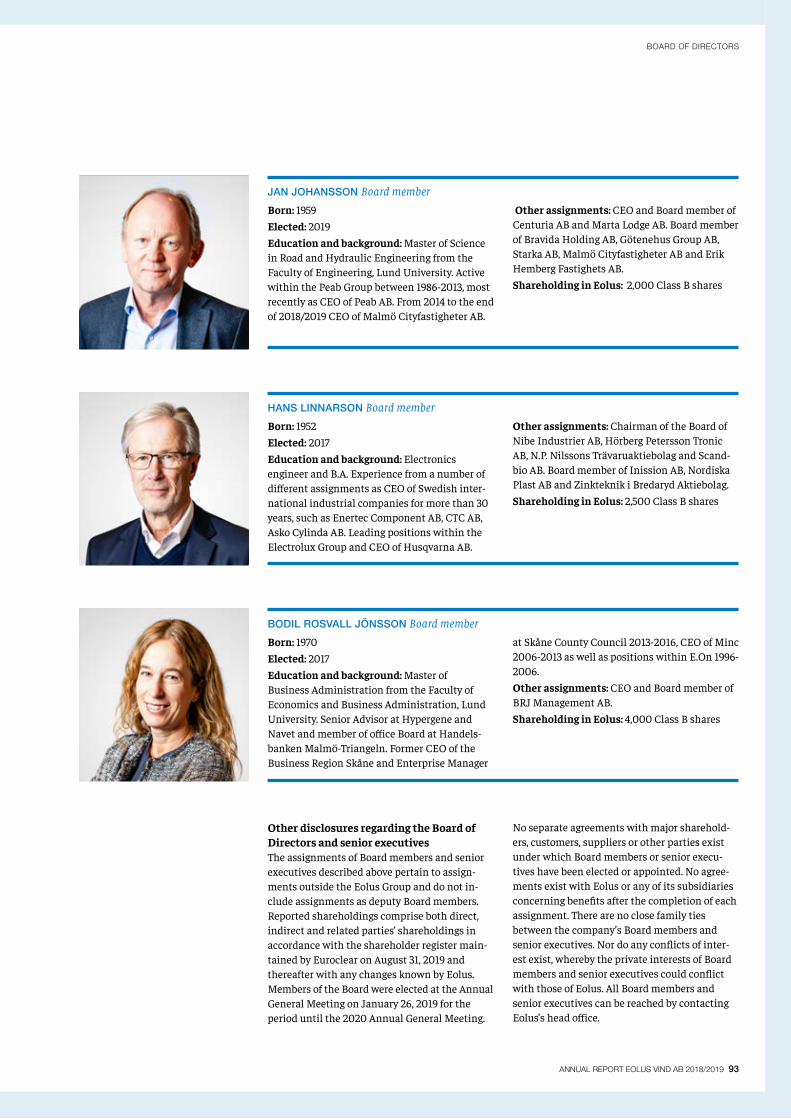
ANNUAL REPORT EOLUS VIND AB 2018/2019 93
BOARD OF DIRECTORS
JAN JOHANSSON Board member
Born: 1959Elected: 2019Education and background: Master of Science in Road and Hydraulic Engineering from the Faculty of Engineering, Lund University. Active within the Peab Group between 1986-2013, most recently as CEO of Peab AB. From 2014 to the end of 2018/2019 CEO of Malmö Cityfastigheter AB.
Other assignments: CEO and Board member of Centuria AB and Marta Lodge AB. Board member of Bravida Holding AB, Götenehus Group AB, Starka AB, Malmö Cityfastigheter AB and Erik Hemberg Fastighets AB.Shareholding in Eolus: 2,000 Class B shares
HANS LINNARSON Board member
Born: 1952Elected: 2017Education and background: Electronics engineer and B.A. Experience from a number of different assignments as CEO of Swedish inter-national industrial companies for more than 30 years, such as Enertec Component AB, CTC AB, Asko Cylinda AB. Leading positions within the Electrolux Group and CEO of Husqvarna AB.
Other assignments: Chairman of the Board of Nibe Industrier AB, Hörberg Petersson Tronic AB, N.P. Nilssons Trävaruaktiebolag and Scand-bio AB. Board member of Inission AB, Nordiska Plast AB and Zinkteknik i Bredaryd Aktiebolag.Shareholding in Eolus: 2,500 Class B shares
BODIL ROSVALL JÖNSSON Board member
Born: 1970Elected: 2017Education and background: Master of Business Administration from the Faculty of Economics and Business Administration, Lund University. Senior Advisor at Hypergene and Navet and member of office Board at Handels-banken Malmö-Triangeln. Former CEO of the Business Region Skåne and Enterprise Manager
at Skåne County Council 2013-2016, CEO of Minc 2006-2013 as well as positions within E.On 1996-2006.Other assignments: CEO and Board member of BRJ Management AB.Shareholding in Eolus: 4,000 Class B shares
Other disclosures regarding the Board of Directors and senior executives The assignments of Board members and senior executives described above pertain to assign-ments outside the Eolus Group and do not in-clude assignments as deputy Board members. Reported shareholdings comprise both direct, indirect and related parties’ shareholdings in accordance with the shareholder register main-tained by Euroclear on August 31, 2019 and thereafter with any changes known by Eolus. Members of the Board were elected at the Annual General Meeting on January 26, 2019 for the period until the 2020 Annual General Meeting.
No separate agreements with major sharehold-ers, customers, suppliers or other parties exist under which Board members or senior execu-tives have been elected or appointed. No agree-ments exist with Eolus or any of its subsidiaries concerning benefits after the completion of each assignment. There are no close family ties between the company’s Board members and senior executives. Nor do any conflicts of inter-est exist, whereby the private interests of Board members and senior executives could conflict with those of Eolus. All Board members and senior executives can be reached by contacting Eolus’s head office.

94 ANNUAL REPORT EOLUS VIND AB 2018/2019
GLOSSARY
A normal Swedish house uses about 5,000 kWh of household electricity per year. This means that:1 MWh is sufficient for 0.2 houses1 GWh is sufficient for 200 houses1 TWh is sufficient for 200,000 houses
GlossaryElectricity certificates A technology- neutral system for promoting the expansion of re-newable electricity generation. Producers of renewable electricity receive a certificate for each MWh (megawatt hour) generated, which is then sold to quota obligation electricity consumers.
Electricity Price Area Geographical divi-sions to highlight areas that require trans-mission and generation capacity to be expanded to better meet consumption in the area in question.
Renewable energy Renewable energy originates from sources that are continuous-ly replenished at a rapid pace, such as wind, water, solar and biomass. Nuclear power is not considered a renewable energy form since it is based on finite resources.
Operational turbines Turbines that have undergone final commissioning and are generating electricity.
Installed capacity For wind power, capacity is measured in MW and states the perfor-mance of the wind turbine according to design data.
Intermittent energy source A method of generating power where the level of power generated varies over time depending on external factors. For wind power, this means how much and when the wind blows, and for photovoltaics, how much sunlight the cells receive depending on the time of day and weather.
Hub height The height of the tower plus the nacelle.
Nord Pool The Nordic Power Exchange.
Normal year The definition of an average year of a generated amount of electricity. Determined based on long-term calculations from the Swedish Meteorological and Hydrological Institute (SMHI).
Offshore Wind power constructed in bodies of water.
Swept area The area of the circle swept by the rotor blades. A turbine with a rotor dia-meter of 150 meters will have a swept area of about 17,700 square meters, almost the same as three soccer fields.
Availability A measurement for the amount of total time that a wind turbine has been available to generate electricity.
Total height Height of a wind turbine when one of the blades is at its highest point.
Constructed turbines Turbines that have been constructed, undergone final com-missioning and been taken over from the turbine supplier. The turbine is either trans-ferred to the customer as a turnkey facility or is transferred to Eolus’s inventories.
Volatility A measurement of the price varia-tion of a product (for example, electricity) over a period of time.
Transmission capacity The amount of electricity that can be transmitted between different areas via the electricity grid.
Units
The unit of measurement for energy is kilowatt hours. 1 MWh = 1,000 kWh 1 GWh = 1,000,000 kWh 1 TWh = 1,000,000,000 kWh
The unit of measurement for capacity is watts. 1 MW = 1,000,000 W 1 GW = 1,000,000,000 W
A wind turbine that produces 14 GWh (14,000,000 kWh)
supplies 2,800 houses with household
electricity per year.
2800

ANNUAL REPORT EOLUS VIND AB 2018/2019 95
ANNUAL GENERAL MEETING, FINANCIAL CALENDAR, DEFINITION OF ALTERNATIVE PERFORMANCE MEASURES
Annual General MeetingThe Annual General Meeting will be held at Hässleholms Kulturhus on Saturday, January 25, 2020 at 3:00 p.m. In conjunction with the Annual General Meeting, Eolus will hold its traditional wind power seminar.
Anyone wishing to participate in the Annual General Meeting must:• be registered as a shareholder in the shareholder register maintained by
Euroclear Sweden AB on January 20, 2020.• have notified the company of their attendance by not later than January 20, 2020
at 4:00 p.m. When notifying the company, name, personal identity number or c orporate registration number, telephone number, address, shareholding and, whe-re applicable, any details concerning proxies and advisors must be included.
• To be eligible to participate in the Annual General Meeting, shareholders whose sha-res are registered in the name of a trustee must also request that their shares be tem-porarily re-registered in their own names in the shareholder register maintained by Euroclear Sweden AB. Shareholders must inform the trustee thereof well in advance of January 20, 2020, which is the date on which such registration must be completed to ensure their inclusion in the shareholder register printed by Euroclear Sweden AB on the date specified.
Financial calendarInterim report Q1, January 23, 2020Annual General Meeting January 25, 2020Interim report Q2, April 23, 2020Interim report Q3, July 8, 2020Year-end report 2019/2020 October 21, 2020
Eolus Vind AB (“Eolus”) is a public company with Corporate Registration Number 556389-3956. The company is based in Hässleholm, Sweden. This Annual Report has been published in Swedish and English. The Swedish Annual Report is the official version. The Annual Report consists of the Directors’ Report (pages 36-40), the Corporate Governance Report (pages 41-45) and the financial statements (pages 46-91).
All monetary values are expressed in Swedish kronor (SEK), unless otherwise stated. The value in Swedish kronor is abbreviated SEK, thousand kronor (KSEK) and million kronor (SEK M). Figures in brackets refer to the preceding fiscal year, 2016/2017.
Definition of alternative performance measuresThis section contains definitions of certain financial non-IFRS measures compared with the closest comparable financial IFRS measure. Financial non-IFRS measures have limitations as analytical tools and should not be considered in isolation or as a replacement for financial measures pro-duced in conformity with IFRS. Financial non-IFRS measures are reported to enhance investors’ assessment of the company’s
operational result, to provide assistance when forecasting future periods and to simplify comparisons of earnings between periods. The management uses these non-IFRS measures to, for example, evaluate operating activities compared with earlier results, for internal planning and for fore-casts. The financial non-IFRS measures presented in this report may differ from similar measures used by other companies.
Cover photo: A blade is mounted on to one of the 43 Vestas V136-3.8 MW wind turbines in Kråktorpet in the Municipality of Sundsvall. The length of each blade is 66.7 meters, contributing to a total swept area of about 14,500 m2 or more than two soccer fields. The farm was handed over to the owners Aquila Capital in autumn 2019 and all electricity generated is encompassed by the power purchase agreement (PPA) with Vattenfall. The Kråktorpet wind farm’s estimated generation is almost 600 MWh per year. Photos: Daniel Larsson
Other photographers: Daniel Larsson, Johan Funke, Fotograf Cecilia, Istock Photo and Eolus Layout: Mustasch Reklambyrå Printed by: Norra Skåne Offset Translation: The Bugli Company.
Return on equity after tax Rolling 12-month earnings relative to average equity.
Return on capital employed Profit after financial items plus interest expense ex-pressed as a percentage of average capital employed.
Equity per share before/after dilution Equity divided by the number of shares at the end of the period before/after dilution.
Net liability/cash Interest-bearing liabili-ties minus cash and cash equivalents.
Earnings per share before/after dilution Net profit for the period divided by the weighted average number of shares during the year before/after dilution.
Operating margin Operating profit expressed as a percentage of net sales.
Equity/assets ratio Equity relative to total assets at the end of the period.
Capital employed Total assets minus non-interest-bearing liabilities.
Change in fair value of financial derivati-ves Relates to the change in fair value of fi-nancial instruments, which is calculated using methods and based on observable input data for the asset or liability, either directly (prices) or indirectly (derived from prices).
Profit margin Profit/loss after financial items expressed as a percentage of net sales.

Eolus Vind is a leading Nordic wind power developer. Eolus creates value at every level of project development, establishment and operation of renewable energy facilities. We offer attractive and competitive investment opportuni-ties in the Nordic region, Baltic countries and the US to both local and international investors.
Since the company’s inception in 1990, Eolus has been in-volved in the construction of more than 570 wind turbines with an installed capacity of nearly 1,050 MW. The Eolus Group currently has customer contracts for asset manage-ment services comprising some 525 MW of wind power deployment. At August 31, 2019, Eolus Vind AB had approximately 14,000 shareholders. Eolus’s Class B share is traded on Nasdaq Stockholm, Small Cap.
Eolus Vind AB Street address: Box 95, Tredje Avenyen 3 SE-281 21 Hässleholm, Sweden
Tel: +46 (0)10-199 88 00 E-mail: [email protected] www.eolusvind.com