annual report december 31, 2015 - goldmansachs.com · 31, 2015 and december 31, 2014, respectively....
TRANSCRIPT

Annual Report December 31, 2015 Goldman Sachs International (unlimited company) Company Number: 02263951

GOLDMAN SACHS INTERNATIONAL (UNLIMITED COMPANY) ANNUAL REPORT FOR THE FINANCIAL YEAR ENDED DECEMBER 31, 2015
1
INDEX Page No.
Part I Strategic Report 2
Introduction 2
Executive Overview 2
Business Environment 3
Adoption of FRS 101 4
Critical Accounting Policy 4
Results of Operations 6
Balance Sheet and Funding Sources 9
Equity Capital Management and Regulatory Capital 12
Regulatory Developments 15
Principal Risks and Uncertainties 19
Risk Management 31
Overview and Structure of Risk Management 32
Liquidity Risk Management 34
Market Risk Management 39
Credit Risk Management 43
Operational Risk Management 46
Model Risk Management 48
Date of Authorisation of Issue 48
Part II Directors’ Report and Audited Financial Statements 49
Directors’ Report 49
Independent Auditor’s Report 51
Profit and Loss Account 53
Statements of Comprehensive Income 53
Balance Sheet 54
Statements of Changes in Equity 55
Statements of Cash Flows 56
Notes to the Financial Statements 57
Note 1. General Information 57
Note 2. Summary of Significant Accounting Policies 57
Note 3. Critical Accounting Estimates and Judgements 62
Note 4. First-Time Adoption of FRS 101 62
Note 5. Segment Reporting 66
Note 6. Administrative Expenses 67
Note 7. Directors’ Emoluments 68
Note 8. Staff Costs 68
Note 9. Interest Payable and Similar Charges 68
Note 10. Pension Arrangements 69
Note 11. Share-Based Payments 71
Note 12. Tax on Profit on Ordinary Activities 72
Note 13. Tangible Fixed Assets 72
Note 14. Fixed Asset Investments 72
Note 15. Financial Instruments Owned and Financial Instruments Sold, But Not Yet Purchased 73
Note 16. Collateralised Agreements 74
Note 17. Debtors 74
Note 18. Deferred Tax 74
Note 19. Collateralised Financings 74
Note 20. Other Creditors 75
Note 21. Provisions for Liabilities 76
Note 22. Share Capital 76
Note 23. Cash and Cash Equivalents 76
Note 24. Reconciliation of Cash Flows From Operating Activities 76
Note 25. Financial Commitments and Contingencies 77
Note 26. Financial Risk Management and Capital Management 78
Note 27. Financial Assets and Financial Liabilities 79
Note 28. Offsetting of Financial Assets and Financial Liabilities 93

GOLDMAN SACHS INTERNATIONAL (UNLIMITED COMPANY)
Strategic Report
2
Introduction
Goldman Sachs International (GSI or the company) provides a
wide range of financial services to clients located worldwide.
The company also operates a number of branches across
Europe, the Middle East and Africa (EMEA) to provide
financial services to clients in those regions.
The company’s primary regulators are the Prudential
Regulation Authority (PRA) and the Financial Conduct
Authority (FCA).
The company’s ultimate parent undertaking and controlling
entity is The Goldman Sachs Group, Inc. (Group Inc.). Group
Inc. is a bank holding company and a financial holding
company regulated by the Board of Governors of the Federal
Reserve System (Federal Reserve Board). Group Inc., together
with its consolidated subsidiaries, form “GS Group” or “the
group”. GS Group is a leading global investment banking,
securities and investment management firm that provides a
wide range of financial services to a substantial and diversified
client base that includes corporations, financial institutions,
governments and individuals. GS Group has a presence in
EMEA through a number of subsidiaries, including GSI.
GSI seeks to be the advisor of choice for its clients and a
leading participant in global financial markets. As part of GS
Group, GSI also enters into transactions with affiliates in the
normal course of business as part of its market-making
activities and general operations. GSI, consistent with GS
Group, reports its activities in four business segments:
Investment Banking; Institutional Client Services; Investing &
Lending; and Investment Management.
References to “the financial statements” are to the directors’
report and audited financial statements as presented in Part II
of this annual report. All references to 2015 and 2014 refer to
the years ended, or the dates, as the context requires, December
31, 2015 and December 31, 2014, respectively.
Unless otherwise stated, all amounts in this annual report are
prepared in accordance with the new FRS 101 framework
(FRS 101), and the terms FRS 101 and United Kingdom
Generally Accepted Accounting Practices (U.K. GAAP) are
used interchangeably. See “Adoption of FRS 101” below for
further information about the company’s transition from the
previous U.K. GAAP to FRS 101.
Certain disclosures required by U.K. GAAP in relation to the
company’s financial risk management and capital management
have been presented alongside other risk management and
regulatory information in the strategic report. Such disclosures
are identified as audited. All other information in the strategic
report is unaudited.
Executive Overview
Profit and Loss Account
The profit and loss account is set out on page 53 of this annual
report. The company’s profit for the financial year was $2.31
billion for 2015, an increase of 44% compared with 2014.
Net revenues were $7.02 billion for 2015, 9% higher than
2014, primarily reflecting higher net revenues in Institutional
Client Services and, to a lesser extent, significantly higher net
revenues in Investing & Lending. These increases were
partially offset by lower net revenues in Investment Banking
and Investment Management.
Administrative expenses were $4.08 billion for 2014, 2% lower
than 2014, due to lower direct costs of employment. This was
partially offset by an increase in non-compensation expenses.
See “Results of Operations” below for information about the
company’s net revenues, administrative expenses and segment
reporting.
Capital Ratios
The company continues to maintain strong capital ratios. As of
December 2015, the company’s Common Equity Tier 1 ratio
was 12.9% (under CRD IV as defined in “Equity Capital
Management and Regulatory Capital – Regulatory Capital”).
Liquidity The company continues to maintain strong liquidity. As of
December 2015, the company’s global core liquid assets were
$59.42 billion. See “Risk Management – Liquidity Risk
Management” for further information about the company’s
global core liquid assets.
Balance Sheet
The balance sheet is set out on page 54 of this annual report. In
the subsequent paragraphs, total assets is defined as the sum of
“Fixed assets”, “Current assets” and the company’s “Pension
surplus”. Total liabilities is defined as the sum of “Creditors:
amounts falling due within one year”, “Creditors: amounts
falling due after more than one year” and “Provisions for
liabilities”.
As of December 2015, total assets were $850.49 billion, a
decrease of $117.19 billion from December 2014. This
decrease reflected a reduction in financial instruments owned
of $77.69 billion and collateralised agreements of $39.81
billion. Financial instruments owned decreased primarily due
to a reduction in the fair value of derivative instruments.
Collateralised agreements decreased due to the company’s
initiative to reduce the size of its balance sheet (see “Balance
Sheet and Funding Sources – Funding Sources” for further
details), partially offset by an increase in client activity.

GOLDMAN SACHS INTERNATIONAL (UNLIMITED COMPANY)
Strategic Report
3
As of December 2015, total liabilities were $824.14 billion, a
decrease of $121.55 billion from December 2014. This
decrease reflected a reduction in financial instruments sold, but
not yet purchased of $85.76 billion, collateralised financings of
$21.76 billion and other creditors of $14.01 billion. Financial
instruments sold, but not yet purchased decreased primarily
due to a reduction in the fair value of derivative instruments.
Collateralised financings and other creditors decreased due to
the company’s initiative to reduce the size of its balance sheet
(see “Balance Sheet and Funding Sources – Funding Sources”
for further details), partially offset by an increase in client
activity.
U.S. GAAP Results The company also prepares results under United States
Generally Accepted Accounting Principles (U.S. GAAP),
which are included in the consolidated financial statements of
GS Group.
The company’s profit under U.S. GAAP differs from that
under U.K. GAAP primarily due to timing differences in the
recognition of certain revenues and expenses. Under U.S.
GAAP, the company’s profit for the financial year for 2015
was not significantly different from that reported under U.K.
GAAP.
The company’s total assets and total liabilities under U.S.
GAAP differ from those reported under U.K. GAAP primarily
due to the company presenting derivative balances as gross
under U.K. GAAP if they are not net settled in the normal
course of business, even where it has a legally enforceable
right to offset those balances. Under U.S. GAAP, as of
December 2015, total assets were $337.85 billion, a decrease
of $38.41 billion from December 2014, and total liabilities
were $311.41 billion, a decrease of $42.74 billion from
December 2014. This decrease in total assets and total
liabilities was primarily driven by the company’s initiative to
reduce the size of its balance sheet (see “Balance Sheet and
Funding Sources – Funding Sources” for further details).
Future Outlook The directors consider that the year-end financial position of
the company was satisfactory. No significant change in the
company’s principal business activities is currently expected.
Business Environment
Global
During 2015, real gross domestic product (GDP) growth
appeared stable but subdued in most advanced economies and
weaker in emerging market economies compared with 2014. In
developed markets, growth was higher in the Euro area and
Japan, while growth in the United Kingdom was lower and
growth in the United States remained stable. In emerging
markets, many economies suffered from lower commodity
prices, and Latin America was particularly weak with negative
aggregate growth in 2015. Monetary policy diverged in 2015,
as the U.S. Federal Reserve increased its target interest rate,
while policy remained accommodative in the Euro area and
Japan. In addition, oil prices declined by 30%, and there were
concerns about the debt situation in Greece earlier in the year
and China’s growth outlook later in the year. In investment
banking, industry-wide mergers and acquisitions activity
remained strong, while industry-wide activity in both debt and
equity underwriting declined compared with 2014.
Europe
In the Euro area, real GDP increased by 1.5% in 2015,
compared to an increase of 0.9% in 2014, as fixed investment,
consumer spending and government consumption all grew.
Measures of inflation remained subdued, prompting the
European Central Bank (ECB) to announce quantitative easing
in the form of an expanded asset purchase programme in
January 2015. The central bank continued its asset purchase
programme through the second and third quarters and
announced further easing measures in the fourth quarter,
cutting the deposit rate by 10 basis points to (0.30)% and
extending purchases to March 2017. The ECB maintained its
main refinancing operations rate at 0.05% during 2015. The
Euro depreciated by 10% against the U.S. dollar. In the United
Kingdom, real GDP increased by 2.2% in 2015, compared with
an increase of 2.9% in 2014. The Bank of England maintained
its official bank rate at 0.50% and the British pound
depreciated by 5% against the U.S. dollar. Yields on 10-year
government bonds in the region generally increased slightly
during the year. In equity markets, the DAX Index, CAC 40
Index and the Euro Stoxx 50 Index increased by 10%, 9%, and
4%, respectively, while the FTSE 100 Index decreased by 5%
during 2015.
GOLDMAN SACHS INTERNATIONAL (UNLIMITED COMPANY)
Strategic Report
4
Adoption of FRS 101
The Financial Reporting Council revised financial reporting
standards in the U.K. and Republic of Ireland for accounting
periods beginning on or after January 1, 2015. The revisions
fundamentally reform U.K. GAAP, replacing the previous
standards (previous U.K. GAAP). From January 1, 2015, the
company has transitioned from the previous U.K. GAAP to
FRS 101, which applies the recognition and measurement
requirements of International Financial Reporting Standards
(IFRS) as adopted by the European Union (EU). All periods
presented in this annual report are prepared in accordance with
FRS 101. The impact of adopting FRS 101 and consequential
changes in accounting policy have been described in Notes 2
and 4 to the financial statements and summarised below.
Collateralised agreements and collateralised financings
reduced by $15.72 billion as of December 2014 due to the
adoption of IAS 32 ‘Financial Instruments: Presentation’.
Debtors and other creditors reduced by $11.08 billion and
$9.57 billion, respectively, as of December 2014 and
financial instruments owned and financial instruments sold,
but not yet purchased increased by $1.52 billion and $9
million, respectively, as of December 2014 due to the
adoption of settlement date accounting for regular-way
purchases and sales of cash instruments, as permitted by
IAS 39 ‘Financial Instruments: Recognition and
Measurement’.
Creditors: amounts falling due within one year reduced by
$2.51 billion with a corresponding increase in creditors:
amounts falling due after more than one year as of
December 2014 due to the reclassification of collateralised
agreements with a contractual maturity of greater than one
year.
Market-making-related costs (i.e., brokerage, clearing,
exchange and distribution fees) have been reclassified from
net revenues to administrative expenses as permitted by
IAS 1 ‘Presentation of Financial Statements’ and IAS 18
‘Revenue’. This resulted in net revenues and administrative
expenses each increasing by $531 million for 2014, with no
change to the operating profit of the company.
Due to the adoption of IAS 19 ‘Employee Benefits
(amended 2011)’, profit for the financial year decreased by
$17 million for 2014. This was offset by a corresponding
increase in other comprehensive income.
Level 3 financial assets and financial liabilities decreased
by $7.36 billion as of December 2014 due to the adoption
of IFRS 13 ‘Fair Value Measurement’.
In addition, FRS 101 has resulted in the company providing
additional disclosures relating to financial assets and financial
liabilities due to the adoption of IFRS 7 ‘Financial Instruments:
Disclosures’ and IFRS 13 ‘Fair Value Measurement’.
Critical Accounting Policy
Fair Value
Fair Value Hierarchy. Financial instruments owned and
Financial instruments sold, but not yet purchased (i.e.,
inventory), as well as certain other financial assets and
financial liabilities, are reflected in the balance sheet at fair
value (i.e., marked-to-market), with related gains or losses
recognised in the profit and loss account. The use of fair value
to measure financial instruments is fundamental to the
company’s risk management practices and is the company’s
most critical accounting policy.
The fair value of a financial instrument is the amount that
would be received to sell an asset or paid to transfer a liability
in an orderly transaction between market participants at the
measurement date. Certain financial assets and financial
liabilities are measured as a portfolio (i.e., based on its net
exposure to market and/or credit risks). In determining fair
value, the hierarchy under U.K. GAAP gives (i) the highest
priority to unadjusted quoted prices in active markets for
identical, unrestricted assets or liabilities (level 1 inputs), (ii)
the next priority to inputs other than level 1 inputs that are
observable, either directly or indirectly (level 2 inputs), and
(iii) the lowest priority to inputs that cannot be observed in
market activity (level 3 inputs). Assets and liabilities are
classified in their entirety based on the lowest level of input
that is significant to their fair value measurement.
The fair values for substantially all of the company’s financial
assets and financial liabilities that are fair valued on a recurring
basis are based on observable prices and inputs and are
classified in levels 1 and 2 of the fair value hierarchy. Certain
level 2 and level 3 financial assets and financial liabilities may
require appropriate valuation adjustments that a market
participant would require to arrive at fair value for factors such
as counterparty and GS Group’s credit quality, funding risk,
transfer restrictions, liquidity and bid/offer spreads.
Instruments categorised within level 3 of the fair value
hierarchy are those which require one or more significant
inputs that are not observable. Total level 3 financial assets
were $6.04 billion and $7.79 billion as of December 2015 and
December 2014, respectively. See Note 27 to the financial
statements for further information about level 3 financial
assets, including changes in level 3 financial assets and related
fair value measurement. Absent evidence to the contrary,
instruments classified within level 3 of the fair value hierarchy
are initially valued at transaction price, which is considered to
be the best initial estimate of fair value. Subsequent to the
transaction date, other methodologies are used to determine
fair value, which vary based on the type of instrument.
Estimating the fair value of level 3 financial instruments
requires judgements to be made.

GOLDMAN SACHS INTERNATIONAL (UNLIMITED COMPANY)
Strategic Report
5
These judgements include:
Determining the appropriate valuation methodology and/or
model for each type of level 3 financial instrument;
Determining model inputs based on an evaluation of all
relevant empirical market data, including prices evidenced
by market transactions, interest rates, credit spreads,
volatilities and correlations; and
Determining appropriate valuation adjustments, including
those related to illiquidity or counterparty credit quality.
Regardless of the methodology, valuation inputs and
assumptions are only changed when corroborated by
substantive evidence.
Controls Over Valuation of Financial Instruments.
Market makers and investment professionals in the company’s
revenue-producing units are responsible for pricing the
company’s financial instruments. The company’s control
infrastructure is independent of the revenue-producing units
and is fundamental to ensuring that all of the company’s
financial instruments are appropriately valued at market-
clearing levels. In the event that there is a difference of opinion
in situations where estimating the fair value of financial
instruments requires judgement (e.g., calibration to market
comparables or trade comparison, as described below), the
final valuation decision is made by senior managers in control
and support functions. This independent price verification is
critical to ensuring that the company’s financial instruments
are properly valued.
Price Verification. All financial instruments at fair value in
levels 1, 2 and 3 of the fair value hierarchy are subject to the
company’s independent price verification process. The
objective of price verification is to have an informed and
independent opinion with regard to the valuation of financial
instruments under review. Instruments that have one or more
significant inputs which cannot be corroborated by external
market data are classified within level 3 of the fair value
hierarchy. Price verification strategies utilised by independent
control and support functions include:
Trade Comparison. Analysis of trade data (both internal
and external where available) is used to determine the most
relevant pricing inputs and valuations.
External Price Comparison. Valuations and prices are
compared to pricing data obtained from third parties (e.g.,
brokers or dealers, Markit, Bloomberg). Data obtained from
various sources is compared to ensure consistency and
validity. When broker or dealer quotations or third-party
pricing vendors are used for valuation or price verification,
greater priority is generally given to executable quotations.
Calibration to Market Comparables. Market-based
transactions are used to corroborate the valuation of
positions with similar characteristics, risks and
components.
Relative Value Analyses. Market-based transactions are
analysed to determine the similarity, measured in terms of
risk, liquidity and return, of one instrument relative to
another or, for a given instrument, of one maturity relative
to another.
Collateral Analyses. Margin calls on derivatives are
analysed to determine implied values which are used to
corroborate valuations.
Execution of Trades. Where appropriate, trading desks
are instructed to execute trades in order to provide evidence
of market-clearing levels.
Backtesting. Valuations are corroborated by comparison
to values realised upon sales.
See Note 27 to the financial statements for further information
about fair value measurement.
Review of Net Revenues. Independent control and support
functions ensure adherence to the company’s pricing policy
through a combination of daily procedures, including the
explanation and attribution of net revenues based on the
underlying factors. Through this process the company
independently validates net revenues, identifies and resolves
potential fair value or trade booking issues on a timely basis
and seeks to ensure that risks are being properly categorised
and quantified.
Review of Valuation Models. GS Group’s independent
model risk management group (Model Risk Management),
consisting of quantitative professionals who are separate from
model developers, performs an independent model review and
validation process of GS Group’s valuation models. New or
changed models are reviewed and approved prior to being put
into use. Models are evaluated and re-approved annually to
assess the impact of any changes in the product or market and
any market developments in pricing theories. See “Risk
Management – Model Risk Management” for further
information about the review and validation of valuation
models.

GOLDMAN SACHS INTERNATIONAL (UNLIMITED COMPANY)
Strategic Report
6
Results of Operations
The composition of the company’s net revenues has varied
over time as financial markets and the scope of its operations
have changed. The composition of net revenues can also vary
over the shorter term due to fluctuations in economic and
market conditions. See “Principal Risks and Uncertainties” for
further information about the impact of economic and market
conditions on the company’s results of operations. In addition
to transactions entered into with third parties, the company also
enters into transactions with affiliates in the normal course of
business as part of its market-making activities and general
operations.
Net Revenues
Net revenues include the net profit arising from transactions,
with both third parties and affiliates, in securities, foreign
exchange and other financial instruments, and fees and
commissions. This is inclusive of associated interest and
dividends.
See “Segment Reporting” below for further details.
Administrative Expenses
Administrative expenses are primarily influenced by
compensation (including the impact of the Group Inc. share
price on share-based compensation), headcount and levels of
business activity. Direct costs of employment include salaries,
allowances, discretionary compensation, amortisation and
mark-to-market of share-based compensation and other items
such as benefits. Discretionary compensation is significantly
impacted by, among other factors, the level of net revenues,
overall financial performance, prevailing labour markets,
business mix, the structure of share-based compensation
programmes and the external environment.
The table below presents the company’s administrative
expenses and average staff (which includes employees,
including directors, consultants and temporary staff).
Year Ended December
$ in millions 2015 2014
Direct costs of employment1 $2,834 $3,042
Brokerage, clearing, exchange and distribution fees 550 531
Market development 95 100
Communications and technology 88 85
Depreciation of tangible fixed assets 4 4
Occupancy 173 180
Professional fees 147 120
Other expenses 186 93
Total non-compensation expenses 1,243 1,113
Total administrative expenses $4,077 $4,155
Average staff 6,149 5,582
1. Includes a charge of $6 million for 2015 and a charge of $83 million for 2014,
relating to the mark-to-market of share-based compensation.
2015 versus 2014. Administrative expenses were $4.08
billion for 2015, 2% lower than 2014. Direct costs of
employment were $2.83 billion for 2015, 7% lower than 2014.
Excluding the mark-to-market impact of share-based
compensation for both years, direct costs of employment were
$2.83 billion for 2015, 4% lower than 2014. The average
number of the company’s staff was 6,149 for 2015, 10% higher
than 2014, primarily due to activity levels in certain businesses
and continued investment in the implementation of regulatory
reform.
Non-compensation expenses were $1.24 billion for 2015, 12%
higher than 2014.
Interest Payable and Similar Charges
Interest payable and similar charges comprises interest on
long-term subordinated loans from parent and group
undertakings.
2015 versus 2014. Interest payable and similar charges was
$285 million for 2015, 28% higher than 2014, reflecting an
increase in the average long-term subordinated loans balance.
GOLDMAN SACHS INTERNATIONAL (UNLIMITED COMPANY)
Strategic Report
7
Tax on Profit on Ordinary Activities
The effective tax rate for 2015 was 13.3%, down from 21.9%
for 2014 primarily due to the company recognising a one-time
benefit of $155 million on the revaluation of its deferred tax
asset as a result of the Finance (No. 2) Act 2015 being enacted
during the fourth quarter of 2015. The effective tax rate
excluding this one-time benefit was 19.1% for 2015. The
Finance (No. 2) Act 2015 introduced: (i) an 8 percentage point
surcharge on banking profits effective in 2016; (ii) a 1
percentage point reduction in corporate tax rates effective in
2017; and (iii) a further 1 percentage point reduction in
corporate tax rates effective in 2020. Beginning in 2016, the 8
percentage point surcharge on banking profits is expected to
increase the company’s effective tax rate.
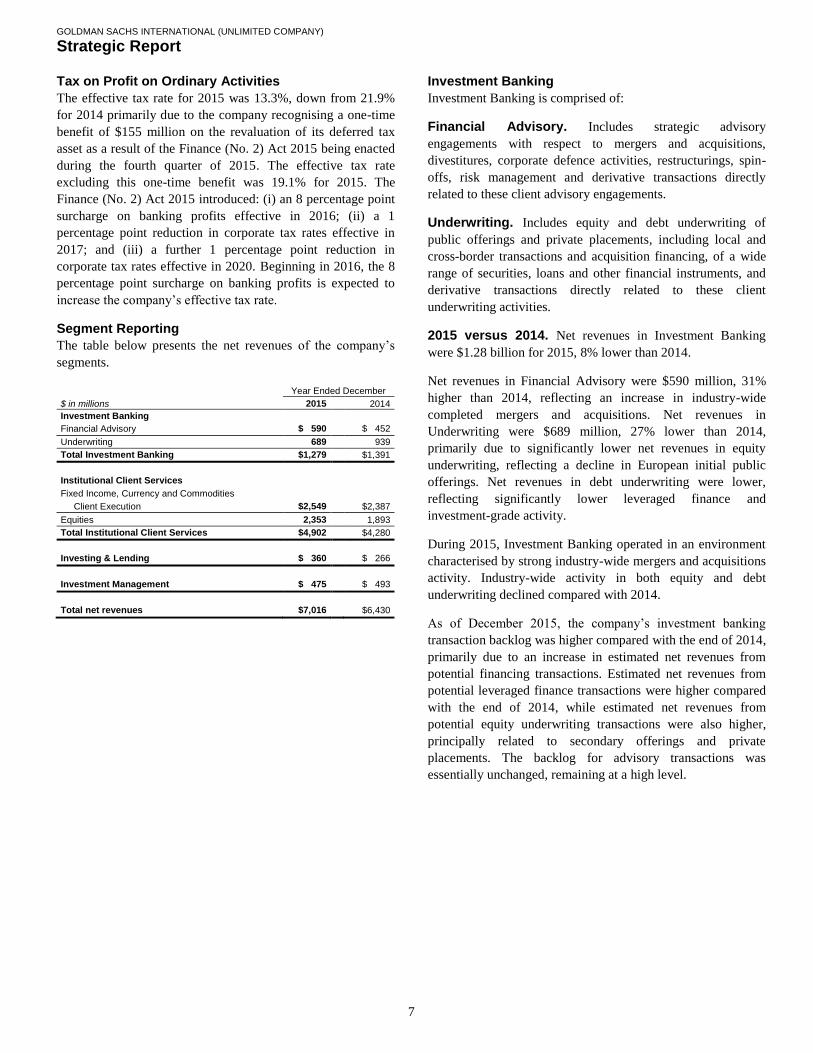
Segment Reporting
The table below presents the net revenues of the company’s
segments.
Year Ended December
$ in millions 2015 2014
Investment Banking
Financial Advisory $0,590 $0,452
Underwriting 689 939
Total Investment Banking $1,279 $1,391
Institutional Client Services
Fixed Income, Currency and Commodities
Client Execution $2,549 $2,387
Equities 2,353 1,893
Total Institutional Client Services $4,902 $4,280
Investing & Lending $0,360 $0,266
Investment Management $0,475 $0,493
Total net revenues $7,016 $6,430
Investment Banking
Investment Banking is comprised of:
Financial Advisory. Includes strategic advisory
engagements with respect to mergers and acquisitions,
divestitures, corporate defence activities, restructurings, spin-
offs, risk management and derivative transactions directly
related to these client advisory engagements.
Underwriting. Includes equity and debt underwriting of
public offerings and private placements, including local and
cross-border transactions and acquisition financing, of a wide
range of securities, loans and other financial instruments, and
derivative transactions directly related to these client
underwriting activities.
2015 versus 2014. Net revenues in Investment Banking
were $1.28 billion for 2015, 8% lower than 2014.
Net revenues in Financial Advisory were $590 million, 31%
higher than 2014, reflecting an increase in industry-wide
completed mergers and acquisitions. Net revenues in
Underwriting were $689 million, 27% lower than 2014,
primarily due to significantly lower net revenues in equity
underwriting, reflecting a decline in European initial public
offerings. Net revenues in debt underwriting were lower,
reflecting significantly lower leveraged finance and
investment-grade activity.
During 2015, Investment Banking operated in an environment
characterised by strong industry-wide mergers and acquisitions
activity. Industry-wide activity in both equity and debt
underwriting declined compared with 2014.
As of December 2015, the company’s investment banking
transaction backlog was higher compared with the end of 2014,
primarily due to an increase in estimated net revenues from
potential financing transactions. Estimated net revenues from
potential leveraged finance transactions were higher compared
with the end of 2014, while estimated net revenues from
potential equity underwriting transactions were also higher,
principally related to secondary offerings and private
placements. The backlog for advisory transactions was
essentially unchanged, remaining at a high level.
GOLDMAN SACHS INTERNATIONAL (UNLIMITED COMPANY)
Strategic Report
8
The company’s investment banking transaction backlog
represents an estimate of future net revenues from investment
banking transactions where the company believes that future
revenue realisation is more likely than not. The company
believes changes in its investment banking transaction backlog
may be a useful indicator of client activity levels which, over
the long term, impact net revenues. However, the time frame
for completion and corresponding revenue recognition of
transactions in the backlog varies based on the nature of the
engagement, as certain transactions may remain in the backlog
for longer periods of time and others may enter and leave
within the same reporting period. In addition, the company’s
transaction backlog is subject to certain limitations, such as
assumptions about the likelihood that individual client
transactions will occur in the future. Transactions may be
cancelled or modified, and transactions not included in the
estimate may also occur.
Institutional Client Services
Institutional Client Services generates revenues in four ways:
In large, highly liquid markets, the company executes a
high volume of transactions for clients;
In less liquid markets, the company executes transactions
for clients for spreads and fees that are generally somewhat
larger than those charged in more liquid markets;
The company also structures and executes transactions
involving customised or tailor-made products that address
clients’ risk exposures, investment objectives or other
complex needs; and
The company provides financing to its clients for their
securities trading activities, as well as securities lending
and other prime brokerage services.
Institutional Client Services is comprised of:
Fixed Income, Currency and Commodities Client
Execution. Includes client execution activities related to
making markets in interest rate products, credit products,
mortgages, currencies and commodities.
Interest rate products. Government bonds, money
market instruments, treasury bills, securities sold under
agreements to repurchase (repurchase agreements) and
other highly liquid securities and instruments, as well as
interest rate swaps, options and other derivatives.
Credit products. Investment-grade corporate securities,
high-yield securities, credit derivatives, bank and bridge
loans, municipal securities, emerging market and distressed
debt, and trade claims.
Mortgages. Commercial mortgage-related securities,
loans and derivatives, residential mortgage-related
securities, loans and derivatives, and other asset-backed
securities, loans and derivatives.
Currencies. Most currencies, including growth-market
currencies.
Commodities. Crude oil and petroleum products, natural
gas, base, precious and other metals, electricity, coal,
agricultural and other commodity products.
Equities. Includes client execution activities related to
making markets in equity products and commissions and fees
from executing and clearing institutional client transactions on
major stock, options and futures exchanges worldwide, as well
as over-the-counter (OTC) transactions. Equities also includes
the securities services business, which provides financing,
securities lending and other prime brokerage services to
institutional clients, including hedge funds, mutual funds,
pension funds and foundations, and generates revenues
primarily in the form of interest rate spreads or fees.
2015 versus 2014. Net revenues in Institutional Client
Services were $4.90 billion for 2015, 15% higher than 2014.
Net revenues in Fixed Income, Currency and Commodities
Client Execution were $2.55 billion for 2015, 7% higher than
2014, due to significantly higher net revenues in interest rate
products and currencies reflecting higher volatility levels
which contributed to higher client activity levels. These
increases were partially offset by significantly lower net
revenues in mortgages, credit products and commodities. The
decreases in mortgages and credit products reflected
challenging market-making conditions and generally low levels
of activity during 2015. The decline in commodities primarily
reflected less favourable market-making conditions compared
with 2014, which included a strong first quarter of 2014.

GOLDMAN SACHS INTERNATIONAL (UNLIMITED COMPANY)
Strategic Report
9
Net revenues in Equities were $2.35 billion for 2015, 24%
higher than 2014, due to significantly higher net revenues in
equities client execution, reflecting significantly higher results
in both derivatives and cash products.
During 2015, the operating environment for Institutional Client
Services was positively impacted by diverging central bank
monetary policies in the United States and the Euro area in the
first quarter, as increased volatility levels contributed to strong
client activity levels in currencies, interest rate products and
equity products, and market-making conditions improved.
However, during the remainder of the year, concerns about
global growth and uncertainty about the U.S. Federal Reserve’s
interest rate policy, along with lower global equity prices,
widening high-yield credit spreads and declining commodity
prices, contributed to lower levels of client activity,
particularly in mortgages and credit, and more difficult market-
making conditions.
Investing & Lending
Investing & Lending includes direct investments made by the
company, which are typically longer-term in nature, and net
revenues associated with providing investing services to other
GS Group entities.
2015 versus 2014. Net revenues in Investing & Lending
were $360 million for 2015, 35% higher than 2014, primarily
due to an increase in net revenues from providing investing
services to other GS Group entities.
Investment Management
Investment Management provides investment management and
wealth advisory services, including portfolio management and
financial counselling, and brokerage and other transaction
services to high-net-worth individuals and families. Investment
Management also includes net revenues associated with
providing investing services to funds managed by GS Group.
2015 versus 2014. Net revenues in Investment Management
were $475 million for 2015, 4% lower than 2014, reflecting
lower management and other fees, primarily due to a decrease
in net revenues from providing investing services to funds
managed by GS Group.
Geographic Data
See Note 5 to the financial statements for a summary of the
company’s net revenues by geographic region.
Balance Sheet and Funding Sources
Balance Sheet Management
One of the most important risk management disciplines for the
company is its ability to manage the size and composition of its
balance sheet. GSI leverages the firmwide balance sheet
management process performed at the GS Group level to
manage these factors. While the asset base of Group Inc. and
its subsidiaries changes due to client activity, market
fluctuations and business opportunities, the size and
composition of the company’s balance sheet reflects (i) the
overall risk tolerance of GS Group, (ii) the ability to access
stable funding sources and (iii) the amount of equity capital
held by GS Group. See “Equity Capital Management and
Regulatory Capital – Equity Capital Management” for
information about the company’s equity management process.
In order to ensure appropriate risk management, GSI seeks to
maintain a liquid balance sheet and leverages GS Group’s
processes to dynamically manage its assets and liabilities
which include (i) quarterly planning, (ii) business-specific
limits, (iii) monitoring of key metrics and (iv) scenario
analyses.
Quarterly Planning. GS Group prepares a quarterly balance
sheet plan that combines projected total assets and composition
of assets with expected funding sources for the upcoming
quarter. The objectives of this quarterly planning process are:
To develop near-term balance sheet projections, taking into
account the general state of the financial markets and
expected business activity levels, as well as current
regulatory requirements;
To determine the target amount, tenor and type of funding
to raise, based on projected assets and forecasted
maturities; and
To allow business risk managers and managers from
independent control and support functions to objectively
evaluate balance sheet limit requests from business
managers in the context of overall balance sheet
constraints, including GS Group’s liability profile and
equity capital levels, and key metrics. Limits are typically
set at levels that will be periodically exceeded, rather than
at levels which reflect maximum risk appetite.
To prepare GS Group’s quarterly balance sheet plan, business
risk managers and managers from its independent control and
support functions meet with business managers to review
current and prior period information and discuss expectations
for the upcoming quarter. The specific information reviewed
includes asset and liability size and composition, aged
inventory, limit utilisation, risk and performance measures, and
capital usage.
GOLDMAN SACHS INTERNATIONAL (UNLIMITED COMPANY)
Strategic Report
10
The consolidated quarterly plan, including balance sheet plans
by business, funding projections, and projected key metrics, is
reviewed and approved by GS Group’s Firmwide Finance
Committee, a sub-committee of GS Group’s Firmwide Risk
Committee. See “Risk Management – Overview and Structure
of Risk Management” for an overview of GS Group’s and the
company’s risk management structure.
Business-Specific Limits. GS Group’s Firmwide Finance
Committee sets asset and liability limits for each business and
aged inventory limits for certain financial instruments as a
disincentive to hold inventory over longer periods of time.
These limits are set at levels which are close to actual
operating levels in order to ensure prompt escalation and
discussion among business managers and managers in
independent control and support functions on a routine basis.
GS Group’s Firmwide Finance Committee reviews and
approves balance sheet limits on a quarterly basis and may also
approve changes in limits on an ad hoc basis in response to
changing business needs or market conditions. Requests for
changes in limits are evaluated after giving consideration to
their impact on key GS Group metrics. Compliance with limits
is monitored on a daily basis by business risk managers, as
well as managers in independent control and support functions.
Monitoring of Key Metrics. Key balance sheet metrics are
monitored daily both by business and on a GS Group basis,
including asset and liability size and composition, aged
inventory, limit utilisation and risk measures. Assets are
allocated to businesses and movements resulting from new
business activity as well as market fluctuations are reviewed
and analysed.
Scenario Analyses. GS Group conducts scenario analyses
for Group Inc. and its subsidiaries to determine how it would
manage the size and composition of the balance sheet. These
scenarios cover short-term and long-term time horizons using
various macroeconomic and GS Group-specific assumptions,
based on a range of economic scenarios. These analyses are
used to assist in developing longer-term balance sheet
management strategy, including the level and composition of
assets, funding and equity capital. Additionally, these analyses
help in the development of approaches for maintaining
appropriate funding, liquidity and capital across a variety of
situations, including a severely stressed environment.
Liquidity and Cash
The company maintains liquidity to meet a broad range of
potential cash outflows and collateral needs in a stressed
environment, referred to as Global Core Liquid Assets
(GCLA). See “Risk Management – Liquidity Risk
Management – Global Core Liquid Assets” for details about
the composition and sizing of the company’s GCLA.
Funding Sources
The company’s primary sources of funding are secured
financings, intercompany unsecured borrowings and external
unsecured borrowings.
GSI raises this funding through a number of different products,
including:
Collateralised financings, which are repurchase agreements
and securities loaned;
Intercompany unsecured loans from Group Inc. and other
affiliates; and
Debt securities issued to both external counterparties and
affiliates, which includes securitised derivative products
(including notes, certificates and warrants) and vanilla debt,
as well as transfers of assets accounted for as financings
rather than sales.
GSI generally distributes funding products through its own
sales force and third-party distributors to a large, diverse
creditor base in a variety of global markets. The company
believes that its relationships with external creditors are critical
to its liquidity. These creditors include banks, securities
lenders, pension funds, insurance companies, mutual funds and
individuals. GSI has imposed various internal guidelines to
monitor creditor concentration across its external funding
programmes.
During the year, the company undertook an initiative to reduce
the size of its balance sheet in response to regulatory
developments and to improve the overall efficiency of its
balance sheet. This primarily resulted in a reduction in
collateralised agreements and collateralised financings with
affiliates, and a reduction in intercompany unsecured
borrowings. These decreases in collateralised agreements and
collateralised financings with affiliates were partially offset by
an increase in client activity.
GOLDMAN SACHS INTERNATIONAL (UNLIMITED COMPANY)
Strategic Report
11
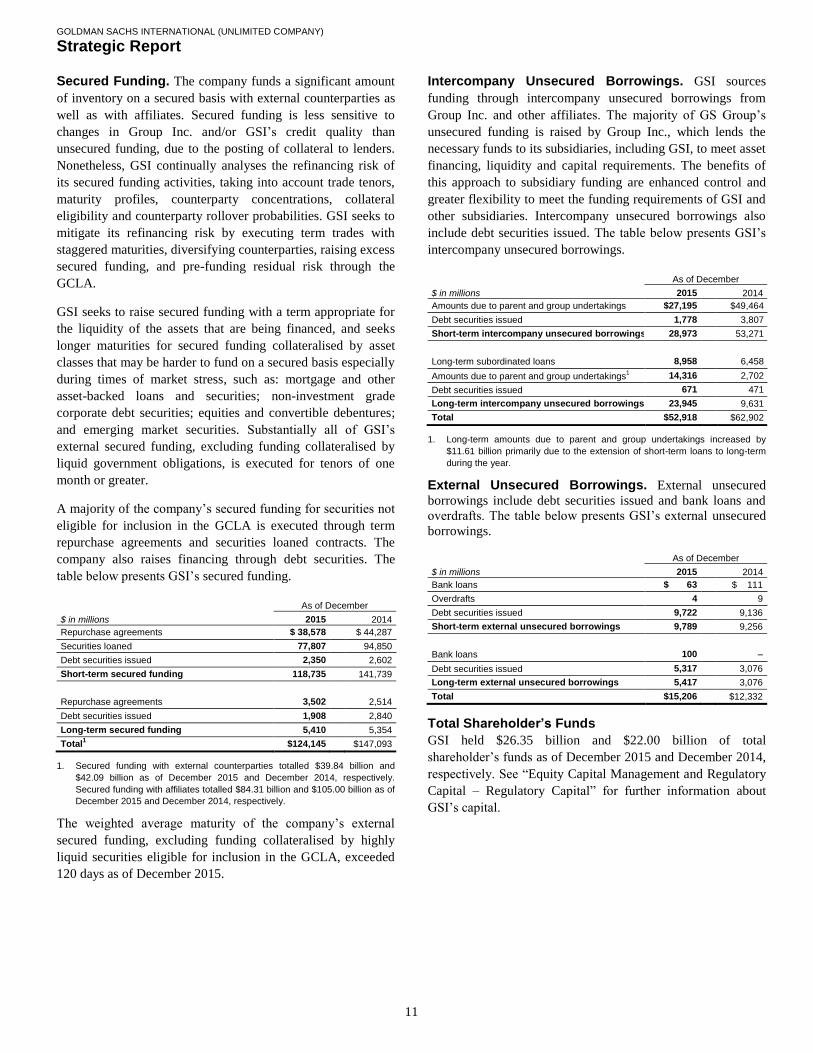
Secured Funding. The company funds a significant amount
of inventory on a secured basis with external counterparties as
well as with affiliates. Secured funding is less sensitive to
changes in Group Inc. and/or GSI’s credit quality than
unsecured funding, due to the posting of collateral to lenders.
Nonetheless, GSI continually analyses the refinancing risk of
its secured funding activities, taking into account trade tenors,
maturity profiles, counterparty concentrations, collateral
eligibility and counterparty rollover probabilities. GSI seeks to
mitigate its refinancing risk by executing term trades with
staggered maturities, diversifying counterparties, raising excess
secured funding, and pre-funding residual risk through the
GCLA.
GSI seeks to raise secured funding with a term appropriate for
the liquidity of the assets that are being financed, and seeks
longer maturities for secured funding collateralised by asset
classes that may be harder to fund on a secured basis especially
during times of market stress, such as: mortgage and other
asset-backed loans and securities; non-investment grade
corporate debt securities; equities and convertible debentures;
and emerging market securities. Substantially all of GSI’s
external secured funding, excluding funding collateralised by
liquid government obligations, is executed for tenors of one
month or greater.
A majority of the company’s secured funding for securities not
eligible for inclusion in the GCLA is executed through term
repurchase agreements and securities loaned contracts. The
company also raises financing through debt securities. The
table below presents GSI’s secured funding.
As of December
$ in millions 2015 2014
Repurchase agreements $ 38,578 $ 44,287
Securities loaned 77,807 94,850
Debt securities issued 2,350 2,602
Short-term secured funding 118,735 141,739
Repurchase agreements 3,502 2,514
Debt securities issued 1,908 2,840
Long-term secured funding 5,410 5,354
Total1 $124,145 $147,093
1. Secured funding with external counterparties totalled $39.84 billion and
$42.09 billion as of December 2015 and December 2014, respectively.
Secured funding with affiliates totalled $84.31 billion and $105.00 billion as of
December 2015 and December 2014, respectively.
The weighted average maturity of the company’s external
secured funding, excluding funding collateralised by highly
liquid securities eligible for inclusion in the GCLA, exceeded
120 days as of December 2015.
Intercompany Unsecured Borrowings. GSI sources
funding through intercompany unsecured borrowings from
Group Inc. and other affiliates. The majority of GS Group’s
unsecured funding is raised by Group Inc., which lends the
necessary funds to its subsidiaries, including GSI, to meet asset
financing, liquidity and capital requirements. The benefits of
this approach to subsidiary funding are enhanced control and
greater flexibility to meet the funding requirements of GSI and
other subsidiaries. Intercompany unsecured borrowings also
include debt securities issued. The table below presents GSI’s
intercompany unsecured borrowings.
As of December
$ in millions 2015 2014
Amounts due to parent and group undertakings $27,195 $49,464
Debt securities issued 1,778 3,807
Short-term intercompany unsecured borrowings 28,973 53,271
Long-term subordinated loans 8,958 6,458
Amounts due to parent and group undertakings1 14,316 2,702
Debt securities issued 671 471
Long-term intercompany unsecured borrowings 23,945 9,631
Total $52,918 $62,902
1. Long-term amounts due to parent and group undertakings increased by
$11.61 billion primarily due to the extension of short-term loans to long-term
during the year.
External Unsecured Borrowings. External unsecured
borrowings include debt securities issued and bank loans and
overdrafts. The table below presents GSI’s external unsecured
borrowings.
As of December
$ in millions 2015 2014
Bank loans $15,263 $ 111
Overdrafts 4 9
Debt securities issued 9,722 9,136
Short-term external unsecured borrowings 9,789 9,256
Bank loans 100 –
Debt securities issued 5,317 3,076
Long-term external unsecured borrowings 5,417 3,076
Total $15,206 $12,332
Total Shareholder’s Funds
GSI held $26.35 billion and $22.00 billion of total
shareholder’s funds as of December 2015 and December 2014,
respectively. See “Equity Capital Management and Regulatory
Capital – Regulatory Capital” for further information about
GSI’s capital.

GOLDMAN SACHS INTERNATIONAL (UNLIMITED COMPANY)
Strategic Report
12
Equity Capital Management and Regulatory
Capital
Capital adequacy is of critical importance to the company. The
company has in place a comprehensive capital management
policy that provides a framework, defines objectives and
establishes guidelines to assist the company in maintaining the
appropriate level and composition of capital in both business-
as-usual and stressed conditions.
Equity Capital Management (Audited)
The company determines the appropriate level and
composition of its equity capital by considering multiple
factors including the company’s current and future regulatory
capital requirements, the results of the company’s capital
planning and stress testing process and other factors such as
rating agency guidelines, the business environment and
conditions in the financial markets.
The company’s capital planning and stress testing process
incorporates internally designed stress tests and those required
under the PRA’s Internal Capital Adequacy Assessment
Process (ICAAP). It is also designed to identify and measure
material risks associated with business activities, including
market risk, credit risk, operational risk and other risks. The
company’s goal is to hold sufficient capital to ensure that it
remains adequately capitalised after experiencing a severe
stress event. The company’s assessment of capital adequacy is
viewed in tandem with its assessment of liquidity adequacy
and is integrated into its overall risk management structure,
governance and policy framework.
In addition, as part of the company’s comprehensive capital
management policy, a contingency capital plan is maintained
that provides a framework for analysing and responding to a
perceived or actual capital deficiency, including, but not
limited to, identification of drivers of a capital deficiency, as
well as mitigants and potential actions. It outlines the
appropriate communication procedures to follow during a
crisis period, including internal dissemination of information as
well as ensuring timely communication with external
stakeholders.
Resolution and Recovery Planning
GS Group is required by the Federal Reserve Board and the
Federal Deposit Insurance Corporation to submit an annual
plan for its rapid and orderly resolution in the event of material
financial distress or failure (resolution plan). GSI is considered
to be a principal material operating entity for the purposes of
the annual resolution plan prepared by GS Group. GS Group
submitted its 2015 resolution plan on June 30, 2015 and GSI
submitted the 2015 resolution plan to the PRA in July 2015.
GS Group is also required by the Federal Reserve Board to
submit and has submitted, on an annual basis, a global
recovery plan that outlines the steps that management could
take to reduce risk, maintain sufficient liquidity, and conserve
capital in times of prolonged stress. The global recovery plan
outlines actions that could be taken by the company’s
management as part of wider actions taken by GS Group.
Regulatory Capital (Audited)
The company is subject to the revised capital framework for
EU-regulated financial institutions (the fourth EU Capital
Requirements Directive and EU Capital Requirements
Regulation, collectively known as “CRD IV”). These capital
regulations are largely based on the Basel Committee’s final
capital framework for strengthening international capital
standards (Basel III).
The risk-based capital requirements are expressed as capital
ratios that compare measures of regulatory capital to risk-
weighted assets (RWAs). The Common Equity Tier 1 (CET1)
ratio is defined as CET1 divided by RWAs. The Tier 1 capital
ratio is defined as Tier 1 capital divided by RWAs. The total
capital ratio is defined as total capital divided by RWAs.
Under CRD IV, the minimum CET1, Tier 1 capital and Total
capital ratios (collectively the Pillar 1 capital requirements)
will be supplemented by:
A capital conservation buffer, consisting entirely of capital
that qualifies as CET1, that phases in beginning on January
1, 2016, in increments of 0.625% per year until it reaches
2.5% of RWAs on January 1, 2019.
A countercyclical capital buffer of up to 2.5% (and also
consisting entirely of CET1) in order to counteract
excessive credit growth. The buffer only applies to the
company’s exposures to certain types of counterparties
based in jurisdictions which have announced a
countercyclical buffer. Since these exposures are not
currently material, the buffer adds less than 0.01% to the
capital ratio and has an immaterial impact on the capital of
the company. The countercyclical capital buffer applicable
to the company could change in the future and, as a result,
the company’s minimum ratios could increase.
Individual capital guidance under Pillar 2A (an additional
amount to cover risks not adequately captured in Pillar 1).
The PRA performs a periodic supervisory review of the
company’s ICAAP, which leads to a final determination by
the PRA of individual capital guidance under Pillar 2A.
This is a point in time assessment of the minimum amount
of capital the PRA considers that a bank should hold.
GOLDMAN SACHS INTERNATIONAL (UNLIMITED COMPANY)
Strategic Report
13
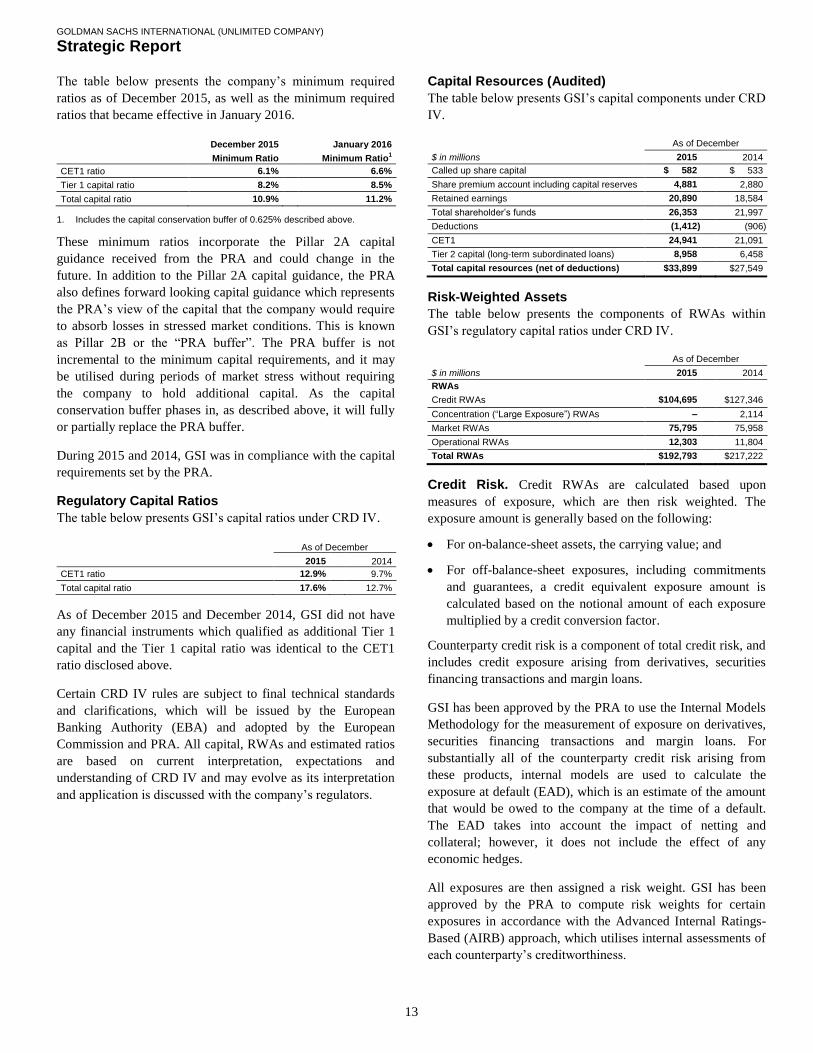
The table below presents the company’s minimum required
ratios as of December 2015, as well as the minimum required
ratios that became effective in January 2016.
December 2015 January 2016
Minimum Ratio Minimum Ratio1
CET1 ratio 6.1% 6.6%
Tier 1 capital ratio 8.2% 8.5%
Total capital ratio 10.9% 11.2%
1. Includes the capital conservation buffer of 0.625% described above.
These minimum ratios incorporate the Pillar 2A capital
guidance received from the PRA and could change in the
future. In addition to the Pillar 2A capital guidance, the PRA
also defines forward looking capital guidance which represents
the PRA’s view of the capital that the company would require
to absorb losses in stressed market conditions. This is known
as Pillar 2B or the “PRA buffer”. The PRA buffer is not
incremental to the minimum capital requirements, and it may
be utilised during periods of market stress without requiring
the company to hold additional capital. As the capital
conservation buffer phases in, as described above, it will fully
or partially replace the PRA buffer.
During 2015 and 2014, GSI was in compliance with the capital
requirements set by the PRA.
Regulatory Capital Ratios
The table below presents GSI’s capital ratios under CRD IV.
As of December
2015 2014
CET1 ratio 12.9% 9.7%
Total capital ratio 17.6% 12.7%
As of December 2015 and December 2014, GSI did not have
any financial instruments which qualified as additional Tier 1
capital and the Tier 1 capital ratio was identical to the CET1
ratio disclosed above.
Certain CRD IV rules are subject to final technical standards
and clarifications, which will be issued by the European
Banking Authority (EBA) and adopted by the European
Commission and PRA. All capital, RWAs and estimated ratios
are based on current interpretation, expectations and
understanding of CRD IV and may evolve as its interpretation
and application is discussed with the company’s regulators.
Capital Resources (Audited)
The table below presents GSI’s capital components under CRD
IV.
As of December
$ in millions 2015 2014
Called up share capital $ 582 $ 533
Share premium account including capital reserves 4,881 2,880
Retained earnings 20,890 18,584
Total shareholder’s funds 26,353 21,997
Deductions (1,412) (906)
CET1 24,941 21,091
Tier 2 capital (long-term subordinated loans) 8,958 6,458
Total capital resources (net of deductions) $33,899 $27,549
Risk-Weighted Assets
The table below presents the components of RWAs within
GSI’s regulatory capital ratios under CRD IV.
As of December
$ in millions 2015 2014
RWAs
Credit RWAs $104,695 $127,346
Concentration (“Large Exposure”) RWAs – 2,114
Market RWAs 75,795 75,958
Operational RWAs 12,303 11,804
Total RWAs $192,793 $217,222
Credit Risk. Credit RWAs are calculated based upon
measures of exposure, which are then risk weighted. The
exposure amount is generally based on the following:
For on-balance-sheet assets, the carrying value; and
For off-balance-sheet exposures, including commitments
and guarantees, a credit equivalent exposure amount is
calculated based on the notional amount of each exposure
multiplied by a credit conversion factor.
Counterparty credit risk is a component of total credit risk, and
includes credit exposure arising from derivatives, securities
financing transactions and margin loans.
GSI has been approved by the PRA to use the Internal Models
Methodology for the measurement of exposure on derivatives,
securities financing transactions and margin loans. For
substantially all of the counterparty credit risk arising from
these products, internal models are used to calculate the
exposure at default (EAD), which is an estimate of the amount
that would be owed to the company at the time of a default.
The EAD takes into account the impact of netting and
collateral; however, it does not include the effect of any
economic hedges.
All exposures are then assigned a risk weight. GSI has been
approved by the PRA to compute risk weights for certain
exposures in accordance with the Advanced Internal Ratings-
Based (AIRB) approach, which utilises internal assessments of
each counterparty’s creditworthiness.

GOLDMAN SACHS INTERNATIONAL (UNLIMITED COMPANY)
Strategic Report
14
RWAs are calculated by multiplying EAD by the
counterparty’s risk weight. Under the AIRB approach, a
counterparty’s risk weight is a function of its probability of
default (PD), loss given default (LGD) and the effective
maturity of the trade or portfolio of trades, where:
PD is an estimate of the probability that an obligor will
default over a one-year horizon – PD is derived from the
use of internally determined equivalents of external credit
assessment ratings; and
LGD is an estimate of the economic loss rate if a default
occurs during economic downturn conditions – LGD is
determined based on industry data.
Wrong-way risk arises from positive expected correlation
between EAD and PD to the same counterparty and the
company seeks to avoid or appropriately mitigate this risk
through collateral or other mitigants. Stress testing is utilised to
identify any wrong-way risk in existing portfolios and risk
mitigants and adjustments to capital may be employed to
reflect any existing wrong-way risk.
The table below presents information on the components of the
credit RWAs.
As of December
$ in millions 2015 2014
Credit RWAs
Derivatives $ 88,282 $105,071
Commitments, guarantees and loans 1,338 2,413
Securities financing transactions 4,735 8,211
Equity investments 1,515 2,481
Other 8,825 9,170
Total Credit RWAs $104,695 $127,346
Concentration Risk. Under CRD IV, institutions are
required to monitor and control their large exposures. The large
exposure framework is designed to limit the risk of over-
reliance on an individual counterparty or a group of connected
counterparties. There is a general limit applied to all of the
institution’s exposures to a single counterparty or groups of
connected counterparties, which is set at 25% of eligible
capital. The framework includes reporting requirements, hard
limits and additional concentration capital charges for trading
book large exposures. As of December 2015, the company had
no concentration risk capital requirements.
Market Risk. Trading book positions are subject to market
risk capital requirements which are based either on
predetermined levels set by regulators or on internal models.
The market risk regulatory capital rules require that a firm
obtains the prior written approval of its regulators before using
any internal model to calculate its risk-based capital
requirement.
RWAs for market risk are computed using the following
internal models: Value-at-Risk (VaR); Stressed VaR (SVaR);
Incremental Risk; and the Comprehensive Risk Measure (for
PRA purposes this is the All Price Risk Measure and is subject
to a floor). In addition, Standardised Rules, in accordance with
CRD IV, are used to compute RWAs for market risk for certain
securitised and non-securitised positions by applying risk-
weighting factors predetermined by regulators to positions
after applicable netting is performed. RWAs for market risk are
the sum of each of these measures multiplied by 12.5.
VaR is the potential loss in value of inventory positions, as
well as certain other financial assets and financial
liabilities, due to adverse market movements over a defined
time horizon with a specified confidence level. For both
risk management purposes and regulatory capital
calculations the company uses a single VaR model which
captures risks including those related to interest rates,
equity prices, currency rates and commodity prices.
However, VaR used for regulatory capital requirements
(regulatory VaR) differs from risk management VaR due to
different time horizons and confidence levels (10-day and
99% for regulatory VaR vs. one-day and 95% for risk
management VaR), as well as differences in the scope of
positions on which VaR is calculated.
SVaR is the potential loss in value of inventory positions
during a period of significant market stress.
Incremental Risk is the potential loss in value of non-
securitised inventory positions due to the default or credit
migration of issuers of financial instruments over a one-
year time horizon.
All Price Risk is the potential loss in value, due to price risk
and defaults, within the company’s credit correlation
trading positions.
The table below presents information on the components of the
market RWAs.
As of December
$ in millions 2015 2014
Market RWAs
VaR-based capital requirements $16,287 $15,236
Stressed VaR 13,259 13,625
Incremental Risk 8,119 7,675
All Price Risk Measure 2,725 4,350
Standardised Rules 20,747 19,858
Securitisation 14,658 15,214
Total Market RWAs $75,795 $75,958

GOLDMAN SACHS INTERNATIONAL (UNLIMITED COMPANY)
Strategic Report
15
Operational Risk. GSI’s capital requirements for operational
risk are currently calculated under the Standardised approach.
The Standardised approach requires companies to divide their
activities into eight defined business lines or categories. Each
business line is assigned a beta factor which is applied to the
three-year average revenues of that business line (with certain
prescribed exceptions, such as extraordinary income).
Expenses are not included in the calculation. The sum of the
individual business line requirements is multiplied by 12.5 to
derive the operational RWAs.
Leverage Ratio
CRD IV, as amended by the European Commission Delegated
Act (the Delegated Act), introduced a new leverage ratio,
which compares CRD IV’s definition of Tier 1 capital to a
measure of leverage exposure, defined as the sum of assets less
Tier 1 capital deductions plus certain off-balance-sheet
exposures, including a measure of derivatives exposures,
securities financing transactions and commitments. The
Delegated Act does not currently include a minimum leverage
ratio requirement; however, the Basel Committee has proposed
a minimum requirement of 3%. Any required minimum ratio is
expected to become effective for GSI on January 1, 2018. As
of December 2015, the company had a leverage ratio of 3.6%.
This leverage ratio is based on the company’s current
interpretation and understanding of this rule and may evolve as
its interpretation and application is discussed with GSI’s
regulators.
Regulatory Developments
GSI’s businesses are subject to significant and evolving
regulation. Reforms have been adopted or are being considered
by regulators and policy makers worldwide. The expectation is
that the principal areas of impact from regulatory reform for
GSI will be increased regulatory capital requirements and
increased regulation and restriction on certain activities.
However, given that many of the new and proposed rules are
highly complex, the full impact of regulatory reform will not
be known until the rules are implemented and market practices
develop under the final EU and/or U.K. regulations.
Capital Ratios
The Basel Committee has published final guidelines for
calculating incremental capital requirements for domestic
systemically important banking institutions (D-SIBs), which
focus on the impact that the distress or failure of banks will
have on a domestic economy. These guidelines are
complementary to the framework for global systemically
important banks (G-SIBs), but are more principles-based in
order to provide an appropriate degree of national discretion.
The D-SIB guidelines have been implemented in the EU via
the systemic risk buffer (SRB) and the other systemically
important institution (O-SII) buffer in CRD IV. The EU’s
implementation of the D-SIB guidelines allows significant EU
member state discretion. The company does not fall within the
scope of the SRB regulations, which apply to ring-fenced
banks and building societies with deposits over £25 billion, and
therefore the company will not be subject to a SRB capital
buffer.
The company’s parent, Goldman Sachs Group UK Limited
(GSGUK), has been designated as an O-SII by the PRA.
However, the U.K. has chosen not to apply a capital buffer to
O-SIIs. Therefore, under current primary legislation in the
U.K., GSI will not be required to maintain an O-SII buffer.
This means that neither of the D-SIB equivalent buffers
currently applies to GSI.

GOLDMAN SACHS INTERNATIONAL (UNLIMITED COMPANY)
Strategic Report
16
In January 2016, the Basel Committee finalised a revised
framework for calculating minimum capital requirements for
market risk, which is expected to increase market risk capital
requirements for most banking organisations. The revised
framework, among other things: modifies the boundary
between the trading book and banking book; replaces VaR and
SVaR measurements in the internal models approach with an
expected shortfall measure that is intended to reflect tail and
liquidity risks not captured by VaR; revises the model review
and approval process; limits the capital-reducing effects of
hedging and portfolio diversification in the internal models
approach; provides that securitisation exposures will be
measured using only the Standardised approach; and makes
significant revisions to the methodology for capital
requirements under the Standardised approach. The effective
date for first reporting under the revised framework is
December 31, 2019. The European authorities have not yet
proposed regulations implementing the revised requirements
for EU financial institutions. The company is currently
evaluating the potential impact of the Basel Committee’s
revised framework.
The Basel Committee has issued a series of updates which
propose other changes to capital regulations. In particular, it
has finalised a revised standard approach for calculating RWAs
for counterparty credit risk on derivatives exposures
(“Standardised Approach for measuring Counterparty Credit
Risk exposures”, known as “SA-CCR”). In addition, it has
published guidelines for measuring and controlling large
exposures (“Supervisory Framework for measuring and
controlling Large Exposures”), and issued an updated
framework for the regulatory capital treatment of banking book
securitisations.
The Basel Committee has also issued consultation papers on,
among other matters, a “Review of Interest Rate Risk in the
Banking Book”, a “Review of the Credit Valuation Adjustment
Risk Framework”, revisions to the Basel Standardised
approach for credit risk and operational risk capital, and the
design of a capital floor framework based on the revised
Standardised approach.
The impact of all of these developments on the company
(including RWAs and regulatory capital ratios) is subject to
uncertainty until corresponding legislation is implemented in
the EU.
Liquidity Ratios
The Basel Committee’s international framework for liquidity
risk measurement, standards and monitoring requires banking
organisations to measure their liquidity against two specific
liquidity tests.
The liquidity coverage ratio (LCR) is designed to ensure that
the entity maintains an adequate level of unencumbered high-
quality liquid assets based on expected net cash outflows under
an acute short-term liquidity stress scenario. The LCR rule
issued by the PRA became effective on October 1, 2015, with a
phase-in period whereby certain financial institutions,
including GSI, must have an 80% minimum ratio initially,
increasing to 90% on January 1, 2017 and 100% on January 1,
2018.
The net stable funding ratio (NSFR) is designed to promote
more medium- and long-term stable funding of the assets and
off-balance-sheet activities of banking organisations over a
one-year time horizon. Under the Basel Committee framework,
the NSFR will be effective on January 1, 2018. The U.K.
regulatory authorities have not yet proposed rules
implementing the NSFR for U.K. financial institutions.
Resolution and Recovery Planning
The EU Bank Recovery and Resolution Directive (BRRD)
establishes a framework for the recovery and resolution of
credit institutions and investment firms in the EU. The BRRD
provides national supervisory authorities with tools and powers
to pre-emptively address potential financial crises in order to
promote financial stability and minimise taxpayers’ exposure
to losses.
The BRRD required EU member states to grant, by January 1,
2016, “bail-in” powers to EU resolution authorities to
recapitalise a failing entity by writing down its unsecured debt
or converting its unsecured debt into equity. Financial
institutions in the EU (including GSI) must provide that new
contracts entered into after January 1, 2016 enable such
actions, and must also amend pre-existing contracts governed
by non-EU law to enable such actions, when the financial
institutions could incur liabilities under such pre-existing
contracts after January 1, 2016. The UK resolution authorities
have allowed for a six month delay in the implementation of
this provision until June 30, 2016 (or earlier if the relevant
rules are amended or revoked), acknowledging the difficulty of
the exercise and the unavailability of EBA authorised language
to be used by financial institutions.
GOLDMAN SACHS INTERNATIONAL (UNLIMITED COMPANY)
Strategic Report
17
Separately, under the BRRD, financial contracts not governed
by EU law are required to be amended so that the resolution
authorities can impose a temporary stay of termination in
resolution. These requirements must be implemented over
2016 and 2017, with the timing depending on the category of
the counterparty of the financial institution.
In November 2015, GS Group and the company, along with a
number of other major global banking organisations, adhered
to an updated version of the International Swaps and
Derivatives Association Resolution Stay Protocol (the ISDA
Protocol) that was developed in coordination with the Financial
Stability Board. The ISDA Protocol imposes a stay on certain
cross-default and early termination rights within standard
ISDA derivatives contracts and securities financing
transactions between adhering parties in the event that one of
them is subject to resolution in its home jurisdiction, including
a resolution under the orderly liquidation authority in the
United States. The initial version, which addressed ISDA
derivatives contracts, took effect in January 2015, and the
updated version, which was revised to also cover securities
financing transactions, took effect in January 2016. The
company anticipates that the implementation of the BRRD
termination stay will be handled in part through the adoption of
the ISDA Protocol.
Total Loss-Absorbing Capacity
In November 2015, the Financial Stability Board issued a set
of final principles and a final term sheet on a new minimum
standard for total loss-absorbing capacity (TLAC) of G-SIBs.
The Financial Stability Board’s final standard also requires
certain material subsidiaries of a G-SIB organised outside of
the G-SIB’s home country, such as GSI, to maintain amounts
of TLAC to facilitate the transfer of losses from operating
subsidiaries to the parent company.
The BRRD subjects institutions to a “minimum requirement
for own funds and eligible liabilities” (MREL) so that they can
be resolved without causing financial instability and without
recourse to public funds in the event of a failure. In July 2015,
the EBA published final draft Regulatory Technical Standards
on MREL. In December 2015, the Bank of England published
a consultation paper on its approach for setting MREL under
which U.K. banks and certain investment firms, such as GSI,
would need to maintain sufficient equity and liabilities that are
capable of credibly bearing losses in resolution. MREL is
generally consistent with the Financial Stability Board’s TLAC
standard.
The proposed MREL is the sum of a loss absorption amount
and a recapitalisation amount. The loss absorption amount is
based on a firm’s minimum going-concern capital requirement,
which currently consists of Pillar 1, plus Pillar 2A. The
recapitalisation amount is based on a firm’s recapitalisation
needs post-resolution and any additional requirements to be
determined by the Bank of England as necessary to maintain
market confidence. MREL in the U.K. is being phased in from
January 1, 2016 to January 1, 2020, with G-SIBs expected to
comply with the minimum TLAC standard by January 1, 2019.
The company expects that a portion of its intercompany
borrowings from GSGUK, adjusted as needed to meet the
terms required under the Bank of England’s final MREL rule
when adopted, will serve to meet its recapitalisation
requirement under MREL.
GOLDMAN SACHS INTERNATIONAL (UNLIMITED COMPANY)
Strategic Report
18
EU Market Reform
The EU has finalised the Markets in Financial Instruments
Regulation and a revision of the Markets in Financial
Instruments Directive (collectively, MiFID II). These include
extensive market structure reforms, such as the establishment
of new trading venue categories for the purposes of
discharging the obligation to trade OTC derivatives on a
trading platform, enhanced pre- and post-trade transparency
covering a wider range of financial instruments and a reform of
the equities markets. Commodities trading firms will be
required to calculate their positions and adhere to specific
limits. Other reforms introduce enhanced transaction reporting,
the publication of best execution data by investment firms and
trading venues, investor protection-related and organisational
requirements. Other requirements may affect the way
investment managers can pay for the receipt of investment
research. On February 10, 2016, the European Commission
proposed delaying the effectiveness of MiFID II until January
2018.
The EU and national financial legislators and regulators have
proposed or adopted numerous further market reforms that may
impact the company’s businesses, including heightened
corporate governance standards for financial institutions and
rules on indices that are used as benchmarks for financial
instruments or funds. In addition, the European Commission,
the European Securities Market Authority and the EBA have
announced or are formulating regulatory standards and other
measures which will impact the company’s European
operations.
The European Commission has published a proposal for a
common system of financial transactions tax which would be
implemented in certain EU member states willing to engage in
enhanced cooperation in this area. The proposed financial
transactions tax is broad in scope and would apply to
transactions in a wide variety of financial instruments and
derivatives. The European Commission has also published a
draft proposal for structural reform of EU banks, which would
prohibit certain banks from proprietary trading and would
require separating certain trading activities from deposit-taking
entities.
The EU has established regulatory requirements for OTC
derivatives activities under the European Market Infrastructure
Regulation, including requirements relating to portfolio
reconciliation and reporting, which have already taken effect,
as well as requirements relating to clearing and margining for
uncleared derivatives, which are currently expected to be
finalised during 2016.
Volcker Rule
The provisions of the Dodd-Frank Wall Street Reform and
Consumer Protection Act (Dodd-Frank Act) referred to as the
“Volcker Rule” became effective in July 2015 (subject to a
conformance period, as applicable). GSI is subject to these
provisions by virtue of being a subsidiary of GS Group. The
Volcker Rule prohibits “proprietary trading”, but permits
activities such as underwriting, market making and risk-
mitigation hedging. GS Group is also required to create an
extensive compliance programme, which includes additional
reporting and record keeping requirements. The reporting
requirements include calculating daily quantitative metrics on
covered trading activities (as defined in the rule) and providing
these metrics to regulators on a monthly basis.
In addition, the Volcker Rule limits the sponsorship of, and
investment in, “covered funds” (as defined in the rule) by
banking groups, including Group Inc. and its subsidiaries. It
also limits certain types of transactions between the company
and GS Group’s sponsored funds, similar to the limitations on
transactions between depository institutions and their affiliates.
The initial implementation of these rules did not have a
material impact on the company’s financial condition, results
of operations or cash flows. However, the rule is highly
complex, and its impact may change as market practices
further develop.
Compensation Practices
The Financial Stability Board has released standards for
implementing certain compensation principles for banks and
other financial companies designed to encourage sound
compensation practices. These standards are to be implemented
by local regulators. In the EU, CRD IV includes compensation
provisions designed to implement the Financial Stability
Board’s compensation standards. These rules have been
implemented by EU member states and, among other things,
limit the ratio of variable to fixed compensation of certain
employees, including those identified as having a material
impact on the risk profile of EU-regulated entities, including
GSI.
Senior Managers and Certification Regimes
In March 2016, the FCA and PRA implemented the Senior
Managers and Certification Regimes (SMCR) which replaces
the current approved persons regime in the U.K. The SMCR is
comprised of three elements: the senior manager regime; the
certification regime; and conduct rules. These changes
introduce a new accountability framework for individuals in
banking organisations and financial institutions and, in
particular, focus on the role and responsibilities of GSI’s most
senior individuals, fitness and propriety requirements for
individuals performing roles relating to the company’s
regulated activities and conduct rules applicable to the wider
population.

GOLDMAN SACHS INTERNATIONAL (UNLIMITED COMPANY)
Strategic Report
19
Principal Risks and Uncertainties
GSI faces a variety of risks that are substantial and inherent in
its businesses including market, liquidity, credit, operational,
model, legal, regulatory and reputational risks and
uncertainties. The following are some of the more important
factors that could affect the company’s businesses.
Economic and Market Conditions
GSI’s businesses, by their nature, do not produce predictable
earnings and are materially affected by conditions in the global
financial markets and economic conditions generally, both
directly and through their impact on client activity levels.
These conditions can change suddenly and negatively.
The company’s financial performance is highly dependent on
the environment in which its businesses operate. A favourable
business environment is generally characterised by, among
other factors, high global GDP growth, regulatory and market
conditions which result in transparent, liquid and efficient
capital markets, low inflation, high business and investor
confidence, stable geopolitical conditions, clear regulations and
strong business earnings. Unfavourable or uncertain economic
and market conditions can be caused by: concerns about
sovereign defaults; uncertainty in U.S. federal and EU fiscal or
monetary policy; extent of and uncertainty about the timing
and nature of regulatory reforms; declines in economic growth,
business activity or investor or business confidence; limitations
on the availability or increases in the cost of credit and capital;
illiquid markets; increases in inflation, interest rates, exchange
rate or basic commodity price volatility, or default rates;
outbreaks of hostilities or other geopolitical instability;
corporate, political or other scandals that reduce investor
confidence in capital markets; extreme weather events or other
natural disasters or pandemics; or a combination of these or
other factors.
In 2008 and through early 2009, the financial services industry
and the securities markets generally were materially and
adversely affected by significant declines in the values of
nearly all asset classes and by a serious lack of liquidity. Since
2011, concerns about European sovereign debt risk and its
impact on the European banking system, and about changes in
interest rates and other market conditions or actual changes in
interest rates and other market conditions, including market
conditions in China, have resulted, at times, in significant
volatility while negatively impacting the levels of client
activity.
General uncertainty about economic, political and market
activities, and the scope, timing and final implementation of
regulatory reform, as well as weak consumer, investor and
chief executive officer (CEO) confidence resulting in large part
from such uncertainty, continues to negatively impact client
activity, which adversely affects many of the company’s
businesses. Periods of low volatility and periods of high
volatility, combined with a lack of liquidity, have at times had
an unfavourable impact on the company’s market-making
businesses.
The company’s revenues and profitability and those of its
competitors have been and will continue to be impacted by
requirements relating to capital, additional loss-absorbing
capacity, leverage, minimum liquidity and long-term funding
levels, requirements related to resolution and recovery
planning, derivatives clearing and margin rules and levels of
regulatory oversight, as well as limitations on whether and how
certain business activities may be carried out by financial
institutions. Although interest rates are at or near historically
low levels, financial institution returns have also been
negatively impacted by increased funding costs due in part to
the withdrawal of perceived government support of such
institutions in the event of future financial crises. In addition,
liquidity in the financial markets has also been negatively
impacted as market participants and market practices and
structures adjust to new regulations.
The degree to which these and other changes resulting from the
financial crisis will have a long-term impact on the profitability
of financial institutions will depend on the final interpretation
and implementation of new regulations, the manner in which
markets, market participants and financial institutions adapt to
the new landscape, and the prevailing economic and financial
market conditions. However, there is a significant risk that
such changes will, at least in the near-term, continue to
negatively impact the absolute level of revenues, profitability
and return on equity of the company and other financial
institutions.
A determination by the U.K. to exit or otherwise significantly
change its relationship with the EU could affect the manner in
which the company conducts its businesses.

GOLDMAN SACHS INTERNATIONAL (UNLIMITED COMPANY)
Strategic Report
20
Regulation
As a participant in the financial services industry and a
subsidiary of a systemically important financial institution, the
company is subject to extensive regulation principally in the
United Kingdom and the European Union more generally but
also in the United States as a subsidiary of GS Group and in
certain other jurisdictions. The company faces the risk of
significant intervention by regulatory and tax authorities in all
jurisdictions in which it conducts its businesses. In many cases,
the company’s activities may be subject to overlapping and
divergent regulation in different jurisdictions. Among other
things, as a result of regulators or private parties challenging
the company’s compliance with laws and regulations, it could
be fined, prohibited from engaging in certain business
activities, subject to limitations or conditions on its business
activities or subjected to new or substantially higher taxes or
other governmental charges in connection with the conduct of
its businesses or with respect to its employees. Such limitations
or conditions may negatively impact the company’s
profitability.
Separate and apart from the impact on the scope and
profitability of the company’s business activities, day-to-day
compliance with laws and regulations, in particular those laws
and regulations adopted since 2008, has involved and will
continue to involve significant amounts of time, including that
of the company’s senior leaders and that of an increasing
number of dedicated compliance and other reporting and
operational personnel, all of which may negatively impact the
company’s profitability.
If there are new laws or regulations or changes in the
enforcement of existing laws or regulations applicable to the
company’s businesses or those of the company’s clients,
including capital, liquidity, leverage, long-term debt, loss
absorbing capacity and margin requirements, restrictions on
other business practices, reporting requirements, requirements
relating to the implementation of BRRD, tax burdens and
compensation restrictions, that are imposed on a limited subset
of financial institutions (either based on size, activities,
geography or other criteria) which may include the company or
Group Inc., compliance with these new laws and regulations,
or changes in the enforcement of existing laws or regulations,
could adversely affect the company’s ability to compete
effectively with other institutions that are not affected in the
same way. In addition, regulation imposed on financial
institutions or market participants generally, such as taxes on
financial transactions, could adversely impact levels of market
activity more broadly, and thus impact the company’s
businesses.
These developments could impact the company’s profitability
in the affected jurisdictions, or even make it uneconomic to
continue to conduct all or certain businesses in such
jurisdictions, or could result in the company incurring
significant costs associated with changing business practices,
restructuring businesses, moving certain businesses and
employees to other locations or complying with applicable
capital requirements, including liquidating assets or raising
capital in a manner that adversely increases the company’s
funding costs or otherwise adversely affects its shareholder and
creditors.
Regulatory developments, in particular MiFID II, Basel III and
the Dodd-Frank Act have significantly altered the regulatory
framework within which the company operates and may
adversely affect the company’s competitive position and
profitability.
The EU and national financial legislators and regulators have
proposed or adopted numerous market reforms that have
impacted and may continue to impact the company’s
businesses. These include stricter capital and liquidity
requirements, including legislation (in the form of CRD IV) to
implement Basel III capital requirements for GSI. In addition,
the EU has finalised MiFID II, which is scheduled to become
effective in January 2018.
Additional market reforms also include rules on the recovery
and resolution of EU institutions, rules on the separation of
certain trading activities from deposit taking, rules on the
cross-border provision of services from countries outside the
European Economic Area, authorisations for regulators to
impose position limits, requirements to execute certain
transactions only on certain regulated venues, reporting
requirements (including requirements to publish information
about transactions), restrictions on short selling and credit
default swaps, additional obligations and restrictions on the
management and marketing of funds in the EU, sanctions for
regulatory breach and further revised organisational, market
structure, conduct of business and market abuse rules. The
implementation of these reforms may adversely affect the
company’s profitability and competitive position, particularly
if these requirements do not apply, or do not apply equally, to
the company’s competitors or are not implemented uniformly
across jurisdictions.
GOLDMAN SACHS INTERNATIONAL (UNLIMITED COMPANY)
Strategic Report
21
The implementation of higher capital requirements, the
liquidity coverage ratio, the net stable funding ratio,
requirements relating to long-term debt and total loss-
absorbing capacity and the prohibition on proprietary trading
and the sponsorship of, or investment in, covered funds by the
Volcker Rule may adversely affect the company’s profitability
and competitive position, particularly if these requirements do
not apply, or do not apply equally, to the company’s
competitors or are not implemented uniformly across
jurisdictions.
The company is also subject to laws and regulations relating to
the privacy of the information of clients, employees or others,
and any failure to comply with these regulations could expose
the company to liability and/or reputational damage. In
addition, the company’s businesses are increasingly subject to
laws and regulations relating to surveillance, encryption and
data on-shoring in the jurisdictions in which the company
operates. Compliance with these laws and regulations may
require the company to change its policies, procedures and
technology for information security, which could, among other
things, make the company more vulnerable to cyber attacks
and misappropriation, corruption or loss of information or
technology.
Increasingly, regulators and courts have sought to hold
financial institutions liable for the misconduct of their clients
where such regulators and courts have determined that the
financial institution should have detected that the client was
engaged in wrongdoing, even though the financial institution
had no direct knowledge of the activities engaged in by its
client. Regulators and courts have also increasingly found
liability as a “control person” for activities of entities in which
financial institutions or funds controlled by financial
institutions have an investment, but which they do not actively
manage. In addition, regulators and courts continue to seek to
establish “fiduciary” obligations to counterparties to which no
such duty had been assumed to exist. To the extent that such
efforts are successful, the cost of, and liabilities associated
with, engaging in brokerage, clearing, market-making, prime
brokerage, investing and other similar activities could increase
significantly. To the extent that the company has fiduciary
obligations in connection with acting as a financial adviser,
investment adviser or in other roles for individual, institutional,
sovereign or investment fund clients, any breach, or even an
alleged breach, of such obligations could have materially
negative legal, regulatory and reputational consequences.
For information about the extensive regulation to which the
company’s businesses are subject, see “Regulatory
Developments”.
GOLDMAN SACHS INTERNATIONAL (UNLIMITED COMPANY)
Strategic Report
22
Market Volatility
Certain market-making activities depend on market volatility
to provide trading and arbitrage opportunities to clients and
decreases in volatility may reduce these opportunities and
adversely affect the results of these activities. In contrast,
increased volatility, whilst it can increase trading volumes and
spreads, also increases risk as measured by VaR and may
expose the company to increased risks in connection with
market-making activities or cause the company to reduce its
market-making positions to avoid increasing VaR. Limiting the
size of such market-making positions can adversely affect the
company’s profitability. In periods when volatility is
increasing, but asset values are declining significantly, it may
not be possible to sell assets at all or it may only be possible to
do so at steep discounts. In such circumstances, the company
may be forced to either take on additional risk or to realise
losses in order to decrease its VaR. In addition, increases in
volatility increase the level of the company’s RWAs, which
increases the company’s capital requirements.
The company’s businesses have been and may be adversely
affected by declining asset values. This is particularly true for
those businesses in which the company has net “long”
positions, receives fees based on the value of assets managed,
or receives or posts collateral. Many of the company’s
businesses have net “long” positions in debt securities, loans,
derivatives, mortgages, equities (including private equity and
real estate) and most other asset classes. These include
positions taken when the company acts as a principal to
facilitate clients’ activities, including exchange-based market-
making activities, or commits large amounts of capital to
maintain positions in interest rate and credit products, as well
as through currencies, commodities and equities and mortgage-
related activities. Because substantially all of these investing
and market-making positions are marked-to-market on a daily
basis, declines in asset values directly and immediately impact
earnings, unless exposures have been effectively hedged to
such declines.
In certain circumstances (particularly in the case of credit
products and private equities or other securities that are not
freely tradable or lack established and liquid trading markets),
it may not be possible or economic to hedge such exposures
and to the extent that this is done the hedge may be ineffective
or may greatly reduce the company’s ability to profit from
increases in the values of the assets. Sudden declines and
significant volatility in the prices of assets may substantially
curtail or eliminate the trading markets for certain assets,
which may make it difficult to sell, hedge or value such assets.
The inability to sell or effectively hedge assets reduces the
ability to limit losses in such positions and the difficulty in
valuing assets may negatively affect the company’s capital,
liquidity or leverage ratios, increase its funding costs and
generally require maintaining additional capital.
In the company’s exchange-based market-making activities,
the company is obligated by stock exchange rules to maintain
an orderly market, including by purchasing securities in a
declining market. In markets where asset values are declining
and in volatile markets, this results in losses and an increased
need for liquidity.
Asset-based management fees are received based on the value
of clients’ portfolios managed by the company and, in some
cases, incentive fees are also received based on increases in the
value of such investments. Declines in asset values reduce the
value of clients’ portfolios which in turn reduce the fees earned
for managing such assets.
Collateral is posted to support obligations and received to
support the obligations of clients and counterparties in
connection with client execution businesses. When the value of
the assets posted as collateral declines or the credit ratings of
the party posting collateral decline, the party posting the
collateral may need to provide additional collateral or, if
possible, reduce its trading position. A classic example of such
a situation is a margin call in connection with a brokerage
account. Therefore, declines in the value of asset classes used
as collateral mean that either the cost of funding positions is
increased or the size of positions is decreased. If the company
is the party providing collateral, this can increase costs and
reduce profitability and if the company is the party receiving
collateral, this can also reduce profitability by reducing the
level of business done with clients and counterparties. In
addition, volatile or less liquid markets increase the difficulty
of valuing assets which can lead to costly and time-consuming
disputes over asset values and the level of required collateral,
as well as increased credit risk to the recipient of the collateral
due to delays in receiving adequate collateral.

GOLDMAN SACHS INTERNATIONAL (UNLIMITED COMPANY)
Strategic Report
23
Liquidity
Liquidity is essential to the company’s businesses. The
company’s liquidity could be impaired by an inability to access
secured and/or unsecured debt markets, an inability to access
funds from Group Inc. or other affiliates, an inability to sell
assets or redeem investments or unforeseen outflows of cash or
collateral. This situation may arise due to circumstances that
the company may be unable to control, such as a general
market disruption or an operational problem that affects third
parties or the company or its affiliates or even by the
perception amongst market participants that the company, or
other market participants, are experiencing greater liquidity
risk.
The company employs structured products to benefit its clients
and hedge its own risks. The financial instruments that the
company holds and the contracts to which it is a party are often
complex, and these complex structured products often do not
have readily available markets to access in times of liquidity
stress. The company’s investing activities may lead to
situations where the holdings from these activities represent a
significant portion of specific markets, which could restrict
liquidity for the company’s positions.
Further, the company’s ability to sell assets may be impaired if
other market participants are seeking to sell similar assets at
the same time, as is likely to occur in a liquidity or other
market crisis or in response to changes to rules or regulations.
In addition, financial institutions with which the company
interacts may exercise set-off rights or the right to require
additional collateral, including in difficult market conditions,
which could further impair the company’s access to liquidity.
The company is an indirect, wholly-owned operating
subsidiary of Group Inc. and depends on Group Inc. for capital
and funding. The credit ratings of GSI and those of Group Inc.
are important to the company’s liquidity. A reduction in GSI
and/or Group Inc.’s credit rating could adversely affect the
company’s liquidity and competitive position, increase
borrowing costs, limit access to the capital markets or funding
from Group Inc. or trigger obligations under certain provisions
in some trading and collateralised financing contracts. Under
these provisions, counterparties could be permitted to terminate
contracts with GSI or Group Inc. or require additional
collateral. Termination of trading and collateralised financing
contracts could cause losses and impair liquidity by requiring
Group Inc. or GSI to find other sources of financing or to make
significant cash payments or securities movements.
GSI’s and Group Inc.’s cost of obtaining long-term unsecured
funding is directly related to both the credit spreads of GSI and
Group Inc. Increases in the credit spreads of GSI and/or Group
Inc. can significantly increase the cost of this funding. Changes
in credit spreads are continuous, market-driven, and subject at
times to unpredictable and highly volatile movements. The
credit spreads of GSI and/or Group Inc. are also influenced by
market perceptions of GSI’s and/or Group Inc.’s
creditworthiness. In addition, the credit spreads of GSI and/or
Group Inc. may be influenced by movements in the costs to
purchasers of credit default swaps referenced to Group Inc.’s
long-term debt. The market for credit default swaps has proven
to be extremely volatile and at times has lacked a high degree
of transparency or liquidity.
Regulatory changes relating to liquidity may also negatively
impact the company’s results of operations and competitive
position. Recently, numerous regulations have been adopted or
proposed, and additional regulations are under consideration,
to introduce more stringent liquidity requirements for large
financial institutions. These regulations and others being
considered address, among other matters, liquidity stress
testing, minimum liquidity requirements, wholesale funding,
restrictions on short-term debt issued by top-tier holding
companies and requirements for structured notes and
prohibitions on parent guarantees that are subject to cross-
defaults. These may overlap with, and be impacted by, other
regulatory changes, including new guidance on the treatment
of brokered deposits and the capital, leverage and resolution
and recovery frameworks applicable to large financial
institutions, as well as proposals relating to minimum long-
term debt requirements and bail-in capacity. Given the overlap
and complex interactions among these new and prospective
regulations, they may have unintended cumulative effects, and
their full impact will remain uncertain until implementation of
post-financial crisis regulatory reform is complete.
GOLDMAN SACHS INTERNATIONAL (UNLIMITED COMPANY)
Strategic Report
24
Resolution and Recovery Planning
The circumstances in which a resolution authority would
exercise its “bail-in” powers to recapitalise a failing entity by
writing down its unsecured debt or converting it into equity are
uncertain. If these powers were to be exercised (or if there was
a suggestion that they could be exercised) in respect of GSI,
such exercise would likely have a material adverse effect on
the value of debt investments in GSI, including a potential loss
of some or all of such investment. Furthermore, the suggestion
that such powers were to be exercised could also have an
adverse impact on the value of such investments.
Credit Markets
Widening credit spreads for the company or Group Inc., as
well as significant declines in the availability of credit, have in
the past adversely affected the company’s ability to borrow on
a secured and unsecured basis and may do so in the future. GSI
obtains the majority of its unsecured funding from Group Inc.,
which funds itself on an unsecured basis by issuing long-term
debt, by accepting deposits at its bank subsidiaries, by issuing
hybrid financial instruments, or by obtaining bank loans or
lines of credit. The company seeks to finance many of its assets
on a secured basis. Any disruptions in the credit markets may
make it harder and more expensive to obtain funding for
businesses. If the company’s available funding is limited or the
company is forced to fund operations at a higher cost, these
conditions may require curtailment of business activities and
increase the cost of funding, both of which could reduce
profitability, particularly in businesses that involve investing
and market making.
Clients engaging in mergers and acquisitions often rely on
access to the secured and unsecured credit markets to finance
their transactions. A lack of available credit or an increased
cost of credit can adversely affect the size, volume and timing
of clients’ merger and acquisition transactions – particularly
large transactions – and adversely affect the company’s
financial advisory and underwriting businesses.
The company’s credit businesses have been and may in the
future be negatively affected by a lack of liquidity in credit
markets. A lack of liquidity reduces price transparency,
increases price volatility and decreases transaction volumes
and size, all of which can increase transaction risk or decrease
the profitability of such businesses.
To the extent that the final rules related to MREL or TLAC
require the company or Group Inc. to issue material amounts of
additional qualified loss-absorbing debt or to refinance
material amounts of existing debt, such requirements, at least
in the near term, could increase the company’s borrowing
costs, perhaps materially, and negatively impact the debt
capital markets. See “Regulatory Developments – Total Loss-
Absorbing Capacity” for more information about the Bank of
England’s proposed rules on loss-absorbency requirements.
Concentration of Risk
Concentration of risk increases the potential for significant
losses in market-making, underwriting, and investing activities.
The number and size of such transactions may affect the
company’s results of operations in a given period. Moreover,
because of concentration of risk, the company may suffer
losses even when economic and market conditions are
generally favourable for competitors. Disruptions in the credit
markets can make it difficult to hedge these credit exposures
effectively or economically.
Rules adopted under the Dodd-Frank Act require issuers of
asset-backed securities and any person who organises and
initiates an asset-backed securities transaction to retain
economic exposure to the asset, which is likely to significantly
increase the cost to the company of engaging in securitisation
activities. The company’s inability to reduce its credit risk by
selling, syndicating or securitising these positions, including
during periods of market stress, could negatively affect the
company’s results of operations due to a decrease in the fair
value of the positions, including due to the insolvency or
bankruptcy of the borrower, as well as the loss of revenues
associated with selling such securities or loans.
In the ordinary course of business, the company may be subject
to a concentration of credit risk to a particular counterparty,
borrower, issuer, including sovereign issuers, or geographic
area or group of related countries, such as the EU. A failure or
downgrade of, or default by, such entity could negatively
impact the company’s businesses, perhaps materially, and the
systems by which the company sets limits and monitors the
level of its credit exposure to individual entities, industries and
countries may not function as anticipated. While the
company’s activities expose it to many different industries,
counterparties and countries, the company routinely executes a
high volume of transactions with counterparties engaged in
financial services activities, including brokers and dealers,
commercial banks, clearing houses and exchanges. This has
resulted in significant credit concentration with respect to these
counterparties. Provisions of the European Market
Infrastructure Regulation and Dodd-Frank Act have led to
increased centralisation of trading activity through particular
clearing houses, central agents or exchanges, which has
significantly increased the company’s concentration of risk
with respect to these entities.
GOLDMAN SACHS INTERNATIONAL (UNLIMITED COMPANY)
Strategic Report
25
Credit Quality
The company is exposed to the risk that third parties who owe
money, securities or other assets will not perform their
obligations. These parties may default on their obligations to
the company due to bankruptcy, lack of liquidity, operational
failure or other reasons. A failure of a significant market
participant, or even concerns about a default by such an
institution, could lead to significant liquidity problems, losses
or defaults by other institutions, which in turn could adversely
affect the company.
The company is also subject to the risk that its rights against
third parties may not be enforceable in all circumstances. In
addition, deterioration in the credit quality of third parties
whose securities or obligations are held by the company,
including a deterioration in the value of collateral posted by
third parties to secure their obligations to the company under
derivatives contracts and loan agreements, could result in
losses and/or adversely affect the company’s ability to
rehypothecate or otherwise use those securities or obligations
for liquidity purposes.
A significant downgrade in the credit ratings of the company’s
counterparties could also have a negative impact on the
company’s results. While in many cases the company is
permitted to require additional collateral from counterparties
that experience financial difficulty, disputes may arise as to the
amount of collateral the company is entitled to receive and the
value of pledged assets. The termination of contracts and the
foreclosure on collateral may subject the company to claims
for the improper exercise of its rights. Default rates,
downgrades and disputes with counterparties as to the
valuation of collateral increase significantly in times of market
stress and illiquidity.
Derivative Transactions
The company is party to a large number of derivative
transactions, including credit derivatives. Many of these
derivative instruments are individually negotiated and
non-standardised, which can make exiting, transferring or
settling positions difficult. Many credit derivatives require that
the company delivers to the counterparty the underlying
security, loan or other obligation in order to receive payment.
In a number of cases, the company does not hold the
underlying security, loan or other obligation and may not be
able to obtain the underlying security, loan or other obligation.
This could cause the company to forfeit the payments due
under these contracts or result in settlement delays with the
attendant credit and operational risk as well as increased costs
to the company.
Derivative transactions may also involve the risk that
documentation has not been properly executed, that executed
agreements may not be enforceable against the counterparty, or
that obligations under such agreements may not be able to be
netted against other obligations with such counterparty. In
addition, counterparties may claim that such transactions were
not appropriate or authorised.
As a signatory to the ISDA Protocol, the company may not be
able to exercise remedies against counterparties and, as this
new regime has not yet been tested, the company may suffer
risks or losses that it would not have expected to suffer if it
could immediately close out transactions upon a termination
event. The ISDA Protocol contemplates adoption of
implementing regulations by various U.S. and non-U.S.
regulators, and the ISDA Protocol’s impact will depend on,
among other things, how it is implemented.
Derivative contracts and other transactions entered into with
third parties are not always confirmed by the counterparties or
settled on a timely basis. While the transaction remains
unconfirmed or during any delay in settlement, the company is
subject to heightened credit and operational risk and in the
event of a default may find it more difficult to enforce its
rights. In addition, as new complex derivative products are
created, covering a wider array of underlying credit and other
instruments, disputes about the terms of the underlying
contracts could arise, which could impair the company’s ability
to effectively manage its risk exposures from these products
and subject it to increased costs. The provisions of legislation
requiring central clearing of credit derivatives and other OTC
derivatives, or a market shift toward standardised derivatives,
could reduce the risk associated with such transactions, but
under certain circumstances could also limit the company’s
ability to develop derivatives that best suit the needs of clients
and to hedge its own risks, and could adversely affect the
company’s profitability and increase credit exposure to such a
platform.

GOLDMAN SACHS INTERNATIONAL (UNLIMITED COMPANY)
Strategic Report
26
Regulations have been proposed or adopted in various
jurisdictions that provide for significantly increased regulation
of and restrictions on derivative markets and transactions,
including the introduction of standardised execution and
clearing, margining and reporting requirements for OTC
derivatives. The EU has established regulatory requirements
for OTC derivatives activities under the European Market
Infrastructure Regulation, including requirements relating to
portfolio reconciliation and reporting, which have already
taken effect, as well as requirements relating to clearing and
margining for uncleared derivatives, which are currently
expected to be finalised during 2016. In addition, under the
Dodd-Frank Act, the U.S. Commodity Futures Trading
Commission has proposed or adopted rules relating to swaps,
swap dealers and major swap participants, and the U.S.
Securities and Exchange Commission has proposed or adopted
rules relating to security-based swaps, security-based swap
dealers and major security-based swap participants.
Operational Infrastructure
The company’s businesses are highly dependent on its ability
to process and monitor, on a daily basis, a large number of
transactions, many of which are highly complex, and occur at
high volumes and frequencies, across numerous and diverse
markets in many currencies. These transactions, as well as
information technology services provided to clients, often must
adhere to client-specific guidelines, as well as legal and
regulatory standards.
Many rules and regulations worldwide govern the company’s
obligations to report transactions to regulators, exchanges and
investors. Compliance with these legal and reporting
requirements can be challenging, and the company and other
financial institutions have been subject to regulatory fines and
penalties for failing to report timely, accurate and complete
information. As reporting requirements expand, compliance
with these rules and regulations has become more challenging.
As the company’s client base and geographical reach expands,
and the volume, speed, frequency and complexity of
transactions, especially electronic transactions (as well as the
requirements to report such transactions on a real-time basis to
clients, regulators and exchanges) increases, developing and
maintaining operational systems and infrastructure becomes
more challenging, and the risk of systems or human error in
connection with such transactions increases, as well as the
potential consequences of such errors due to the speed and
volume of transactions involved and the potential difficulty
associated with discovering such errors quickly enough to limit
the resulting consequences.
Financial, accounting, data processing or other operating
systems and facilities may fail to operate properly or become
disabled as a result of events that are wholly or partially
beyond the company’s control, such as a spike in transaction
volume, adversely affecting the company’s ability to process
these transactions or provide these services. The company must
continuously update these systems to support its operations and
growth and to respond to changes in regulations and markets,
and invest heavily in systemic controls and training to ensure
that such transactions do not violate applicable rules and
regulations or, due to errors in processing such transactions,
adversely affect markets, clients and counterparties or the
company itself.
Systems enhancements and updates, as well as the requisite
training, including in connection with the integration of new
businesses, entail significant costs and create risks associated
with implementing new systems and integrating them with
existing ones.
Notwithstanding the proliferation of technology and
technology-based risk and control systems, the company’s
businesses ultimately rely on human beings as their greatest
resource, and from time-to-time, mistakes are made that are not
always caught immediately by technological processes or by
other procedures which are intended to prevent and detect such
errors. These can include calculation errors, mistakes in
addressing emails, errors in software development or
implementation, or simple errors in judgement. The company
strives to eliminate such human errors through training,
supervision, technology and by duplicate or overlapping
processes and controls. Human errors, even if promptly
discovered and remediated, can result in material losses and
liabilities for the company.
In addition, the company faces the risk of operational failure,
termination or capacity constraints of any of the clearing
agents, exchanges, clearing houses or other financial
intermediaries that it uses to facilitate securities and derivatives
transactions, and as interconnectivity with clients grows, the
company will increasingly face the risk of operational failure
with respect to clients’ systems.
In recent years, there has been significant consolidation among
clearing agents, exchanges and clearing houses and an
increasing number of derivative transactions are now or in the
near future will be cleared on exchanges, which has increased
the company’s exposure to operational failure, termination or
capacity constraints of the particular financial intermediaries
that the company uses and could affect its ability to find
adequate and cost-effective alternatives in the event of any
such failure, termination or constraint. Industry consolidation,
whether among market participants or financial intermediaries,
increases the risk of operational failure as disparate complex
systems need to be integrated, often on an accelerated basis.

GOLDMAN SACHS INTERNATIONAL (UNLIMITED COMPANY)
Strategic Report
27
Furthermore, the interconnectivity of multiple financial
institutions with central agents, exchanges and clearing houses,
and the increased centrality of these entities, increases the risk
that an operational failure at one institution or entity may cause
an industry-wide operational failure that could materially
impact the company’s ability to conduct business. Any such
failure, termination or constraint could adversely affect the
company’s ability to effect transactions, service its clients,
manage its exposure to risk or expand its businesses or result in
financial loss or liability to its clients, impairment of its
liquidity, disruption of its businesses, regulatory intervention
or reputational damage.
Despite the resiliency plans and facilities that are in place, the
company’s ability to conduct business may be adversely
impacted by a disruption in the infrastructure that supports its
businesses and the communities in which the company is
located. This may include a disruption involving electrical,
satellite, undersea or other communications, internet,
transportation or other services facilities used by the company
or third parties with which the company conducts business,
including cloud service providers. These disruptions may occur
as a result of events that affect only the company’s buildings or
systems or those of such third parties, or as a result of events
with a broader impact globally, regionally or in the cities
where those buildings or systems are located, including, but
not limited, to, natural disasters, war, civil unrest, terrorism,
economic or political developments, pandemics and weather
events.
Technology
Technology is fundamental to the company’s businesses and
industry. The growth of electronic trading and the introduction
of new technologies is changing these businesses and
presenting the company with new challenges. Securities,
futures and options transactions are increasingly occurring
electronically, both on the company’s own systems and
through other alternative trading systems, and it appears that
the trend toward alternative trading systems will continue.
Some of these alternative trading systems compete with the
company’s businesses, particularly the company’s exchange-
based market-making activities, and the company may
experience continued competitive pressures in these and other
areas. In addition, the increased use by clients of low-cost
electronic trading systems and direct electronic access to
trading markets could cause a reduction in commissions and
spreads. As clients increasingly use the company’s systems to
trade directly in the markets, the company may incur liabilities
as a result of their use of the company’s order routing and
execution infrastructure. Significant resources have been
invested into the development of electronic trading systems
and the company expects to continue to do so, but there is no
assurance that the revenues generated by these systems will
yield an adequate return on this investment, particularly given
the generally lower commissions arising from electronic trades.
Cyber Security
The company’s operations rely on the secure processing,
storage and transmission of confidential and other information
in its computer systems and networks. There have been several
recent highly publicised cases involving financial services and
consumer-based companies reporting the unauthorised
disclosure of client or customer information in recent years, as
well as cyber attacks involving the dissemination, theft and
destruction of corporate information or other assets, as a result
of failure to follow procedures by employees or contractors or
as a result of actions by third-parties, including actions by
foreign governments.
The company is regularly the target of attempted cyber attacks,
including denial-of-service attacks, and must continuously
monitor and develop its systems to protect its technology
infrastructure and data from misappropriation or corruption. In
addition, due to the interconnectivity with third-party vendors,
central agents, exchanges, clearing houses and other financial
institutions, the company could be adversely impacted if any of
them is subject to a successful cyber attack or other
information security event.
Despite the company’s efforts to ensure the integrity of its
systems and information, it may not be able to anticipate,
detect or implement effective preventive measures against all
cyber threats, especially because the techniques used are
increasingly sophisticated, change frequently and are often not
recognised until launched. Cyber attacks can originate from a
variety of sources, including third parties who are affiliated
with foreign governments or are involved with organised crime
or terrorist organisations. Third parties may also attempt to
place individuals within the company or induce employees,
clients or other users of the company’s systems to disclose
sensitive information or provide access to the company’s data
or that of its clients, and these types of risks may be difficult to
detect or prevent.
Although the company takes protective measures and
endeavours to modify them as circumstances warrant, its
computer systems, software and networks may be vulnerable to
unauthorised access, misuse, computer viruses or other
malicious code and other events that could have a security
impact. If one or more of such events occur, this potentially
could jeopardise the company or its clients’ or counterparties’
confidential and other information processed and stored in, and
transmitted through, the company’s computer systems and
networks, or otherwise cause interruptions or malfunctions in
the company’s, its clients’, its counterparties’ or third parties’
operations, which could impact their ability to transact with the
company or otherwise result in significant losses or
reputational damage.

GOLDMAN SACHS INTERNATIONAL (UNLIMITED COMPANY)
Strategic Report
28
The increased use of mobile and cloud technologies can
heighten these and other operational risks. The company
expects to expend significant additional resources on an
ongoing basis to modify protective measures and to investigate
and remediate vulnerabilities or other exposures, but these
measures may be ineffective and the company may be subject
to litigation and financial losses that are either not insured
against or not fully covered through any insurance it maintains.
Certain aspects of the security of such technologies are
unpredictable or beyond the company’s control, and the failure
by mobile technology and cloud service providers to
adequately safeguard their systems and prevent cyber attacks
could disrupt the company’s operations and result in
misappropriation, corruption or loss of confidential and other
information. In addition, there is a risk that encryption and
other protective measures, despite their sophistication, may be
defeated, particularly to the extent that new computing
technologies vastly increase the speed and computing power
available.
The company routinely transmits and receives personal,
confidential and proprietary information by email and other
electronic means. The company has discussed and worked with
clients, vendors, service providers, counterparties and other
third parties to develop secure transmission capabilities and
protect against cyber attacks, but does not have, and may be
unable to put in place, secure capabilities with all of its clients,
vendors, service providers, counterparties and other third
parties and it may not be able to ensure that these third parties
have appropriate controls in place to protect the confidentiality
of the information. An interception, misuse or mishandling of
personal, confidential or proprietary information being sent to
or received from a client, vendor, service provider,
counterparty or other third party could result in legal liability,
regulatory action and reputational harm.
Risk Management
The company seeks to monitor and control its risk exposure
through a risk and control framework encompassing a variety
of separate, but complementary financial, credit, operational,
compliance and legal reporting systems, internal controls,
management review processes and other mechanisms. The
company’s risk management process seeks to balance its
ability to profit from market-making positions with its
exposure to potential losses. Whilst the company employs a
broad and diversified set of risk monitoring and risk mitigation
techniques, those techniques and the judgements that
accompany their application cannot anticipate every economic
and financial outcome or the specifics and timing of such
outcomes. Thus, the company may, in the course of its
activities, incur losses. Market conditions in recent years have
involved unprecedented dislocations and highlight the
limitations inherent in using historical data to manage risk.
The models that the company uses to assess and control its risk
exposures reflect assumptions about the degrees of correlation
or lack thereof among prices of various asset classes or other
market indicators. In times of market stress or other unforeseen
circumstances, such as occurred during 2008 and early 2009,
and to some extent since 2011, previously uncorrelated
indicators may become correlated, or conversely previously
correlated indicators may move in different directions. These
types of market movements have at times limited the
effectiveness of the company’s hedging strategies and have
caused it to incur significant losses, and they may do so in the
future. These changes in correlation can be exacerbated where
other market participants are using risk or trading models with
assumptions or algorithms that are similar to the company’s. In
these and other cases, it may be difficult to reduce the
company’s risk positions due to the activity of other market
participants or widespread market dislocations, including
circumstances where asset values are declining significantly or
no market exists for certain assets.
To the extent that the company has positions through its
market-making or origination activities or it makes investments
directly through its investing activities, including private
equity, that do not have an established liquid trading market or
are otherwise subject to restrictions on sale or hedging, the
company may not be able to reduce its positions and therefore
reduce its risk associated with such positions. In addition, to
the extent permitted by applicable law and regulation, the
company invests its own capital in private equity, credit, real
estate and hedge funds that it manages and limitations on its
ability to withdraw some or all of its investments in these
funds, whether for legal, reputational or other reasons, may
make it more difficult for the company to control the risk
exposures relating to these investments.
Prudent risk management, as well as regulatory restrictions,
may cause the company to limit its exposure to counterparties,
geographic areas or markets, which may limit its business
opportunities and increase the cost of funding or hedging
activities.

GOLDMAN SACHS INTERNATIONAL (UNLIMITED COMPANY)
Strategic Report
29
New Business Initiatives
The company faces enhanced risks as new business initiatives
lead it to transact with a broader array of clients and
counterparties and expose it to new asset classes and new
markets. A number of the company’s recent and planned
business initiatives and expansions of existing businesses may
bring it into contact, directly or indirectly, with individuals and
entities that are not within the company’s traditional client and
counterparty base and expose it to new asset classes and new
markets. For example, the company continues to transact
business and invest in new regions, including a wide range of
emerging and growth markets.
New business initiatives expose the company to new and
enhanced risks, including risks associated with dealing with
governmental entities, reputational concerns arising from
dealing with less sophisticated counterparties and investors,
greater regulatory scrutiny of these activities, increased credit-
related, market, sovereign and operational risks, risks arising
from accidents or acts of terrorism, and reputational concerns
with the manner in which these assets are being operated or
held or in which the company interacts with these
counterparties.
Operating in Multiple Jurisdictions
In conducting GSI’s businesses and maintaining and
supporting its global operations, the company is subject to risks
of possible nationalisation, expropriation, price controls,
capital controls, exchange controls and other restrictive
governmental actions, as well as the outbreak of hostilities or
acts of terrorism. For example, as a result of the significant
conflict between Russia and Ukraine in recent years, sanctions
have been imposed by the U.S. and EU on certain individuals
and companies in Russia. In many countries, the laws and
regulations applicable to the securities and financial services
industries and many of the transactions in which the company
is involved are uncertain and evolving, and it may be difficult
to determine the exact requirements of local laws in every
market. Any determination by local regulators that the
company has not acted in compliance with the application of
local laws in a particular market or a failure to develop
effective working relationships with local regulators could
have a significant and negative effect not only on GSI’s
businesses in that market but also on its reputation generally.
The company is also subject to the enhanced risk that
transactions it structures might not be legally enforceable in all
cases.
The company’s businesses and operations are increasingly
expanding throughout the world, including in emerging and
growth markets, and this trend is expected to continue. Various
emerging and growth market countries have experienced
severe economic and financial disruptions, including
significant devaluations of their currencies, defaults or
threatened defaults on sovereign debt, capital and currency
exchange controls, and low or negative growth rates in their
economies, as well as military activity, civil unrest or acts of
terrorism. The possible effects of any of these conditions
include an adverse impact on the company’s businesses and
increased volatility in financial markets generally.
While business and other practices throughout the world differ,
the company is subject in its operations worldwide to rules and
regulations relating to corrupt and illegal payments, hiring
practices and money laundering, as well as laws relating to
doing business with certain individuals, groups and countries,
such as the U.S. Foreign Corrupt Practices Act, the USA
PATRIOT Act of 2001 and U.K. Bribery Act. While the
company has invested and continues to invest significant
resources in training and in compliance monitoring, the
geographical diversity of its operations, employees, clients and
customers, as well as the vendors and other third parties that
the company deals with, greatly increases the risk that the
company may be found in violation of such rules or regulations
and any such violation could subject it to significant penalties
or adversely affect its reputation.
In addition, there have been a number of highly publicised
cases around the world, involving actual or alleged fraud or
other misconduct by employees in the financial services
industry in recent years, and the company runs the risk that
employee misconduct could occur. This misconduct has
included and may include in the future the theft of proprietary
information, including proprietary software. It is not always
possible to deter or prevent employee misconduct and the
precautions taken to prevent and detect this activity have not
been and may not be effective in all cases.

GOLDMAN SACHS INTERNATIONAL (UNLIMITED COMPANY)
Strategic Report
30
Conflicts of Interest
A failure to appropriately identify and address potential
conflicts of interest could adversely affect the company’s
businesses. Due to the broad scope of GS Group’s businesses
and client base, the company regularly addresses potential
conflicts of interest, including situations where services to a
particular client or GS Group’s own investments or other
interests conflict, or are perceived to conflict, with the interests
of another client, as well as situations where one or more of its
businesses have access to material non-public information that
may not be shared with other businesses within GS Group and
situations where it may be a creditor of an entity with which
GS Group also has an advisory or other relationship.
Extensive procedures and controls are in place that are
designed to identify and address conflicts of interest, including
those designed to prevent the improper sharing of information
among businesses. However, appropriately identifying and
dealing with conflicts of interest is complex and difficult, and
the company’s reputation, which is one of its most important
assets, could be damaged and the willingness of clients to enter
into transactions with the company may be affected if it fails,
or appears to fail, to identify, disclose and deal appropriately
with conflicts of interest. In addition, potential or perceived
conflicts could give rise to litigation or regulatory enforcement
actions.
Competition
The financial services industry and all of the company’s
businesses are intensely competitive, and are expected to
remain so. The company competes on the basis of a number of
factors, including transaction execution, products and services,
innovation, reputation, creditworthiness and price. There has
been substantial consolidation and convergence among
companies in the financial services industry. This consolidation
and convergence has also hastened the globalisation of the
securities and other financial services markets.
As a result, the company has had to commit capital to support
its international operations and to execute large global
transactions. To the extent the company expands into new
business areas and new geographic regions, it will face
competitors with more experience and more established
relationships with clients, regulators and industry participants
in the relevant market, which could adversely affect its ability
to expand. Governments and regulators have recently adopted
regulations, imposed taxes, adopted compensation restrictions
or otherwise put forward various proposals that have or may
impact the company’s ability to conduct certain of its
businesses in a cost-effective manner or at all in certain or all
jurisdictions, including proposals relating to restrictions on the
type of activities in which financial institutions are permitted to
engage. These or other similar rules, many of which do not
apply to all the company’s competitors, could impact its ability
to compete effectively.
Pricing and other competitive pressures in the company’s
businesses have continued to increase, particularly in situations
where some competitors may seek to increase market share by
reducing prices. For example, in connection with investment
banking and other assignments, the company has experienced
pressure to extend and price credit at levels that may not
always fully compensate it for the risks taken.
The financial services industry is highly interrelated in that a
significant volume of transactions occur among a limited
number of members of that industry. Many transactions are
syndicated to other financial institutions and financial
institutions are often counterparties in transactions. This has
led to claims by other market participants and regulators that
such institutions have colluded in order to manipulate markets
or market prices, including allegations that antitrust laws have
been violated. While the company has extensive procedures
and controls that are designed to identify and prevent such
activities, allegations of such activities, particularly by
regulators, can have a negative reputational impact and can
subject the company to large fines and settlements, and
potentially significant penalties, including treble damages.
Personnel
The company’s businesses may be adversely affected if it is
unable to hire and retain qualified employees. The company’s
performance is largely dependent on the talents and efforts of
highly skilled individuals; therefore, the company’s continued
ability to compete effectively in its businesses, to manage its
businesses effectively and to expand into new businesses and
geographic areas depends on its ability to attract new talented
and diverse employees and to retain and motivate existing
employees. Factors that affect the company’s ability to attract
and retain such employees include compensation and benefits,
and a reputation as a successful business with a culture of
fairly hiring, training and promoting qualified employees. As a
significant portion of the compensation that the company pays
to its employees is paid in the form of year-end discretionary
compensation, a significant portion of which is in the form of
deferred equity-related awards, declines in the company’s
profitability, or in the outlook for its future profitability, as
well as regulatory limitations on compensation levels and
terms, can negatively impact its ability to hire and retain highly
qualified employees.
Competition from within the financial services industry and
from businesses outside the financial services industry for
qualified employees has often been intense. Recently, the
company has experienced increased competition in hiring and
retaining employees to address the demands of new regulatory
requirements. This is also the case in emerging and growth
markets, where the company is often competing for qualified
employees with entities that have a significantly greater
presence or more extensive experience in the region.

GOLDMAN SACHS INTERNATIONAL (UNLIMITED COMPANY)
Strategic Report
31
Changes in law or regulation in jurisdictions in which the
company’s operations are located that affect taxes on the
company’s employees’ income, or the amount or composition
of compensation, may also adversely affect the company’s
ability to hire and retain qualified employees in those
jurisdictions.
The company’s compensation practices are subject to review
by, and the standards of, the PRA and the FCA. As a large
financial institution, the company is subject to limitations on
compensation practices (which may or may not affect
competitors) by the PRA and the FCA and other regulators
worldwide. These limitations, including any imposed by or as a
result of future legislation or regulation, may require the
company to alter compensation practices in ways that could
adversely affect its ability to attract and retain talented
employees.
Legal Liability
Substantial legal liability or significant regulatory action
against the company could have material adverse financial
effects or cause significant reputational harm, which in turn
could seriously harm business prospects. The company faces
significant legal risks in its businesses, and the volume of
claims and amount of damages and penalties claimed in
litigation and regulatory proceedings against financial
institutions remain high. GSI is, from time to time, subject to a
number of other investigations and reviews by, and in some
cases has received requests for documents and information
from, various governmental and regulatory bodies and self-
regulatory organisations relating to various aspects of the
company’s businesses and operations. From experience, legal
claims by customers and clients increase in a market downturn
and employment-related claims increase following periods of
staff reduction. Additionally, governmental entities are
plaintiffs in certain of the legal proceedings in which the
company is involved, and it may face future actions or claims
by the same or other governmental entities, as well as follow-
on civil litigation that is often commenced after regulatory
settlements.
Recently, significant settlements by several large financial
institutions with governmental entities have been publicly
announced. The trend of large settlements with governmental
entities may adversely affect the outcomes for other financial
institutions in similar actions, especially where governmental
officials have announced that the large settlements will be used
as the basis or a template for other settlements. The uncertain
regulatory enforcement environment makes it difficult to
estimate probable losses, which can lead to substantial
disparities between legal reserves and subsequent actual
settlements or penalties.
Unforeseen or Catastrophic Events
The occurrence of unforeseen or catastrophic events, including
the emergence of a pandemic, such as the Ebola or Zika
viruses, or other widespread health emergency (or concerns
over the possibility of such an emergency), terrorist attacks,
extreme terrestrial or solar weather events or other natural
disasters, could create economic and financial disruptions, and
could lead to operational difficulties (including travel
limitations) that could impair the company’s ability to manage
its businesses and result in losses.
Risk Management
Risks are inherent in the company’s business and include
liquidity, market, credit, operational, legal, regulatory and
reputational risks. For further information about the company’s
risk management processes, see “– Overview and Structure of
Risk Management” below. Risks include the risk across the
company’s risk categories, regions or global businesses, as
well as those which have uncertain outcomes and have the
potential to materially impact the company’s financial results,
its liquidity and its reputation. For further information about
the company’s areas of risk, see “– Liquidity Risk
Management”, “– Market Risk Management”, “– Credit Risk
Management”, “– Operational Risk Management”, “– Model
Risk Management” and “Principal Risks and Uncertainties”.

GOLDMAN SACHS INTERNATIONAL (UNLIMITED COMPANY)
Strategic Report
32
Overview and Structure of Risk
Management
Overview
The company believes that effective risk management is of
primary importance to its success. GSI has comprehensive risk
management processes through which the risks associated with
the company’s business are monitored, evaluated and
managed. These risks include market, credit, liquidity,
operational, model, legal, regulatory and reputational risk
exposures. Together with the GSI board of directors, an
extensive cross-divisional committee structure with
representation from senior management of GSI is key to the
risk management culture throughout the company. GSI’s risk
management framework, consistent with GS Group, is built
around three core components: governance; processes; and
people.
Governance. Senior management in the company’s revenue-
producing units and independent control and support functions
lead and participate in risk-oriented committees. Independent
control and support functions include those in Business
Selection and Conflicts Resolution, Compliance, Controllers,
Credit Risk Management and Advisory (Credit Risk
Management), Human Capital Management, Legal, Liquidity
Risk Management and Analysis (Liquidity Risk Management),
Market Risk Management and Analysis (Market Risk
Management), Model Risk Management, Operations,
Operational Risk Management and Analysis (Operational Risk
Management), Tax, Technology and Treasury.
The company maintains strong communication about risk and
has a culture of collaboration in decision-making among the
revenue-producing units, independent control and support
functions, committees and senior management. While the
company believes that the first line of defence in managing risk
rests with the managers in the revenue-producing units, it
dedicates extensive resources to independent control and
support functions in order to ensure a strong oversight structure
and an appropriate segregation of duties. The company
regularly reinforces a strong culture of escalation and
accountability across all divisions and functions.
Processes. The company maintains various processes and
procedures that are critical components of its risk management.
First and foremost is the daily discipline of marking
substantially all of the company’s inventory to current market
levels. The company carries its inventory at fair value, with
changes in valuation reflected immediately in its risk
management systems and in net revenues. The company does
so because it believes this discipline is one of the most
effective tools for assessing and managing risk and that it
provides transparent and realistic insight into its financial
exposures.
People. Even the best technology serves only as a tool for
helping to make informed decisions in real time about the risks
the company is taking. Ultimately, effective risk management
requires the company’s people to interpret risk data on an
ongoing and timely basis and adjust risk positions accordingly.
In both the revenue-producing units and the independent
control and support functions, the experience of GSI’s
professionals, and their understanding of the nuances and
limitations of each risk measure, guide the company in
assessing exposures and maintaining them within prudent
levels.
The company reinforces a culture of effective risk management
in training and development programmes as well as the way
performance is evaluated, and people are recognised and
rewarded. Training and development programmes, including
certain sessions led by the most senior leaders of GS Group
and GSI, are focused on the importance of risk management,
client relationships and reputational excellence. As part of the
annual performance review process, reputational excellence is
assessed, including how an employee exercises good risk
management and reputational judgement, and adheres to the
code of conduct and compliance policies. Review and reward
processes are designed to communicate and reinforce to the
company’s professionals the link between behaviour and how
people are recognised, the need to focus on clients and
reputation, and the need to always act in accordance with the
highest standards of GS Group.

GOLDMAN SACHS INTERNATIONAL (UNLIMITED COMPANY)
Strategic Report
33
Structure Oversight of risk in GSI is ultimately the responsibility of the
GSI board of directors, who oversee risk both directly and
through various committees. A series of committees within
GSI with specific risk management mandates covering
important aspects of the company’s businesses also have
oversight or decision-making responsibilities. The key
committees with oversight of GSI’s activities are described
below.
European Management Committee (EMC). The EMC
oversees all of GSI’s activities in the region. It is chaired by
the co-CEOs of GSI and its membership includes senior
managers from the revenue-producing divisions and
independent control and support functions. The EMC reports to
the GSI board of directors.
EMEA Audit, Business Standards & Compliance
Committee (EABSCC). The EABSCC assists the directors
and senior management of the company in the oversight of
business standards, compliance, operational and reputational
risks and in the review of processes for ensuring the suitability
and effectiveness of the systems and controls of the company
in the region. Its membership includes senior managers from
the revenue-producing divisions and independent control and
support functions. The EABSCC also has responsibility for
overseeing the external audit arrangements and review of
internal audit activities. The EABSCC reports to the EMC and
to the GSI board of directors. In 2016, the EABSCC has been
succeeded by the EMEA Conduct Risk Committee, which will
focus on the oversight of business standards and conduct risk,
and a newly constituted Audit Committee of the GSI board of
directors.
GSI Risk Committee. The GSI Risk Committee is
responsible for the on-going monitoring and control of all
financial risks associated with GSI’s activities. This includes
reviewing key financial and risk metrics, including but not
limited to profit and loss, capital (including ICAAP), funding,
liquidity, credit risk, market risk, operational risk, price
verification and stress tests. The GSI Risk Committee approves
VaR, credit, liquidity and regulatory capital limits. Its
membership includes senior managers from the revenue-
producing divisions and independent control and support
functions. The GSI Risk Committee reports to the GSI board of
directors.
GS Group Risk Governance The comprehensive global risk governance framework in place
at the GS Group level forms an integral part of the risk
management process at GSI. GS Group has established a series
of committees with specific risk management mandates.
Committees with oversight of matters relevant to GSI include
representation from GSI’s senior management. The primary
GS Group risk and oversight committees are described below.
Management Committee. The Management Committee
oversees the global activities of GS Group, including GS
Group’s independent control and support functions. The
committee is comprised of the most senior leaders of GS
Group, and is chaired by GS Group’s CEO. The co-CEOs of
GSI are both members of this committee.
Firmwide Client and Business Standards Committee.
The Firmwide Client and Business Standards Committee
assesses and makes determinations regarding business
standards and practices, reputational risk management, client
relationships and client service, is chaired by GS Group’s
president and chief operating officer, and reports to the
Management Committee. Its membership includes
representation from GSI’s senior management.
Firmwide Risk Committee. The Firmwide Risk Committee
is globally responsible for the ongoing monitoring and
management of GS Group’s financial risks. Through both
direct and delegated authority, the Firmwide Risk Committee
approves firmwide and business-level limits for both market
and credit risks, approves sovereign credit risk limits, reviews
results of stress tests and scenario analyses, and provides
oversight over model risk. Its membership includes
representation from GSI’s senior management.

GOLDMAN SACHS INTERNATIONAL (UNLIMITED COMPANY)
Strategic Report
34
Liquidity Risk Management
Overview (Audited)
Liquidity risk is the risk that the company will be unable to
fund itself or meet its liquidity needs in the event of company-
specific, broader industry, or market liquidity stress events.
Liquidity is of critical importance to the company, as most of
the failures of financial institutions have occurred in large part
due to insufficient liquidity. Accordingly, the company has in
place a comprehensive and conservative set of liquidity and
funding policies. The principal objective is to be able to fund
the company and to enable the core businesses to continue to
serve clients and generate revenues, even under adverse
circumstances.
Treasury has the primary responsibility for assessing,
monitoring and managing liquidity and funding strategy.
Treasury is independent of the revenue-producing units and
reports to GS Group’s chief financial officer.
GS Group’s Liquidity Risk Management function is an
independent risk management function responsible for control
and oversight of GS Group’s liquidity risk management
framework, including stress testing and limit governance.
Liquidity Risk Management is independent of the revenue-
producing units and Treasury, and reports to GS Group’s chief
risk officer.
Liquidity Risk Management Principles (Audited)
GSI manages liquidity risk according to three principles (i)
hold sufficient excess liquidity in the form of GCLA to cover
outflows during a stressed period, (ii) maintain appropriate
Asset-Liability Management and (iii) maintain a viable
Contingency Funding Plan.
Global Core Liquid Assets. GCLA is liquidity that the
company maintains to meet a broad range of potential cash
outflows and collateral needs in a stressed environment. The
company’s most important liquidity policy is to pre-fund its
estimated potential cash and collateral needs during a liquidity
crisis and hold this liquidity in the form of unencumbered,
highly liquid securities and cash. The company believes that
the securities held in its GCLA would be readily convertible to
cash in a matter of days, through liquidation, by entering into
repurchase agreements or from maturities of securities
purchased under agreements to resell (resale agreements), and
that this cash would allow it to meet immediate obligations
without needing to sell other assets or depend on additional
funding from credit-sensitive markets.
GSI’s GCLA reflects the following principles:
The first days or weeks of a liquidity crisis are the most
critical to a company’s survival;
Focus must be maintained on all potential cash and
collateral outflows, not just disruptions to financing flows.
The company’s businesses are diverse, and its liquidity
needs are determined by many factors, including market
movements, collateral requirements and client
commitments, all of which can change dramatically in a
difficult funding environment;
During a liquidity crisis, credit-sensitive funding, including
unsecured debt and some types of secured financing
agreements, may be unavailable, and the terms (e.g.,
interest rates, collateral provisions and tenor) or availability
of other types of secured financing may change; and
As a result of the company’s policy to pre-fund liquidity
that it estimates may be needed in a crisis, GSI holds more
unencumbered securities and has larger debt balances than
it would otherwise require. GSI believes that its liquidity is
stronger with greater balances of highly liquid
unencumbered securities, even though it increases total
assets and funding costs.
The company’s GCLA is distributed across asset types, issuers
and clearing agents to provide sufficient operating liquidity to
ensure timely settlement in all major markets, even in a
difficult funding environment.
The company believes that its GCLA provides a resilient
source of funds that would be available in advance of potential
cash and collateral outflows and gives significant flexibility in
managing through a difficult funding environment.
Asset-Liability Management. The company’s liquidity risk
management policies are designed to ensure it has a sufficient
amount of financing, even when funding markets experience
persistent stress. The company manages maturities and
diversity of funding across markets, products and
counterparties, and seeks to maintain a long-dated and
diversified external funding profile, taking into consideration
the characteristics and liquidity profile of its assets.

GOLDMAN SACHS INTERNATIONAL (UNLIMITED COMPANY)
Strategic Report
35
GSI’s approach to asset-liability management includes:
Conservatively managing the overall characteristics of its
funding book, with a focus on maintaining long-term,
diversified sources of funding in excess of current
requirements. See “Balance Sheet and Funding Sources –
Funding Sources” for additional details;
Actively managing and monitoring its asset base, with
particular focus on the liquidity, holding period and its
ability to fund assets on a secured basis. The company
assesses its funding requirements and its ability to liquidate
assets in a stressed environment while appropriately
managing risk. This enables the company to determine the
most appropriate funding products and tenors. See
“Balance Sheet and Funding Sources – Balance Sheet
Management” for more detail on the company’s balance
sheet management process and “– Funding Sources –
Secured Funding” for more detail on asset classes that may
be harder to fund on a secured basis; and
Raising secured and unsecured financing that has a long
tenor relative to the liquidity profile of its assets. This
reduces the risk that liabilities will come due in advance of
the company’s ability to generate liquidity from the sale of
assets. Because GSI maintains a highly liquid balance
sheet, the holding period of certain assets may be materially
shorter than their contractual maturity dates.
The company’s goal is to ensure it maintains sufficient
liquidity to fund its assets and meet its contractual and
contingent obligations in normal times as well as during
periods of market stress. Through the dynamic balance sheet
management process, actual and projected asset balances are
used to determine secured and unsecured funding
requirements. In a liquidity crisis, the company would first use
its GCLA in order to avoid reliance on asset sales (other than
its GCLA). However, the company recognises that orderly
asset sales may be prudent or necessary in a severe or
persistent liquidity crisis.
Contingency Funding Plan. GS Group maintains a
contingency funding plan, which has a GSI-specific addendum,
to provide a framework for analysing and responding to a
liquidity crisis situation or periods of market stress. The
contingency funding plan outlines a list of potential risk
factors, key reports and metrics that are reviewed on an
ongoing basis to assist in assessing the severity of, and
managing through, a liquidity crisis and/or market dislocation.
The contingency funding plan also describes the company’s
potential responses if assessments indicate that the company
has entered a liquidity crisis, which includes pre-funding for
what the company estimates will be its potential cash and
collateral needs as well as utilising secondary sources of
liquidity. Mitigants and action items to address specific risks
which may arise are also described and assigned to individuals
responsible for execution.
The contingency funding plan identifies key groups of
individuals to foster effective coordination, control and
distribution of information, all of which are critical in the
management of a crisis or period of market stress. The
contingency funding plan also details the responsibilities of
these groups and individuals, which include making and
disseminating key decisions, coordinating all contingency
activities throughout the duration of the crisis or period of
market stress, implementing liquidity maintenance activities
and managing internal and external communication.
Liquidity Stress Tests
In order to determine the appropriate size of the company’s
GCLA, an internal liquidity model is used, referred to as the
Modeled Liquidity Outflow, which captures and quantifies the
company’s liquidity risks. Other factors are considered
including, but not limited to, an assessment of potential
intraday liquidity needs through an additional internal liquidity
model, referred to as the Intraday Liquidity Model, the results
of the company’s long-term stress testing models, applicable
regulatory requirements and a qualitative assessment of the
condition of the financial markets and of the company. The
results of the Modeled Liquidity Outflow, the Intraday
Liquidity Model and the long-term stress testing models are
reported to senior management on a regular basis.

GOLDMAN SACHS INTERNATIONAL (UNLIMITED COMPANY)
Strategic Report
36
Modeled Liquidity Outflow. The Modeled Liquidity
Outflow is based on conducting multiple scenarios that include
combinations of market-wide stress and GS Group-specific
stress, characterised by the following qualitative elements:
Severely challenged market environments, including low
consumer and corporate confidence, financial and political
instability, adverse changes in market values, including
potential declines in equity markets and widening of credit
spreads; and
A GS Group-specific crisis potentially triggered by material
losses, reputational damage, litigation, executive departure,
and/or a ratings downgrade.
The following are the critical modelling parameters of the
Modeled Liquidity Outflow:
Liquidity needs over a 30-day scenario;
A two-notch downgrade of the long-term senior unsecured
credit ratings of Group Inc. and its rated subsidiaries,
including GSI;
A combination of contractual outflows, such as upcoming
maturities of unsecured debt, and contingent outflows (e.g.,
actions though not contractually required, may be deemed
necessary in a crisis). GSI assumes most contingent
outflows will occur within the initial days and weeks of a
crisis;
No issuance of equity or unsecured debt;
No asset liquidation, other than the GCLA.
The potential contractual and contingent cash and collateral
outflows covered in the Modeled Liquidity Outflow include:
External Unsecured Funding
Contractual: All upcoming maturities of unsecured long-
term debt and other unsecured funding products. GSI
assumes that it will be unable to issue new unsecured debt
or rollover any maturing debt.
Contingent: Repurchases of outstanding long-term debt and
hybrid financial instruments in the ordinary course of
business as a market maker.
Secured Funding
Contractual: A portion of upcoming contractual maturities
of secured funding due to either the inability to refinance or
the ability to refinance only at wider haircuts (i.e., on terms
which require the company to post additional collateral).
Assumptions reflect, among other factors, the quality of the
underlying collateral, counterparty roll probabilities (the
company’s assessment of the counterparty’s likelihood of
continuing to provide funding on a secured basis at the
maturity of the trade) and counterparty concentration.
Contingent: Adverse changes in value of financial assets
pledged as collateral for financing transactions, which
would necessitate additional collateral postings under those
transactions.
OTC Derivatives
Contingent: Collateral postings to counterparties due to
adverse changes in the value of the company’s OTC
derivatives, excluding those that are cleared and settled
through central counterparties (OTC-cleared).
Contingent: Other outflows of cash or collateral related to
OTC derivatives, excluding OTC-cleared, including the
impact of trade terminations, collateral substitutions,
collateral disputes, loss of rehypothecation rights, collateral
calls or termination payments required by a two-notch
downgrade in Group Inc. and/or GSI’s credit ratings, and
collateral that has not been called by counterparties, but is
available to them.
Exchange-Traded and OTC-cleared Derivatives
Contingent: Variation margin postings required due to
adverse changes in the value of outstanding exchange-
traded and OTC-cleared derivatives.
Contingent: An increase in initial margin and guarantee
fund requirements by derivative clearing houses.
Customer Cash and Securities
Contingent: Liquidity outflows associated with the
company’s prime brokerage business, including
withdrawals of customer credit balances, and a reduction in
customer short positions, which may serve as a funding
source for long positions.
Firm Securities
Contingent: Liquidity outflows associated with a reduction
or composition change in firm short positions, which may
serve as a funding source for long positions.
Unfunded Commitments
Contingent: Draws on the company’s unfunded
commitments. Draw assumptions reflect, among other
things, the type of commitment and counterparty.
Other
Other upcoming large cash outflows, such as tax payments.

GOLDMAN SACHS INTERNATIONAL (UNLIMITED COMPANY)
Strategic Report
37
Intraday Liquidity Model. The company’s Intraday
Liquidity Model measures the company’s intraday liquidity
needs using a scenario analysis characterised by the same
qualitative elements as the Modeled Liquidity Outflow. The
model assesses the risk of increased intraday liquidity
requirements during a scenario where access to sources of
intraday liquidity may become constrained.
The following are key modelling elements of the Intraday
Liquidity Model:
Liquidity needs over a one-day settlement period;
Delays in receipt of counterparty cash payments;
A reduction in the availability of intraday credit lines at the
company’s third-party clearing agents; and
Higher settlement volumes due to an increase in activity.
Long-Term Stress Testing. The company utilises a longer-
term stress test to take a forward view on its liquidity position
through a prolonged stress period in which the company
experiences a severe liquidity stress and recovers in an
environment that continues to be challenging. The company is
focused on ensuring conservative asset-liability management to
prepare for a prolonged period of potential stress, seeking to
maintain a long-dated and diversified funding profile, taking
into consideration the characteristics and liquidity profile of its
assets.
The company also runs stress tests on a regular basis as part of
its routine risk management processes and conducts tailored
stress tests on an ad hoc or product-specific basis in response
to market developments.
Model Review and Validation
Treasury regularly refines the company’s Modeled Liquidity
Outflow, Intraday Liquidity Model and stress testing models to
reflect changes in market or economic conditions and the
company’s business mix. Any changes, including model
assumptions, are assessed and approved by GS Group’s
Liquidity Risk Management function.
Model Risk Management is responsible for the independent
review and validation of the company’s liquidity models. See
“Model Risk Management” for further information about the
review and validation of these models.
Limits
The company uses liquidity limits at various levels and across
liquidity risk types to control the size of its liquidity exposures.
Limits are measured relative to acceptable levels of risk given
the liquidity risk tolerance of the company. The purpose of
these limits is to assist senior management in monitoring and
controlling the company’s overall liquidity profile.
The GSI Risk Committee approves the company’s liquidity
risk limits. Limits are reviewed frequently and amended, with
required approvals, on a permanent and temporary basis, as
appropriate, to reflect changing market or business conditions.
The company’s liquidity risk limits are monitored by Treasury
and GS Group’s Liquidity Risk Management. Treasury is
responsible for identifying and escalating, on a timely basis,
instances where limits have been exceeded.
GCLA and Unencumbered Metrics
GCLA. Based on the results of the company’s internal
liquidity risk models, described above, as well as consideration
of other factors including, but not limited to, an assessment of
the company’s potential intraday liquidity needs and a
qualitative assessment of the condition of the financial markets
and the company, the company believes its liquidity position as
of both December 2015 and December 2014 was appropriate.
As of December 2015 and December 2014, the fair value of the
securities and certain overnight cash deposits included in GSI’s
GCLA totalled $59.42 billion and $54.20 billion, respectively,
and the fair value of these assets averaged $57.22 billion for
2015 and $49.90 billion for 2014.
The table below presents the fair value of the company’s
GCLA by asset class.
Average for the
Year Ended December
$ in millions 2015 2014
Overnight cash deposits $ 3,412 $ 906
U.S. government obligations 19,308 15,322
French government obligations 10,769 9,073
U.K. government obligations 13,425 15,614
German government obligations 7,488 6,896
Japanese government obligations 2,813 2,086
Total $57,215 $49,897
The company strictly limits its GCLA to the following
narrowly defined list of securities and cash because they are
highly liquid, even in a difficult funding environment: (i)
unencumbered U.S. government obligations; (ii)
unencumbered German, French, Japanese and U.K.
government obligations; and (iii) certain overnight cash
deposits in U.S. dollars and other highly liquid currencies. The
company does not include other potential sources of excess
liquidity, such as less liquid unencumbered securities or
committed credit facilities, in the GCLA.
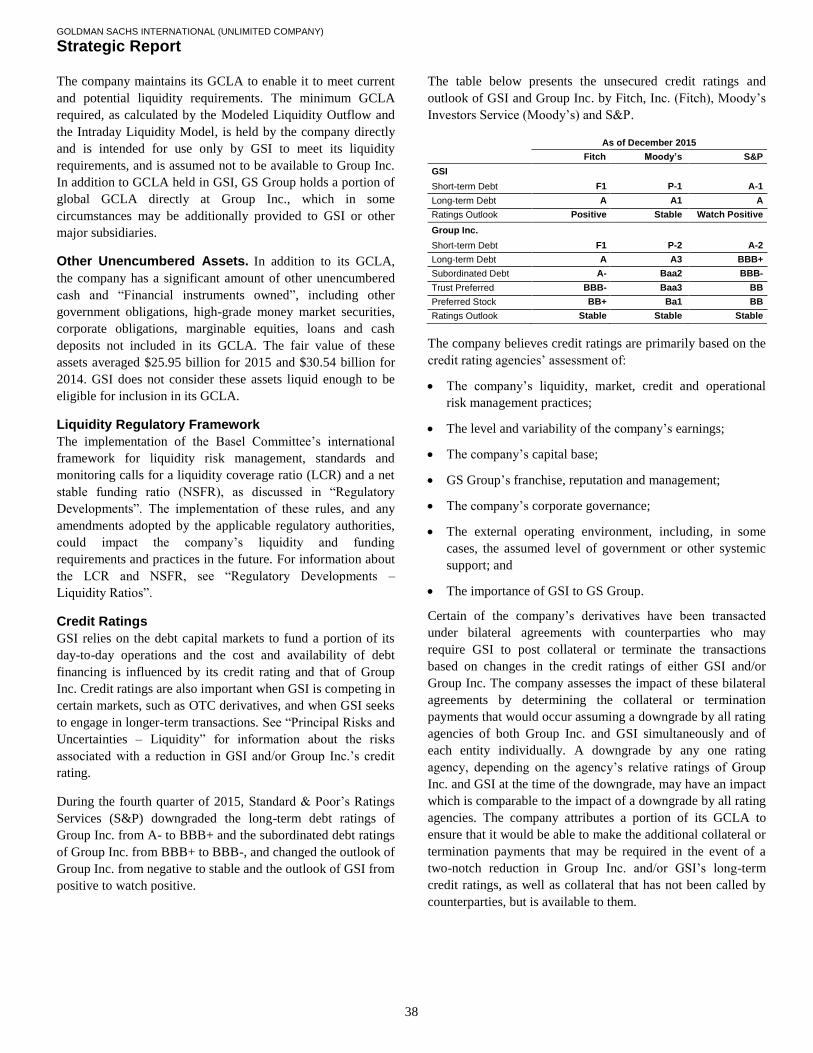
GOLDMAN SACHS INTERNATIONAL (UNLIMITED COMPANY)
Strategic Report
38
The company maintains its GCLA to enable it to meet current
and potential liquidity requirements. The minimum GCLA
required, as calculated by the Modeled Liquidity Outflow and
the Intraday Liquidity Model, is held by the company directly
and is intended for use only by GSI to meet its liquidity
requirements, and is assumed not to be available to Group Inc.
In addition to GCLA held in GSI, GS Group holds a portion of
global GCLA directly at Group Inc., which in some
circumstances may be additionally provided to GSI or other
major subsidiaries.
Other Unencumbered Assets. In addition to its GCLA,
the company has a significant amount of other unencumbered
cash and “Financial instruments owned”, including other
government obligations, high-grade money market securities,
corporate obligations, marginable equities, loans and cash
deposits not included in its GCLA. The fair value of these
assets averaged $25.95 billion for 2015 and $30.54 billion for
2014. GSI does not consider these assets liquid enough to be
eligible for inclusion in its GCLA.
Liquidity Regulatory Framework
The implementation of the Basel Committee’s international
framework for liquidity risk management, standards and
monitoring calls for a liquidity coverage ratio (LCR) and a net
stable funding ratio (NSFR), as discussed in “Regulatory
Developments”. The implementation of these rules, and any
amendments adopted by the applicable regulatory authorities,
could impact the company’s liquidity and funding
requirements and practices in the future. For information about
the LCR and NSFR, see “Regulatory Developments –
Liquidity Ratios”.
Credit Ratings
GSI relies on the debt capital markets to fund a portion of its
day-to-day operations and the cost and availability of debt
financing is influenced by its credit rating and that of Group
Inc. Credit ratings are also important when GSI is competing in
certain markets, such as OTC derivatives, and when GSI seeks
to engage in longer-term transactions. See “Principal Risks and
Uncertainties – Liquidity” for information about the risks
associated with a reduction in GSI and/or Group Inc.’s credit
rating.
During the fourth quarter of 2015, Standard & Poor’s Ratings
Services (S&P) downgraded the long-term debt ratings of
Group Inc. from A- to BBB+ and the subordinated debt ratings
of Group Inc. from BBB+ to BBB-, and changed the outlook of
Group Inc. from negative to stable and the outlook of GSI from
positive to watch positive.
The table below presents the unsecured credit ratings and
outlook of GSI and Group Inc. by Fitch, Inc. (Fitch), Moody’s
Investors Service (Moody’s) and S&P.
As of December 2015
Fitch Moody’s S&P
GSI
Short-term Debt F1 P-1 A-1
Long-term Debt A A1 A
Ratings Outlook Positive Stable Watch Positive
Group Inc.
Short-term Debt F1 P-2 A-2
Long-term Debt A A3 BBB+
Subordinated Debt A- Baa2 BBB-
Trust Preferred BBB- Baa3 BB
Preferred Stock BB+ Ba1 BB
Ratings Outlook Stable Stable Stable
The company believes credit ratings are primarily based on the
credit rating agencies’ assessment of:
The company’s liquidity, market, credit and operational
risk management practices;
The level and variability of the company’s earnings;
The company’s capital base;
GS Group’s franchise, reputation and management;
The company’s corporate governance;
The external operating environment, including, in some
cases, the assumed level of government or other systemic
support; and
The importance of GSI to GS Group.
Certain of the company’s derivatives have been transacted
under bilateral agreements with counterparties who may
require GSI to post collateral or terminate the transactions
based on changes in the credit ratings of either GSI and/or
Group Inc. The company assesses the impact of these bilateral
agreements by determining the collateral or termination
payments that would occur assuming a downgrade by all rating
agencies of both Group Inc. and GSI simultaneously and of
each entity individually. A downgrade by any one rating
agency, depending on the agency’s relative ratings of Group
Inc. and GSI at the time of the downgrade, may have an impact
which is comparable to the impact of a downgrade by all rating
agencies. The company attributes a portion of its GCLA to
ensure that it would be able to make the additional collateral or
termination payments that may be required in the event of a
two-notch reduction in Group Inc. and/or GSI’s long-term
credit ratings, as well as collateral that has not been called by
counterparties, but is available to them.

GOLDMAN SACHS INTERNATIONAL (UNLIMITED COMPANY)
Strategic Report
39
The table below presents the additional collateral or
termination payments related to the company’s net derivative
liabilities under bilateral agreements that could have been
called at the reporting date by counterparties in the event of a
one-notch and two-notch downgrade in Group Inc. and/or
GSI’s credit ratings.
As of December
$ in millions 2015 2014
Additional collateral or termination
payments for a one-notch downgrade $ 401 $ 294
Additional collateral or termination
payments for a two-notch downgrade 1,457 1,295
Cash Flows
As a financial institution, the company’s cash flows are
complex and bear little relation to the company’s profitability
and net assets. Consequently, the company believes that
traditional cash flow analysis is less meaningful in evaluating
its liquidity position than the liquidity and asset-liability
management policies described above. Cash flow analysis
may, however, be helpful in highlighting certain macro trends
and strategic initiatives in the company’s businesses.
The statements of cash flows are set out on page 56 of this
annual report.
Year Ended December 2015. The company’s cash and
cash equivalents increased by $6.82 billion to $9.97 billion at
the end of 2015. The company generated $2.49 billion in net
cash from operating activities, and generated $4.33 billion in
net cash from financing activities due to the issuance of long-
term subordinated loans and ordinary share capital.
Year Ended December 2014. The company’s cash and
cash equivalents decreased by $235 million to $3.58 billion at
the end of 2014.
Maturity of Financial Liabilities
See Note 27 to the financial statements for a maturity analysis
of the company’s financial liabilities.
Market Risk Management
Overview (Audited)
Market risk is the risk of loss in the value of the company’s
inventory, as well as certain other financial assets and financial
liabilities, due to changes in market conditions. The company
employs a variety of risk measures, each described in the
respective sections below, to monitor market risk. The
company holds inventory primarily for market making for
clients. The company’s inventory therefore changes based on
client demands. The company’s inventory is accounted for at
fair value and therefore fluctuates on a daily basis, with the
related gains and losses included in net revenues. Categories of
market risk include the following:
Interest rate risk: results from exposures to changes in the
level, slope and curvature of yield curves, the volatilities of
interest rates, mortgage prepayment speeds and credit
spreads;
Equity price risk: results from exposures to changes in
prices and volatilities of individual equities, baskets of
equities and equity indices;
Currency rate risk: results from exposures to changes in
spot prices, forward prices and volatilities of currency rates;
and
Commodity price risk: results from exposures to changes in
spot prices, forward prices and volatilities of commodities,
such as crude oil and metals.
Managers in revenue-producing units are accountable for
managing risk within prescribed limits, both at the GS Group
and GSI level. These managers have in-depth knowledge of
their positions, markets and the instruments available to hedge
their exposures.
Market Risk Management, which is independent of the
revenue-producing units and reports to the GS Group chief risk
officer, has primary responsibility for assessing, monitoring
and managing market risk. Risks are monitored and controlled
through strong oversight and independent control and support
functions across the global businesses.
Managers in revenue-producing units and Market Risk
Management discuss market information, positions and
estimated risk and loss scenarios on an ongoing basis.

GOLDMAN SACHS INTERNATIONAL (UNLIMITED COMPANY)
Strategic Report
40
Market Risk Management Process (Audited)
The company manages market risk by diversifying exposures,
controlling position sizes and establishing economic hedges in
related securities or derivatives. This process includes:
Accurate and timely exposure information incorporating
multiple risk metrics;
A dynamic limit setting framework; and
Constant communication among revenue-producing units,
risk managers and senior management.
GSI’s framework for managing market risk is consistent with,
and part of, the GS Group framework, and results are analysed
by business and in aggregate, at both the GS Group and GSI
level.
Risk Measures. Market Risk Management produces risk
measures and monitors them against market risk limits set by
the GSI Risk Committee. These measures reflect an extensive
range of scenarios and the results are aggregated by business at
the company level.
A variety of risk measures are used to estimate the size of
potential losses for both moderate and more extreme market
moves over both short-term and long-term time horizons.
Primary risk measures are VaR, used for shorter-term periods,
and stress tests. The GSI risk report details key risks, drivers
and changes for each business, and is distributed daily to senior
management of both the revenue-producing units and
independent control and support functions.
Value-at-Risk. VaR is the potential loss in value due to
adverse market movements over a defined time horizon with a
specified confidence level. A one-day time horizon with a 95%
confidence level is typically employed. The VaR model is a
single model that captures risks including interest rates, equity
prices, currency rates and commodity prices. As such, VaR
facilitates comparison across portfolios of different risk
characteristics. VaR also captures the diversification of
aggregated risk across GSI.
There are inherent limitations to VaR and therefore a variety of
risk measures are used in the market risk management process.
Inherent limitations to VaR include:
VaR does not estimate potential losses over longer time
horizons where moves may be extreme;
VaR does not take account of the relative liquidity of
different risk positions; and
Previous moves in market risk factors may not produce
accurate predictions of all future market moves.
When calculating VaR, historical simulations with full
valuation of approximately 70,000 market factors are used.
VaR is calculated at a position level based on simultaneously
shocking the relevant market risk factors for that position. A
sample from five years of historical data is taken to generate
the scenarios for the VaR calculation. The historical data is
weighted so that the relative importance of the data reduces
over time. This gives greater importance to more recent
observations and reflects current asset volatilities, which
improves the accuracy of estimates of potential loss. As a
result, even if positions included in VaR were unchanged, VaR
would increase with increasing market volatility and vice
versa.
Given its reliance on historical data, VaR is most effective in
estimating risk exposures in markets in which there are no
sudden fundamental changes or shifts in market conditions.
The VaR measure does not include:
Positions that are best measured and monitored using
sensitivity measures; and
The impact of changes in counterparty and GS Group’s
credit spreads on derivatives, as well as changes in GS
Group’s credit spreads on unsecured borrowings, which are
designated at fair value through profit or loss.
The VaR model is applied consistently across GS Group,
including GSI. Daily backtesting of the VaR model is
performed (i.e., comparing daily trading net revenues to the
VaR measure calculated as of the prior business day) at the GS
Group and GSI level and for each of GS Group’s businesses.
Stress Testing. Stress testing is a method of determining the
effect on GS Group of various hypothetical stress scenarios.
GS Group uses stress testing to examine risks of specific
portfolios as well as the potential impact of significant risk
exposures across GS Group, and the impact specifically on
GSI. A variety of stress testing techniques to calculate the
potential loss from a wide range of market moves on GSI’s
portfolios are used, including sensitivity analysis, scenario
analysis and GSI stress tests. The results of the various stress
tests are analysed together for risk management purposes.
Sensitivity analysis is used to quantify the impact of a market
move in a single risk factor across all positions (e.g., equity
prices or credit spreads) using a variety of defined market
shocks, ranging from those that could be expected over a one-
day time horizon up to those that could take many months to
occur. Sensitivity analysis is also used to quantify the impact
of the default of any single entity, which captures the risk of
large or concentrated exposures.
GOLDMAN SACHS INTERNATIONAL (UNLIMITED COMPANY)
Strategic Report
41
Scenario analysis is used to quantify the impact of a specified
event, including how the event impacts multiple risk factors
simultaneously. For example, for sovereign stress testing GSI
calculates potential direct exposure associated with its
sovereign inventory as well as the corresponding debt, equity
and currency exposures associated with its non-sovereign
inventory that may be impacted by the sovereign distress.
When conducting scenario analysis, a number of possible
outcomes are typically considered for each scenario, ranging
from moderate to severely adverse market impacts. In
addition, these stress tests are constructed using both historical
events and forward-looking hypothetical scenarios.
Stress testing across GS Group and GSI combines market,
credit, operational and liquidity risks into a single combined
scenario. Stress tests are primarily used to assess capital
adequacy as part of the capital planning and stress testing
process; however, it is also ensured that stress testing is
integrated into the risk governance framework. This includes
selecting appropriate scenarios to use for the capital planning
and stress testing process.
Unlike VaR measures, which have an implied probability
because they are calculated at a specified confidence level,
there is generally no implied probability that GS Group’s stress
test scenarios will occur. Instead, stress tests are used to model
both moderate and more extreme moves in underlying market
factors. When estimating potential loss, it is generally assumed
that positions cannot be reduced or hedged (although
experience demonstrates that the company is generally able to
do so).
Stress test scenarios are conducted on a regular basis as part of
the routine risk management process and on an ad hoc basis in
response to market events or concerns. Stress testing is an
important part of the risk management process because it
allows the company to quantify its exposure to tail risks,
highlight potential loss concentrations, undertake risk/reward
analysis and assess and mitigate its risk positions.
Limits. Risk limits are used at various levels in GS Group
(including entity, business and product) to govern risk appetite
by controlling the size of its exposures to market risk. Limits
for GSI are set based on VaR and on a range of stress tests
relevant to the company’s exposures. Limits are reviewed
frequently and amended on a permanent or temporary basis to
reflect changing market conditions, business conditions or
tolerance for risk.
The GSI Risk Committee sets market risk limits for the
company at an overall, business and product level. The purpose
of the limits is to assist senior management in controlling the
overall risk profile. Business level limits are designed to set the
desired maximum amount of exposure that may be managed by
any particular business on a day-to-day basis without
additional levels of senior management approval, effectively
leaving day-to-day trading decisions to individual desk
managers and traders. Accordingly, business level limits are a
management tool designed to ensure appropriate escalation
rather than to establish maximum risk tolerance. Business level
limits also distribute risk among various businesses in a
manner that is consistent with their level of activity and client
demand, taking into account the relative performance of each
area.
Market risk limits are monitored daily by Market Risk
Management, which is responsible for identifying and
escalating, on a timely basis, instances where limits have been
exceeded. The limits that are set by the GSI Risk Committee
are subject to the same scrutiny and limit escalation policy as
the GS Group limits.
When a risk limit has been exceeded (e.g., due to changes in
market conditions, such as increased volatilities or changes in
correlations), it is escalated to the GSI Risk Committee and
remediated by an inventory reduction and/or a temporary or
permanent increase to the risk limit.
Model Review and Validation
The VaR and stress testing models are regularly reviewed by
Market Risk Management and enhanced in order to incorporate
changes in the composition of positions included in market risk
measures, as well as variations in market conditions. Prior to
implementing significant changes to assumptions and/or
models, Model Risk Management performs model validations.
Significant changes to the VaR and stress testing models are
reviewed with GS Group’s chief risk officer and chief financial
officer, as well as approved by GS Group’s Firmwide Risk
Committee and, where appropriate, the GSI Risk Committee.
See “Model Risk Management” for further information about
the review and validation of these models.

GOLDMAN SACHS INTERNATIONAL (UNLIMITED COMPANY)
Strategic Report
42
Systems
GS Group has made a significant investment in technology to
monitor market risk including:
An independent calculation of VaR and stress measures;
Risk measures calculated at individual position levels;
Attribution of risk measures to individual risk factors of
each position;
The ability to report many different views of the risk
measures (e.g., by desk, business, product type or legal
entity); and
The ability to produce ad hoc analyses in a timely manner.
Metrics
The tables below present, by risk category, average daily VaR
and period-end VaR, as well as the high and low VaR for the
period. Diversification effect in the tables below represents the
difference between total VaR and the sum of the VaRs for the
four risk categories. This effect arises because the four market
risk categories are not perfectly correlated.
The table below presents average daily VaR.
$ in millions Year Ended December
Risk Categories 2015 2014
Interest rates $ 22 $ 19
Equity prices 17 18
Currency rates 8 5
Commodity prices 1 –
Diversification effect (17) (12)
Total $ 31 $ 30
The company’s average daily VaR increased to $31 million in
2015 from $30 million in 2014, primarily reflecting an increase
in the interest rates category due to higher market volatility and
an increase in the currency rates category due to increased
exposures. These increases were partially offset by an increase
in the diversification benefit across risk categories.
The table below presents period-end VaR, and high and low
VaR.
Year Ended
$ in millions As of December December 2015
Risk Categories 2015 2014 High Low
Interest rates $ 23 $ 27 $28 $17
Equity prices 14 11 45 10
Currency rates 13 4 32 3
Commodity prices 1 1 2 –
Diversification effect (23) (15)
Total $ 28 $ 28 $48 $22
The company’s daily VaR was $28 million as of December
2015, unchanged compared to December 2014, primarily
reflecting an increase in the currency rates category due to
increased exposure, offset by an increase in the diversification
benefit across risk categories.
During 2015, the company’s VaR risk limit was temporarily
raised on one occasion in order to facilitate a client transaction.
Separately, in June 2015, the company’s VaR risk limit was
reduced, reflecting lower risk utilisation over the last year.
During 2014, the company’s VaR risk limit was not exceeded,
raised or reduced.
Sensitivity Measures
Certain portfolios and individual positions are not included in
VaR because VaR is not the most appropriate risk measure for
these positions.
10% Sensitivity Measures. The table below presents
market risk for inventory positions that are not included in
VaR. The market risk of these positions is determined by
estimating the potential reduction in net revenues of a 10%
decline in the underlying asset value.
$ in millions As of December
Asset Categories 2015 2014
Equity $10.8 $16.0
Debt 0.3 0.3
Total $11.1 $16.3
The company’s 10% sensitivity measures decreased to $11.1
million as of December 2015 from $16.3 million as of
December 2014, reflecting a decrease in the equity asset
category due to a decrease in private equity securities.

GOLDMAN SACHS INTERNATIONAL (UNLIMITED COMPANY)
Strategic Report
43
Credit Risk Management
Overview (Audited)
Credit risk represents the potential for loss due to the default or
deterioration in credit quality of a counterparty (e.g., an OTC
derivatives counterparty or a borrower) or an issuer of
securities or other instruments the company holds. The
company’s exposure to credit risk comes mostly from client
transactions in OTC derivatives. Credit risk also comes from
cash placed with banks, securities financing transactions (i.e.,
resale and repurchase agreements and securities borrowing and
lending activities) and debtors.
Credit Risk Management, which is independent of the
revenue-producing units and reports to GS Group’s chief risk
officer, has primary responsibility for assessing, monitoring
and managing credit risk. GSI’s framework for managing
credit risk is consistent with the framework of GS Group. GS
Group’s Credit Policy Committee and Firmwide Risk
Committee establish and review credit policies and parameters
for GS Group as a whole. In addition, the company holds other
positions that give rise to credit risk, (e.g., bonds held in
inventory). These credit risks are captured as a component of
market risk measures, which are monitored and managed by
Market Risk Management, consistent with other inventory
positions. The company also enters into derivatives to manage
market risk exposures. Such derivatives also give rise to credit
risk which is monitored and managed by Credit Risk
Management.
Credit Risk Management Process (Audited)
Effective management of credit risk requires accurate and
timely information, a high level of communication and
knowledge of customers, countries, industries and products.
The process for managing credit risk includes:
Approving transactions and setting and communicating
credit exposure limits;
Monitoring compliance with established credit exposure
limits;
Assessing the likelihood that a counterparty will default on
its payment obligations;
Measuring the company’s current and potential credit
exposure and losses resulting from counterparty default;
Reporting of credit exposures to senior management, the
GSI board of directors and regulators;
Use of credit risk mitigants, including collateral and
hedging; and
Communication and collaboration with other independent
control and support functions such as operations, legal and
compliance.
As part of the risk assessment process, Credit Risk
Management performs credit reviews which include initial and
ongoing analyses of the company’s counterparties. For
substantially all of the company’s credit exposures, the core of
the process is an annual counterparty credit review. A credit
review is an independent analysis of the capacity and
willingness of a counterparty to meet its financial obligations,
resulting in an internal credit rating. The determination of
internal credit ratings also incorporates assumptions with
respect to the nature of and outlook for the counterparty’s
industry, and the economic environment. Senior personnel
within Credit Risk Management, with expertise in specific
industries, inspect and approve credit reviews and internal
credit ratings.
The global credit risk management systems capture credit
exposure to individual counterparties and on an aggregate basis
to counterparties and their subsidiaries (economic groups).
These systems also provide management with comprehensive
information on aggregate credit risk by product, internal credit
rating, industry, country and region.
Risk Measures and Limits
Credit risk is measured based on the potential loss in the event
of non-payment by a counterparty using current and potential
exposure. For derivatives and securities financing transactions,
current exposure represents the amount presently owed to the
company after taking into account applicable netting and
collateral arrangements while potential exposure represents the
company’s estimate of the future exposure that could arise over
the life of a transaction based on market movements within a
specified confidence level. Potential exposure also takes into
account netting and collateral arrangements.
Credit limits are used at various levels (counterparty, economic
group, industry, country) to control the size of the company’s
credit exposures. Limits for counterparties and economic
groups are reviewed regularly and revised to reflect changing
risk appetites for a given counterparty or group of
counterparties. Limits for industries and countries are based on
the company’s risk tolerance and are designed to allow for
regular monitoring, review, escalation and management of
credit risk concentrations. GS Group’s Risk Committee of the
Board and Firmwide Risk Committee approve credit risk limits
at the GS Group and business level. The GSI Risk Committee
approves the framework that governs the setting of credit risk
limits at the GSI level, which is delegated to the GSI Credit
Committee. Credit Risk Management sets credit limits for
individual counterparties, economic groups, industries and
countries. Policies authorised by GS Group’s Firmwide Risk
Committee and Credit Policy Committee prescribe the level of
formal approval required for GS Group to assume credit
exposure to a counterparty across all product areas, taking into
account any applicable netting provisions, collateral or other
credit risk mitigants.
GOLDMAN SACHS INTERNATIONAL (UNLIMITED COMPANY)
Strategic Report
44
Stress Tests
Regular stress tests are used to calculate the credit exposures,
including potential concentrations that would result from
applying shocks to counterparty credit ratings or credit risk
factors (e.g., currency rates, interest rates, equity prices). These
shocks include a wide range of moderate and more extreme
market movements. Some of the stress tests include shocks to
multiple risk factors, consistent with the occurrence of a severe
market or economic event. In the case of sovereign default,
Credit Risk Management estimates the direct impact of the
default on the company’s credit exposures, changes to the
company’s credit exposures arising from potential market
moves in response to the default, and the impact of credit
market deterioration on corporate borrowers and counterparties
that may result from the sovereign default. Unlike potential
exposure, which is calculated within a specified confidence
level, with a stress test there is generally no assumed
probability of these events occurring.
Stress tests are run on a regular basis as part of the company’s
routine risk management processes and the company conducts
tailored stress tests on an ad hoc basis in response to market
developments. Stress tests are regularly conducted jointly with
the company’s market and liquidity risk functions.
Model Review and Validation
The company’s potential credit exposure and stress testing
models, and any changes to such models or assumptions, are
reviewed and independently validated by Model Risk
Management. See “Model Risk Management” for further
information about the review and validation of these models.
Risk Mitigants
To reduce credit exposures on derivatives and securities
financing transactions, the company may enter into netting
agreements with counterparties that permit it to offset
receivables and payables with such counterparties. The
company may also reduce credit risk with counterparties by
entering into agreements that enable it to obtain collateral from
them on an upfront or contingent basis and/or terminate
transactions if the counterparty’s credit rating falls below a
specified level. The company monitors the fair value of the
collateral on a daily basis to ensure that credit exposures are
appropriately collateralised. The company seeks to minimise
exposures where there is a significant positive correlation
between the creditworthiness of counterparties and the market
value of collateral received.
When the company does not have sufficient visibility into a
counterparty’s financial strength or when it believes a
counterparty requires support from its parent company, the
company may obtain third party guarantees of the
counterparty’s obligations. The company may also mitigate its
credit risk using credit derivatives.
Credit Exposures (Audited)
GSI’s credit exposures are described further below.
Financial Instruments Owned. Financial instruments
owned includes cash instruments and derivatives. The
company’s credit exposure on derivatives arises primarily from
market-making activities. As a market maker, the company
enters into derivative transactions to provide liquidity to clients
and to facilitate the transfer and hedging of their risks. The
company also enters into derivatives to manage market risk
exposures. In the table below cash instruments are included in
the gross exposure; however, to the extent that they have been
captured by market risk they are removed to arrive at net credit
exposure. Derivatives are reported at fair value on a gross by
counterparty basis in the company’s financial statements unless
it has current legal right of set-off and also intends to settle on
a net basis. OTC derivatives are risk managed using the risk
processes, measures and limits described above.
Collateralised Agreements. The company bears credit risk
related to collateralised agreements only to the extent that cash
advanced to the counterparty exceeds the value of the collateral
received. The company’s credit exposure on these transactions
is therefore significantly lower than the amounts recorded on
the balance sheet, which represent fair values or contractual
value before consideration of collateral received. The company
also has credit exposure on collateralised financings, which are
liabilities on its balance sheet, to the extent that the value of
collateral pledged to the counterparty for these transactions
exceeds the amount of cash or collateral received.
Debtors. The company is exposed to credit risk from its
debtors through its amounts due from broker/dealers and
customers; and amounts due from parent and group
undertakings. These primarily comprise receivables related to
cash collateral paid to counterparties and clearing organisations
in respect of derivative financial instrument liabilities. Debtors
also includes collateralised receivables related to customer
securities transactions, which generally have minimal credit
risk due to both the value of the collateral received and the
short-term nature of these receivables.
Cash at Bank and in Hand. Cash at bank and in hand
include both interest-bearing and non-interest-bearing deposits.
To mitigate the risk of credit loss, the company places
substantially all of its deposits with highly-rated banks and
central banks.

GOLDMAN SACHS INTERNATIONAL (UNLIMITED COMPANY)
Strategic Report
45
The tables below present the company’s gross credit exposure
to financial assets and net credit exposure after taking account
of assets captured by market risk in the company’s risk
management process, counterparty netting (i.e., the netting of
financial assets and financial liabilities for a given counterparty
when a legal right of setoff exists under an enforceable netting
agreement), and cash and security collateral received and cash
collateral posted under credit support agreements, which
management considers when determining credit risk. This is
presented by financial asset class and by credit rating
equivalent (internally determined public rating agency
equivalents).
In the tables below, cash collateral and security collateral are
slightly higher than the amounts disclosed in Note 28 to the
financial statements as the below disclosure includes additional
cash and security collateral that management considers when
determining credit risk.
As of December 2015
Assets
captured Security
$ in millions Gross by market Counterparty Cash collateral Net credit
Financial Asset Class exposure risk netting collateral received exposure
Financial instruments owned $616,054 $(62,850) $(474,519) $(43,121) $ (13,946) $21,618
Collateralised agreements 163,703 – (48,219) – (112,523) 2,961
Debtors 59,874 – (542) (32,202) (7,900) 19,230
Cash at bank and in hand 9,974 – – – – 9,974
Total $849,605 $(62,850) $(523,280) $(75,323) $(134,369) $53,783
As of December 2014
Assets
captured Security
$ in millions Gross by market Counterparty Cash collateral Net credit
Financial Asset Class exposure risk netting collateral received exposure
Financial instruments owned $693,748 $(63,024) $(549,166) $(43,040) $ (10,970) $27,548
Collateralised agreements 203,516 – (88,761) – (109,490) 5,265
Debtors 66,060 – (602) (28,928) (8,903) 27,627
Cash at bank and in hand 3,586 – – – – 3,586
Total1 $966,910 $(63,024) $(638,529) $(71,968) $(129,363) $64,026
As of December 2015
Assets
captured Security
$ in millions Gross by market Counterparty Cash collateral Net credit
Credit Rating Equivalent exposure risk netting collateral received exposure
AAA/Aaa $ 15,024 $ – $ (2,944) $ (2,385) $ (2,195) $ 7,500
AA/Aa2 120,851 – (53,752) (18,425) (33,236) 15,438
A/A2 530,383 – (415,540) (30,443) (69,077) 15,323
BBB/Baa2 77,943 – (41,552) (15,834) (11,334) 9,223
BB/Ba2 or lower 38,302 – (9,386) (8,140) (17,536) 3,240
Unrated 67,102 (62,850) (106) (96) (991) 3,059
Total $849,605 $(62,850) $(523,280) $(75,323) $(134,369) $53,783
As of December 2014
Assets
captured Security
$ in millions Gross by market Counterparty Cash collateral Net credit
Credit Rating Equivalent exposure risk netting collateral received exposure
AAA/Aaa $ 7,632 $ – $ (3,392) $ (1,790) $ (287) $ 2,163
AA/Aa2 123,147 – (57,999) (17,350) (33,321) 14,477
A/A2 636,730 – (514,027) (28,606) (67,402) 26,695
BBB/Baa2 90,441 – (50,961) (15,706) (13,050) 10,724
BB/Ba2 or lower 40,000 – (12,045) (8,407) (13,830) 5,718
Unrated 68,960 (63,024) (105) (109) (1,473) 4,249
Total1 $966,910 $(63,024) $(638,529) $(71,968) $(129,363) $64,026
1. During the year, the company revised its approach for the disclosure of credit risk mitigants for the current and previous periods to align it more closely with
management’s view of the company’s credit risk on financial assets, giving consideration to the expected enforceability of collateral arrangements.
GOLDMAN SACHS INTERNATIONAL (UNLIMITED COMPANY)
Strategic Report
46
The unrated net credit exposure of $3.06 billion and $4.25
billion as of December 2015 and December 2014, respectively,
relates to financial assets for which the company has not
assigned an internally determined public rating agency
equivalent.
In addition to credit risk on financial assets, the company also
has credit exposure in respect of contingent and forward
starting resale and securities borrowing agreements. The
company’s gross credit exposure related to these activities is
$29.28 billion and $34.57 billion as of December 2015 and
December 2014, respectively. However, this will be mitigated
by collateral of approximately $29.21 billion and $33.77
billion as of December 2015 and December 2014, respectively,
if these commitments are fulfilled. As a result, the company’s
net credit exposure to these commitments was $64 million and
$804 million as of December 2015 and December 2014,
respectively.
As of December 2015 and December 2014, financial assets
past due or impaired were not material.
Operational Risk Management
Overview (Audited)
Operational risk is the risk of loss resulting from inadequate or
failed internal processes, people and systems or from external
events. Exposure to operational risk arises from routine
processing errors as well as extraordinary incidents, such as
major systems failures. Potential types of loss events related to
internal and external operational risk include:
Clients, products and business practices;
Execution, delivery and process management;
Business disruption and system failures;
Employment practices and workplace safety;
Damage to physical assets;
Internal fraud; and
External fraud.
GSI’s framework for managing operational risk is fully
integrated in GS Group’s comprehensive control framework
designed to provide a well-controlled environment to minimise
operational risks. In GSI, the EMEA Operational Risk
Committee provides regional oversight for ongoing
development and implementation of the operational risk
framework and promotion of a robust overall control
environment. Operational Risk Management is a risk
management function independent of revenue-producing units,
reports to GS Group’s chief risk officer, and is responsible for
developing and implementing policies, methodologies and a
formalised framework for operational risk management with
the goal of minimising exposure to operational risk.
Operational Risk Management Process (Audited)
Managing operational risk requires timely and accurate
information as well as a strong control culture. Operational risk
is managed through:
Training, supervision and development of people;
Active participation of senior management in identifying
and mitigating key operational risks;
Independent control and support functions that monitor
operational risk on a daily basis, and implementation of
extensive policies and procedures, and controls designed to
prevent the occurrence of operational risk events;
Proactive communication between revenue-producing units
and independent control and support functions; and
A network of systems throughout GS Group, including
GSI, to facilitate the collection of data used to analyse and
assess operational risk exposure.

GOLDMAN SACHS INTERNATIONAL (UNLIMITED COMPANY)
Strategic Report
47
Top-down and bottom-up approaches are combined to manage
and measure operational risk. From a top-down perspective,
senior management assesses firmwide and business-level
operational risk profiles. From a bottom-up perspective,
revenue-producing units and independent control and support
functions are responsible for risk management on a day-to-day
basis, including identifying, mitigating, and escalating
operational risks to senior management.
The operational risk framework is in part designed to comply
with the operational risk measurement rules under Basel III
and has evolved based on the changing needs of the company’s
businesses and regulatory guidance. The framework comprises
the following practices:
Risk identification and reporting;
Risk measurement; and
Risk monitoring.
Internal Audit performs an independent review of the
operational risk framework, including key controls, processes
and applications, on an annual basis to assess the effectiveness
of the framework.
Risk Identification and Reporting
The core of the operational risk management framework is risk
identification and reporting. A comprehensive data collection
process is in place, including firmwide policies and procedures,
for operational risk events.
Policies are in place that require managers in the revenue-
producing units and independent control and support functions
to escalate operational risk events. When operational risk
events are identified, policies require that the events be
documented and analysed to determine whether changes are
required in the systems and/or processes to further mitigate the
risk of future events.
Thresholds have been established to monitor the impact of an
operational risk event, including single loss events and
cumulative losses over a twelve-month period, as well as
escalation protocols. If incidents breach escalation thresholds,
respective operational risk reports are provided to senior
management, EMEA Risk Committee and GS Group’s Risk
Committee of the Board.
In addition, firmwide systems capture internal operational risk
event data, key metrics such as transaction volumes, and
statistical information such as performance trends. An
internally-developed operational risk management application
is used to aggregate and organise this information. Managers
from both revenue-producing units and independent control
and support functions analyse the information to evaluate
operational risk exposures and identify businesses, activities or
products with heightened levels of operational risk. Periodic
operational risk reports are provided to senior management, the
GSI Risk Committee and the GSI board of directors.
Risk Measurement
GSI’s operational risk exposure is measured over a twelve-
month time horizon using both statistical modelling and
scenario analyses, which involve qualitative assessments of the
potential frequency and extent of potential operational risk
losses, for each of GSI’s businesses. Operational risk
measurement incorporates qualitative and quantitative
assessments of factors including:
Internal and external operational risk event data;
Assessments of GSI’s internal controls;
Evaluations of the complexity of GSI’s business activities;
The degree of and potential for automation in GSI’s
processes;
New product information;
The legal and regulatory environment;
Changes in the markets for GSI’s products and services,
including the diversity and sophistication of GSI’s
customers and counterparties; and
The liquidity of the capital markets and the reliability of the
infrastructure that supports the capital markets.
The results from these scenario analyses are used to monitor
changes in operational risk and to determine business lines that
may have heightened exposure to operational risk. These
analyses ultimately are used in the determination of the
appropriate level of operational risk capital to hold.
Risk Monitoring
Changes in the operational risk profile of GSI, including
changes in business mix or jurisdictions in which GSI operates,
are evaluated by monitoring the factors noted above at the
company level. GSI has both detective and preventive internal
controls, which are designed to reduce the frequency and
severity of operational risk losses and the probability of
operational risk events. The company monitors the results of
assessments and independent internal audits of these internal
controls.
Model Review and Validation
The statistical models utilised by Operational Risk
Management are subject to independent review and validation
by Model Risk Management. See “Model Risk Management”
for further information about the review and validation of these
models.

GOLDMAN SACHS INTERNATIONAL (UNLIMITED COMPANY)
Strategic Report
48
Model Risk Management
Overview (Audited)
Model risk is the potential for adverse consequences from
decisions made based on model outputs that may be incorrect
or used inappropriately. GS Group relies on quantitative
models across its business activities primarily to value certain
financial assets and liabilities, to monitor and manage its risk,
and to measure and monitor its regulatory capital.
GSI’s framework for managing model risk is consistent with
and part of GS Group’s framework. GS Group’s model risk
management framework is managed through a governance
structure and risk management controls, which encompass
standards designed to ensure it maintains a comprehensive
model inventory, including risk assessment and classification,
sound model development practices, independent review and
model-specific usage controls. GS Group’s Firmwide Risk
Committee and GS Group’s Firmwide Model Risk Control
Committee oversee the model risk management framework.
Model Risk Management, which is independent of model
developers, model owners and model users, reports to GS
Group’s chief risk officer, is responsible for identifying and
reporting significant risks associated with models, and provides
periodic updates on model risk to senior management, risk
committees and GS Group’s Risk Committee of the Board.
Model Review and Validation
Model Risk Management consists of quantitative professionals
who perform an independent review, validation and approval
of the models. This review includes an analysis of the model
documentation, independent testing, an assessment of the
appropriateness of the methodology used, and verification of
compliance with model development and implementation
standards. Model Risk Management reviews all existing
models on an annual basis, as well as new models or
significant changes to models.
The model validation process incorporates a review of models
and trade and risk parameters across a broad range of scenarios
(including extreme conditions) in order to critically evaluate
and verify:
The model’s conceptual soundness, including the
reasonableness of model assumptions, and suitability for
intended use;
The testing strategy utilised by the model developers to
ensure that the models function as intended;
The suitability of the calculation techniques incorporated in
the model;
The model’s accuracy in reflecting the characteristics of the
related product and its significant risks;
The model’s consistency with models for similar products;
and
The model’s sensitivity to input parameters and
assumptions.
See “Critical Accounting Policy – Fair Value – Review of
Valuation Models”, “Liquidity Risk Management”, “Market
Risk Management”, “Credit Risk Management” and
“Operational Risk Management” for further information about
the company’s use of models within these areas.
Date of Authorisation of Issue
The strategic report was authorised for issue by the Board of
Directors on March 14, 2016.
By order of the board
A.J. Bagley
Secretary
March 14, 2016
GOLDMAN SACHS INTERNATIONAL (UNLIMITED COMPANY)
Directors’ Report
49
The directors present their report and the audited financial
statements for the year ended December 2015.
Introduction
In accordance with section 414A of the Companies Act 2006,
the directors have prepared a strategic report, which is included
in Part I of this annual report and which contains a review of
the company’s businesses and a description of the principal
risks and uncertainties facing the company. The directors have
chosen to disclose the company’s risk management objectives
and policies, including exposures to market risk, credit risk and
liquidity risk, and the future outlook of the company in the
strategic report in accordance with section 414C(11) of the
Companies Act 2006.
Dividends
The directors do not recommend the payment of an ordinary
dividend for 2015. No dividends were paid in 2014.
Exchange Rate
The British pound/U.S. dollar exchange rate was £/$1.4732
and £/$1.5579 as of December 2015 and December 2014,
respectively. The average rate for the year was £/$1.5252 and
£/$1.6455 for 2015 and 2014, respectively.
Employment of Disabled Persons
Applications for employment by disabled persons are fully and
fairly considered with regard to the aptitudes and abilities of
each applicant. Efforts are made to enable any employees who
become disabled during employment to continue their careers
within GS Group. Training, career development and promotion
of disabled persons are, to the extent possible, identical to that
of other employees who are not disabled.
Charitable Contributions
The company made donations to charity of $36 million and
$25 million for 2015 and 2014, respectively. This included
donations of $32 million and $21 million for 2015 and 2014,
respectively, to Goldman Sachs Gives (UK), a registered
charity, for general charitable purposes in England and Wales.
Employee Involvement
It is company policy that there should be effective
communication with all employees who, subject to practical
and commercial considerations, should be consulted on and
involved in decisions that affect their current jobs or future
prospects. Employees share in performance-based incentive
schemes.
Disclosure of Information to Auditors
In the case of each of the persons who are directors of the
company at the date when this report was approved:
So far as each of the directors is aware, there is no relevant
audit information of which the company’s auditors are
unaware; and
Each of the directors has taken all the steps that he ought to
have taken as a director to make himself aware of any
relevant audit information and to establish that the
company’s auditors are aware of that information.
Independent Auditors
Prior to 1 October 2007, the company passed an elective
resolution under section 386 of the Companies Act 1985 to
dispense with the annual reappointment of auditors.
PricewaterhouseCoopers LLP will, accordingly, continue in
office as auditors of the company pursuant to section 487(2) of
the Companies Act 2006 and paragraph 44 of Schedule 3 to the
Companies Act 2006 (Commencement No. 3 Consequential
Amendment, Transitional Provisions and Savings) Order 2007.

GOLDMAN SACHS INTERNATIONAL (UNLIMITED COMPANY)
Directors’ Report
50
Statement of Directors’ Responsibilities
The directors are responsible for preparing the strategic report,
the directors’ report and the financial statements in accordance
with applicable law and regulations. Company law requires the
directors to prepare accounts for each financial period which
give a true and fair view of the state of affairs of the company
as at the end of the financial period and of the profit or loss of
the company for that period. In preparing those accounts, the
directors are required to:
Select suitable accounting policies and then apply them
consistently;
Make judgements and estimates that are reasonable and
prudent;
State whether applicable accounting standards have been
followed subject to any material departures disclosed and
explained in the financial statements; and
Prepare the accounts on the going concern basis unless it is
inappropriate to presume that the company will continue in
business.
The directors are responsible for keeping adequate accounting
records which disclose with reasonable accuracy at any time
the financial position of the company and to enable them to
ensure that the accounts comply with the Companies Act 2006.
They are also responsible for safeguarding the assets of the
company and, hence, for taking reasonable steps for the
prevention and detection of fraud and other irregularities.
The directors are responsible for the maintenance and integrity
of the company’s financial statements on the Goldman Sachs
website. Legislation in the U.K. governing the preparation and
dissemination of financial statements may differ from
legislation in other jurisdictions.
Directors
The directors of the company who served throughout the year
and to the date of this report, except where noted, were:
Name Appointed Resigned
C. A. G. Dahlbäck, Chairman1
R. J. Gnodde, Co-chief executive officer
Lord Grabiner QC June 24, 2015
Lord Griffiths of Fforestfach
M. S. Sherwood, Co-chief executive officer
P. D. Sutherland, Chairman June 30, 2015
R. A. Vince
1. C. A. G. Dahlbäck was appointed as the chairman of the company on July 1,
2015.
No director had, at the year end, any interest requiring note
herein.
Date of Authorisation of Issue
The financial statements were authorised for issue by the
Board of Directors on March 14, 2016.
By order of the board
A.J. Bagley
Secretary
March 14, 2016

Independent Auditor’s Report to the Members of Goldman Sachs International (unlimited company)
51
Report on the financial statements
Our opinion
In our opinion, Goldman Sachs International’s financial
statements (the “financial statements”):
give a true and fair view of the state of the company’s
affairs as of December 31, 2015 and of its profit and cash
flows for the year then ended;
have been properly prepared in accordance with United
Kingdom Generally Accepted Accounting Practice; and
have been prepared in accordance with the requirements of
the Companies Act 2006.
What we have audited
The financial statements, included within the Annual Report,
comprise:
the Balance Sheet as of December 31, 2015;
the Profit and Loss Account and the Statements of
Comprehensive Income for the year then ended;
the Statements of Cash Flows for the year then ended;
the Statements of Changes in Equity for the year then
ended; and
the notes to the financial statements, which include a
summary of significant accounting policies and other
explanatory information.
Certain required disclosures have been presented elsewhere in
the Annual Report, rather than in the notes to the financial
statements. These are cross-referenced from the financial
statements and are identified as audited.
The financial reporting framework that has been applied in the
preparation of the financial statements is United Kingdom
Accounting Standards, comprising FRS 101 “Reduced
Disclosure Framework”, and applicable law (United Kingdom
Generally Accepted Accounting Practice).
In applying the financial reporting framework, the directors
have made a number of subjective judgements, for example in
respect of significant accounting estimates. In making such
estimates, they have made assumptions and considered future
events.
Opinion on other matter prescribed by the
Companies Act 2006 In our opinion the information given in the Strategic Report
and Directors’ Report for the financial year for which the
financial statements are prepared is consistent with the
financial statements.
Other matters on which we are required to
report by exception
Adequacy of accounting records and information
and explanations received
Under the Companies Act 2006 we are required to report to
you if, in our opinion:
we have not received all the information and explanations
we require for our audit; or
adequate accounting records have not been kept, or returns
adequate for our audit have not been received from
branches not visited by us; or
the financial statements are not in agreement with the
accounting records and returns.
We have no exceptions to report arising from this
responsibility.
Directors’ remuneration
Under the Companies Act 2006 we are required to report to
you if, in our opinion, certain disclosures of directors’
remuneration specified by law are not made. We have no
exceptions to report arising from this responsibility.

Independent Auditor’s Report to the Members of Goldman Sachs International (unlimited company)
52
Responsibilities for the financial statements
and the audit
Our responsibilities and those of the directors
As explained more fully in the Statement of Directors’
Responsibilities set out on page 50, the directors are
responsible for the preparation of the financial statements and
for being satisfied that they give a true and fair view.
Our responsibility is to audit and express an opinion on the
financial statements in accordance with applicable law and
International Standards on Auditing (UK and Ireland) (“ISAs
(UK & Ireland)”). Those standards require us to comply with
the Auditing Practices Board’s Ethical Standards for Auditors.
This report, including the opinions, has been prepared for and
only for the company’s members as a body in accordance with
Chapter 3 of Part 16 of the Companies Act 2006 and for no
other purpose. We do not, in giving these opinions, accept or
assume responsibility for any other purpose or to any other
person to whom this report is shown or into whose hands it
may come save where expressly agreed by our prior consent in
writing.
What an audit of financial statements involves
We conducted our audit in accordance with ISAs (UK &
Ireland). An audit involves obtaining evidence about the
amounts and disclosures in the financial statements sufficient
to give reasonable assurance that the financial statements are
free from material misstatement, whether caused by fraud or
error. This includes an assessment of:
whether the accounting policies are appropriate to the
company’s circumstances and have been consistently
applied and adequately disclosed;
the reasonableness of significant accounting estimates
made by the directors; and
the overall presentation of the financial statements.
We primarily focus our work in these areas by assessing the
directors’ judgements against available evidence, forming our
own judgements, and evaluating the disclosures in the financial
statements.
We test and examine information, using sampling and other
auditing techniques, to the extent we consider necessary to
provide a reasonable basis for us to draw conclusions. We
obtain audit evidence through testing the effectiveness of
controls, substantive procedures or a combination of both.
In addition, we read all the financial and non-financial
information in the Annual Report to identify material
inconsistencies with the audited financial statements and to
identify any information that is apparently materially incorrect
based on, or materially inconsistent with, the knowledge
acquired by us in the course of performing the audit. If we
become aware of any apparent material misstatements or
inconsistencies we consider the implications for our report.
Duncan McNab (Senior Statutory Auditor)
for and on behalf of PricewaterhouseCoopers LLP
Chartered Accountants and Statutory Auditors
7 More London Riverside
London
SE1 2RT
March 14, 2016

GOLDMAN SACHS INTERNATIONAL (UNLIMITED COMPANY)
Profit and Loss Account
53
Year Ended December
$ in millions Note 2015 2014
Net revenues 5 $ 7,016 $ 6,430
Administrative expenses 6 (4,077) (4,155)
Operating profit 2,939 2,275
Interest payable and similar charges 9 (285) (222)
Net finance income 10 7 7
Profit on ordinary activities before taxation 2,661 2,060
Tax on profit on ordinary activities 12 (353) (452)
Profit for the financial year $ 2,308 $ 1,608
Net revenues and operating profit of the company are derived from continuing operations in the current and prior years.
Statements of Comprehensive Income
Year Ended December
$ in millions Note 2015 2014
Profit for the financial year $ 2,308 $ 1,608
Other comprehensive income/(loss)
Items that will not be reclassified subsequently to profit or loss
Actuarial profit/(loss) relating to the pension scheme 10 (3) 111
U.K. deferred tax attributable to the actuarial profit/(loss) 18 1 (22)
Other comprehensive income/(loss) for the financial year, net of tax (2) 89
Total comprehensive income for the financial year $ 2,306 $ 1,697
The accompanying notes are an integral part of these financial statements.

GOLDMAN SACHS INTERNATIONAL (UNLIMITED COMPANY)
Balance Sheet
54
As of December
$ in millions Note 2015 2014
Fixed assets
Tangible assets 13 $ 11 $ 12
Investments 14 1 2
12 14
Current assets
Financial instruments owned (includes $22,036 and $24,404 pledged as collateral as of December 2015 and
December 2014, respectively) 15 616,054 693,748
Collateralised agreements 16 163,703 203,516
Debtors 17 60,488 66,561
Cash at bank and in hand 23 9,974 3,586
850,219 967,411
Creditors: amounts falling due within one year
Financial instruments sold, but not yet purchased 15 (555,654) (641,413)
Collateralised financings 19 (116,385) (139,137)
Other creditors 20 (116,300) (145,904)
(788,339) (926,454)
Net current assets 61,880 40,957
Total assets less current liabilities 61,892 40,971
Creditors: amounts falling due after more than one year
Collateralised financings 19 (3,502) (2,514)
Other creditors 20 (32,298) (16,700)
(35,800) (19,214)
Provisions for liabilities 21 – (17)
Net assets excluding pension surplus 26,092 21,740
Pension surplus 10 261 257
Net assets including pension surplus $ 26,353 $ 21,997
Capital and reserves
Called up share capital 22 $ 582 $ 00,533
Share premium account 4,864 2,863
Capital reserve (non-distributable) 17 17
Profit and loss account 20,890 18,584
Total shareholder’s funds $ 26,353 $ 21,997
The financial statements were approved by the Board of Directors on March 14, 2016 and signed on its behalf by:
M. S. Sherwood
Director The accompanying notes are an integral part of these financial statements. Company number: 02263951

GOLDMAN SACHS INTERNATIONAL (UNLIMITED COMPANY)
Statements of Changes in Equity
55
Year Ended December
$ in millions 2015 2014
Called up share capital
Balance, beginning of year $ 533 $ 533
Shares issued 49 –
Balance, end of year 582 533
Share premium account
Balance, beginning of year 2,863 2,863
Shares issued 2,001 –
Balance, end of year 4,864 2,863
Capital reserve (non-distributable)
Balance, beginning of year 17 17
Balance, end of year 17 17
Profit and loss account
Balance, beginning of year 18,584 16,887
Profit for the financial year 2,308 1,608
Other comprehensive income/(loss) (2) 89
Share-based payments 630 529
Management recharge related to share-based payments (630) (529)
Balance, end of year 20,890 18,584
Total shareholder’s funds $26,353 $21,997
No dividends were paid in 2015 and 2014.
The accompanying notes are an integral part of these financial statements.

GOLDMAN SACHS INTERNATIONAL (UNLIMITED COMPANY)
Statements of Cash Flows
56
Year Ended December
$ in millions Note 2015 2014
Cash flows from operating activities
Cash generated from operations 24 $2,889 $ 88
Taxation received 3 14
Taxation paid (403) (169)
Net cash from/(used in) operating activities 2,489 (67)
Cash flows from investing activities
Payments to acquire tangible fixed assets (3) (2)
Net cash used in investing activities (3) (2)
Cash flows from financing activities
Receipts from issuing ordinary share capital 2,050 –
Interest paid on long-term subordinated loans (217) (166)
Receipts from issuing long-term subordinated loans 2,500 –
Net cash from/(used in) financing activities 4,333 (166)
Net increase/(decrease) in cash and cash equivalents 6,819 (235)
Cash and cash equivalents, beginning of year 3,577 4,004
Foreign exchange losses on cash and cash equivalents (426) (192)
Cash and cash equivalents, end of year 23 $9,970 $3,577
The accompanying notes are an integral part of these financial statements.

GOLDMAN SACHS INTERNATIONAL (UNLIMITED COMPANY)
Notes to the Financial Statements
57
Note 1.
General Information
The company is a private unlimited company and is
incorporated and domiciled in England and Wales. The address
of its registered office is Peterborough Court, 133 Fleet Street,
London, EC4A 2BB, United Kingdom.
The company’s immediate parent undertaking is Goldman
Sachs Group UK Limited (GSGUK), a company incorporated
and domiciled in England and Wales.
The ultimate controlling undertaking and the parent company
of the smallest and largest group for which consolidated
financial statements are prepared is The Goldman Sachs
Group, Inc., a company incorporated in the United States of
America. Copies of its consolidated financial statements, as
well as certain regulatory filings, for example Quarterly Report
on Form 10-Q and Annual Report on Form 10-K, that provide
additional information about GS Group and its business
activities, can be obtained from Investor Relations, 200 West
Street, New York, NY 10282, United States of America, GS
Group’s principal place of business, or at
www.goldmansachs.com/shareholders/.
Basel III Pillar 3 Disclosures
The company is included in the consolidated Pillar 3
disclosures of GSGUK, which are required by the EU Capital
Requirements Regulation. GSGUK’s 2015 Pillar 3 disclosures
will be made available in conjunction with the publication of
its financial statements at www.goldmansachs.com/
disclosures/.
Country-by-Country Reporting
The company is included in the consolidated country-by-
country reporting disclosures of GSGUK, which are required
by the Capital Requirements (Country-by-Country Reporting)
Regulations 2013. GSGUK’s 2015 country-by-country
disclosures will be made available by December 31, 2016 at
www.goldmansachs.com/disclosures/.
Note 2.
Summary of Significant Accounting Policies
Basis of Presentation
For all periods up to and including the year ended December
2014, the company prepared its financial statements in
accordance with the previous U.K. GAAP. From January 1,
2015, the company transitioned from the previous U.K. GAAP
to FRS 101 ‘Reduced Disclosure Framework’ (FRS 101).
These financial statements are for the first full annual period
covered by FRS 101. All periods presented in these financial
statements have been prepared in accordance with FRS 101.
The impact on the company’s financial statements as a result of
adopting FRS 101 is described in Note 4.
These financial statements have been prepared on the going
concern basis, under the historical cost convention (modified
as explained in “Pension Arrangements” and “Financial Assets
and Financial Liabilities” below), and in accordance with the
Companies Act 2006.
The following exemptions from the disclosure requirements of
IFRS as adopted by the EU have been applied in the
preparation of these financial statements in accordance with
FRS 101:
IFRS 2 ‘Share-based Payment’ paragraph 45(b) and 46 to
52. These disclosures are provided in the consolidated
financial statements of Group Inc.
IAS 1 ‘Presentation of Financial Statements’ paragraph 38
to present comparative information in respect of:
IAS 1 ‘Presentation of Financial Statements’ paragraph
79(a)(iv); and
IAS 16 ‘Property, Plant and Equipment’ paragraph
73(e).
IAS 1 ‘Presentation of Financial Statements’ paragraphs
10(f), 16, and 40A-D;
IAS 8 ‘Accounting Policies, Changes in Accounting
Estimates and Errors’ paragraphs 30 and 31;
IAS 24 ‘Related Party Disclosures’ paragraph 17; and
IAS 24 ‘Related Party Disclosures’ requirements to
disclose transactions with companies also wholly owned
within GS Group.
Consolidation
The company has elected not to prepare consolidated financial
statements as permitted by section 402 of the Companies Act
2006 as its subsidiaries are not material for the purpose of
giving a true and fair view.
These financial statements are individual financial statements.
GOLDMAN SACHS INTERNATIONAL (UNLIMITED COMPANY)
Notes to the Financial Statements
58
Accounting Policies
Revenue Recognition. Net revenues have been disclosed
instead of turnover as this reflects more meaningfully the
nature and results of the company’s activities. Net revenues
includes the net profit arising from transactions, with both third
parties and affiliates, in securities, foreign exchange and other
financial instruments, and fees and commissions. This is
inclusive of associated interest and dividends.
Financial Assets and Financial Liabilities Measured
at Fair Value Through Profit or Loss
Financial assets and financial liabilities held for trading or
designated at fair value through profit or loss are recognised at
fair value with realised and unrealised gains and losses as well
as associated interest and dividend income and expenses
included in net revenues. Financial assets are marked to bid
prices and financial liabilities are marked to offer prices. Fair
value measurements do not include transaction costs.
Non-derivative financial instruments owned and financial
instruments sold, but not yet purchased (i.e., cash instruments)
are recognised using settlement date accounting. See
“Financial Assets and Financial Liabilities – Recognition and
Derecognition” below for further details. Unrealised gains and
losses related to the change in fair value of these instruments
between trade date and settlement date are recognised within
net revenues.
Investment Banking
Fees from financial advisory engagements and underwriting
revenues are recognised in profit and loss when the relevant
parties are contractually bound and as contract activity
progresses unless the right to consideration does not arise until
the occurrence of a critical event, in which case revenue is not
recognised until that event has occurred.
Expenses associated with such engagements are deferred until
the related revenue is recognised or the engagement is
otherwise concluded. Expenses associated with financial
advisory engagements are recognised in administrative
expenses, net of client reimbursements. Underwriting revenues
are presented net of related expenses.
Investment Management
Management fees are recognised on an accrual basis and are
generally calculated as a percentage of a fund or a separately
managed account’s average net asset value. All management
fees are recognised over the period that the related service is
provided.
Incentive fees are calculated as a percentage of a fund’s return
or a percentage of a fund’s excess return above a specified
benchmark or other performance target. Incentive fees are
recognised only when all material contingencies have been
resolved.
Commissions and Fees
Revenue from commissions and fees from executing and
clearing client transactions on stock, options and futures
markets, as well as OTC transactions is recognised in net
revenues on the day the trade is executed.
Operating Leases. The company has entered into operating
lease arrangements as the lessee. Leased assets are not
recognised on the balance sheet. Costs in respect of operating
leases, adjusted for any incentives granted by the lessor, are
charged on a straight-line basis over the lease term and
included within administrative expenses in the profit and loss
account.
Short-Term Employee Benefits. Short-term employee
benefits, such as wages and salaries, are measured on an
undiscounted basis and accrued as an expense over the period
in which the employee renders the service to the company.
Provision is made for discretionary year-end compensation
whether to be paid in cash or share-based awards where, as a
result of company policy and past practice, a constructive
obligation exists at the balance sheet date.
Share-Based Payments. Group Inc. issues awards in the
form of restricted stock units (RSUs) and stock options to the
company’s employees for services rendered to the company.
Awards are classified as equity settled and hence the cost of
share-based transactions with employees is measured based on
the grant-date fair value of the award. Share-based awards that
do not require future service (i.e., vested awards, including
awards granted to retirement eligible employees) are expensed
immediately. Share-based awards that require future service
are amortised over the relevant service period. Expected
forfeitures are included in determining share-based employee
compensation expense.
Group Inc. settles equity awards through the delivery of its
ordinary shares. Group Inc. pays cash dividend equivalents on
outstanding RSUs. The company has also entered into a
chargeback agreement with Group Inc. under which it is
committed to pay to Group Inc. the grant-date fair value as
well as subsequent movements in fair value of those awards to
Group Inc. at the time of delivery to its employees.

GOLDMAN SACHS INTERNATIONAL (UNLIMITED COMPANY)
Notes to the Financial Statements
59
Dividends. Final equity dividends are recognised as a liability
and deducted from equity in the period in which the dividends
are approved by the company’s shareholder. Interim equity
dividends are recognised and deducted from equity when paid.
Pension Arrangements. The company is a sponsor of a
defined contribution pension plan and a hybrid pension plan
for the benefit of certain employees. The hybrid pension plan
has both a defined benefit section (the Plan) and a defined
contribution section. These are accounted for as follows:
For the defined contribution pension plan and the defined
contribution section of the hybrid pension plan, the
contributions payable for the year are charged to operating
profit. Differences between contributions payable for the
year and contributions actually paid are shown as either
accruals or prepayments on the balance sheet.
For the Plan, the amounts charged to operating profit are
the current service costs, any past service costs and any
gains or losses on settlements and curtailments. These
amounts are included in staff costs. The net interest is
included in net finance income. Actuarial gains and losses
are recognised immediately in the statement of other
comprehensive income. Plan assets are measured at fair
value and Plan liabilities are measured on an actuarial basis
using the projected unit method and discounted at a rate
equivalent to the current rate of return on a high-quality
corporate bond of equivalent currency and term to the Plan
liabilities. Full actuarial valuations are obtained at least
triennially and updated at each balance sheet date. Any
surplus or deficit of Plan assets over Plan liabilities is
recognised on the balance sheet as an asset (surplus) or
liability (deficit).
Tangible Fixed Assets. Tangible fixed assets are stated at
cost less accumulated depreciation and provision for
impairment. Fixtures, fittings and equipment are depreciated
on a straight-line basis over their estimated useful lives, which
is between 3 to 7 years. Depreciation is included in
administrative expenses.
Leasehold improvements are depreciated over the shorter of
the useful economic life of the asset or the remaining life of the
lease when the asset is brought into use. Depreciation policies
are reviewed on an annual basis.
Fixed Asset Investments. Fixed asset investments are
stated at cost or amortised cost, as applicable, less provision for
impairment. Amortisation is included in administrative
expenses.
Cash at Bank and In Hand. Cash at bank and in hand is
highly liquid overnight deposits held in the ordinary course of
business.
Foreign Currencies. The company’s financial statements
are presented in U.S. dollars, which is also the company’s
functional currency.
Transactions denominated in foreign currencies are translated
into U.S. dollars at rates of exchange ruling on the date the
transaction occurred. Monetary assets and liabilities
denominated in foreign currencies are translated into U.S.
dollars at rates of exchange ruling at the balance sheet date.
Foreign exchange gains and losses are recognised in operating
profit.
GOLDMAN SACHS INTERNATIONAL (UNLIMITED COMPANY)
Notes to the Financial Statements
60
Financial Assets and Financial Liabilities.
Recognition and Derecognition
Non-derivative financial instruments owned and financial
instruments sold, but not yet purchased (i.e., cash instruments)
purchased or sold in regular way transactions are recognised
and derecognised using settlement date accounting.
Other financial assets and financial liabilities are recognised
when the company becomes party to the contractual provisions
of the instrument. They are de-recognised when the contractual
rights to the cash flows from the financial asset expire or if the
company transfers the financial asset and substantially all the
risk and rewards of ownership of that financial asset. A
financial liability is derecognised only when it is extinguished
(i.e., when the obligation specified in the contract is discharged
or cancelled or expires).
Classification and Measurement
The company classifies its financial assets and financial
liabilities into the below categories. The classification, which is
determined at initial recognition, depends on the purpose for
which they were acquired or originated.
Financial assets and financial liabilities classified
as held for trading. Financial assets and financial
liabilities classified as held for trading include financial
instruments owned and financial instruments sold, but not
yet purchased. Financial instruments owned and financial
instruments sold, but not yet purchased include cash
instruments and derivative instruments. Both are initially
recognised at fair value with transaction costs expensed in
profit or loss. Such financial instruments are carried in the
balance sheet at fair value and all subsequent gains or
losses are recognised in net revenues.
The directors are of the opinion that it would not be
appropriate to classify them as current asset investments or
to provide an analysis of such securities between those
listed and unlisted.
Financial assets and financial liabilities
designated at fair value through profit or loss. The
company designates certain of its other financial assets and
financial liabilities at fair value through profit or loss.
Financial assets and financial liabilities designated at fair
value through profit or loss are initially recognised at fair
value with transaction costs expensed in profit or loss. They
are measured in the balance sheet at fair value and all
subsequent gains or losses are recognised in net revenues.
The primary reasons for designating such financial assets
and financial liabilities at fair value through profit or loss
are:
The group of financial assets, financial liabilities or
both is managed and its performance evaluated on a fair
value basis; and
To eliminate or significantly reduce a measurement or
recognition inconsistency that would otherwise arise
from measuring assets or liabilities or recognising the
gains and losses on them on different bases.
Financial assets and financial liabilities designated at fair
value through profit or loss include:
Resale agreements and substantially all repurchase
agreements;
Securities borrowed and loaned within Fixed Income,
Currency and Commodities Client Execution;
Substantially all secured debt securities issued, which
includes certain hybrid financial instruments and
transfers of assets accounted for as financings rather
than sales;
Certain unsecured debt securities issued, including
certain hybrid financial instruments; and
Certain debtors, including transfers of assets accounted
for as secured loans rather than purchases.
Hybrid financial instruments are instruments that contain
bifurcatable embedded derivatives. If the company elects to
bifurcate the embedded derivative from the associated debt,
the derivative is accounted for at fair value and the host
contract is accounted for at amortised cost, adjusted for the
effective portion of any fair value hedges. If the company
does not elect to bifurcate, the entire hybrid financial
instrument is designated at fair value through profit or loss.
These financial assets and financial liabilities at fair value
are generally valued based on discounted cash flow
techniques, which incorporate inputs with reasonable levels
of price transparency, and are generally classified as level 2
because the inputs are observable. Valuation adjustments
may be made for liquidity and for counterparty and GS
Group’s credit quality.

GOLDMAN SACHS INTERNATIONAL (UNLIMITED COMPANY)
Notes to the Financial Statements
61
Loans and receivables; and financial liabilities
measured at amortised cost. Loans and receivables
are non-derivative financial assets with fixed or
determinable payments that are not quoted in an active
market. They include certain collateralised agreements,
substantially all debtors and cash at bank and in hand. Such
financial assets are initially recognised at fair value plus
transaction costs and subsequently measured at amortised
cost using the effective interest method (see below).
Finance revenue is recorded in net revenues.
Financial liabilities measured at amortised cost include
certain collateralised financings and substantially all other
creditors. Such financial liabilities are initially recognised
at fair value plus transactions costs and subsequently
measured at amortised cost using the effective interest
method (see below). Finance costs, including discounts
allowed on issue, are recorded in net revenues with the
exception of interest on long-term subordinated loans,
which is recorded in interest payable and similar charges.
The effective interest method is a method of calculating the
amortised cost of a financial asset or a financial liability (or
a group of financial assets or financial liabilities) and of
allocating the interest income or interest expense over the
relevant period. The effective interest rate is the rate that
exactly discounts estimated future cash payments or
receipts through the expected life of the financial asset or
financial liability or, when appropriate, a shorter period to
the net carrying amount of the financial asset or financial
liability. When calculating the effective interest rate, the
company estimates cash flows considering all contractual
terms of the financial asset or financial liability but does
not consider future credit losses. The calculation includes
all fees and points paid or received that are an integral part
of the effective interest rate, transaction costs, and all other
premiums or discounts.
The company assesses its loans and receivables at each
balance sheet date for any objective evidence of
impairment. If there is objective evidence that an
impairment loss has been incurred, the amount of the loss is
measured as the difference between the financial asset’s
carrying amount and the present value of estimated future
cash flows discounted at the financial asset’s original
effective interest rate. The amount of the loss is included
within net revenues, if trading related, or in administrative
expenses if non-trading related.
Classification of Financial Liabilities and Equity
Financial liabilities and equity instruments are classified
according to the substance of the contractual arrangements. A
financial liability is any liability that is a contractual obligation
to deliver cash or another financial asset to another entity; or to
exchange financial assets or financial liabilities with another
entity under conditions that are potentially unfavourable to the
entity. An equity investment is any contract that evidences a
residual interest in the assets of the entity after deducting all
liabilities. Instruments are evaluated to determine if they
contain both liability and equity components. The initial
carrying amount of a compound financial instrument is
allocated first to the liability component, measured at fair
value, and the equity is assigned the residual amount.
Offsetting Financial Assets and Financial Liabilities
Financial assets and financial liabilities are offset and the net
amount presented in the balance sheet where there is:
Currently a legally enforceable right to set-off the
recognised amounts; and
Intent to settle on a net basis or to realise the asset and
settle the liability simultaneously.
Where these conditions are not met, financial assets and
financial liabilities are presented on a gross basis on the
balance sheet.
Fair Value Measurement
See Note 27 for details about the fair value measurement of the
company’s financial assets and financial liabilities.
Hedge Accounting
The company applies hedge accounting for certain interest rate
swaps used to manage the interest rate exposure of certain
fixed-rate unsecured long-term and short-term borrowings. To
qualify for hedge accounting, the derivative hedge must be
highly effective at reducing the risk from the exposure being
hedged. Additionally, the company must formally document
the hedging relationship at inception and test the hedging
relationship to ensure the derivative hedge continues to be
highly effective over the life of the hedging relationship.
Collateralised Agreements and Collateralised
Financings. Collateralised agreements include resale
agreements and securities borrowed. Collateralised financings
include repurchase agreements and securities loaned. See
“Classification and Measurement” above for details on the
classification and measurement of these instruments. Collateral
received or posted can be in the form of cash or securities.
Cash collateral is recognised/derecognised when received/paid.
Collateral posted by the company in the form of securities is
not derecognised from the balance sheet, whilst collateral
received in the form of securities is not recognised on the
balance sheet. If collateral received is subsequently sold, the
obligation to return the collateral and the cash received are
recognised on balance sheet.

GOLDMAN SACHS INTERNATIONAL (UNLIMITED COMPANY)
Notes to the Financial Statements
62
Current and Deferred Taxation. The tax expense for the
period comprises current and deferred taxation. Tax is
recognised in the profit and loss account, except to the extent it
relates to items recognised in the statement of other
comprehensive income.
Current tax is calculated on the basis of the tax laws enacted or
substantively enacted at the balance sheet date in the countries
where the company operates and generates taxable income.
Deferred tax is recognised in respect of all timing differences
that have originated, but not reversed at the balance sheet date,
where transactions or events have occurred at that date that will
result in an obligation to pay more tax or a right to pay less tax
in the future with the following exceptions:
Deferred tax assets are recognised only to the extent that
the directors consider that it is more likely than not that
there will be suitable taxable profits from which the future
reversal of the underlying timing differences can be
deducted.
Deferred tax is measured on an undiscounted basis at the
tax rates that are expected to apply in the periods in which
timing differences reverse, based on tax rates and laws
enacted or substantively enacted at the balance sheet date.
Deferred tax is recognised in the profit and loss account or
directly in the statement of other comprehensive income
according to where the associated gain or loss, to which the
deferred tax is attributable, is recognised.
Provisions, Contingent Liabilities and Contingent
Assets. Provisions are recognised in the financial statements
when it is probable that an outflow of economic benefits will
be required to settle a present (legal or constructive) obligation,
which has arisen as a result of past events, and for which a
reliable estimate can be made of the amount of the obligation.
Legal obligations that may arise as a result of proposed new
laws are recognised as obligations only when the legislation is
virtually certain to be enacted as drafted.
A contingent liability is a possible obligation that arises from
past events and whose existence will be confirmed only by the
occurrence or non-occurrence of one or more uncertain future
events not wholly within the control of the company or a
present obligation that arises from past events but is not
recognised because either an outflow of economic benefits is
not probable or the amount of the obligation cannot be reliably
measured.
A contingent asset is a possible asset that arises from past
events and whose existence will be confirmed only by the
occurrence or non-occurrence of one or more uncertain future
events not wholly within the control of the company.
Contingent liabilities and contingent assets are not recognised
in the financial statements. However, disclosure is made unless
the probability of settlement is remote.
Note 3.
Critical Accounting Estimates and
Judgements
The preparation of financial statements requires management
to make judgements, estimates and assumptions that affect the
amounts recognised in these financial statements. The nature of
estimation means that actual outcomes could differ from those
estimates. The following judgements have had the most
significant effect on amounts recognised in the financial
statements:
Fair Value Measurement
Certain of the company’s financial assets and financial
liabilities include significant unobservable inputs (i.e., level 3).
See Note 27 for information about the carrying value, valuation
techniques and significant inputs of these instruments.
Litigation and Regulatory Proceedings
The company estimates and provides for potential losses that
may arise out of litigation and regulatory proceedings to the
extent that such losses are probable and can be reasonably
estimated. Significant judgement is required in making these
estimates and the company’s final liabilities may ultimately be
materially different. See Notes 21 and 25 for further
information about the company’s provisions for liabilities and
legal proceedings that the company is involved in, for which it
is not practicable to estimate an impact, respectively.
Defined Benefit Pension
The cost of the Plan and the value of the Plan liabilities are
determined using actuarial valuations. This involves making
assumptions about discount rates, future salary increases,
mortality rates and future pension increases. Due to the
complexity of the valuation, such estimates are subject to
significant uncertainty.
Note 4.
First-Time Adoption of FRS 101
As set out in Note 2, these financial statements are for the first
full annual period covered by FRS 101.
The accounting policies set out in Note 2 have been used in the
preparation of all periods in these financial statements.
The following describes the impact to the company’s financial
statements as a result of adopting FRS 101 and consequential
changes to accounting policies.

GOLDMAN SACHS INTERNATIONAL (UNLIMITED COMPANY)
Notes to the Financial Statements
63
Reconciliation of Equity
There was no impact on the company’s equity as a result of
adopting FRS 101. The table below presents a comparison of
the company’s balance sheet under the previous U.K. GAAP
and FRS 101 as of January 1, 2014 (the company’s opening
balance sheet) and December 2014. See “FRS 101
Reconciliation Notes” below for an explanation of each
transition adjustment.
As of January 1, 2014 As of December 2014
Previous Adjustments Previous Adjustments
$ in millions Note U.K. GAAP on transition FRS 101 U.K. GAAP on transition FRS 101
Fixed assets
Tangible assets $ 15 $ – $ 15 $ 12 $ – $ 12
Investments 1 – 1 2 – 2
16 – 16 14 – 14
Current assets
Financial instruments owned A 516,105 (371) 515,734 692,227 1,521 693,748
Collateralised agreements B 225,854 (14,376) 211,478 219,234 (15,718) 203,516
Debtors A 70,212 (11,813) 58,399 77,643 (11,082) 66,561
Cash at bank and in hand 4,032 – 4,032 3,586 – 3,586
816,203 (26,560) 789,643 992,690 (25,279) 967,411
Creditors: amounts falling due within one year
Financial instruments sold, but not yet purchased A (457,164) 703 (456,461) (641,404) (9) (641,413)
Collateralised financings B/C (190,211) 17,025 (173,186) (157,369) 18,232 (139,137)
Other creditors A (133,350) 11,481 (121,869) (155,474) 9,570 (145,904)
(780,725) 29,209 (751,516) (954,247) 27,793 (926,454)
Net current assets 35,478 2,649 38,127 38,443 2,514 40,957
Total assets less current liabilities 35,494 2,649 38,143 38,457 2,514 40,971
Creditors: amounts falling due after more than one year
Collateralised financings C – (2,649) (2,649) – (2,514) (2,514)
Other creditors (15,332) – (15,332) (16,700) – (16,700)
(15,332) (2,649) (17,981) (16,700) (2,514) (19,214)
Provisions for liabilities (18) – (18) (17) – (17)
Net assets excluding pension surplus 20,144 – 20,144 21,740 – 21,740
Pension surplus 156 – 156 257 – 257
Net assets including pension surplus $ 20,300 $ – $ 20,300 $ 21,997 $ – $ 21,997
Capital and reserves
Called up share capital $ 533 $ – $ 00,533 $ 533 $ – $ 00,533
Share premium account 2,863 – 2,863 2,863 – 2,863
Capital reserve (non-distributable) 17 – 17 17 – 17
Profit and loss account 16,887 – 16,887 18,584 – 18,584
Total shareholder’s funds $ 20,300 $ – $ 20,300 $ 21,997 $ – $ 21,997

GOLDMAN SACHS INTERNATIONAL (UNLIMITED COMPANY)
Notes to the Financial Statements
64
Reconciliation of Total Comprehensive Income
The table below presents a comparison of the company’s total
comprehensive income under the previous U.K. GAAP and
FRS 101. See “FRS 101 Reconciliation Notes” below for an
explanation of each transition adjustment.
Year Ended December 2014
Previous Adjustments
$ in millions Note U.K. GAAP on transition FRS 101
Net revenues D $ 5,899 $ 531 $ 6,430
Administrative expenses D (3,624) (531) (4,155)
Operating profit 2,275 – 2,275
Interest payable and
similar charges (222) – (222)
Net finance income E 28 (21) 7
Profit on ordinary
activities before taxation 2,081 (21) 2,060
Tax on profit on ordinary
activities E (456) 4 (452)
Profit for the financial year $ 1,625 $ (17) $ 1,608
Other comprehensive income
Items that will not be
reclassified subsequently
to profit or loss
Actuarial profit relating to
the pension scheme E 90 21 111
U.K. deferred tax attributable
to the actuarial profit E (18) (4) (22)
Other comprehensive
income for the financial
year, net of tax 72 17 89
Total comprehensive
income for the
financial year $ 1,697 $ – $ 1,697
FRS 101 Reconciliation Notes
A. Change From Trade Date to Settlement Date
Accounting. Following a detailed review of its accounting
policies on transition to FRS 101, the company has changed its
accounting policy for regular-way purchases and sales of held
for trading non-derivative financial instruments from trade date
to settlement date accounting. Under the previous U.K. GAAP
and financial statements prepared for interim periods in 2015,
regular-way purchases and sales of held for trading non-
derivative financial instruments were recorded on a trade date
basis.
The company believes that recognising and derecognising held
for trading non-derivative financial instruments on settlement
date results in a more relevant and reliable presentation of its
financial position. In particular:
It eliminates the recognition of unsettled receivable and
payable balances. This results in a more appropriate
representation of the settlement risk inherent in these
balances which is minimal due to the delivery vs. payment
settlement mechanics, which substantially eliminate credit
risk for the majority of regular-way trades; and
This is more consistent with the way these balances are
viewed by management and results in more similar balance
sheet presentation to the GS Group’s U.S. GAAP financial
statements.
The change in accounting policy to recognise and derecognise
these financial instruments on a settlement date basis did not
change the amount or timing of gains and losses recognised in
the profit or loss account for these instruments because
movements in fair value are still recorded between the trade
date and settlement date. The impact of this change is:
As of January 1, 2014, financial instruments owned and
financial instruments sold, but not yet purchased decreased
by $371 million and $703 million, respectively. Debtors
and other creditors decreased by $11.81 billion and $11.48
billion, respectively.
As of December 2014, financial instruments owned and
financial instruments sold, but not yet purchased increased
by $1.52 billion and $9 million, respectively. Debtors and
other creditors decreased by $11.08 billion and $9.57
billion, respectively.
B. Adoption of IAS 32 ‘Financial Instruments:
Presentation’. The company has adopted IAS 32 ‘Financial
Instruments: Presentation’ (IAS 32), which includes
‘Offsetting Financial Assets and Financial Liabilities
(Amendments to IAS 32)’. This amendment included
additional guidance not brought into the previous U.K. GAAP,
which clarifies the meaning of ‘currently has a legally
enforceable right of set-off’ and that some gross settlement
systems may be considered equivalent to net settlement. This
resulted in the company offsetting collateralised agreements
with collateralised financings under FRS 101, which were
previously presented as gross under the previous U.K. GAAP.
The impact of this change is:
As of January 1, 2014, collateralised agreements and
collateralised financings decreased by $14.38 billion.
As of December 2014, collateralised agreements and
collateralised financings decreased by $15.72 billion.

GOLDMAN SACHS INTERNATIONAL (UNLIMITED COMPANY)
Notes to the Financial Statements
65
C. Change in Presentation of Collateralised
Financings. The company has revised its presentation of
collateralised financings for instruments that have a contractual
maturity of greater than one year to include them in creditors:
amounts falling due after more than one year, which better
reflects the inherent nature of these balances. Previously, the
company included such instruments in creditors: amounts
falling due within one year. The impact of this change is:
As of January 1, 2014, creditors: amounts falling due
within one year decreased by $2.65 billion, with a
corresponding increase in creditors: amounts falling due
after more than one year.
As of December 2014, creditors: amounts falling due
within one year decreased by $2.51 billion, with a
corresponding increase in creditors: amounts falling due
after more than one year.
D. Change in Presentation of Market-Making-Related
Costs. The company has revised its presentation of market-
making-related costs (i.e., brokerage, clearing, exchange and
distribution fees) to include them within administrative
expenses as permitted by IAS 1 ‘Presentation of Financial
Statements’ and IAS 18 ‘Revenue’, which better reflects the
inherent nature of these balances. Previously, the company
included market-making-related costs within net revenues.
This resulted in net revenues and administrative expenses each
increasing by $531 million for 2014, with no change to the
operating profit of the company.
E. Adoption of IAS 19 ‘Employee Benefits (amended
2011)’. The company has adopted IAS 19 ‘Employee Benefits
(amended 2011)’ (IAS 19), which differs to the previous U.K.
GAAP in its recognition of amounts in the profit and loss
account and other comprehensive income. Under the previous
U.K. GAAP, the net finance income recognised in the profit
and loss account was the summation of the expected return on
assets in the Plan and interest on Plan liabilities estimated at
the beginning of the year. Any remeasurements during the year
were recognised in other comprehensive income. Under IAS
19, the expected return on assets in the Plan is replaced by
interest income, which is instead calculated by applying the
discount rate to Plan assets at the beginning of the year. Any
remeasurements during the year are recognised in other
comprehensive income.
As a result of adopting IAS 19, the company’s net finance
income and tax on profit on ordinary activities for 2014
decreased by $21 million and $4 million, respectively. This
was offset by an increase in the company’s other
comprehensive income. As a result, there was no impact to
total comprehensive income. This adoption had no impact on
the value of the company’s pension surplus.
Statements of Cash Flows
The company has adopted IAS 7 ‘Statement of Cash Flows’,
which resulted in certain presentational changes to the
company’s reconciliation of cash flows from operating
activities, without any changes to the company’s cash and cash
equivalents as of December 2014.
In addition, the adoption of settlement date accounting and IAS
32, as set out in the “Reconciliation of Equity” above, also
impacted the magnitude of working capital changes in the
company’s reconciliation of cash flows from operating
activities without any change to the net cash flows from
operating activities.
Disclosures
The adoption of FRS 101 resulted in the company revising
certain disclosures in the notes to the financial statements.
These include:
Level 3 Financial Assets and Financial Liabilities.
The company has adopted IFRS 13 ‘Fair Value
Measurement’, which impacts the classification of its level
3 financial assets and financial liabilities. The company
now classifies certain financial assets and financial
liabilities as level 2 (as opposed to level 3) in the fair value
hierarchy if the company has no significant net risk to the
level 3 inputs. The impact of this change is:
As of January 1, 2014, level 3 financial assets and
financial liabilities decreased by $5.36 billion, with a
corresponding increase in level 2.
As of December 2014, level 3 financial assets and
financial liabilities decreased by $7.36 billion, with a
corresponding increase in level 2.
Tax on Profit on Ordinary Activities. Under the
previous U.K. GAAP, a reconciliation between current tax
and the product of profit on ordinary activities before
taxation multiplied by the applicable tax rate was required.
Upon adoption of IAS 12 ‘Income Taxes’ the company is
now required to present a reconciliation between the total
tax expense and the product of profit on ordinary activities
before taxation multiplied by the applicable tax rate.
Operating Leases. Under the previous U.K. GAAP, the
rentals the company was committed to pay in the following
year in respect of its operating leases were disclosed. These
were categorised by the maturity date of the lease. Upon
adoption of IAS 17 ‘Leases’, the company is now required
to disclose the total future minimum lease payments
payable by year instead.
In addition, FRS 101 has resulted in the company providing
additional disclosures relating to financial assets and financial
liabilities due to the adoption of IFRS 7 ‘Financial Instruments:
Disclosures’ and IFRS 13 ‘Fair Value Measurement’.

GOLDMAN SACHS INTERNATIONAL (UNLIMITED COMPANY)
Notes to the Financial Statements
66
Note 5.
Segment Reporting
The company reports its activities in the following four
business segments: Investment Banking; Institutional Client
Services; Investing & Lending; and Investment Management.
See “Results of Operations – Segment Reporting” in Part I of
this annual report for a description of the company’s segments.
Basis of Presentation
In reporting segments, certain of the company’s business lines
have been aggregated where they have similar economic
characteristics and are similar in each of the following areas:
(i) the nature of the services they provide; (ii) their methods of
distribution; (iii) the types of clients they serve; and (iv) the
regulatory environments in which they operate.
The cost drivers of the company taken as a whole –
compensation, headcount and levels of business activity – are
broadly similar in each of the company’s business segments.
Direct costs of employment in the company’s segments reflect,
among other factors, the overall performance of the company
as well as the performance of individual businesses.
Consequently, operating profit margins in one segment of the
company’s business may be significantly affected by the
performance of the company’s other business segments.
The company allocates assets (including allocations of GCLA
and cash, secured client financing and other assets), revenues
and expenses among the four business segments. Due to the
integrated nature of these segments, estimates and judgements
are made in allocating certain assets, revenues and expenses.
The allocation process is based on the manner in which
management currently views the performance of the segments.
Transactions between segments are based on specific criteria or
approximate third-party rates. Total administrative expenses
include charitable contributions and mark-to-market of share-
based compensation that have not been allocated to individual
business segments.
In addition to transactions entered into with third parties, the
company also enters into transactions with affiliates in the
normal course of business as part of market-making activities
and general operations. Revenues are allocated to, and received
from, such affiliates for these transactions.
Management believes that the information in the tables below
provides a reasonable representation of each segment’s
contribution to net revenues, operating profit and total assets.
Operating profit has only been presented for the company’s
significant segments, being Investment Banking and
Institutional Client Services.
The segment information presented in “Segment Net
Revenues” and “Segment Operating Profit” below is prepared
according to the following methodologies:
Revenue and expenses directly associated with each
segment are included in determining operating profit.
Net revenues in the company’s segments include
allocations of interest income and interest expense to
specific securities and other positions in relation to the cash
generated by, or funding requirements of, such underlying
positions with the exception of interest on long-term
subordinated loans, which is presented in interest payable
and similar charges (see Note 9). Net interest is included in
segment net revenues as it is consistent with the way in
which management assesses segment performance.
Overhead expenses not directly allocable to specific
segments are allocated ratably based on direct segment
expenses.
Segment Net Revenues
The table below presents the net revenue of the company’s
segments.
Year Ended December
$ in millions 2015 2014
Investment Banking
Financial Advisory $1,590 $1,452
Underwriting 689 939
Total Investment Banking $1,279 $1,391
Institutional Client Services
Fixed Income, Currency and Commodities
Client Execution $2,549 $2,387
Equities 2,353 1,893
Total Institutional Client Services $4,902 $4,280
Investing & Lending $0,360 $0,266
Investment Management $0,475 $0,493
Total net revenues $7,016 $6,430
Substantially all interest income and interest expense
recognised within net revenues is attributable to Institutional
Client Services.

GOLDMAN SACHS INTERNATIONAL (UNLIMITED COMPANY)
Notes to the Financial Statements
67
Segment Operating Profit
The table below presents the operating profit of the company’s
significant segments.
Year Ended December
$ in millions 2015 2014
Investment Banking
Net revenues $1,279 $1,391
Administrative expenses 812 828
Operating profit $0,467 $0,563
Institutional Client Services
Net revenues $4,902 $4,280
Administrative expenses 2,644 2,761
Operating profit $2,258 $1,519
Total net revenues1 $7,016 $6,430
Total administrative expenses2 4,077 4,155
Total operating profit
$2,939 $2,275
1. Includes net revenues of $835 million and $759 million for 2015 and 2014,
respectively, related to Investing & Lending and Investment Management.
2. Includes administrative expenses of $579 million and $458 million for 2015
and 2014, respectively, related to Investing & Lending and Investment
Management segments, and certain overhead expenses that have not been
allocated to the company’s segments of $42 million and $108 million for 2015
and 2014, respectively, representing charitable contributions and mark-to-
market of share-based compensation.
Segment Assets
Substantially all of the company’s assets are attributable to
Institutional Client Services.
Geographical Analysis
Due to the highly integrated nature of international financial
markets, the company manages its businesses based on the
profitability of the enterprise as a whole. The methodology for
allocating profitability to geographic regions is dependent on
estimates and management judgement. Geographic results are
generally allocated as follows:
Investment Banking: location of the client, investment
banking team and underlying risk.
Institutional Client Services: location of the market-making
desk and the primary market for the underlying security.
Investing & Lending: location of the investing and lending
team.
Investment Management: location of the investment
management team.
The table below presents the total net revenues of the company
by geographic region allocated based on the methodology
referred to above.
Year Ended December
$ in millions 2015 2014
Net revenues
Europe, Middle East and Africa $5,252 $4,827
Americas 1,010 928
Asia 754 675
Total net revenues $7,016 $6,430
Note 6.
Administrative Expenses
The table below presents the company’s administrative
expenses.
Year Ended December
$ in millions 2015 2014
Direct costs of employment $2,834 $3,042
Brokerage, clearing, exchange and distribution fees 550 531
Market development 95 100
Communications and technology 88 85
Depreciation of tangible fixed assets 4 4
Occupancy1
173 180
Professional fees2 147 120
Other expenses3 186 93
Total non-compensation expenses 1,243 1,113
Total administrative expenses $4,077 $4,155
1. Occupancy expenses include operating lease rentals for land and buildings of
$81 million and $87 million for 2015 and 2014, respectively, and income from
the sub-lease payments of $16 million and $12 million for 2015 and 2014,
respectively.
2. Professional fees include fees payable to the company’s auditor for the audit
of the company’s annual financial statements of $5 million for both 2015 and
2014 and fees payable to the company’s auditor for other services of $4
million and $0.6 million for 2015 and 2014, respectively.
3. Other expenses include miscellaneous taxes, charitable contributions,
management fees charged by and to group undertakings relating to
operational and administrative support, management services received from
and provided to affiliates and losses on disposal of tangible fixed assets.
Losses on disposal of tangible fixed assets were $0.4 million and $0.5 million
for 2015 and 2014, respectively.

GOLDMAN SACHS INTERNATIONAL (UNLIMITED COMPANY)
Notes to the Financial Statements
68
Note 7.
Directors’ Emoluments
The table below presents the company’s directors’
emoluments.
Year Ended December
$ in millions 2015 2014
Aggregate emoluments $8 $6
Company pension contributions to money
purchase schemes – –
Total directors’ emoluments $8 $6
The table below presents emoluments for the highest paid
director.
Year Ended December
$ in millions 2015 2014
Aggregate emoluments $3 $2
Company pension contributions to money
purchase schemes – –
Accrued annual pension at end of year – –
In accordance with the Companies Act 2006, directors’
emoluments above represent the proportion of total
emoluments paid or payable in respect of qualifying services
only. This total only includes the value of cash and benefits in
kind, and does not include the value of equity awards in
accordance with the provisions of Schedule 5 of SI 2008/410.
Directors also receive emoluments for non-qualifying services
which are not required to be disclosed.
One director is a member of a defined contribution pension
plan and one director is a member of the hybrid pension plan
(including the defined benefit section and defined contribution
section). Three directors, including the highest paid director,
have been granted Group Inc. shares in respect of long term
incentive schemes during the year. Three directors, including
the highest paid director, have exercised options during the
year.
Note 8.
Staff Costs
The table below presents the company’s average number of
staff (employees including directors, consultants and
temporary staff).
Average for the
Year Ended December
Number 2015 2014
Employees including directors
Investment Banking 721 696
Institutional Client Services 1,407 1,400
Investing & Lending 146 111
Investment Management 593 534
Support Functions 2,755 2,503
5,622 5,244
Consultants and temporary staff 527 338
Total average number of staff 6,149 5,582
The company has the use of the services of a number of
individuals who are employed by affiliated entities and
seconded to the company. These seconded individuals are
included in the disclosure of headcount and related staff costs.
Consultants and temporary staff costs are included in total
direct costs of employment, below. Total headcount was 6,458
and 5,730 as of December 2015 and December 2014,
respectively.
The table below presents employment costs incurred by the
company, including those relating to directors.
Year Ended December
$ in millions 2015 2014
Aggregate gross wages and salaries $2,454 $2,621
Employer’s National Insurance Contributions 295 314
Pension costs, employer contributions to:
Defined contribution plan and defined contribution
section of the hybrid pension plan 62 61
Defined benefit section of the hybrid pension plan 23 46
Total direct costs of employment1 $2,834 $3,042
1. Includes a charge of $6 million for 2015 and a charge of $83 million for 2014,
relating to the mark-to-market of share-based compensation.
Note 9.
Interest Payable and Similar Charges
Interest payable and similar charges comprises interest on
long-term subordinated loans from parent and group
undertakings of $285 million and $222 million for 2015 and
2014, respectively. See Note 20 for further details.

GOLDMAN SACHS INTERNATIONAL (UNLIMITED COMPANY)
Notes to the Financial Statements
69
Note 10.
Pension Arrangements
The company sponsors an open pension plan with a hybrid
structure, having both a defined benefit section (the Plan) and a
defined contribution section. The Plan provides retirement
benefits on the basis of members’ final salary, with a normal
retirement age of 65 for most members. The Plan is funded,
with the assets of the scheme held separately from those of the
company, in separate trustee-administered funds.
The Plan was closed to new entrants with effect from April 1,
2008 and was replaced by a defined contribution plan. In 2015,
the company notified plan participants that the Plan will no
longer accrue future benefit accruals after March 31, 2016.
This resulted in the company recognising a curtailment gain of
$24 million. Existing participants continue to accrue benefits
up until the Plan’s closure.
The Plan operates under trust law and is managed and
administrated by the Goldman Sachs UK Retirement Plan
Trustee Limited (the Trustee) on behalf of the members in
accordance with the terms of the Trust Deed and Rules and
relevant legislation. The Plan’s assets are held by the trust.
A full actuarial valuation of the Plan was carried out by a
qualified independent actuary as of December 31, 2012 using
the projected unit funding method and updated to December
31, 2015. As of December 2015, the Plan liabilities comprise
28% in respect of active employees, 69% in respect of deferred
members and 3% in respect of current beneficiaries.
Risks of the Plan
The main risks of the Plan are:
Funding Shortfall. Additional contributions will be
required if the investment returns are not sufficient to pay
for benefits. The level of equity returns will be a key
determinant of overall investment return; the investment
portfolio is also subject to a range of other risks typical of
the asset classes held, in particular interest rate risk and
inflation risk on bonds.
Asset Volatility. A consequence of the Plan’s investment
strategy, with a significant proportion of the assets invested
in equities and other return-seeking assets is that the
difference between Plan assets and Plan liabilities may be
volatile.
Plan Liabilities Sensitivity. Plan liabilities and the
current service cost are sensitive to the assumptions made
about future inflation and life expectancy. It is also
sensitive to the discount rate, which depends on market
yields on sterling-denominated AA corporate bonds.
Financial Assumptions
The table below presents the significant financial assumptions
used to determine the present value of the defined benefit
obligation.
Year Ended December
% per annum 2015 2014
Discount rate 3.80 3.80
Rate of increase in salaries 4.00 4.00
Rate of price inflation – RPI 3.40 3.30
Rate of price inflation – CPI 2.40 2.30
Rate of increase in pensions in payments
(post-November 30, 1996 accrual) 3.20 3.10
Rate of increase in pensions in deferment
(post-November 30, 1996 accrual) 2.40 2.30
Rate of increase in pensions in deferment
(post-April 5, 2009 accrual) 2.40 2.30
Mortality Assumptions
The table below presents the mortality assumptions used to
determine the present value of the defined benefit obligation.
The mortality assumptions adopted were the “S1 series all
pensioner light” base table with allowance for future
improvements from 2002 onwards in line with the CMI 2012
core projections with a long-term rate of improvement of 1%
per annum.
Year Ended December
Years 2015 2014
Life expectancy at 65 for a member currently 65
Males 24.0 23.9
Females 25.3 25.2
Life expectancy at 65 for a member currently 45
Males 25.3 25.3
Females 26.7 Females 26.8 26.7
Defined Benefit Cost
The table below presents the defined benefit cost related to the
Plan recognised in the company’s profit and loss account and
statement of other comprehensive income.
Year Ended December
$ in millions 2015 2014
Profit and loss account
Current service cost $ 47 $ 046
Curtailment gain (24) –
Net finance income (7) (7)
Total charged to the profit and loss account 16 39
Other comprehensive income
Return on Plan assets greater than discount rate (28) (319)
Actuarial gain – liability experience (13) (19)
Actuarial loss – financial assumptions 44 227
Total loss/(gain) recognised in other
comprehensive income 3 (111)
Total defined benefit cost/(gain) $ 19 $ (72)

GOLDMAN SACHS INTERNATIONAL (UNLIMITED COMPANY)
Notes to the Financial Statements
70
Reconciliation of Pension Surplus
The table below presents a reconciliation of Plan assets, Plan
liabilities and the net pension surplus.
Plan Plan Net Pension
$ in millions Assets Liabilities Surplus
Year Ended December 2015
As of January 1 $1,817 $(1,560) $257
Current service cost – (47) (47)
Curtailment gain – 24 24
Net finance income 68 (61) 7
Return on Plan assets greater
than discount rate 28 – 28
Actuarial gain – liability
experience – 13 13
Actuarial loss – financial
assumptions – (44) (44)
Employer contributions 37 – 37
Benefits paid (10) 10 –
Foreign exchange gain/(loss) (103) 89 (14)
As of December 31 $1,837 $(1,576) $261
Year Ended December 2014
As of January 1 $1,509 $(1,353) $156
Current service cost – (46) (46)
Curtailment gain – – –
Net finance income 67 (60) 7
Return on Plan assets greater
than discount rate 319 – 319
Actuarial gain – liability
experience – 19 19
Actuarial loss – financial
assumptions – (227) (227)
Employer contributions 44 – 44
Benefits paid (9) 9 –
Foreign exchange gain/(loss) (113) 98 (15)
As of December 31 $1,817 $(1,560) $257
Fair Value of Plan Assets
The Plan Trustees have a long-term asset allocation strategy to
invest 65% of assets in return seeking investments (such as
equities) and 35% in liability matching assets (such as Gilts).
The Plan has a hedging programme investing in swaps and
other derivatives in order to reduce the exposure to changes in
interest rates and inflation. The table below presents the fair
value of Plan assets.
$ in millions Quoted Unquoted Total
As of December 2015
Equities $ 873 $ – $ 873
Gilts 534 – 534
Swaps 250 – 250
Cash and cash equivalents 56 – 56
Other 73 51 124
Total $1,786 $51 $1,837
As of December 2014
Equities $ 992 $ – $ 992
Gilts 478 – 478
Swaps 206 – 206
Cash and cash equivalents 118 – 118
Other – 23 23
Total $1,794 $23 $1,817
Sensitivity Analysis
The table below presents a sensitivity analysis of Plan
liabilities for each significant actuarial assumption. The
sensitivities are based on a change in each assumption while
holding all other assumptions constant.
There are inherent limitations in this analysis, as such
idiosyncratic movements are unlikely to occur. The
methodology used to calculate the sensitivities are consistent
across the two periods presented in the table below.
Impact to Plan Liabilities
Increase in assumption Decrease in assumption
$ in millions % $ in millions %
As of December 2015
0.25% change in
discount rate $(123) (7.8) $ 142 9.0)
0.25% change in price
inflation 112 7.1) (105) (6.7)
1 year change in life
expectancy 54 3.4) (52) (3.3)
As of December 2014
0.25% change in
discount rate $(124) (7.9) $ 143 9.2)
0.25% change in price
inflation 117 7.5) (109) (7.0)
1 year change in life
expectancy 53 3.4) (51) (3.3)
Nature of Future Cash Flows
The most recent formal funding valuation of the Plan for the
Trustees was carried out by a qualified independent actuary as
of December 31, 2012, which indicated that Plan assets
exceeded the present value placed on defined benefits accrued
by members to that date (i.e., a surplus). The preliminary
results of the next formal triennial valuation as of December
2015 are likely to be available in the third quarter of 2016.
In compliance with the Pensions Act 2014, the company and
the Trustee agreed a scheme-specific funding target, statement
of funding principles and a schedule of contributions.
As the Plan is closed to future accrual from March 31, 2016,
the company will cease to make regular annual contributions
into the Plan from that point and will instead assess the funding
requirements of the Plan with the Trustees on a periodic basis.
The company expects to make $8 million of contributions to
the Plan and expects $8 million of benefits to be paid out of the
Plan to members in 2016.
The weighted average duration of Plan liabilities was 35 years
as of December 2015.

GOLDMAN SACHS INTERNATIONAL (UNLIMITED COMPANY)
Notes to the Financial Statements
71
Note 11.
Share-Based Payments
Stock Incentive Plan
Group Inc. sponsors a stock incentive plan, The Goldman
Sachs Amended and Restated Stock Incentive Plan (2015)
(2015 SIP), which provides for, amongst others, grants of
RSUs and incentive stock options.
GSI recorded share-based compensation in respect of the
amortisation of granted equity awards, net of forfeitures, of
$630 million and $529 million for 2015 and 2014, respectively.
The corresponding credit to equity has been transferred to
liabilities as a result of the terms of the chargeback agreement
with Group Inc. under which the company is committed to pay
to Group Inc. the grant-date fair value as well as subsequent
movements in fair value of those awards to Group Inc. at the
time of delivery to its employees.
Restricted Stock Units
Group Inc. grants RSUs to GSI’s employees under the 2015
SIP, which are valued based on the closing price of the
underlying shares on the date of grant after taking into account
a liquidity discount for any applicable post-vesting and
delivery transfer restrictions. RSUs generally vest and
underlying shares of common stock deliver as outlined in the
applicable RSU agreements. Employee RSU agreements
generally provide that vesting is accelerated in certain
circumstances, such as on retirement, death, disability and
conflicted employment. Delivery of the underlying shares of
common stock is conditioned on the grantees satisfying certain
vesting and other requirements outlined in the award
agreements.
Stock Options
Stock options granted to employees generally vest as outlined
in the applicable stock option agreement. In general, options
expire on the tenth anniversary of the grant date, although they
may be subject to earlier termination or cancellation under
certain circumstances in accordance with the terms of the
applicable stock option agreement and The Goldman Sachs
Amended and Restated Stock Incentive Plan in effect at the
time of grant.
The table below presents options outstanding. All outstanding
options as of December 2015 were granted in 2006 through
2008.
Weighted
Weighted Average
Average Remaining
Options Exercise Life
Exercise Price Outstanding Price (years)
$ 75.00 - $ 89.99 2,154,052 $ 78.78 3.00
$ 90.00 - $119.99 – – –
$120.00 - $134.99 – – –
$135.00 - $194.99 – – –
$195.00 - $209.99 847,310 202.40 1.51
Outstanding, December 2015 3,001,362 $113.68 2.58
$ 75.00 - $ 89.99 3,383,700 $ 78.78 4.00
$ 90.00 - $119.99 – – –
$120.00 - $134.99 271,481 131.64 0.92
$135.00 - $194.99 – – –
$195.00 - $209.99 847,310 202.40 2.51
Outstanding, December 2014 4,502,491 $105.23 3.53
For those options exercised during the year, the weighted
average share price at the date of exercise was $196.28 and
$169.82 for 2015 and 2014, respectively.
GOLDMAN SACHS INTERNATIONAL (UNLIMITED COMPANY)
Notes to the Financial Statements
72
Note 12.
Tax on Profit on Ordinary Activities
The table below presents the company’s analysis of tax on
profit on ordinary activities.
Year Ended December
$ in millions 2015 2014
Current tax
U.K. corporation tax $372 $243
Adjustments in respect of prior periods 18 39
Overseas taxation 77 62
Total current tax 467 344
Deferred tax
Origination and reversal of temporary differences 54 101
Effect of increased U.K. corporate tax rates (155) –
Adjustments in respect of prior periods (13) 7
Total deferred tax (114) 108
Total tax on profit on ordinary activities $ 353 $452
The Finance (No. 2) Act 2015 was enacted in the fourth quarter
of 2015, which introduced: (i) an 8 percentage point surcharge
on banking profits effective in 2016; (ii) a 1 percentage point
reduction in corporate tax rates effective in 2017; and (iii) a
further 1 percentage point reduction in corporate tax rates
effective in 2020. This resulted in the company recognising a
one-time benefit of $155 million relating to the revaluation of
its deferred tax asset.
The table below presents a reconciliation between tax on profit
on ordinary activities and the amount calculated by applying
the weighted average rate of U.K. corporation tax applicable to
the company for the year of 20.25% (2014: 21.5%) to the profit
on ordinary activities before tax.
Year Ended December
$ in millions 2015 2014
Profit on ordinary activities before taxation $2,661 $2,060
Profit on ordinary activities multiplied by
U.K. corporate tax rate of 20.25% (2014: 21.5%) 539 443
Changes in recognition and measurement of
deferred tax assets (8) 7
Permanent differences (4) (21)
Tax losses surrendered from group
undertakings for nil consideration (29) (29)
Effect of higher taxes on overseas earnings 8 12
Exchange differences and other (3) (6)
Adjustments in respect of prior periods 5 46
Effect of increased U.K. corporate tax rates (155) –
Total tax on profit on ordinary activities $ 353 $ 452
Note 13.
Tangible Fixed Assets
The table below presents the movements in tangible fixed
assets during the year.
Fixtures,
Leasehold fittings and
$ in millions improvements equipment Total
Cost
As of January 1 $24 $10 $34
Additions 1 2 3
Disposals – (1) (1)
As of December 31 25 11 36
Accumulated depreciation
As of January 1 17 5 22
Charge for the year (see Note 6) 2 2 4
Disposals – (1) (1)
As of December 31 19 6 25
Net book value
As of December 2015 $ 6 $ 5 $11
As of December 2014 $ 7 $ 5 $12
Note 14.
Fixed Asset Investments
The table below presents the movements in fixed asset
investments during the year.
Other
Shares in investments,
subsidiary other than
$ in millions undertakings loans Total
Cost
As of January 1 $ – $ 2 $ 2
Disposals – (1) (1)
As of December 31 – 1 1
Accumulated depreciation
As of January 1 – – –
As of December 31 – – –
Net book value
As of December 2015 $ – $ 1 $ 1
As of December 2014 $ – $ 2 $ 2
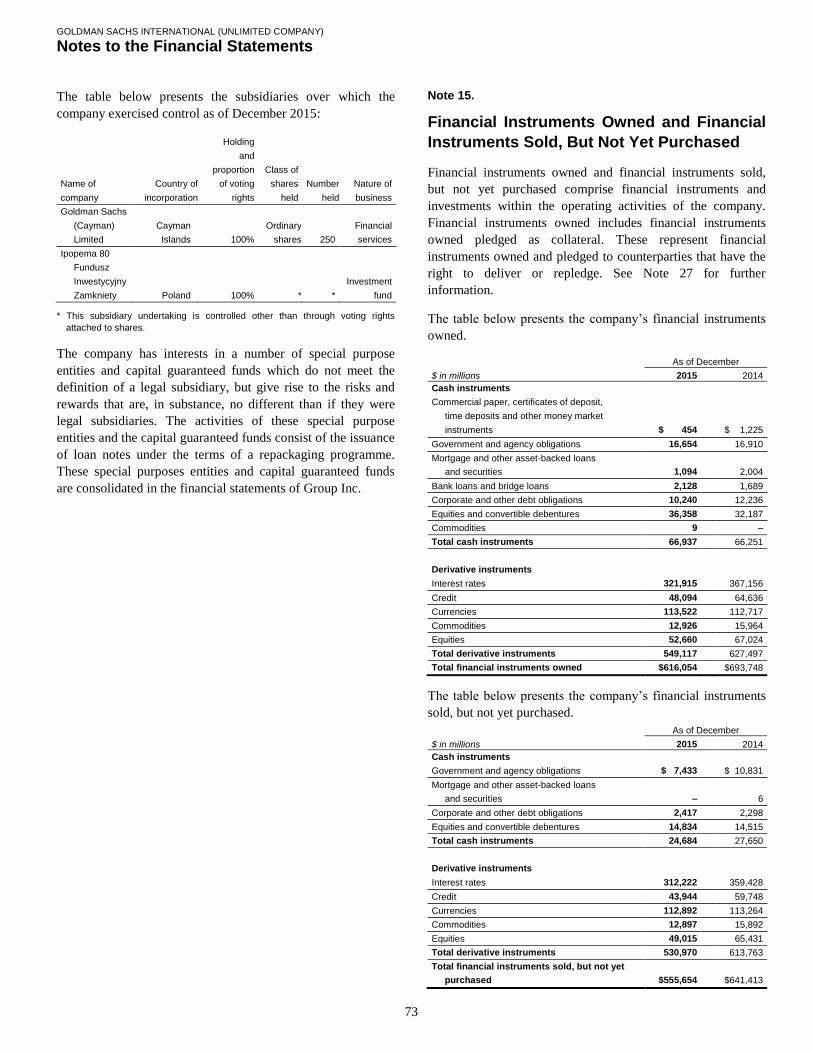
GOLDMAN SACHS INTERNATIONAL (UNLIMITED COMPANY)
Notes to the Financial Statements
73
The table below presents the subsidiaries over which the
company exercised control as of December 2015:
Holding
and
proportion Class of
Name of Country of of voting shares Number Nature of
company incorporation rights held held business
Goldman Sachs
(Cayman) Cayman Ordinary Financial
Limited Islands 100% shares 250 services
Ipopema 80
Fundusz
Inwestycyjny Investment
Zamkniety Poland 100% * * fund
* This subsidiary undertaking is controlled other than through voting rights
attached to shares.
The company has interests in a number of special purpose
entities and capital guaranteed funds which do not meet the
definition of a legal subsidiary, but give rise to the risks and
rewards that are, in substance, no different than if they were
legal subsidiaries. The activities of these special purpose
entities and the capital guaranteed funds consist of the issuance
of loan notes under the terms of a repackaging programme.
These special purposes entities and capital guaranteed funds
are consolidated in the financial statements of Group Inc.
Note 15.
Financial Instruments Owned and Financial
Instruments Sold, But Not Yet Purchased
Financial instruments owned and financial instruments sold,
but not yet purchased comprise financial instruments and
investments within the operating activities of the company.
Financial instruments owned includes financial instruments
owned pledged as collateral. These represent financial
instruments owned and pledged to counterparties that have the
right to deliver or repledge. See Note 27 for further
information.
The table below presents the company’s financial instruments
owned.
As of December
$ in millions 2015 2014
Cash instruments
Commercial paper, certificates of deposit,
time deposits and other money market
instruments $ 454 $ 1,225
Government and agency obligations 16,654 16,910
Mortgage and other asset-backed loans
and securities 1,094 2,004
Bank loans and bridge loans 2,128 1,689
Corporate and other debt obligations 10,240 12,236
Equities and convertible debentures 36,358 32,187
Commodities 9 –
Total cash instruments 66,937 66,251
Derivative instruments
Interest rates 321,915 367,156
Credit 48,094 64,636
Currencies 113,522 112,717
Commodities 12,926 15,964
Equities 52,660 67,024
Total derivative instruments 549,117 627,497
Total financial instruments owned $616,054 $693,748
The table below presents the company’s financial instruments
sold, but not yet purchased.
As of December
$ in millions 2015 2014
Cash instruments
Government and agency obligations $ 7,433 $ 10,831
Mortgage and other asset-backed loans
and securities – 6
Corporate and other debt obligations 2,417 2,298
Equities and convertible debentures 14,834 14,515
Total cash instruments 24,684 27,650
Derivative instruments
Interest rates 312,222 359,428
Credit 43,944 59,748
Currencies 112,892 113,264
Commodities 12,897 15,892
Equities 49,015 65,431
Total derivative instruments 530,970 613,763
Total financial instruments sold, but not yet
purchased $555,654 $641,413

GOLDMAN SACHS INTERNATIONAL (UNLIMITED COMPANY)
Notes to the Financial Statements
74
Note 16.
Collateralised Agreements
The table below presents the company’s collateralised
agreements.
As of December
$ in millions 2015 2014
Resale agreements $110,318 $116,140
Securities borrowed 53,385 87,376
Total collateralised agreements1,2
$163,703 $203,516
1. Includes amounts due from group undertakings of $91.84 billion and $134.92
billion as of December 2015 and December 2014, respectively.
2. Includes balances due in more than one year of $1.87 billion and $2.15 billion
as of December 2015 and December 2014, respectively.
Note 17.
Debtors
The table below presents the company’s debtors balances. All
debtors are due within one year of the balance sheet date,
unless noted below.
As of December
$ in millions 2015 2014
Amounts due from broker/dealers and customers1 $53,047 $56,392
Amounts due from parent and group undertakings 6,768 9,641
Deferred tax (see Note 18) 569 454
Other debtors 44 35
Prepayments and accrued income 60 39
Total debtors2 $60,488 $66,561
1. Includes balances due in more than one year relating to secured lending and
prepaid commodity contracts of $887 million and $981 million as of
December 2015 and December 2014, respectively.
2. Includes financial assets of $59.87 billion and $66.06 billion as of December
2015 and December 2014, respectively, and non-financial assets of $614
million and $501 million as of December 2015 and December 2014,
respectively.
Note 18.
Deferred Tax
The table below presents the components of the company’s
deferred tax asset.
As of December
$ in millions 2015 2014
Depreciation in excess of capital allowances $ 3 $ 3
Post-retirement benefits (68) (51)
Deferred compensation1 634 502
Total deferred tax $569 $454
1. Deferred compensation is mainly in respect of share-based compensation.
The table below presents changes in each component of the
company’s deferred tax asset.
As of December
$ in millions 2015 2014
Depreciation in excess of capital allowances
As of January 1 $ 3 $ 3
As of December 31 $ 3 $ 3
Post-retirement benefits
As of January 1 $ (51) $ (31)
Transfer to the profit and loss account (18) 2
Transfer to other comprehensive income 1 (22)
As of December 31 $ (68) $ (51)
Deferred compensation
As of January 1 $502 $ 612
Transfer to the profit and loss account 132 (110)
As of December 31 $634 $ 502
Total
As of January 1 $454 $ 584
Transfer to the profit and loss account
(see Note 12) 114 (108)
Transfer to other comprehensive income 1 (22)
As of December 31 $569 $ 454
Note 19.
Collateralised Financings
The table below presents the company’s collateralised
financings.
As of December
$ in millions 2015 2014
Amounts falling due within one year
Repurchase agreements $ 38,578 $ 44,287
Securities loaned 77,807 94,850
Total $116,385 $139,137
Amounts falling due after more than one year
Repurchase agreements $113,502 $132,514
Total $113,502 $132,514
Total collateralised financings1 $119,887 $141,651
1. Includes amounts due to group undertakings of $82.67 billion and $103.15
billion as of December 2015 and December 2014, respectively, of which
$82.55 billion and $102.56 billion as of December 2015 and December 2014,
respectively, are due within one year.

GOLDMAN SACHS INTERNATIONAL (UNLIMITED COMPANY)
Notes to the Financial Statements
75
Note 20.
Other Creditors
The table below presents the company’s other creditors.
As of December
$ in millions 2015 2014
Amounts falling due within one year
Bank loans $ 63 $ 111
Overdrafts 4 9
Debt securities issued 13,850 15,545
Amounts due to broker/dealers and customers 54,544 61,419
Amounts due to parent and group
undertakings – unsecured borrowings 27,195 49,464
Amounts due to parent and group
undertakings – other unsecured creditors 18,316 17,076
Accrual for management charges payable
to parent and group undertakings1 834 1,077
Corporation tax payable 134 78
Other taxes and social security costs 230 250
Other creditors and accruals 1,130 875
Total2 $116,300 $145,904
Amounts falling due after more than one year
Bank loans $ 100 $ –
Long-term subordinated loans 8,958 6,458
Debt securities issued 7,896 6,387
Amounts due to parent and group
undertakings – unsecured borrowings 14,316 2,702
Amounts due to parent and group
undertakings – other unsecured creditors 344 379
Accrual for management charges payable
to parent and group undertakings1 684 774
Total3 $132,298 $216,700
Total other creditors $148,598 $162,604
1. The accrual for management charges payable to parent and group
undertakings is in respect of share-based compensation.
2. Includes financial liabilities of $115.94 billion and $145.58 billion as of
December 2015 and December 2014, respectively, and non-financial
liabilities of $364 million and $328 million as of December 2015 and
December 2014, respectively.
3. All amounts falling due after more than one year are financial liabilities as of
December 2015 and December 2014.
Debt Securities Issued
The table below presents the company’s debt securities issued.
As of December
$ in millions 2015 2014
Amounts falling due within one year
Unsecured debt securities with affiliates $21,778 $ 3,807
Unsecured debt securities with external
counterparties 9,722 9,136
Secured debt securities with affiliates1 493 672
Secured debt securities with external
counterparties1 1,857 1,930
Total $13,850 $15,545
Amounts falling due after more than one year
Unsecured debt securities with affiliates $13,671 $15,471
Unsecured debt securities with external
counterparties 5,317 3,076
Secured debt securities with affiliates1 1,148 1,190
Secured debt securities with external
counterparties1 760 1,650
Total $27,896 $26,387
Total debt securities issued $21,746 $21,932
1. Secured debt securities are secured by securities which have been pledged
as collateral. This pledged collateral is either recognised within “Financial
instruments owned” or sourced through collateralised agreements.
The table below presents the maturity of the company’s long-
term debt securities issued.
As of December
$ in millions 2015 2014
Between one and two years $2,554 $1,637
Between two and five years 2,074 3,059
Over five years 3,268 1,691
Total $7,896 $6,387
Amounts due in more than five years predominantly relate to
structured debt securities with maturities falling due between
2021 and 2046. Payments on these securities are typically
referenced to underlying financial assets, which are
predominately interest rate and equities-related.
Long-Term Subordinated Loans
Long-term subordinated loans comprise long-term
subordinated loans from parent and group undertakings, which
are unsecured and carry interest at a margin over the U.S.
Federal Reserve’s federal funds rate. The margin is reset on a
periodic basis to reflect changes in GS Group’s weighted
average cost of debt. Long-term subordinated loans constitute
regulatory capital as approved by the PRA and are repayable
subject to PRA approval and upon giving or receiving at least 5
years’ notice to or from the parent or group undertaking.

GOLDMAN SACHS INTERNATIONAL (UNLIMITED COMPANY)
Notes to the Financial Statements
76
Note 21.
Provisions for Liabilities
The table below presents the company’s provisions for
liabilities, which are in respect of legal claims made against the
company.
$ in millions 2015
As of January 1 $ 17
Charge to the profit and loss account 8
Reduction in provision (7)
Utilised during the year (17)
Foreign exchange gain (1)
As of December 31 $ –
Further details relating to the provisions have not been
disclosed as permitted by IAS 37 ‘Provisions, Contingent
Liabilities and Contingent Assets’, on the grounds that it would
be seriously prejudicial to do so.
Note 22.
Share Capital
The table below presents the company’s share capital.
Ordinary shares
Allotted, called up and fully paid of $1 each $ in millions
As of January 1, 2015 533,447,150 $533
Allotted during the year 48,517,011 49
As of December 31, 2015 581,964,161 $582
During the year, the directors and shareholder of the company
reviewed GSI’s capital requirements and new ordinary shares
were issued in order to increase the company’s regulatory
capital and further support ongoing business activities.
On June 10, 2015, 36,088,475 ordinary shares of $1 each were
allotted at $42.95 to GSGUK. The total consideration received
was $1,550,000,000 in cash incorporating a share premium of
$1,513,911,525.
On June 29, 2015, 12,428,536 ordinary shares of $1 each were
allotted at $40.23 to GSGUK. The total consideration received
was $500,000,000 in cash incorporating a share premium of
$487,571,464.
Note 23.
Cash and Cash Equivalents
The table below presents the company’s cash and cash
equivalents for the purpose of the statements of cash flows.
As of December
$ in millions 2015 2014
Cash at bank and in hand $9,974 $3,586
Overdrafts (see Note 20) (4) (9)
Total cash and cash equivalents $9,970 $3,577
Note 24.
Reconciliation of Cash Flows From
Operating Activities
The table below presents the company’s reconciliation of cash
flows from operating activities.
Year Ended December
$ in millions 2015 2014
Profit on ordinary activities before taxation $(102,661 $ 2,060
Adjustments for
Depreciation of tangible fixed assets
(see Notes 6 and 13) 4 4
Loss on sale of fixed assets (see Note 6) – 1
Charge for defined benefit plan (see Note 10) 16 39
Foreign exchange losses 433 208
Share-based compensation expense 502 770
Provision for liabilities 1 (10)
Interest payable and similar charges (see Note 9) 285 222
Cash generated before changes in operating
assets and liabilities 3,902 3,294
Changes in operating assets
Decrease/(increase) in financial instruments owned 77,694 (178,014)
Decrease in collateralised agreements 39,813 7,962
Decrease/(increase) in debtors 6,194 (8,390)
123,701 (178,442)
Changes in operating liabilities
Increase/(decrease) in financial instruments
sold, but not yet purchased (85,759) 184,952
Decrease in collateralised financings (21,764) (34,184)
Increase/(decrease) in other creditors (17,137) 24,502
Increase/(decrease) in provisions for liabilities (17) 10
(124,677) 175,280
Contributions paid to defined benefit plan
(see Note 10) (37) (44)
Cash generated from operations $(122,889 $ 88
Cash generated from operations includes interest paid of $2.16
billion and $2.03 billion as of December 2015 and December
2014, respectively, and interest received of $2.22 billion and
$2.45 billion, as of December 2015 and December 2014,
respectively.

GOLDMAN SACHS INTERNATIONAL (UNLIMITED COMPANY)
Notes to the Financial Statements
77
Note 25.
Financial Commitments and Contingencies
Commitments and Contingencies
The table below presents the company’s commitments and
contingencies.
As of December
$ in millions 2015 2014
Contingent and forward starting resale
and securities borrowing agreements $29,276 $34,572
Forward starting repurchase and secured
lending agreements 11,483 14,760
Other 4,137 4,001
Total $44,896 $53,333
The company enters into resale and securities borrowing
agreements and repurchase and secured lending agreements
that settle at a future date, generally within three business days.
The company also enters into commitments to provide
contingent financing to its clients and counterparties through
resale agreements. The company’s funding of these
commitments depends on the satisfaction of all contractual
conditions to the resale agreement and these commitments can
expire unused.
Other commitments primarily relate to collateral commitments.
In addition, there are registered charges on the company’s
assets which have arisen in the ordinary course of business.
Leases
The company leases certain buildings under long-term lease
agreements. Under these lease agreements, which are subject to
renegotiation at various intervals specified in the leases, the
company pays all insurance, maintenance and repairs of these
properties. The table below presents future minimum rental
payments.
As of December
$ in millions 2015 2014
Less than one year $095 $098
Between one and five years 347 385
Over five years 16 80
Total $458 $563
Total future minimum sublease payments expected to be
received under non-cancellable subleases as of December 2015
and December 2014 were $70 million and $90 million,
respectively.
Legal Proceedings
The company is involved in the below legal proceedings,
however it is not practicable to estimate an impact, if any, of
these proceedings.
Credit Derivatives Antitrust Matters. On December 4,
2015, the European Commission announced that it had closed
antitrust proceedings against all banks, including GSI, involved
in the European Commission’s investigation, announced in
April 2011, of numerous financial services companies in
connection with the supply of data related to credit default
swaps and in connection with profit sharing and fee
arrangements for clearing of credit default swaps, including
potential anti-competitive practices.
Mortgage-Related Matters. Various alleged purchasers of,
and counterparties involved in transactions relating to,
mortgage pass-through certificates, collateralised debt
obligations and other mortgage-related products (including
Aozora Bank, Ltd., Basis Yield Alpha Fund (Master) and IKB
Deutsche Industriebank AG) have filed complaints in the
United States against the company and certain of its affiliates,
generally alleging that the offering documents for the securities
that they purchased contained untrue statements of material
fact and material omissions and generally seeking rescission
and/or damages. Certain of these complaints allege fraud and
seek punitive damages.
Libya-Related Litigation. GSI is the defendant in an action
filed on January 21, 2014 with the High Court of Justice in
London by the Libyan Investment Authority, relating to nine
derivative transactions between the plaintiff and GSI and
seeking, among other things, rescission of the transactions and
unspecified equitable compensation and damages exceeding $1
billion. On December 4, 2014, the Libyan Investment
Authority filed an amended statement of claim.
Interest Rate Swap Antitrust Litigation. GSI is among
the defendants named in a putative antitrust class action
relating to the trading of interest rate swaps, filed on November
25, 2015 in the U.S. District Court for the Southern District of
New York. The complaint generally alleges a conspiracy
among the dealers and brokers since at least January 1, 2008 to
preclude exchange trading of interest rate swaps. The
complaint seeks declaratory and injunctive relief as well as
treble damages in an unspecified amount.
GOLDMAN SACHS INTERNATIONAL (UNLIMITED COMPANY)
Notes to the Financial Statements
78
Commodities-Related Litigation. GSI is among the
defendants named in a number of putative class actions filed
beginning on August 1, 2013 and consolidated in the U.S.
District Court for the Southern District of New York. The
complaints generally allege violations of federal antitrust laws
and state laws in connection with the storage of aluminium and
aluminium trading. The complaints seek declaratory, injunctive
and other equitable relief as well as unspecified monetary
damages, including treble damages. On August 29, 2014, the
court granted the Goldman Sachs defendants’ motion to
dismiss. Certain plaintiffs appealed on September 24, 2014,
and the remaining plaintiffs sought to amend their complaints
in October 2014. On March 26, 2015, the court granted in part
and denied in part plaintiffs’ motions for leave to amend their
complaints, rejecting their monopolisation claims and most
state law claims but permitting their antitrust conspiracy claims
and certain parallel state law and unjust enrichment claims to
proceed, and the court directed the remaining plaintiffs to file
their amended complaints, which they did on April 9, 2015.
GSI is among the defendants in putative class actions, filed
beginning May 23, 2014 in the U.S. District Court for the
Southern District of New York, based on alleged violations of
the federal antitrust laws in connection with the management
of zinc storage facilities. The complaints seek declaratory,
injunctive and other equitable relief as well as unspecified
monetary damages, including treble damages. On January 7,
2016, the court granted the defendants’ motion to dismiss.
GSI is among the defendants named in putative class actions
relating to trading in platinum and palladium, filed beginning
on November 25, 2014, in the U.S. District Court for the
Southern District of New York. The complaints generally
allege that the defendants violated federal antitrust laws and
the Commodity Exchange Act in connection with an alleged
conspiracy to manipulate a benchmark for physical platinum
and palladium prices and seek declaratory and injunctive relief
as well as treble damages in an unspecified amount. On July
27, 2015, plaintiffs filed a second amended consolidated
complaint, and on September 21, 2015, the defendants moved
to dismiss.
Note 26.
Financial Risk Management and Capital
Management
Certain disclosures in relation to the company’s financial risk
management and capital management have been presented
alongside other risk management and regulatory information in
Part I of this annual report.
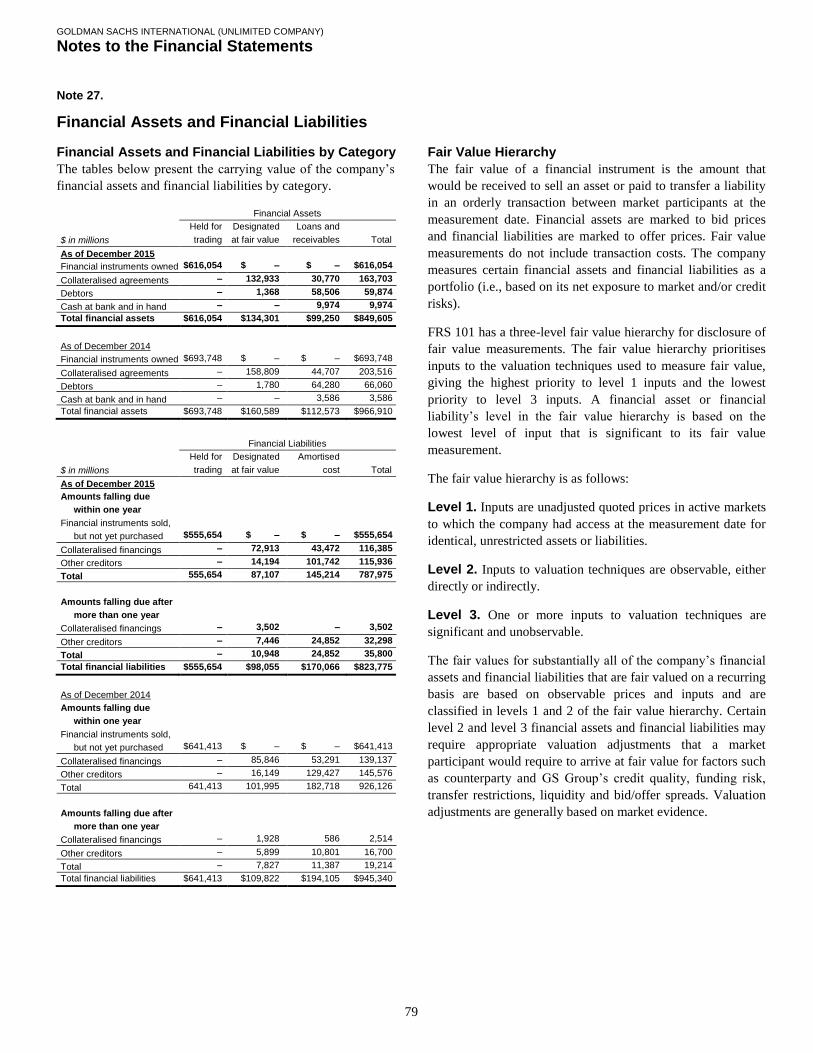
GOLDMAN SACHS INTERNATIONAL (UNLIMITED COMPANY)
Notes to the Financial Statements
79
Note 27.
Financial Assets and Financial Liabilities
Financial Assets and Financial Liabilities by Category
The tables below present the carrying value of the company’s
financial assets and financial liabilities by category.
Financial Assets
Held for Designated Loans and
$ in millions trading at fair value receivables Total
As of December 2015
Financial instruments owned $616,054 $ – $ – $616,054
Collateralised agreements – 132,933 30,770 163,703
Debtors – 1,368 58,506 59,874
Cash at bank and in hand – – 9,974 9,974
Total financial assets $616,054 $134,301 $99,250 $849,605
As of December 2014
Financial instruments owned $693,748 $ – $ – $693,748
Collateralised agreements – 158,809 44,707 203,516
Debtors – 1,780 64,280 66,060
Cash at bank and in hand – – 3,586 3,586
Total financial assets $693,748 $160,589 $112,573 $966,910
Financial Liabilities
Held for Designated Amortised
$ in millions trading at fair value cost Total
As of December 2015
Amounts falling due
within one year
Financial instruments sold,
but not yet purchased $555,654 $ – $ – $555,654
Collateralised financings – 72,913 43,472 116,385
Other creditors – 14,194 101,742 115,936
Total 555,654 87,107 145,214 787,975
Amounts falling due after
more than one year
Collateralised financings – 3,502 – 3,502
Other creditors – 7,446 24,852 32,298
Total – 10,948 24,852 35,800
Total financial liabilities $555,654 $98,055 $170,066 $823,775
As of December 2014
Amounts falling due
within one year
Financial instruments sold,
but not yet purchased $641,413 $ – $ – $641,413
Collateralised financings – 85,846 53,291 139,137
Other creditors – 16,149 129,427 145,576
Total 641,413 101,995 182,718 926,126
Amounts falling due after
more than one year
Collateralised financings – 1,928 586 2,514
Other creditors – 5,899 10,801 16,700
Total – 7,827 11,387 19,214
Total financial liabilities $641,413 $109,822 $194,105 $945,340
Fair Value Hierarchy
The fair value of a financial instrument is the amount that
would be received to sell an asset or paid to transfer a liability
in an orderly transaction between market participants at the
measurement date. Financial assets are marked to bid prices
and financial liabilities are marked to offer prices. Fair value
measurements do not include transaction costs. The company
measures certain financial assets and financial liabilities as a
portfolio (i.e., based on its net exposure to market and/or credit
risks).
FRS 101 has a three-level fair value hierarchy for disclosure of
fair value measurements. The fair value hierarchy prioritises
inputs to the valuation techniques used to measure fair value,
giving the highest priority to level 1 inputs and the lowest
priority to level 3 inputs. A financial asset or financial
liability’s level in the fair value hierarchy is based on the
lowest level of input that is significant to its fair value
measurement.
The fair value hierarchy is as follows:
Level 1. Inputs are unadjusted quoted prices in active markets
to which the company had access at the measurement date for
identical, unrestricted assets or liabilities.
Level 2. Inputs to valuation techniques are observable, either
directly or indirectly.
Level 3. One or more inputs to valuation techniques are
significant and unobservable.
The fair values for substantially all of the company’s financial
assets and financial liabilities that are fair valued on a recurring
basis are based on observable prices and inputs and are
classified in levels 1 and 2 of the fair value hierarchy. Certain
level 2 and level 3 financial assets and financial liabilities may
require appropriate valuation adjustments that a market
participant would require to arrive at fair value for factors such
as counterparty and GS Group’s credit quality, funding risk,
transfer restrictions, liquidity and bid/offer spreads. Valuation
adjustments are generally based on market evidence.
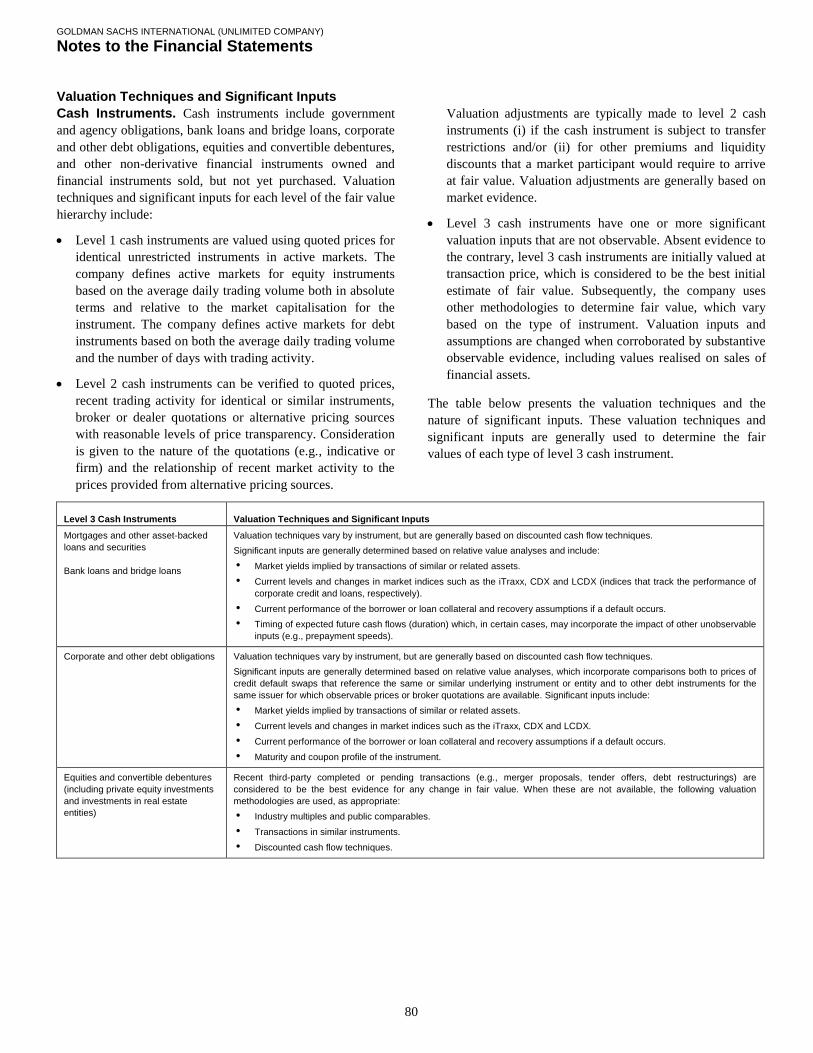
GOLDMAN SACHS INTERNATIONAL (UNLIMITED COMPANY)
Notes to the Financial Statements
80
Valuation Techniques and Significant Inputs
Cash Instruments. Cash instruments include government
and agency obligations, bank loans and bridge loans, corporate
and other debt obligations, equities and convertible debentures,
and other non-derivative financial instruments owned and
financial instruments sold, but not yet purchased. Valuation
techniques and significant inputs for each level of the fair value
hierarchy include:
Level 1 cash instruments are valued using quoted prices for
identical unrestricted instruments in active markets. The
company defines active markets for equity instruments
based on the average daily trading volume both in absolute
terms and relative to the market capitalisation for the
instrument. The company defines active markets for debt
instruments based on both the average daily trading volume
and the number of days with trading activity.
Level 2 cash instruments can be verified to quoted prices,
recent trading activity for identical or similar instruments,
broker or dealer quotations or alternative pricing sources
with reasonable levels of price transparency. Consideration
is given to the nature of the quotations (e.g., indicative or
firm) and the relationship of recent market activity to the
prices provided from alternative pricing sources.
Valuation adjustments are typically made to level 2 cash
instruments (i) if the cash instrument is subject to transfer
restrictions and/or (ii) for other premiums and liquidity
discounts that a market participant would require to arrive
at fair value. Valuation adjustments are generally based on
market evidence.
Level 3 cash instruments have one or more significant
valuation inputs that are not observable. Absent evidence to
the contrary, level 3 cash instruments are initially valued at
transaction price, which is considered to be the best initial
estimate of fair value. Subsequently, the company uses
other methodologies to determine fair value, which vary
based on the type of instrument. Valuation inputs and
assumptions are changed when corroborated by substantive
observable evidence, including values realised on sales of
financial assets.
The table below presents the valuation techniques and the
nature of significant inputs. These valuation techniques and
significant inputs are generally used to determine the fair
values of each type of level 3 cash instrument.
Level 3 Cash Instruments Valuation Techniques and Significant Inputs
Mortgages and other asset-backed
loans and securities
Bank loans and bridge loans
Valuation techniques vary by instrument, but are generally based on discounted cash flow techniques.
Significant inputs are generally determined based on relative value analyses and include:
• Market yields implied by transactions of similar or related assets.
• Current levels and changes in market indices such as the iTraxx, CDX and LCDX (indices that track the performance of
corporate credit and loans, respectively).
• Current performance of the borrower or loan collateral and recovery assumptions if a default occurs.
• Timing of expected future cash flows (duration) which, in certain cases, may incorporate the impact of other unobservable
inputs (e.g., prepayment speeds).
Corporate and other debt obligations Valuation techniques vary by instrument, but are generally based on discounted cash flow techniques.
Significant inputs are generally determined based on relative value analyses, which incorporate comparisons both to prices of
credit default swaps that reference the same or similar underlying instrument or entity and to other debt instruments for the
same issuer for which observable prices or broker quotations are available. Significant inputs include:
• Market yields implied by transactions of similar or related assets.
• Current levels and changes in market indices such as the iTraxx, CDX and LCDX.
• Current performance of the borrower or loan collateral and recovery assumptions if a default occurs.
• Maturity and coupon profile of the instrument.
Equities and convertible debentures
(including private equity investments
and investments in real estate
entities)
Recent third-party completed or pending transactions (e.g., merger proposals, tender offers, debt restructurings) are
considered to be the best evidence for any change in fair value. When these are not available, the following valuation
methodologies are used, as appropriate:
• Industry multiples and public comparables.
• Transactions in similar instruments.
• Discounted cash flow techniques.

GOLDMAN SACHS INTERNATIONAL (UNLIMITED COMPANY)
Notes to the Financial Statements
81
Derivative Instruments. Derivatives may be traded on an
exchange (exchange-traded) or they may be privately
negotiated contracts, which are usually referred to as OTC
derivatives. Certain of the company’s OTC derivatives are
cleared and settled through central clearing counterparties
(OTC-cleared), while others are bilateral contracts between
two counterparties (bilateral OTC).
The company’s level 2 and level 3 derivatives are valued using
derivative pricing models (e.g., discounted cash flow models,
correlation models, and models that incorporate option pricing
methodologies, such as Monte Carlo simulations). Price
transparency of derivatives can generally be characterised by
product type, as described below.
Interest Rate. In general, the key inputs used to value
interest rate derivatives are transparent, even for most long-
dated contracts. Interest rate swaps and options
denominated in the currencies of leading industrialised
nations are characterised by high trading volumes and tight
bid/offer spreads. Interest rate derivatives that reference
indices, such as an inflation index, or the shape of the yield
curve (e.g., 10-year swap rate vs. 2-year swap rate) are
more complex, but the key inputs are generally observable.
Credit. Price transparency for credit default swaps,
including both single names and baskets of credits, varies
by market and underlying reference entity or obligation.
Credit default swaps that reference indices, large corporates
and major sovereigns generally exhibit the most price
transparency. For credit default swaps with other
underliers, price transparency varies based on credit rating,
the cost of borrowing the underlying reference obligations,
and the availability of the underlying reference obligations
for delivery upon the default of the issuer. Credit default
swaps that reference loans, asset-backed securities and
emerging market debt instruments tend to have less price
transparency than those that reference corporate bonds. In
addition, more complex credit derivatives, such as those
sensitive to the correlation between two or more underlying
reference obligations, generally have less price
transparency.
Currency. Prices for currency derivatives based on the
exchange rates of leading industrialised nations, including
those with longer tenors, are generally transparent. The
primary difference between the price transparency of
developed and emerging market currency derivatives is that
emerging markets tend to be observable for contracts with
shorter tenors.
Equity. Price transparency for equity derivatives varies by
market and underlier. Options on indices and the common
stock of corporates included in major equity indices exhibit
the most price transparency. Equity derivatives generally
have observable market prices, except for contracts with
long tenors or reference prices that differ significantly from
current market prices. More complex equity derivatives,
such as those sensitive to the correlation between two or
more individual stocks, generally have less price
transparency.
Liquidity is essential to observability of all product types. If
transaction volumes decline, previously transparent prices and
other inputs may become unobservable. Conversely, even
highly structured products may at times have trading volumes
large enough to provide observability of prices and other
inputs.
Level 1 Derivatives
Level 1 derivatives include short-term contracts for future
delivery of securities when the underlying security is a level 1
instrument, and exchange-traded derivatives if they are actively
traded and are valued at their quoted market price.
Level 2 Derivatives
Level 2 derivatives include OTC derivatives for which all
significant valuation inputs are corroborated by market
evidence and exchange-traded derivatives that are not actively
traded and/or that are valued using models that calibrate to
market-clearing levels of OTC derivatives. In evaluating the
significance of a valuation input, the company considers,
among other factors, a portfolio’s net risk exposure to that
input.
The selection of a particular model to value a derivative
depends on the contractual terms of and specific risks inherent
in the instrument, as well as the availability of pricing
information in the market. For derivatives that trade in liquid
markets, model selection does not involve significant
management judgement because outputs of models can be
calibrated to market-clearing levels.
Valuation models require a variety of inputs, such as
contractual terms, market prices, yield curves, discount rates
(including those derived from interest rates on collateral
received and posted as specified in credit support agreements
for collateralised derivatives), credit curves, measures of
volatility and correlations of such inputs. Significant inputs to
the valuations of level 2 derivatives can be verified to market
transactions, broker or dealer quotations or other alternative
pricing sources with reasonable levels of price transparency.
Consideration is given to the nature of the quotations (e.g.,
indicative or firm) and the relationship of recent market
activity to the prices provided from alternative pricing sources.

GOLDMAN SACHS INTERNATIONAL (UNLIMITED COMPANY)
Notes to the Financial Statements
82
Level 3 Derivatives
Level 3 derivatives are valued using models which utilise
observable level 1 and/or level 2 inputs, as well as
unobservable level 3 inputs. Unobservable inputs include
certain correlations as well as credit spreads and equity
volatility inputs.
Subsequent to the initial valuation of a level 3 derivative, the
company updates the level 1 and level 2 inputs to reflect
observable market changes and any resulting gains and losses
are recorded in level 3. Level 3 inputs are changed when
corroborated by evidence such as similar market transactions,
third-party pricing services and/or broker or dealer quotations
or other empirical market data. In circumstances where the
company cannot verify the model value by reference to market
transactions, it is possible that a different valuation model
could produce a materially different estimate of fair value. See
below for further information about significant unobservable
inputs used in the valuation of level 3 derivatives.
Where there is a difference between the initial transaction price
and the fair value calculated by internal models, a gain or loss
is recognised after initial recognition only to the extent that it
arises from a change in a factor (including time) that market
participants would consider in setting a price.
Valuation Adjustments
Valuation adjustments are integral to determining the fair value
of derivative portfolios and are used to adjust the mid-market
valuations produced by derivative pricing models to the
appropriate exit price valuation. These adjustments incorporate
bid/offer spreads, the cost of liquidity, credit valuation
adjustments and funding valuation adjustments, which account
for the credit and funding risk inherent in the uncollateralised
portion of derivative portfolios. The company also makes
funding valuation adjustments to collateralised derivatives
where the terms of the agreement do not permit the company to
deliver or repledge collateral received. Market-based inputs
are generally used when calibrating valuation adjustments to
market-clearing levels.
In addition, for derivatives that include significant
unobservable inputs, the company makes model or exit price
adjustments to account for the valuation uncertainty present in
the transaction.
Collateralised Agreements and Collateralised
Financings. The significant inputs to the valuation of resale
and repurchase agreements and securities borrowed and loaned
are funding spreads, the amount and timing of expected future
cash flows and interest rates.
Debtors. Debtors measured at fair value are primarily
comprised of secured lending and prepaid commodity
contracts. The significant inputs to the valuation of such
receivables are commodity prices, interest rates, the amount
and timing of expected future cash flows and funding spreads.
Other Creditors. Other creditors primarily comprise hybrid
financial instruments and prepaid commodity contracts.
The significant inputs to the valuation of secured other
creditors measured at fair value are the amount and timing of
expected future cash flows, interest rates, funding spreads, the
fair value of the collateral delivered by the company (which is
determined using the amount and timing of expected future
cash flows, market prices, market yields and recovery
assumptions) and the frequency of additional collateral calls.
The significant inputs to the valuation of unsecured other
creditors measured at fair value are the amount and timing of
expected future cash flows, interest rates, the credit spreads of
GS Group, as well as commodity prices in the case of prepaid
commodity contracts. The inputs used to value the embedded
derivative component of hybrid financial instruments are
consistent with the inputs used to value the company’s other
derivative instruments.
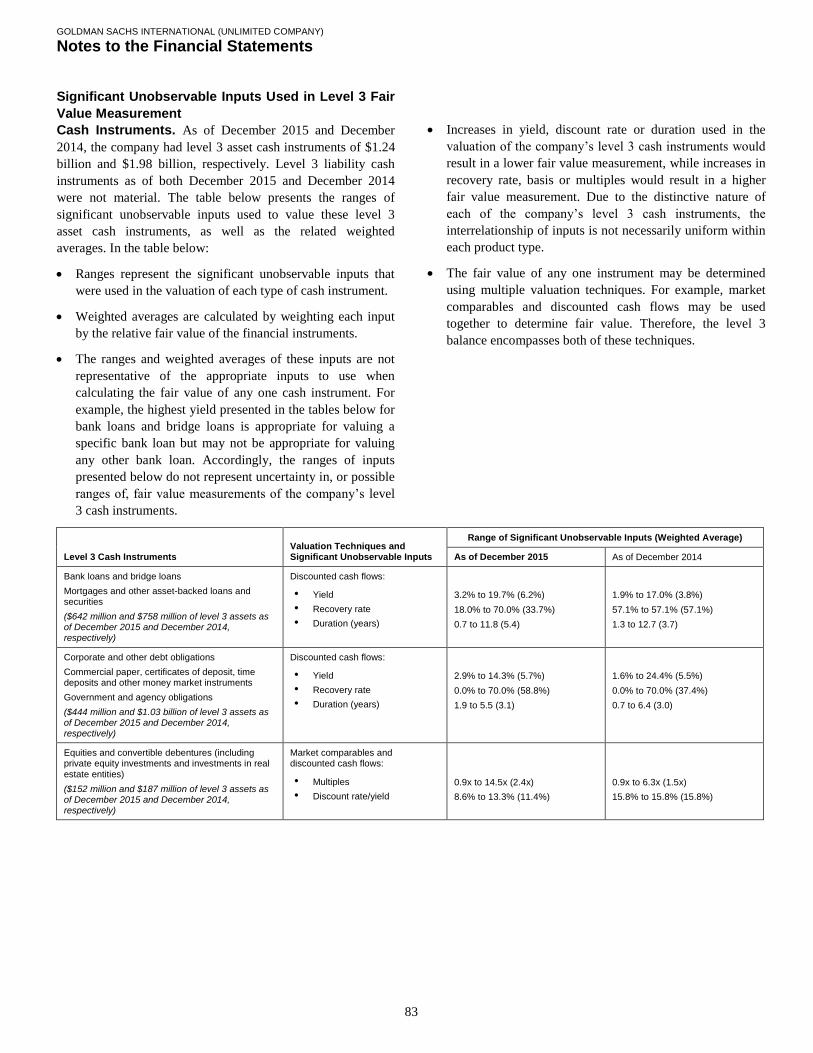
GOLDMAN SACHS INTERNATIONAL (UNLIMITED COMPANY)
Notes to the Financial Statements
83
Significant Unobservable Inputs Used in Level 3 Fair
Value Measurement
Cash Instruments. As of December 2015 and December
2014, the company had level 3 asset cash instruments of $1.24
billion and $1.98 billion, respectively. Level 3 liability cash
instruments as of both December 2015 and December 2014
were not material. The table below presents the ranges of
significant unobservable inputs used to value these level 3
asset cash instruments, as well as the related weighted
averages. In the table below:
Ranges represent the significant unobservable inputs that
were used in the valuation of each type of cash instrument.
Weighted averages are calculated by weighting each input
by the relative fair value of the financial instruments.
The ranges and weighted averages of these inputs are not
representative of the appropriate inputs to use when
calculating the fair value of any one cash instrument. For
example, the highest yield presented in the tables below for
bank loans and bridge loans is appropriate for valuing a
specific bank loan but may not be appropriate for valuing
any other bank loan. Accordingly, the ranges of inputs
presented below do not represent uncertainty in, or possible
ranges of, fair value measurements of the company’s level
3 cash instruments.
Increases in yield, discount rate or duration used in the
valuation of the company’s level 3 cash instruments would
result in a lower fair value measurement, while increases in
recovery rate, basis or multiples would result in a higher
fair value measurement. Due to the distinctive nature of
each of the company’s level 3 cash instruments, the
interrelationship of inputs is not necessarily uniform within
each product type.
The fair value of any one instrument may be determined
using multiple valuation techniques. For example, market
comparables and discounted cash flows may be used
together to determine fair value. Therefore, the level 3
balance encompasses both of these techniques.
Level 3 Cash Instruments Valuation Techniques and Significant Unobservable Inputs
Range of Significant Unobservable Inputs (Weighted Average)
As of December 2015 As of December 2014
Bank loans and bridge loans
Mortgages and other asset-backed loans and securities
($642 million and $758 million of level 3 assets as of December 2015 and December 2014, respectively)
Discounted cash flows:
• Yield
• Recovery rate
• Duration (years)
3.2% to 19.7% (6.2%)
18.0% to 70.0% (33.7%)
0.7 to 11.8 (5.4)
1.9% to 17.0% (3.8%)
57.1% to 57.1% (57.1%)
1.3 to 12.7 (3.7)
Corporate and other debt obligations
Commercial paper, certificates of deposit, time deposits and other money market instruments
Government and agency obligations
($444 million and $1.03 billion of level 3 assets as of December 2015 and December 2014, respectively)
Discounted cash flows:
• Yield
• Recovery rate
• Duration (years)
2.9% to 14.3% (5.7%)
0.0% to 70.0% (58.8%)
1.9 to 5.5 (3.1)
1.6% to 24.4% (5.5%)
0.0% to 70.0% (37.4%)
0.7 to 6.4 (3.0)
Equities and convertible debentures (including private equity investments and investments in real estate entities)
($152 million and $187 million of level 3 assets as of December 2015 and December 2014, respectively)
Market comparables and discounted cash flows:
• Multiples
• Discount rate/yield
0.9x to 14.5x (2.4x)
8.6% to 13.3% (11.4%)
0.9x to 6.3x (1.5x)
15.8% to 15.8% (15.8%)
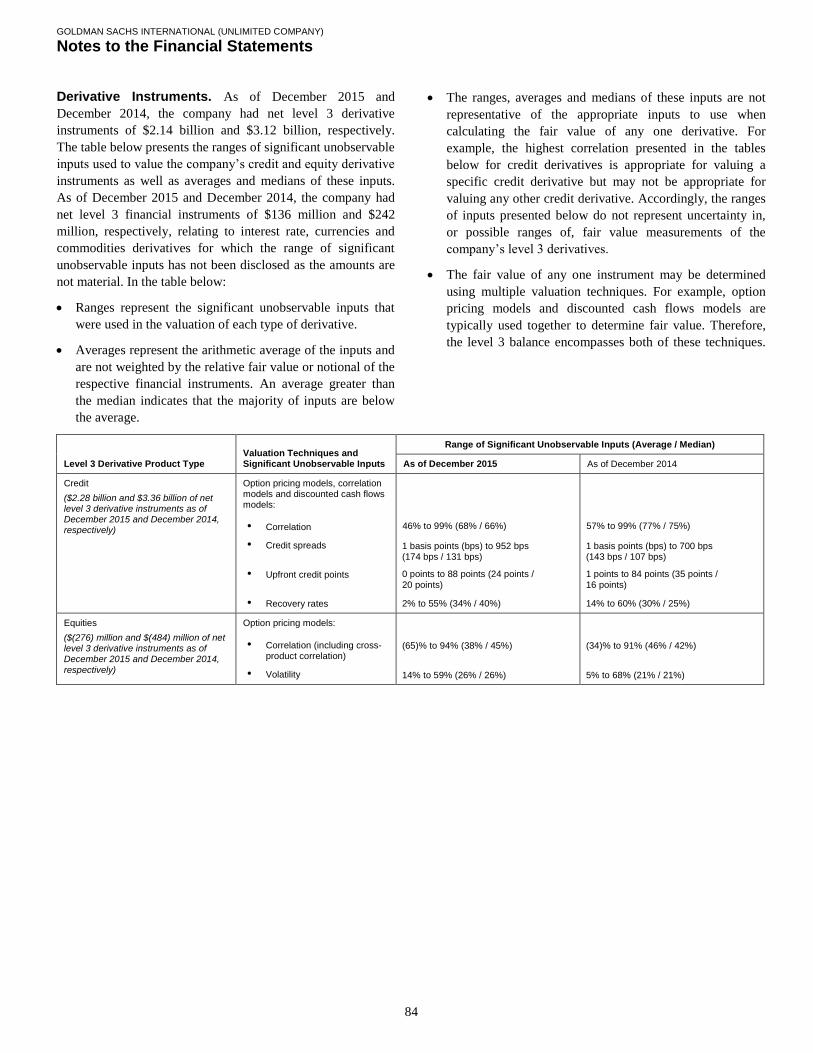
GOLDMAN SACHS INTERNATIONAL (UNLIMITED COMPANY)
Notes to the Financial Statements
84
Derivative Instruments. As of December 2015 and
December 2014, the company had net level 3 derivative
instruments of $2.14 billion and $3.12 billion, respectively.
The table below presents the ranges of significant unobservable
inputs used to value the company’s credit and equity derivative
instruments as well as averages and medians of these inputs.
As of December 2015 and December 2014, the company had
net level 3 financial instruments of $136 million and $242
million, respectively, relating to interest rate, currencies and
commodities derivatives for which the range of significant
unobservable inputs has not been disclosed as the amounts are
not material. In the table below:
Ranges represent the significant unobservable inputs that
were used in the valuation of each type of derivative.
Averages represent the arithmetic average of the inputs and
are not weighted by the relative fair value or notional of the
respective financial instruments. An average greater than
the median indicates that the majority of inputs are below
the average.
The ranges, averages and medians of these inputs are not
representative of the appropriate inputs to use when
calculating the fair value of any one derivative. For
example, the highest correlation presented in the tables
below for credit derivatives is appropriate for valuing a
specific credit derivative but may not be appropriate for
valuing any other credit derivative. Accordingly, the ranges
of inputs presented below do not represent uncertainty in,
or possible ranges of, fair value measurements of the
company’s level 3 derivatives.
The fair value of any one instrument may be determined
using multiple valuation techniques. For example, option
pricing models and discounted cash flows models are
typically used together to determine fair value. Therefore,
the level 3 balance encompasses both of these techniques.
Level 3 Derivative Product Type Valuation Techniques and Significant Unobservable Inputs
Range of Significant Unobservable Inputs (Average / Median)
As of December 2015 As of December 2014
Credit
($2.28 billion and $3.36 billion of net level 3 derivative instruments as of December 2015 and December 2014, respectively)
Option pricing models, correlation models and discounted cash flows models:
• Correlation
• Credit spreads
• Upfront credit points
• Recovery rates
46% to 99% (68% / 66%)
1 basis points (bps) to 952 bps (174 bps / 131 bps)
0 points to 88 points (24 points / 20 points)
2% to 55% (34% / 40%)
57% to 99% (77% / 75%)
1 basis points (bps) to 700 bps (143 bps / 107 bps)
1 points to 84 points (35 points / 16 points)
14% to 60% (30% / 25%)
Equities
($(276) million and $(484) million of net level 3 derivative instruments as of December 2015 and December 2014,
respectively)
Option pricing models:
• Correlation (including cross-product correlation)
• Volatility
(65)% to 94% (38% / 45%)
14% to 59% (26% / 26%)
(34)% to 91% (46% / 42%)
5% to 68% (21% / 21%)

GOLDMAN SACHS INTERNATIONAL (UNLIMITED COMPANY)
Notes to the Financial Statements
85
Range of Significant Unobservable Inputs
The following is information about the ranges of significant
unobservable inputs used to value the company’s level 3
derivative instruments:
Correlation. Ranges for correlation cover a variety of
underliers both within one market (e.g., equity index and
equity single stock names) and across markets (e.g.,
correlation of an equity index and a foreign exchange rate),
as well as across regions.
Volatility. Ranges for volatility cover numerous underliers
across a variety of markets, maturities and strike prices. For
example, volatility of equity indices is generally lower than
volatility of single stocks.
Credit spreads, upfront credit points and recovery
rates. The ranges for credit spreads, upfront credit points
and recovery rates cover a variety of underliers (index and
single names), regions, sectors, maturities and credit
qualities (high-yield and investment-grade). The broad
range of this population gives rise to the width of the ranges
of significant unobservable inputs.
Sensitivity of Fair Value Measurement to Changes in
Significant Unobservable Inputs
The following is a description of the directional sensitivity of
the company’s level 3 fair value measurements to changes in
significant unobservable inputs, in isolation:
Correlation. In general, for contracts where the holder
benefits from the consistent directional performance of the
underlying asset or index prices (e.g., interest rates, credit
spreads, foreign exchange rates, inflation rates and equity
prices), an increase in correlation results in a higher fair
value measurement.
Volatility. In general, for purchased options, an increase in
volatility results in a higher fair value measurement.
Credit spreads, upfront credit points and recovery
rates. In general, the fair value of purchased credit
protection increases as credit spreads or upfront credit
points increase or recovery rates decrease. Credit spreads,
upfront credit points and recovery rates are strongly related
to distinctive risk factors of the underlying reference
obligations. These include reference entity-specific factors
such as leverage, volatility and industry; market-based risk
factors, such as borrowing costs or liquidity of the
underlying reference obligation; and macroeconomic
conditions.
Due to the distinctive nature of each of the company’s level 3
derivatives, the interrelationship of inputs is not necessarily
uniform within each product type.
Collateralised Agreements and Collateralised
Financings. As of both December 2015 and December 2014,
the company had no level 3 resale agreements, securities
borrowed or securities loaned. As of both December 2015 and
December 2014, the company’s level 3 repurchase agreements
were not material.
Debtors. As of both December 2015 and December 2014, the
company’s level 3 debtors were $nil.
Other Creditors. As of both December 2015 and December
2014, the significant unobservable inputs used to value the
company’s secured level 3 other creditors have been
incorporated in the company’s cash instruments disclosures
related to unobservable inputs. See “Cash Instruments” above.
As of both December 2015 and December 2014, substantially
all of the company’s unsecured level 3 other creditors are
hybrid financial instruments. As the significant unobservable
inputs used to value hybrid financial instruments primarily
relate to the embedded derivative component of these
borrowings, these inputs are incorporated in the company’s
derivative disclosures related to unobservable inputs. See
“Derivative Instruments” above.

GOLDMAN SACHS INTERNATIONAL (UNLIMITED COMPANY)
Notes to the Financial Statements
86
Fair Value of Financial Assets and Financial
Liabilities by Level
The tables below present, by level within the fair value
hierarchy, financial assets and financial liabilities measured at
fair value on a recurring basis.
Financial Assets and Financial Liabilities
at Fair Value as of December 2015
$ in millions Level 1 Level 2 Level 3 Total
Financial Assets
Cash instruments $48,198 $ 17,501 $1,238 $ 66,937
Derivative instruments 14 544,300 4,803 549,117
Financial instruments owned 48,212 561,801 6,041 616,054
Collateralised agreements – 132,933 – 132,933
Debtors – 1,368 – 1,368
Total financial assets $48,212 $696,102 $6,041 $750,355
Financial Liabilities
Amounts falling due within
one year
Cash instruments $21,038 $003,584 $0,062 $ 24,684
Derivative instruments 28 528,277 2,665 530,970
Financial instruments sold,
but not yet purchased 21,066 531,861 2,727 555,654
Collateralised financings – 72,842 71 72,913
Other creditors – 10,715 3,479 14,194
Total 21,066 615,418 6,277 642,761
Amounts falling due after
more than one year
Collateralised financings – 3,502 – 3,502
Other creditors – 5,322 2,124 7,446
Total – 8,824 2,124 10,948
Total financial liabilities $21,066 $624,242 $8,401 $653,709
Net derivative instruments $ (14) $ 16,023 $2,138 $ 18,147
Financial Assets and Financial Liabilities
at Fair Value as of December 2014
$ in millions Level 1 Level 2 Level 3 Total
Financial Assets
Cash instruments $40,292 $023,983 $1,976 $066,251
Derivative instruments 17 621,663 5,817 627,497
Financial instruments owned 40,309 645,646 7,793 693,748
Collateralised agreements – 158,809 – 158,809
Debtors – 1,780 – 1,780
Total financial assets $40,309 $806,235 $7,793 $854,337
Financial Liabilities
Amounts falling due within
one year
Cash instruments $22,740 $004,889 $0,021 $027,650
Derivative instruments 34 611,032 2,697 613,763
Financial instruments sold,
including financial
but not yet purchased 22,774 615,921 2,718 641,413
Collateralised financings – 85,722 124 85,846
Other creditors – 13,412 2,737 16,149
Total 22,774 715,055 5,579 743,408
Amounts falling due after
more than one year
Collateralised financings – 1,928 – 1,928
Other creditors – 5,056 843 5,899
Total – 6,984 843 7,827
Total financial liabilities $22,774 $722,039 $6,422 $751,235
Net derivative instruments $ (17) $ 10,631 $3,120 $013,734
Transfers Between Level 1 and Level 2 of the Fair
Value Hierarchy
During 2015 and 2014, there were no significant transfers
between level 1 and level 2 financial assets and financial
liabilities measured at fair value on a recurring basis.
Level 3 Rollforward
The table below presents the changes in fair value for all level
3 financial assets and financial liabilities measured at fair value
on a recurring basis. Gains and losses arising on level 3 assets
are recognised within net revenues in the profit and loss
account. In the table below:
If a financial asset or financial liability was transferred to
level 3 during a reporting period, its entire gain or loss for
the period is included in level 3. For level 3 financial assets,
increases are shown as positive amounts, while decreases
are shown as negative amounts. For level 3 financial
liabilities, increases are shown as negative amounts, while
decreases are shown as positive amounts.
Transfers between levels are recognised at the beginning of
the reporting period in which they occur. Accordingly, the
tables do not include gains or losses for level 3 financial
assets and financial liabilities that were transferred out of
level 3 prior to the end of the period.
Level 3 financial assets and financial liabilities are
frequently economically hedged with level 1 and level 2
financial assets and financial liabilities. Accordingly, level
3 gains or losses that are reported in the table below for a
particular class of financial asset or financial liability can
be partially offset by gains or losses attributable to level 1
or level 2 in the same class of financial asset or financial
liability or gains or losses attributable to level 1, level 2 or
level 3 in a different class of financial asset or financial
liability. As a result, gains or losses included in the level 3
rollforward below do not necessarily represent the overall
impact on the company’s results of operations, liquidity or
capital resources.
See “Level 3 Rollforward Commentary” below for an
explanation of transfers into and transfers out of level 3.

GOLDMAN SACHS INTERNATIONAL (UNLIMITED COMPANY)
Notes to the Financial Statements
87
Level 3 Financial Assets and Financial Liabilities at Fair Value
Balance, Transfers Transfers Balance,
beginning Gains/ into out of end of
$ in millions of year (losses) Purchases Sales Settlements level 3 level 3 year
Year Ended December 2015
Financial instruments owned $ 7,793 $2,646 $1,680 $ (401) $(1,399) $ 934 $(2,212) $ 6,041
Debtors – – – – – – – –
Total level 3 financial assets $ 7,793 $2,646 $1,680 $ (401) $(1,399) $ 934 $(2,212) $ 6,041
Financial instruments sold, but not yet purchased $(2,718) $ (8) $1,799 $ (383) $ 324 $(424) $ 383 $(2,727)
Collateralised financings (124) (2) – – 55 – – (71)
Other creditors (3,580) 538 – (4,811) 2,422 (549) 377 (5,603)
Total level 3 financial liabilities $(6,422) $2,528 $1,799 $(5,194) $ 2,801 $(973) $ 760 $(8,401)
Year Ended December 2014
Financial instruments owned $ 8,055 $2,509 $1,700 $ (765) $(3,089) $ 712 $(1,329) $ 7,793
Debtors 180 – – – – – (180) –
Total level 3 financial assets $ 8,235 $2,509 $1,700 $ (765) $(3,089) $ 712 $(1,509) $ 7,793
Financial instruments sold, but not yet purchased $(3,835) $ (423) $ (1) $ (655) $ 1,173 $(245) $ 1,268 $(2,718)
Collateralised financings (1,010) – – – 886 – – (124)
Other creditors (2,668) 132 (2) (2,954) 1,773 (447) 586 (3,580)
Total level 3 financial liabilities $(7,513) $ (291) $ (3) $(3,609) $ 3,832 $(692) $ 1,854 $(6,422)
Level 3 Rollforward Commentary
Year Ended December 2015. Transfers into level 3
primarily reflected transfers of certain credit derivatives from
level 2, principally due to unobservable credit spread inputs
becoming significant to the valuation of these instruments and
the transfers of certain equity derivatives from level 2,
principally due to unobservable volatility and correlation
inputs becoming significant to the valuation of these
derivatives.
Transfers out of level 3 primarily reflected transfers of certain
credit derivatives to level 2, principally due to unobservable
credit spread inputs no longer being significant to the net risk
of certain portfolios.
Year Ended December 2014. Transfers into level 3
primarily reflected transfers of certain credit derivatives from
level 2, principally due to unobservable credit spread inputs
becoming significant to the valuation of these instruments or a
reduction in market data available for the instrument.
Transfers out of level 3 primarily reflected transfers of certain
credit derivatives to level 2, principally due to unobservable
credit spread inputs no longer being significant to the net risk
of certain portfolios and the transfers of certain equity
derivatives to level 2, due to unobservable correlations no
longer being significant to the valuation of the instrument.

GOLDMAN SACHS INTERNATIONAL (UNLIMITED COMPANY)
Notes to the Financial Statements
88
Fair Value Financial Assets and Financial Liabilities
Valued Using Techniques That Incorporate
Unobservable Inputs
The fair value of financial assets and financial liabilities may
be determined in whole or part using a valuation technique
based on assumptions that are not supported by prices from
observable current market transactions in the same instrument
or based on available observable market data and changing
these assumptions will change the resultant estimate of fair
value. The potential impact of using reasonable possible
alternative assumptions for the valuations, including significant
unobservable inputs, has been quantified as of December 2015
and December 2014, as approximately $261 million and $179
million, respectively, for favourable changes and $238 million
and $146 million, respectively, for unfavourable changes. In
determining reasonably possible alternative unfavourable
assumptions, a detailed business and position level review has
been performed to identify and quantify instances where
potential uncertainty exists. This has taken into account the
positions’ fair value as compared to the range of available
market information.
The table below presents the amounts not recognised in the
profit and loss account relating to the difference between the
fair value of financial instruments held for trading at initial
recognition (the transaction price) and the amounts determined
at initial recognition using the valuation techniques (day 1
P&L).
Year Ended December
$ in millions 2015 2014
As of January 1 $136 $ 80
New transactions 93 118
Amounts recognised in the profit and loss account
during the period (90) (62)
As of December 31 $139 $136
Fair Value of Financial Assets and Financial
Liabilities Not Measured at Fair Value
As of December 2015 and December 2014, the company had
$99.25 billion and $112.57 billion, respectively, of current
financial assets and $145.21 billion and $182.72 billion,
respectively, of current financial liabilities that are not
measured at fair value. Given the short-term nature of these
instruments, their carrying amounts in the balance sheet are a
reasonable approximation of fair value.
As of December 2015 and December 2014, the company had
$24.85 billion and $11.39 billion, respectively, of financial
liabilities that are due after more than one year that are not
measured at fair value which predominantly relate to long-term
intercompany borrowings. The interest rates of these
borrowings are variable in nature and approximate prevailing
market interest rates for instruments with similar terms and
characteristics. As such, their carrying amounts in the balance
sheet are a reasonable approximation of fair value.
Items of Income, Expense, Gains or Losses
The table below presents the items of income, expense, gains
or losses related to the company’s financial assets and financial
liabilities that are presented within net revenues.
Year Ended December
$ in millions 2015 2014
Non-interest income1,2
$6,778 $6,015
Interest income
Interest income from external counterparties 1,804 2,510
Interest income from parent and group undertakings 235 22
Total interest income 2,039 2,532
Interest expense
Interest expense from external counterparties 1,050 1,265
Interest expense from parent and group undertakings 751 852
Total interest expense 1,801 2,117
Net interest income 238 415
Total net revenues $7,016 $6,430
1. Non-interest income includes commissions and fees income of $532 million
and $657 million for 2015 and 2014, respectively. This is recognised in
Institutional Client Services and Investment Management.
2. Non-interest income includes net gains of $625 million for 2015 and net
losses of $489 million for 2014, in relation to the company’s financial assets
and financial liabilities designated at fair value. This is recognised in
Institutional Client Services. The remaining net revenues within Institutional
Client Services predominately relate to net gains from financial assets and
financial liabilities held for trading.
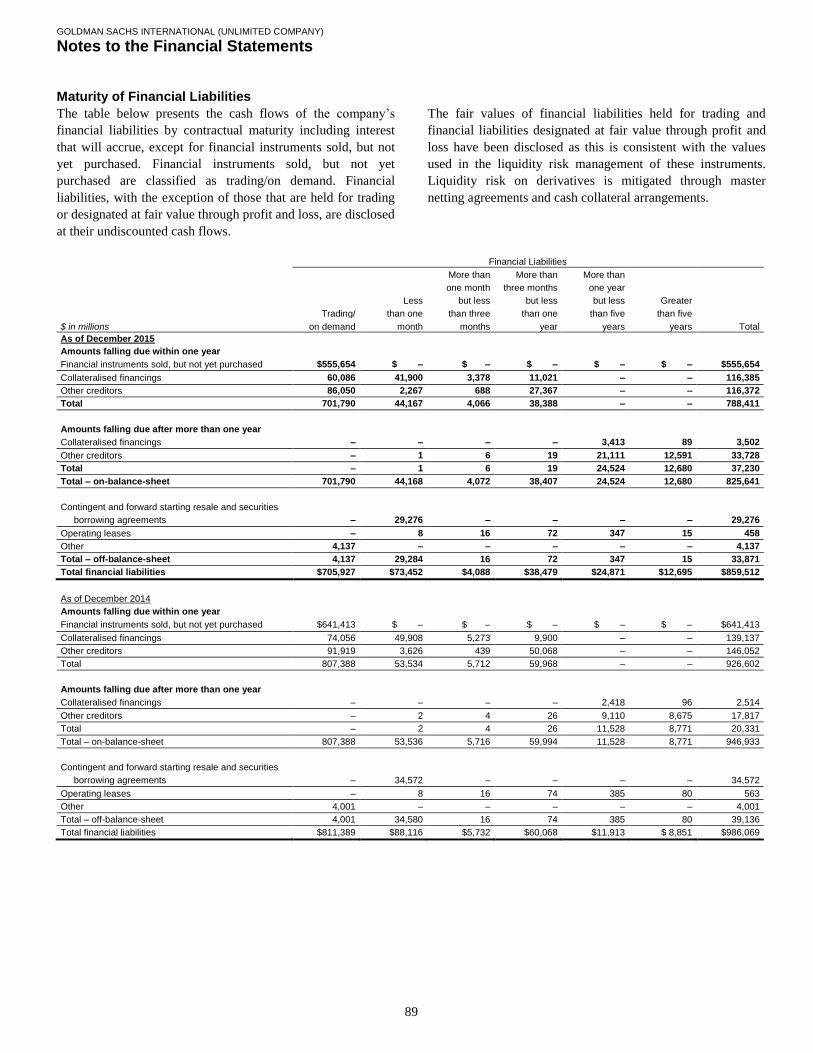
GOLDMAN SACHS INTERNATIONAL (UNLIMITED COMPANY)
Notes to the Financial Statements
89
Maturity of Financial Liabilities
The table below presents the cash flows of the company’s
financial liabilities by contractual maturity including interest
that will accrue, except for financial instruments sold, but not
yet purchased. Financial instruments sold, but not yet
purchased are classified as trading/on demand. Financial
liabilities, with the exception of those that are held for trading
or designated at fair value through profit and loss, are disclosed
at their undiscounted cash flows.
The fair values of financial liabilities held for trading and
financial liabilities designated at fair value through profit and
loss have been disclosed as this is consistent with the values
used in the liquidity risk management of these instruments.
Liquidity risk on derivatives is mitigated through master
netting agreements and cash collateral arrangements.
Financial Liabilities
More than More than More than
one month three months one year
Less but less but less but less Greater
Trading/ than one than three than one than five than five
$ in millions on demand month months year years years Total
As of December 2015
Amounts falling due within one year
Financial instruments sold, but not yet purchased $555,654 $ – $ – $ – $ – $ – $555,654
Collateralised financings 60,086 41,900 3,378 11,021 – – 116,385
Other creditors 86,050 2,267 688 27,367 – – 116,372
Total 701,790 44,167 4,066 38,388 – – 788,411
Amounts falling due after more than one year
Collateralised financings – – – – 3,413 89 3,502
Other creditors – 1 6 19 21,111 12,591 33,728
Total – 1 6 19 24,524 12,680 37,230
Total – on-balance-sheet 701,790 44,168 4,072 38,407 24,524 12,680 825,641
Contingent and forward starting resale and securities
borrowing agreements – 29,276 – – – – 29,276
Operating leases – 8 16 72 347 15 458
Other 4,137 – – – – – 4,137
Total – off-balance-sheet 4,137 29,284 16 72 347 15 33,871
Total financial liabilities $705,927 $73,452 $4,088 $38,479 $24,871 $12,695 $859,512
As of December 2014
Amounts falling due within one year
Financial instruments sold, but not yet purchased $641,413 $ – $ – $ – $ – $ – $641,413
Collateralised financings 74,056 49,908 5,273 9,900 – – 139,137
Other creditors 91,919 3,626 439 50,068 – – 146,052
Total 807,388 53,534 5,712 59,968 – – 926,602
Amounts falling due after more than one year
Collateralised financings – – – – 2,418 96 2,514
Other creditors – 2 4 26 9,110 8,675 17,817
Total – 2 4 26 11,528 8,771 20,331
Total – on-balance-sheet 807,388 53,536 5,716 59,994 11,528 8,771 946,933
Contingent and forward starting resale and securities
borrowing agreements – 34,572 – – – – 34,572
Operating leases – 8 16 74 385 80 563
Other 4,001 – – – – – 4,001
Total – off-balance-sheet 4,001 34,580 16 74 385 80 39,136
Total financial liabilities $811,389 $88,116 $5,732 $60,068 $11,913 $ 8,851 $986,069

GOLDMAN SACHS INTERNATIONAL (UNLIMITED COMPANY)
Notes to the Financial Statements
90
Collateral Received and Pledged
The company receives financial instruments (e.g., government
and agency obligations, corporate debt securities, equities and
convertible debentures) as collateral, primarily in connection
with resale agreements, securities borrowed, derivative
transactions and customer margin loans. The company obtains
cash and securities as collateral on an upfront or contingent
basis for derivative instruments and collateralised agreements
to reduce its credit exposure to individual counterparties.
In many cases, the company is permitted to deliver or repledge
financial instruments received as collateral when entering into
repurchase agreements and securities lending agreements,
primarily in connection with secured client financing activity.
The company is also permitted to deliver or repledge these
financial instruments in connection with other secured
financings, collateralising derivative transactions and meeting
company or customer settlement requirements.
The company also pledges certain financial instruments owned
in connection with repurchase agreements, securities lending
agreements and other secured financings to counterparties who
may or may not have the right to deliver or repledge.
The table below presents financial instruments received as
collateral that were available to be delivered, or repledged and
were delivered or repledged by the company.
As of December
$ in millions 2015 2014
Collateral available to be delivered or repledged $379,594 $369,545
Collateral that was delivered or repledged 307,759 294,994
The table below presents information about assets pledged.
As of December
$ in millions 2015 2014
Financial instruments owned pledged to
counterparties that:
Had the right to deliver or repledge $22,036 $24,404
Did not have the right to deliver or repledge 20,146 17,656
The company has received cash collateral in respect of
financial instruments owned of $57.64 billion and $57.54
billion as of December 2015 and December 2014, respectively,
and posted cash collateral in respect of financial instruments
sold, but not yet purchased of $38.71 billion and $35.46 billion
as of December 2015 and December 2014, respectively.
In addition to repurchase agreements and securities lending
transactions, the company funds certain assets through the use
of other secured financings and pledges financial instruments
as collateral in these transactions. These other secured
financings consist of liabilities related to special purpose
entities, transfers of financial assets that are accounted for as
financings rather than sales and other structured financing
arrangements. Other secured financings include arrangements
that are non-recourse.
Hedge Accounting
The company designates certain interest rate swaps as fair
value hedges. These interest rate swaps hedge changes in fair
value attributable to the relevant benchmark interest rate (e.g.,
London Interbank Offered Rate (LIBOR)), effectively
converting fixed rate obligations into floating rate obligations.
The company applies a statistical method that utilises
regression analysis when assessing the effectiveness of its fair
value hedging relationships in achieving offsetting changes in
the fair values of the hedging instrument and the risk being
hedged (i.e., interest rate risk). An interest rate swap is
considered highly effective in offsetting changes in fair value
attributable to changes in the hedged risk when the regression
analysis results in a coefficient of determination of 80% or
greater and a slope between 80% and 125%.
For qualifying fair value hedges, gains or losses on derivatives
and the change in fair value of the hedged item attributable to
the hedged risk are included in net revenues. When a derivative
is no longer designated as a hedge, any remaining difference
between the carrying value and par value of the hedged item is
amortised over the remaining life of the hedged item using the
effective interest method.
The table below presents the gains/(losses) from interest rate
derivatives accounted for as hedges, the related hedged
borrowings and the hedge ineffectiveness on these derivatives.
Year Ended December
$ in millions 2015 2014
Interest rate hedges $(22) $ 85
Hedge borrowings 18 (80)
Hedge ineffectiveness $ (4) $ 05
The fair value of asset and liability derivative instruments
designated as hedges were $158 million and $24 million,
respectively, as of December 2015.
The fair value of asset and liability derivative instruments
designated as hedges were $188 million and $10 million,
respectively, as of December 2014.

GOLDMAN SACHS INTERNATIONAL (UNLIMITED COMPANY)
Notes to the Financial Statements
91
Transferred Assets
Assets Continued to be Recognised in Full. During the
year, the company transferred certain financial assets where the
transfers failed to meet the derecognition criteria, as contained
in IAS 39 ‘Financial Instruments: Recognition and
Measurement’, and as a result of which the company continues
to recognise these assets in full on the balance sheet.
The company transfers assets owned to counterparties in the
ordinary course of business to collateralise repurchase
agreements and other securities lending transactions. In these
transactions the transferred assets continue to be recognised by
the company for accounting purposes because the transactions
require the financial instruments to be repurchased at maturity
of the agreement and the company remains exposed to the
price, credit and interest rate risk of these instruments. When
the company receives cash proceeds from the transfer of the
asset, a financial liability is recognised in respect of the
consideration received and recorded within “Collateralised
financings”. When the company receives non cash collateral
(in the form of securities) no liability is initially recognised. If
collateral received is subsequently sold, the obligation to return
the collateral is recognised as a liability within “Financial
instruments sold, but not yet purchased”.
In addition to repurchase agreements and securities lending
agreements, the company obtains funding through the use of
other arrangements that fail to meet the derecognition criteria.
For example, sales of securities with related derivatives, such
as total return swaps, through which the company retains
substantially all of the risk and reward of the transferred assets.
A financial liability is recognised in such cases for the
proceeds received.
Other financial assets transferred that continue to be recognised
on balance sheet for accounting purposes relate to pledges of
securities as collateral, primarily for derivative transactions.
The obligations under such derivatives are recorded in
“Financial instruments sold, but not yet purchased”.
The table below presents financial assets which have been
transferred but which remain on balance sheet for accounting
purposes. The carrying amount of the associated financial
liabilities generally approximate the carrying amount of the
assets transferred.
As of December
$ in millions 2015 2014
Commercial paper, certificates of deposit, time
deposits and other money market instruments $ 221 $01,047
Government and agency obligations 10,036 11,095
Corporate and other debt obligations 5,300 6,248
Equities and convertible debentures 26,625 23,670
Total $42,182 $42,060

GOLDMAN SACHS INTERNATIONAL (UNLIMITED COMPANY)
Notes to the Financial Statements
92
Derecognised Assets With Ongoing Exposure. The
company has continuing involvement in the form of derivative
transactions and guarantees with certain non consolidated
structured entities to which the company had transferred
financial assets. These derivatives may be credit-linked to the
asset transferred and result in the company retaining specific
risks in the transferred asset or require the company to make
payments to the structured entity to compensate losses on the
asset if certain contingent events occur.
In addition, the company transfers financial assets to
securitisation vehicles. The company generally receives cash in
exchange for the transferred assets but may have continuing
involvement with the transferred assets, including ownership of
beneficial interests in the securitisation. The company may also
purchase senior or subordinated securities issued by
securitisation vehicles in connection with secondary market
making activities.
Where the company’s continuing involvement in transferred
assets is through derivatives or guarantees, the maximum
exposure to loss is the notional amounts of the derivative or
guarantee. For retained or purchased interests in securitised
assets, the company’s risk of loss is limited to the fair value of
these interests. In all cases these retained interests are carried at
fair value.
The company accounts for assets pending transfer at fair value
and therefore does not typically recognise significant gains or
losses upon the transfer of assets. The company does not have
continuing involvement that could require the company to
repurchase derecognised financial assets.
The tables below present information about the company’s
exposure through continuing involvement and the gains or
losses related to those transactions.
Maximum
Carrying Exposure
$ in millions Amount to Loss
As of December 2015
Assets
Cash instruments $176 $1,093
Derivative instruments 99 1,160
Financial instruments owned 175 1,253
Total $175 $1,253
Liabilities
Derivatives instruments $ (2) $ (101)
Financial instruments sold, but not yet purchased (2) (101)
Other creditors – –
Total $ (2) $ (101)
As of December 2014
Assets
Cash instruments $164 $1,364
Derivative instruments 120 1,308
Financial instruments owned 184 1,372
Total $184 $1,372
Liabilities
Derivatives instruments $ (2) $ (92)
Financial instruments sold, but not yet purchased (2) (92)
Other creditors – –
Total $ (2) $ (92)
Income/ Cumulative
(Expense) Income/
$ in millions in the year (Expense)
As of December 2015
Assets
Cash instruments $ 2 $ 120
Derivative instruments 6 150
Financial instruments owned 8 270
Total $ 8 $ 270
Liabilities
Derivatives instruments $ (1) $ (32)
Financial instruments sold, but not yet purchased (1) (32)
Other creditors – (1)
Total $ (1) $ (33)
As of December 2014
Assets
Cash instruments $ 27 $ 119
Derivative instruments 66 144
Financial instruments owned 93 263
Total $ 93 $ 263
Liabilities
Derivatives instruments $ 2 $ (31)
Financial instruments sold, but not yet purchased 2 (31)
Other creditors – (1)
Total $ 2 $ (32)

GOLDMAN SACHS INTERNATIONAL (UNLIMITED COMPANY)
Notes to the Financial Statements
93
Note 28.
Offsetting of Financial Assets and Financial
Liabilities
The tables below present the company’s financial assets and
financial liabilities that are subject to enforceable netting
agreements and offsetting. Gross amounts exclude the effects
of both counterparty netting and collateral, and therefore are
not representative of the company’s economic exposure.
Amounts are only offset in the balance sheet when the
company currently has a legally enforceable right to set-off the
recognised amounts and an intention either to settle on a net
basis, or to realise the asset and settle the liability
simultaneously.
The tables below also present amounts not offset in the balance
sheet in respect of counterparty netting (i.e., the netting of
financial assets and financial liabilities for a given counterparty
when a legal right of setoff exists under an enforceable netting
agreement), and cash and security collateral received and
posted under enforceable credit support agreements, that do not
meet the criteria for offsetting under U.K. GAAP. Where the
company has received or posted collateral under credit support
agreements, but has not yet determined whether such
agreements are enforceable, the related collateral has not been
included in the amounts not offset in the balance sheet, in the
tables below.
As of December 2015
Amounts not offset in the balance sheet
Amounts Net amount
offset in the presented in
Gross balance the balance Counterparty Cash Security
$ in millions amounts1,2
sheet sheet netting collateral collateral Net amount
Financial assets
Cash instruments $ 15,662 $ (11,579) $ 4,083 $ (21) $ (726) $ (1,993) $ 1,343
Derivative instruments 608,906 (59,789) 549,117 (474,498) (42,162) (11,095) 21,362
Financial instruments owned 624,568 (71,368) 553,200 (474,519) (42,888) (13,088) 22,705
Collateralised agreements 191,094 (27,391) 163,703 (48,219) – (112,475) 3,009
Debtors 55,187 (6,758) 48,429 (542) (32,202) (7,900) 7,785
Financial assets subject to enforceable netting
agreements 870,849 (105,517) 765,332 (523,280) (75,090) (133,463) 33,499
Financial assets not subject to enforceable netting
agreements 84,273 – 84,273 – – – 84,273
Total financial assets $955,122 $(105,517) $849,605 $(523,280) $(75,090) $(133,463) $117,772
Financial liabilities
Amounts falling due within one year
Cash instruments $ 1,164 $ (1,164) $ – $ – $ – $ – $ –
Derivative instruments 589,450 (58,480) 530,970 (474,498) (32,203) (8,617) 15,652
Financial instruments sold, but not yet purchased 590,614 (59,644) 530,970 (474,498) (32,203) (8,617) 15,652
Collateralised financings 150,534 (34,149) 116,385 (48,130) – (52,066) 16,189
Other creditors 67,453 (5,027) 62,426 (21) (42,162) – 20,243
Total 808,601 (98,820) 709,781 (522,649) (74,365) (60,683) 52,084
Amounts falling due after more than one year
Collateralised financings 3,502 – 3,502 (89) – (3,343) 70
Other creditors 8,694 (6,697) 1,997 (542) – – 1,455
Total 12,196 (6,697) 5,499 (631) – (3,343) 1,525
Financial liabilities subject to enforceable netting
agreements 820,797 (105,517) 715,280 (523,280) (74,365) (64,026) 53,609
Financial liabilities not subject to enforceable netting
agreements 108,495 – 108,495 – – – 108,495
Total financial liabilities $929,292 $(105,517) $823,775 $(523,280) $(74,365) $(64,026) $162,104
1. Derivative assets and derivative liabilities include amounts that are not subject to an enforceable netting agreement or are subject to a netting agreement that the
company has not yet determined to be enforceable of $8.34 billion and $7.49 billion, respectively.
2. Substantially all collateralised agreements and collateralised financings are subject to enforceable netting agreements.

GOLDMAN SACHS INTERNATIONAL (UNLIMITED COMPANY)
Notes to the Financial Statements
94
As of December 2014
Amounts not offset in the balance sheet
Amounts Net amount
offset in the presented in
Gross balance the balance Counterparty Cash Security
$ in millions amounts1,2
sheet sheet netting collateral collateral Net amount
Financial assets
Cash instruments $ 17,460 $ (14,453) $ 3,007 $ (161) $ – $ – $ 2,846
Derivative instruments 759,612 (132,115) 627,497 (549,005) (42,710) (10,215) 25,567
Financial instruments owned 777,072 (146,568) 630,504 (549,166) (42,710) (10,215) 28,413
Collateralised agreements 219,234 (15,718) 203,516 (88,761) – (109,488) 5,267
Debtors 58,046 (9,975) 48,071 (602) (28,928) (8,903) 9,638
Financial assets subject to enforceable netting
agreements 1,054,352 (172,261) 882,091 (638,529) (71,638) (128,606) 43,318
Financial assets not subject to enforceable netting
agreements 84,819 – 84,819 – – – 84,819
Total financial assets $1,139,171 $(172,261) $966,910 $(638,529) $(71,638) $(128,606) $128,137
Financial liabilities
Amounts falling due within one year
Cash instruments $ – $ – $ – $ – $ – $ – $ –
Derivative instruments 744,162 (130,399) 613,763 (549,005) (28,928) (16,091) 19,739
Financial instruments sold, but not yet purchased 744,162 (130,399) 613,763 (549,005) (28,928) (16,091) 19,739
Collateralised financings 164,830 (25,693) 139,137 (88,665) – (35,933) 14,539
Other creditors 72,453 (8,601) 63,852 (161) (42,710) – 20,981
Total 981,445 (164,693) 816,752 (637,831) (71,638) (52,024) 55,259
Amounts falling due after more than one year
Collateralised financings 2,514 – 2,514 (96) – (2,418) –
Other creditors 9,603 (7,568) 2,035 (602) – – 1,433
Total 12,117 (7,568) 4,549 (698) – (2,418) 1,433
Financial liabilities subject to enforceable netting
agreements 993,562 (172,261) 821,301 (638,529) (71,638) (54,442) 56,692
Financial liabilities not subject to enforceable netting
agreements 124,039 – 124,039 – – – 124,039
Total financial liabilities $1,117,601 $(172,261) $945,340 $(638,529) $(71,638) $0(54,442)) $180,731
1. Derivative assets and derivative liabilities include amounts that are not subject to an enforceable netting agreement or are subject to a netting agreement that the
company has not yet determined to be enforceable of $12.52 billion and $10.50 billion, respectively.
2. Substantially all collateralised agreements and collateralised financings are subject to enforceable netting agreements.