annual report for the financial year ... - bank islam · pdf file31 august 2013 laporan...
TRANSCRIPT

BIMB AL-FALAH
BIMB Al-fakhim BIMB Al-munsif
ANNUAL REPORT FOR THE FINANCIAL YEAR ENDED
31 AUGUST 2013
LAPORAN TAHUNAN BAGI TAHUN KEWANGAN BERAKHIR
31 OGOS 2013

2
TABLE OF CONTENT
1.0 Manager’s Report 3
1.1 Fund Name, Fund Type, Fund Category and Fund Investment Objective 3
1.2 Fund Performance Benchmark and Fund Distribution Policy 4
1.3 Performance for the Financial Year Ended 31 August 2013 4
1.4 Economic and Market Review 11
1.5 Market Outlook and Strategy 15
1.6 Asset Allocation as at 31 August 2013 16
1.7 Other Performance Data for the Financial Year Ended 31 August 2013 18
1.8 Unit Holdings as at 31 August 2013 21
1.9 Policy on Rebate and Soft Commission 22
2.0 Trustee’s Report 43
3.0 Shariah Committee’s Report 44
4.0 Directors’ Declaration Report 45
5.0 Independent Auditors’ Report 46
6.0 Financial Statements (Audited) 48
6.1 BIMB Dana Al-Fakhim 48
6.2 BIMB Dana Al-Munsif 69
6.3 BIMB Dana Al-Falah 102
7.0 Corporate Directory 134

3
1.0 MANAGER’S REPORT Dear Unit Holders,
We are pleased to present the Manager’s report of BIMB Dana Al-Fakhim, BIMB Dana Al-Munsif
and BIMB Dana Al-Falah for the financial year ended 31 August 2013.
1.1 Fund Name, Fund Type, Fund Category and Fund Investment Objective
Fund Name BIMB Dana
Al-Fakhim
BIMB Dana
Al-Munsif
BIMB Dana
Al-Falah
Fund Type Income Income & Growth Growth
Fund Category Money Market Balanced Mixed Assets
Fund Investment
Objective
The Fund seeks to
provide a regular
stream of income by
investing in Shariah-
compliant short-term
debentures, money
market instruments
and placement in
short-term deposits.
The principal
investment objective
of the Fund is to
provide a steady and
consistent income
and capital
appreciation of the
Units over the
medium to long term
period. Accordingly,
returns shall be in
the form of long term
capital growth and
regular income
distribution to the
Unit Holders.
The principal
investment objective
of the Fund is to
achieve long term
capital appreciation
of the Units by
investing in a
diversified portfolio
of equities, Sukuk
and money market
instruments.
Accordingly, all
investment income
(if any) shall be
reinvested for long
term capital growth
rather than
distributed annually.
Note: Any material change to the investment objective of the Fund would require Unit Holders’ approval.

4
1.2 Fund Performance Benchmark and Fund Distribution Policy
Fund Name BIMB Dana
Al-Fakhim
BIMB Dana
Al-Munsif
BIMB Dana
Al-Falah
Fund
Performance
Benchmark
1-month General
Investment Account
(GIA) of Bank Islam
Malaysia Berhad.
60:40 ratios of the
“FBM Emas Shariah
Index” and 12-month
Bank Islam GIA
rates.
70:30 ratios of the
“FBM Emas Shariah
Index” and 12-
month Bank Islam
GIA rates.
Fund
Distribution
Policy
The Fund shall
distribute income* (if
any) on a quarterly
basis.
*Note:
The distribution of
income will
automatically be
reinvested. Hence,
Unit Holders will
receive additional
units from the
reinvestment of
income distribution.
The Fund intends to
payout annual income
distribution to Unit
Holders if sufficient
investment income
has been
accumulated during
the year.
Distribution of
income* (if any) is
incidental.
*Note:
The distribution of
income will
automatically be
reinvested. Hence,
Unit Holders will
receive additional
units from the
reinvestment of
income distribution.
1.3 Performance for the Financial Year Ended 31 August 2013
1.3.1 BIMB Dana Al-Fakhim
a) Performance Review
For the financial year under review, BIMB Dana Al-Fakhim (Al-Fakhim) registered a return of
2.38%, as compared to its Benchmark’s return of 2.27%.
For the financial year under review, the manager re-launched Al-Fakhim as a money market
fund on 13 September 2012 after obtaining the approval from unit holders in July 2012 to
convert Al-Fakhim’s category of fund from a Sukuk fund to a Money Market fund. The effective
date of Al-Fakhim as a money market fund was 15 October 2012.
From its effective date as a money market fund from 15 October 2012 to 31 August 2013, Al-
Fakhim registered a total return of 2.30% as compared to its Benchmark’s return of 2.06%,
thus outperformed the Benchmark’s return by 0.24%.
The selected performance benchmark for Al-Fakhim is based on 1-month Bank Islam General
Investment Account (GIA) rates.
Our strategy has consistently been to manage in a fairly conservative manner with the primary
aim of outperforming traditional investment account returns. Consequently, the Fund has
managed to achieve stability in the investors’ principal investment besides providing quarterly
income to the investors.
5
During its financial year ending 31 August 2013, Al-Fakhim has met its objectives of providing
a regular income stream to the Unit Holders through investments primarily in Shariah-
compliant money market instruments. As at end August 2013, the Fund has 26.2% exposure
in Islamic Debt Securities and 73.8% in Shariah-compliant money market instrument and cash.
Thus far, the Fund continues to be managed in line with its stated objective by investing
primarily in Shariah-compliant money market instruments. The total NAV was RM15.31 million
as at 31 August 2013 and RM14.11 million as at 31 August 2012.
The net asset value (NAV) per unit of the Fund has decreased to RM0.5188 as at 31 August
2013 from RM0.5236 as at 31 August 2012. The Fund has declared a total income distribution
of 1.70 sen per unit during the financial year, equivalent to a yield of 3.25% per annum.
For the financial year ended 31 August 2013, there were no other significant changes to the
state of affairs of the Fund and no circumstances that materially affect the interest of
Unitholders that have taken place up to the date of this Manager’s report.
b) Total Return and Average Total Return for the financial year ended 31 August 2013
BIMB Dana Al-Fakhim Benchmark
Total Return*
(%)
Average Total Return
(%)
Total Return (%)
Average Total Return
(%)
1-YearPeriod
2.38 2.38 2.27^ 2.27
3-Year Period
9.31 3.10 7.51 2.50
5-Year Period
17.04 3.41 11.57 2.31
*The fund changed its category from Sukuk fund to money market fund effective 15 October
2012
^The benchmark has been changed to a 1-month General Investment Account (GIA) of Bank
Islam Malaysia Berhad (Bank Islam) from 12-month GIA of Bank Islam with effect from the
date of change of category.
c) Total Return for the last 5 Financial Years
Financial Years
BIMB Dana Al-Fakhim
Total Return (%)
Benchmark
(%)
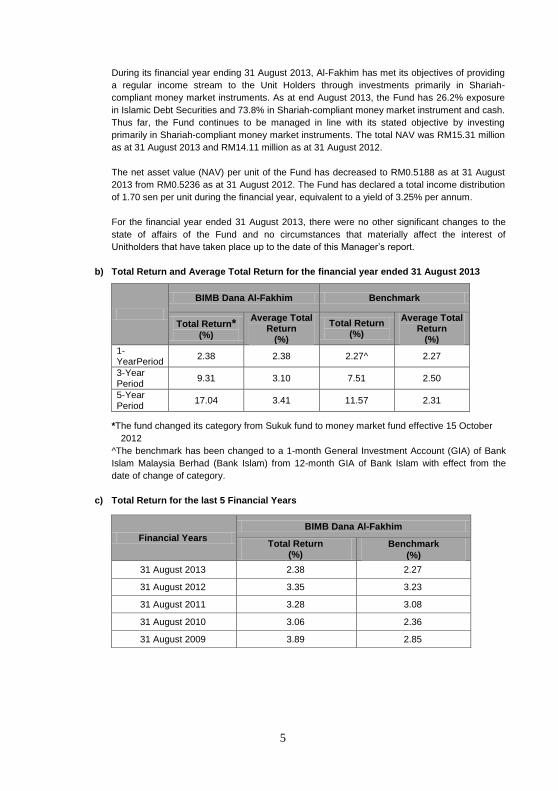
31 August 2013 2.38 2.27
31 August 2012 3.35 3.23
31 August 2011 3.28 3.08
31 August 2010 3.06 2.36
31 August 2009 3.89 2.85
6
Figure 1: Fund and Benchmark Total Return for the last 5 Financial Years
Note
Data Source : BIMB Invest
Data Verified by : Perkasa Normandy Managers Sdn. Bhd.
Benchmark : 1-month General Investment Account (GIA) of Bank Islam
Malaysia Berhad.
1.3.2 BIMB Dana Al-Munsif
a) Performance Review
For the financial year under review, BIMB Dana Al-Munsif (Al-Munsif) registered a return of
3.50% as compared to its Benchmark’s return of 4.96%.
From its commencement on 27 December 2001 to 31 August 2013, Al-Munsif has registered a
total return of 103.09%, as compared to its Benchmark’s return of 96.93%, thus outperformed
the Benchmark’s return by 6.16%.
The selected performance benchmark for Al-Munsif is based on 60:40 ratios of the “FBM Emas
Shariah Index” and 12-month Bank Islam General Investment Account (GIA) rates.
Our strategy has consistently been to remain focused on well-established companies that
could potentially pay sustainable dividends and have good prospects for earnings growth.
During its financial year ending 31 August 2013, Al-Munsif has met its objectives of providing a
steady and consistent income and capital appreciation over the medium to long term period
despite the heightened global equity market corrections and protracted market volatilities. As
at 31 August 2013, the Fund has 59.0% exposure in equities and 41.0% in Islamic Debt
Securities and Cash. Thus far, the Fund continues to be managed in line with its stated
objective and asset allocation over the medium to long term basis. In terms of total NAV, the
Fund size as at 31 August 2013 was at RM47.55 million as compared to RM58.73 million as at
31 August 2012.
7
The net asset value (NAV) per unit of the Fund has decreased to RM0.5119 (ex-dist) as at 31
August 2013 from RM0.5300 (ex-dist) as at 31 August 2012. The Fund has declared an
income distribution of 3.75 sen per unit, equivalent to a yield of 7.08% per annum.
For the financial year ended 31 August 2013, there were no significant changes to the state of
affairs of the Fund and no circumstances that materially affect the interest of Unitholders that
have taken place up to the date of this Manager’s report.
b) Total Return and Average Total Return for the financial year ended 31 August 2013
BIMB Dana Al-Munsif Benchmark
Total Return (%)
Average Total Return
(%)
Total Return (%)
Average Total Return
(%)
1-Year Period 3.50 3.50 4.96 4.96
3-Year Period 14.72 4.91 22.2 7.40
5-Year Period 25.52 5.10 41.69 8.34
c) Total Return for the last 5 Financial Years
Financial Years
BIMB Dana Al-Munsif
Total Return (%)
Benchmark
(%)
31 August 2013 3.50 4.96
31 August 2012 8.63 12.3
31 August 2011 2.07 3.67
31 August 2010 6.28 8.62
31 August 2009 2.95 6.75

8
Figure 2: Fund and Benchmark Total Return for the last 5 Financial Years
Note
Data Source : BIMB Invest
Data Verified by : Perkasa Normandy Managers Sdn. Bhd.
Benchmark :60:40 ratio of the “FBM Emas Shariah Index” and
12-month Bank Islam GIA rates.
1.3.3 BIMB Dana Al-Falah
a) Performance Review
For the financial year under review, BIMB Dana Al-Falah (Al-Falah) registered a return of
0.96% as compared to its Benchmark’s return of 5.21%.
From its commencement on 27 December 2001 to 31 August 2013, Al-Falah has registered a
total return of 100.97% as compared to its Benchmark’s return of 106.46%.
The selected performance benchmark for Al-Falah is based on 70:30 ratios of the “FBM Emas
Shariah Index” and 12-month Bank Islam General Investment Account (GIA) rates.
Our strategy has consistently been to remain focused on accumulating stocks relating to
companies which potentially are able to achieve above average earnings growth in the
medium to long term.
During its financial year ending 31 August 2013, Al-Falah has met its objectives by investing in
a diversified portfolio of equities, Sukuk and money market instruments. As at end August
2013, the Fund had 77.2% exposure in equities and 22.8% in Islamic Debt Securities and
cash. Thus far, Al-Falah continues to be managed in line with its stated objective by investing
in diversified portfolio of equities, Sukuk and Shariah-compliant money market instrument. In
terms of total NAV, the Fund size as at 31 August 2013 was at RM23.42 million as compared
to RM23.54 million as at 31 August 2012.

9
The net asset value (NAV) per unit of the Fund has decreased to RM0.5417 (ex-dist) as at 31
August 2013 from RM0.5769 (ex-dist) as at 31 August 2012. The Fund has declared an
income distribution of 4.10 sen per unit, equivalent to a yield of 7.11% per annum. The income
distribution shall be reinvested as disclosed in the prospectus of Al-Falah.
For the financial year ended 31 August 2013, there were no significant changes to the state of
affairs of the Fund and no circumstances that materially affect the interest of Unitholders that
have taken place up to the date of this Manager’s report.
b) Total Return and Average Total Return for the financial year ended 31 August 2013
BIMB Dana Al-Falah Benchmark
Total Return (%)
Average Total Return
(%)
Total Return (%)
Average Total Return
(%)
1-Year Period 0.96 0.96 5.21 5.21
3-Year Period 13.61 4.54 24.23 8.08
5-Year Period 30.61 6.12 46.00 9.20
c) Total Return for the last 5 Financial Years
Financial Years
BIMB Dana Al-Falah
Total Return (%)
Benchmark
(%)
31 August 2013 0.96 5.21
31 August 2012 9.16 13.84
31 August 2011 3.02 3.72
31 August 2010 7.86 9.67
31 August 2009 6.60 7.17

10
Figure 3: Fund and Benchmark Total Return for the last 5 Financial Years
Note
Data Source : BIMB Invest
Data Verified by : Perkasa Normandy Managers Sdn. Bhd.
Benchmark :70:30 ratio of the “FBM Emas Shariah Index” and
12-month Bank Islam GIA rates.
Notes:
1. Total Return of the Fund has been verified by Perkasa Normandy Managers Sdn. Bhd.
(363145-w).
2. Average Total Return is derived by this formula:
Total Return
Number of Years under Review
The calculation of average total returns is based on methods obtained from Lipper Asia Ltd.
Past performance is not necessarily indicative of future performance and unit prices and
investment returns may go down, as well as up.

11
1.4 Economic and Market Review
1.4.1 Economy
a) Global
• United States of America (US) real Gross Domestic Product (GDP) growth was revised
down to an annualised rate of 1.8% in the first quarter 2013 (1Q13) from the initial
estimate of 2.4%. This was attributed to a downward revision in consumer spending as
consumer spending grew by 2.6% in the 1Q13, weaker than the previous estimate of
3.4%, on account of smaller-than-expected spending on durable goods and services due
to US payroll tax increase.
• US headline inflation was 2.0% in July 2013. The core inflation was 1.7% in July 2013, due
to an increase in prices of tobacco and smoking products and alcoholic beverages.
• The US unemployment rate was 7.4% of total labour force in July 2013. This was the
lowest level in more than four years, indicating a gradual improvement in employment.
• The US Federal Reserve reported in July 2013 that the economy maintained a modest to
moderate pace of growth driven by manufacturing and housing industries. Manufacturing
expanded in most districts since the previous report, underpinned by increases in new
orders, shipments and production. The strong demand in residential construction
continued to stimulate the manufacturing sector with home-building suppliers and cement
producers reported strong activities, wood product manufacturers expanded operations
and increased production, and demand for construction equipment picked up.
• The Euro zone’s real GDP edged back to register positive growth of 0.3% quarter-on-
quarter (qoq) in the second quarter 2013 (2Q13), after contracting by 0.3% qoq in the
1Q13 and by 0.6% qoq in the fourth quarter 2012 (4Q12), led by its two largest
economies, Germany and France. This marks the first expansion following six consecutive
quarters of contraction.
• The European Central Bank (ECB) kept interest rates at a record-low of 0.5% in August
2013, as compared to 0.75% in August 2012. The ECB mentioned that its monetary policy
stance is to continue providing support to a gradual recovery in economic activity in the
remaining part of the year and in 2014.
• China’s economy slowed further to 7.5% yoy in the 2Q13 from 7.7% in the 1Q13 as
exports tumbled and fixed-asset investment weakened.
b) Local
• The Malaysian economy grew by 4.3% yoy in the 2Q13 as compared to 4.1% in 1Q13
supported by private consumption and private investment. Domestic demand
counterbalanced the drag from the external sector. Aggregate domestic demand grew,
albeit at a moderate 7.3% in the 2Q, contributing 6.7% pts to 2Q GDP growth. Net trade
subtracted 3.3% pts from second quarter GDP growth. (Source: Bank Negara Malaysia)
• Loan growth moderated to 9.1% yoy in June 2013 from 9.3% in May due to a weaker
growth in corporate and household loans during the month.

12
• Malaysia's exports in June 2013 fell 6.9% yoy to RM56.75 billion as exports of
semiconductors fell. The decrease in exports was mainly to China, South Korea, Japan,
Taiwan and the US.
• Fitch Ratings revised Malaysia's sovereign credit rating outlook from stable to negative on
30 July 2013. Nevertheless, it affirmed Malaysia’s long-term foreign and local currency at
'A-' and 'A' respectively.
• Bank Negara Malaysia decided to maintain the Overnight Policy Rate (OPR) at 3.0% at its
Monetary Policy Committee (MPC) meeting on 11 July 2013. The MPC considers the
current stance of monetary policy to be appropriate given the outlook for inflation and
growth.
1.4.2 Market Review
a) Equity
FTSE Bursa Malaysia EMAS Shariah Index (“FBM Shariah”) commenced the year under
review at 11,377.7 points before it declined to the lowest of 10,831.06 points on 27th
November 2012. It touched the highest of 12,617.6 points on 23rd
July 2013 and closed at
12,046.9 points on 30th August 2013. For the year under review, the FBM Shariah gained
669.2 points or 5.88% whereas the FBM KLCI gained by 81.44 points or 4.95% to close at
1,727.55 points. Among the key factors that contributed to the movement of the index are
highlighted below:
Key factors contributed to movement in market:-
• The International Monetary Fund (IMF) reduced its global economic growth forecast by 0.2
percentage point to 3.1% in 2013 from 3.3% projected in April. This was the fifth
consecutive time the IMF trimmed its prediction for global economic growth in 2013 as
global growth increased slower than expected. The IMF reduced its 2013 projection for the
US to 1.7% from 1.9% projected in April. Similarly, it expects the Euro zone to contract by
0.6% in 2013, sharper than the -0.4% projected earlier. For the emerging economies,
China’s and India’s real GDP growth forecasts were reduced to 7.8% and 5.6%
respectively in 2013 from 8.1% and 5.8% projected in April.
• Standard & Poor’s (S&P) reduced Italy’s credit rating from BBB+ to BBB or two levels
above junk due to weakening economic prospects and the nation’s impaired financial
system. S&P stated that the rating action reflects the view of a further worsening of Italy’s
economic prospects. The low growth stems in large part from rigidities in Italy’s labour and
product markets. The outlook on the rating remains negative. Although austerity measures
helped Italy to reduce its deficit to within European Union limits, it deepened the nation’s
recession with the economy headed for its eighth quarter of contraction and joblessness at
its highest since at least 1977.
• Japanese Prime Minister Shinzo Abe’s victory in the upper house elections on 20 July
2013 opened a window for him to deliver on promises for structural reforms that he said
will help to revive the economy.

13
b) Bond Market and Money Market
Global
For the financial year under review, US Treasury (UST) yields continued to increase
particularly along the medium to longer tenors as investors were concern that the US Federal
Reserve will start to reduce the Quantitative Easing asset purchases program some time this
year.
Figure 4: US Treasury Yields
Source: US Treasury Yields, 31 August 2013
Local
On the local front, sovereign bonds dominated the local bond market activities when Malaysian
Government Securities (MGS) and Government Investment Issue (GII) recorded a secondary
market trade volume of RM775.18 billion for the year under review. The local government
bond yields closed higher compared to the previous year due to foreign selling on expectations
the US Federal Reserve will soon start to reduce its Quantitative Easing asset purchases
program.

14
Table 1: Sukuk/ Islamic Bond Yields
Tenure/Date 31 August 2013
(%)
31 August 2012
(%)
Change
* (bps)
3-Year Bonds
GII 3.37 3.22 15.0
AAA Corporate 3.88 3.64 24.0
5-Year Bonds
GII 3.74 3.36 38.0
AAA Corporate 4.17 3.85 32.0
7-Year Bonds
GII 3.94 3.51 43.0
AAA Corporate 4.37 4.04 33.0
10-Year Bonds
GII 3.97 3.57 40.0
AAA Corporate 4.56 4.25 31.0
Source: Bond Pricing Agency Malaysia (BPAM), 31 August 2013
Figure 5: Overnight Policy Rate (OPR)
Source: Bank Negara Malaysia (BNM), 31 August 2013
15
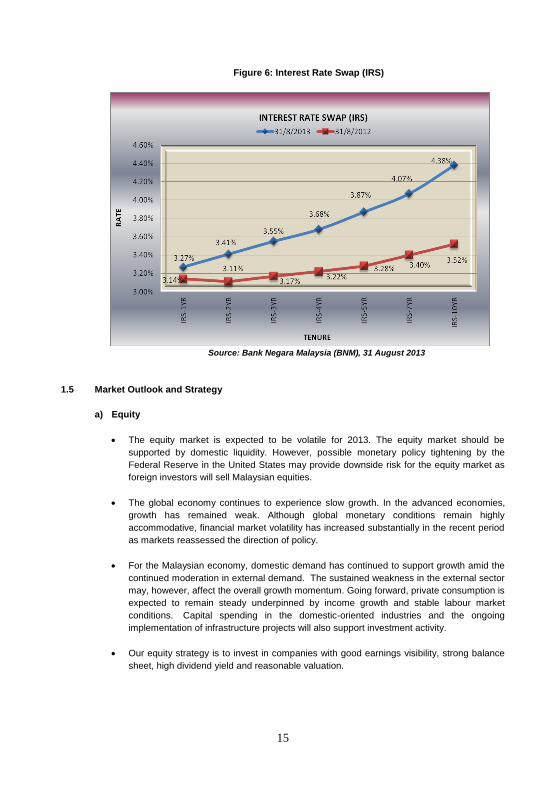
Figure 6: Interest Rate Swap (IRS)
Source: Bank Negara Malaysia (BNM), 31 August 2013
1.5 Market Outlook and Strategy
a) Equity
The equity market is expected to be volatile for 2013. The equity market should be
supported by domestic liquidity. However, possible monetary policy tightening by the
Federal Reserve in the United States may provide downside risk for the equity market as
foreign investors will sell Malaysian equities.
The global economy continues to experience slow growth. In the advanced economies,
growth has remained weak. Although global monetary conditions remain highly
accommodative, financial market volatility has increased substantially in the recent period
as markets reassessed the direction of policy.
For the Malaysian economy, domestic demand has continued to support growth amid the
continued moderation in external demand. The sustained weakness in the external sector
may, however, affect the overall growth momentum. Going forward, private consumption is
expected to remain steady underpinned by income growth and stable labour market
conditions. Capital spending in the domestic-oriented industries and the ongoing
implementation of infrastructure projects will also support investment activity.
Our equity strategy is to invest in companies with good earnings visibility, strong balance
sheet, high dividend yield and reasonable valuation.
16
b) Sukuk Market & Money Market
The Sukuk market is expected to be volatile as possible monetary policy tightening by the
Federal Reserve in the United States will be negative for Sukuk price as foreign investors
sell Sukuk. However, the ample liquidity in the domestic market will support the Sukuk
market.
Bank Negara Malaysia’s (BNM) Monetary Policy Committee (MPC) opted to maintain the
Overnight Policy Rate (OPR) stable at 3.0% on 11 July. It highlighted its intention to
maintain accommodative monetary policy to continue supporting economic growth while
inflation remains contained.
Our Sukuk strategy is to invest in good quality Sukuk with minimum AA3/AA- rating by
RAM/MARC and attractive profit rate. Our money market strategy is to invest in money
market investments that provide an attractive profit rate and placing deposits with longer
maturity as cost of funds is not expected to increase.
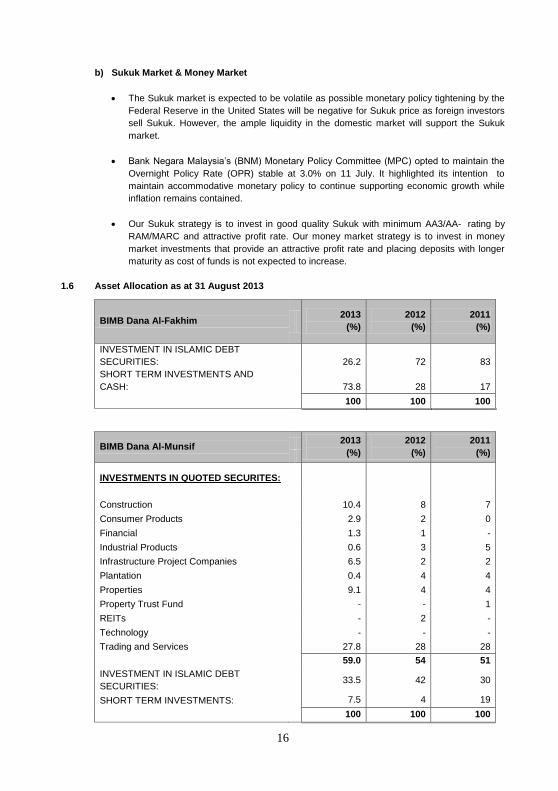
1.6 Asset Allocation as at 31 August 2013
BIMB Dana Al-Fakhim 2013
(%)
2012
(%)
2011
(%)
INVESTMENT IN ISLAMIC DEBT
SECURITIES: 26.2 72 83
SHORT TERM INVESTMENTS AND
CASH: 73.8 28 17
100 100 100
BIMB Dana Al-Munsif 2013
(%)
2012
(%)
2011
(%)
INVESTMENTS IN QUOTED SECURITES:
Construction 10.4 8 7
Consumer Products 2.9 2 0
Financial 1.3 1 -
Industrial Products 0.6 3 5
Infrastructure Project Companies 6.5 2 2
Plantation 0.4 4 4
Properties 9.1 4 4
Property Trust Fund - - 1
REITs - 2 -
Technology - - -
Trading and Services 27.8 28 28
59.0 54 51
INVESTMENT IN ISLAMIC DEBT
SECURITIES: 33.5 42 30
SHORT TERM INVESTMENTS: 7.5 4 19
100 100 100

17
1.6 Asset Allocation as at 31 August 2013 (continued)
BIMB Dana Al-Falah 2013
(%)
2012
(%)
2011
(%)
INVESTMENTS IN QUOTED SECURITES:
Construction 14.9 9 7
Consumer Products 6.4 2 -
Industrial Products - 3 4
Information Technology - - -
Infrastructure Project Companies 5.2 - -
Plantation 2.5 4 3
Properties 17.5 5 5
REITs 0.6 - -
Trading and Services 28.0 34 26
Warrant 2.1 - -
77.2 57 45
INVESTMENT IN ISLAMIC DEBT
SECURITIES: 17.1 30 18
SHORT TERM INVESTMENTS: 5.7 13 37
100 100 100

18
1.7 Other Performance Data for the Financial Year Ended 31 August 2013
BIMB Dana Al-Fakhim 2013 2012 2011
Unit Prices (MYR)
Highest NAV per unit for the year * 0.5260 0.5402 0.5372
Lowest NAV per unit for the year * 0.5188 0.5223 0.5198
Net Asset Value (NAV) and Units in
Circulation (UIC) as at the End of the Year
Total NAV (MYR) 15,311,020 14,107,483 14,551,641
Units in Circulation (UIC) 29,513,863 26,942,831 27,880,013
NAV per unit (MYR) * 0.5188 0.5236 0.5220
Return of Fund (%)
Capital Growth (%) (0.87) 0.28 0.40
Income Return (%) 3.25 3.07 2.88
2.38 3.35 3.28
Gross Distribution per Unit (Sen) 1.70 1.60 1.50
Net Distribution per Unit (Sen) 1.70 1.60 1.50
NAV per Unit before Distribution (MYR) 0.5358 0.5396 0.5370
NAV per Unit after Distribution (MYR) 0.5188 0.5236 0.5220
Date of Distribution 30 Aug 2013 30 Aug 2012 29 Aug 2011
Management Expense Ratio (MER) (%) 0.69 0.95 1.88
Portfolio Turnover Ratio (PTR) (times) 16.04 0.20 1.20
*The price and net asset value per unit are ex-distribution

19
1.7 Other Performance Data for the Financial Year Ended 31 August 2013 (continued)
*The price and net asset value per unit are ex-distribution
BIMB Dana Al-Munsif 2013 2012 2011
Unit Prices (MYR)
Highest NAV per unit for the year * 0.5722 0.5577 0.5645
Lowest NAV per unit for the year * 0.5119 0.4830 0.5256
Net Asset Value (NAV) and Units in
Circulation (UIC) as at the End of the Year
Total NAV (MYR) 47,546,800 58,729,018 50,212,801
Units in Circulation (UIC) 92,883,138 110,803,698 98,329,037
NAV per unit (MYR) * 0.5119 0.5300 0.5107
Return of Fund (%)
Capital Growth (%) (3.58) 3.83 (2.72)
Income Return (%) 7.08 4.80 4.79
3.50 8.63 2.07
Gross Distribution per Unit (Sen) 3.76 2.47 2.52
Net Distribution per Unit (Sen) 3.75 2.45 2.50
NAV per Unit before Distribution (MYR) 0.5494 0.5545 0.5357
NAV per Unit after Distribution (MYR) 0.5119 0.5300 0.5107
Date of Distribution 30 Aug 2013 30 Aug 2012 29 Aug 2011
Management Expense Ratio (MER) (%) 1.68 1.64 1.68
Portfolio Turnover Ratio (PTR) (times) 1.06 0.45 0.89

20
1.7 Other Performance Data for the Financial Year Ended 31 August 2013 (continued)
*The price and net asset value per unit are ex-distribution
a) Return of the Fund
Return of the Funds
= NAV per unit (end of year) - 1
NAV per unit (beginning of year)
b) Capital Growth
Capital Growth
= Total Return of the Fund – Income Return
c) Income Return
Income Return
= {Income Distribution per Unit / NAV per Unit on
beginning of year} x 100
d) Management
Expenses Ratio
= The Management Expenses Ratio for the annual
period are as above. It is the total management
expenses expressed as an annual percentage of the
Fund’s average Net Asset Value.
e) Portfolio Turnover
Ratio
= It represents the average of the total acqusitions and
disposals of the investment in the Fund for the
annual period over the average Net Asset Value of
the Fund calculated on a daily basis.
BIMB Dana Al-Falah 2013 2012 2011
Unit Prices (MYR)
Highest NAV per unit for the year * 0.6333 0.6003 0.5997
Lowest NAV per unit for the year * 0.5417 0.5189 0.5336
Net Asset Value (NAV) and Units in
Circulation (UIC) as at the End of the Year
Total NAV (MYR) 23,421,454 23,536,529 23,114,940
Units in Circulation (UIC) 43,241,059 40,793,027 42,266,252
NAV per unit (MYR) * 0.5417 0.5769 0.5469
Return of Fund (%)
Capital Growth (%) (6.15) 5.51 (0.63)
Income Return (%) 7.11 3.65 3.65
0.96 9.16 3.02
Gross Distribution per Unit (Sen) 4.12 2.04 2.01
Net Distribution per Unit (Sen) 4.10 2.00 2.00
NAV per Unit before Distribution (MYR) 0.5827 0.5969 0.5669
NAV per Unit after Distribution (MYR) 0.5417 0.5769 0.5469
Date of Distribution 30 Aug 2013 30 Aug 2012 29 Aug 2011
Management Expense Ratio (MER) (%) 1.76 1.69 1.76
Portfolio Turnover Ratio (PTR) (times) 0.96 0.44 0.88
21
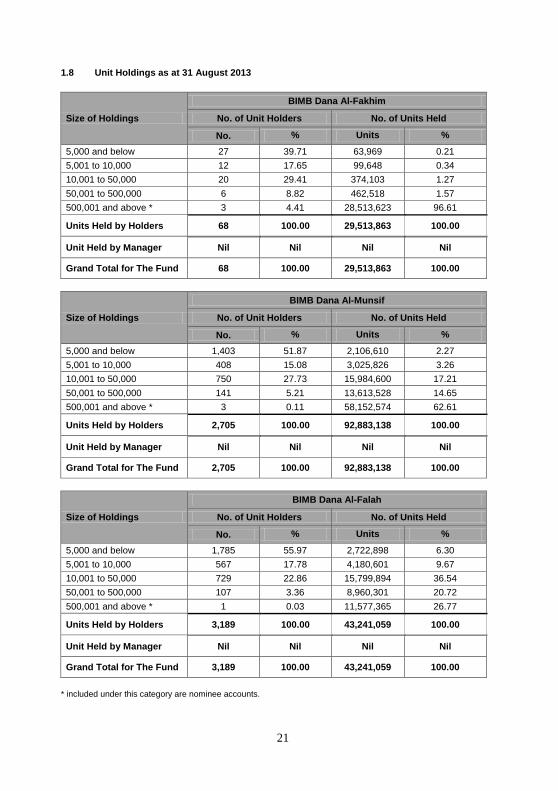
1.8 Unit Holdings as at 31 August 2013
Size of Holdings
BIMB Dana Al-Fakhim
No. of Unit Holders No. of Units Held
No. % Units %
5,000 and below 27 39.71 63,969 0.21
5,001 to 10,000 12 17.65 99,648 0.34
10,001 to 50,000 20 29.41 374,103 1.27
50,001 to 500,000 6 8.82 462,518 1.57
500,001 and above * 3 4.41 28,513,623 96.61
Units Held by Holders 68 100.00 29,513,863 100.00
Unit Held by Manager Nil Nil Nil Nil
Grand Total for The Fund 68 100.00 29,513,863 100.00
Size of Holdings
BIMB Dana Al-Munsif
No. of Unit Holders No. of Units Held
No. % Units %
5,000 and below 1,403 51.87 2,106,610 2.27
5,001 to 10,000 408 15.08 3,025,826 3.26
10,001 to 50,000 750 27.73 15,984,600 17.21
50,001 to 500,000 141 5.21 13,613,528 14.65
500,001 and above * 3 0.11 58,152,574 62.61
Units Held by Holders 2,705 100.00 92,883,138 100.00
Unit Held by Manager Nil Nil Nil Nil
Grand Total for The Fund 2,705 100.00 92,883,138 100.00
Size of Holdings
BIMB Dana Al-Falah
No. of Unit Holders No. of Units Held
No. % Units %
5,000 and below 1,785 55.97 2,722,898 6.30
5,001 to 10,000 567 17.78 4,180,601 9.67
10,001 to 50,000 729 22.86 15,799,894 36.54
50,001 to 500,000 107 3.36 8,960,301 20.72
500,001 and above * 1 0.03 11,577,365 26.77
Units Held by Holders 3,189 100.00 43,241,059 100.00
Unit Held by Manager Nil Nil Nil Nil
Grand Total for The Fund 3,189 100.00 43,241,059 100.00
* included under this category are nominee accounts.

22
1.9 Policy on Rebate and Soft Commission
The Manager does not receive any soft commission from brokers. All dealings with brokers are
executed at competitive market rates.
For and on behalf of the Manager
BIMB INVESTMENT MANAGEMENT BERHAD
Date: 28 October 2013

23
1.0 LAPORAN PENGURUS
Para pemegang unit yang dihormati,
Kami dengan sukacitanya membentangkan Laporan Pengurus BIMB Dana Al-Fakhim, BIMB
Dana Al-Munsif and BIMB Dana Al-Falah bagi tempoh kewangan berakhir 31 Ogos 2013.
1.1 Nama Dana, Jenis Dana, Kategori Dana dan Objektif Pelaburan Dana
Nama Dana BIMB Dana Al-Fakhim
BIMB Dana Al-Munsif
BIMB Dana Al-Falah
Jenis Dana Pendapatan Pendapatan & Pertumbuhan
Pertumbuhan
Kategori Dana Pasaran Wang Seimbang Aset Campuran
Objektif Pelaburan Dana
Dana ini bertujuan menyediakan aliran pendapatan yang konsisten dengan melabur dalam debentur patuh Syariah jangka pendek, instrumen pasaran wang dan penempatan dalam deposit jangka pendek.
Objektif pelaburan utama Dana adalah untuk menyediakan pendapatan yang stabil dan konsisten serta peningkatan nilai modal untuk jangkamasa sederhana ke panjang. Oleh yang demikian, pulangan adalah berbentuk pertumbuhan modal jangkamasa panjang dan pengagihan pendapatan yang tetap kepada Pemegang Unit.
Objektif pelaburan utama Dana adalah untuk mencapai pulangan modal jangkamasa panjang dengan melabur dalam pelbagai portfolio yang terdiri daripada ekuiti, Sukuk dan instrumen pasaran wang. Justeru itu, semua pendapatan pelaburan (jika ada) akan dilabur semula untuk pertumbuhan modal jangkamasa panjang berbanding dengan pengagihan tahunan.
Nota: Sebarang perubahan kepada objektif pelaburan Dana memerlukan kelulusan daripada Pemegang Unit.
24
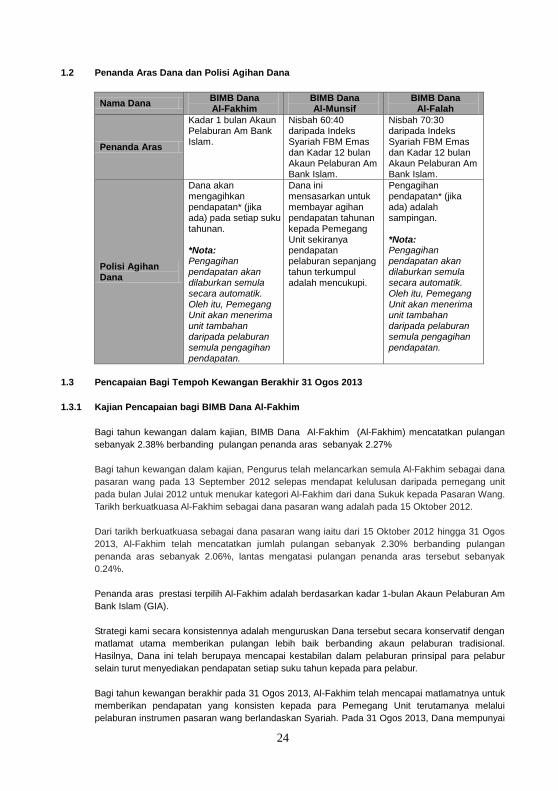
1.2 Penanda Aras Dana dan Polisi Agihan Dana
Nama Dana BIMB Dana Al-Fakhim
BIMB Dana Al-Munsif
BIMB Dana Al-Falah
Penanda Aras
Kadar 1 bulan Akaun Pelaburan Am Bank Islam.
Nisbah 60:40 daripada Indeks Syariah FBM Emas dan Kadar 12 bulan Akaun Pelaburan Am Bank Islam.
Nisbah 70:30 daripada Indeks Syariah FBM Emas dan Kadar 12 bulan Akaun Pelaburan Am Bank Islam.
Polisi Agihan Dana
Dana akan mengagihkan pendapatan* (jika ada) pada setiap suku tahunan. *Nota: Pengagihan pendapatan akan dilaburkan semula secara automatik. Oleh itu, Pemegang Unit akan menerima unit tambahan daripada pelaburan semula pengagihan pendapatan.
Dana ini mensasarkan untuk membayar agihan pendapatan tahunan kepada Pemegang Unit sekiranya pendapatan pelaburan sepanjang tahun terkumpul adalah mencukupi.
Pengagihan pendapatan* (jika ada) adalah sampingan. *Nota: Pengagihan pendapatan akan dilaburkan semula secara automatik. Oleh itu, Pemegang Unit akan menerima unit tambahan daripada pelaburan semula pengagihan pendapatan.
1.3 Pencapaian Bagi Tempoh Kewangan Berakhir 31 Ogos 2013
1.3.1 Kajian Pencapaian bagi BIMB Dana Al-Fakhim
Bagi tahun kewangan dalam kajian, BIMB Dana Al-Fakhim (Al-Fakhim) mencatatkan pulangan
sebanyak 2.38% berbanding pulangan penanda aras sebanyak 2.27%
Bagi tahun kewangan dalam kajian, Pengurus telah melancarkan semula Al-Fakhim sebagai dana
pasaran wang pada 13 September 2012 selepas mendapat kelulusan daripada pemegang unit
pada bulan Julai 2012 untuk menukar kategori Al-Fakhim dari dana Sukuk kepada Pasaran Wang.
Tarikh berkuatkuasa Al-Fakhim sebagai dana pasaran wang adalah pada 15 Oktober 2012.
Dari tarikh berkuatkuasa sebagai dana pasaran wang iaitu dari 15 Oktober 2012 hingga 31 Ogos
2013, Al-Fakhim telah mencatatkan jumlah pulangan sebanyak 2.30% berbanding pulangan
penanda aras sebanyak 2.06%, lantas mengatasi pulangan penanda aras tersebut sebanyak
0.24%.
Penanda aras prestasi terpilih Al-Fakhim adalah berdasarkan kadar 1-bulan Akaun Pelaburan Am
Bank Islam (GIA).
Strategi kami secara konsistennya adalah menguruskan Dana tersebut secara konservatif dengan
matlamat utama memberikan pulangan lebih baik berbanding akaun pelaburan tradisional.
Hasilnya, Dana ini telah berupaya mencapai kestabilan dalam pelaburan prinsipal para pelabur
selain turut menyediakan pendapatan setiap suku tahun kepada para pelabur.
Bagi tahun kewangan berakhir pada 31 Ogos 2013, Al-Fakhim telah mencapai matlamatnya untuk
memberikan pendapatan yang konsisten kepada para Pemegang Unit terutamanya melalui
pelaburan instrumen pasaran wang berlandaskan Syariah. Pada 31 Ogos 2013, Dana mempunyai

25
pendedahan sebanyak 26.2% dalam sekuriti hutang Islam dan 73.8% dalam instrumen pasaran
wang berlandaskan Syariah dan pegangan tunai. Setakat ini, Dana kekal diuruskan sejajar dengan
matlamat yang ditetapkan iaitu melabur terutamanya dalam instrumen pasaran wang
berlandaskan Syariah. Jumlah NAB adalah RM15.31 juta pada 31 Ogos 2013 berbanding
RM14.11 juta pada 31 Ogos 2012.
Nilai aset bersih (NAB) seunit Dana telah berkurangan kepada RM0.5188 (NAB selepas
pengagihan pendapatan) pada 31 Ogos 2013 daripada RM0.5236 (NAB selepas pengagihan
pendapatan) pada 31 Ogos 2012. Dana telah mengisytiharkan jumlah pengagihan pendapatan
sebanyak 1.70 sen seunit sepanjang tahun kewangan, bersamaan 3.25% setahun.
a) Jumlah Pulangan dan Purata Jumlah Pulangan bagi Tahun Kewangan Berakhir pada 31
August 2013
BIMB Dana Al-Fakhim Penanda Aras
Jumlah Pulangan
(%)
Purata Jumlah
Pulangan (%)
Jumlah Pulangan
(%)
Purata Jumlah
Pulangan (%)
Jangkamasa 1-
Tahun 2.38 2.38 2.27 2.27
Jangkamasa 3-
Tahun 9.31 3.10 7.51 2.50
Jangkamasa 5-
Tahun 17.04 3.41 11.57 2.31
* Dana telah menukar kategori dari dana Sukuk kepada dana pasaran wang berkuatkuasa 15
Oktober 2012
^ Penanda aras telah ditukar kepada Akaun Pelaburan Am 1 bulan (GIA) Bank Islam Malaysia
Berhad (Bank Islam) daripada 12 bulan GIA Bank Islam mulai dari tarikh perubahan kategori.
b) Jumlah Pulangan Tahunan Bagi 5 Tahun Kewangan yang Lalu
Tahun Kewangan
BIMB Dana Al-Fakhim
Jumlah Pulangan (%)
Penanda Aras (%)
31 Ogos 2013 2.38 2.27
31 Ogos 2012 3.35 3.23
31 Ogos 2011 3.28 3.08
31 Ogos 2010 3.06 2.36
31 Ogos 2009 3.89 2.85

26
Rajah 1: Jumlah Pulangan Dana dan Penanda Aras Bagi 5 Tahun Kewangan Yang Lalu
Nota:
Sumber Data :BIMB Invest
Data disahkan oleh :Perkasa Normandy Managers Sdn. Bhd.
Penanda Aras : Kadar 12 bulan Akaun Pelaburan Am (AP) Bank Islam
1.3.2 Kajian Pencapaian bagi BIMB Dana Al-Munsif
Bagi tahun kewangan dalam kajian, BIMB Dana Al-Munsif (Al-Munsif) mencatatkan pulangan
sebanyak 3.50% berbanding pulangan penanda aras sebanyak 4.96%
Sejak dilancarkan pada 27 Disember 2001 hingga 31 Ogos 2013, Al-Munsif telah mencatatkan
pulangan sebanyak 103.09% berbanding penanda aras sebanyak 96.93%, lantas menunjukkan
pencapaiannya yang lebih baik sebanyak 6.16%.
Penanda aras prestasi terpilih Al-Munsif adalah berdasarkan nisbah 60:40 Indeks Emas Syariah
FBM dan kadar 12-bulan Akaun Pelaburan Am Bank Islam (GIA).
Strategi kami adalah secara konsistennya mengekalkan tumpuan kepada syarikat-syarikat yang
mantap dan berpotensi untuk membayar dividen secara mapan selain mempunyai prospek
pertumbuhan pendapatan yang baik.
Bagi tahun kewangan berakhir pada 31 Ogos 2013, Al-Munsif telah mencapai matlamatnya untuk
memberikan pendapatan yang kekal stabil dan konsisten serta peningkatan modal dalam jangka
sederhana hingga panjang disebalik pembetulan pasaran sejagat yang memuncak dan
ketidaktentuan pasaran yang berlanjutan. Pada 31 Ogos 2013, Dana mempunyai pendedahan
sebanyak 59.0% dalam pasaran ekuiti dan 41.0% dalam sekuriti hutang Islam dan tunai. Setakat
ini, Dana terus diuruskan selari dengan matlamat dan peruntukan asetnya untuk tempoh jangka
sederhana dan panjang. Berdasarkan jumlah NAB, saiz Dana pada 31 Ogos 2013 adalah
sebanyak RM47.55 juta, berbanding RM58.73 juta pada 31 Ogos 2012.
27
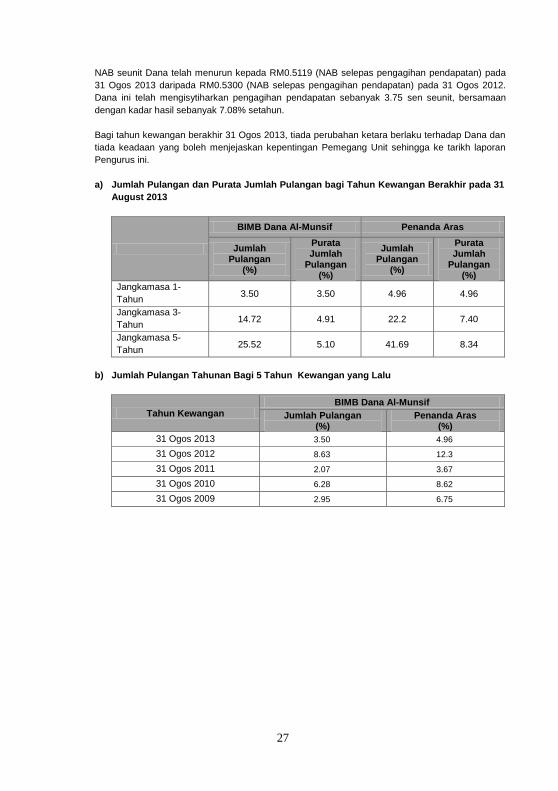
NAB seunit Dana telah menurun kepada RM0.5119 (NAB selepas pengagihan pendapatan) pada
31 Ogos 2013 daripada RM0.5300 (NAB selepas pengagihan pendapatan) pada 31 Ogos 2012.
Dana ini telah mengisytiharkan pengagihan pendapatan sebanyak 3.75 sen seunit, bersamaan
dengan kadar hasil sebanyak 7.08% setahun.
Bagi tahun kewangan berakhir 31 Ogos 2013, tiada perubahan ketara berlaku terhadap Dana dan
tiada keadaan yang boleh menjejaskan kepentingan Pemegang Unit sehingga ke tarikh laporan
Pengurus ini.
a) Jumlah Pulangan dan Purata Jumlah Pulangan bagi Tahun Kewangan Berakhir pada 31
August 2013
BIMB Dana Al-Munsif Penanda Aras
Jumlah Pulangan
(%)
Purata Jumlah
Pulangan (%)
Jumlah Pulangan
(%)
Purata Jumlah
Pulangan (%)
Jangkamasa 1-
Tahun 3.50 3.50 4.96 4.96
Jangkamasa 3-
Tahun 14.72 4.91 22.2 7.40
Jangkamasa 5-
Tahun 25.52 5.10 41.69 8.34
b) Jumlah Pulangan Tahunan Bagi 5 Tahun Kewangan yang Lalu
Tahun Kewangan
BIMB Dana Al-Munsif
Jumlah Pulangan (%)
Penanda Aras (%)
31 Ogos 2013 3.50 4.96
31 Ogos 2012 8.63 12.3
31 Ogos 2011 2.07 3.67
31 Ogos 2010 6.28 8.62
31 Ogos 2009 2.95 6.75

28
Rajah 2: Jumlah Pulangan Dana dan Penanda Aras Bagi 5 Tahun Kewangan Yang Lalu
Nota
Sumber Data : BIMB Invest
Data disahkan oleh : Perkasa Normandy Managers Sdn. Bhd.
Penanda Aras : Nisbah 60:40 “FBM Emas Shariah Index” dan
12 bulan kadar Akaun Pelaburan Am (AP) Bank Islam.
1.3.3 Kajian Pencapaian bagi BIMB Dana Al-Falah
Bagi tahun kewangan dalam kajian, Dana BIMB Al-Falah (Al-Falah) mencatatkan pulangan
sebanyak 0.96% berbanding pulangan penanda aras sebanyak 5.21%.
Sejak dilancarkan pada 27 Disember 2001 hingga 31 Ogos 2013, Al-Falah mencatatkan jumlah
pulangan sebanyak 100.97% berbanding pulangan penanda aras sebanyak 106.46%.
Penanda aras prestasi terpilih Al-Falah adalah berasaskan nisbah 70:30 “Indeks Emas Syariah
FBM” dan kadar 12-bulan Akaun Pelaburan Am Bank Islam (GIA).
Strategi kami adalah secara konsistennya menjurus kepada pengumpulan saham-saham syarikat
yang berpotensi mencatat pertumbuhan pendapatan lebih tinggi daripada kadar purata dalam
jangka sederhana dan panjang.
Bagi tahun kewangan berakhir 31 Ogos 2013, Al-Falah telah mencapai matlamatnya dengan
mempelbagaikan portfolio dalam pelaburan ekuiti, Sukuk dan instrumen pasaran wang. Pada 31
Ogos 2013, Dana mempunyai pendedahan sebanyak 77.2% dalam pasaran ekuiti dan 22.8%
dalam sekuriti hutang Islam dan pegangan tunai. Setakat ini, Al-Falah kekal diuruskan berdasarkan
objektifnya untuk melabur dalam pelbagai portfolio ekuiti, Sukuk dan instrumen pasaran wang
berlandaskan Syariah. Daripada segi jumlah NAB, saiz Dana pada 31 Ogos 2013 adalah
sebanyak RM23.42 juta, berbanding RM23.54 juta, pada 31 Ogos 2012.
NAB seunit Dana telah menurun kepada RM0.5417 (NAB selepas pengagihan pendapatan) pada
31 Ogos 2013 daripada RM0.5769 (NAB selepas pengagihan pendapatan) pada 31 Ogos 2012.

29
Dana telah mengisytiharkan pengagihan pendapatan sebanyak 4.10 sen seunit, atau kadar hasil
sebanyak 7.11% setahun. Pengagihan pendapatan akan dilaburkan semula seperti mana
dinyatakan di dalam prospektus Al-Falah.
Bagi tahun kewangan berakhir 31 Ogos 2013, tiada perubahan ketara berlaku terhadap Dana dan
tiada keadaan yang boleh menjejaskan kepentingan Pemegang Unit sehingga ke tarikh laporan
Pengurus ini.
a) Jumlah Pulangan dan Purata Jumlah Pulangan bagi Tahun Kewangan Berakhir pada 31
August 2013
BIMB Dana Al-Munsif Penanda Aras
Jumlah Pulangan
(%)
Purata Jumlah
Pulangan (%)
Jumlah Pulangan
(%)
Purata Jumlah
Pulangan (%)
Jangkamasa 1-Tahun 0.96 0.96 5.21 5.21
Jangkamasa 3-Tahun 13.61 4.54 24.23 8.08
Jangkamasa 5-Tahun 30.61 6.12 46.00 9.20
b) Jumlah Pulangan Tahunan Bagi 5 Tahun Kewangan yang Lalu
Tahun Kewangan BIMB Dana Al-Falah
Jumlah Pulangan (%)
Penanda Aras (%)
31 Ogos 2013 0.96 5.21
31 Ogos 2012 9.16 13.84
31 Ogos 2011 3.02 3.72
31 Ogos 2010 7.86 9.67
31 Ogos 2009 6.60 7.17

30
Rajah 3: Jumlah Pulangan Dana dan Penanda Aras Bagi 5 Tahun Kewangan Yang Lalu
Nota
Sumber Data : BIMB Invest
Data disahkan oleh : Perkasa Normandy Managers Sdn. Bhd.
Penanda Aras : Nisbah 70:30 “FBM Emas Shariah Index” dan
12 bulan kadar Akaun Pelaburan Am (AP) Bank Islam.
Nota:
1. Jumlah Pulangan telah disahkan oleh Perkasa Normandy Advisers Sdn. Bhd.
(363145-w)
2. Jumlah Pulangan Purata adalah berpandukan formula berikut:
Jumlah Pulangan
Bilangan Tahun Bawah Kajian
Jumlah pulangan purata di atas adalah berdasarkan kepada kaedah-kaedah diperolehi
daripada Lipper Asia Ltd.
Prestasi tahun-tahun sebelum ini tidak semestinya menjadi petunjuk prestasi masa depan
dan harga unit serta pulangan pelaburan mungkin turun dan naik.

31
1.4 Ekonomi dan Kajian Pasaran
1.4.1 Ekonomi
a) Global
Pertumbuhan Keluaran Dalam Negara Kasar (KDNK) benar Amerika Syarikat (AS) telah
disemak semula dengan kadar tahunannya dikurangkan kepada 1.8% pada suku pertama
tahun 2013 (S113) berbanding unjuran awal sebanyak 2.4%. Pengurangan itu adalah
disebabkan oleh semakan semula ke atas perbelanjaan pengguna yang berkembang
sebanyak 2.6% pada S113 berbanding 3.4% sebelumnya apabila perbelanjaan terhadap
barangan tahan lama dan perkhidmatan adalah lebih kecil daripada jangkaan kerana
terdapat kenaikan cukai gaji negara itu.
Inflasi kasar AS berada pada paras 2.0% pada bulan Julai 2013. Inflasi teras berada pada
paras 1.7% pada bulan Julai 2013 disebabkan oleh kenaikan harga tembakau dan produk
berkaitan rokok serta minuman beralkohol.
Kadar pengangguran AS adalah 7.4% daripada keseluruhan jumlah tenaga buruh pada
bulan Julai 2013. Kadar berkenaan yang merupakan paras terendah dalam tempoh lebih
empat tahun, menunjukkan berlakunya pemulihan yang beransur-ansur dalam
pengambilan tenaga kerja.
Rizab Persekutuan AS melaporkan pada bulan Julai 2013, ekonomi negara itu telah
mengekalkan kadar pertumbuhannya daripada perlahan hingga sederhana dengan dipacu
oleh industri pembuatan dan perumahan. Sektor pembuatan telah berkembang di
kebanyakan kawasan sejak penerbitan laporan yang terdahulu, hasil daripada
peningkatan tempahan baharu, penghantaran dan pengeluaran. Permintaan tinggi
terhadap pembinaan rumah kediaman terus merangsang sektor pembuatan dengan
pembekal bahan binaan rumah serta pengeluar simen melaporkan kegiatan yang kukuh,
pengeluar produk kayu memperluaskan operasi dan meningkat pengeluaran, dan
permintaan terhadap peralatan pembinaan meningkat.
Kadar KDNK benar zon Euro kembali meningkat untuk mencatat pertumbuhan yang positif
sebanyak 0.3% pada suku kedua 2013 (S213) berbanding tempoh yang sama tahun lalu
berdasarkan perbandingan sukuan tahun, selepas menguncup sebanyak 0.3% pada
1Q13 dan sebanyak 0.6% pada suku keempat 2012 (S412), dengan didahului oleh dua
ekonomi terbesar, Jerman dan Perancis. Ini menandakan pengembangan ekonomi yang
pertama selepas berlaku penguncupan selama enam suku tahun berturut-turut.
Bank Pusat Eropah (ECB) mengekalkan kadar faedah pada paras rekod terendah
sebanyak 0.5% di dalam Ogos 2013, berbanding dengan 0.75% dalam bulan Ogos 2012.
ECB menyatakan pendirian dasar monetarinya adalah mengekalkan sokongan kepada
pemulihan yang berlaku secara beransur-ansur dalam kegiatan ekonomi untuk tempoh
yang seterusnya dalam tahun ini dan tahun 2014.
Ekonomi China terus menjadi semakin perlahan pada kadar 7.5% pada S213 daripada
7.7% pada S113 berdasarkan perbandingan tahun-ke-tahun apabila eksportnya
mengalami kejatuhan teruk dan pelaburan aset tetap bertambah lemah.

32
b) Dalam Negara
• Ekonomi Malaysia berkembang sebanyak 4.3% pada S213 daripada 4.1% dalam S113
berdasarkan perbandingan tahunan, hasil sokongan penggunaan dan pelaburan swasta.
Permintaan dalam negeri mengimbangi kemerosotan yang berlaku dalam sektor luaran.
Agregat permintaan domestik meningkat, pada kadar sederhana sebanyak 7.3% dalam
S2, untuk menyumbang 6.7% mata kepada pertumbuhan KDNK pada S2. Jumlah
perdagangan bersih telah berkurangan sebanyak 3.3% mata daripada pertumbuhan
KDNK dalam suku kedua (Sumber data: Bank Negara Malaysia).
Pertumbuhan pinjaman berada pada kadar yang sederhana iaitu 9.1% dalam bulan Jun
2013 daripada 9.3% pada bulan Mei berdasarkan perbandingan tahunan berikutan
pertumbuhan pinjaman korporat dan isi rumah lebih lemah pada bulan tersebut.
Eksport Malaysia pada bulan Jun 2013 jatuh 6.9% kepada RM56.75 bilion dalam
perbandingan tahunan kerana berlakunya kejatuhan dalam eksport semikonduktor.
Penurunan berlaku terutamanya untuk eksport ke China, Korea Selatan, Jepun, Taiwan
dan AS.
Fitch Ratings telah menyemak semula tinjauan penarafan kredit kerajaan Malaysia
daripada stabil kepada negatif pada 30 Julai 2013. Walau bagaimanapun, ia mengekalkan
penarafan mata wang asing dan tempatan jangka panjang Malaysia, masing-masing pada
'A-' dan 'A'.
Bank Negara Malaysia mengekalkan Kadar Dasar Semalaman (OPR) sebanyak 3.0%
pada mesyuarat Jawatan kuasa Dasar Monetari (MPC) yang diadakan pada 11 Julai 2013.
MPC menyatakan pendirian yang diambil terhadap dasar monetari semasa adalah wajar
berdasarkan unjuran inflasi dan pertumbuhan ekonomi.
1.4.2 Kajian Pasaran
a) Ekuiti
Indeks Syariah Emas FTSE Bursa Malaysia ("FBM Syariah") mencatatkan paras 11,377.7
mata pada awal tahun kewangan sebelum jatuh ke paras terendah 10,831.06 mata pada 27
November 2012. Indeks itu mencapai paras tertinggi iaitu 12,617.6 mata pada 23 Julai 2013
dan ditutup kepada 12,046.9 mata pada 30 Ogos 2013. Bagi tahun kewangan dalam kajian,
FBM Syariah meningkat sebanyak 669.2 mata atau 5.88% manakala FBM KLCI menokok
81.44 mata atau 4.95% untuk ditutup kepada 1,727.55 mata. Antara faktor-faktor utama yang
menyumbang kepada pergerakan indeks adalah seperti dinyatakan di bawah:
Faktor-faktor utama yang menyumbang kepada pergerakan dalam pasaran:-
Tabung Kewangan Antarabangsa (IMF) telah mengurangkan unjuran pertumbuhan
ekonomi global sebanyak 0.2 mata peratusan kepada 3.1% bagi tahun 2013 berbanding
unjuran sebanyak 3.3% yang dibuat pada bulan April. Ini adalah pengurangan kali
kelima berturut-turut yang dilakukan oleh IMF bagi tahun 2013 berikutan pertumbuhan
ekonomi global yang lebih perlahan berbanding jangkaan. IMF mengurangkan unjuran
pertumbuhan AS bagi tahun 2013 kepada 1.7% daripada unjuran 1.9% yang dibuat pada
bulan April. IMF juga menjangkakan zon Euro akan menguncup sebanyak 0.6% pada
tahun 2013, berbanding -0.4% yang diramalkan sebelum ini. Bagi negara-negara ekonomi
baru muncul, ramalan pertumbuhan sebenar KDNK bagi China dan India telah
dikurangkan, masing-masing kepada 7.8% dan 5.6% bagi tahun 2013 daripada 8.1% dan
5.8% yang diunjurkan pada bulan April.

33
Standard & Poor’s (S&P) telah menurunkan penarafan kredit Itali daripada BBB+ kepada
BBB iaitu dua aras lebih tinggi daripada tahap bon berisiko disebabkan prospek
ekonominya yang semakin lemah dan sistem kewangan yang bermasalah. S&P
menyatakan penarafan itu mewakili pandangannya terhadap prospek ekonomi Itali yang
semakin buruk. Pertumbuhan ekonomi yang rendah itu sebahagian besarnya berpunca
daripada ketegaran pasaran tenaga buruh dan produk Itali. Tinjauan terhadap penarafan
kekal negatif. Walaupun langkah-langkah penjimatan telah membantu Itali mengurangkan
defisitnya mengikut had yang ditetapkan dalam Kesatuan Eropah, tindakan itu menjadikan
kemelesetan yang dialami semakin meruncing dengan ekonomi memasuki era
penguncupan bagi kali kelapan suku tahun dan kadar pengangguran juga berada pada
paras yang tertinggi sekurang-kurangnya sejak tahun 1977.
Kemenangan Perdana Menteri Jepun, Shinzo Abe dalam pemilihan Dewan Senat pada 20
Julai 2013 telah membuka ruang kepada beliau untuk menunaikan janji pembaharuan
struktur yang dikatakannya akan membantu memulihkan ekonomi negara matahari terbit
itu.
b) Pasaran Bon
Global
Bagi tahun kewangan dalam kajian, kadar hasil Perbendaharaan AS (UST) terus meningkat
terutamanya bagi tempoh matang jangka sederhana hingga panjang kerana para pelabur
bimbang bahawa Rizab Persekutuan AS akan mula mengurangkan program pembelian aset
di bawah Kelonggaran Kuantitatif tahun ini.
Rajah 4: Kadar Pulangan Perbendaharaan AS
Sumber: Jabatan Perbendaharaan AS, 31 Ogos 2013

34
Dalam Negara
Di pasaran tempatan, bon kerajaan menguasai kegiatan pasaran bon tempatan apabila
Sekuriti Kerajaan Malaysia (MGS) dan Terbitan Pelaburan Kerajaan (GII) mencatatkan
jumlah dagangan di pasaran sekunder sebanyak RM775.18 bilion bagi tahun dalam
kajian. Kadar hasil bon kerajaan tempatan ditutup lebih tinggi berbanding pada tahun
sebelumnya berikutan jualan yang dilakukan oleh pelabur asing kerana menjangkakan
Rizab Persekutuan AS akan memulakan pengurangan program pembelian aset di bawah
Kelonggaran Kuantitatif tidak lama lagi.
Jadual 1: Sukuk/ Bon Islam
Tempoh/ Tarikh 31 Ogos 2013
(%)
31 Ogos 2012
(%)
Perubahan
* (bps)
Bon 3-Tahun
GII 3.37 3.22 15.0
Korporat AAA 3.88 3.64 24.0
Bon 5-Tahun
GII 3.74 3.36 38.0
Korporat AAA 4.17 3.85 32.0
Bon 7-Tahun
GII 3.94 3.51 43.0
Korporat AAA 4.37 4.04 33.0
Bon 10-Tahun
GII 3.97 3.57 40.0
Korporat AAA 4.56 4.25 31.0
Sumber: Agensi Penetapan Harga (BPAM), 31 Ogos 2013
Rajah 5: Kadar Polisi Semalaman (OPR)
Sumber: Bank Negara Malaysia (BNM), 31 Ogos 2013.

35
Rajah 6: Pertukaran Kadar Faedah (IRS)
Sumber: Bank Negara Malaysia (BNM), 31 Ogos 2013
1.5 Tinjauan Dan Strategi Pasaran
a) Ekuiti
Pasaran ekuiti dijangka berada dalam keadaan tidak menentu pada tahun 2013. Pasaran
ekuiti dijangka disokong oleh kecairan dalam pasaran domestik. Bagaimanapun,
kemungkinan pengenaan dasar monetari yang ketat oleh Rizab Persekutuan Amerika
Syarikat boleh menimbulkan risiko penurunan dalam pasaran ekuiti kerana para pelabur
asing akan menjual ekuiti Malaysia yang berada dalam pegangan mereka.
Ekonomi global terus mengalami pertumbuhan yang perlahan. Ekonomi negara-negara
maju menyaksikan pertumbuhannya kekal lemah. Walaupun keadaan monetari global
kekal amat akomodatif dalam menyokong pertumbuhan, ketidaktentuan pasaran
kewangan telah meningkat dengan ketara sejak kebelakangan ini apabila pasaran-
pasaran kembali menilai semula hala tuju dasar.
Bagi ekonomi Malaysia, permintaan dalam negeri terus menyokong pertumbuhan di
tengah-tengah permintaan luar yang sederhana. Kelemahan yang berterusan dalam
sektor luaran, bagaimanapun mungkin menjejaskan momentum pertumbuhan
keseluruhan. Dalam melangkah ke hadapan, penggunaan swasta dijangka kekal mantap
dengan sokongan pertumbuhan pendapatan dan keadaan pasaran buruh yang stabil.
Perbelanjaan modal dalam industri berasaskan kegiatan domestik serta projek-projek
infrastruktur yang terus dilaksanakan, juga menyokong kegiatan pelaburan.
Strategi ekuiti kami adalah melabur dalam syarikat-syarikat yang jelas mempunyai
pendapatan yang baik, kunci kira-kira yang kukuh, menawarkan hasil dividen yang tinggi
dan mempunyai penilaian yang munasabah.

36
b) Pasaran Bon dan Pasaran Wang
Pasaran Sukuk dijangka tidak menentu dengan terdapat kemungkinan Rizab Persekutuan
di Amerika Syarikat akan mengetatkan dasar kewangannya lantas memberi kesan yang
negatif kepada harga Sukuk apabila para pelabur asing menjual bon-bon tersebut. Walau
bagaimanapun, kecairan yang besar dalam pasaran domestik akan menyokong pasaran
Sukuk.
Jawatankuasa Dasar Monetari (MPC) Bank Negara Malaysia (BNM), pada 11 Julai, telah
memutuskan untuk mengekalkan Kadar Dasar Semalaman (OPR) pada paras 3.0%. BNM
juga mengambil pendirian mengekalkan dasar monetari yang akomodatif untuk memberi
sokongan terhadap pertumbuhan ekonomi tatkala inflasi kekal bertahan.
Strategi kami adalah melabur dalam Sukuk berkualiti baik yang mempunyai penarafan
minimum AA3/AA- daripada RAM/MARC dan menjanjikan kadar keuntungan yang
menarik. Strategi pasaran wang kami adalah melabur dalam pelaburan pasaran wang
yang memberikan kadar keuntungan menarik dan menempatkan deposit untuk tempoh
matang lebih panjang kerana kos dana dijangka tidak akan bertambah.
1.6 Peruntukan Aset pada 31 Ogos 2013
BIMB Dana Al-Fakhim 2013
(%)
2012
(%)
2011
(%)
PELABURAN DALAM SEKURITI
HUTANG SECARA ISLAM: 26.2 72 83
PELABURAN JANGKA PENDEK: 73.8 28 17
100 100 100
BIMB Dana Al-Munsif 2013
(%)
2012
(%)
2011
(%)
PELABURAN SEKURITI
TERSIARHARGA:
Pembinaan 10.4 8 7
Barang Pengguna 2.9 2 0
Kewangan 1.3 1 -
Syarikat Projek Infrastruktur 0.6 3 5
Perladangan 6.5 2 2
Hartanah Barangan Industri 0.4 4 4
Tabung Amanah Hartanah 9.1 4 4
REITs - - 1
Teknologi - 2 -
Perdagangan dan Perkhidmatan - - -
27.8 28 28
59.0 54 51
PELABURAN DALAM SEKURITI
HUTANG SECARA ISLAM: 33.5 42 30
PELABURAN JANGKA PENDEK: 7.5 4 19
100 100 100

37
1.6 Peruntukan Aset pada 31 Ogos 2013 (sambungan)
BIMB Dana Al-Falah 2013
(%)
2012
(%)
2011
(%)
PELABURAN SEKURITI
TERSIARHARGA:
Pembinaan 14.9 9 7
Barang Pengguna 6.4 2 -
Barangan Industri - 3 4
Teknologi Maklumat - - -
Syarikat Projek Infrastruktur 5.2 - -
Perladangan 2.5 4 3
Hartanah 17.5 5 5
REITs 0.6 - -
Perdagangan dan Perkhidmatan 28.0 34 26
Waran 2.1 - -
77.2 57 45
PELABURAN DALAM SEKURITI HUTANG
SECARA ISLAM: 17.1 30 18
PELABURAN JANGKA PENDEK: 5.7 13 37
100 100 100
1.7 Lain-Lain Data Prestasi Bagi Tahun Kewangan Berakhir 31 Ogos 2013
BIMB Dana Al-Fakhim 2013 2012 2011
Harga Unit (RM)
NAB tertinggi seunit dalam tahun * 0.5260 0.5402 0.5372
NAB terendah seunit dalam tahun * 0.5188 0.5223 0.5198
Nilai asset Bersih (NAB) dan Unit Dalam
Edaran (UDE) pada Akhir Tahun
Jumlah NAB (RM) 15,311,020 14,107,483 14,551,641
Unit Dalam Edaran (UDE) 29,513,863 26,942,831 27,880,013
NAB seunit (RM) * 0.5188 0.5236 0.5220
Jumlah Pulangan Dana (%)
Pertumbuhan Modal (%) (0.87) 0.28 0.40
Pulangan Pendapatan (%) 3.25 3.07 2.88
2.38 3.35 3.28
Agihan Kasar seunit (Sen) 1.70 1.60 1.50
Agihan Bersih seunit (Sen) 1.70 1.60 1.50
Nilai Aset Bersih sebelum Pengagihan (RM) 0.5358 0.5396 0.5370
Nilai Aset Bersih selepas Pengagihan (RM) 0.5188 0.5236 0.5220
Tarikh Pengagihan 30 Ogos 2013 30 Ogos 2012 29 Ogos 2011
Nisbah Perbelanjaan Pengurusan (NPP) (%) 0.69 0.95 1.88
Nisbah Pusing Ganti Portfolio (Kali) 16.04 0.20 1.20
*Harga NAB selepas pengagihan pendapatan

38
1.7 Lain-Lain Data Prestasi Bagi Tahun Kewangan Berakhir 31 Ogos 2013 (sambungan)
BIMB Dana Al-Munsif 2013 2012 2011
Harga Unit (RM)
NAB tertinggi seunit dalam tahun * 0.5722 0.5577 0.5645
NAB terendah seunit dalam tahun * 0.5119 0.4830 0.5256
Nilai asset Bersih (NAB) dan Unit Dalam
Edaran (UDE) pada Akhir Tahun
Jumlah NAB (RM) 47,546,800 58,729,018 50,212,801
Unit Dalam Edaran (UDE) 92,883,138 110,803,698 98,329,037
NAB seunit (RM) * 0.5119 0.5300 0.5107
Jumlah Pulangan Dana (%)
Pertumbuhan Modal (%) (3.58) 3.83 (2.72)
Pulangan Pendapatan (%) 7.08 4.80 4.79
3.50 8.63 2.07
Agihan Kasar seunit (Sen) 3.76 2.47 2.52
Agihan Bersih seunit (Sen) 3.75 2.45 2.50
Nilai Aset Bersih sebelum Pengagihan (RM) 0.5494 0.5545 0.5357
Nilai Aset Bersih selepas Pengagihan (RM) 0.5119 0.5300 0.5107
Tarikh Pengagihan 30 Ogos 2013 30 Ogos 2012 29 Ogos 2011
Nisbah Perbelanjaan Pengurusan (NPP) (%) 1.68 1.64 1.68
Nisbah Pusing Ganti Portfolio (Kali) 1.06 0.45 0.89
*Harga NAB selepas pengagihan pendapatan
BIMB Dana Al-Falah 2013 2012 2011
Harga Unit (RM)
NAB tertinggi seunit dalam tahun * 0.6333 0.6003 0.5997
NAB terendah seunit dalam tahun * 0.5417 0.5189 0.5336
Nilai asset Bersih (NAB) dan Unit Dalam
Edaran (UDE) pada Akhir Tahun
Jumlah NAB (RM) 23,423,394 23,536,529 23,114,940
Unit Dalam Edaran (UDE) 43,241,059 40,793,027 42,266,252
NAB seunit (RM) * 0.5417 0.5769 0.5469
Jumlah Pulangan Dana (%)
Pertumbuhan Modal (%) (6.15) 5.51 (0.63)
Pulangan Pendapatan (%) 7.11 3.65 3.65
0.96 9.16 3.02
Agihan Kasar seunit (Sen) 4.12 2.04 2.01
Agihan Bersih seunit (Sen) 4.10 2.00 2.00
Nilai Aset Bersih sebelum Pengagihan (RM) 0.5827 0.5969 0.5669
Nilai Aset Bersih selepas Pengagihan (RM) 0.5417 0.5769 0.5469
Tarikh Pengagihan 30 Ogos 2013 30 Ogos 2012 29 Ogos 2011
Nisbah Perbelanjaan Pengurusan (NPP) (%) 1.76 1.69 1.76
Nisbah Pusing Ganti Portfolio (Kali) 0.96 0.44 0.88
*Harga NAB selepas pengagihan pendapatan

39
a) Pulangan Ke atas Dana
Pulangan ke atas Dana
= Harga seunit (pada akhir tahun) -1
Harga seunit (pada awal tahun)
b) Pertumbuhan Modal
Penambahan Modal
= Pulangan Ke atas Dana – Pulangan Pendapatan
c) Pulangan Pendapatan
Pulangan Pendapatan
= {Pengagihan Pendapatan Se Unit / NAB se unit pada
awal tahun} x 100
d) Nisbah Perbelanjaan
Pengurusan
= Ia dikira dengan mengambil jumlah perbelanjaan
pengurusan sepertimana yang dinyatakan sebagai
peratusan tahunan daripada jumlah purata Nilai
Aset Bersih Dana.
e) Nisbah Pusing Ganti
Portfolio
= Ia dikira dengan mengambil purata jumlah perolehan dan
pelupusan pelaburan dalam Dana bagi tempoh
tahunan dibahagi dengan purata Nilai Aset Bersih Dana
yang dikira pada asas harian.
1.8 Pecahan Pegangan Unit pada 31 Ogos 2013
Saiz Dipegang
BIMB Dana Al-Fakhim
Bilangan Pemegang Unit Bilangan Unit Dipegang
Bilangan % Unit %
Kurang daripada 5,000 27 39.71 63,969 0.21
5,001 hingga 10,000 12 17.65 99,648 0.34
10,001 hingga 50,000 20 29.41 374,103 1.27
50,001 hingga 500,000 6 8.82 462,518 1.57
500,001 dan ke atas * 3 4.41 28,513,623 96.61
Unit yang dipegang oleh
Pemegang unit 68 100.00 29,513,863 100.00
Unit yang dipegang oleh Pengurus
Tiada Tiada Tiada Tiada
Jumlah Keseluruhan Dana 68 100.00 29,513,863 100.00

40
1.8 Pecahan Pegangan Unit pada 31 Ogos 2013 (sambungan)
Saiz Dipegang
BIMB Dana Al-Munsif
Bilangan Pemegang Unit Bilangan Unit Dipegang
Bilangan % Bilangan %
Kurang daripada 5,000 1,403 51.87 2,106,610 2.27
5,001 hingga 10,000 408 15.08 3,025,826 3.26
10,001 hingga 50,000 750 27.73 15,984,600 17.21
50,001 hingga 500,000 141 5.21 13,613,528 14.65
500,001 dan ke atas * 3 0.11 58,152,574 62.61
Unit yang dipegang oleh
Pemegang unit 2,705 100.00 92,883,138 100.00
Unit yang dipegang oleh Pengurus
Tiada Tiada Tiada Tiada
Jumlah Keseluruhan Dana 2,705 100.00 92,883,138 100.00
*Akaun Penama juga termasuk dibawah kategori ini.
Saiz Dipegang
BIMB Dana Al-Falah
Bilangan Pemegang Unit Bilangan Unit Dipegang
Bilangan % Bilangan %
Kurang daripada 5,000 1,785 55.97 2,722,898 6.30
5,001 hingga 10,000 567 17.78 4,180,601 9.67
10,001 hingga 50,000 729 22.86 15,799,894 36.54
50,001 hingga 500,000 107 3.36 8,960,301 20.72
500,001 dan ke atas * 1 0.03 11,577,365 26.77
Unit yang dipegang oleh
Pemegang unit 3,189 100.00 43,241,059 100.00
Unit yang dipegang oleh Pengurus
Tiada Tiada Tiada Tiada
Jumlah Keseluruhan Dana 3,189 100.00 43,241,059 100.00
*Akaun Penama juga termasuk dibawah kategori ini.

41
1.9 Polisi Rebat dan Komisyen Bukan Tunai
Pihak pengurusan tidak menerima sebarang komisyen bukan tunai daripada broker. Semua
urusniaga dengan broker telah dilaksanakan pada kadar pasaran yang berdaya saing.
Untuk dan bagi pihak Pengurus
BIMB INVESTMENT MANAGEMENT BERHAD
Tarikh: 28 Oktober 2013
Nota:
Laporan ini telah diterjemahkan daripada laporan asal (dalam Bahasa Inggeris). Jika terdapat
perbezaan, sila rujuk kepada laporan Bahasa Inggeris

42
2.0 TRUSTEE’S REPORT
ABB TRUSTEE BERHAD
ANNUAL REPORT FOR THE FINANCIAL YEAR ENDED 31 AUGUST 2013
To the Unit Holders of
BIMB Dana Al-Fakhim
BIMB Dana Al-Munsif
BIMB Dana Al-Falah
We have acted as Trustee of BIMB Dana Al-Fakhim, BIMB Dana Al-Munsif and BIMB Dana Al-
Falah (“the Funds”) for the financial year ended 31 August 2013. To the best of our knowledge,
BIMB Investment Management Berhad (“the Manager” or “the Management Company”) has
managed the Funds in accordance with the following:
1. The limitations imposed on the investment powers of the Management Company and the
Trustee under the Deeds, the Securities Commission’s Guidelines on Unit Trust Funds, the
Capital Markets and Services Act 2007 and other applicable laws;
2. The valuation or pricing of the Funds is carried out in accordance with the Deeds and any
regulatory requirement;
3. The creation and cancellation of units of the Funds are carried out in accordance with the
Deeds and any regulatory requirement; and
4. The income distribution by BIMB Dana Al-Fakhim is relevant and reflects the investment
objective of the Fund.
For ABB Trustee Berhad
…………………………………..
Ahmad Fathi Mohd Noor
Vice President
Kuala Lumpur, Malaysia
Date: 28 October 2013

43
3.0 SHARIAH COMMITTEE’S REPORT ANNUAL REPORT
FOR THE FINANCIAL YEAR ENDED 31 AUGUST 2013
بسم ٱهلل ٱلرحمـن ٱلرحيم
To the Unit Holders of
BIMB Dana Al-Fakhim
BIMB Dana Al-Munsif
BIMB Dana Al-Falah
We have acted as the Shariah Committee of BIMB Dana Al-Fakhim, BIMB Dana Al-Munsif and BIMB Dana
Al-Falah.
Our responsibilities are to ensure that the procedures and processes employed by BIMB Investment
Management Berhad and that the provisions of the Deed dated 6 December 2001 are in accordance with
Shariah principles.
In our opinion, BIMB Investment Management Berhad has managed BIMB Dana Al-Fakhim, BIMB Dana
Al-Munsif and BIMB Dana Al-Falah in accordance with Shariah principles and complied with applicable
guidelines, ruling or decision issued by the Securities Commission pertaining to Shariah matters for the
financial year ended 31 August 2013.
In addition, we also confirm that the investment portfolio of BIMB Dana Al-Fakhim, BIMB Dana Al-Munsif
and BIMB Dana Al-Falah comprises securities which have been classified as Shariah-compliant by the
Shariah Advisory Council (SAC) of the Securities Commission, as the case may be and that all deposits
and money market instruments placed by the Funds are Shariah-compliant.
أعلم واهلل
For and on behalf of the Shariah Committee
……………………………………………….. USTAZ DR. AHMAD SHAHBARI@SOBRI SALAMON (Chairman) ……………………………………………….. USTAZ DR. YUSOF RAMLI (Committee Member) ……………………………………………….. USTAZAH DR. ASMAK AB. RAHMAN (Committee Member) Date: 28 October 2013

44
4.0 DIRECTORS’ DECLARATION REPORT ANNUAL REPORT
FOR THE FINANCIAL YEAR ENDED 31 AUGUST 2013
To the Unit Holders of
BIMB Dana Al-Fakhim
BIMB Dana Al-Munsif
BIMB Dana Al-Falah
We, Mustapha Bin Hamat and Nazaruddin Bin Othman, being two of the directors of the Manager, BIMB
Investment Management Berhad, for BIMB Dana Al-Fakhim, BIMB Dana Al-Munsif and BIMB Dana Al-
Falah do hereby state that in our opinion, the accompanying Statement of Financial Position, Statement of
Profit or Loss and Other Comprehensive Income, Statement of Changes in Net Asset Value and Statement
of Cash Flows are drawn up so as to give true and fair view of the Statement of Financial Position of the
Fund as at 31 August 2013 and Statement of Profit or Loss and Other Comprehensive Income, Statement
of Changes in Net Asset Value and Statement of Cash Flows for the year ended on that date.
For and on behalf on the Board of Directors,
……………………………………………
Mustapha Bin Hamat
(Non-Executive Independent Director)
…………………………………………..
Nazaruddin Bin Othman
(Chief Executive Officer)
Date: 28 October 2013

45
5.0 INDEPENDENT AUDITOR’S REPORT
(Established in Malaysia)
Independent Auditors’ Report to the Unitholders of BIMB Dana Al-Fakhim, BIMB Dana Al-Munsif
and BIMB Dana Al-Falah
Report on the Financial Statements
We have audited the financial statements of BIMB Dana Al-Fakhim, BIMB Dana Al-Munsif and BIMB Dana
Al-Falah (“the Fund”), which comprise the statement of financial position as at 31 August 2013, and the
statements of profit or loss and other comprehensive income, changes in net asset value and cash flows
for the year then ended, and a summary of significant accounting policies and other explanatory
information, as set out on pages 47 to 129.
Manager’s and Trustee’s Responsibility for the Financial Statements
The Manager of the Fund is responsible for the preparation of financial statements that give a true and fair
view in accordance with Malaysian Financial Reporting Standards, International Financial Reporting
Standards and for such internal control as the Manager determine are necessary to enable the preparation
of financial statements that are free from material misstatement, whether due to fraud or error. The Trustee
is responsible for ensuring that the Manager maintains proper accounting and other records as are
necessary to enable true and fair presentation of these financial statements.
Auditors’ Responsibility
Our responsibility is to express an opinion on these financial statements based on our audit. We conducted
our audit in accordance with approved standards on auditing in Malaysia. Those standards require that we
comply with ethical requirements and plan and perform the audit to obtain reasonable assurance whether
the financial statements are free from material misstatement.
An audit involves performing procedures to obtain audit evidence about the amounts and disclosures in the
financial statements. The procedures selected depend on our judgement, including the assessment of
risks of material misstatement of the financial statements, whether due to fraud or error. In making those
risk assessments, we consider internal control relevant to the entity’s preparation of financial statements
that give a true and fair view in order to design audit procedures that are appropriate in the circumstances,
but not for the purpose of expressing an opinion on the effectiveness of the entity’s internal control. An
audit also includes evaluating the appropriateness of accounting policies used and the reasonableness of
accounting estimates made by the Manager, as well as evaluating the overall presentation of the financial
statements.
We believe that the audit evidence we have obtained is sufficient and appropriate to provide a basis for our
audit opinion.

46
Opinion
In our opinion, the financial statements give a true and fair view of the financial position of the Fund as of
31 August 2013 and of its financial performance, changes in net asset attributable to unitholders and cash
flows for the year then ended in accordance with Malaysian Financial Reporting Standards and
International Financial Reporting Standards.
Other Matters
As stated in Note 2(a) to the financial statements, BIMB Dana Al-Fakhim, BIMB Dana Al-Munsif and BIMB
Dana Al-Falah adopted Malaysian Financial Reporting Standards (“MFRS”) and International Financial
Reporting Standards (“IFRS”) on 1 September 2012 with a transition date of 1 September 2011. These
standards were applied retrospectively by the Manager to the comparative information in these financial
statements, including the statements of financial position as at 31 August 2012 and 1 September 2011,
and the statements of profit or loss and other comprehensive income, changes in equity and cash flows for
the year ended 31 August 2012 and related disclosures. We were not engaged to report on the
comparative information that is prepared in accordance with MFRS and IFRS, and hence it is unaudited.
Our responsibilities as part of our audit of the financial statements of the Fund for the year ended 31
August 2013 have, in these circumstances, included obtaining sufficient appropriate audit evidence that
the opening balances as at 1 September 2012 do not contain misstatements that materially affect the
financial position as of 31 August 2013 and financial performance and cash flows for the year then ended.
This report is made solely to the unitholders of the Fund and for no other purpose. We do not assume
responsibility to any other person for the content of this report.
KPMG Desa Megat & Co.
Firm Number: AF 0759
Chartered Accountants
Ow Peng Li
Approval Number: 2666/09/15(J)
Chartered Accountant
Petaling Jaya, Selangor
Date: 28 October 2013
47
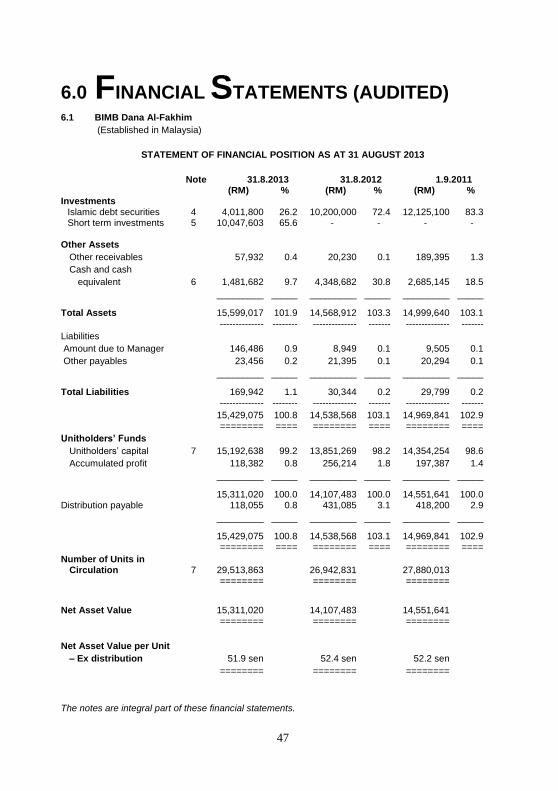
6.0 FINANCIAL STATEMENTS (AUDITED) 6.1 BIMB Dana Al-Fakhim
(Established in Malaysia)
STATEMENT OF FINANCIAL POSITION AS AT 31 AUGUST 2013
Note 31.8.2013 31.8.2012 1.9.2011 (RM) % (RM) % (RM) % Investments
Islamic debt securities 4 4,011,800 26.2 10,200,000 72.4 12,125,100 83.3 Short term investments 5 10,047,603 65.6 - - - -
Other Assets
Other receivables 57,932 0.4 20,230 0.1 189,395 1.3
Cash and cash
equivalent 6 1,481,682 9.7 4,348,682 30.8 2,685,145 18.5
_________ _____ _________ _____ _________ _____
Total Assets 15,599,017 101.9 14,568,912 103.3 14,999,640 103.1 -------------- -------- -------------- ------- -------------- -------
Liabilities
Amount due to Manager 146,486 0.9 8,949 0.1 9,505 0.1
Other payables 23,456 0.2 21,395 0.1 20,294 0.1
_________ _____ _________ _____ _________ _____
Total Liabilities 169,942 1.1 30,344 0.2 29,799 0.2 -------------- -------- -------------- ------- -------------- -------
15,429,075 100.8 14,538,568 103.1 14,969,841 102.9 ======== ==== ======== ==== ======== ====
Unitholders’ Funds
Unitholders’ capital 7 15,192,638 99.2 13,851,269 98.2 14,354,254 98.6
Accumulated profit 118,382 0.8 256,214 1.8 197,387 1.4
_________ _____ _________ _____ _________ _____
15,311,020 100.0 14,107,483 100.0 14,551,641 100.0 Distribution payable 118,055 0.8 431,085 3.1 418,200 2.9
_________ _____ _________ _____ _________ _____
15,429,075 100.8 14,538,568 103.1 14,969,841 102.9 ======== ==== ======== ==== ======== ====
Number of Units in Circulation 7 29,513,863 26,942,831 27,880,013
======== ======== ========
Net Asset Value 15,311,020 14,107,483 14,551,641
======== ======== ========
Net Asset Value per Unit
– Ex distribution 51.9 sen 52.4 sen 52.2 sen
======== ======== ========
The notes are integral part of these financial statements.
48
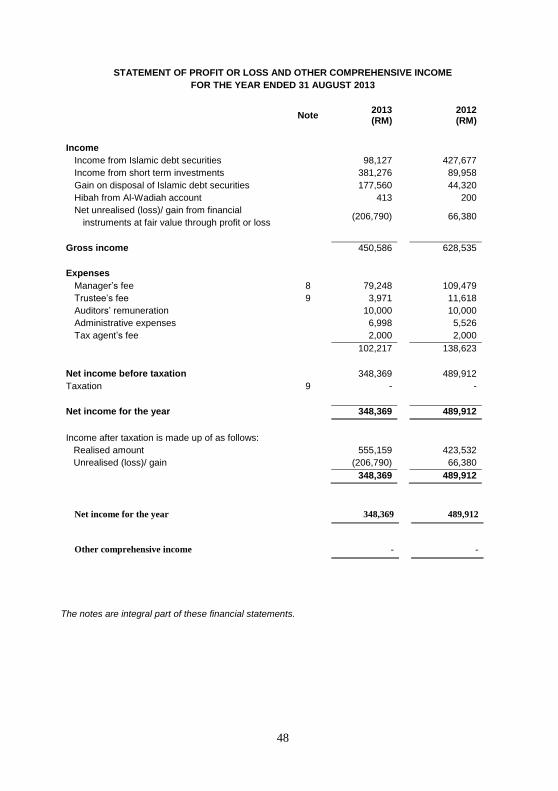
STATEMENT OF PROFIT OR LOSS AND OTHER COMPREHENSIVE INCOME
FOR THE YEAR ENDED 31 AUGUST 2013
Note 2013 (RM)
2012 (RM)
Income
Income from Islamic debt securities 98,127 427,677
Income from short term investments 381,276 89,958
Gain on disposal of Islamic debt securities 177,560 44,320
Hibah from Al-Wadiah account 413 200
Net unrealised (loss)/ gain from financial
instruments at fair value through profit or loss (206,790) 66,380
Gross income 450,586 628,535
Expenses
Manager’s fee 8 79,248 109,479
Trustee’s fee 9 3,971 11,618
Auditors’ remuneration 10,000 10,000
Administrative expenses 6,998 5,526
Tax agent’s fee 2,000 2,000
102,217 138,623
Net income before taxation 348,369 489,912
Taxation 9 - -
Net income for the year 348,369 489,912
Income after taxation is made up of as follows:
Realised amount 555,159 423,532
Unrealised (loss)/ gain (206,790) 66,380
348,369 489,912
Net income for the year 348,369 489,912
Other comprehensive income - -
The notes are integral part of these financial statements.

49
STATEMENT OF CHANGES IN NET ASSET VALUE FOR THE YEAR ENDED 31 AUGUST 2013
Note
Unitholders
’capital Distribution
Accumulate
d profits Total
(RM) (RM) (RM) (RM)
As at 1 September 2011
14,354,254 418,200 197,387 14,969,841
Movement in unitholders' contribution or
distribution
Creation of units via cash
388,347 - - 388,347
Cancellation of units via
reinvestment of distribution 37,715 (418,200) - (380,485)
Cancellation of units
(929,047) - - (929,047)
Distributions 11 - 431,085 (431,085) -
Total distribution to unitholders
(502,985) 12,885 (431,085) (921,185)
Net income for the year
- - 489,912 489,912
As at 31 August 2012
13,851,269 431,085 256,214 14,538,568
As at 1 September 2012
13,851,269 431,085 256,214 14,538,568
Movement in unitholders' contribution or
distribution
Creation of units via cash
2,032,587 - - 2,032,587
Creation of units via reinvestment of
distribution 392,504 (799,231) - (406,727)
Cancellation of units
(1,083,722) - - (1,083,722)
Distributions 11 - 486,201 (486,201) -
Total distribution to unitholders
1,341,369 (313,030) (486,201) 542,138
Net income for the year
- - 348,369 348,369
As at 31 August 2013
15,192,638 118,055 118,382 15,429,075
The notes are integral part of these financial statements.

50
STATEMENT OF CASH FLOWS FOR THE YEAR ENDED 31 AUGUST 2013
2013 (RM)
2012 (RM)
Cash flows from Operating Activities
Proceeds from sales of Islamic debt securities 10,173,000 4,033,800
Income from Islamic debt securities and short term investments
442,113 687,000
Trustee’s fee paid (4,670) (11,647)
Payment for other fee and expenses (6,238) (9,005)
Audit fee paid (10,000) (7,392)
Manager’s fee paid (81,809) (110,034)
Purchase of investments (10,047,603) (1,998,000)
Purchase of Islamic debt securities (4,014,030) -
Net cash (used in)/ generated from operating activities
(3,549,237) 2,584,722
Cash flows from financing activities
Cash receipt for creation of units 2,032,587 388,347
Cash payment for cancellation of units (943,624) (929,047)
Payment of distribution (406,726) (380,485)
Net cash generated from/ (used in) financing activities
682,237 (921,185)
Net (decrease)/ increase in cash and cash equivalents
(2,867,000) 1,663,537
Cash and cash equivalents at beginning of the year
4,348,682 2,685,145
Cash and cash equivalents at end of the year 1,481,682 4,348,682
Cash and cash equivalents comprise:
Cash at bank 46,474 195,782
Short term investments 1,435,208 4,152,900
1,481,682 4,348,682
The notes are an integral part of these financial statements.

51
NOTES TO THE FINANCIAL STATEMENTS
1. Information on the Fund
BIMB Dana Al-Fakhim (hereinafter referred to as “the Fund”) was constituted pursuant to the
execution of a Deed dated 6 December 2001 between the Manager - BIMB Investment
Management Berhad, the Trustee - ABB Trustee Berhad and the registered holders of the Fund.
The addresses of the registered office and principal place of business of the Fund is as follows:
Registered office
Level 32, Menara Bank Islam
No. 22, Jalan Perak
50450 Kuala Lumpur
Principal place of business
Leval 19, Menara Bank Islam
No. 22, Jalan Perak
50450 Kuala Lumpur
The principal activity of the Fund is to invest in Authorised Investments as defined in the Deed,
which include Islamic debt securities and short term deposits.
The Manager, BIMB Investment Management Berhad, a company incorporated in Malaysia, is a
subsidiary of Bank Islam Malaysia Berhad.
The financial statements were approved by the Board of Directors of the Manager on 28 October
2013.
2. Basis of Preparation
(a) Statement of Compliance
The financial statements of the Fund have been prepared in accordance with Malaysian
Financial Reporting Standards (“MFRSs”) and International Financial Reporting Standards in
Malaysia. This is the Fund’s first financial statements prepared in accordance with MFRSs and
MFRS 1, First-time Adoption of Malaysian Financial Reporting Standards has been applied.
In the previous years, the financial statements of the Fund were prepared in accordance with
Financial Reporting Standards (“FRS”). The transition to MFRS has no financial impact to the
financial statements of the Fund.
The Fund has adopted the amendments to MFRS 101, Presentation of Financial Statements
which are effective for annual periods beginning on or after 1 July 2012. The adoption of the
amendments to MFRS 101 has no impact on the financial statements other than the
presentation format of the statement of financial position and the statement of profit or loss
and other comprehensive income.
The following are accounting standards, amendments and interpretations of the MFRS
framework that have been issued by the Malaysian Accounting Standards Board (“MASB”) but
have not been adopted by the Fund:

52
2. Basis of Preparation (continued)
(a) Statement of Compliance (continued)
MFRSs, Interpretations and amendments effective for annual periods beginning on or
after 1 January 2013
MFRS 10, Consolidated Financial Statements
MFRS 11, Joint Arrangements
MFRS 12, Disclosure of Interests in Other Entities
MFRS 13, Fair Value Measurement
MFRS 119, Employee Benefits (2011)
MFRS 127, Separate Financial Statements (2011)
MFRS 128, Investments in Associates and Joint Ventures (2011)
IC Interpretation 20, Stripping Costs in the Production Phase of a Surface Mine
Amendments to MFRS 7, Financial Instruments: Disclosures – Offsetting Financial Assets
and Financial Liabilities
Amendments to MFRS 1, First-time Adoption of Malaysian Financial Reporting Standards
– Government Loans
Amendments to MFRS 1, First-time Adoption of Malaysian Financial Reporting Standards
(Annual Improvements 2009-2011 Cycle)
Amendments to MFRS 101, Presentation of Financial Statements (Annual Improvements
2009-2011 Cycle)
Amendments to MFRS 116, Property, Plant and Equipment (Annual Improvements 2009-
2011 Cycle)
Amendments to MFRS 132, Financial Instruments: Presentation (Annual Improvements
2009-2011 Cycle)
Amendments to MFRS 134, Interim Financial Reporting (Annual Improvements 2009-2011
Cycle)
Amendments to MFRS 10, Consolidated Financial Statements: Transition Guidance
Amendments to MFRS 11, Joint Arrangements: Transition Guidance
Amendments to MFRS 12, Disclosure of Interests in Other Entities: Transition Guidance
MFRSs, Interpretations and amendments effective for annual periods beginning on or
after 1 January 2014
Amendments to MFRS 10, Consolidated Financial Statements: Investment Entities
Amendments to MFRS 12, Disclosure of Interests in Other Entities: Investment Entities
Amendments to MFRS 127, Separate Financial Statements (2011): Investment Entities
Amendments to MFRS 132, Financial Instruments: Presentation – Offsetting Financial
Assets and Financial Liabilities

53
2. Basis of Preparation (continued)
(a) Statement of Compliance (continued)
MFRSs, Interpretations and amendments effective for annual periods beginning on or
after 1 January 2015
MFRS 9, Financial Instruments (2009)
MFRS 9, Financial Instruments (2010)
Amendments to MFRS 7, Financial Instruments: Disclosures – Mandatory Effective
Date of MFRS 9 and Transition Disclosures
The Fund plans to apply the abovementioned standards, amendments and interpretations,
where applicable:
from the annual period beginning on 1 September 2013 for those standards, amendments
or interpretations that are effective for annual periods beginning on or after 1 January
2013.
from the annual period beginning on 1 September 2014 for those standards, amendments
or interpretations that are effective for annual periods beginning on or after 1 January
2014.
from the annual period beginning on 1 September 2015 for those standards, amendments
or interpretations that are effective for annual periods beginning on or after 1 January
2015.
The initial application of the above standards, amendments and interpretations is not expected
to have any material financial impacts to the current and prior periods financial statements
upon their first adoption.
(b) Basis of Measurement
The financial statements are prepared on the historical cost basis except as disclosed in note
3(a).
(c) Functional and Presentation Currency
These financial statements are presented in Ringgit Malaysia (RM), which is the Fund’s
functional currency.
(d) Use of Estimates and Judgments
The preparation of financial statements inconformity with MFRSs requires management to
make judgements, estimates and assumptions that affect the application of accounting
policies and the reported amounts of assets and liabilities, income and expenses. Actual
results may differ from these estimates.
Estimates and underlying assumptions are reviewed on an ongoing basis. Revisions to
accounting estimates are recognised in the year in which the estimate is revised and in any
future years effected.
There are no significant areas of estimation uncertainty and critical judgements in applying
accounting policies that have significant effect on the amounts recognised in the financial
statements.

54
3. Significant Accounting Policies
The accounting policies set out below have been applied consistently to the periods presented in
these financial statements, and in preparing the opening MFRS statements of financial position of
the Fund at 1 September 2011 (the transition date to MFRS framework), unless otherwise stated.
(a) Financial instruments
(i) Initial recognition and measurement
A financial instrument is recognised in the statement of financial position when, and only
when, the Fund becomes a party to the contractual provisions of the instrument.
A financial instrument is recognised initially, at its fair value plus, in the case of a financial
instrument not at fair value through profit or loss, transaction costs that are directly
attributable to the acquisition or issue of the financial instrument.
(ii) Financial instrument categories and subsequent measurement
The Fund categorise financial instruments as follows:
Financial assets
(a) Financial assets at fair value through profit or loss
Fair value through profit or loss category comprises financial assets that are held for
trading, or financial assets that are specifically designated into this category upon
initial recognition. These include Islamic debt securities.
Financial assets categorised as fair value through profit or loss are subsequently
measured at their fair values with the gain or loss recognised in the statement of profit
or loss and other comprehensive income.
(b) Financing and receivables
Financing and receivables category are debt instruments that are not quoted in an
active market and these comprises other receivables, cash at bank and short term
investments.
Financial assets categorised as financing and receivables are subsequently
measured at amortised cost using the effective profit method.
All financial assets except for those measured at fair value through profit or loss, are
subject to review for impairment.
Financial liabilities
All financial liabilities are initially measured at fair value and subsequently measured at
amortised cost.
Financial liabilities measured at amortised cost comprise amount due to Manager and
other payables.

55
3. Significant Accounting Policies (continued)
(a) Financial instruments (continued)
(iii) Derecognition
A financial asset or part of it is derecognised when, and only when the contractual rights
to the cash flows from the financial asset expire or the financial asset is transferred to
another party without retaining control or substantially all risks and rewards of the asset.
On derecognition of a financial asset, the difference between the carrying amount and the
sum of the consideration received (including any new asset obtained less any new liability
assumed) and any cumulative gain or loss that had been recognised in equity is
recognised in profit or loss.
A financial liability or a part of it is derecognised when, and only when, the obligation
specified in the contract is discharged or cancelled or expires. On derecognition of a
financial liability, the difference between the carrying amount of the financial liability
extinguished or transferred to another party and the consideration paid, including any non-
cash assets transferred or liabilities assumed, is recognised in profit or loss.
(b) Income recognition
Income from short term investments and Islamic debt securities are recognised in the
statement of profit or loss and other comprehensive income as it accrues.
(c) Short term investments
Short term investments are mainly General Investment Account, Istismar Deposits, Special
Investment Account and Term Deposits-i with maturity more than 30 days and less than 1
year. Short term investments are categorised and measured as financing and receivables in
accordance with Note 3(a)(ii).
(d) Impairment
Financial assets
All financial assets (except for financial assets categorised as fair value through profit or loss)
are assessed at each reporting date whether there is any objective evidence of impairment as
a result of one or more events having an impact on the estimated future cash flows of the
asset. Losses expected as a result of future events, no matter how likely, are not recognised.
An impairment loss in respect of financing and receivables is recognised in profit or loss and
is measured as the difference between the asset’s carrying amount and the present value of
estimated future cash flows discounted at the asset’s original effective profit rate. The carrying
amount of the asset is reduced through the use of an allowance account.
(e) Cash and cash equivalents
Cash and cash equivalents consist of cash at bank and short term investments which are
readily convertible to cash with an insignificant risk of changes in value. Cash and cash
equivalents are categorised and measured as financing and receivables in accordance with
Note 3(a)(ii).

56
3. Significant Accounting Policies (continued)
(f) Unitholders’ capital
The Fund issues cancellable units, which are cancelled at the holder’s option and are
classified as equity. Cancellable units can be put back to the Fund at any time for cash equal
to a proportionate share of the Fund’s net asset value. The outstanding units is carried at the
redemption amount that is payable at the financial position date if the holder exercises the
right to put the unit back to the Fund.
Units are created and cancelled at the holder’s option at prices based on the Fund’s net
assets value per unit at the time of creation or cancellation. The Fund’s net assets value per
unit is calculated by dividing the net assets attributable to unitholders with the total number of
outstanding units. In accordance with the Securities Commission’s Guidelines on Unit Trust
Funds in Malaysia, investment positions are valued based on the last traded market price for
the purpose of determining the net assets value per unit for creations and cancellations.
The units in the Fund are puttable instruments, classified as equity, which entitle the
unitholders to a pro-rata share of the net asset of the Fund. The units are subordinated and
have identical features. There is no contractual obligation to deliver cash or another financial
asset other than the obligation on the Fund to repurchase the units. The total expected cash
flows from the units are based on the change in the net asset of the Fund.
(g) Distribution
Distributions are at the discretion of the Fund. A distribution to the Fund’s unitholders is
accounted for as a deduction from realised reserves. The mode of the income distribution is
via creation of additional units based on NAV as at the date one month after the accrual date.
A proposed distribution is recognised in equity in the period in which they are declared.
(h) Net Assets Value
As the distribution is to be reinvested, for this Fund, the Net Asset Value is calculated after
deducting the retained earnings allocated for distribution.

57
4. Islamic Debt Securities
31 August 2013
Percentage of value of Maturity Rating* Market funds at Date Cost Value 31.8.2013 Issuer (RM) (RM) (%)
Kapar Energy Ventues Sdn. Bhd. 04/07/2014 AA+IS 3,008,730 3,006,900 19.6 Tanjung Bin O&M Berhad 01/07/2015 AA-IS 1,005,300 1,004,900 6.6 _______________________________________
4,014,030 4,011,800 26.2 ======================================
31 August 2012
Percentage of value of Maturity Rating* Market funds at Date Cost Value 31.8.2012 Issuer (RM) (RM) (%)
Government Investment Issuance: PE 120047 17/05/2013 AA2 1,998,000 2,004,000 14.2 GL 110001 30/08/2018 - 7,997,440 8,196,000 58.2 ____________________________________
9,995,440 10,200,000 72.4 ==================================
1 September 2011 Percentage
of value of Maturity Market funds at Date Cost Value 1.9.2011 Issuer (RM) (RM) (%)
Government Investment Issuance: GH 100001 15/07/2013 - 3,000,000 3,011,700 20.7 GL 110001 30/08/2018 - 9,000,000 9,113,400 62.6 __________________________________
12,000,000 12,125,100 83.3 ===============================
* Ratings is either by Rating Agency Malaysia Berhad or Malaysian Rating Corporation Berhad whichever
applicable.

58
5. Short term investments
31.8.2013 31.8.2012 1.9.2011
(RM) (RM) (RM)
Short term investments with maturity
more than 30 days:
General Investment Account 2,962,719 - -
Istismar Deposits 2,777,961 - -
Special Investment Account* 1,436,084 - -
Term Deposit-i 2,870,838
__________ __________ __________
10,047,603 - -
========= ========= =========
* Special Investment Account is placed with a related party, Bank Islam Malaysia Berhad.
6. Cash and cash equivalents
31.8.2013 31.8.2012 1.9.2011
(RM) (RM) (RM)
Short term investments with maturity
less than 30 days
Special Investment Account* 1,435,208 1,084,291 1,508,610
Wakalah i Deposit- 418,804 1,159,264
Waheed-i Deposits* - 2,649,805 -
__________ __________ __________
1,435,208 4,152,900 2,667,874
Cash at bank * 46,474 195,782 17,271
__________ __________ __________
1,481,682 4,348,682 2,685,145
========= ========= =========
* Special Investment Account, Waheed-i Deposit and cash at bank are placed with a related party,
Bank Islam Malaysia Berhad.
7. Unitholders’ Capital
31.8.2013 31.8.2012 1.9.2011
No. of units (RM) No. of units (RM) No. of units (RM)
At 1 September 26,942,831 13,851,269 27,880,013 14,354,254 27,982,177 14,408,149
Creation of units 4,649,254 2,425,091 803,467 426,062 382,486 201,704
Release of units (2,078,222) (1,083,722) (1,740,649) (929,047) (484,650) (255,599)
_________ _________ _________ _________ _________ _________
At 31 August 29,513,863 15,192,638 26,942,831 13,851,269 27,880,013 14,354,254
======== ======== ======== ======== ======== =========

59
7. Unitholders’ Capital (continued)
In accordance with the Deed, the maximum number of units that can be issued out for circulation
is 400,000,000 (31 August 2012: 400,000,000, 1 September 2011: 400,000,000). As at 31 August
2013, the number of units yet to be issued is RM370,486,137 (31 August 2012: RM373,057,169, 1
September 2011: RM372,119,987).
Based on historic information over the last 12 months, redemption levels are expected to
approximate RM1,083,000 (31 August 2012: RM930,000, 1 September 2011: RM250,000) and the
average monthly level of creations net of new redemptions are expected to approximate
RM111,800 (31 August 2012: RM42,000, 1 September 2011: RM4,000). However, the actual level
of creations may differ significantly from the historic experience.
8. Management Fee
The management fee payable to the Manager of the Fund is based on 0.50% (2012: 0.75%) per
annum of the net asset value of the Fund calculated on a daily basis.
Based on Supplemental Master Prospectus dated 12 September 2012, the management fee was
reduced from 0.75% per annum to 0.50% per annum effectively from 15 October 2012.
Amount due to Manager represents net amount payable to Manager [Management fee: RM6,388
(2012: RM8,949)] and net amount payable to Manager for units released [Release amount:
RM140,098 (2012: RM Nil)].
9. Trustee’s Fee
The trustee’s fee payable to the trustee of the Fund is based on 0.02% (2012: 0.08%) of the net
asset value of the Fund calculated on a daily basis.
Based on Supplemental Master Prospectus dated 12 September 2012, the trustee fee was
reduced from 0.08% per annum subject to a minimum fee of RM18,000 per annum to 0.02% per
annum effectively from 15 October 2012.
10. Taxation
There is no current and prior year tax expense as the investment income received are exempted
from tax, pursuant to Schedule 6 of the Income Tax Act, 1967.

60
11. Distribution
2013 2012
(RM) (RM)
Distribution to unitholders is from the following sources:
Income from short term investment 381,276 89,958
Income from Islamic debt securities 98,127 427,677
Gain on disposal from Islamic debt securities 177,560 44,320
Hibah from Al-Wadiah account 413 200
Realised retained profit brought forward - 7,553
________ ________
657,376 569,708
Less:
Expenses (102,217) (138,623)
Undistributed income (68,958) -
________ ________
Net distribution 486,201 431,085
======= ========
The Manager had declared a net distribution of 1.70 sen (2012: 1.60 sen) per unit based on units
in circulation as at 31 August 2013 amounting to RM486,201 (2012: RM431,085) in respect of the
current financial year. The distribution was approved by the Investment Committee in July 2013.
12. Unit held by Related Party
The number of units held by management company and other related parties are as follows:
2013 2012
Units (RM) Units (RM)
Bank Islam Malaysia Berhad 2,050,383 1,063,739 2,000,000 1,047,000
BIMB Holdings Berhad 23,884,086 12,391,064 23,297,193 12,196,080
======== ======== ======== ========
The Manager does not held any unit in the Fund. All units are held legally and beneficially by the
companies.

61
13. Transaction with Related Parties
Other than as disclosed in Note 5 and 6 of the financial statements, other transaction with related
parties are as follow:
Transactions Balance
as at as at
31 August 31 August
2013 2012 2013 2012
(RM) (RM) (RM) (RM)
The Manager
BIMB Investment Management Bhd.
- Management fee 79,248 109,479 (6,388) (8,949)
====== ====== ====== =======
Holding company of the Manager
Bank Islam Malaysia Berhad
- Income from short term
placement 97,489 26,761 2,871,293 2,649,805
====== ====== ======== =======
The Trustee
ABB Trustee Berhad
- Trustee fee 3,971 11,618 (256) (955)
====== ====== ====== =======
14. Transactions with Financial Institutions
2013 2012
% of % of
Value of total Value of total
trade trade trade trade
Islamic Debt securities (RM) (RM)
AmBank (M) Bhd. 3,008,730 21.12 3,036,525 49.98
Bank Muamalat Malaysia Bhd. 8,208,593 57.62 - -
CIMB Bank Bhd. - - 1,998,000 32.88
Hong Leong Bank Bhd. - - 1,041,467 17.14
Maybank Investment Bank Bhd. 1,006,294 7.06 - -
OSK Investment Bank Bhd. 2,023,564 14.20 - -
_________ _____ _______ ______
14,247,181 100.00 6,075,992 100.00
======== ===== ========= ======
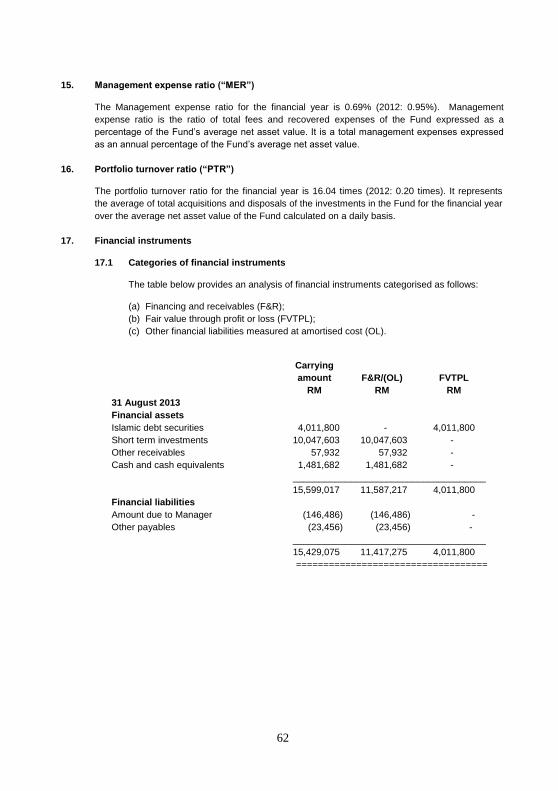
62
15. Management expense ratio (“MER”)
The Management expense ratio for the financial year is 0.69% (2012: 0.95%). Management
expense ratio is the ratio of total fees and recovered expenses of the Fund expressed as a
percentage of the Fund’s average net asset value. It is a total management expenses expressed
as an annual percentage of the Fund’s average net asset value.
16. Portfolio turnover ratio (“PTR”)
The portfolio turnover ratio for the financial year is 16.04 times (2012: 0.20 times). It represents
the average of total acquisitions and disposals of the investments in the Fund for the financial year
over the average net asset value of the Fund calculated on a daily basis.
17. Financial instruments
17.1 Categories of financial instruments
The table below provides an analysis of financial instruments categorised as follows:
(a) Financing and receivables (F&R);
(b) Fair value through profit or loss (FVTPL);
(c) Other financial liabilities measured at amortised cost (OL).
Carrying
amount F&R/(OL) FVTPL
RM RM RM
31 August 2013
Financial assets
Islamic debt securities 4,011,800 - 4,011,800
Short term investments 10,047,603 10,047,603 -
Other receivables 57,932 57,932 -
Cash and cash equivalents 1,481,682 1,481,682 -
_____________________________________
15,599,017 11,587,217 4,011,800
Financial liabilities
Amount due to Manager (146,486) (146,486) -
Other payables (23,456) (23,456) -
_____________________________________
15,429,075 11,417,275 4,011,800
===================================

63
17. Financial instruments (continued)
17.1 Categories of financial instruments (continued)
Carrying
amount F&R/(OL) FVTPL
RM RM RM
31 August 2012
Financial assets
Islamic debt securities 10,200,000 - 10,200,000
Other receivables 20,230 20,230 -
Cash and cash equivalents 4,348,682 4,348,682 -
_____________________________________
14,568,912 4,368,912 10,200,000
Financial liabilities
Other payables (30,344) (30,344) -
_____________________________________
14,538,568 4,338,568 10,200,000
===================================
1 September 2011
Financial assets
Islamic debt securities 12,125,100 - 12,125,100
Other receivables 189,395 189,395 -
Cash and cash equivalents 2,685,145 2,685,145 -
_____________________________________
14,999,640 2,874,540 12,125,100
Financial liabilities
Other payables (29,799) (29,799) -
_____________________________________
14,969,841 2,844,741 12,125,100
===================================
17.2 Net gains and losses arising from financial instruments
2013 2012
Net gains on: RM RM
Fair value through profit or loss:
- Designated upon initial recognition 68,897 538,377
- Financing and receivables 381,689 90,158
_______ _______
450,586 628,535
====== =======
17.3 Financial risk management
The Fund has exposure to the following risks from its use of financial instruments:
Credit risk
Liquidity risk
Market risk
Investment risk
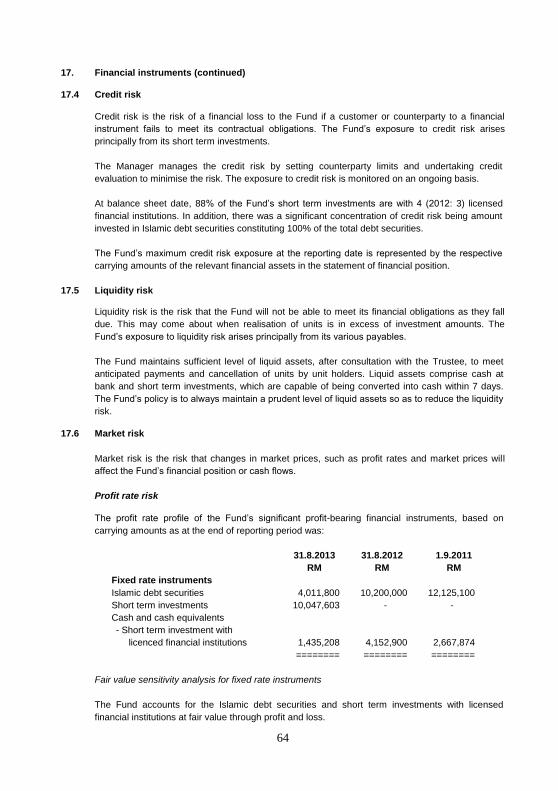
64
17. Financial instruments (continued)
17.4 Credit risk
Credit risk is the risk of a financial loss to the Fund if a customer or counterparty to a financial
instrument fails to meet its contractual obligations. The Fund’s exposure to credit risk arises
principally from its short term investments.
The Manager manages the credit risk by setting counterparty limits and undertaking credit
evaluation to minimise the risk. The exposure to credit risk is monitored on an ongoing basis.
At balance sheet date, 88% of the Fund’s short term investments are with 4 (2012: 3) licensed
financial institutions. In addition, there was a significant concentration of credit risk being amount
invested in Islamic debt securities constituting 100% of the total debt securities.
The Fund’s maximum credit risk exposure at the reporting date is represented by the respective
carrying amounts of the relevant financial assets in the statement of financial position.
17.5 Liquidity risk
Liquidity risk is the risk that the Fund will not be able to meet its financial obligations as they fall
due. This may come about when realisation of units is in excess of investment amounts. The
Fund’s exposure to liquidity risk arises principally from its various payables.
The Fund maintains sufficient level of liquid assets, after consultation with the Trustee, to meet
anticipated payments and cancellation of units by unit holders. Liquid assets comprise cash at
bank and short term investments, which are capable of being converted into cash within 7 days.
The Fund’s policy is to always maintain a prudent level of liquid assets so as to reduce the liquidity
risk.
17.6 Market risk
Market risk is the risk that changes in market prices, such as profit rates and market prices will
affect the Fund’s financial position or cash flows.
Profit rate risk
The profit rate profile of the Fund’s significant profit-bearing financial instruments, based on
carrying amounts as at the end of reporting period was:
31.8.2013 31.8.2012 1.9.2011
RM RM RM
Fixed rate instruments
Islamic debt securities 4,011,800 10,200,000 12,125,100
Short term investments 10,047,603 - -
Cash and cash equivalents
- Short term investment with
licenced financial institutions 1,435,208 4,152,900 2,667,874
======== ======== ========
Fair value sensitivity analysis for fixed rate instruments
The Fund accounts for the Islamic debt securities and short term investments with licensed
financial institutions at fair value through profit and loss.
65
17. Financial instruments (continued)
17.6 Market risk (continued)
An increase of 100 basis points (bp) in interest rates at the end of the reporting period would have
decreased equity and profit and loss by RM41,938 (2012: RM425,268). A decrease of 100 basis
point (bp) in interest rates would have equal but opposite effect on the equity and profit and loss
respectively.
17.7 Investment risk
Investments are bound by regulatory guidelines that govern the maximum securities holdings and
maximum liquid assets holdings.
Fixed income risks are in the form of profit rate and credit risks. To manage these risks,
investments will be in investment grade Sukuk.
Risk management objectives, policies and processes for managing the risk
The Manager has written policies and guidelines on risk management, which set out the overall
investment risks strategies and general risk management philosophies. These processes monitor,
measure and control risks associated with the business. Matters relating to investment risks in
respect of funds portfolio are discussed during the Investment Committee meetings of the
Manager.
17.8 Fair value of financial instruments
The carrying amounts of cash at bank, short term investments, other receivables and payables
approximate fair values due to relatively short term nature of these financial instruments.
The fair value of Islamic debt securities, together with the carrying amounts shown in the
statement of financial position, is disclosed in Note 4.
The following summarise the method used in determining the fair value of financial instruments:
Islamic debt securities
Islamic debt securities issued by Malaysian corporations and rated by the Rating Agency of
Malaysia Berhad or Malaysian Rating Corporation Berhad are carried at fair value. In arising at fair
value gain/loss, the acquisition cost is adjusted for the amortisation of any premium or accretion of
any discount over their par values at the time of acquisition. The premium or discount is amortised
or accreted on a yield to maturity basis over the remaining term of the investments from the date
of acquisition.
This adjusted cost (carrying value) is then revalued to reflect its fair value (indicative market value)
using the fair price quoted by an independent bond pricing agency (BPA) registered with the
Securities Commission. If such quotations are not available, it will be valued on a weekly basis or
as and when appropriate by reference to average indicative yield quoted by the three reputable
financial institutions in over-the-counter markets as the close of trading. These institutions include
investments banks and commercial banks. Surplus or deficit on revaluation is transferred to
statement of profit or loss and other comprehensive income.

66
18. Capital management
The Fund’s capital is represented by the unitholders’ fund in the statement of financial position.
The Manager of the Fund monitors the adequacy of capital on an ongoing basis. There is no
external capital requirement imposed on the Fund.
19. Significant event
A unit holders’ meeting was held in July 2012, whereby the Fund has changed its investment
objective from primarily investing in Islamic Bonds and other Islamic money market instruments to
investing in Shariah-compliant short-term debentures, money market instruments and placement
in short-term deposits. This change shall be effective from 15 October 2012 as disclosed in the
Supplemental Master Prospectus dated 12 September 2012 registered with the Securities
Commission.
20. Explanation of transition to MFRSs
As stated in Note 2(a), these are the first financial statements of the Company prepared in
accordance with MFRSs.
The accounting policies set out in Note 3 have been applied in preparing the financial statements
of the Fund for the year ended 31 August 2013, the comparative information presented in these
financial statements for the year ended 31 August 2012 and in the preparation of the opening
MFRS statement of financial position at 1 September 2011 (the Fund’s date of transition to
MFRSs).
The transition to MFRSs does not have financial impact to the financial statements of the Fund.

67
6.2 BIMB Dana Al-Munsif
(Established in Malaysia)
STATEMENT OF FINANCIAL POSITION AS AT 31 AUGUST 2013
Note 31.8.2013 31.8.2012 1.9.2011
(RM) % (RM) % (RM) %
Investments
Quoted securities 4 28,069,277 59.0 31,777,571 54.1 26,878,162 53.5
Islamic debt securities 5 15,928,100 33.5 24,569,690 41.8 15,353,690 30.6
__________ _____ __________ _____ _________ _____
43,997,377 92.5 56,347,261 95.9 42,231,852 84.1
Other assets
Amount due from
stockbroker 1,358,947 2.8 - 0.0 - 0.0
Amount due from
Manager - - - - 19,767 0.0
Other receivables 218,183 0.5 378,846 0.7 285,439 0.6
Current tax assets 60,571 0.1 37,220 0.1 29,421 0.1
Cash at bank 6 6,461,607 13.6 6,597,902 11.2 10,262,679 20.4
__________ _____ __________ _____ _________ _____
Total assets 52,096,685 109.5 63,361,229 107.9 52,829,158 105.2
--------------- -------- -------------- ------- -------------- -------
Liabilities
Amount due to
stockbroker 970,893 2.0 130,896 0.2 - 0.0
Amount due to
Manager 1,811 - 1,683,480 2.9 72,714 0.1
Other payables 94,064 0.2 103,144 0.2 85,417 0.2
Distribution payable 3,483,118 7.3 2,714,691 4.6 2,458,226 4.9
__________ _____ __________ _____ _________ _____
Total liabilities 4,549,885 9.5 4,632,211 7.9 2,616,357 5.2
--------------- -------- -------------- ------- -------------- -------
Net assets value 47,546,800 100.0 58,729,018 100.0 50,212,801 100.0
========= ==== ======== ==== ======== ====
Unitholders’ fund
Unitholders’ capital 7 47,890,156 100.7 57,712,153 98.3 52,182,176 103.9
(Accumulated losses)/
Retained profits (343,356) (0.7) 1,016,865 1.7 (1,969,375) (3.9)
__________ _____ __________ _____ _________ _____
47,546,800 100.0 58,729,018 100.0 50,212,801 100.0
========= ==== ======== ==== ======== ====
Number of units in
circulation 7 92,883,138 110,803,698 98,329,037
========= ========= =========
Net Asset Value 47,546,800 58,729,018 50,212,801
========= ========= =========
Net asset value per
Unit – Ex distribution 51.2 sen 53.0 sen 51.1 sen
========= ========= =========
The notes are an integral part of these financial statements.

68
STATEMENT OF PROFIT OR LOSS AND OTHER COMPREHENSIVE INCOME
FOR THE YEAR ENDED 31 AUGUST 2013
Note 2013 (RM)
2012 (RM)
Income
Gain on sale of shares 3,190,641 1,099,850
Gross dividends from shares quoted in Malaysia
1,375,010 944,393
Income from Islamic debt securities 859,674 814,162
Income from short term investments 178,381 376,551
Gain on disposal of Islamic debt securities 289,830 225,098
Hibah from Al-Wadiah account 1,409 1,416
Net (loss)/ gain from financial instruments at fair value through profit or loss
(2,828,231)
3,337,832
3,066,714 6,799,302
Expenses
Manager’s fee 8 834,468 949,068
Trustee’s fee 9 44,505 50,617
Auditors’ remuneration 10,000 10,000
Administrative expenses 44,844 25,686
Tax agent’s fee 2,000 2,011
935,817 1,037,382
Net income before taxation 2,130,897 5,761,920
Tax expense 10 (8,000) (60,989)
Net income for the year 2,122,897 5,700,931
Net Income for the year consist of:
Realised amount 4,951,128 2,363,099
Unrealised amount (2,828,231) 3,337,832
2,122,897 5,700,931
Net income for the year 2,122,897 5,700,931
Other comprehensive income - -
The notes are integral part of these financial statements.

69
STATEMENT OF CHANGES IN NET ASSET VALUE FOR THE YEAR ENDED 31 AUGUST 2013
Note
Unitholders' capital
Distribution
(Accumulated losses)/
Retained profits
Total
(RM) (RM) (RM) (RM)
As at 1 September 2011
52,182,176 2,458,226 (1,969,375) 52,671,027
Movement in unitholders' contribution or distribution
Creation of units via cash
23,786,895 - - 23,786,895
Creation of unit via reinvestment of distribution
2,373,047
(2,458,226)
-
(85,179)
Cancellation of units
(20,629,965) - - (20,629,965)
Distributions 11 - 2,714,691 (2,714,691) -
Total contribution from unitholders
5,529,977
256,465
(2,714,691)
3,071,751
Net income for the year
- - 5,700,931 5,700,931
As at 31 August 2012
57,712,153 2,714,691 1,016,865 61,443,709
As at 1 September 2012
57,712,153 2,714,691 1,016,865 61,443,709
Movement in unitholders' contribution or distribution
Creation of units for cash
3,819,007 - - 3,834,228
Creation of units via reinvestment of distribution 2,669,250
(2,714,691)
-
(45,441)
Cancellation of units
(16,310,254) - - (16,310,254)
Distributions 11 - 3,483,118 (3,483,118) -
Total contribution from unitholders
(9,821,997)
768,427
(3,483,118)
(12,521,467)
Net income for the year
- - 2,122,897 2,107,676
As at 31 August 2013
47,890,156 3,483,118 (343,356) 51,029,918
The notes are an integral part of these financial statements.

70
STATEMENT OF CASH FLOWS FOR THE YEAR ENDED 31 AUGUST 2013
2013 (RM)
2012 (RM)
Cash flows from operating activities
Proceeds from sale of investments 57,375,420 24,660,986
Dividend received 1,395,158 728,670
Income from Islamic debt securities and short term investments
1,469,810 1,222,002
Tax paid (31,351) (26,100)
Audit fee paid (10,000) (7,624)
Payment for administrative expenses (39,244) (46,063)
Trustee fee paid (45,346) (49,961)
Management fee paid (850,248) (936,763)
Purchase of investments (45,182,076) (32,301,442)
Net cash generated from/ (used in) operating activities
14,082,123 (6,756,295)
Cash flows from financing activities
Creation of units 3,818,950 23,806,662
Cancellation of units (17,991,923) (20,629,965)
Payment of distributions (45,441) (85,179)
Net cash (used in)/ generated from financing activities
(14,218,414) 3,091,518
Net decrease in cash and cash equivalents (136,295) (3,664,777)
Cash and cash equivalents at 1 September 6,597,902 10,262,679
Cash and cash equivalents at 31 August 6,461,607 6,597,902
Cash and cash equivalents comprise:
Cash at bank 795,978 330,079
Short term investments 5,665,629 6,267,823
6,461,607 6,597,902
The notes are an integral part of these financial statements.

71
NOTES TO THE FINANCIAL STATEMENTS
1. Information on the Fund
BIMB Dana Al-Munsif (hereinafter referred to as “the Fund”) was constituted pursuant to the
execution of a Deed dated 6 December 2001 between the Manager - BIMB Investment
Management Berhad., the Trustee - ABB Trustee Berhad and the registered holders of the Fund.
The addresses of the registered office and principal place of business of the Fund are as follows:
Registered office
Level 32, Menara Bank Islam
No. 22, Jalan Perak
50450 Kuala Lumpur
Principal place of business
Level 19, Menara Bank Islam
No.22, Jalan Perak
50450 Kuala Lumpur
The principal activity of the Fund is to invest in Authorised Investments as defined in the Deed,
which include stocks and shares of companies quoted on Bursa Malaysia, short term deposits and
Islamic debt securities.
The Manager, BIMB Investment Management Berhad, a company incorporated in Malaysia, is a
subsidiary of Bank Islam Malaysia Berhad.
The financial statements were approved by the Board of Directors on 28 October 2013.
2. Basis of preparation
(a) Statement of compliance
The financial statements of the Fund have been prepared in accordance with Malaysian
Financial Reporting Standards (“MFRSs”) and International Financial Reporting Standards in
Malaysia. This is the Company’s first financial statements prepared in accordance with MFRSs
and MFRS 1, First-time Adoption of Malaysian Financial Reporting Standards has been
applied.
In the previous years, the financial statements of the Fund were prepared in accordance with
Financial Reporting Standards (“FRS”). The transition to MFRS has no financial impact to the
financial statements of the Fund.
The Fund has adopted the amendments to MFRS 101, Presentation of Financial Statements
which are effective for annual periods beginning on or after 1 September 2012. The adoption
of the amendments to MFRS 101 has no impact on the financial statements other than the
presentation format of the statement of financial position and the statement of profit or loss
and other comprehensive income.
The following are accounting standards, amendments and interpretations of the MFRS
framework that have been issued by the Malaysian Accounting Standards Board (“MASB”) but
have not been adopted by the Fund:
72
2. Basis of preparation (continued)
(a) Statement of compliance (continued)
MFRSs, Interpretations and amendments effective for annual periods beginning on or
after 1 January 2013
MFRS 10, Consolidated Financial Statements
MFRS 11, Joint Arrangements
MFRS 12, Disclosure of Interests in Other Entities
MFRS 13, Fair Value Measurement
MFRS 119, Employee Benefits (2011)
MFRS 127, Separate Financial Statements (2011)
MFRS 128, Investments in Associates and Joint Ventures (2011)
IC Interpretation 20, Stripping Costs in the Production Phase of a Surface Mine
Amendments to MFRS 7, Financial Instruments: Disclosures – Offsetting Financial Assets and Financial Liabilities
Amendments to MFRS 1, First-time Adoption of Malaysian Financial Reporting Standards – Government Loans
Amendments to MFRS 1, First-time Adoption of Malaysian Financial Reporting Standards (Annual Improvements 2009-2011 Cycle)
Amendments to MFRS 101, Presentation of Financial Statements (Annual Improvements 2009-2011 Cycle)
Amendments to MFRS 116, Property, Plant and Equipment (Annual Improvements 2009-2011 Cycle)
Amendments to MFRS 132, Financial Instruments: Presentation (Annual Improvements 2009-2011 Cycle)
Amendments to MFRS 134, Interim Financial Reporting (Annual Improvements 2009-2011 Cycle)
Amendments to MFRS 10, Consolidated Financial Statements: Transition Guidance
Amendments to MFRS 11, Joint Arrangements: Transition Guidance
Amendments to MFRS 12, Disclosure of Interests in Other Entities: Transition Guidance
MFRSs, Interpretations and amendments effective for annual periods beginning on or
after 1 January 2014
Amendments to MFRS 10, Consolidated Financial Statements: Investment Entities
Amendments to MFRS 12, Disclosure of Interests in Other Entities: Investment Entities
Amendments to MFRS 127, Separate Financial Statements (2011): Investment Entities
Amendments to MFRS 132, Financial Instruments: Presentation – Offsetting Financial Assets and Financial Liabilities
MFRSs, Interpretations and amendments effective for annual periods beginning on or
after 1 January 2015
MFRS 9, Financial Instruments (2009)
MFRS 9, Financial Instruments (2010)
Amendments to MFRS 7, Financial Instruments: Disclosures – Mandatory Effective Date of MFRS 9 and Transition Disclosures
73
2. Basis of preparation (continued)
(a) Statement of compliance (continued)
The Fund plans to apply the abovementioned standards, amendments and interpretations,
where applicable:
from the annual period beginning on 1 September 2013 for those standards, amendments or interpretations that are effective for annual periods beginning on or after 1 January 2013.
from the annual period beginning on 1 September 2014 for those standards, amendments or interpretations that are effective for annual periods beginning on or after 1 January 2014.
from the annual period beginning on 1 September 2015 for those standards, amendments or interpretations that are effective for annual periods beginning on or after 1 January 2015.
The initial application of the above standards, amendments and interpretations is not expected
to have any material financial impacts to the current and prior periods financial statements
upon their first adoption.
(b) Basis of measurement
The financial statements are prepared on the historical cost basis except as disclosed in note
3(a).
(c) Functional and presentation currency
These financial statements are presented in Ringgit Malaysia (RM), which is the Fund’s
functional currency.
(d) Use of estimates and judgements
The preparation of financial statements in conformity with MFRSs requires management to
make judgements, estimates and assumptions that affect the application of accounting
policies and the reported amounts of assets, liabilities, income and expenses. Actual results
may differ from these estimates.
Estimates and underlying assumptions are reviewed on an ongoing basis. Revisions to
accounting estimates are recognised in the period in which the estimate is revised and in any
future periods effected.
There are no significant areas of estimation uncertainty and critical judgements in applying
accounting policies that have significant effect on the amounts recognised in the financial
statements.

74
3. Significant accounting policies
The accounting policies set out below have been applied consistently to the periods presented in
these financial statements, and in preparing the opening MFRS statements of financial position of
the Fund at 1 September 2011 (the transition date to MFRS framework), unless otherwise stated.
(a) Financial instruments
(i) Initial recognition and measurement
A financial instrument is recognised in the statement of financial statements when, and only
when, the Fund becomes a party to the contractual provisions of the instrument.
A financial instrument is recognised initially, at its fair value plus, in the case of a financial
instrument not at fair value through profit or loss, transaction costs that are directly
attributable to the acquisition or issue of the financial instrument.
(ii) Financial instrument categories and subsequent measurement
The Fund categorises financial instruments as follows:
Financial assets
(a) Financial assets at fair value through profit or loss
Fair value through profit or loss category comprises financial assets that are held for
trading, or financial assets that are specifically designated into this category upon initial
recognition. These include quoted securities and Islamic debt securities.
Financial assets categorised as fair value through profit or loss are subsequently
measured at their fair values with the gain or loss recognised in the statement of profit
or loss and other comprehensive income.
(b) Financing and receivables
Financing and receivables category are debt instruments that are not quoted in an
active market and these comprises amount due from manager, other receivables, cash
at bank and short term investments. Financial assets categorised as financing and
receivables are subsequently measured at amortised cost using the effective interest
method.
All financial assets except for those measured at fair value through profit or loss, are
subject to review for impairment.
Financial liabilities
All financial liabilities are subsequently measured at amortised cost.
Financial liabilities measured at amortised cost comprises amount due to stockbroker,
amount due to Manager, other payables and distribution payable.

75
3. Significant accounting policies (continued)
(a) Financial instruments (continued)
(iii) Derecognition
A financial asset or part of it is derecognised when, and only when the contractual rights to
the cash flows from the financial asset expire or the financial asset is transferred to another
party without retaining control or substantially all risks and rewards of the asset. On
derecognition of a financial asset, the difference between the carrying amount and the sum
of the consideration received (including any new asset obtained less any new liability
assumed) and any cumulative gain or loss that had been recognised in equity is recognised
in profit or loss.
A financial liability or a part of it is derecognised when, and only when, the obligation
specified in the contract is discharged or cancelled or expires. On derecognition of a
financial liability, the difference between the carrying amount of the financial liability
extinguished or transferred to another party and the consideration paid, including any non-
cash assets transferred or liabilities assumed, is recognised in profit or loss.
(b) Revenue recognition
(i) Dividend income
Dividend from quoted investments is recognised when right to receive payment is
established.
(ii) Income from short term investments and islamic debt securities
Income from short term investments and Islamic debt securities are recognised in the
statement of profit or loss and other comprehensive income as it accrues, taking into
account the effective profit on the asset.
(c) Cash and cash equivalents
Cash and cash equivalents consist of cash at bank and short term investments with licensed
financial institutions which are readily convertible to cash with an insignificant risk of changes
in value.
Cash and cash equivalents are categorised and measured as loans and receivables in
accordance with policy Note 3(a)(ii)(b).
(d) Impairment
Financial assets
All financial assets (except for financial assets categorised as fair value through profit or loss)
are assessed at each reporting date whether there is any objective evidence of impairment as
a result of one or more events having an impact on the estimated future cash flows of the
asset. Losses expected as a result of future events, no matter how likely, are not recognised.
An impairment loss in respect of financing and receivables is recognised in profit or loss and
is measured as the difference between the asset’s carrying amount and the present value of
estimated future cash flows discounted at the asset’s original effective profit rate. The carrying
amount of the asset is reduced through the use of an allowance account.

76
3. Significant Accounting Policies (continued)
(e) Taxation
Tax expense comprises current and deferred tax. Tax expense is recognised in the income
statement except to the extent that it relates to items recognised directly in equity, in which
case it is recognised in equity.
Current tax is the expected tax payable on the taxable income for the year, using tax rates
enacted or substantively enacted at the balance sheet date, and any adjustment to tax payable
in respect of previous years.
(f) Unitholders’ capital
The Fund issues cancellable units, which are cancelled at the holder’s option and are classified
as equity. Cancellable units can be put back to the Fund at any time for cash equal to a
proportionate share of the Fund’s net asset value. The outstanding units is carried at the
redemption amount that is payable at the financial position date if the holder exercises the right
to put the unit back to the Fund.
Units are created and cancelled at the holder’s option at prices based on the Fund’s net assets
value per unit at the time of creation or cancellation. The Fund’s net assets value per unit is
calculated by dividing the net assets attributable to unitholders with the total number of
outstanding units. In accordance with the Securities Commission’s Guidelines on Unit Trust
Funds in Malaysia, investment positions are valued based on the last traded market price for
the purpose of determining the net assets value per unit for creations and cancellations.
The units in the Fund are puttable instruments, classified as equity, which entitle the
unitholders to a pro-rata share of the net asset of the Fund. The units are subordinated and
have identical features. There is no contractual obligation to deliver cash or another financial
asset other than the obligation on the Fund to repurchase the units. The total expected cash
flows from the units are based on the change in the net asset of the Fund.
(g) Distribution
Distributions are at the discretion of the Fund. A distribution to the Fund’s unitholders is
accounted for as a deduction from realised reserves. A proposed distribution is recognised as
a liability in the period in which it is declared.
(h) Net Asset Value
The Net Asset Value is calculated after deducting the retained earnings allocated for
distribution.

77
4. Quoted securities
As at 31 August 2013 Company’s Name
Number of shares held
Cost (RM)
Market Value (RM)
Percentage of value of Funds at 31.8.2013
(%)
(A) Main Market (continued)
i) Construction
Gamuda Bhd. 372,000 1,740,720 1,662,840 3.5
Malaysian Resources
Corporation Bhd. 796,000 1,668,392 1,146,240 2.41
WCT Bhd. 874,450 2,176,745 2,133,658 4.49
2,042,450 5,585,857 4,942,738 10.40
ii) Consumer products
QL Resources Bhd. 352,000 1,240,397 1,196,800 2.52
UMW Holdings Bhd. 13,000 161,864 163,540 0.34
365,000 1,402,261 1,360,340 2.86
iii) Finance
BIMB Holdings Bhd. 141,000 523,563 609,120 1.28
iv) Industrial products
Perisai Petroleum Teknologi Bhd. 217,000 309,305 295,120 0.62
v) Infrastructure
Digi.Com.Bhd. 447,500 2,183,377 2,103,250 4.42
YTL Power International Bhd. 629,000 1,459,008 1,006,400 2.12
1,076,500 3,642,385 3,109,650 6.54
vi) Plantation
IOI Corporation Bhd. 12,000 63,400 64,800 0.14
United Malacca Bhd. 17,700 133,063 127,440 0.27
29,700 196,463 192,240 0.41

78
4. Quoted securities (continued)
As at 31 August 2013 Company’s Name
Number of shares held
Cost (RM)
Market Value (RM)
Percentage of value of Funds at 31.8.2013
(%)
(A) Main Market (continued)
vii) Properties
IJM Land. Bhd. 451,000 1,327,789 1,091,420 2.30
LBS Bina Group Bhd. 780,000 1,382,647 1,310,400 2.76
Mah Sing Group Bhd. 46,000 98,297 103,500 0.22
SP Setia Bhd. 254,000 1,031,792 815,340 1.71
UEM Sunrise Bhd. 396,900 1,101,795 1,000,188 2.10
1,927,900 4,942,320 4,320,848 9.09
viii) Trading and services
Axiata Group Bhd. 182,000 1,004,500 1,226,680 2.58
Dialog Group Bhd. 367,000 982,590 946,860 1.99
Maxis Bhd. 273,000 1,649,437 1,867,320 3.93
Media Chinese International Ltd. 923,200 1,362,938 969,360 2.04
MMC Corporation Bhd. 224,500 640,886 561,250 1.18
Parkson Holdings Bhd. 194,000 1,067,947 649,900 1.37
PETRONAS Dagangan Bhd. 28,500 583,351 792,300 1.67
Pos Malaysia Bhd. 67,600 216,306 335,296 0.70
Sime Darby Bhd. 72,500 655,975 680,775 1.43
SapuraKencana Petroleum Bhd. 317,000 1,155,630 1,138,030 2.39
Tenaga Nasional Bhd. 247,000 2,040,182 2,156,310 4.53
Telekom Malaysia Bhd. 354,000 1,975,777 1,915,140 4.03
3,250,300 13,335,519 13,239,221 27.84
Total portfolio investment as at 31 August 2013
29,937,673 28,069,277 59.04

79
4. Quoted securities (continued)
As at 31 August 2012 Company’s Name
Number of shares held
Cost (RM)
Market Value (RM)
Percentage of value of Funds at 31.8.2012
(%)
(A) Main Market
i) Construction
Gamuda Bhd. 509,000 1,900,244 1,756,050 3.0
Hock Seng Lee Bhd. 210,120 375,924 338,293 0.6
IJM Corporation Bhd. 213,000 1,167,264 1,094,820 1.9
Malaysian Resources Corporation
656,000 1,436,016 1,108,640 1.9
WCT Bhd. 140,000 417,389 371,000 0.6
1,728,120 5,296,837 4,668,803 8.0
ii) Consumer products
Padiberas Nasional Bhd. 236,000 742,796 802,400 1.4
MSM Malaysia Holdings Bhd. 119,700 575,206 603,288 1.0
355,700 1,318,002 1,405,688 2.4
iii) Finance
BIMB Holdings Bhd. 138,000 390,096 441,600 0.8
138,000 390,096 441,600 0.8
iv) Industrial products
PETRONAS Chemical Group Bhd.
292,000 1,959,637 1,892,160 3.2
v) Infrastructure
YTL Power International Bhd. 629,000 1,459,008 1,094,460 1.9
vi) Plantation
Genting Plantations Bhd. 84,000 716,077 780,360 1.3
IOI Corporation Bhd. 365,000 1,930,194 1,876,100 3.2
449,000 2,646,271 2,656,460 4.5

80
4. Quoted securities (continued)
As at 31 August 2012 Company’s Name
Number of shares held
Cost (RM)
Market Value (RM)
Percentage of value of Funds at 31.8.2012
(%)
(A) Main Market (continued)
vii) Properties
IJM Land Bhd. 180,000 567,720 430,200 0.7
SP Setia Bhd. 254,000 1,031,792 904,240 1.5
UEM Land Holdings Bhd. 491,000 1,379,706 908,350 1.5
925,000 2,979,218 2,242,790 3.7
viii) Reits
Al-Aqar Healthcare Reit 510,100 569,835 714,140 1.2
Axis Reits 73,000 197,732 223,380 0.4
583,100 767,567 937,520 1.6
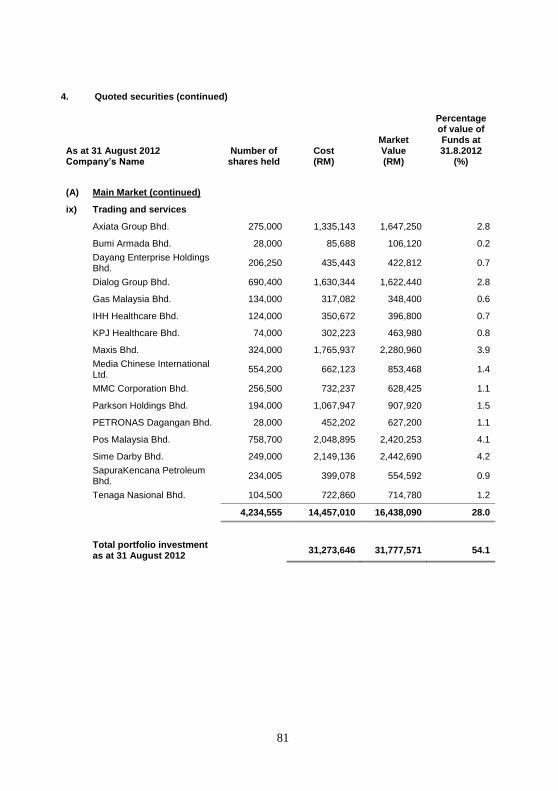
81
4. Quoted securities (continued)
As at 31 August 2012 Company’s Name
Number of shares held
Cost (RM)
Market Value (RM)
Percentage of value of Funds at 31.8.2012
(%)
(A) Main Market (continued)
ix) Trading and services
Axiata Group Bhd. 275,000 1,335,143 1,647,250 2.8
Bumi Armada Bhd. 28,000 85,688 106,120 0.2
Dayang Enterprise Holdings Bhd.
206,250 435,443 422,812 0.7
Dialog Group Bhd. 690,400 1,630,344 1,622,440 2.8
Gas Malaysia Bhd. 134,000 317,082 348,400 0.6
IHH Healthcare Bhd. 124,000 350,672 396,800 0.7
KPJ Healthcare Bhd. 74,000 302,223 463,980 0.8
Maxis Bhd. 324,000 1,765,937 2,280,960 3.9
Media Chinese International Ltd.
554,200 662,123 853,468 1.4
MMC Corporation Bhd. 256,500 732,237 628,425 1.1
Parkson Holdings Bhd. 194,000 1,067,947 907,920 1.5
PETRONAS Dagangan Bhd. 28,000 452,202 627,200 1.1
Pos Malaysia Bhd. 758,700 2,048,895 2,420,253 4.1
Sime Darby Bhd. 249,000 2,149,136 2,442,690 4.2
SapuraKencana Petroleum Bhd.
234,005 399,078 554,592 0.9
Tenaga Nasional Bhd. 104,500 722,860 714,780 1.2
4,234,555 14,457,010 16,438,090 28.0
Total portfolio investment as at 31 August 2012
31,273,646 31,777,571 54.1
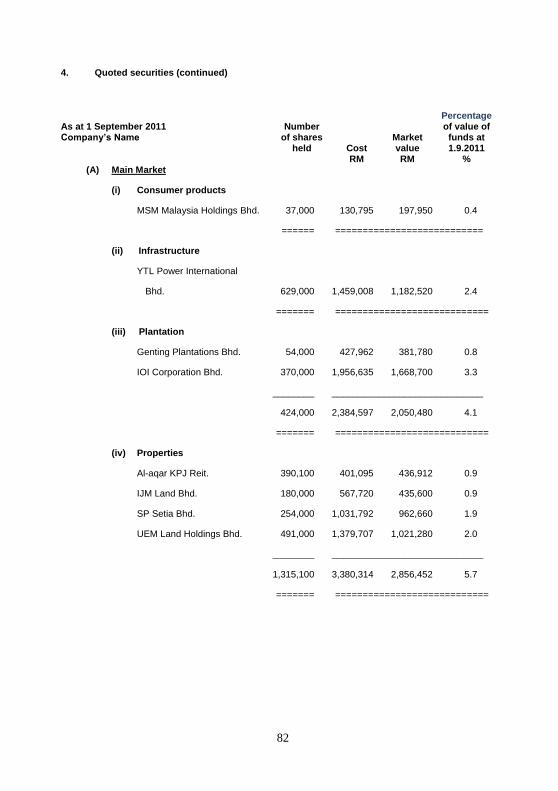
82
4. Quoted securities (continued)
Percentage As at 1 September 2011 Number of value of Company’s Name of shares Market funds at held Cost value 1.9.2011
RM RM % (A) Main Market
(i) Consumer products
MSM Malaysia Holdings Bhd. 37,000 130,795 197,950 0.4
====== ===========================
(ii) Infrastructure
YTL Power International
Bhd. 629,000 1,459,008 1,182,520 2.4
======= ============================
(iii) Plantation
Genting Plantations Bhd. 54,000 427,962 381,780 0.8
IOI Corporation Bhd. 370,000 1,956,635 1,668,700 3.3
________ _____________________________
424,000 2,384,597 2,050,480 4.1
======= ============================
(iv) Properties
Al-aqar KPJ Reit. 390,100 401,095 436,912 0.9
IJM Land Bhd. 180,000 567,720 435,600 0.9
SP Setia Bhd. 254,000 1,031,792 962,660 1.9
UEM Land Holdings Bhd. 491,000 1,379,707 1,021,280 2.0
________ _____________________________
1,315,100 3,380,314 2,856,452 5.7
======= ============================

83
4. Quoted securities (continued)
Percentage As at 1 September 2011 Number of value of Company’s Name of shares Market funds at held Cost value 1.9.2011
RM RM %
(v) Trading and services
Bumi Armada Bhd. 28,000 85,688 99,400 0.2
Dayang Enterprise
Holdings 206,250 435,443 371,250 0.7
Dialog Group Bhd. 367,000 983,004 880,800 1.8
Kencana Petroleum Bhd. 574,700 1,533,034 1,580,425 3.2
Maxis Bhd. 324,000 1,765,937 1,720,440 3.4
Malaysian Bulk Carriers
Bhd. 193,500 589,886 367,650 0.7
MMC Corporation Bhd. 268,000 765,066 675,360 1.4
Plus Expressways Bhd. 628,000 2,791,461 2,731,800 5.4
Sapuracrest Petroluem Bhd. 369,600 1,464,988 1,478,400 2.9
Sime Darby Bhd. 184,000 1,550,371 1,617,360 3.2
Tenaga Nasional Bhd. 104,500 722,860 548,625 1.1
Telekom Malaysia Bhd. 583,000 2,198,163 2,419,450 4.8
________ _____________________________
3,830,550 14,885,901 14,490,960 28.8
======= ============================

84
4. Quoted securities (continued)
Percentage As at 1 September 2011 Number of value of Company’s Name of shares Market funds at held Cost value 1.9.2011
RM RM %
(vi) Construction
Gamuda Bhd. 509,000 1,900,244 1,516,820 3.0
Hock Seng Lee Bhd. 206,000 375,924 306,940 0.6
IJM Corporation Bhd. 88,000 466,031 499,840 1.0
Malaysian Resources
Corporation Berhad 556,000 1,258,504 1,123,120 2.2
WCT Bhd. 140,000 417,389 359,800 0.7 ________ _____________________________ 1,499,000 4,418,092 3,806,520 7.5
======= =========================
(vii) Industrial products
KNM Group Bhd. 356,000 1,025,505 477,040 1.0 Petronas Chemical Group Bhd. 292,000 1,959,637 1,816,240 3.6 ________ ______________________________ 648,000 2,985,142 2,293,280 4.6
======= ============================= Total portfolio investment as at 1 September 2011 29,643,849 26,878,162 53.5
===========================

85
5. Islamic debt securities
As at 31 August 2013 Maturity
Date Rating*
Cost (RM)
Market Value (RM)
Percentage of Value of Funds at 31.8.2013
Teknologi Tenaga Perlis Consortium Bhd.
31.07.2017 AA1 114,540 114,590 0.2
SapuraKencana Petroleum Bhd.
28.08.2017 AA3 4,971,000 4,931,000 10.37
Tanjung Bin O&M Berhad 01.07.2021 AA-IS 3,049,800 3,003,600 6.32
Axis REIT Sukuk Bhd. 12.07.2024 AAA 5,060,000 4,971,000 10.45
16,084,400 15,928,100 33.50
As at 31 August 2012 Maturity
Date Rating*
Cost (RM)
Market Value (RM)
Percentage of Value of Funds at 31.8.2012
Encorp Systembilt Sdn. Bhd. 17.05.2013 AA2 1,998,000 2,004,000 3.4
Teknologi Tenaga Perlis Consortium Bhd.
11.09.2015 AA1 114,540 114,590 0.2
Sarawak Energy Bhd. 22.06.2018 AA1 3,017,760 3,104,400 5.3
Government Investment Issuance II
30.08.2018 - 999,680 1,024,500 1.7
Aman Sukuk Bhd. 12.04.2019 AAA 3,000,000 3,055,800 5.2
Axis Reit Sukuk Bhd. 07.12.2024 AAA 9,108,000 9,092,700 15.5
Manjung Island Energy Bhd. 25.11.2026 AAA 3,000,000 3,063,300 5.2
Projek Lebuhraya Usahasama Bhd.
12.01.2027 AAA 3,032,100 3,110,400 5.3
24,270,080 24,569,690 41.8

86
5. Islamic debt securities (continued)
As at 1 September 2011 Maturity
Date Rating*
Cost (RM)
Market Value (RM)
Percentage of Value of Funds at 31.8.2011
TTPC Sdn. Bhd. 11.09.201
5 AA1 114,540 117,890 0.2
Government Investment Issuance I
15.07.2013
- 1,993,200 2,007,800 4.0
Government Investment Issuance II
30.08.2018
- 9,96,800 10,126,000 20.2
Sarawak Energy Bhd. 22.06.201
8 AA1 3,017,760 3,102,000 6.2
15,122,300 15,353,690 30.6
* Ratings is either by Rating Agency Malaysia Berhad or Malaysian Rating Corporation Berhad whichever applicable.
6. Cash and cash equivalents
As at
31.8.2013
(RM)
As at
31.8.2012
(RM)
As at
31.8.2011
(RM)
Short term placements
in licensed financial
institutions
Special Investment Account*
5,665,629
-
7,063,629
Waheed I Deposits* - 6,267,823 -
Wakalah Deposits - - 2,885,517
5,665,629 6,267,823 9,949,146
Cash at bank* 795,978 330,079 313,533
6,461,607 6,597,902 10,262,679
*Special Investment Account, Waheed I Deposits and cash at bank are placed with related party,
Bank Islam Malaysia Berhad.

87
7. Unitholders’ capital
As at As at As at
31.8.2013 31.8.2012 1.9.2011
No. of units (RM) No. of units (RM) No. of units (RM)
At 1 September
2012/2011 110,803,698 57,712,153 98,329,037 52,182,176 60,063,446 31,111,429
Creation of units 12,183,695 6,488,257 50,453,460 26,159,942 44,970,184 24,767,710
Cancellation of
units (30,104,255)(16,310,254)(37,978,799) (20,629,965) (6,704,593) (3,696,963)
__________ _________ _________ _________ _________ _________
At 31 August 92,883,138 47,890,156 110,803,698 57,712,153 98,329,037 52,182,176
========= ======== ========= ========= ========= =========
In accordance with the Deed, the maximum number of units that can be issued out for circulation
is 400,000,000 (31 August 2012: 400,000,000, 1 September 2011: 400,000,000) units. As at 31
August 2013, the number of units yet to be issued was 307,116,862 units (31 August 2012:
289,196,302 units, 1 September 2011: 301,670,963).
Based on historic information over the last 12 months, redemption levels are expected to
approximate RM16,310,000 (31 August 2012: RM20,630,000, 1 September 2011: RM3,600,000)
and the average monthly level of creation net of redemption are expected to approximate
RM818,000 (31 August 2012: RM460,000, 1 September 2011: RM1,700,000). However, the actual
level of redemptions may differ significantly from the historic experience.
8. Manager’s fee
The manager’s fee payable to the Manager of the Fund is based on 1.50% (2012: 1.50%) per annum of the net asset value of the Fund calculated on a daily basis.
9. Trustee’s fee
The trustee’s fee is payable to the trustee of the Fund based on 0.08% (2012: 0.08%) per annum
subject to a minimum of RM18,000 per annum of the net asset value of the Fund calculated on a
daily basis.
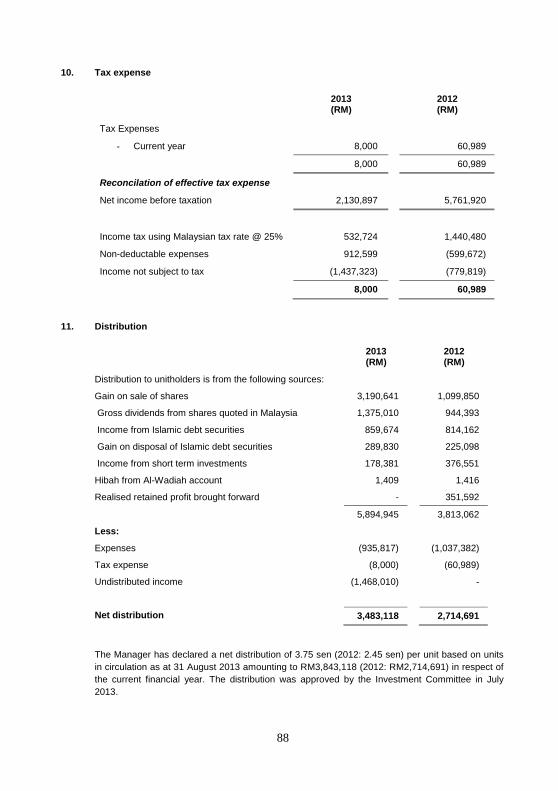
88
10. Tax expense
2013 (RM)
2012 (RM)
Tax Expenses
- Current year 8,000 60,989
8,000 60,989
Reconcilation of effective tax expense
Net income before taxation 2,130,897 5,761,920
Income tax using Malaysian tax rate @ 25% 532,724 1,440,480
Non-deductable expenses 912,599 (599,672)
Income not subject to tax (1,437,323) (779,819)
8,000 60,989
11. Distribution
2013
(RM)
2012 (RM)
Distribution to unitholders is from the following sources:
Gain on sale of shares 3,190,641 1,099,850
Gross dividends from shares quoted in Malaysia 1,375,010 944,393
Income from Islamic debt securities 859,674 814,162
Gain on disposal of Islamic debt securities 289,830 225,098
Income from short term investments 178,381 376,551
Hibah from Al-Wadiah account 1,409 1,416
Realised retained profit brought forward - 351,592
5,894,945 3,813,062
Less:
Expenses (935,817) (1,037,382)
Tax expense (8,000) (60,989)
Undistributed income (1,468,010) -
Net distribution 3,483,118 2,714,691
The Manager has declared a net distribution of 3.75 sen (2012: 2.45 sen) per unit based on units
in circulation as at 31 August 2013 amounting to RM3,843,118 (2012: RM2,714,691) in respect of
the current financial year. The distribution was approved by the Investment Committee in July
2013.

89
12. Units held by related parties
The number of units held by Management Company and other related party are as follows:
As at 31.8.2013
As at 31.8.2012
Unit (RM) Unit (RM)
Bank Islam Malaysia Bhd
500,00 255,950 500,000 267,650
The Manager does not hold any unit in the Fund (2012: Nil). All units are held legally and beneficially by the company.
13. Transactions with related parties
Other than as disclosed in Note 6 of the financial statements, other transaction with related parties
are as follow:
Transactions Balance
as at as at
31 August 31 August
2013 2012 2013 2012
(RM) (RM) (RM) (RM)
The Manager
BIMB Investment Management
Berhad
- Management fee 834,468 949,068 (63,818) (79,598)
- Amount due to manager - - (1,753) (1,683,480)
====== ======= ====== =======
Holding company of the Manager
Bank Islam Malaysia Berhad
- Income from short term
placement 170,411 116,398 5,665,629 6,267,823
====== ======= ======= ========
Related company of the Manager
BIMB Securities Sdn. Bhd.
- Brokerage fee 36,254 7,079 - -
====== ======= ====== =======
The Trustee
ABB Trustee Berhad
- Trustee fee 44,505 50,617 (3,404) (4,245)
====== ======= ====== =======

90
14. Transaction with related and other stockbroking companies
1 September 2012 to 31 August 2013
Value of trade (RM)
% of total trade
Brokerage fee
(RM)
% of total brokerage fee
Maybank Investment Bank Bhd
16,993,174 14.46 51,362 22.34
Bank Islam Malaysia Bhd.* 11,301,673 9.62 - -
CIMB Investment Bank Bhd. 10,564,198 8.99 39,890 17.35
Hong Leong Bank Bhd. 10,198,268 8.67 - -
CIMB Bank Bhd. 10,170,441 8.65 - -
BIMB Securities Sdn. Bhd.* 9,706,951 8.26 36,254 15.77
RHB Investment Bank Bhd. 9,511,461 8.09 32,992 14.35
AmBank (M) Bhd. 9,175,746 7.80 - -
MIDF Investment Bank Bhd. 8,858,328 7.54 32,277 14.04
OSK Investment Bank Bhd. 8,686,100 7.39 12,989 5.65
Other brokers 12,386,023 10.54 24,154 10.50
117,551,363 100.00 229,918 100.00
*Transactions with the related party have been entered into in the normal course of business and have
been transacted at arm’s length basis.

91
14. Transaction with related and other stockbroking companies (continued)
1 September 2011 to 31 August 2012
Value of trade (RM)
% of total trade
Brokerage fee
(RM)
% of total brokerage fee
MIDF Amanah Investment Bank Bhd.
4,074,059 7.34 10,185 13.22
AmBank (M) Bhd 5,056,450 9.10 - -
AmInvestment Bank Bhd 3,884,524 7.00 10,682 13.87
CIMB Bank Bhd. 11,118,205 20.01 - -
Bank Islam Malaysia Bhd * 6,000,000 10.80 - -
Hong Leong Bank Bhd 6,248,802 11.25 - -
CIMB Investment Bank Bhd. 3,651,322 6.57 12,558 16.31
Maybank Investment Bank Bhd
3,587,156 6.46 22,177 28.79
AmIslamic Bank Bhd. 3,065,363 5.52 - -
OSK Investment Bank Bhd. 3,072,355 5.53 7,681 9.98
Other brokers 5,787,969 10.42 13,736 17.83
55,546,205 100.00 77,019 100.00
*Transactions with the related party have been entered into in the normal course of business and have
been transacted at arm’s length basis.
15. Management Expense Ratio (“MER”)
The Management Expense Ratio for the financial year is 1.68% (2012: 1.64%). Management
expense ratio is the ratio of total fees and recovered expenses of the Fund expressed as a
percentage of the Fund’s average net asset value. It is a total management expenses expressed
as an annual percentage of the Fund’s average net asset value.
16. Portfolio Turnover Ratio (“PTR”)
The Portfolio Turnover Ratio for the financial year is 1.06 times (2012: 0.45 times). It represents
the average of total acquisitions and disposals of the investments in the Fund for the financial year
over the average net asset value of the Fund calculated on a daily basis.

92
17. Financial Instruments
17.1 Categories of financial instruments
The table below provides an analysis of financial instruments categorised as follows:
(a) Financing and receivables (F&R);
(b) Fair value through profit or loss (FVTPL);
(c) Other financial liabilities measured at amortised cost (OL).
Carrying
amount F&R/(OL) FVTPL
As at 31 August 2013 (RM) (RM) (RM)
Financial assets
Quoted securities 28,069,277 - 28,069,277
Islamic debt securities 15,928,100 - 15,928,100
Receivables 1,577,130 1,577,130 -
Cash and cash equivalents 6,461,607 6,461,607 -
___________________________________
52,036,114 8,038,737 43,997,377
===================================
Financial liabilities
Payables (1,066,767) (1,066,767) -
Distribution payable (3,483,118) (3,483,118) -
___________________________________
(4,549,885) (4,549,885) -
==================================
As at 31 August 2012
Financial assets
Quoted securities 31,777,571 - 31,777,571
Islamic debt securities 24,569,690 - 24,569,690
Receivables 378,846 378,846 -
Cash and cash equivalents 6,597,902 6,597,902 -
____________________________________
63,324,009 6,976,748 56,347,261
===================================
Financial liabilities
Payables (1,917,520) (1,917,520) -
Distribution payable (2,714,691) (2,714,691) -
_____________________________________
(4,632,211) (4,632,211) -
====================================

93
17. Financial Instruments (continued)
17.1 Categories of financial instruments (continued) Carrying amount F&R/(OL) FVTPL
(RM) (RM) (RM)
As at 1 September 2011
Financial assets
Quoted securities 26,878,162 - 26,878,162
Islamic debt securities 15,353,690 - 15,353,690
Receivables 305,206 305,206 -
Cash and cash equivalents 10,262,679 10,262,679 -
__________________________________
52,799,737 10,567,885 42,231,852
=================================
Financial liabilities
Payables (158,131) (158,131) -
Distribution payable (2,458,226) (2,458,226) -
__________________________________
(2,616,357) (2,616,357) -
=================================
17.2 Net gains and losses arising from financial instruments
2013 (RM)
2012 (RM)
Net gains on:
Fair value through profit or loss:
- Designated upon initial recognition 2,886,924 6,421,335
Financing and receivables 179,790 377,967
3,066,714 6,799,302
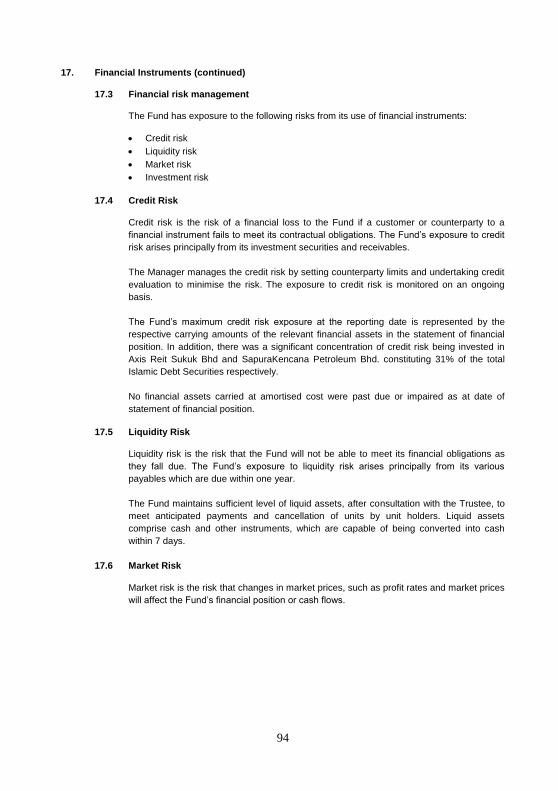
94
17. Financial Instruments (continued)
17.3 Financial risk management
The Fund has exposure to the following risks from its use of financial instruments:
Credit risk
Liquidity risk
Market risk
Investment risk
17.4 Credit Risk
Credit risk is the risk of a financial loss to the Fund if a customer or counterparty to a
financial instrument fails to meet its contractual obligations. The Fund’s exposure to credit
risk arises principally from its investment securities and receivables.
The Manager manages the credit risk by setting counterparty limits and undertaking credit
evaluation to minimise the risk. The exposure to credit risk is monitored on an ongoing
basis.
The Fund’s maximum credit risk exposure at the reporting date is represented by the
respective carrying amounts of the relevant financial assets in the statement of financial
position. In addition, there was a significant concentration of credit risk being invested in
Axis Reit Sukuk Bhd and SapuraKencana Petroleum Bhd. constituting 31% of the total
Islamic Debt Securities respectively.
No financial assets carried at amortised cost were past due or impaired as at date of
statement of financial position.
17.5 Liquidity Risk
Liquidity risk is the risk that the Fund will not be able to meet its financial obligations as
they fall due. The Fund’s exposure to liquidity risk arises principally from its various
payables which are due within one year.
The Fund maintains sufficient level of liquid assets, after consultation with the Trustee, to
meet anticipated payments and cancellation of units by unit holders. Liquid assets
comprise cash and other instruments, which are capable of being converted into cash
within 7 days.
17.6 Market Risk
Market risk is the risk that changes in market prices, such as profit rates and market prices
will affect the Fund’s financial position or cash flows.

95
17. Financial Instruments (continued)
17.6 Market Risk (continued)
Profit rate risk
The profit rate profile of the Fund’s significant profit-bearing financial instruments, based
on carrying amounts as at the end of reporting period was:
Fixed rate instruments
As at 31.8.2013
(RM)
As at 31.8.2012
(RM)
As at 1.9.2011
(RM)
Islamic debt securities 15,928,100
24,569,690
15,353,690
Short term investments
5,665,629
6,267,823
9,949,146
Fair value sensitivity analysis for fixed rate instruments
The Fund accounts for the Islamic debt securities at fair value through profit and loss.
An increase of 100 basis points (bp) in interest rates at the end of the reporting period
would have decreased on the unitholders’ fund and statement of profit or loss and other
comprehensive income by RM723,996 (2012: RM1,778,556). A decrease of 100 basis
point (bp) in interest rates would have equal but opposite effect on the equity and
statement on comprehensive income respectively.
The Fund is also accounts for the fixed rate short term investment are not significantly
exposed to profit rate risk.
Market price risk
Equity price risk arises from the Fund’s investments in equity securities.
Risk management objectives, policies and processes for managing the risk
The Fund is restricted to invest in securities issued by any issuer of not more than a
certain percentage of its net asset value. Under such restriction, the exposure risk to the
securities of any issuer is mitigated.
Equity price risk sensitivity analysis
This analysis assumes that all other variables remain constant and the Fund’s equity
investments are positively correlated to each other.
A 5% strengthening in the equity prices at the end of the reporting period would have
increased the net asset value and unitholders’ fund by RM1,584,996 (2012:
RM1,588,879). A 5% weakening in equity prices would have had equal but opposite effect
on the net asset value and unitholders’ fund respectively.

96
17. Financial Instruments (continued)
17.7 Investment risk
Investments are bound by regulatory guidelines that govern the maximum securities
holdings and maximum liquid assets holdings.
Equity investment risks consist primarily of market risk, specific stock risk and liquidity risk.
The mechanism employed to control investment risk for equity funds is by placing
acceptable stock and sector limits.
Fixed income risks are in the form of profit rate and credit risks. To manage these risks,
investments will be in investment grade Sukuk.
Risk management objectives, policies and processes for managing the risk
The Manager has written policies and guidelines on risk management, which set out the
overall investment risks strategies and general risk management philosophies. These
processes monitor, measure and control risks associated with the business. Matters
relating to investment risks in respect of Funds portfolio are discussed during the
Investment Committee meetings of the Manager.
17.8 Fair value of financial instruments
The carrying amounts of cash and cash equivalents, short term receivables and payables
approximate fair values due to the relatively short term nature of these financial
instruments.
The fair value of quoted securities and Islamic debt securities, together with the carrying
amounts shown in the statement of financial position are already disclosed in Note 4 and
Note 5 respectively.
The following summarises the method used in determining the fair value of financial
instruments:
Quoted equities
Quoted equities in Malaysia are valued at a bid price quoted on the Bursa Malaysia at the
date of the statement of financial position, in accordance with the Deed. Unrealised gain or
loss is taken to statement of profit or loss and other comprehensive income.
Islamic debt securities
Islamic debt securities issued by Malaysian corporations and rated by the Rating Agency
Malaysia Berhad and Malaysian Rating Corporation Berhad are carried at fair value. In
arriving at fair value gain/loss, the acquisition cost is adjusted for the amortisation of any
premium or accretion of any discount over their par values at the time of acquisition. The
premium or discount is amortised or accreted on a yield to maturity basis over the
remaining term of the investments from the date of acquisition.

97
17. Financial Instruments (continued)
17.8 Fair value of financial instruments (continued)
Islamic debt securities
This adjusted cost (carrying value) is then revalued to reflect its fair value (indicative
market value) using the fair price quoted by an independent bond pricing agency (BPA)
registered with the Securities Commission. If such quotations are not available, it will be
valued on a weekly basis or as and when appropriate by reference to average indicative
yield quoted by the three reputable financial institutions in over-the-counter markets as the
close of trading. These institutions include investments banks and commercial banks.
Surplus or deficit on revaluation is transferred to statement of profit of loss and other
comprehensive income.
17.8.1 Fair value hierarchy
The table below analyses financial instruments carried at fair value, by valuation
method. The different levels have been defined as follows:
Level 1: Quoted prices (unadjusted) in active markets for identical assets and
liabilities.
Level 2: Inputs other than quoted prices included within Level 1 that are
observable for the asset or liability, either directly (i.e. as prices) or indirectly
(i.e. derived from prices).
Carrying
amount Level 1 Level 2
As at 31 August 2013 (RM) (RM) (RM)
Financial assets at fair value
through profit or loss
- Quoted securities 28,069,277 28,069,277 -
- Islamic debt securities 15,928,100 - 15,928,100
____________________________________
43,997,377 28,069,277 15,928,100
==================================
As at 31 August 2012
Financial assets at fair value
through profit or loss
- Quoted securities 31,777,571 31,777,571 -
- Islamic debt securities 24,569,690 - 24,569,690
____________________________________
56,347,261 31,777,571 24,569,690
==================================
As at 1 September 2011
Financial assets at fair value
through profit or loss
- Quoted securities 26,878,162 26,878,162 -
- Islamic debt securities 15,353,690 - 15,353,690
____________________________________
42,231,852 26,878,162 15,353,690
==================================
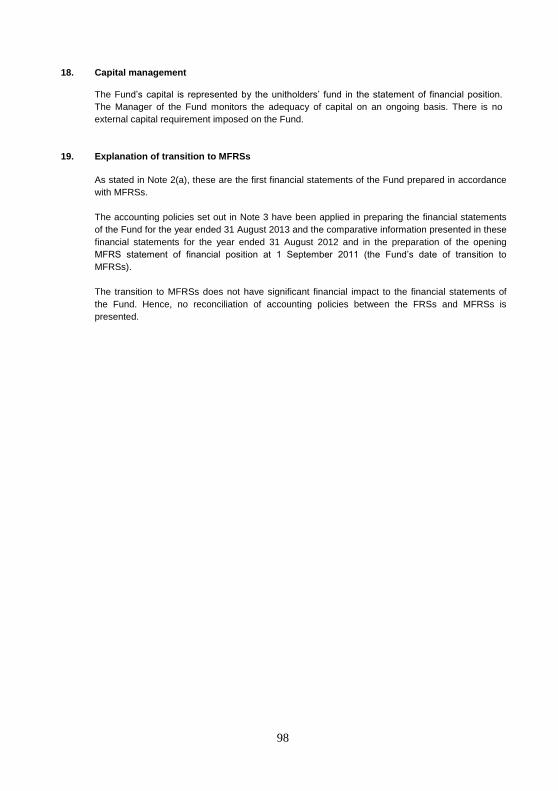
98
18. Capital management
The Fund’s capital is represented by the unitholders’ fund in the statement of financial position.
The Manager of the Fund monitors the adequacy of capital on an ongoing basis. There is no
external capital requirement imposed on the Fund.
19. Explanation of transition to MFRSs
As stated in Note 2(a), these are the first financial statements of the Fund prepared in accordance
with MFRSs.
The accounting policies set out in Note 3 have been applied in preparing the financial statements
of the Fund for the year ended 31 August 2013 and the comparative information presented in these
financial statements for the year ended 31 August 2012 and in the preparation of the opening
MFRS statement of financial position at 1 September 2011 (the Fund’s date of transition to
MFRSs).
The transition to MFRSs does not have significant financial impact to the financial statements of
the Fund. Hence, no reconciliation of accounting policies between the FRSs and MFRSs is
presented.

99
6.3 BIMB Dana Al-Falah
(Established in Malaysia)
STATEMENT OF FINANCIAL POSITION AS AT 31 AUGUST 2013
Note 31.8.2013 31.8.2012 1.9.2011 (RM) % (RM) % (RM) % Investments Quoted securities 4 18,082,988 77.2 13,496,920 57.3 10,541,435 45.6 Islamic debt securities 5 4,017,400 17.1 7,177,000 30.5 4,071,800 17.6 _________ _____ _________ _____ _________ _____ 22,100,388 94.3 20,673,920 87.8 14,613,235 63.2 Other assets Amount due from stockbroker 105,095 0.5 - - 16,802 0.1 Amount due from Manager 196,781 0.7 - - 16,802 0.1 Other receivables 93,863 0.4 134,683 0.6 90,991 0.4 Current tax assets 26,597 0.1 13,646 0.1 7,766 0.0 Cash and cash equivalents 6 2,999,713 12.8 3,681,262 15.6 9,275,858 40.1 _________ _____ _________ _____ _________ _____ Total assets 25,522,437 108.8 24,503,511 104.1 24,004,652 103.8 ------------- -------- -------------- -------- -------------- -------- Liabilities Amount due to stockbroker 262,017 1.1 - - - - Amount due to Manager - - 96,607 0.5 - - Other payables 66,083 0.1 54,515 0.1 44,387 0.2 _________ _____ _________ _____ _________ _____ Total liabilities 328,100 1.2 151,122 0.6 44,387 0.2 ------------- -------- -------------- -------- -------------- -------- 25,194,337 107.6 24,352,389 103.5 23,960,265 103.6 ======== ==== ======== ==== ======== ==== Unitholders’ Funds Unitholders’ capital 7 24,283,066 103.7 22,912,669 97.3 23,914,752 103.5 Distribution equalisation 117,747 0.5 117,747 0.5 148,825 0.6 (Accumulated losses)/ Retained profits (979,359) (4.2) 506,113 2.2 (948,637) (4.1) _________ _____ _________ _____ _________ _____ 23,421,454 100.0 23,536,529 100.0 23,114,940 100.0 Distribution payable 1,772,883 7.6 815,860 3.5 845,325 3.6 _________ _____ _________ _____ _________ _____ 25,194,337 115.2 24,352,389 103.5 23,960,265 103.6 ======== ==== ======== ==== ======== ==== Number of units in circulation 7 43,241,059 40,793,027 42,266,252 ======== ======== ======== Net Asset Value 23,421,454 23,536,529 23,114,940 ======== ======== ======== Net asset value per Unit – Ex distribution 54.2 sen 57.7 sen 54.7 sen ======== ======== ========
The notes are an integral part of these financial statements.

100
STATEMENT OF PROFIT OR LOSS AND OTHER COMPREHENSIVE INCOME FOR THE YEAR
ENDED 31 AUGUST 2013
Not
e
2013
(RM)
2012
(RM)
Income
Gain on sale of shares 1,815,709 304,020
Gross dividends from shares quoted in Malaysia 596,651 368,105
Income from Islamic debt securities 227,811 257,898
Income from short term investments 147,560 170,492
Gain on sale of Islamic debt securities 112,980 63,105
Hibah from Al-Wadiah account 860 582
Net (loss)/ gain from financial instruments at fair value
through profit or loss
(2,154,988) 1,518,907
746,583 2,683,109
Expenses
Manager’s fee 8 383,966 370,130
Trustee’s fee 9 20,478 19,740
Auditors’ remuneration 10,000 10,000
Administration 35,928 19,407
Tax agent’s fee 2,000 2,000
452,372 421,277
Net income before taxation 294,211 2,261,832
Taxation 10 (6,800) (22,300)
Net income for the year 287,411 2,239,532
Net income for the year consist of:
Realised amount 2,442,399 720,625
Unrealised amount (2,154,988) 1,518,907
287,411 2,239,532
Net income for the year 287,411 2,239,532
Other comprehensive income - -
The notes are integral part of these financial statements.

101
STATEMENT OF CHANGES IN NET ASSET VALUE FOR THE YEAR ENDED 31 AUGUST 2013
Note
Unitholders' capital
Distribution Reserve
Distribution Equalisation
Retained profits/
(Accumulated losses)
Total
(RM) (RM) (RM) (RM) (RM)
As at 1 September 2011
23,914,752 845,325 148,825 (948,637) 23,960,265
Movement in unitholders' contribution
or distribution
Creation of units via cash
6,737,172 - - - 6,737,172 Creation of units via
reinvestment
of distribution
845,325 (845,325) - 31,078 - Cancellation of units
(8,584,580) - - - (8,584,580) Distribution
11 - 815,860 (31,078) (815,860) -
Total (distribution to)/ contribution (1,002,083) (29,465)
(31,078) (784,782) (1,847,408)
from unitholders
Net income for the year
- - - 2,239,532 2,239,532 As at 31 August 2012
22,912,669 815,860 117,747 506,113 24,352,389
As at 1 September 2012
22,912,669 815,860 117,747 506,113 24,352,389
Movement in unitholders' contribution
or distribution
Creation of units via cash
8,723,065 - - 2,181 8,752,247 Creation of unit via reinvestment
of distribution
815,860 (815,860) - - - Cancellation of units
(8,168,528) - - - (8,168,528) Distribution
11 - 1,772,883 - (1,772,883) -
Total (distribution to)/
contribution from unitholders
1,370,397 957,023 - (1,770,701) 556,719
Net income for the year
- - - 285,229 285,229
As at 31 August 2013
24,283,066 1,772,883 117,747 (979,359) 25,194,337
The notes are an integral part of these financial statements.

102
STATEMENT OF CASH FLOWS FOR THE YEAR ENDED 31 AUGUST 2013
2013 (RM)
2012 (RM)
Cash flows from operating activities
Proceeds from sales of investments 22,037,761 9,123,176
Purchase of investments (23,599,152) (13,297,829)
Dividend received 600,664 296,233
Income from Islamic debts securities and
short term investments
183,046 428,972
Management fee paid (372,430) (367,858)
Trustee fee paid (20,478) (19,619)
Audit fee paid (10,000) (3,643)
Payment for other fee and expenses (55,497) (20,029)
Net cash used in operating activities (1,236,086) (3,860,597)
Cash flows from financing activities
Creation of units 8,723,065 6,753,974
Cancellation of units (8,168,528) (8,487,973)
Net cash generated from/ (used in)
financing activities
554,537
(1,733,999)
Net decrease in cash and cash equivalents (681,549) (5,594,596)
Cash and cash equivalents at 1 September
2012/2011
3,681,262 9,275,858
Cash and cash equivalents at 31 August 2,999,713
3,681,262
Cash and cash equivalents comprise:
Cash at bank
303,695
74,753
Short term investments 2,696,018 3,606,509
2,999,713 3,681,262
The notes are an integral part of these financial statements.

103
NOTES TO THE FINANCIAL STATEMENTS
1. Information on the Fund
BIMB Dana Al-Falah (hereinafter referred to as “the Fund”) was constituted pursuant to the
execution of a Deed dated 6 December 2001 between the Manager - BIMB Investment
Management Berhad, the Trustee - ABB Trustee Berhad and the registered holders of the Fund.
The addresses of the registered office and principal place of business of the Fund are as follows:
Registered office
Level 32, Menara Bank Islam
No.22, Jalan Perak
50450 Kuala Lumpur
Principal place of business
Level 19, Menara Bank Islam
No.22, Jalan Perak
50450 Kuala Lumpur
The principal activity of the Fund is to invest in Authorised Investments as defined in the Deed,
which include stocks and shares of companies quoted on Bursa Malaysia, short term deposits and
Islamic debt securities.
The Manager, BIMB Investment Management Berhad, a company incorporated in Malaysia, is a
subsidiary of Bank Islam Malaysia Berhad.
The financial statements were approved by the Board of Directors of the Manager on 28 October
2013.
2. Basis of preparation
(a) Statement of compliance
The financial statements of the Fund have been prepared in accordance with Malaysian
Financial Reporting Standards (“MFRSs”) and International Financial Reporting Standards in
Malaysia. This is the Fund’s first financial statements prepared in accordance with MFRSs and
MFRS 1, First-time Adoption of Malaysian Financial Reporting Standards has been applied.
In the previous years, the financial statements of the Fund were prepared in accordance with
Financial Reporting Standards (“FRS”). The transition to MFRS has no financial impact to the
financial statements of the Fund.
The Fund has adopted the amendments to MFRS 101, Presentation of Financial Statements
which are effective for annual periods beginning on or after 1 July 2012. The adoption of the
amendments to MFRS 101 has no impact on the financial statements other than the
presentation format of the statement of financial position and the statement of profit or loss
and other comprehensive income.
The following are accounting standards, amendments and interpretations of the MFRS
framework that have been issued by the Malaysian Accounting Standards Board (“MASB”) but
have not been adopted by the Fund:

104
2. Basis of preparation (continued)
(a) Statement of compliance (continued)
MFRSs, Interpretations and amendments effective for annual periods beginning on or
after 1 January 2013
MFRS 10, Consolidated Financial Statements
MFRS 11, Joint Arrangements
MFRS 12, Disclosure of Interests in Other Entities
MFRS 13, Fair Value Measurement
MFRS 119, Employee Benefits (2011)
MFRS 127, Separate Financial Statements (2011)
MFRS 128, Investments in Associates and Joint Ventures (2011)
IC Interpretation 20, Stripping Costs in the Production Phase of a Surface Mine
Amendments to MFRS 7, Financial Instruments: Disclosures – Offsetting Financial Assets and Financial Liabilities
Amendments to MFRS 1, First-time Adoption of Malaysian Financial Reporting Standards – Government Loans
Amendments to MFRS 1, First-time Adoption of Malaysian Financial Reporting Standards (Annual Improvements 2009-2011 Cycle)
Amendments to MFRS 101, Presentation of Financial Statements (Annual Improvements 2009-2011 Cycle)
Amendments to MFRS 116, Property, Plant and Equipment (Annual Improvements 2009-2011 Cycle)
Amendments to MFRS 132, Financial Instruments: Presentation (Annual Improvements 2009-2011 Cycle)
Amendments to MFRS 134, Interim Financial Reporting (Annual Improvements 2009-2011 Cycle)
Amendments to MFRS 10, Consolidated Financial Statements: Transition Guidance
Amendments to MFRS 11, Joint Arrangements: Transition Guidance
Amendments to MFRS 12, Disclosure of Interests in Other Entities: Transition Guidance
MFRSs, Interpretations and amendments effective for annual periods beginning on or
after 1 January 2014
Amendments to MFRS 10, Consolidated Financial Statements: Investment Entities
Amendments to MFRS 12, Disclosure of Interests in Other Entities: Investment Entities
Amendments to MFRS 127, Separate Financial Statements (2011): Investment Entities
Amendments to MFRS 132, Financial Instruments: Presentation – Offsetting Financial Assets and Financial Liabilities
MFRSs, Interpretations and amendments effective for annual periods beginning on or
after 1 January 2015
MFRS 9, Financial Instruments (2009)
MFRS 9, Financial Instruments (2010)
Amendments to MFRS 7, Financial Instruments: Disclosures – Mandatory Effective Date of MFRS 9 and Transition Disclosures

105
2. Basis of preparation (continued)
(a) Statement of compliance (continued)
The Fund plans to apply the abovementioned standards, amendments and interpretations,
where applicable:
from the annual period beginning on 1 September 2013 for those standards, amendments or interpretations that are effective for annual periods beginning on or after 1 January 2013.
from the annual period beginning on 1 September 2014 for those standards, amendments or interpretations that are effective for annual periods beginning on or after 1 January 2014.
from the annual period beginning on 1 September 2015 for those standards, amendments or interpretations that are effective for annual periods beginning on or after 1 January 2015
The initial application of the above standards, amendments and interpretations is not expected
to have any material financial impacts to the current and prior periods financial statements
upon their first adoption.
(b) Basis of measurement
The financial statements are prepared on the historical cost basis except as disclosed in note
3(a).
(c) Functional and presentation currency
These financial statements are presented in Ringgit Malaysia (RM), which is the Fund’s
functional currency.
(d) Use of estimates and judgments
The preparation of financial statements in conformity with MFRSs requires management to
make judgements, estimates and assumptions that affect the application of accounting
policies and the reported amounts of assets, liabilities, income and expenses. Actual results
may differ from these estimates.
Estimates and underlying assumptions are reviewed on an ongoing basis. Revisions to
accounting estimates are recognised in the period in which the estimate is revised and in any
future periods effected.
There are no significant areas of estimation uncertainty and critical judgements in applying
accounting policies that have significant effect on the amounts recognised in the financial
statements.

106
3. Significant accounting policies
The accounting policies set out below have been applied consistently to the periods presented in
these financial statements, and in preparing the opening MFRS statements of financial position of
the Fund at 1 September 2011 (the transition date to MFRS framework), unless otherwise stated.
(a) Financial instruments
(i) Initial recognition and measurement
A financial instrument is recognised in the statement of financial statements when, and
only when, the Fund becomes a party to the contractual provisions of the instrument.
A financial instrument is recognised initially, at its fair value plus, in the case of a financial
instrument not at fair value through profit or loss, transaction costs that are directly
attributable to the acquisition or issue of the financial instrument.
(ii) Financial instrument categories and subsequent measurement
The Fund categorises financial instruments as follows:
Financial assets
(a) Financial assets at fair value through profit or loss
Fair value through profit or loss category comprises financial assets that are held for
trading, or financial assets that are specifically designated into this category upon
initial recognition. These include quoted securities and Islamic debt securities.
Financial assets categorised as fair value through profit or loss are subsequently
measured at their fair values with the gain or loss recognised in the statement of
comprehensive income.
(b) Financing and receivables
Financing and receivables category are debt instruments that are not quoted in an
active market and these comprises other receivables, cash at bank and short term
investments. Financial assets categorised as financing and receivables are
subsequently measured at amortised cost using the effective interest method.
All financial assets except for those measured at fair value through profit or loss, are
subject to review for impairment.
Financial liabilities
All financial liabilities are subsequently measured at amortised cost.
Financial liabilities measured at amortised cost comprises amount due to stockbroker,
amount due to Manager, other payables and distribution payable.
107
3. Significant accounting policies (continued)
(a) Financial instruments (continued)
(iii) Derecognition
A financial asset or part of it is derecognised when, and only when the contractual rights
to the cash flows from the financial asset expire or the financial asset is transferred to
another party without retaining control or substantially all risks and rewards of the asset.
On derecognition of a financial asset, the difference between the carrying amount and the
sum of the consideration received (including any new asset obtained less any new liability
assumed) and any cumulative gain or loss that had been recognised in equity is
recognised in profit or loss.
A financial liability or a part of it is derecognised when, and only when, the obligation
specified in the contract is discharged or cancelled or expires. On derecognition of a
financial liability, the difference between the carrying amount of the financial liability
extinguished or transferred to another party and the consideration paid, including any non-
cash assets transferred or liabilities assumed, is recognised in profit or loss.
(b) Income recognition
(i) Dividend income
Dividend from quoted investments is recognised when right to receive payment is
established.
(ii) Income from short term investments and Islamic debt securities
Income from short term investments and Islamic debt securities are recognised in the
statement of profit or loss and other comprehensive income as it accrues, taking into
account the effective profit on the asset.
(c) Cash and cash equivalents
Cash and cash equivalents consist of cash at bank and short term investments with licensed
financial institutions which are readily convertible to cash with an insignificant risk of changes
in value.
Cash and cash equivalents are categorised and measured as financing and receivables in
accordance with policy Note 3(a)(ii)(b).
(d) Impairment
Financial assets
All financial assets (except for financial assets categorised as fair value through profit or loss)
are assessed at each reporting date whether there is any objective evidence of impairment as
a result of one or more events having an impact on the estimated future cash flows of the
asset. Losses expected as a result of future events, no matter how likely, are not recognised.
An impairment loss in respect of loans and receivables is recognised in profit or loss and is
measured as the difference between the asset’s carrying amount and the present value of
estimated future cash flows discounted at the asset’s original effective profit rate. The carrying
amount of the asset is reduced through the use of an allowance account.

108
3. Significant accounting policies (continued)
(e) Taxation
Tax expense comprises current and deferred tax. Tax expense is recognised in the statement
of comprehensive income except to the extent that it relates to items recognised directly in
equity, in which case it is recognised in equity.
Current tax is the expected tax payable on the taxable income for the year, using tax rates
enacted or substantively enacted at the statement of financial position date, and any
adjustment to tax payable in respect of previous years.
(f) Unitholders’ capital
The Fund issues cancellable units, which are cancelled at the holder’s option and are
classified as equity. Cancellable units can be put back to the Fund at any time for cash equal
to a proportionate share of the Fund’s net asset value. The outstanding units is carried at the
redemption amount that is payable at the financial position date if the holder exercises the
right to put the unit back to the Fund.
Units are created and cancelled at the holder’s option at prices based on the Fund’s net
assets value per unit at the time of creation or cancellation. The Fund’s net assets value per
unit is calculated by dividing the net assets attributable to unitholders with the total number of
outstanding units. In accordance with the Securities Commission’s Guidelines on Unit Trust
Funds in Malaysia, investment positions are valued based on the last traded market price for
the purpose of determining the net assets value per unit for creations and cancellations.
The units in the Fund are puttable instruments, classified as equity, which entitle the
unitholders to a pro-rata share of the net asset of the Fund. The units are subordinated and
have identical features. There is no contractual obligation to deliver cash or another financial
asset other than the obligation on the Fund to repurchase the units. The total expected cash
flows from the units are based on the change in the net asset of the Fund.
(g) Distribution
Distributions are at the discretion of the Fund. A distribution to the Fund’s unitholders is
accounted for as a deduction from realised reserves except when realised reserves is not
enough, it will be sourced out of distribution equalisation. The mode of the income distribution
is via creation of additional units based on NAV as at the date one month after the accrual
date. A proposed distribution is recognised in equity in the period in which they are declared.
(h) Net assets value
As the distribution is to be reinvested, for this Fund, the Net Asset Value is calculated after
deducting the retained earnings allocated for distribution.
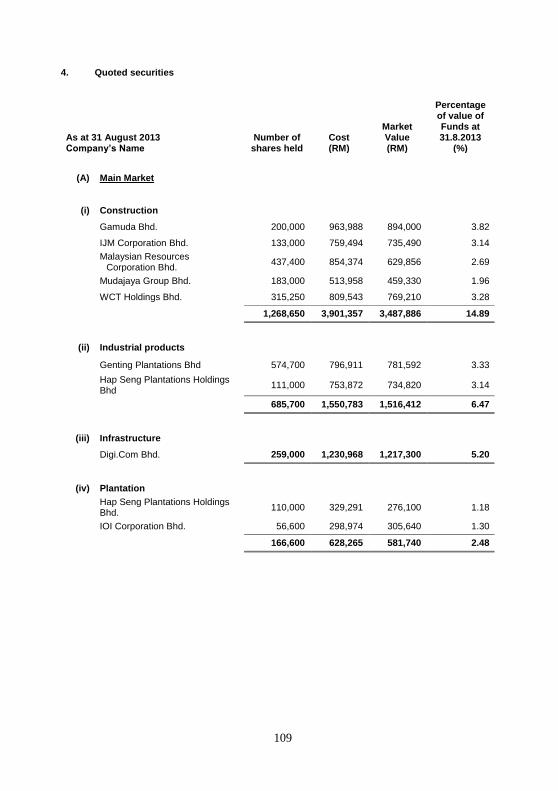
109
4. Quoted securities
As at 31 August 2013 Company’s Name
Number of
shares held Cost (RM)
Market Value (RM)
Percentage of value of Funds at 31.8.2013
(%)
(A) Main Market
(i) Construction
Gamuda Bhd. 200,000 963,988 894,000 3.82
IJM Corporation Bhd. 133,000 759,494 735,490 3.14
Malaysian Resources
Corporation Bhd. 437,400 854,374 629,856 2.69
Mudajaya Group Bhd. 183,000 513,958 459,330 1.96
WCT Holdings Bhd. 315,250 809,543 769,210 3.28
1,268,650 3,901,357 3,487,886 14.89
(ii) Industrial products
Genting Plantations Bhd 574,700 796,911 781,592 3.33
Hap Seng Plantations Holdings Bhd
111,000 753,872 734,820 3.14
685,700 1,550,783 1,516,412 6.47
(iii) Infrastructure
Digi.Com Bhd. 259,000 1,230,968 1,217,300 5.20
(iv) Plantation
Hap Seng Plantations Holdings Bhd.
110,000 329,291 276,100 1.18
IOI Corporation Bhd. 56,600 298,974 305,640 1.30
166,600 628,265 581,740 2.48
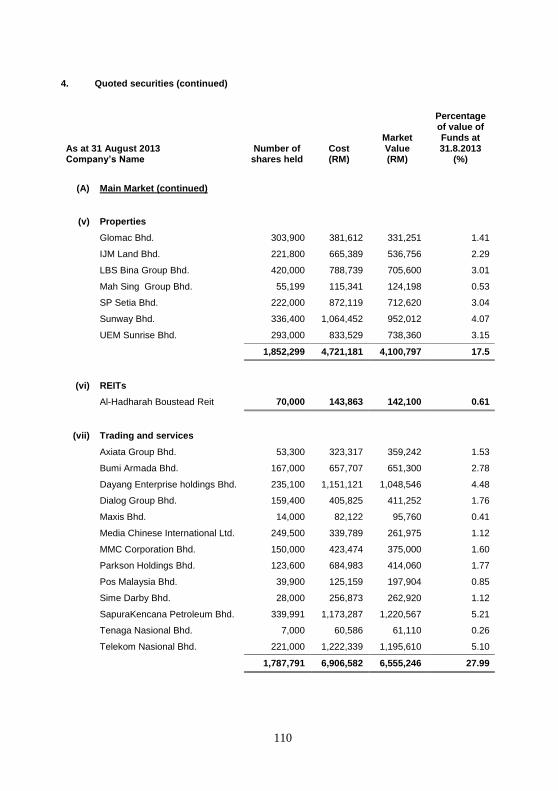
110
4. Quoted securities (continued)
As at 31 August 2013 Company’s Name
Number of
shares held Cost (RM)
Market Value (RM)
Percentage of value of Funds at 31.8.2013
(%)
(A) Main Market (continued)
(v) Properties
Glomac Bhd. 303,900 381,612 331,251 1.41
IJM Land Bhd. 221,800 665,389 536,756 2.29
LBS Bina Group Bhd. 420,000 788,739 705,600 3.01
Mah Sing Group Bhd. 55,199 115,341 124,198 0.53
SP Setia Bhd. 222,000 872,119 712,620 3.04
Sunway Bhd. 336,400 1,064,452 952,012 4.07
UEM Sunrise Bhd. 293,000 833,529 738,360 3.15
1,852,299 4,721,181 4,100,797 17.5
(vi) REITs
Al-Hadharah Boustead Reit 70,000 143,863 142,100 0.61
(vii) Trading and services
Axiata Group Bhd. 53,300 323,317 359,242 1.53
Bumi Armada Bhd. 167,000 657,707 651,300 2.78
Dayang Enterprise holdings Bhd. 235,100 1,151,121 1,048,546 4.48
Dialog Group Bhd. 159,400 405,825 411,252 1.76
Maxis Bhd. 14,000 82,122 95,760 0.41
Media Chinese International Ltd. 249,500 339,789 261,975 1.12
MMC Corporation Bhd. 150,000 423,474 375,000 1.60
Parkson Holdings Bhd. 123,600 684,983 414,060 1.77
Pos Malaysia Bhd. 39,900 125,159 197,904 0.85
Sime Darby Bhd. 28,000 256,873 262,920 1.12
SapuraKencana Petroleum Bhd. 339,991 1,173,287 1,220,567 5.21
Tenaga Nasional Bhd. 7,000 60,586 61,110 0.26
Telekom Nasional Bhd. 221,000 1,222,339 1,195,610 5.10
1,787,791 6,906,582 6,555,246 27.99

111
4. Quoted securities (continued)
As at 31 August 2013 Company’s Name
Number of
shares held Cost (RM)
Market Value (RM)
Percentage of value of Funds at 31.8.2013
(%)
(A) Main Market (continued)
(viii) Warrant
Mah Sing Group Bhd.
- Warrant B 592,700 389,030 290,423 1.24
Sunway Bhd.
- Warrant A 285,200 256,964 191,084 0.82
877,900 645,994 481,507 2.06
Total portfolio investment as
at 31 August 2013 19,728,993 18,082,988 77.20
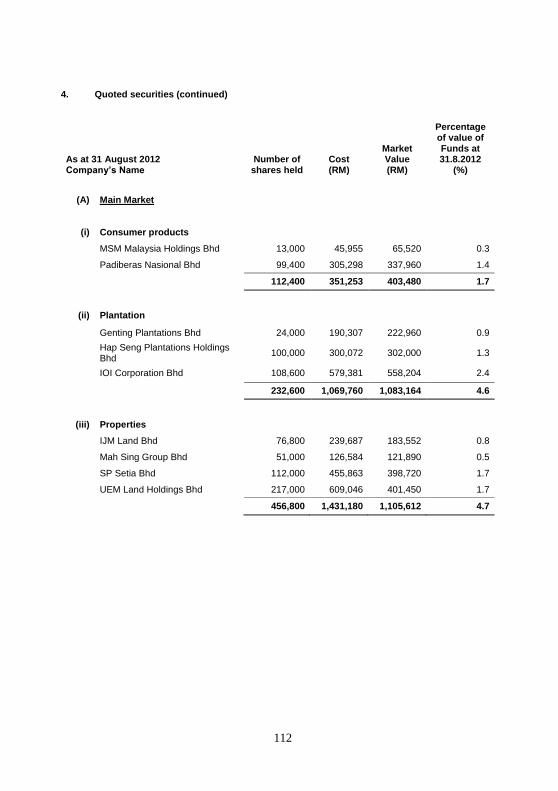
112
4. Quoted securities (continued)
As at 31 August 2012 Company’s Name
Number of
shares held Cost (RM)
Market Value (RM)
Percentage of value of Funds at 31.8.2012
(%)
(A) Main Market
(i) Consumer products
MSM Malaysia Holdings Bhd 13,000 45,955 65,520 0.3
Padiberas Nasional Bhd 99,400 305,298 337,960 1.4
112,400 351,253 403,480 1.7
(ii) Plantation
Genting Plantations Bhd 24,000 190,307 222,960 0.9
Hap Seng Plantations Holdings Bhd
100,000 300,072 302,000 1.3
IOI Corporation Bhd 108,600 579,381 558,204 2.4
232,600 1,069,760 1,083,164 4.6
(iii) Properties
IJM Land Bhd 76,800 239,687 183,552 0.8
Mah Sing Group Bhd 51,000 126,584 121,890 0.5
SP Setia Bhd 112,000 455,863 398,720 1.7
UEM Land Holdings Bhd 217,000 609,046 401,450 1.7
456,800 1,431,180 1,105,612 4.7

113
4. Quoted securities (continued)
As at 31 August 2012 Company’s Name
Number of shares held
Cost (RM)
Market Value (RM)
Percentage of value of Funds at 31.8.2012
(%)
Main Market (continued)
(iv) Trading and Services
Axiata Group Bhd 209,000 1,016,304 1,251,910 5.3
Bumi Armada Berhad 11,000 33,663 41,690 0.2
Dayang Enterprise Holdings 127,281 243,110 260,926 1.1
Dialog Group Berhad 334,400 802,733 785,840 3.3
Gas Malaysia Berhad 33,000 73,145 85,800 0.4
IHH Healthcare Berhad 44,000 124,432 140,800 0.6
KPJ Healthcare Berhad 42,000 186,146 263,340 1.1
Maxis Berhad 77,000 435,725 542,080 2.3
Media Chinese International
Limited 200,000 234,914 308,000 1.4
MMC Corporation Berhad 100,000 287,022 245,000 1.0
Parkson Holdings Berhad 123,600 684,983 578,448 2.5
Petronas Dagangan Berhad 12,000 193,886 268,800 1.1
Pos Malaysia Berhad 295,000 800,536 941,050 4.0
Sime Darby Berhad 136,000 1,183,774 1,334,160 5.7
SapuraKencana Petroleum Berhad
190,947 315,197 452,544 1.9
STAR Publications Malaysia
Berhad 78,000 250,201 252,720 1.1
Tenaga Nasional Berhad 35,500 245,190 242,820 1.0
2,048,728 7,110,961 7,995,928 34.0
(v) Construction
Gamuda Berhad 207,100 771,965 714,495 3.0
Hock Seng Lee Bhd 102,510 182,685 165,041 0.7
IJM Corporation Bhd 90,000 508,447 462,600 2.0
Malaysian Resources
Corporation Bhd 283,000 601,843 478,270 2.0
WCT Bhd 75,000 224,145 198,750 0.8
757,610 2,289,085 2,019,156 8.5

114
4. Quoted securities (continued)
As at 31 August 2012 Company’s Name
Number of shares held
Cost (RM)
Market Value (RM)
Percentage of value of Funds at 31.8.2012
(%)
(A) Main Market (continued)
vi) Industrial products
Petronas Chemical Group Bhd 111,000 753,872 719,280 3.1
vii) Finance Products
BIMB Holdings Berhad 25,000 59,992 80,000 0.3
viii) REITS
Al-Aqar Healthcare REIT 64,500 77,714 90,300 0.4
Total portfolio investment as
at 31 August 2012 13,143,817 13,496,920 57.3

115
4. Quoted Securities (continued)
As at 1 September 2011 Company’s Name
Number of
shares held Cost (RM)
Market Value (RM)
Percentage of value of Funds at 1.9.2011
(%)
(A) Main Market
(i) Consumer products
MSM Malaysia Holdings Bhd 13,000 45,955 65,520 0.3
(ii) Plantation
Genting Plantations Bhd 24,000 190,306 169,680 0.7
IOI Corporation Bhd 108,600 579,381 489,786 2.1
132,600 769,687 659,466 2.8
(iii) Properties
IJM Land Bhd 76,800 239,687 185,856 0.8
Mah Sing Group Bhd 51,000 126,583 111,180 0.5
Naim Holding Bhd 48,800 158,526 92,720 0.4
SP Setia Bhd 112,000 455,863 424,480 1.8
UEM Land Holdings Bhd 217,000 609,049 451,360 2.0
505,600 1,589,705 1,265,596 5.5
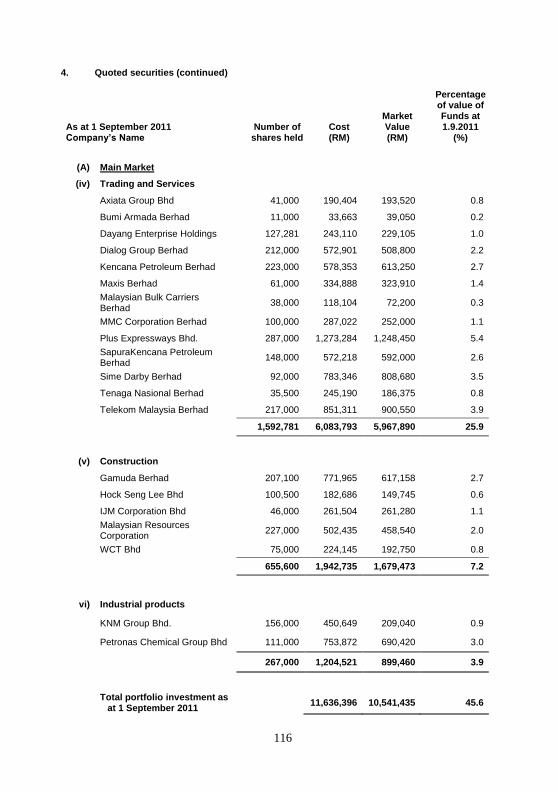
116
4. Quoted securities (continued)
As at 1 September 2011 Company’s Name
Number of
shares held Cost (RM)
Market Value (RM)
Percentage of value of Funds at 1.9.2011
(%)
(A) Main Market
(iv) Trading and Services
Axiata Group Bhd 41,000 190,404 193,520 0.8
Bumi Armada Berhad 11,000 33,663 39,050 0.2
Dayang Enterprise Holdings 127,281 243,110 229,105 1.0
Dialog Group Berhad 212,000 572,901 508,800 2.2
Kencana Petroleum Berhad 223,000 578,353 613,250 2.7
Maxis Berhad 61,000 334,888 323,910 1.4
Malaysian Bulk Carriers Berhad
38,000 118,104 72,200 0.3
MMC Corporation Berhad 100,000 287,022 252,000 1.1
Plus Expressways Bhd. 287,000 1,273,284 1,248,450 5.4
SapuraKencana Petroleum Berhad
148,000 572,218 592,000 2.6
Sime Darby Berhad 92,000 783,346 808,680 3.5
Tenaga Nasional Berhad 35,500 245,190 186,375 0.8
Telekom Malaysia Berhad 217,000 851,311 900,550 3.9
1,592,781 6,083,793 5,967,890 25.9
(v) Construction
Gamuda Berhad 207,100 771,965 617,158 2.7
Hock Seng Lee Bhd 100,500 182,686 149,745 0.6
IJM Corporation Bhd 46,000 261,504 261,280 1.1
Malaysian Resources Corporation
227,000 502,435 458,540 2.0
WCT Bhd 75,000 224,145 192,750 0.8
655,600 1,942,735 1,679,473 7.2
vi) Industrial products
KNM Group Bhd. 156,000 450,649 209,040 0.9
Petronas Chemical Group Bhd 111,000 753,872 690,420 3.0
267,000 1,204,521 899,460 3.9
Total portfolio investment as
at 1 September 2011 11,636,396 10,541,435 45.6

117
5. Islamic debt securities
As at 31 August 2013
Maturity Date
Rating*
Cost (RM)
Market Value (RM)
Percentage Value of Funds at 31.8.2013
Teknologi Tenaga
Perlis Consortium
Sdn. Bhd.
31.07.2017 AA1 2,002,400 2,015,000 8.6
Manjung Island Energy Bhd.
01.07.2021 AA-IS 2,033,200 2,002,400 8.5
4,035,600 4,017,400 17.1
As at 31 August 2012
Maturity Date
Rating*
Cost (RM)
Market Value (RM)
Percentage Value of Funds at 31.8.2012
Sarawak Energy Bhd 22.06.2018 AA1 1,005,920 1,034,800 4.4
Manjung Island Energy Bhd.
25.11.2026 AAA 1,000,000 1,021,100 4.3
Projek Lebuhraya Usahasama Bhd
12.01.2027 AAA 2,021,400 2,073,600 8.8
Aman Sukuk Bhd. 12.04.2019 AAA 2,000,000 2,037,200 8.7
Axis Reit Sukuk Bhd. 12.07.2024 AAA 1,012,000 1,010,300 4.3
7,039,320 7,177,000 30.5
As at 1 September 2011
Maturity Date
Rating*
Cost (RM)
Market Value (RM)
Percentage Value of Funds at 1.9.2011
Government
Investment
Issuance
30.08.2018 - 2,999,040 3,037,800 13.1
Sarawak Energy Bhd.
22.06.2018 AA1 1,005,920 1,034,000 4.5
4,004,960 4,071,800 17.6
* Ratings is either Rating Agency Malaysia Berhad or Malaysian Rating Corporation Berhad
whichever applicable.

118
6. Cash and cash equivalents
As at
31.8.2013 (RM)
As at
31.8.2012
(RM)
As at
1.9.2011
(RM)
Short term placements in licensed
financial institutions
Special Investment Account* 2,696,017 - 3,514,196
Waheed I Deposit* - 2,070,418 -
Wakalah Deposit - 1,536,091 3,428,535
2,696,018 3,606,509 6,942,731
Cash at bank* 303,695 74,753 2,333,127
2,999,713
3,681,262
9,275,858
* Special Investment Account, Waheed I Deposits and cash at bank are placed with a related
party, Bank Islam Malaysia Berhad.
7. Unitholders’ capital
As at As at As at
31.8.2013 31.8.2012 1.9.2011
No. of units (RM) No. of units (RM) No. of units (RM)
At 1 September
2012/2010 40,793,027 22,912,669 42,266,252 23,914,752 15,351,730 8,212,657
Creation of units 16,234,137 9,538,925 13,491,768 7,582,497 27,827,561 16,237,069
Cancellation of
units (13,786,105) (8,168,528) (14,964,993) (8,584,580) (913,039) (534,974)
_________ _________ _________ _________ _________ _________
At 31 August 43,241,059 24,283,066 40,793,027 22,912,669 42,266,252 23,914,752
======== ======== ======== ======== ======== =========
In accordance with the Deed, the maximum number of units that can be issued out for circulation
is 400,000,000 (31 August 2012: 400,000,000, 1 September 2011: 400,000,000). As at 31 August
2013, the number of units yet to be issued was 356,758,941 (31 August 2012: 359,206,973, 1
September 2011: 357,733,748).
Based on historic information over the last 12 months, redemption levels are expected to
approximate RM8,100,000 (31 August 2012: RM8,600,000, 1 September 2011: RM500,000) and
the average monthly level of redemptions net of new subscriptions are expected to approximate
RM114,100 (31 August 2012: RM86,000, 1 September 2011: RM1,308,000). However, the actual
level of redemptions may differ significantly from the historic experience.

119
8. Manager’s fee
The management fee payable to the manager of the Fund is based on 1.50% (2012: 1.50%) per
annum of the net asset value of the Fund calculated on a daily basis.
9. Trustee’s fee
The trustee’s fee is payable to the trustee of the Fund based on 0.08% (2012: 0.08%) per annum
subject to a minimum of RM18,000 (2012: RM18,000) per annum of the net asset value of the
Fund calculated on a daily basis.
10. Tax expense
2013
(RM)
2012
(RM)
Tax Expenses
- Current Year 6,800 22,300
6,800 22,300
Reconcilation of effective tax expense
Net income before taxation 294,211 2,261,832
Income tax using Malaysian tax rate @ 25% 73,553 565,458
Non-deductable expenses 59,890 96,160
Income not subject to tax (126,643) (639,318)
6,800 22,300

120
11. Distribution
2013 (RM)
2012 (RM)
Distribution to unitholders is from the following sources:
Gain on sale of shares 1,815,709 304,020
Gross dividends from share quoted in Malaysia 596,651 368,105
Income from Islamic debt securities 227,811 257,898
Income from short term investments 147,560 170,492
Gain on disposal of Islamic debt securities 112,980 63,105
Hibah from Al-Wadiah account 860 582
Realised retained profit brought forward - 64,157
Distribution equalisation - 31,078
2,901,571 1,256,147
Less:
Expenses (452,372) (417,987)
Tax expense (6,800) (22,300)
Undistributed income (669,516) -
Net Distribution 1,772,883 815,860
The Manager has declared a net distribution of 4.10 sen (2012: 2.00 sen) per unit based on units
in circulation as at 31 August 2013 amounting to RM1,772,883 (2012: RM815,860) in respect of
the current financial year. The distribution was approved by the Investment Committee in July
2013.
12. Units held by related party
The number of units held by Management Company and other related party are as follows:
As at 31.08.2013 As at 31.08.2012
Unit (RM)
Unit (RM)
Bank Islam Malaysia Berhad 140,887 76,318
136,163 77,490
The Manager does not hold any unit in the Fund (2012: Nil). All units are held legally and
beneficially by the company.

121
13. Transactions with related party
Other than as disclosed in note 6 to the financial statements, other transactions with related parties
are as follows
Transactions Balance
as at as at
31 August 31 August
2013 2012 2013 2012
(RM) (RM) (RM) (RM)
The Manager
BIMB Investment Management
Berhad
- Management fee 383,966 370,130 (31,536) (30,273)
- Amount due from manager - - 196,780 -
- Amount due to manager - - - (96,607)
====== ======= ======= =======
Holding company of the Manager
Bank Islam Malaysia Berhad
- Income from short term
placement 94,134 43,758 2,696,018 2,070,418
====== ======= ======= =======
Related company of the Manager
BIMB Securities Sdn. Bhd.
- Brokerage fee 10,888 4,987 - -
====== ======= ====== =======
The Trustee
ABB Trustee Berhad
- Trustee fee 20,478 19,740 (1,682) (1,615)
====== ======= ====== =======
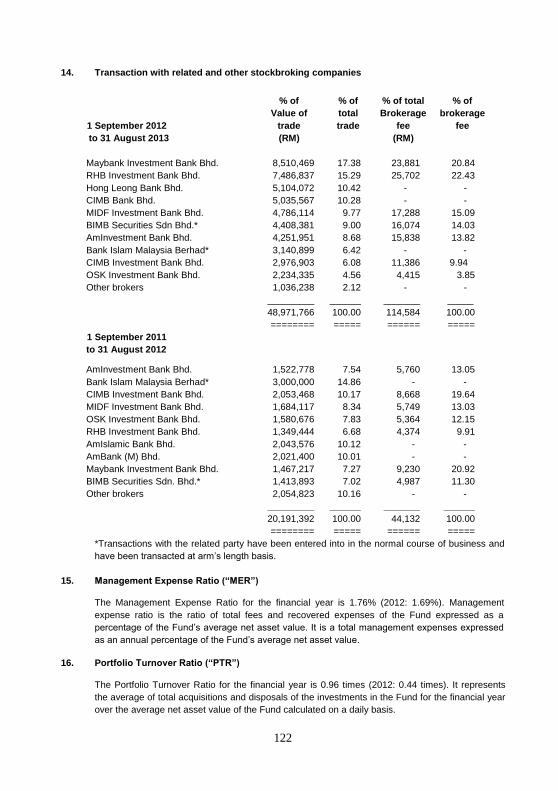
122
14. Transaction with related and other stockbroking companies
% of % of % of total % of
Value of total Brokerage brokerage
1 September 2012 trade trade fee fee
to 31 August 2013 (RM) (RM)
Maybank Investment Bank Bhd. 8,510,469 17.38 23,881 20.84
RHB Investment Bank Bhd. 7,486,837 15.29 25,702 22.43
Hong Leong Bank Bhd. 5,104,072 10.42 - -
CIMB Bank Bhd. 5,035,567 10.28 - -
MIDF Investment Bank Bhd. 4,786,114 9.77 17,288 15.09
BIMB Securities Sdn Bhd.* 4,408,381 9.00 16,074 14.03
AmInvestment Bank Bhd. 4,251,951 8.68 15,838 13.82
Bank Islam Malaysia Berhad* 3,140,899 6.42 - -
CIMB Investment Bank Bhd. 2,976,903 6.08 11,386 9.94
OSK Investment Bank Bhd. 2,234,335 4.56 4,415 3.85
Other brokers 1,036,238 2.12 - -
_________ ______ _______ _____
48,971,766 100.00 114,584 100.00
======== ===== ====== =====
1 September 2011
to 31 August 2012
AmInvestment Bank Bhd. 1,522,778 7.54 5,760 13.05
Bank Islam Malaysia Berhad* 3,000,000 14.86 - -
CIMB Investment Bank Bhd. 2,053,468 10.17 8,668 19.64
MIDF Investment Bank Bhd. 1,684,117 8.34 5,749 13.03
OSK Investment Bank Bhd. 1,580,676 7.83 5,364 12.15
RHB Investment Bank Bhd. 1,349,444 6.68 4,374 9.91
AmIslamic Bank Bhd. 2,043,576 10.12 - -
AmBank (M) Bhd. 2,021,400 10.01 - -
Maybank Investment Bank Bhd. 1,467,217 7.27 9,230 20.92
BIMB Securities Sdn. Bhd.* 1,413,893 7.02 4,987 11.30
Other brokers 2,054,823 10.16 - -
_________ ______ _______ ______
20,191,392 100.00 44,132 100.00
======== ===== ====== =====
*Transactions with the related party have been entered into in the normal course of business and
have been transacted at arm’s length basis.
15. Management Expense Ratio (“MER”)
The Management Expense Ratio for the financial year is 1.76% (2012: 1.69%). Management
expense ratio is the ratio of total fees and recovered expenses of the Fund expressed as a
percentage of the Fund’s average net asset value. It is a total management expenses expressed
as an annual percentage of the Fund’s average net asset value.
16. Portfolio Turnover Ratio (“PTR”)
The Portfolio Turnover Ratio for the financial year is 0.96 times (2012: 0.44 times). It represents
the average of total acquisitions and disposals of the investments in the Fund for the financial year
over the average net asset value of the Fund calculated on a daily basis.
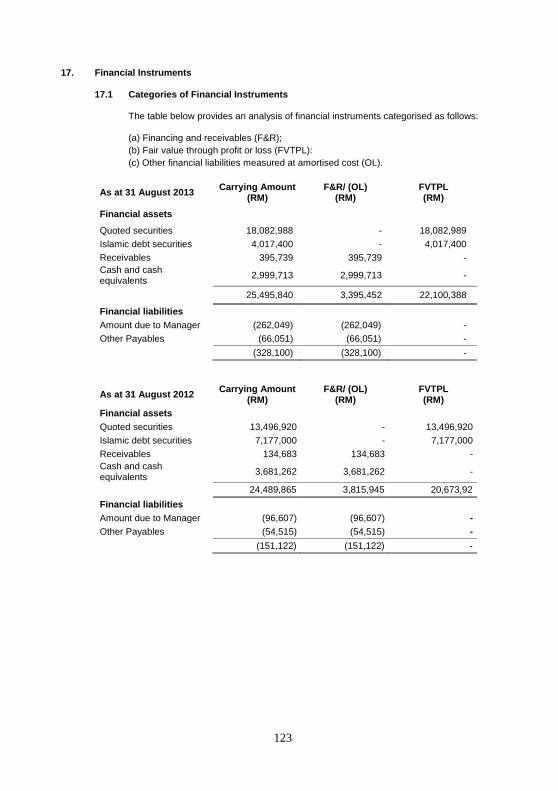
123
17. Financial Instruments
17.1 Categories of Financial Instruments
The table below provides an analysis of financial instruments categorised as follows:
(a) Financing and receivables (F&R);
(b) Fair value through profit or loss (FVTPL):
(c) Other financial liabilities measured at amortised cost (OL).
As at 31 August 2013 Carrying Amount
(RM) F&R/ (OL)
(RM) FVTPL (RM)
Financial assets
Quoted securities 18,082,988 - 18,082,989
Islamic debt securities 4,017,400 - 4,017,400
Receivables 395,739 395,739 -
Cash and cash equivalents
2,999,713 2,999,713 -
25,495,840 3,395,452 22,100,388
Financial liabilities
Amount due to Manager (262,049) (262,049) -
Other Payables (66,051) (66,051) -
(328,100) (328,100) -
As at 31 August 2012 Carrying Amount
(RM) F&R/ (OL)
(RM) FVTPL (RM)
Financial assets
Quoted securities 13,496,920 - 13,496,920
Islamic debt securities 7,177,000 - 7,177,000
Receivables 134,683 134,683 -
Cash and cash equivalents
3,681,262 3,681,262 -
24,489,865 3,815,945 20,673,92
Financial liabilities
Amount due to Manager (96,607) (96,607) -
Other Payables (54,515) (54,515) -
(151,122) (151,122) -

124
17. Financial Instruments (continued)
17.1 Categories of Financial Instruments (continued)
As at 1 September 2011 Carrying Amount
(RM) F&R/ (OL)
(RM) FVTPL (RM)
Financial assets
Quoted securities 10,541,435 - 10,541,435
Islamic debt securities 4,071,800 - 4,071,800
Receivables 107,793 107,793 -
Cash and cash equivalents
9,275,858 9,275,858 -
23,996,886 9,383,651 14,613,235
Financial liabilities
Other Payables (44,387) (44,387) -
(44,387) (44,387) -
17.2 Net gains and losses arising from financial instruments
2013 (RM)
2012 (RM)
Net gains on: Fair value through profit or loss: - Designated upon initial recognition
598,163 2,512,035
Loans and receivables 148,420 171,074
746,583 2,683,109
17.3 Financial risk management
The Fund has exposure to the following risks from its use of financial instruments:
Credit risk
Liquidity risk
Market risk
Investment risk
17.4 Credit risk
Credit risk is the risk of a financial loss to the Fund if a customer or counterparty to a
financial instrument fails to meet its contractual obligations. The Fund’s exposure to credit
risk arises principally from its investment securities and receivables.
The Manager manages the credit risk by setting counterparty limits and undertaking credit
evaluation to minimise the risk. The exposure to credit risk is monitored on an ongoing
basis.

125
17. Financial instruments (continued)
17.4 Credit risk (continued)
The Fund’s maximum credit risk exposure at the reporting date is represented by the
respective carrying amounts of the relevant financial assets in the statement of financial
position.
No financial assets carried at amortised cost were past due or impaired as at date of
statement of financial position.
17.5 Liquidity risk Liquidity risk is the risk that the Fund will not be able to meet its financial obligations as
they fall due. The Fund’s exposure to liquidity risk arises principally from its various
payables which are due within one year.
The Fund maintains sufficient level of liquid assets, after consultation with the Trustee, to
meet anticipated payments and cancellation of units by unit holders. Liquid assets
comprise cash and other instruments, which are capable of being converted into cash
within 7 days.
17.6 Market risk
Market risk is the risk that changes in market prices, such as profit rates and market prices
will affect the Fund’s financial position or cash flows.
Profit rate risk
The profit rate profile of the fund’s significant profit-bearing financial instruments, based on
carrying amounts as at the end of reporting period was:
Fixed rate instruments 31.8.2013
(RM)
31.8.2012
(RM)
1.9.2011
(RM)
Islamic debt securities 4,017,400
7,177,000
4,071,800
Short term investments 2,696,018 3,606,509 6,942,731
Fair value sensitivity analysis for fixed rate instruments The Fund accounts for the Islamic debt securities at fair value through profit and loss.
An increase of 100 basis points (bp) in interest rates at the end of the reporting period
would have decreased on the unitholders’ fund and statement of comprehensive income
by RM240,380 (2012: RM543,970). A decrease of 100 basis point (bp) in interest rates
would have equal but opposite effect on the equity and statement on comprehensive
income respectively.

126
17. Financial instruments (continued)
17.6 Market risk (continued)
Market price risk
Equity price risk arises from the Fund’s investments in equity securities.
Risk management objectives, policies and processes for managing the risk
The Fund is restricted to invest in securities issued by any issuer of not more than a
certain percentage of its net asset value. Under such restriction, the exposure risk to the
securities of any issuer is mitigated.
Equity price risk sensitivity analysis
This analysis assumes that all other variables remain constant and the Fund’s equity
investments are positively correlated to each other.
A 5% strengthening in equity prices at the end of the reporting period would have
increased the net asset value and unitholders’ fund by RM904,149 (2012: RM674,846). A
5% weakening in equity prices would have had equal but opposite effect on the net asset
value and unitholders’ fund respectively.
17.7 Investment risk
Investments are bound by regulatory guidelines that govern the maximum securities
holdings and maximum liquid assets holdings.
Equity investment risks consist primarily of market risk, specific stock risk and liquidity risk.
The mechanism employed to control investment risk for equity funds is by placing
acceptable stock and sector limits.
Fixed income risks are in the form of profit rate and credit risks. To manage these risks,
investments will be in investment grade Sukuk.
Risk management objectives, policies and processes for managing the risk
The Manager has written policies and guidelines on risk management, which set out the
overall investment risks strategies and general risk management philosophies. These
processes monitor, measure and control risks associated with the business. Matters
relating to investment risks in respect of funds portfolio are discussed during the
Investment Committee meetings of the Manager.
127
17. Financial instruments (continued)
17.8 Fair value of financial instruments The carrying amounts of cash and cash equivalents, short term receivables and payables
approximate fair values due to the relatively short term nature of these financial
instruments.
The fair value of quoted securities and Islamic debt securities, together with the carrying
amounts shown in the statement of financial position are already disclosed in Note 4 and
Note 5 respectively.
The following summarises the method used in determining the fair value of financial
instruments:
Quoted equities
Quoted equities in Malaysia are valued at a bid price quoted on the Bursa Malaysia at the
date of the statement of financial position, in accordance with the Deed. Unrealised gain or
loss is taken to statement of profit or loss and other comprehensive income.
Islamic debt securities
Islamic debt securities issued by Malaysian corporations and rated by the Rating Agency
of Malaysia Berhad are carried at fair value. In arriving at fair value gain/loss, the
acquisition cost is adjusted for the amortisation of any premium or accretion of any
discount over their par values at the time of acquisition. The premium or discount is
amortised or accreted on a yield to maturity basis over the remaining term of the
investments from the date of acquisition.
This adjusted cost (carrying value) is then revalued to reflect its fair value (indicative
market value) using the fair price quoted by an independent bond pricing agency (BPA)
registered with the Securities Commission. If such quotations are not available, it will be
valued on a weekly basis or as and when appropriate by reference to average indicative
yield quoted by the three reputable financial institutions in over-the-counter markets as the
close of trading. These institutions include investments banks and commercial banks.
Surplus or deficit on revaluation is transferred to statement of comprehensive income.

128
17. Financial instruments (continued)
17.8 Fair value of financial instruments (continued)
17.8.1 Fair value hierarchy
The table below analyses financial instruments carried at fair value, by valuation
method. The level have been defined as follows:
Level 1: Quoted prices (unadjusted) in active markets for identical assets and
liabilities.
Level 2: Inputs other than quoted prices included within Level 1 that are
observable for the asset or liability, either directly (i.e. as prices) or indirectly
(i.e. derived from prices).
Carrying amount Level 1 Level 2
As at 31 August 2013 (RM) (RM) (RM) Financial assets at fair value through profit or loss - Quoted securities 18,082,988 18,082,988 - - Islamic debt securities 4,017,400 - 4,017,400
_________________________________
22,100,388 18,082,988 4,017,400 ================================
As at 31 August 2012 Financial assets at fair value through profit or loss - Quoted securities 13,496,920 13,496,920 - - Islamic debt securities 7,177,000 - 7,177,000
_________________________________
20,673,920 13,496,920 7,177,000 ================================
Carrying amount Level 1 Level 2
(RM) (RM) (RM) As at 1 September 2011 Financial assets at fair value through profit or loss - Quoted securities 10,541,435 10,541,435 - - Islamic debt securities 4,071,800 - 4,071,800
________________________________
14,613,235 10,541,435 4,071,800 ================================

129
18. Capital management
The Fund’s capital is represented by the unitholders’ fund in the statement of financial position.
The Manager of the Fund monitors the adequacy of capital on an ongoing basis. There is no
external capital requirement imposed on the Fund.
19. Explanation of transition to MFRSs
As stated in Note 2(a), these are the first financial statements of the Fund prepared in accordance
with MFRSs.
The accounting policies set out in Note 3 have been applied in preparing the financial statements
of the Fund for the year ended 31 August 2013, the comparative information presented in these
financial statements for the year ended 31 August 2012 and in the preparation of the opening
MFRS statement of financial position at 1 September 2011 (the Fund’s date of transition to
MFRSs).
The transition to MFRSs does not have significant financial impact to the financial statements of
the Fund. Hence, no reconciliation of accounting policies between the FRSs and MFRSs is
presented.

130
7.0 CORPORATE DIRECTORY
MANAGER
BIMB Investment Management Berhad
Registered Office
Level 32, Menara Bank Islam, No. 22, Jalan Perak
50450, Kuala Lumpur
Business Office
Level 19, Menara Bank Islam, No. 22, Jalan Perak
50450, Kuala Lumpur
BOARD OF DIRECTORS
Dato’ Sri Zukri Samat (Chairman – Non Executive)
Mustapha Hamat (Non-Executive Independent Director)
Ghazali Awang (Non-Executive Independent Director)
Malkiat Singh @ Malkit Singh Maan (Non-Executive Non Independent
Director)
Khairul Kamarudin (Non-Executive Non Independent Director)
Nazaruddin Othman (Chief Executive Officer)
INVESTMENT
COMMITTEE
Ghazali Awang (Chairman - Independent Member)
Mustapha Hamat (Independent Member)
Norashikin Mohd Kassim
Jeroen P.M.M Thijs
COMPANY SECRETARY
Norhidayati Mohamat Salim (MIA 27364)
No. 33, Jalan Batu Jauhar,
Taman Rowther, 68100 Batu Caves, Selangor.
Zuraidah Zainudin (LS 8101)
No.22, Jalan 7/3B, Seksyen 7
43650 Bandar Baru Bangi, Selangor
131
KEY MANAGEMENT
Nazaruddin Othman (Chief Executive Officer)
Vicknesan Balakrishnan (Chief Investment Officer)
Azman Ali (Head of Compliance)
Noor Rose Mona Aziz (Acting Head, Finance and Operations)
Wan Shahrulzaman Japhilus (Head, Agency and Corporate Business)
SHARIAH COMMITTEE
Ustaz Dr. Ahmad Shahbari @ Sobri Salamon
Ustaz Dr. Yusof Ramli
Ustazah Dr. Asmak Ab. Rahman
PRINCIPAL BANKER
Bank Islam Malaysia Berhad
Ground Floor, Menara Bank Islam
No.22, Jalan Perak
50450 Kuala Lumpur
TRUSTEE
ABB Trustee Berhad (208904-W)
Tingkat 17, Menara Affin
80, Jalan Raja Chulan
50200 Kuala Lumpur
SOLICITOR
Messrs Naqiz & Partners
No.42A, Lorong Dungun, Damansara Height,
50490 Kuala Lumpur
AUDITORS
KPMG Desa Megat & Co.
(AF 0759)
Level 10, KPMG Tower
8, First Avenue, Bandar Utama
47800 Petaling Jaya, Selangor

132
TAX ADVISER
Ernst & Young Tax Consultants Sdn. Bhd
Level 23A, Menara Millenium, Jalan Damanlela
Pusat Bandar Damansara
Damansara Heights, 50490 Kuala Lumpur
FEDERATION OF
INVESTMENT
MANAGERS MALAYSIA
(FiMM)
19-07-3, 7th Floor, PNB Damansara
No.19, Lorong Dungun
Damansara Heights
50490 Kuala Lumpur
DISTRIBUTORS
Bank Islam Malaysia Berhad Branches
IFast Capital Sdn Bhd
Phillip Mutual Berhad
Johor Bharu Agency Office
Bank Simpanan Nasional
Registered Unit Trust Consultant with BIMB Investment Management
Berhad
TOLL FREE NUMBER: 1-800-88-1196

Toll Free Number: 1-800-88-1196Call Centre: 03-26 900 900