annual report of the national notifiable … · annual report of the national notifiable diseases...
TRANSCRIPT

ANNUAL REPORT OF THE NATIONAL NOTIFIABLE DISEASESSURVEILLANCE SYSTEM, 1994
Jenny Hargreaves, Helen Longbottom, Htoo Myint, Ana Herceg, Graeme Oliver, Margaret Curran, and David Evans,AIDS/Communicable Diseases Branch, Department of Human Services and Health, for the Communicable Diseases NetworkAustralia New Zealand
Introduction
Notification of cases of certain communicable diseasesto the health authorities of the States and Territories hasbeen required for over one hundred years in most partsof Australia1. Last century, diseases were notifiablemainly for quarantine purposes, and emphasis was onsmallpox, typhoid, cholera, plague and yellow fever.As knowledge of communicable disease aetiology andepidemiology have increased, and control methodsother than quarantine have been developed, the lists ofnotifiable diseases have changed and expanded2. Inthe early part of this century, the lists of notifiablediseases were expanded to include diphtheria, pulmo-nary tuberculosis, pertussis, poliomyelitis and malariaamong others and, in more recent years, to includediseases such as hepatitis A, hepatitis B, hepatitis C,Ross River virus infection, HIV infection and salmonel-losis.
Notification of communicable disease is an importantcontribution to public health, as it prompts investiga-tion and appropriate actions to control the spread of thediseases and enables monitoring of the effectiveness ofexisting control activities. Many communicable dis-ease control activities are initiated at local governmentor State level, necessitating local and State-based sur-veillance activities. However, for many diseases,national surveillance is also appropriate, for exampleto undertake control activities in outbreaks which affectmore than one jurisdiction, to monitor the need for orimpact of national control programs (for example, forvaccine preventable diseases of childhood, sexuallytransmissible diseases and hepatitis C), to guide Na-tional Health and Medical Research Council (NHMRC)and other national disease control policy development(for example, for tuberculosis), to describe the currentepidemiology of rare diseases for which there are onlya few notifications in each State (for example, leprosy),to assist in national quarantine activities and to enablereporting of surveillance data to the World Health Or-ganization and for other international collaborations.
In recognition of these needs for timely and accuratenational communicable disease surveillance informa-tion, the National Notifiable Diseases SurveillanceSystem (NNDSS) was established in its current formatin 1991, under the auspices of the Communicable Dis-eases Network Australia New Zealand. It monitors theoccurrence and some risk factors for communicablediseases in Australia through national compilation ofnotifications of the diseases made to the health authori-ties of the States and Territories. Forty-three diseasesor disease categories are included, largely as recom-mended by the NHMRC3.
This is the fourth annual report of the NNDSS in itscurrent format; previous reports were for cases re-ported in 19914, 19925 and 19936.
Methods
Notifications of communicable disease were compiledand collated continuously through 1994 by the Statesand Territories. On a fortnightly basis, they sent com-puterised line listings of their notifications for thecalendar year to date to the AIDS/Communicable Dis-eases Branch of the Department of Human Services andHealth, for national dataset compilation, analysis andpublication in Communicable Diseases Intelligence and toguide national control activities. The national datasetincluded fields for a unique identifying number; thedisease; the age, sex, Aboriginality and postcode ofresidence of the case; the date of onset of the diseaseand the date of report to the State or Territory healthauthority.
The final 1994 datasets were provided by the States andTerritories between June and September 1995. Theywere converted to the standard format where neces-sary using Epi Info v6.02, Turbo Pascal, dBase IV andVisual Basic. Missing data and apparent errors such asan onset date after a report date were corrected wherepossible and duplicate records deleted, in consultationwith the States and Territories.
Notification rates were determined using Excel v5.0spreadsheets and the 1994 mid-year estimated residentpopulation denominator data from the Australian Bu-reau of Statistics. Data used were the estimatedpopulations of the States and Territories, the StatisticalDivisions and by age group and sex for Australia.National rates were adjusted, as appropriate, by ex-cluding the populations of States and Territories wherediseases were not notifiable or otherwise classified forthe entire year.
Most analysis of the notifications was based on the dateof report, for example, the notifications reported foreach age group and sex are those with report dates in1994. They include some notifications with onset datesin 1993 but exclude notifications with report dates in1995 and onset dates in 1994. For analysis of seasonaltrends, notifications have been reported by month ofonset, and notifications with 1994 onset which werereported in 1995 have been differentiated in the graphs.These notifications reported in 1995 have not been con-firmed by the States and Territories and are regardedas provisional.
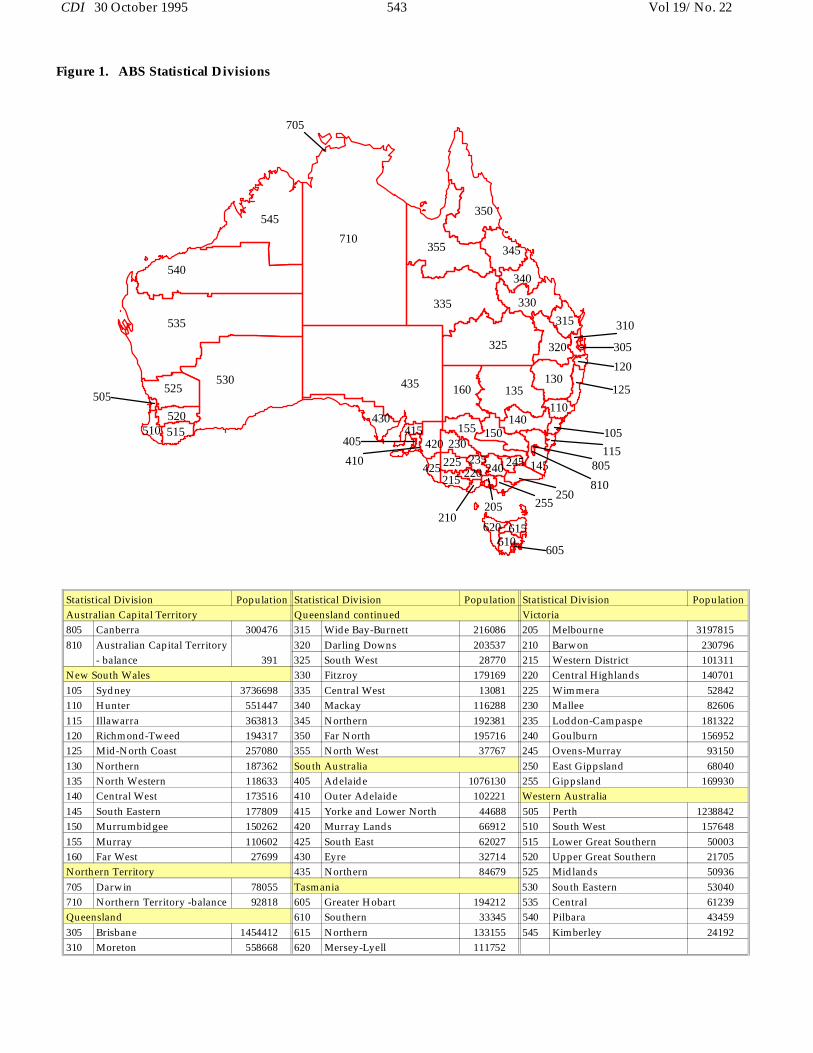
Notifications were allocated to the Australian Bureauof Statistics’ Statistical Divisions (Figure 1) for mapping
Vol 19/No. 22 542 CDI 30 October 1995
505
520510 515
530525
710
545
705
340
345
540
535
405
410
415430
215425 225
230420
210
350
355
335
160
155
220235
435 130
205
620
240 245
610615
135
150140
325
330
255250
605
320
315
805145
810
105115
110125
310
305
120
Figure 1. ABS Statistical Divisions
Statistical Division Population Statistical Division Population Statistical Division PopulationAustralian Capital Territory Queensland continued Victoria805 Canberra 300476 315 Wide Bay-Burnett 216086 205 Melbourne 3197815810 Australian Capital Territory 320 Darling Downs 203537 210 Barwon 230796
- balance 391 325 South West 28770 215 Western District 101311New South Wales 330 Fitzroy 179169 220 Central Highlands 140701105 Sydney 3736698 335 Central West 13081 225 Wimmera 52842110 Hunter 551447 340 Mackay 116288 230 Mallee 82606115 Illawarra 363813 345 Northern 192381 235 Loddon-Campaspe 181322120 Richmond-Tweed 194317 350 Far North 195716 240 Goulburn 156952125 Mid-North Coast 257080 355 North West 37767 245 Ovens-Murray 93150130 Northern 187362 South Australia 250 East Gippsland 68040135 North Western 118633 405 Adelaide 1076130 255 Gippsland 169930140 Central West 173516 410 Outer Adelaide 102221 Western Australia145 South Eastern 177809 415 Yorke and Lower North 44688 505 Perth 1238842150 Murrumbidgee 150262 420 Murray Lands 66912 510 South West 157648155 Murray 110602 425 South East 62027 515 Lower Great Southern 50003160 Far West 27699 430 Eyre 32714 520 Upper Great Southern 21705Northern Territory 435 Northern 84679 525 Midlands 50936705 Darwin 78055 Tasmania 530 South Eastern 53040710 Northern Territory -balance 92818 605 Greater Hobart 194212 535 Central 61239Queensland 610 Southern 33345 540 Pilbara 43459305 Brisbane 1454412 615 Northern 133155 545 Kimberley 24192310 Moreton 558668 620 Mersey-Lyell 111752
CDI 30 October 1995 543 Vol 19/No. 22
using postcodes of residence of the patients. Postcodeswere not available for most of the Northern Territory’snotifications, so the mapped notification rates are forthe Northern Territory as a whole. Numerator anddenominator data for the two Statistical Divisions in theAustralian Capital Territory were combined, as thepopulation for the Australian Capital Territory balanceStatistical Division was small, and rates mapped for thejurisdiction as a whole. In South Australia, numeratorand denominator data were similarly combined forchlamydial infection, gonococcal infection and syphilisfor the Statistical Divisions of Northern, Yorke andLower North, and Eyre, and for the Statistical Divisionsof South East and Murraylands.
Maps were prepared using Map Info v1.0 and graphsusing Quattro Pro v1.0.
Notes on interpretation
The notifications compiled by the NNDSS may be in-fluenced by a number of factors which should beconsidered when interpreting the data. The proportionof all cases notified (case ascertainment or sensitivity)is unknown, and may vary from disease to disease,from State to State and with time. Methods of surveil-lance vary, with differing requirements for notificationby diagnosing doctors, laboratories and hospitals.There may be better case ascertainment for diseases forwhich laboratory confirmation is necessary in jurisdic-tions which have mandatory reporting by laboratories.Conversely, diseases which can be only clinically diag-nosed may be underestimated in jurisdictions which donot require cases other than laboratory-confirmedcases to be notified, or they may be overestimated ifclinical case definitions are not highly specific for thedisease. For some diseases such as hepatitis B, manyinfections are asymptomatic and are not diagnosed orreported. There may be better case ascertainment forrarer, more serious diseases than for common diseaseswithout frequent serious sequelae. Additionally, al-though the NHMRC has recommended uniformsurveillance case definitions3, the States and Territoriesmay use definitions suited to local purposes or predat-ing the NHMRC definitions.
The undetermined sensitivities and specificities of theSystem mean that comparisons of notification ratesreported for different diseases, for the States and Terri-tories and for different reporting years should be madewith caution.
Postcode information is well reported but, as it is usu-ally the postcode of residence, it may not alwaysrepresent the place of acquisition or diagnosis of thedisease or the area in which public health actions weretaken in response to the notification. Duplicate check-ing between the State datasets was not possible so theremay be some duplicate reports if patients moved fromone jurisdiction to another and were notified in both.In some cases, mapped notification rates may be higherthan notification rates reported for the States and Ter-ritories as the former is based on postcode informationand the latter on reporting State or Territory. SomeStatistical Divisions have small populations (Figure 1),
so small numbers of cases may be reflected as highnotification rates in these areas.
The data are limited as they do not include risk factorinformation other than age, sex, Aboriginality andpostcode of residence. Age and sex are well reported,but the completeness of Aboriginality information var-ies by disease and from State to State. Other risk factorinformation is compiled in datasets supplementary tothe NNDSS, for Haemophilus influenzae type b infection,tuberculosis, non-tuberculosis mycobacterial infectionand hepatitis C only, and are reported separately.
Some States and Territories reported notifications ofHIV infection and non-tuberculosis mycobacterial in-fection in addition to the diseases included inthis report. National HIV and AIDS surveillance isconducted by the National Centre in HIV Epidemiol-ogy and Clinical Research, who have reportedseparately7. The non-tuberculosis mycobacterial infec-tion notifications are included in the NationalMycobacterial Surveillance System which also reportsseparately.
Notifications overall
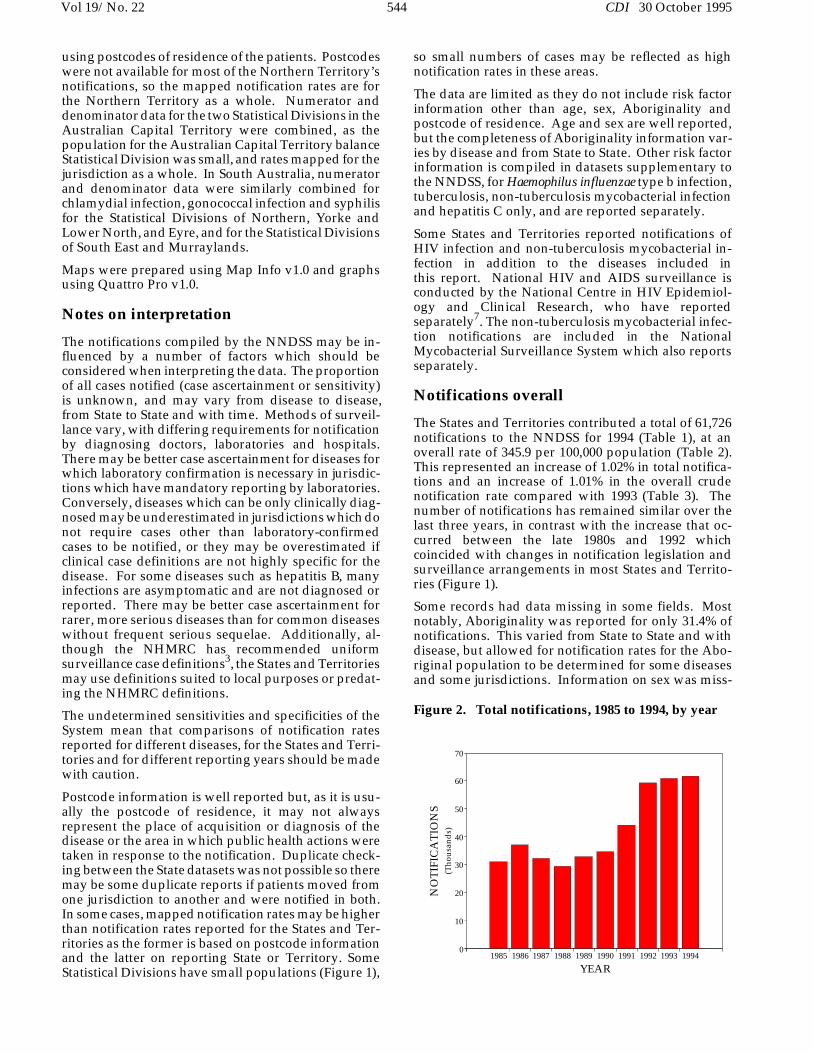
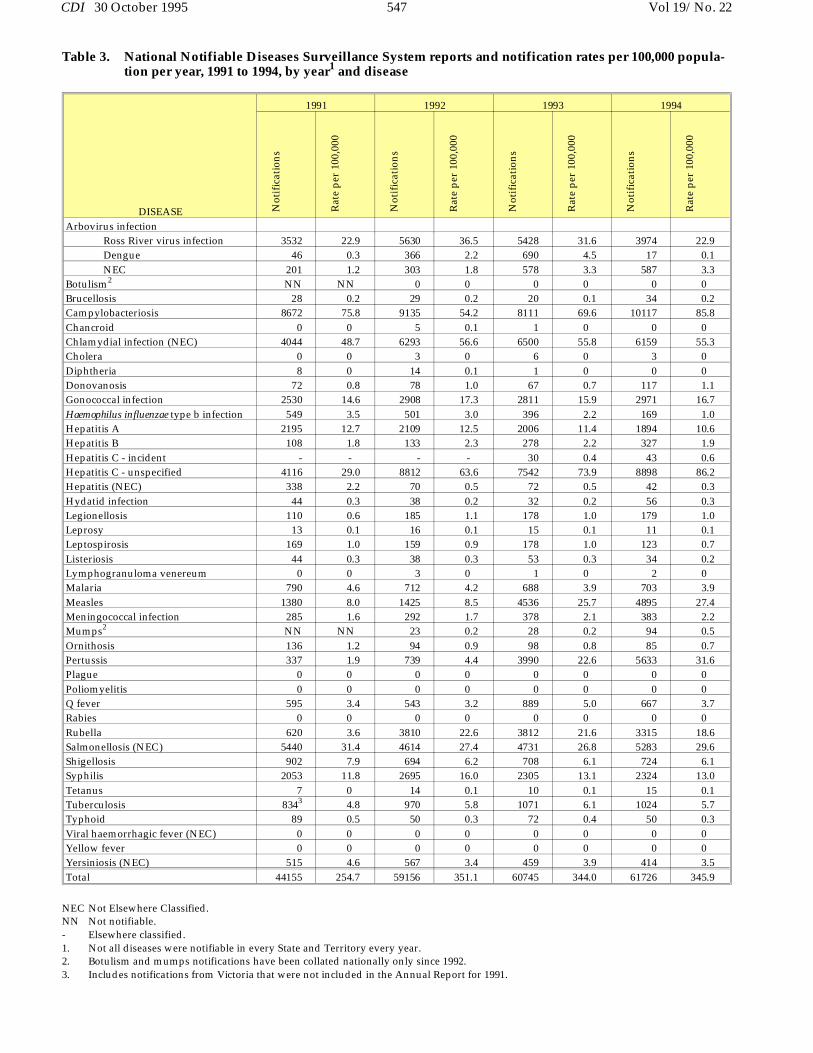
The States and Territories contributed a total of 61,726notifications to the NNDSS for 1994 (Table 1), at anoverall rate of 345.9 per 100,000 population (Table 2).This represented an increase of 1.02% in total notifica-tions and an increase of 1.01% in the overall crudenotification rate compared with 1993 (Table 3). Thenumber of notifications has remained similar over thelast three years, in contrast with the increase that oc-curred between the late 1980s and 1992 whichcoincided with changes in notification legislation andsurveillance arrangements in most States and Territo-ries (Figure 1).
Some records had data missing in some fields. Mostnotably, Aboriginality was reported for only 31.4% ofnotifications. This varied from State to State and withdisease, but allowed for notification rates for the Abo-riginal population to be determined for some diseasesand some jurisdictions. Information on sex was miss-
1985 1986 1987 1988 1989 1990 1991 1992 1993 1994
YEAR
0
10
20
30
40
50
60
70
(Tho
usan
ds)
NO
TIF
ICA
TIO
NS
Figure 2. Total notifications, 1985 to 1994, by year
Vol 19/No. 22 544 CDI 30 October 1995

DISEASE ACT NSW NT Qld SA Tas Vic WA TotalArbovirus infection
Ross River virus infection 1 337 312 3141 28 - 58 97 3974Dengue1 0 0 6 3 1 - 6 1 17NEC2 0 46 34 457 0 24 17 9 587
Botulism 0 - NN NN 0 0 0 NN 0Brucellosis 0 4 0 27 0 0 3 0 34Campylobacteriosis3 308 - 324 2109 2318 503 3479 1076 10117Chancroid 0 0 0 0 NN 0 0 0 0Chlamydial infection (NEC) 93 NN 722 2524 732 295 1306 847 6519Cholera 0 0 0 2 0 0 1 0 3Diphtheria 0 0 0 0 0 0 0 0 0Donovanosis 0 NN 68 30 NN 0 0 19 117Gonococcal infection4 8 358 736 708 156 8 154 843 2971Haemophilus influenzae type b infection 1 63 1 38 19 4 32 11 169Hepatitis A 17 561 68 803 54 10 154 227 1894Hepatitis B - 81 26 49 34 2 96 39 327Hepatitis C - incident5 6 33 - - 4 - - - 43Hepatitis C - unspecified5 428 301 3177 538 3523 1416 8898Hepatitis (NEC) 0 5 0 15 4 0 18 NN 42Hydatid infection 2 20 1 8 3 1 19 2 56Legionellosis 0 62 5 21 26 1 44 20 179Leprosy 0 3 1 2 0 0 3 2 11Leptospirosis 1 13 2 59 5 3 40 0 123Listeriosis 1 8 0 13 3 0 8 1 34Lymphogranuloma venereum 0 NN 0 0 NN 0 2 NN 2Malaria 24 188 40 297 31 13 83 27 703Measles 114 1484 402 2483 70 32 177 133 4895Meningococcal infection 7 142 5 92 19 5 58 55 383Mumps6 5 10 3 NN 7 NN 62 7 94Ornithosis 1 NN 0 3 19 3 57 2 85Pertussis 19 1516 138 1937 982 26 447 568 5633Plague 0 0 0 0 0 NN 0 0 0Poliomyelitis 0 0 0 0 0 0 0 0 0Q fever 0 267 0 286 29 0 77 8 667Rabies 0 NN 0 0 0 0 0 0 0Rubella7 51 123 49 2053 81 0 211 747 3315Salmonellosis (NEC) 44 1053 475 1450 488 119 1055 599 5283Shigellosis3 8 - 127 148 63 2 87 289 724Syphilis 16 1016 451 549 43 2 143 104 2324Tetanus 0 4 0 0 8 0 1 2 15Tuberculosis 9 409 31 113 57 14 309 82 1024Typhoid 1 17 3 2 2 2 7 16 50Viral haemorrhagic fever (NEC) 0 0 0 0 0 0 0 0 0Yellow fever 0 0 0 0 0 0 0 0 0Yersiniosis (NEC)3 0 - 1 291 97 1 21 3 414Total 1165 7823 4332 22890 5450 1123 11758 7252 61726
Table 1. National Notifiable Diseases Surveillance System reports, 1994, by State or Territory and disease
4. Northern Territory, Queensland, South Australia and Victoria: includes gonococcal neonatal ophthalmia.5. States and Territories reported notifications of incident cases only and/or all notifications.6. Northern Territory: compiled since September 1994 and
notifiable since 22 December 1994.7. Tasmania: congenital rubella syndrome only.8. A further 241 cases of unspecified hepatitis C were notified in
Tasmania but not reported to the NNDSS for incorporationinto the national dataset.
NN Not Notifiable.NEC Not Elsewhere Classified.- Elsewhere classified.1. Western Australia: notifiable since 24 June 1994.2. Tasmania: includes Ross River virus infection
and dengue. 3. New South Wales: only as ’foodborne disease’ or ’gastroenteritis in an institution’.
CDI 30 October 1995 545 Vol 19/No. 22

DISEASE ACT NSW NT Qld SA Tas Vic WA TotalArbovirus infection
Ross River virus infection 0.3 5.6 182.3 98.3 1.9 - 1.3 5.7 22.9Dengue1 0 0 3.5 0.1 0.1 - 0.1 0.1 0.1NEC2 0 0.8 19.9 14.3 0 5.1 0.4 0.5 3.3
Botulism 0 - NN NN 0 0 0 NN 0Brucellosis 0 0.1 0 0.8 0 0 0.1 0 0.2Campylobacteriosis3 102.4 - 189.3 66.0 157.7 106.5 77.7 63.2 85.8Chancroid 0 0 0 0 NN 0 0 0 0Chlamydial infection (NEC) 30.9 NN 421.9 79.0 49.8 62.5 29.2 49.8 55.3Cholera 0 0 0 0.1 0 0 0 0 0Diphtheria 0 0 0 0 0 0 0 0 0Donovanosis 0 NN 39.7 1.0 NN 0 0 1.1 1.1Gonococcal infection4 2.7 5.9 430.1 22.2 10.6 1.7 3.4 49.5 16.7Haemophilus influenzae type b infection 0.3 1.0 0.6 1.2 1.3 0.9 0.7 0.7 1.0Hepatitis A 5.7 9.3 39.7 25.1 3.7 2.1 3.4 13.3 10.6Hepatitis B - 1.3 15.2 1.5 2.3 0.4 2.1 2.3 1.9Hepatitis C - incident5 2.0 0.6 - - 0.3 - - - 0.6Hepatitis C - unspecified5 142.2 175.9 99.4 11.2 78.7 83.2 86.2Hepatitis (NEC) 0 0.1 0 0.5 0.3 0 0.4 NN 0.3Hydatid infection 0.7 0.3 0.6 0.3 0.2 0.2 0.4 0.1 0.3Legionellosis 0 1.0 2.9 0.7 1.8 0.2 1.0 1.1 1.0Leprosy 0 0.1 0.6 0.1 0 0 0.1 0.1 0.1Leptospirosis 0.3 0.2 1.2 1.9 0.3 0.6 0.9 0 0.7Listeriosis 0.3 0.1 0 0.4 0.2 0 0.2 0.1 0.2Lymphogranuloma venereum 0 NN 0 0 NN 0 0.4 NN 0Malaria 8.0 3.1 23.4 9.3 2.1 2.8 1.9 1.6 3.9Measles 37.9 24.5 234.9 77.7 4.8 6.8 4.0 7.8 27.4Meningococcal infection 2.3 2.4 2.9 2.9 1.3 1.1 1.3 3.2 2.2Mumps6 1.7 0.2 1.8 NN 0.5 NN 1.4 0.4 0.5Ornithosis 0.3 NN 0 0.1 1.3 0.6 1.3 0.1 0.7Pertussis 6.3 25.1 80.6 60.6 66.8 5.5 10.0 33.4 31.6Plague 0 0 0 0 0 NN 0 0 0Poliomyelitis 0 0 0 0 0 0 0 0 0Q fever 0 4.4 0 9.0 2.0 0 1.7 0.5 3.7Rabies 0 NN 0 0 0 0 0 0 0Rubella7 17.0 2.0 28.6 64.2 5.5 0 4.7 43.9 18.6Salmonellosis (NEC) 14.6 17.4 277.6 45.4 33.2 25.2 23.6 35.2 29.6Shigellosis3 2.7 - 74.2 4.6 4.3 0.4 1.9 17.0 6.1Syphilis 5.3 16.8 263.5 17.2 2.9 0.4 3.2 6.1 13.0Tetanus 0 0.1 0 0 0.5 0 0 0.1 0.1Tuberculosis 3.0 6.8 18.1 3.5 3.9 3.0 6.9 4.8 5.7Typhoid 0.3 0.3 1.8 0.1 0.1 0.4 0.2 0.9 0.3Viral haemorrhagic fever (NEC) 0 0 0 0 0 0 0 0 0Yellow fever 0 0 0 0 0 0 0 0 0Yersiniosis (NEC)3 0 - 0.6 9.1 6.6 0.2 0.5 0.2 3.5Total 387.2 129.3 2531.4 716.0 366.2 237.7 262.7 426.1 345.9
Table 2. National Notifiable Disease Surveillance System notification rates per 100,000 population, 1994, byState or Territory and disease
NN Not Notifiable.NEC Not Elsewhere Classified.- Elsewhere classified.1. Western Australia: notifiable since 24 June 1994.2. Tasmania: includes Ross River virus infection
and dengue. 3. New South Wales: only as ’foodborne disease’ or ’gastroenteritis in an institution’.
4. Northern Territory, Queensland, South Australia and Victoria: includes gonococcal neonatal ophthalmia.5. States and Territories reported notifications of incident cases only and/or all notifications.6. Northern Territory: compiled since September 1994 and
notifiable since 22 December 1994.7. Tasmania: congenital rubella syndrome only.
Vol 19/No. 22 546 CDI 30 October 1995
1991 1992 1993 1994
DISEASE Not
ific
atio
ns
Rat
e p
er 1
00,0
00
Not
ific
atio
ns
Rat
e p
er 1
00,0
00
Not
ific
atio
ns
Rat
e p
er 1
00,0
00
Not
ific
atio
ns
Rat
e p
er 1
00,0
00
Arbovirus infectionRoss River virus infection 3532 22.9 5630 36.5 5428 31.6 3974 22.9Dengue 46 0.3 366 2.2 690 4.5 17 0.1NEC 201 1.2 303 1.8 578 3.3 587 3.3
Botulism2 NN NN 0 0 0 0 0 0Brucellosis 28 0.2 29 0.2 20 0.1 34 0.2Campylobacteriosis 8672 75.8 9135 54.2 8111 69.6 10117 85.8Chancroid 0 0 5 0.1 1 0 0 0Chlamydial infection (NEC) 4044 48.7 6293 56.6 6500 55.8 6159 55.3Cholera 0 0 3 0 6 0 3 0Diphtheria 8 0 14 0.1 1 0 0 0Donovanosis 72 0.8 78 1.0 67 0.7 117 1.1Gonococcal infection 2530 14.6 2908 17.3 2811 15.9 2971 16.7Haemophilus influenzae type b infection 549 3.5 501 3.0 396 2.2 169 1.0Hepatitis A 2195 12.7 2109 12.5 2006 11.4 1894 10.6Hepatitis B 108 1.8 133 2.3 278 2.2 327 1.9Hepatitis C - incident - - - - 30 0.4 43 0.6Hepatitis C - unspecified 4116 29.0 8812 63.6 7542 73.9 8898 86.2Hepatitis (NEC) 338 2.2 70 0.5 72 0.5 42 0.3Hydatid infection 44 0.3 38 0.2 32 0.2 56 0.3Legionellosis 110 0.6 185 1.1 178 1.0 179 1.0Leprosy 13 0.1 16 0.1 15 0.1 11 0.1Leptospirosis 169 1.0 159 0.9 178 1.0 123 0.7Listeriosis 44 0.3 38 0.3 53 0.3 34 0.2Lymphogranuloma venereum 0 0 3 0 1 0 2 0Malaria 790 4.6 712 4.2 688 3.9 703 3.9Measles 1380 8.0 1425 8.5 4536 25.7 4895 27.4Meningococcal infection 285 1.6 292 1.7 378 2.1 383 2.2Mumps2 NN NN 23 0.2 28 0.2 94 0.5Ornithosis 136 1.2 94 0.9 98 0.8 85 0.7Pertussis 337 1.9 739 4.4 3990 22.6 5633 31.6Plague 0 0 0 0 0 0 0 0Poliomyelitis 0 0 0 0 0 0 0 0Q fever 595 3.4 543 3.2 889 5.0 667 3.7Rabies 0 0 0 0 0 0 0 0Rubella 620 3.6 3810 22.6 3812 21.6 3315 18.6Salmonellosis (NEC) 5440 31.4 4614 27.4 4731 26.8 5283 29.6Shigellosis 902 7.9 694 6.2 708 6.1 724 6.1Syphilis 2053 11.8 2695 16.0 2305 13.1 2324 13.0Tetanus 7 0 14 0.1 10 0.1 15 0.1Tuberculosis 8343 4.8 970 5.8 1071 6.1 1024 5.7Typhoid 89 0.5 50 0.3 72 0.4 50 0.3Viral haemorrhagic fever (NEC) 0 0 0 0 0 0 0 0Yellow fever 0 0 0 0 0 0 0 0Yersiniosis (NEC) 515 4.6 567 3.4 459 3.9 414 3.5Total 44155 254.7 59156 351.1 60745 344.0 61726 345.9
NEC Not Elsewhere Classified.NN Not notifiable.- Elsewhere classified.1. Not all diseases were notifiable in every State and Territory every year.2. Botulism and mumps notifications have been collated nationally only since 1992.3. Includes notifications from Victoria that were not included in the Annual Report for 1991.
Table 3. National Notifiable Diseases Surveillance System reports and notification rates per 100,000 popula-tion per year, 1991 to 1994, by year1 and disease
CDI 30 October 1995 547 Vol 19/No. 22

ing for 601 notifications (0.97%), age for 900 (1.45%),and postcode of residence for 2314 (3.75%). The pro-portion of reports with missing data in these fields alsovaried by State and disease.
The highest number of notifications was contributed byQueensland (22,890 or 37.1% of the total for Australia).There was an increase in notifications from the Austra-lian Capital Territory, the Northern Territory,Queensland, Victoria and Western Australia comparedwith 1993, and decreases for the other States (Figure 2).The highest overall crude notification rates were for theNorthern Territory (2531.4 per 100,000, compared with2161.9 in 1993) and Queensland (716.0 per 100,000,compared with 678.1 in 1993). Differences in the dis-eases which are notifiable, in surveillance methods andin the incidence of disease contribute to these differ-ences in notification rates between jurisdictions andreporting years.
The highest number of reports was received for cam-pylobacteriosis (10,117 notifications), unspecifiedhepatitis C (8898) and chlamydial infection, not else-where classified (6519), giving notification rates of 85.8per 100,000, 86.2 per 100,000, and 55.3 per 100,000 re-spectively. Disease-specific notification rates variedwidely by jurisdiction, with the highest crude ratesreported from the Northern Territory for gonococcalinfection (430.1 per 100,000) and for chlamydial infec-tion, not elsewhere classified (421.9 per 100,000).
There have been marked changes in notification totalsand crude notification rates for several diseases duringthe four years in which the NNDSS has been operatingin its current format (Table 3). Most marked have beenthe decrease in Haemophilus influenzae type b infectionnotification rates over the four year period, the de-crease in dengue notifications for 1994 compared with1992 and 1993, and the increases in notification rates forarbovirus, not elsewhere classified, meningococcal in-fection and pertussis since 1991.
The remainder of this report describes the individualnotifiable diseases in the order presented in Table 1.
Arbovirus infection - Ross River virus infection
There were 3974 notifications of Ross River virus infec-tion in 1994. The annual adjusted rate of 22.9 per 100,000population was lower than that in 1993 (31.6 per 100,000population) and 1992 (36.5 per 100,000 population) butthe same as that in 1991.
As in previous years there was a marked seasonal trendwith the highest number of notifications having onsetdates in February (819) and March (1021) (Figure 4).
The proportion of cases in males and females wasapproximately the same with a male:female ratio of1.0:1.1. As seen in previous years, there was a bellshaped age distribution curve with the peak notifica-tion rates in the 30-54 years age group (Figure 5).
The highest rates of notification were reported for Sta-tistical Divisions in Queensland and the NorthernTerritory with the highest rates recorded for Northern
Jan Feb Mar Apr May Jun Jul Aug Sep Oct Nov Dec
MONTH
0
200
400
600
800
1000
1200
NO
TIF
ICA
TIO
NS
Reported in 1995
Reported in 1994
Figure 4. Notifications of Ross River virus infec-tion with onset dates in 1994, by monthof onset
1991
1992
1993
1994
ACT NSW NT QLD SA TAS VIC WA
STATE OR TERRITORY
0
5
10
15
20
25
(Tho
usan
ds)
NO
TIF
ICA
TIO
NS
Figure 3. Total notifications, 1991 to 1994, by yearand State or Territory
0-45-9
10-1415-19
20-2425-29
30-3435-39
40-4445-49
50-5455-59
60-6465-69
70-7475-79
80-8585+
AGE GROUP (YEARS)
0
5
10
15
20
25
30
35
40
45
50
NO
TIF
ICA
TIO
N R
AT
E
Males
Females
Figure 5. Annual adjusted rate of notification ofRoss River virus infection per 100,000population, 1994, by age group and sex
Vol 19/No. 22 548 CDI 30 October 1995
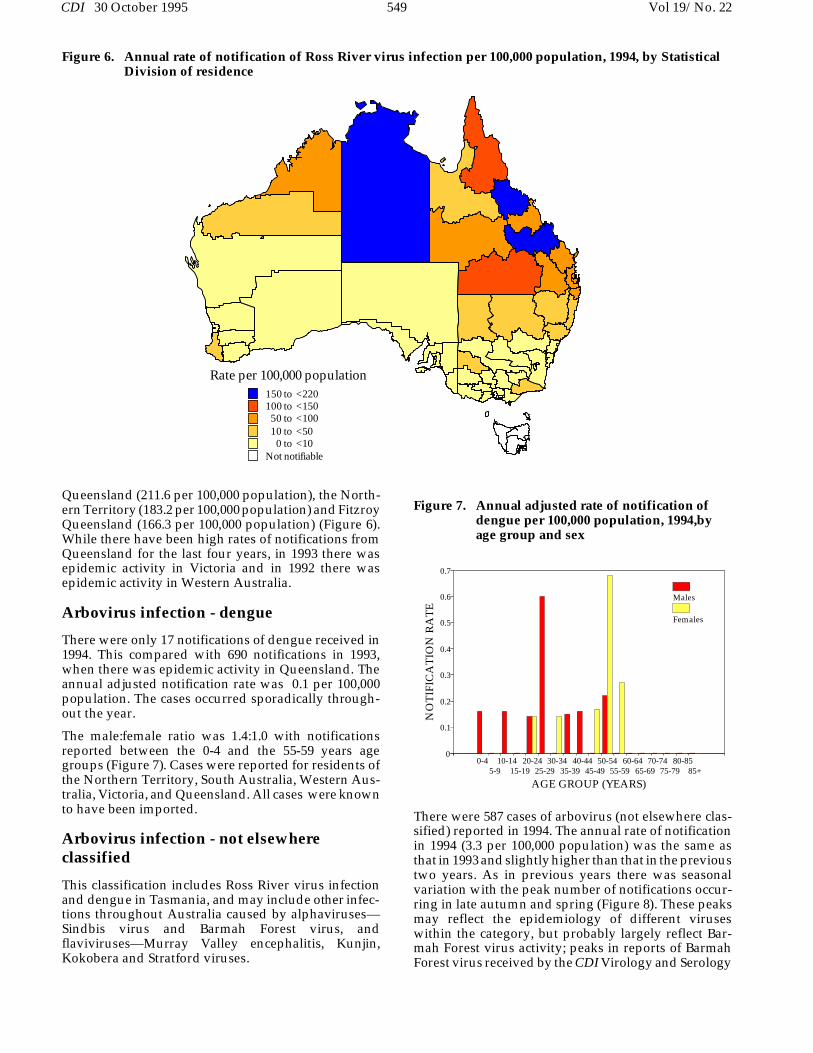
Queensland (211.6 per 100,000 population), the North-ern Territory (183.2 per 100,000 population) and FitzroyQueensland (166.3 per 100,000 population) (Figure 6).While there have been high rates of notifications fromQueensland for the last four years, in 1993 there wasepidemic activity in Victoria and in 1992 there wasepidemic activity in Western Australia.
Arbovirus infection - dengue
There were only 17 notifications of dengue received in1994. This compared with 690 notifications in 1993,when there was epidemic activity in Queensland. Theannual adjusted notification rate was 0.1 per 100,000population. The cases occurred sporadically through-out the year.
The male:female ratio was 1.4:1.0 with notificationsreported between the 0-4 and the 55-59 years agegroups (Figure 7). Cases were reported for residents ofthe Northern Territory, South Australia, Western Aus-tralia, Victoria, and Queensland. All cases were knownto have been imported.
Arbovirus infection - not elsewhere classified
This classification includes Ross River virus infectionand dengue in Tasmania, and may include other infec-tions throughout Australia caused by alphaviruses—Sindbis virus and Barmah Forest virus, andflaviviruses—Murray Valley encephalitis, Kunjin,Kokobera and Stratford viruses.
There were 587 cases of arbovirus (not elsewhere clas-sified) reported in 1994. The annual rate of notificationin 1994 (3.3 per 100,000 population) was the same asthat in 1993 and slightly higher than that in the previoustwo years. As in previous years there was seasonalvariation with the peak number of notifications occur-ring in late autumn and spring (Figure 8). These peaksmay reflect the epidemiology of different viruseswithin the category, but probably largely reflect Bar-mah Forest virus activity; peaks in reports of BarmahForest virus received by the CDI Virology and Serology
Figure 6. Annual rate of notification of Ross River virus infection per 100,000 population, 1994, by StatisticalDivision of residence
0-45-9
10-1415-19
20-2425-29
30-3435-39
40-4445-49
50-5455-59
60-6465-69
70-7475-79
80-8585+
AGE GROUP (YEARS)
0
0.1
0.2
0.3
0.4
0.5
0.6
0.7
NO
TIF
ICA
TIO
N R
AT
E
Males
Females
Figure 7. Annual adjusted rate of notification ofdengue per 100,000 population, 1994,byage group and sex
Rate per 100,000 population150 to <220100 to <15050 to <10010 to <50
0 to <10Not notifiable
CDI 30 October 1995 549 Vol 19/No. 22
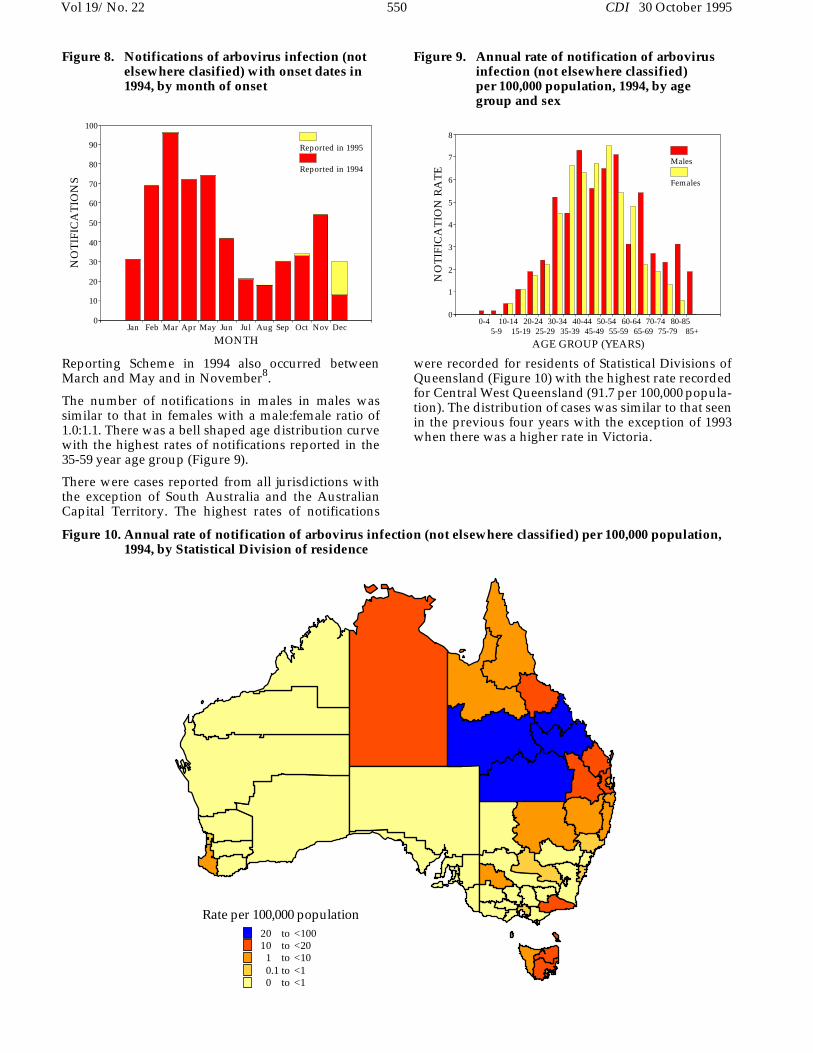
Reporting Scheme in 1994 also occurred betweenMarch and May and in November8.
The number of notifications in males in males wassimilar to that in females with a male:female ratio of1.0:1.1. There was a bell shaped age distribution curvewith the highest rates of notifications reported in the35-59 year age group (Figure 9).
There were cases reported from all jurisdictions withthe exception of South Australia and the AustralianCapital Territory. The highest rates of notifications
were recorded for residents of Statistical Divisions ofQueensland (Figure 10) with the highest rate recordedfor Central West Queensland (91.7 per 100,000 popula-tion). The distribution of cases was similar to that seenin the previous four years with the exception of 1993when there was a higher rate in Victoria.
Figure 10. Annual rate of notification of arbovirus infection (not elsewhere classified) per 100,000 population,1994, by Statistical Division of residence
Jan Feb Mar Apr May Jun Jul Aug Sep Oct Nov Dec
MONTH
0
10
20
30
40
50
60
70
80
90
100
NO
TIF
ICA
TIO
NS
Reported in 1995
Reported in 1994
Figure 8. Notifications of arbovirus infection (notelsewhere clasified) with onset dates in1994, by month of onset
0-45-9
10-1415-19
20-2425-29
30-3435-39
40-4445-49
50-5455-59
60-6465-69
70-7475-79
80-8585+
AGE GROUP (YEARS)
0
1
2
3
4
5
6
7
8
NO
TIF
ICA
TIO
N R
AT
E
Males
Females
Figure 9. Annual rate of notification of arbovirusinfection (not elsewhere classified) per 100,000 population, 1994, by agegroup and sex
Rate per 100,000 population20 to <10010 to <20
1 to <100.1 to <10 to <1
Vol 19/No. 22 550 CDI 30 October 1995
Botulism
There were no cases of botulism reported in 1994.There have been no notifications of this disease re-ported since the NNDSS began surveillance in 1992.
Brucellosis
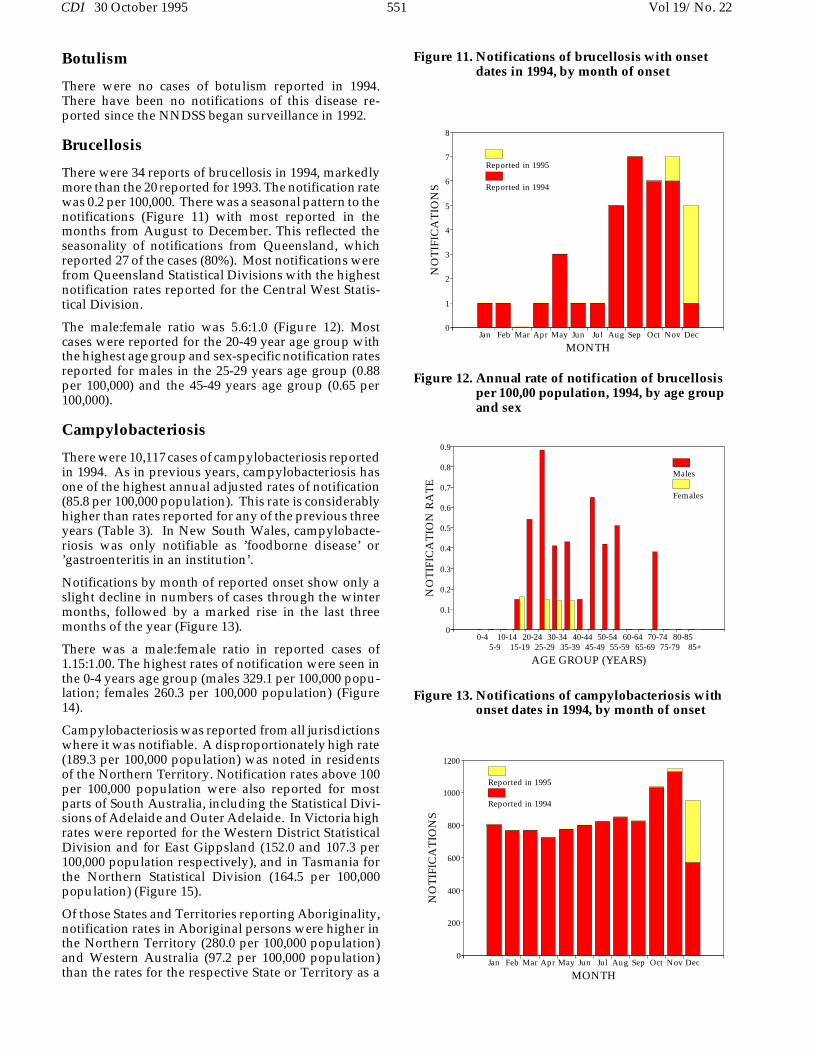
There were 34 reports of brucellosis in 1994, markedlymore than the 20 reported for 1993. The notification ratewas 0.2 per 100,000. There was a seasonal pattern to thenotifications (Figure 11) with most reported in themonths from August to December. This reflected theseasonality of notifications from Queensland, whichreported 27 of the cases (80%). Most notifications werefrom Queensland Statistical Divisions with the highestnotification rates reported for the Central West Statis-tical Division.
The male:female ratio was 5.6:1.0 (Figure 12). Mostcases were reported for the 20-49 year age group withthe highest age group and sex-specific notification ratesreported for males in the 25-29 years age group (0.88per 100,000) and the 45-49 years age group (0.65 per100,000).
Campylobacteriosis
There were 10,117 cases of campylobacteriosis reportedin 1994. As in previous years, campylobacteriosis hasone of the highest annual adjusted rates of notification(85.8 per 100,000 population). This rate is considerablyhigher than rates reported for any of the previous threeyears (Table 3). In New South Wales, campylobacte-riosis was only notifiable as ’foodborne disease’ or’gastroenteritis in an institution’.
Notifications by month of reported onset show only aslight decline in numbers of cases through the wintermonths, followed by a marked rise in the last threemonths of the year (Figure 13).
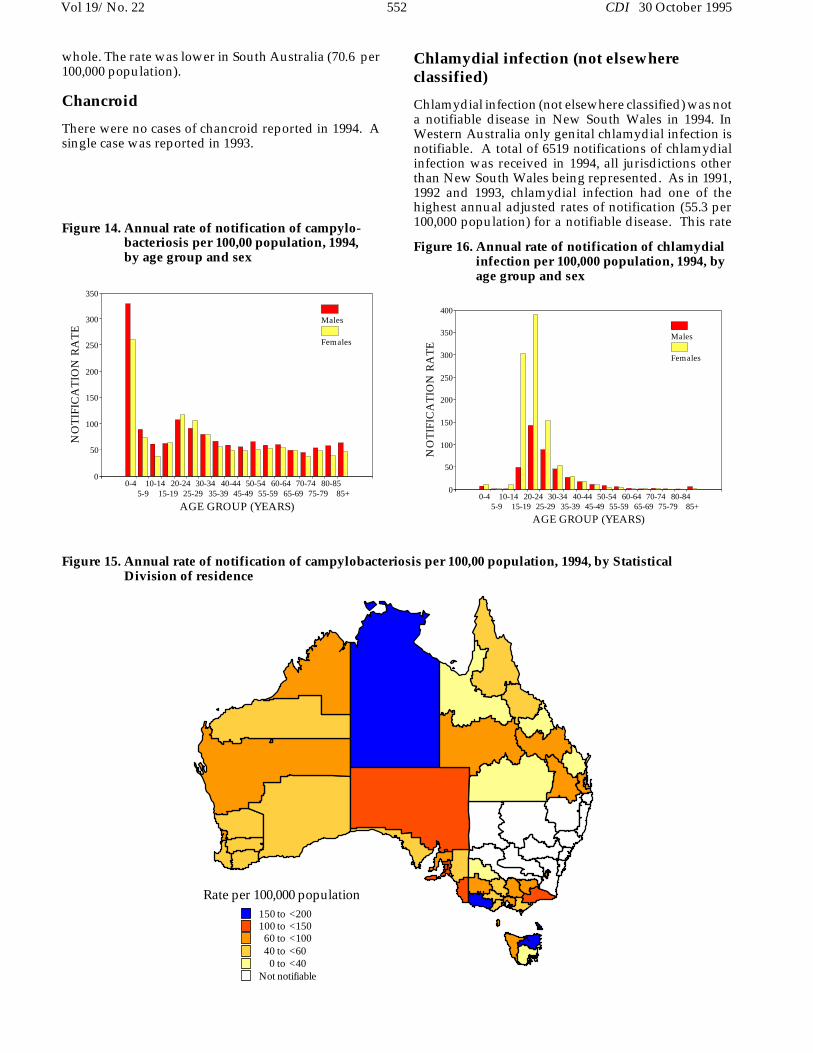
There was a male:female ratio in reported cases of1.15:1.00. The highest rates of notification were seen inthe 0-4 years age group (males 329.1 per 100,000 popu-lation; females 260.3 per 100,000 population) (Figure14).
Campylobacteriosis was reported from all jurisdictionswhere it was notifiable. A disproportionately high rate(189.3 per 100,000 population) was noted in residentsof the Northern Territory. Notification rates above 100per 100,000 population were also reported for mostparts of South Australia, including the Statistical Divi-sions of Adelaide and Outer Adelaide. In Victoria highrates were reported for the Western District StatisticalDivision and for East Gippsland (152.0 and 107.3 per100,000 population respectively), and in Tasmania forthe Northern Statistical Division (164.5 per 100,000population) (Figure 15).
Of those States and Territories reporting Aboriginality,notification rates in Aboriginal persons were higher inthe Northern Territory (280.0 per 100,000 population)and Western Australia (97.2 per 100,000 population)than the rates for the respective State or Territory as a
Jan Feb Mar Apr May Jun Jul Aug Sep Oct Nov Dec
MONTH
0
1
2
3
4
5
6
7
8
NO
TIF
ICA
TIO
NS
Reported in 1995
Reported in 1994
Figure 11. Notifications of brucellosis with onsetdates in 1994, by month of onset
0-45-9
10-1415-19
20-2425-29
30-3435-39
40-4445-49
50-5455-59
60-6465-69
70-7475-79
80-8585+
AGE GROUP (YEARS)
0
0.1
0.2
0.3
0.4
0.5
0.6
0.7
0.8
0.9
NO
TIF
ICA
TIO
N R
AT
E
Males
Females
Figure 12. Annual rate of notification of brucellosisper 100,00 population, 1994, by age groupand sex
Jan Feb Mar Apr May Jun Jul Aug Sep Oct Nov Dec
MONTH
0
200
400
600
800
1000
1200
NO
TIF
ICA
TIO
NS
Reported in 1995
Reported in 1994
Figure 13. Notifications of campylobacteriosis withonset dates in 1994, by month of onset
CDI 30 October 1995 551 Vol 19/No. 22
whole. The rate was lower in South Australia (70.6 per100,000 population).
Chancroid
There were no cases of chancroid reported in 1994. Asingle case was reported in 1993.
Chlamydial infection (not elsewhere classified)
Chlamydial infection (not elsewhere classified) was nota notifiable disease in New South Wales in 1994. InWestern Australia only genital chlamydial infection isnotifiable. A total of 6519 notifications of chlamydialinfection was received in 1994, all jurisdictions otherthan New South Wales being represented. As in 1991,1992 and 1993, chlamydial infection had one of thehighest annual adjusted rates of notification (55.3 per100,000 population) for a notifiable disease. This rate
Figure 15. Annual rate of notification of campylobacteriosis per 100,00 population, 1994, by Statistical Division of residence
Rate per 100,000 population150 to <200100 to <15060 to <10040 to <60
0 to <40Not notifiable
0-45-9
10-1415-19
20-2425-29
30-3435-39
40-4445-49
50-5455-59
60-6465-69
70-7475-79
80-8485+
AGE GROUP (YEARS)
0
50
100
150
200
250
300
350
400
NO
TIF
ICA
TIO
N R
AT
E
Males
Females
Figure 16. Annual rate of notification of chlamydialinfection per 100,000 population, 1994, byage group and sex
0-45-9
10-1415-19
20-2425-29
30-3435-39
40-4445-49
50-5455-59
60-6465-69
70-7475-79
80-8585+
AGE GROUP (YEARS)
0
50
100
150
200
250
300
350
NO
TIF
ICA
TIO
N R
AT
E
Males
Females
Figure 14. Annual rate of notification of campylo-bacteriosis per 100,00 population, 1994,by age group and sex
Vol 19/No. 22 552 CDI 30 October 1995

did not change substantially over the four year period(Table 3). No seasonal trend in notifications is appar-ent.
There was a male:female ratio in reported cases of1.0:2.4 with disproportionately high notification ratesof 302.6 and 389.5 per 100,000 population reported forfemales in the age groups 15-19 years and 20-24 yearsrespectively (Figure 16).
Notification rates above 200 per 100,000 populationwere reported across northern Australia, for the North-ern Territory, the Statistical Divisions of the Pilbara andKimberley in Western Australia, and the Statistical Di-visions of North West and Far North in Queensland(Figure 17).
Of those States and Territories reporting Aboriginalityfor most notifications (South Australia, Western Aus-tralia and the Northern Territory) the rates inAboriginal persons were two to eight times as high asthe rates reported for the populations of the respectiveState or Territory as a whole.
Cholera
There were three reports of cholera in 1994, two fromQueensland and one from Victoria. All cases weremale, one in the 0-4 year age group, one in the 25-29year age group and one in the 60-65 year age group.One case was thought to have been acquired in Bali andone in El Salvador.
Diphtheria
There were no cases of diphtheria reported for 1994.This was the first year since 1979 that there were nonotifications of this disease.
Donovanosis
Donovanosis was not a notifiable disease in New SouthWales or South Australia in 1994. A total of 117 notifi-cations was received from Queensland, WesternAustralia and the Northern Territory (Table 1), butnone from the other States and Territories.
The male:female ratio in notified cases was 1.0:2.1 and78% of notifications were for persons in the age range15-39 years (39.8 and 28.9 per 100,000 population re-spectively).
The highest rates of notification were from the North-ern Territory and the Kimberley Statistical Division ofWestern Australia (Figure 18). In all but six of the 87cases notified from the Northern Territory and WesternAustralia, those affected were reported as Aboriginal.
Gonococcal infection
In the Northern Territory, Queensland, South Australiaand Victoria, notifications of gonococcal infection in-clude cases of gonococcal neonatal ophthalmia as wellas sexually transmitted infection. In 1994, a total of2971 notifications of gonococcal infection were re-ceived from all jurisdictions (Table 1), the annualnotification rate of 16.7 per 100,000 population being
Figure 17. Annual rate of notification of chlamydial infection per 100,000 population, 1994, by Statistical Division of residence
Rate per 100,000 population300 to <600100 to <30050 to <10020 to <50
0 to <20Not notifiable
CDI 30 October 1995 553 Vol 19/No. 22

comparable to rates observed for the previous threeyears (Table 3). No seasonal trend of notifications wasapparent.
There was wide geographical variation in the rate ofnotification of gonococcal infection (Table 2; Figure19). High notification rates (above 150 per 100,000population) were reported across northern Australia,for the Northern Territory, and the Statistical Divisionsof the Pilbara and Kimberley in Western Australia, and
of North West and Far North Queensland. The highestrate, 1864 per 100,000 population, was reported for theKimberley Statistical Division.
The male:female ratio of 2.2:1.0 was also comparable topreviously observed male:female ratios. Male notifica-tion rates were higher than female rates in all agegroups except the three youngest five year age groups,up to 14 years (Figure 20).
Figure 19. Annual rate of notification of gonococcal infection per 100,000 population, 1994, by Statistical Division of residence
Rate per 100,000 population1000 to <2000
200 to <100050 to <20010 to <50
5 to <100 to <5
0-45-9
10-1415-19
20-2425-29
30-3435-39
40-4445-49
50-5455-59
60-6465-69
70-7475-79
80-8485+
AGE GROUP (YEARS)
0
0.5
1
1.5
2
2.5
3
3.5
4
4.5
5
NO
TIF
ICA
TIO
N R
AT
E
Males
Females
Figure 18. Annual adjusted rate of notification ofdonovanosis per 100,000 population,1994, by age group and sex
0-45-9
10-1415-19
20-2425-29
30-3435-39
40-4445-49
50-5455-59
60-6465-69
70-7475-79
80-8485+
AGE GROUP (YEARS)
0
10
20
30
40
50
60
70
80
NO
TIF
ICA
TIO
N R
AT
E
Males
Females
Figure 20. Annual rate of notification of gonococcalinfection per 100,00 population, 1994, byage group and sex
Vol 19/No. 22 554 CDI 30 October 1995
Very high rates of notification were reported for Abo-riginal populations in Western Australia (1416 per100,00 population), the Northern Territory (1145 per100,000) and South Australia (495 per 100,000).
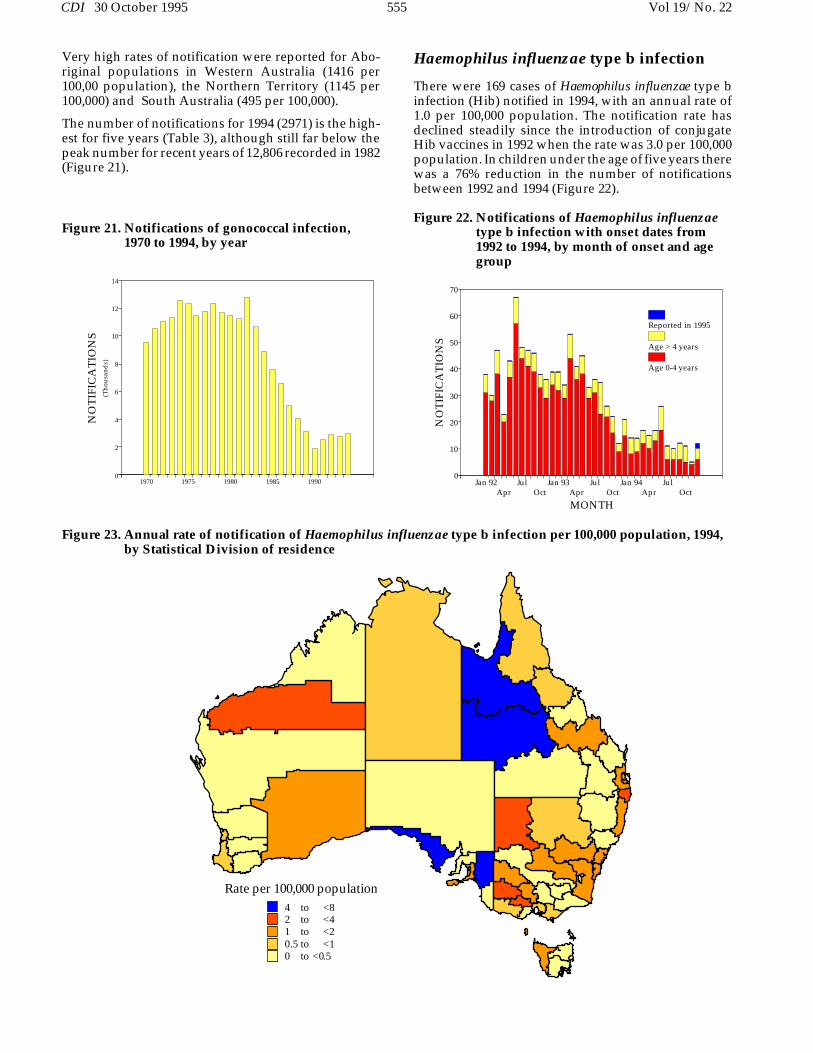
The number of notifications for 1994 (2971) is the high-est for five years (Table 3), although still far below thepeak number for recent years of 12,806 recorded in 1982(Figure 21).
Haemophilus influenzae type b infection
There were 169 cases of Haemophilus influenzae type binfection (Hib) notified in 1994, with an annual rate of1.0 per 100,000 population. The notification rate hasdeclined steadily since the introduction of conjugateHib vaccines in 1992 when the rate was 3.0 per 100,000population. In children under the age of five years therewas a 76% reduction in the number of notificationsbetween 1992 and 1994 (Figure 22).
Figure 23. Annual rate of notification of Haemophilus influenzae type b infection per 100,000 population, 1994,by Statistical Division of residence
Rate per 100,000 population4 to <82 to <41 to <20.5 to <10 to <0.5
1970 1975 1980 1985 19900
2
4
6
8
10
12
14
(Tho
usan
ds)
NO
TIF
ICA
TIO
NS
Figure 21. Notifications of gonococcal infection,1970 to 1994, by year
Jan 92Apr
JulOct
Jan 93Apr
JulOct
Jan 94Apr
JulOct
MONTH
0
10
20
30
40
50
60
70
NO
TIF
ICA
TIO
NS
Reported in 1995
Age > 4 years
Age 0-4 years
Figure 22. Notifications of Haemophilus influenzaetype b infection with onset dates from1992 to 1994, by month of onset and agegroup
CDI 30 October 1995 555 Vol 19/No. 22

Notification rates of Hib did not exceed 8.0 per 100,000population in any Statistical Division in Australia (Fig-ure 23). The highest notification rates per 100,000population were in the Statistical Divisions of CentralWest Queensland (7.6), Northwest Queensland (7.9),Eyre, South Australia (6.1) and Murraylands, SouthAustralia (6.0), but these all represented very smallnumbers of cases occurring in small populations.
The male:female ratio was 1.6:1.0. The notification ratewas highest in the 0-4 years age group with a rate of 8.4per 100,000 population, 10.0 in males and 6.8 in females(Figure 24). In 1992 the rate in the same age group was33.6 per 100,000 population. Nineteen per cent of casesoccurred in children under the age of one year com-pared with 26% in 1992.
Hepatitis A
There were 1894 notifications of hepatitis A during1994. The annual notification rate was 10.6 per 100,000population, a slight decrease on the rate of 11.4 per100,000 reported the previous year.
The highest notification rates were received from theNorthern Territory (39.7 per 100,000 population) andQueensland (25.1 per 100,00). Residents of Far Northand South West Queensland and the Murray StatisticalDivision of Victoria (Figure 25) reported higher ratesthan other parts of the country.
There was no apparent seasonal trend in the notifica-tions (Figure 26). Overall the male:female ratio was1.4:1.0. The age group specific notification rates werehighest for males in the 5-9 and 25-29 year age ranges(Figure 27) with rates of 22.3 and 24.7 per 100,000population respectively. For females the highest agegroup specific rate of 19.2 per 100,000 was reported forthe 5-9 year age group. Overall notification rates de-clined with age.
Figure 25. Annual rate of notification of hepatitis A per 100,000 population, 1994, by Statistical Division of residence
Rate per 100,000 population10 to <15
5 to <102 to <51 to <20.2 to <10 to <0.2
0-45-9
10-1415-19
20-2425-29
30-3435-39
40-4445-49
50-5455-59
60-6465-69
70-7475-79
80-8585+
AGE GROUP (YEARS)
0
1
2
3
4
5
6
7
8
9
10
11
NO
TIF
ICA
TIO
N R
AT
E
Males
Females
Figure 24. Annual rate of notification of Haemophi-lus influenzae type b infection per100,000 population, 1994, by age groupand sex
Vol 19/No. 22 556 CDI 30 October 1995

Hepatitis B
All States and Territories except the Australian CapitalTerritory reported incident cases of hepatitis B in 1994,a total of 327 being reported for the year. This corre-sponds to a notification rate of 1.9 per 100,000population and is a decrease on the rates of 2.3 and 2.2per 100,000 reported in 1992 and 1993 respectively.
Overall the Northern Territory and the Kimberley Sta-tistical Division of Western Australia reported thehighest notification rates (Figure 28).
The male:female ratio was 1.6:1.0. The highest agegroup specific notification rates were reported formales aged 20-24 years (5.3 per 100,000 population) and25-29 years (6.6 per 100,000) (Figure 29). For females thehighest rate was reported for the 15-19 year age range(5.9 per 100,000).
Hepatitis C
A total of 43 reports of incident hepatitis C was receivedfrom the Australian Capital Territory, New SouthWales and South Australia in 1994. This corresponded
Jan Feb Mar Apr May Jun Jul Aug Sep Oct Nov Dec
MONTH
0
50
100
150
200
250
NO
TIF
ICA
TIO
NS
Reported in 1995
Reported in 1994
Figure 26. Notifications of hepatitis A with onsetdates in 1994, by month of onset
Figure 28. Annual rate of notification of hepatitis B per 100,000 population, 1994, by Statistical Division of residence
Rate per 100,000 population10 to <35
5 to <102 to <51 to <20 to <1
Not notifiable
0-45-9
10-1415-19
20-2425-29
30-3435-39
40-4445-49
50-5455-59
60-6465-69
70-7475-79
80-8585+
AGE GROUP (YEARS)
0
5
10
15
20
25
30
NO
TIF
ICA
TIO
N R
AT
E
Males
Females
Figure 27. Annual rate of notification of hepatitis Aper 100,000 population, 1994, by agegroup and sex
CDI 30 October 1995 557 Vol 19/No. 22

to an adjusted annual notification rate of 0.6 per 100,000population. The male:female ratio was 1.3:1.0 and allcases were in the 20-64 year age range (Figure 30.). Asinfection with this virus is frequently asymptomaticthis is an underestimation of the incidence of hepatitisC infection.
Unspecified hepatitis C was reported mainly by thoseStates and Territories not reporting incident cases.There were 8898 cases of unspecified hepatitis C re-ported for 1994 for an annual adjusted notification rateof 86.2 per 100,000 population. As unspecified notifica-tions do not differentiate between acute, chronic andpast infection it is probable that these figures are repre-sentative of testing patterns rather than newly acquiredinfection. The male:female ratio was 1.6:1.0 and thehighest notification rates were reported for persons inthe 25-44 year age range. In contrast with the incidentcases of hepatitis C, there were cases reported in boththe less than 20 years and the more than 64 years agegroups (Figure 31).
Hepatitis (not elsewhere classified)
A total of 42 reports of other viral hepatitis were re-ceived for 1994. They may have included cases ofhepatitis D and hepatitis E.
Hydatid infection
Hydatid infection was reported for 56 patients in 1994(0.3 per 100,000), more than have been reported inrecent years. The male:female ratio was 1.75:1.0 and thehighest age group and sex-specific notification rateswere in males in the 50-54 years age group and the over80 years age group (Figure 32). There were only tworeports for persons under the age of 25 years.
Notifications were for rural and metropolitan Statisti-cal Divisions, as has been the pattern since 19919.
0-45-9
10-1415-19
20-2425-29
30-3435-39
40-4445-49
50-5455-59
60-6465-69
70-7475-79
80-8585+
AGE GROUP (YEARS)
0
1
2
3
4
5
6
7
NO
TIF
ICA
TIO
N R
AT
E
Males
Females
Figure 29. Annual adjusted rate of notification ofhepatitis B per 100,000 population, 1994,by age group and sex
0-45-9
10-1415-19
20-2425-29
30-3435-39
40-4445-49
50-5455-59
60-6465-69
70-7475-79
80-8585+
AGE GROUP (YEARS)
0
0.5
1
1.5
2
2.5
NO
TIF
ICA
TIO
N R
AT
E
Males
Females
Figure 30. Annual adjusted rate of notification ofhepatitis C (incident) per 100,000 popula-tion, 1994, by age group and sex
0-45-9
10-1415-19
20-2425-29
30-3435-39
40-4445-49
50-5455-59
60-6465-69
70-7475-79
80-8585+
AGE GROUP (YEARS)
0
50
100
150
200
250
300
350
NO
TIF
ICA
TIO
N R
AT
E
Males
Females
Figure 31. Annual adjusted rate of notification ofhepatitis C (unspecified) per 100,000population, 1994, by age group and sex
0-45-9
10-1415-19
20-2425-29
30-3435-39
40-4445-49
50-5455-59
60-6465-69
70-7475-79
80-8585+
AGE GROUP (YEARS)
0
0.5
1
1.5
2
2.5
3
3.5
4
NO
TIF
ICA
TIO
N R
AT
E
Males
Females
Figure 32. Annual rate of notification of hydatid in-fection per 100,000 population, 1994, byage group and sex
Vol 19/No. 22 558 CDI 30 October 1995

Legionellosis
This classification includes notifications of infectionscaused by all Legionella species. There were 179 notifi-cations received in 1994 with an annual rate of 1.0 caseper 100,000 population. This rate is similar to that seenin the previous four years.
A peak number of notifications overall was recorded inApril, however, in South Australia, Western Australia,and the Northern Territory the highest number of no-tifications were received in the spring (Figure 33). Thispattern may reflect the epidemiology of the differentspecies of Legionella; L. pneumophila infections havebeen reported to peak in the autumn and L. longbeachaeinfections in the spring.
No notifications were received from the AustralianCapital Territory and there was only one notificationfrom Tasmania. The highest numbers of reports werereceived from New South Wales (60), Victoria (48),South Australia (28), and Western Australia (20).
The male:female ratio was 2.2:1.0. The notification rateby age group increased disproportionately in malesaged greater than 45 years with a peak notification raterecorded for males in the 65-69 years age group (6.3 per100,000 population) (Figure 34).
Leprosy
There were 11 reports of leprosy in 1994 from five Statesand Territories, and a notification rate of 0.1 per 100,000population, the same as for the last few years. Sevenreports were for males and four for females. The re-ported ages ranged from the 10-14 years age group tothe 70-74 years age group.
Leptospirosis
There were 123 notifications of leptospirosis in 1994,made at a rate of 0.7 per 100,000 population, less thanthe rate for recent years. Many more males were re-ported than females (male:female ratio 12.7:1.0). Mostreports were for the 15-54 years age group and thehighest age group and sex specific rates were for malesin the 30-34 year age group (3.13 per 100,000) (Figure35).
A seasonal pattern was apparent, with 52 cases (41%)having onset in the first quarter of the year (Figure 36).
Most notifications were from Queensland and Victoria(Figure 37); the highest notification rates were reportedfor the Statistical Divisions of Western District in Vic-toria (10.9 per 100,000), Southwest Queensland (10.4)and Far North Queensland (12.8).
0-45-9
10-1415-19
20-2425-29
30-3435-39
40-4445-49
50-5455-59
60-6465-69
70-7475-79
80-8585+
AGE GROUP (YEARS)
0
1
2
3
4
5
6
7
NO
TIF
ICA
TIO
N R
AT
E
Males
Females
Figure 34. Annual rate of notification of legionel-losis per 100,000 population, 1994, by agegroup and sex
Jan Feb Mar Apr May Jun Jul Aug Sep Oct Nov Dec
MONTH
0
2
4
6
8
10
12
14
16
NO
TIF
ICA
TIO
NS
New South Wales
Victoria
Queensland
Others
Figure 33. Notifications of legionellosis with onsetdates in 1994, by month of onset
0-45-9
10-1415-19
20-2425-29
30-3435-39
40-4445-49
50-5455-59
60-6465-69
70-7475-79
80-8585+
AGE GROUP (YEARS)
0
0.5
1
1.5
2
2.5
3
3.5
NO
TIF
ICA
TIO
N R
AT
E
Males
Females
Figure 35. Annual rate of notification of leptospi-rosis per 100,000 population, 1994, by agegroup and sex
CDI 30 October 1995 559 Vol 19/No. 22
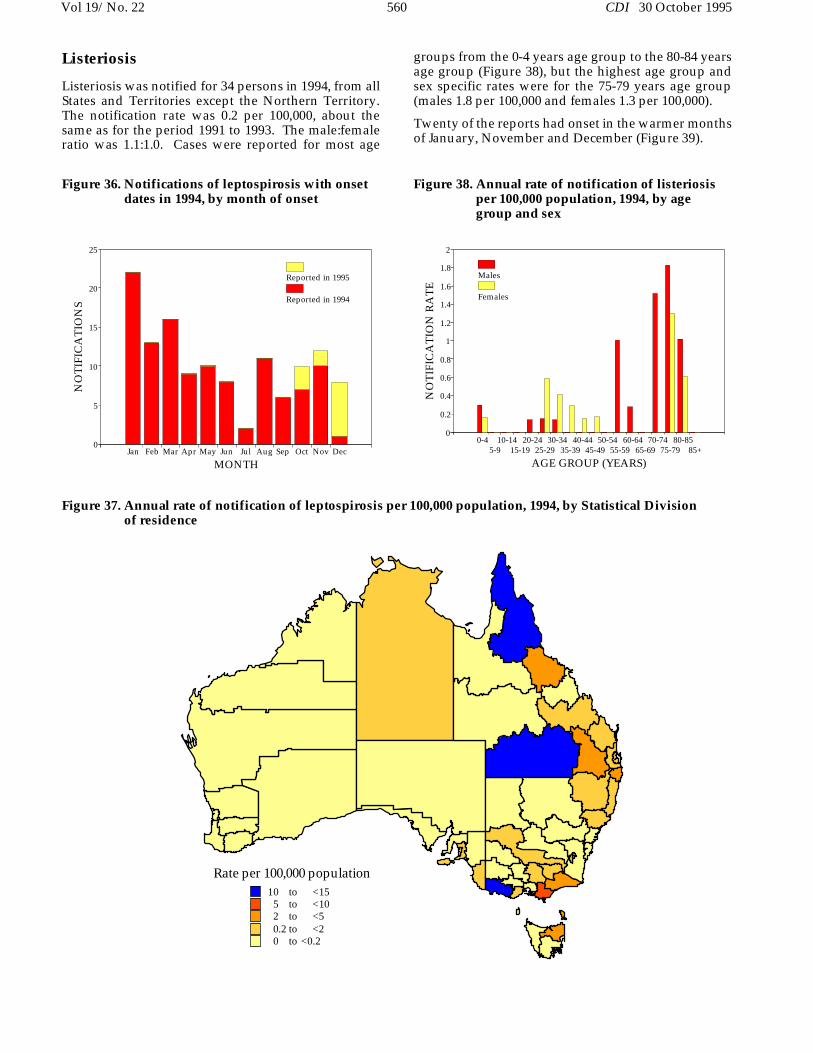
Listeriosis
Listeriosis was notified for 34 persons in 1994, from allStates and Territories except the Northern Territory.The notification rate was 0.2 per 100,000, about thesame as for the period 1991 to 1993. The male:femaleratio was 1.1:1.0. Cases were reported for most age
groups from the 0-4 years age group to the 80-84 yearsage group (Figure 38), but the highest age group andsex specific rates were for the 75-79 years age group(males 1.8 per 100,000 and females 1.3 per 100,000).
Twenty of the reports had onset in the warmer monthsof January, November and December (Figure 39).
Figure 37. Annual rate of notification of leptospirosis per 100,000 population, 1994, by Statistical Division of residence
Rate per 100,000 population10 to <15
5 to <102 to <50.2 to <20 to <0.2
Jan Feb Mar Apr May Jun Jul Aug Sep Oct Nov Dec
MONTH
0
5
10
15
20
25
NO
TIF
ICA
TIO
NS
Reported in 1995
Reported in 1994
Figure 36. Notifications of leptospirosis with onsetdates in 1994, by month of onset
0-45-9
10-1415-19
20-2425-29
30-3435-39
40-4445-49
50-5455-59
60-6465-69
70-7475-79
80-8585+
AGE GROUP (YEARS)
0
0.2
0.4
0.6
0.8
1
1.2
1.4
1.6
1.8
2
NO
TIF
ICA
TIO
N R
AT
E
Males
Females
Figure 38. Annual rate of notification of listeriosisper 100,000 population, 1994, by agegroup and sex
Vol 19/No. 22 560 CDI 30 October 1995

Lymphogranuloma venereum
Lymphogranuloma venereum was not a notifiable dis-ease in New South Wales, Western Australia or SouthAustralia in 1994. Two cases were reported from Victo-ria in 1994, one male and one female. A single case hadbeen notified from Victoria the previous year.
Malaria
Seven hundred and three notifications of malaria werereceived in 1994 with an annual notification rate of 3.9notifications per 100,000 population. This rate is similarto that recorded for the last four years. There were noreports of locally acquired cases.
Jan Feb Mar Apr May Jun Jul Aug Sep Oct Nov Dec
MONTH
0
20
40
60
80
100
120
140
NO
TIF
ICA
TIO
NS
Reported in 1995
Reported in 1994
Figure 40. Notifications of malaria with onset datesin 1994, by month of onset
Jan Feb Mar Apr May Jun Jul Aug Sep Oct Nov Dec
MONTH
0
1
2
3
4
5
6
7
8
9
NO
TIF
ICA
TIO
NS
Reported in 1995
Reported in 1994
Figure 39. Notifications of listeriosis with dates in1994, by month of onset
Figure 41. Annual rate of notification of malaria per 100,000 population, 1994, by Statistical Division of residence
Rate per 100,000 population25 to <4010 to <255 to <101 to <50 to <1
CDI 30 October 1995 561 Vol 19/No. 22

There was a marked seasonal variation with the highestnumber of reports occurring in February (Figure 40).This pattern was seen in most jurisdictions but wasmost marked in the Northern Territory and in Queens-land where 25% and 21% of notifications, respectively,had onset dates in February.
As seen in previous years the highest rates of notifica-tions were recorded for residents of the StatisticalDivisions of Far North Queensland (36.3 per 100,00population), North Queensland (22.9 per 100,000 popu-lation), and the Northern Territory (23.4 per 100,000population) (Figure 41).
A higher proportion of notifications was recorded formales with a male:female ratio of 2.5:1.0. The age groupand sex specific notification rates showed dispropor-tionately higher rates for males in the 20-54 years agegroup with the highest rate recorded for males in the20-24 years age group (11.9 per 100,000 population)(Figure 42).
Measles
The epidemic of measles which commenced in 1992continued into 1994 with 4895 cases being reported(Figure 43). The annual notification rate was 27.4 per100,000 population, higher than the rates for both 1993(25.7 per 100,000 population) and 1992 (8.5 per 100,000population). Notifications were highest from August toNovember, with 2226 cases being reported in this pe-riod.
The male:female ratio was 1.0:1.0. Eighty-four per centof all cases were reported in those aged less than 20years, with the highest notification rate in children aged0-4 years (90.0 per 100,000 population) (Figure 44).There were 393 cases reported for children under theage of one year.
Notification patterns varied between States and Terri-tories, with Queensland reporting large numbers ofcases in the middle of the year, the Northern Territoryhaving a peak in August and notifications in NewSouth Wales rising sharply late in the year (Figure 45).
0-45-9
10-1415-19
20-2425-29
30-3435-39
40-4445-49
50-5455-59
60-6465-69
70-7475-79
80-8585+
AGE GROUP (YEARS)
0
2
4
6
8
10
12
14
NO
TIF
ICA
TIO
N R
AT
E
Males
Females
Figure 42. Annual rate of notification of malaria per100,000 population, 1994, by age groupand sex
Jan 92Apr
JulOct
Jan 93Apr
JulOct
Jan 94Apr
JulOct
MONTH
0
200
400
600
800
1000
1200
NO
TIF
ICA
TIO
NS
Reported in 1995
Figure 43. Notifications of measles with onset datesfrom 1992 to 1994, by month of onset
Jan Feb Mar Apr May Jun Jul Aug Sep Oct Nov Dec
MONTH
0
50
100
150
200
250
300
350
400
NO
TIF
ICA
TIO
NS
New South Wales
Northern Territory
Queensland
Others
Figure 45. Notifications of measles with onset datesin 1994, by State or Territory and monthof onset
0-45-9
10-1415-19
20-2425-29
30-3435-39
40-4445-49
50-5455-59
60-6465-69
70-7475-79
80-8585+
AGE GROUP (YEARS)
0
10
20
30
40
50
60
70
80
90
100
NO
TIF
ICA
TIO
N R
AT
E
Males
Females
Figure 44. Annual rate of notification of measles per100,000 population, 1994, by age groupand sex
Vol 19/No. 22 562 CDI 30 October 1995

Notification rates were highest for the Statistical Divi-sions of Northwest Queensland (521.6 per 100,000population) and the Northern Territory (237.0 per100,000 population) (Figure 46).
Meningococcal infection
There were 383 notifications of meningococcal infec-tion in 1994, made at a rate of 2.2 per 100,000.Notifications of meningococcal infection have in-
creased in most years in the last decade. The notifica-tion rate has similarly increased from about 0.3 in 1985and 1986 to over 2.0 per 100,000 in 1993 and 1994 (Figure47).
There was a marked seasonal pattern, with 226 (58%)of cases having onset between June and October 1994(Figure 48). This seasonality was apparent in all theStates which reported more than 10 cases (all but the
Figure 46. Annual rate of notification of measles per 100,000 population, 1994, by Statistical Division of resi-dence
Rate per 100,000 population200 to <530
50 to <20020 to <5010 to <20
5 to <10<5
Jan Feb Mar Apr May Jun Jul Aug Sep Oct Nov Dec
MONTH
0
10
20
30
40
50
60
70
NO
TIF
ICA
TIO
NS
Reported in 1995
Reported in 1994
Figure 48. Notifications of meningococcal infectionwith onset dates in 1994, by month of on-set
1985 1986 1987 1988 1989 1990 1991 1992 1993 1994
YEAR
0
0.5
1
1.5
2
2.5
NO
TIF
ICA
TIO
N R
AT
E
Figure 47. Annual rate of notification of meingococ-cal infection per 100,000, 1985 to 1994, byyear
CDI 30 October 1995 563 Vol 19/No. 22
Australian Capital Territory, the Northern Territoryand Tasmania).
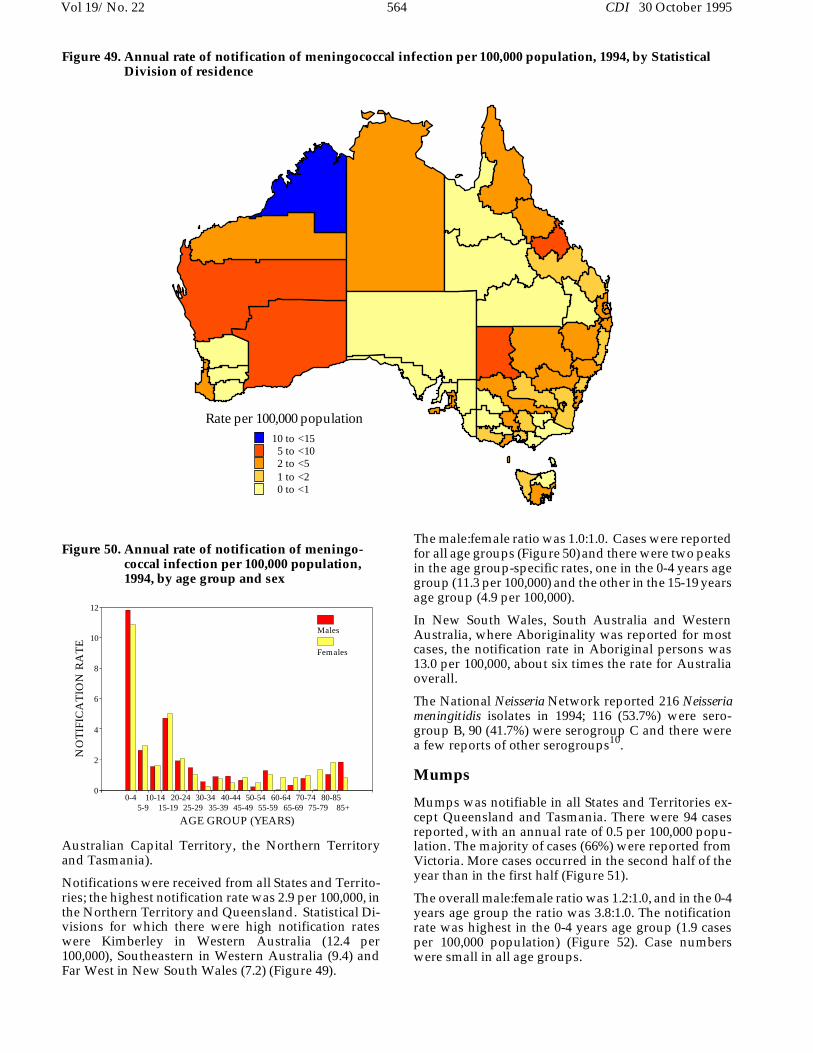
Notifications were received from all States and Territo-ries; the highest notification rate was 2.9 per 100,000, inthe Northern Territory and Queensland. Statistical Di-visions for which there were high notification rateswere Kimberley in Western Australia (12.4 per100,000), Southeastern in Western Australia (9.4) andFar West in New South Wales (7.2) (Figure 49).
The male:female ratio was 1.0:1.0. Cases were reportedfor all age groups (Figure 50) and there were two peaksin the age group-specific rates, one in the 0-4 years agegroup (11.3 per 100,000) and the other in the 15-19 yearsage group (4.9 per 100,000).
In New South Wales, South Australia and WesternAustralia, where Aboriginality was reported for mostcases, the notification rate in Aboriginal persons was13.0 per 100,000, about six times the rate for Australiaoverall.
The National Neisseria Network reported 216 Neisseriameningitidis isolates in 1994; 116 (53.7%) were sero-group B, 90 (41.7%) were serogroup C and there werea few reports of other serogroups10.
Mumps
Mumps was notifiable in all States and Territories ex-cept Queensland and Tasmania. There were 94 casesreported, with an annual rate of 0.5 per 100,000 popu-lation. The majority of cases (66%) were reported fromVictoria. More cases occurred in the second half of theyear than in the first half (Figure 51).
The overall male:female ratio was 1.2:1.0, and in the 0-4years age group the ratio was 3.8:1.0. The notificationrate was highest in the 0-4 years age group (1.9 casesper 100,000 population) (Figure 52). Case numberswere small in all age groups.
Figure 49. Annual rate of notification of meningococcal infection per 100,000 population, 1994, by StatisticalDivision of residence
Rate per 100,000 population10 to <15
5 to <102 to <51 to <20 to <1
0-45-9
10-1415-19
20-2425-29
30-3435-39
40-4445-49
50-5455-59
60-6465-69
70-7475-79
80-8585+
AGE GROUP (YEARS)
0
2
4
6
8
10
12
NO
TIF
ICA
TIO
N R
AT
E
Males
Females
Figure 50. Annual rate of notification of meningo-coccal infection per 100,000 population,1994, by age group and sex
Vol 19/No. 22 564 CDI 30 October 1995

Ornithosis
Orthinosis was notifiable in all States and Territorieswith the exception of New South Wales. There were 85cases reported with an annual adjusted rate of 0.7 per100,000 population. This rate is similar to that observedin the last four years (Table 3). There was no markedseasonal variation.
The male:female ratio was 1.0:1.0 with cases aged be-tween the 5-9 and the 85+ years age groups. The highestrate of notification was reported for males in the 60-64years age group (2.2 per 100,000 population).
Pertussis
Epidemic activity of pertussis continued in 1994, with5633 cases reported and an annual notification rate of31.6 per 100,000 population. Notifications have re-mained very high since 1993 (Figure 53).
The male:female ratio was 1.0:1.3 (Figure 54). Notifica-tion rates were highest in those aged less than 15 years.The highest notification rate was in those aged 5-9 years(87.7 per 100,000 population), but the rate was also highin children aged less than five years (63.3 per 100,000population). Two hundred and eighty-eight cases werechildren aged less than one year.
Seasonal patterns varied between States and Territoriesover the year, with peaks occurring in late winter inQueensland and South Australia, and notifications ris-ing sharply late in the year in the Northern Territoryand Western Australia (Figure 56).
Notification rates for the year varied across the country(Figure 57). Rates were highest in the Statistical Divi-sions of Richmond-Tweed, New South Wales (197.1 per100,000 population), Darling Downs, Queensland(133.6 per 100,000 population) and Far North Queens-land (102.7 per 100,000 population).
Jan Feb Mar Apr May Jun Jul Aug Sep Oct Nov Dec
MONTH
0
2
4
6
8
10
12
14
NO
TIF
ICA
TIO
NS
Reported in 1995
Reported in 1994
Figure 51. Notifications of mumps with onset datesin 1994, by month of onset
0-45-9
10-1415-19
20-2425-29
30-3435-39
40-4445-49
50-5455-59
60-6465-69
70-7475-79
80-8585+
AGE GROUP (YEARS)
0
0.5
1
1.5
2
2.5
3
NO
TIF
ICA
TIO
N R
AT
E
Males
Females
Figure 52. Annual rate of notification of mumps per100,000 population, 1994, by age groupand sex
0-45-9
10-1415-19
20-2425-29
30-3435-39
40-4445-49
50-5455-59
60-6465-69
70-7475-79
80-8585+
AGE GROUP (YEARS)
0
10
20
30
40
50
60
70
80
90
100
NO
TIF
ICA
TIO
N R
AT
E
Males
Females
Figure 54. Annual rate of notification of pertussisper 100,000 population, 1994, by agegroup and sex
Jan 92Apr
JulOct
Jan 93Apr
JulOct
Jan 94Apr
JulOct
MONTH
0
100
200
300
400
500
600
700
800
900
NO
TIF
ICA
TIO
NS
Reported in 1995
Figure 53. Notifications of pertussis with onsetdates from 1992 to 1994, by month of onset
CDI 30 October 1995 565 Vol 19/No. 22

Plague
There were no notifications of plague in 1994. The lastnotification of this disease in Australia was in 1923.
Poliomyelitis
No cases of poliomyelitis were notified in Australia in1994. The last case of this disease reported to theNNDSS was in 1986.
Q fever
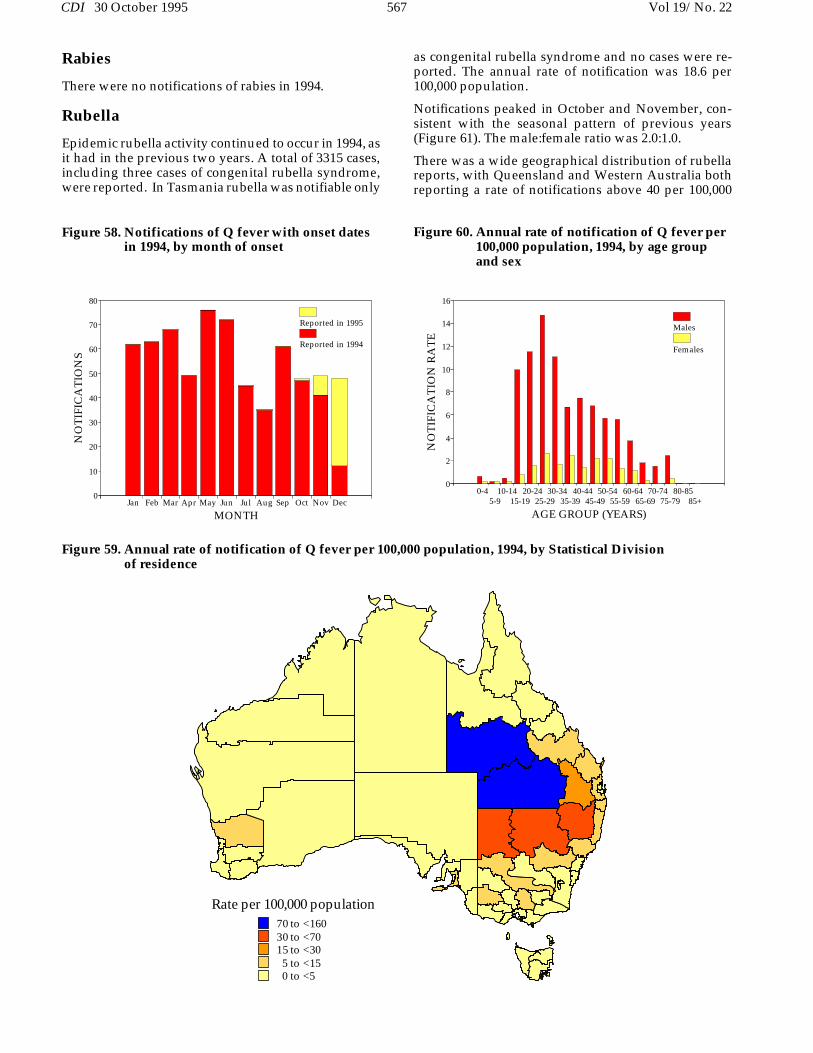
There were 667 cases of Q fever reported in 1994, withan annual rate of 3.7 per 100,000 population. More caseswere reported with an onset in May and June than inother months (Figure 58).
No cases were reported from the Australian CapitalTerritory, the Northern Territory or Tasmania. The ma-jority of cases were reported from New South Walesand Queensland, as in previous years. The highest ratesoccurred in the Statistical Divisions of SouthwestQueensland (156.4 per 100,000 population) and CentralWest Queensland (122.3 per 100,000 population) (Fig-ure 59).
The male:female ratio was 5.1:1.0. The highest ratesoccurred in males aged between 15 and 34 years of age,with a peak of 14.7 per 100,000 population in males inthe 25 to 29 years age group (Figure 60).
Figure 57. Annual rate of notification of pertussis per 100,000 population, 1994, by Statistical Division of residence
Rate per 100,000 population70 to <16030 to <7015 to <305 to <150 to <5
Jan Feb Mar Apr May Jun Jul Aug Sep Oct Nov Dec
MONTH
0
50
100
150
200
250
NO
TIF
ICA
TIO
NS
New South Wales Queensland South Australia
Western Australia Northern Territory Others
Figure 56. Notifications of pertussis with onsetdates in 1994, by State or Territory andmonth of onset
Vol 19/No. 22 566 CDI 30 October 1995
Rabies
There were no notifications of rabies in 1994.
Rubella
Epidemic rubella activity continued to occur in 1994, asit had in the previous two years. A total of 3315 cases,including three cases of congenital rubella syndrome,were reported. In Tasmania rubella was notifiable only
as congenital rubella syndrome and no cases were re-ported. The annual rate of notification was 18.6 per100,000 population.
Notifications peaked in October and November, con-sistent with the seasonal pattern of previous years(Figure 61). The male:female ratio was 2.0:1.0.
There was a wide geographical distribution of rubellareports, with Queensland and Western Australia bothreporting a rate of notifications above 40 per 100,000
Figure 59. Annual rate of notification of Q fever per 100,000 population, 1994, by Statistical Division of residence
0-45-9
10-1415-19
20-2425-29
30-3435-39
40-4445-49
50-5455-59
60-6465-69
70-7475-79
80-8585+
AGE GROUP (YEARS)
0
2
4
6
8
10
12
14
16
NO
TIF
ICA
TIO
N R
AT
E
Males
Females
Figure 60. Annual rate of notification of Q fever per100,000 population, 1994, by age groupand sex
Jan Feb Mar Apr May Jun Jul Aug Sep Oct Nov Dec
MONTH
0
10
20
30
40
50
60
70
80
NO
TIF
ICA
TIO
NS
Reported in 1995
Reported in 1994
Figure 58. Notifications of Q fever with onset datesin 1994, by month of onset
Rate per 100,000 population70 to <16030 to <7015 to <305 to <150 to <5
CDI 30 October 1995 567 Vol 19/No. 22

population (Figure 62). Rates were highest in the Statis-tical Divisions of Darling Downs, Queensland (149.4per 100,000 population), Pilbara, Western Australia(87.4 per 100,000 population) and Southeastern West-ern Australia (79.2 per 100,000 population).
The highest notification rate occurred in the 15-19 yearsage group (69.7 per 100,000 population), with the ratein males being 108.3 per 100,000 population and the rate
in females 26.7 per 100,000 population (Figure 63).There were 486 cases reported in women aged between15 and 45 years. Surveillance of cases of congenitalrubella syndrome conducted through the AustralianPaediatric Surveillance Unit recorded seven cases bornin 199411.
Figure 62. Annual rate of notification of rubella per 100,000 population, 1994, by Statistical Division of residence
0-45-9
10-1415-19
20-2425-29
30-3435-39
40-4445-49
50-5455-59
60-6465-69
70-7475-79
80-8585+
AGE GROUP (YEARS)
0
20
40
60
80
100
120
NO
TIF
ICA
TIO
N R
AT
E
Males
Females
Figure 63. Annual rate of notification of rubella per100,000 population, 1994, by age groupand sex
Jan 92Apr
JulOct
Jan 93Apr
JulOct
Jan 94Apr
JulOct
MONTH
0
200
400
600
800
1000
1200
NO
TIF
ICA
TIO
NS
Reported in 1995
Figure 61. Notifications of rubella with onset datesfrom 1992 to 1994, by month of onset
Rate per 100,000 population90 to <15050 to <9020 to <5010 to <20
0 to <10
Vol 19/No. 22 568 CDI 30 October 1995

Salmonellosis (not elsewhere classified)
A total of 5283 cases of salmonellosis (not elsewhereclassified) was reported in 1994, the annual notificationrate of 29.6 per 100,000 population being slightly higherthan for either of the previous two years.
As in previous years, a seasonal trend was noted witha higher number of notifications reported as havingmonth of onset in the warmer months (Figure 64).
Salmonellosis (not elsewhere classified) was reportedfor residents of all Statistical Divisions, with higherrates being generally observed in the northern parts ofAustralia. The highest rates were observed for resi-dents of the Northern Territory and the KimberleyStatistical Division of Western Australia (both 289 per100,000 population) (Figure 65).
Jan Feb Mar Apr May Jun Jul Aug Sep Oct Nov Dec
MONTH
0
100
200
300
400
500
600
700
NO
TIF
ICA
TIO
NS
Reported in 1995
Reported in 1994
Figure 64. Notifications of salmonellosis (not else-where classified) with onset dates in1994, by month of onset
0-45-9
10-1415-19
20-2425-29
30-3435-39
40-4445-49
50-5455-59
60-6465-69
70-7475-79
80-8585+
AGE GROUP (YEARS)
0
20
40
60
80
100
120
140
160
180
200
NO
TIF
ICA
TIO
N R
AT
E
Males
Females
Figure 66. Annual rate of notification of salmonel-losis (not elsewhere classified) per100,000 population, 1994, by age groupand sex
Figure 65. Annual rate of notification of salmonellosis (not elsewhere classified) per 100,000 population, 1994,by Statistical Division of residence
Rate per 100,000 population200 to <300100 to <20050 to <10020 to <50
0 to <20
CDI 30 October 1995 569 Vol 19/No. 22

There was a male:female ratio in reported cases of1.0:1.0. By far the highest rates of notification were seenin the 0-4 years age group (males 180.1 per 100,000population; females 176.9 per 100,000 population) (Fig-ure 66).
Of those States and Territories reporting Aboriginalityfor most or all notifications (the Northern Territory,Western Australia and South Australia), rates of notifi-cation for Aboriginal persons were two to five times therates for the respective State or Territory as a whole.
Shigellosis
Shigellosis was notified for 724 persons in 1994, fromall States and Territories except New South Wales,where it was only notifiable as ’foodborne disease’ or’gastroenteritis in an institution’. The notification ratewas 6.1 per 100,000, the same as in 1993.
The male:female ratio was 1.0:1.3 (Figure 67). Peaks inage group and sex-specific rates occurred in males inthe 0-4 years age group (22.6 per 100,000) and in females
Figure 68. Annual rate of notification of shigellosis per 100,000 population, 1994, by Statistical Division of residence
0-45-9
10-1415-19
20-2425-29
30-3435-39
40-4445-49
50-5455-59
60-6465-69
70-7475-79
80-8585+
AGE GROUP (YEARS)
0
5
10
15
20
25
30
NO
TIF
ICA
TIO
N R
AT
E
Males
Females
Figure 67. Annual adjusted rate of notification ofshigellosis per 100,000 population, 1994,by age group and sex
Jan Feb Mar Apr May Jun Jul Aug Sep Oct Nov Dec
MONTH
0
20
40
60
80
100
120
NO
TIF
ICA
TIO
NS
Reported in 1995
Reported in 1994
Figure 69. Notifications of shigellosis with onsetdates in 1994, by month of onset
Rate per 100,000 population100 to <250
50 to <10010 to <505 to <100 to <5
Not notifiable
Vol 19/No. 22 570 CDI 30 October 1995

in the same age group (29.6 per 100,000). The highestnotification rates were reported for the Statistical Divi-sions of Kimberley in Western Australia (223 per100,000), Pilbara in Western Australia (120 per 100,000)and for the Northern Territory (80 per 100,000) (Figure68).
Most cases were reported in the first half of the year,with a peak of 110 reports in March (Figure 69). Thiscoincided with the seasonal peaks in the States with themost reports of shigellosis, Queensland and WesternAustralia (Figure 70).
In the Northern Territory, South Australia and WesternAustralia, where Aboriginality was reported for mostcases, the overall notification rate in Aboriginal personswas 199 per 100,000, about 33 times the rate for Austra-lia overall.
Syphilis
A total of 2324 notifications were received in 1994 (Ta-ble 1), the annual rate being 13.0 per 100,000population. This is similar to the rates observed for1991 and 1993 (12.2 and 13.1 per 100,000 respectively)but lower than the rate reported for 1992 (16.0 per100,000) (Table 3). No seasonal trend was observed inreported onset dates for notified cases.
There was wide geographical variation in the rate ofnotification of syphilis (Table 2; Figure 71). High noti-fication rates (above 100 per 100,000 population) werereported for the Northern Territory, the Statistical Di-visions of North West and Far North in Queensland,and the Northwestern Statistical Division of NewSouth Wales. The highest rate, 282.7 per 100,000 popu-lation, was reported for the Northern Territory. Therate for the Statistical Division of Kimberley in WesternAustralia was 95.0 per 100,000 population.
Sex was not specified in nearly 3% of notified cases. Forthe remainder of the notifications, the male:female ratiowas 1.2:1.0. Rates were much higher in females thanmales for the age groups from 10-14 years to 20-24years, and were much higher in males than females inthe age group 35-39 years and older age groups (Fig-ure 72). In some jurisdictions, notifications have
Jan Feb Mar Apr May Jun Jul Aug Sep Oct Nov Dec
MONTH
5
10
15
20
25
30
35
40
45
NO
TIF
ICA
TIO
NS
Queensland
Western Australia
Others
Figure 70. Notifications of shigellosis with onsetdates in 1994, by State or Territory andmonth of onset
Figure 71. Annual rate of notification of syphilis per 100,000 population, 1994, by Statistical Division of resi-dence
Rate per 100,000 population200 to <300100 to <20010 to <100
5 to <100 to <5
CDI 30 October 1995 571 Vol 19/No. 22
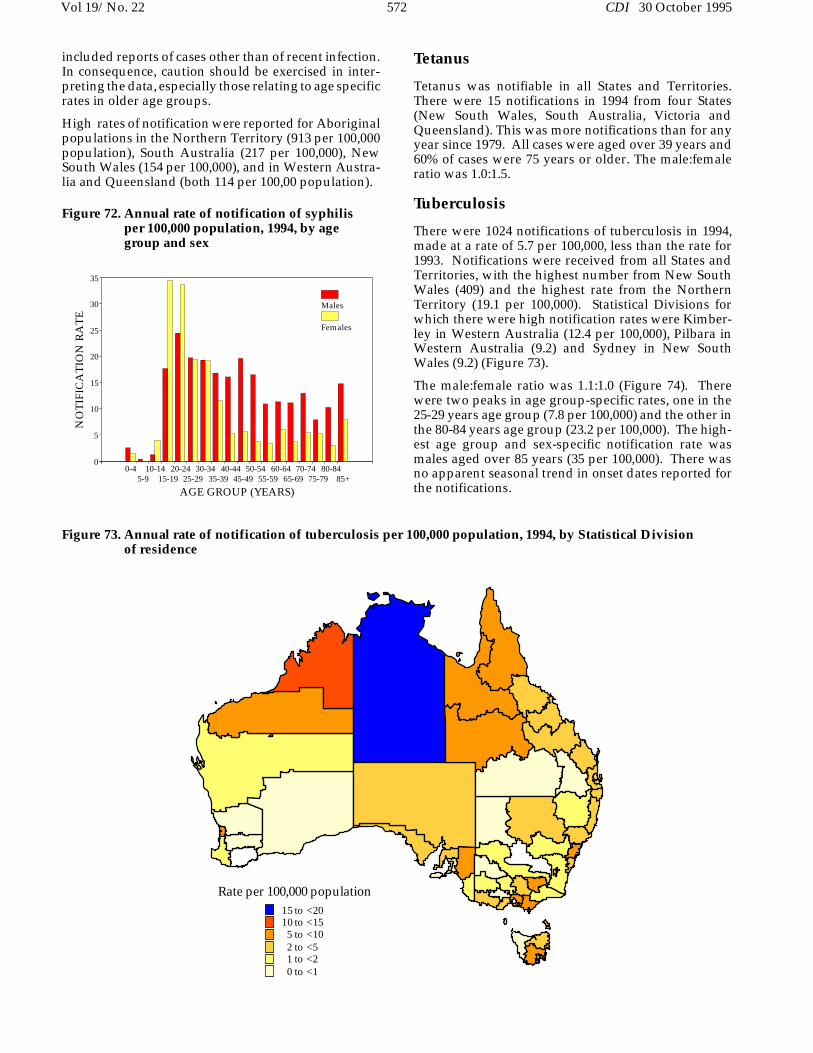
included reports of cases other than of recent infection.In consequence, caution should be exercised in inter-preting the data, especially those relating to age specificrates in older age groups.
High rates of notification were reported for Aboriginalpopulations in the Northern Territory (913 per 100,000population), South Australia (217 per 100,000), NewSouth Wales (154 per 100,000), and in Western Austra-lia and Queensland (both 114 per 100,00 population).
Tetanus
Tetanus was notifiable in all States and Territories.There were 15 notifications in 1994 from four States(New South Wales, South Australia, Victoria andQueensland). This was more notifications than for anyyear since 1979. All cases were aged over 39 years and60% of cases were 75 years or older. The male:femaleratio was 1.0:1.5.
Tuberculosis
There were 1024 notifications of tuberculosis in 1994,made at a rate of 5.7 per 100,000, less than the rate for1993. Notifications were received from all States andTerritories, with the highest number from New SouthWales (409) and the highest rate from the NorthernTerritory (19.1 per 100,000). Statistical Divisions forwhich there were high notification rates were Kimber-ley in Western Australia (12.4 per 100,000), Pilbara inWestern Australia (9.2) and Sydney in New SouthWales (9.2) (Figure 73).
The male:female ratio was 1.1:1.0 (Figure 74). Therewere two peaks in age group-specific rates, one in the25-29 years age group (7.8 per 100,000) and the other inthe 80-84 years age group (23.2 per 100,000). The high-est age group and sex-specific notification rate wasmales aged over 85 years (35 per 100,000). There wasno apparent seasonal trend in onset dates reported forthe notifications.
0-45-9
10-1415-19
20-2425-29
30-3435-39
40-4445-49
50-5455-59
60-6465-69
70-7475-79
80-8485+
AGE GROUP (YEARS)
0
5
10
15
20
25
30
35
NO
TIF
ICA
TIO
N R
AT
E
Males
Females
Figure 72. Annual rate of notification of syphilisper 100,000 population, 1994, by agegroup and sex
Figure 73. Annual rate of notification of tuberculosis per 100,000 population, 1994, by Statistical Division of residence
Rate per 100,000 population15 to <2010 to <155 to <102 to <51 to <20 to <1
Vol 19/No. 22 572 CDI 30 October 1995

Aboriginality was reported for most cases in NewSouth Wales, the Northern Territory, Queensland,South Australia and Western Australia. The overallnotification rate for Aboriginal persons was 12.5 per100,000 in these jurisdictions, more than twice the ratefor Australia overall.
Typhoid
There were 50 cases of typhoid notified in 1994 at a rateof 0.3 per 100,000 population. The male:female ratio
was 1.1:1.0, with most cases (32) and the highest notifi-cation rates in the 15-29 years age group. There was noapparent seasonal trend. Forty-seven of the 53 reportsof typhoid made to the National Salmonella SurveillanceScheme for 1994 were known to have been acquiredoverseas12.
Yellow fever and other viral haemorrhagicfevers
There were no notifications of these diseases in 1994.
Yersiniosis
Yersiniosis was notified for 414 persons in 1994, fromall States and Territories except the Australian CapitalTerritory, and New South Wales, where it was onlynotifiable as ’foodborne disease’ or ’gastroenteritis inan institution’. Most were from Queensland as a wholeand from Queensland Statistical Divisions (Fitzroy 26.8per 100,000 and Southwest 10.4 per 100,000) (Figure 75).
The male:female ratio was 1.1:1.0 (Figure 76). The high-est number of notifications was for the 0-4 years agegroup (140 or 33.8% of the total). The highest age groupand sex-specific notification rates were for males in the0-4 years age group (16.0 per 100,000) and for femalesin the same age group (16.4 per 100,000).
Most cases had onset in the first half of the year (Figure77); there was a peak of 59 cases in March. This coin-cided with the peak in reports from Queensland(Figure 78), which reported 69% of the total.
0-45-9
10-1415-19
20-2425-29
30-3435-39
40-4445-49
50-5455-59
60-6465-69
70-7475-79
80-8585+
AGE GROUP (YEARS)
0
5
10
15
20
25
30
35
40
NO
TIF
ICA
TIO
N R
AT
E
Males
Females
Figure 74. Annual rate of notification of tuberculo-sis per 100,000 population, 1994, by agegroup and sex
Figure 75. Annual rate of notification of yersiniosis per 100,000 population, 1994, by Statistical Division of residence
Rate per 100,000 population20 to <3010 to <205 to <102 to <50 to <2
Not notifiable
CDI 30 October 1995 573 Vol 19/No. 22
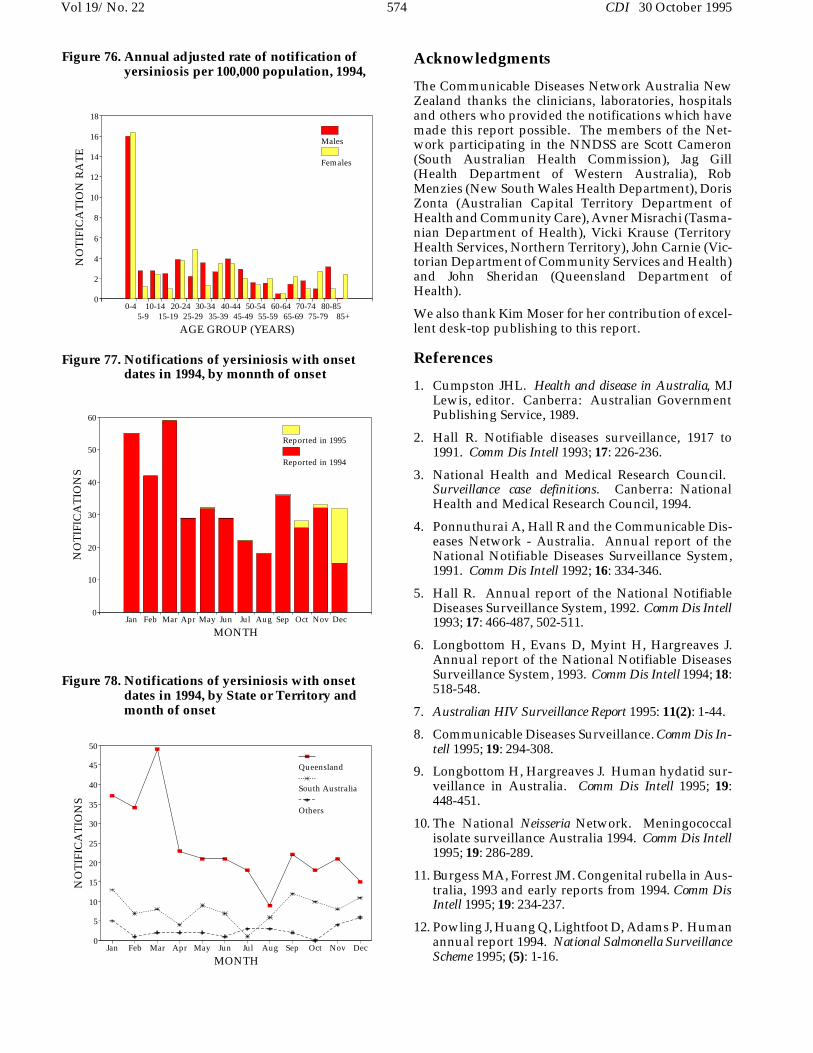
Acknowledgments
The Communicable Diseases Network Australia NewZealand thanks the clinicians, laboratories, hospitalsand others who provided the notifications which havemade this report possible. The members of the Net-work participating in the NNDSS are Scott Cameron(South Australian Health Commission), Jag Gill(Health Department of Western Australia), RobMenzies (New South Wales Health Department), DorisZonta (Australian Capital Territory Department ofHealth and Community Care), Avner Misrachi (Tasma-nian Department of Health), Vicki Krause (TerritoryHealth Services, Northern Territory), John Carnie (Vic-torian Department of Community Services and Health)and John Sheridan (Queensland Department ofHealth).
We also thank Kim Moser for her contribution of excel-lent desk-top publishing to this report.
References
1. Cumpston JHL. Health and disease in Australia, MJLewis, editor. Canberra: Australian GovernmentPublishing Service, 1989.
2. Hall R. Notifiable diseases surveillance, 1917 to1991. Comm Dis Intell 1993; 17: 226-236.
3. National Health and Medical Research Council. Surveillance case definitions. Canberra: NationalHealth and Medical Research Council, 1994.
4. Ponnuthurai A, Hall R and the Communicable Dis-eases Network - Australia. Annual report of theNational Notifiable Diseases Surveillance System,1991. Comm Dis Intell 1992; 16: 334-346.
5. Hall R. Annual report of the National NotifiableDiseases Surveillance System, 1992. Comm Dis Intell1993; 17: 466-487, 502-511.
6. Longbottom H, Evans D, Myint H, Hargreaves J.Annual report of the National Notifiable DiseasesSurveillance System, 1993. Comm Dis Intell 1994; 18:518-548.
7. Australian HIV Surveillance Report 1995: 11(2): 1-44.
8. Communicable Diseases Surveillance. Comm Dis In-tell 1995; 19: 294-308.
9. Longbottom H, Hargreaves J. Human hydatid sur-veillance in Australia. Comm Dis Intell 1995; 19:448-451.
10. The National Neisseria Network. Meningococcalisolate surveillance Australia 1994. Comm Dis Intell1995; 19: 286-289.
11. Burgess MA, Forrest JM. Congenital rubella in Aus-tralia, 1993 and early reports from 1994. Comm DisIntell 1995; 19: 234-237.
12. Powling J, Huang Q, Lightfoot D, Adams P. Humanannual report 1994. National Salmonella SurveillanceScheme 1995; (5): 1-16.
Jan Feb Mar Apr May Jun Jul Aug Sep Oct Nov Dec
MONTH
0
5
10
15
20
25
30
35
40
45
50
NO
TIF
ICA
TIO
NS
Queensland
South Australia
Others
Figure 78. Notifications of yersiniosis with onsetdates in 1994, by State or Territory andmonth of onset
Jan Feb Mar Apr May Jun Jul Aug Sep Oct Nov Dec
MONTH
0
10
20
30
40
50
60
NO
TIF
ICA
TIO
NS
Reported in 1995
Reported in 1994
Figure 77. Notifications of yersiniosis with onsetdates in 1994, by monnth of onset
0-45-9
10-1415-19
20-2425-29
30-3435-39
40-4445-49
50-5455-59
60-6465-69
70-7475-79
80-8585+
AGE GROUP (YEARS)
0
2
4
6
8
10
12
14
16
18
NO
TIF
ICA
TIO
N R
AT
E
Males
Females
Figure 76. Annual adjusted rate of notification ofyersiniosis per 100,000 population, 1994,
Vol 19/No. 22 574 CDI 30 October 1995