annual report on local governments - 2008osc.state.ny.us/localgov/annualreport/08annreport.pdf · a...
TRANSCRIPT
20082008ANNUAL REPORTANNUAL REPORTON LOCAL GOVERNMENTS
OFFICE OF THENEW YORK STATE COMPTROLLER
Thomas P. DiNapoliState Comptroller
DIVISION OF LOCAL GOVERNMENT AND SCHOOL ACCOUNTABILITY
SEPTEMBER 2008

For additional copies of this report contact:
Comptroller’s Press Offi ce110 State Street, 15th fl oorAlbany, New York 12236 (518) 474-4015or email us: [email protected]
www.osc.state.ny.us
To be removed from our mailing list:In an effort to reduce the cost of printing, if you would like to have your nameremoved from our mailing list or if your present address has changed, contact the Comptroller’s Press Offi ce at (518) 474-4015 or Offi ce of the State Comptroller, 110 State Street, 15th Floor, Albany, NY 12236. Date of Issue: September 2008 RMD42
1 DIVISION OF LOCAL GOVERNMENT AND SCHOOL ACCOUNTABILITY
Division Mission 2
Comptroller’s Message 3
Executive Summary 4
Enhancing Transparency with the Release of Open Book 5
The State of Local Governments 10 Economic Outlook ................................................................................................................... 11 Snapshot of Revenues– Fiscal Year Ended 2006 .................................................................. 12 Sales Tax Collections ............................................................................................................. 12 Mortgage Recording Taxes ..................................................................................................... 13 State Aid ................................................................................................................................. 13 Property Tax ........................................................................................................................... 14 Snapshot of Expenditures– Fiscal Year Ended 2006 ............................................................. 14 Growth in Employee Benefits Continues ................................................................................ 15 Escalating Fuel Costs ............................................................................................................. 16
Local Government– Class Highlights 17 Cities ....................................................................................................................................... 17 Counties .................................................................................................................................. 18 Towns ...................................................................................................................................... 20 Villages ................................................................................................................................... 21 School Districts .......................................................................................................................22 Fire Districts ............................................................................................................................ 23 New York City ......................................................................................................................... 24
2008 State Legislation Affecting Local Governments 25
Audits and Oversight 27 Accountability Audits ............................................................................................................... 27 Internal Control Audits ............................................................................................................ 28 Efficiency Audits .....................................................................................................................30 Budget Reviews ...................................................................................................................... 32
Other Division Activities 33 Policy Reports .........................................................................................................................33 Local Official Training .............................................................................................................35 Justice Court Fund ..................................................................................................................36 Public Authorities Reporting Information System (PARIS) ..................................................... 37 Indigent Legal Services Fund ................................................................................................. 37
Population Trends in New York State–Update 38
Summary of Local Government Entities 40
Appendix I 41 Level One and Level Two Revenue Categories ...................................................................... 41 Level One and Level Two Expenditure Categories ................................................................. 42
Division Services/Resources 64 Central Office Directory .......................................................................................................... 67 Regional Office Directory .......................................................................................................68 Map of New York State Counties and Cities by Region ..........................................................69
TABLE OF CONTENTS
2008 Annual Report

2008 Annual Report OFFICE OF THE STATE COMPTROLLER2
OFFICE OF THENEW YORK STATE COMPTROLLER
DIVISION OFLOCAL GOVERNMENT AND SCHOOL ACCOUNTABILITY
To achieve our mission we have developed the following goals:
• Enable and encourage local government and school offi cials to maintain or improve fi scal health by increasing effi ciency and effectiveness, managing costs, improving service delivery, and accounting for and protecting assets.
• Promote government reform and foster good governance in communities statewide by providing local government and school offi cials with up-to-date information and expert technical assistance.
MISSION AND GOALS
The Division of Local Government and School Accountability’s mission is to serve taxpayers’ interests by improving the fi scal management of
local governments and schools in New York State.
3 DIVISION OF LOCAL GOVERNMENT AND SCHOOL ACCOUNTABILITY
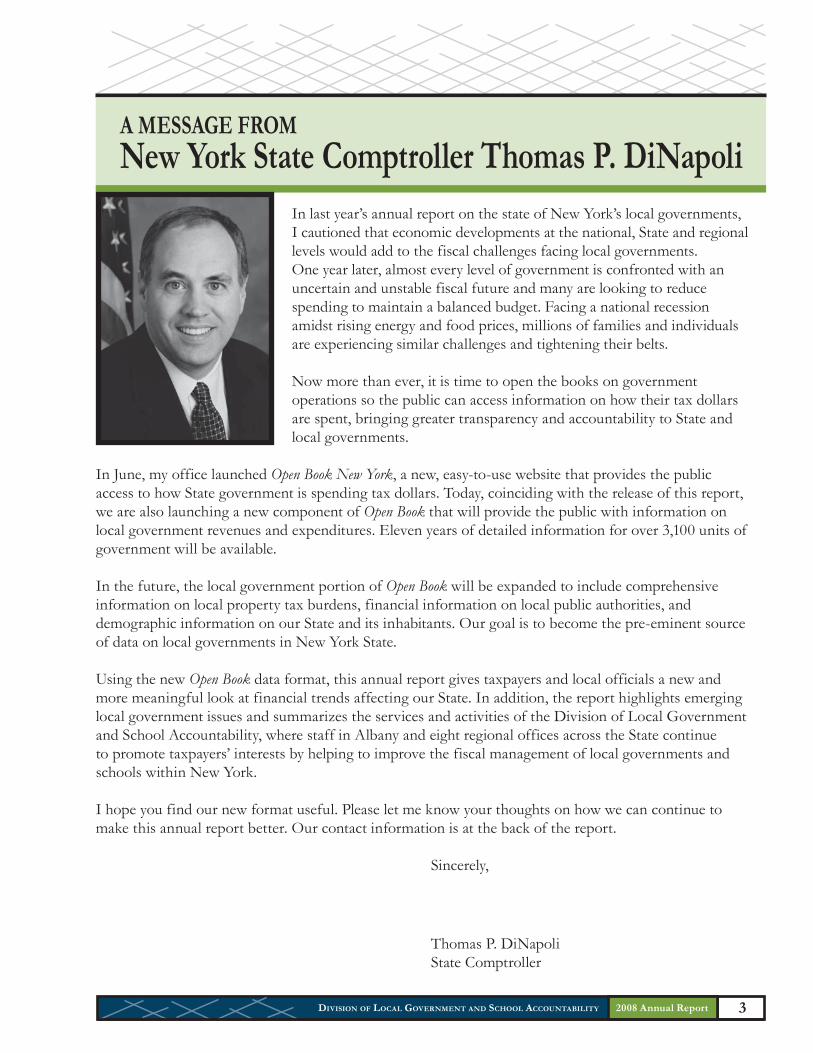
In last year’s annual report on the state of New York’s local governments, I cautioned that economic developments at the national, State and regional levels would add to the fiscal challenges facing local governments. One year later, almost every level of government is confronted with an uncertain and unstable fiscal future and many are looking to reduce spending to maintain a balanced budget. Facing a national recession amidst rising energy and food prices, millions of families and individuals are experiencing similar challenges and tightening their belts.
Now more than ever, it is time to open the books on government operations so the public can access information on how their tax dollars are spent, bringing greater transparency and accountability to State and local governments.
In June, my office launched Open Book New York, a new, easy-to-use website that provides the public access to how State government is spending tax dollars. Today, coinciding with the release of this report, we are also launching a new component of Open Book that will provide the public with information on local government revenues and expenditures. Eleven years of detailed information for over 3,100 units of government will be available.
In the future, the local government portion of Open Book will be expanded to include comprehensive information on local property tax burdens, financial information on local public authorities, and demographic information on our State and its inhabitants. Our goal is to become the pre-eminent source of data on local governments in New York State.
Using the new Open Book data format, this annual report gives taxpayers and local officials a new and more meaningful look at financial trends affecting our State. In addition, the report highlights emerging local government issues and summarizes the services and activities of the Division of Local Government and School Accountability, where staff in Albany and eight regional offices across the State continue to promote taxpayers’ interests by helping to improve the fiscal management of local governments and schools within New York.
I hope you find our new format useful. Please let me know your thoughts on how we can continue to make this annual report better. Our contact information is at the back of the report.
Sincerely,
Thomas P. DiNapoli State Comptroller
2008 Annual Report
A MESSAGE FROMNew York State Comptroller Thomas P. DiNapoli

2008 Annual Report OFFICE OF THE STATE COMPTROLLER4
Executive SummaryThe condition of New York’s local government finances is growing increasingly precarious. Long-standing demographic trends have contributed to an underperformance of the upstate economy. Rising health care, energy and other commodity prices have sent shockwaves through the local government expenditure base. A national recession caused in part by the collapse of the housing price bubble, Wall Street’s woes and increasing levels of both inflation and unemployment are likely to result in stagnant revenue growth and reductions in intergovernmental aid. Given the current state of the economy, it is likely these challenges will continue and intensify in the coming year.
Many of the fiscal, demographic and socioeconomic trends point to an environment of difficult times and difficult choices. In its oversight and advocacy role on behalf of local governments, the Office of the State Comptroller (OSC) will put a renewed emphasis on promoting cost savings and best practices, encouraging shared services and regional cooperation, and advocating for policy changes that will help governments operate more efficiently and effectively.
The 2008 Annual Report on Local Governments introduces a new look to the annual local government financial data reported by every county, city, town, village, school district and fire district in New York State. In an effort to promote transparency and accountability, OSC has now made much of the data reported to it from 1996 to 2006 accessible through Open Book New York– a new, user-friendly website that also provides information on spending by State agencies, as well as all State contracts.
This new format is the result of a considerable effort to summarize the detailed information reported by local governments to OSC in more useful and meaningful categories. Through this new classification system and Open Book, readers can easily find information on how local governments generate their revenues, and what activities and services those revenues support. In addition, through Open Book, users of this data can now “drill down” to retrieve additional information on each category of revenue and expense for an individual local government or for an entire class of local government (e.g., all cities).
In the new data classification system, all spending for employee benefits is now captured in one category, making it easy to identify that employee benefits continue to be the fastest growing expense for all classes of local government. With a couple of mouse clicks in Open Book, taxpayers can easily see that the largest expenditure for cities and villages is ensuring the public’s safety through police and fire protection services, and that counties spend the majority of their revenues to support the delivery of social services, including Medicaid.
The new data classification and the ease of retrieving 11 years of financial information for individual municipalities will enhance transparency and accountability. For the first time, taxpayers and local government officials can easily compare revenue and expenditure trends-by-function with those of similar local governments.

5 DIVISION OF LOCAL GOVERNMENT AND SCHOOL ACCOUNTABILITY
Enhancing Transparency with the Release of Open BookIn June of 2008, as part of Comptroller DiNapoli’s effort to promote more openness in government and to give taxpayers better access to the financial workings of government, the Office of the State Comptroller (OSC) launched Open Book New York. Open Book is a website (www.openbooknewyork.com) which provides information on salaries, travel and other expenditures for more than 100 State agencies and more than 60,000 State contracts through user-friendly, searchable databases.
The release of the 2008 Annual Report on Local Governments coincides with the rollout of a new local government component of Open Book, which gives local government officials and taxpayers access to revenue and expenditure data reported to OSC by all cities, towns, villages, school districts and fire districts from 1996 through 2006. In the future, the local government component of the Open Book website will be expanded to include financial information for local public authorities such as Industrial Development Agencies (IDAs), as well as data on real property taxes, local government indebtedness, and constitutional tax and debt limits for each local government. Open Book provides unprecedented access to detailed financial information on local governments for taxpayers and other interested parties.
The consumers of OSC local government data are a diverse group of individuals and organizations. With the release of Open Book, this data will be easier to access than ever before. Taxpayers can use this information to assess how their local governments are using their tax dollars. Municipal officials can use the data to compare their revenues and expenditures with other local governments and help identify potential efficiencies. Research organizations, academics and students can now easily access this data to support their research. Legislative and Executive agency staffs can use the searchable database to assist in analyses used to develop statewide policies. While this data has historically been available to these groups upon request, the launch of the Open Book website provides instantaneous access to this information.
Making Local Government Data More MeaningfulIn addition to making it easier to retrieve data, the Open Book website also arranges financial information in a more meaningful fashion. Over the past several years, OSC has undertaken a major effort to develop a new data classification system that permits the user to “drill down” into certain revenue and expenditure items, reorganizes and clarifies some data categories, and offers greater utility and flexibility in terms of trend analysis and peer-group comparisons. The 2008 Annual Report and the local government data contained in Open Book reflect this new classification system.
2008 Annual Report

2008 Annual Report OFFICE OF THE STATE COMPTROLLER6
What Has Changed?
Drill-Down Capabilities – Information at a More Granular Level
For the end user, the most noticeable change is the level of detail that is now available for the various revenue and expenditure categories. Rather than just having high-level summary data at their disposal, users can “get behind” the numbers for even greater detail. The public has access to two levels of data in Open Book. The broadest category, or Level One, provides users with rolled-up numbers for a general grouping of data. For example, local government revenues are reflected at the highest level in Level One categories that include Real Property Taxes and Assessments, Sales and Use Tax, State Aid, Federal Aid and Charges for Services. Each of these broad Level One categories can be further detailed into more specific Level Two subcategories.
Costs associated with employee benefits are often a topic of discussion. With this new drill-down capability, users will notice that each local government has a Level One expenditure category specifically designated for employee benefits and a Level Two breakout that will allow the user more easily to distinguish expenditures for employee medical insurance, life insurance, disability, etc.
In the example below, three Level Two categories of fees feed into the Level One Charges for Services category. Open Book users can now access both Level One and Level Two data.
Charges for Services
Public Safety Fees
Health Fees
Utility Fees
Account Code 2Account Code 3Account Code 4
Account Code 1
General:Level 1
More Specific:Level 2
Most Specific: Account Code Level
Account Code 2Account Code 3Account Code 4
Account Code 1
Account Code 2Account Code 3Account Code 4
Account Code 1

7 DIVISION OF LOCAL GOVERNMENT AND SCHOOL ACCOUNTABILITY
Reclassifications of Certain Revenue and Expenditure Categories
Much effort has also been directed towards rethinking how the Office of State Comptroller categorizes the various revenues and expenditures for local governments. In some cases, certain revenues and expenditures moved from one grouping to another. In other cases, an entirely new category was created. For example, the expenditure category formerly called Home and Community Services has been eliminated, and three new Level One categories have been created in its place: Community Services, Utilities and Sanitation.
In another departure from past practice, the allocation of account codes to the various Level One and Level Two categories has been more closely aligned with the purpose served, rather than the governmental entity carrying out the service. For example, in the area of Education, users will find that schools now have a broader array of functional expenditures in their data display. Since not all services provided by school districts are strictly educational, it is important to make such distinctions so as to avoid skewing or overstating the actual costs associated with education. School district account codes that pertain to general administrative activities (e.g., district clerk, tax collector) will be included in a Level One General Government expenditure category in the school district’s data display.
Another example can be found in the Health expenditure category. Users will notice a new Level Two category named Environmental Services. While all Health expenditures promote good health for the general public, Environmental Services address the environmental conditions that surround constituents (e.g., insect/rodent control), and are distinguished from other health expenditures that involve more direct interaction with constituents (e.g., mental health services).
Naming Conventions
Users will also notice that changes have been made to the actual names of certain revenue and expenditure categories. These changes were made in an effort to reflect relevant program areas more accurately and to enable users to identify the categories they want to examine quickly and easily. For example, under the former classification system, county Medicaid expenditures were not easily identifiable and were included in a category labeled “Economic Assistance.”
Medicaid is one of the largest expenditure categories for counties in New York, and thus has been the subject of much scrutiny. OSC often received data requests for these expenditures, but they had to be handled on a case-by-case basis. Under the new classification system, Medicaid expenditures are clearly labeled and are more easily found under the renamed, broader and more intuitive Level One Social Services category. With Open Book, any individual looking for this specific information now has the ability to retrieve it at any time.
Additional examples highlighting the components of various Level One and Level Two categories can be found in the State of Local Governments section of this report, and readers can see some of the more interesting Level Two breakouts in the class tables presented at the end of the report. A more detailed listing of the new classification scheme is included as Appendix I to this document.
2008 Annual Report
2008 Annual Report OFFICE OF THE STATE COMPTROLLER8
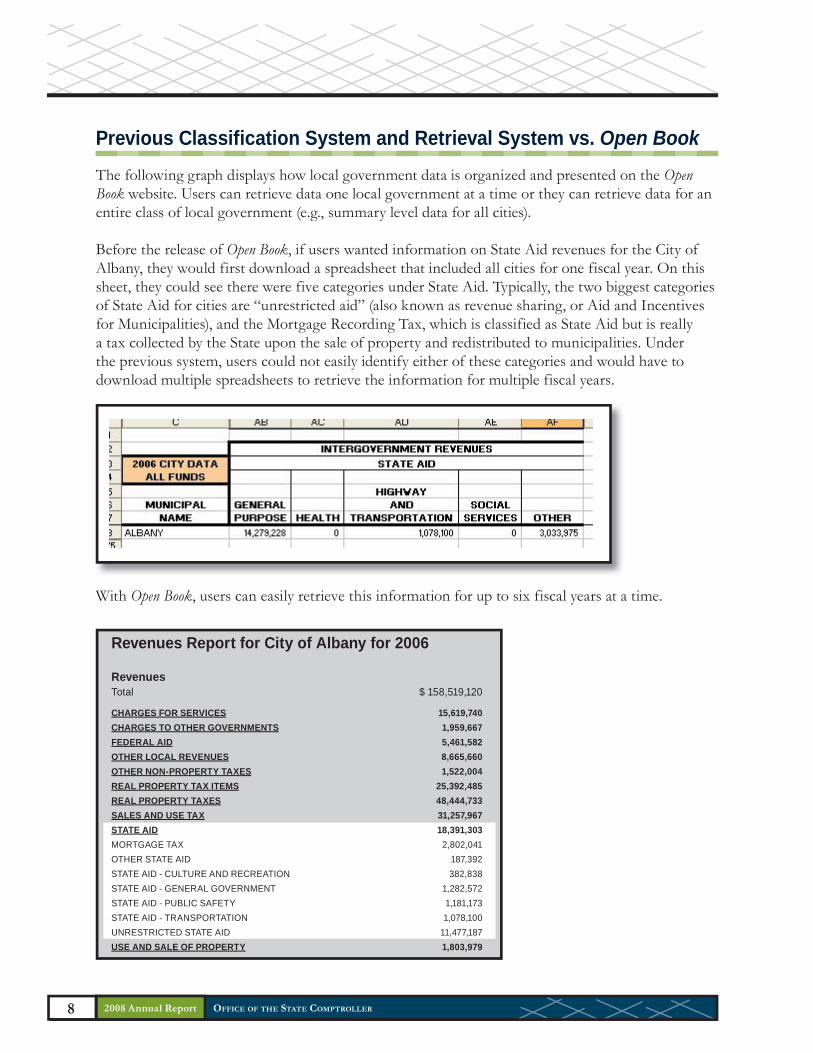
Previous Classification System and Retrieval System vs. Open BookThe following graph displays how local government data is organized and presented on the Open Book website. Users can retrieve data one local government at a time or they can retrieve data for an entire class of local government (e.g., summary level data for all cities).
Before the release of Open Book, if users wanted information on State Aid revenues for the City of Albany, they would first download a spreadsheet that included all cities for one fiscal year. On this sheet, they could see there were five categories under State Aid. Typically, the two biggest categories of State Aid for cities are “unrestricted aid” (also known as revenue sharing, or Aid and Incentives for Municipalities), and the Mortgage Recording Tax, which is classified as State Aid but is really a tax collected by the State upon the sale of property and redistributed to municipalities. Under the previous system, users could not easily identify either of these categories and would have to download multiple spreadsheets to retrieve the information for multiple fiscal years.
Revenues Report for City of Albany for 2006
RevenuesTotal $ 158,519,120
CHARGES FOR SERVICES 15,619,740CHARGES TO OTHER GOVERNMENTS 1,959,667FEDERAL AID 5,461,582OTHER LOCAL REVENUES 8,665,660OTHER NON-PROPERTY TAXES 1,522,004REAL PROPERTY TAX ITEMS 25,392,485REAL PROPERTY TAXES 48,444,733SALES AND USE TAX 31,257,967STATE AID 18,391,303MORTGAGE TAX 2,802,041OTHER STATE AID 187,392STATE AID - CULTURE AND RECREATION 382,838STATE AID - GENERAL GOVERNMENT 1,282,572STATE AID - PUBLIC SAFETY 1,181,173STATE AID - TRANSPORTATION 1,078,100UNRESTRICTED STATE AID 11,477,187USE AND SALE OF PROPERTY 1,803,979
With Open Book, users can easily retrieve this information for up to six fiscal years at a time.

9 DIVISION OF LOCAL GOVERNMENT AND SCHOOL ACCOUNTABILITY
Benefits of this ApproachIn addition to providing the public greater access to local government financial data in a user-friendly format, Open Book and the new classification of the data will enhance the ability of local government officials and other interested parties to conduct unit cost analysis. Unit cost analysis is the practice of developing budgeting and accounting systems in a way that allows program managers to determine the cost per unit of services provided and allows comparisons to be made with similar municipalities. While Open Book does not yet contain the demographic information necessary to complete a unit cost analyses (e.g., the number of fire calls to determine the cost per call to a certain city), the new classification scheme provides local governments with the revenue and expenditure components necessary to begin this analysis.
The new data look also allows local officials to compare their financial data with similar entities more easily. For example, Rochester and Syracuse are major upstate cities with similar demographics. A quick analysis of their respective expenditure charts for 2006 (which can be generated in Open Book) shows what each city spent for public safety. Open Book allows users to see how those public safety dollars were allocated between police and fire services.
Open Book offers users new ways to access and analyze local government fiscal data. Ultimately, this new presentation of data offers users greater clarity on “where the money comes from” and “where the money goes,” and helps highlight the unique fiscal challenges faced by each class of local government.
Rochester 2006 Expenditures
Syracuse 2006 ExpendituresCity of Rochester, 2006PUBLIC SAFETYFIRE PROTECTION 40,561,849 34.1%MISCELLANEOUS PUBLIC SAFETY 2,560,529 2.2%POLICE 66,927,399 56.3%PUBLIC SAFETY ADMINISTRATION 8,742,021 7.4%Total 118,791,798 100.0%
City of Syracuse, 2006PUBLIC SAFETYFIRE PROTECTION 26,161,225 36.0%MISCELLANEOUS PUBLIC SAFETY 4,330,522 6.0%POLICE 42,165,685 58.0%Total 72,657,432 100.0%
2008 Annual Report
2008 Annual Report OFFICE OF THE STATE COMPTROLLER10
The State of Local GovernmentsLocal governments across the State find themselves in an increasingly tenuous financial situation. While it is never easy for local officials to manage the competing demands of service delivery and fiscal restraint, a deteriorating economic environment is further straining already tight local government budgets in every corner of the State.
According to 2007 population estimates, New York ranks 42nd among all states in population growth—significantly lagging other states in the nation. Without foreign immigration, New York’s population would have been essentially stagnant. This trend differs from that in many other states, particularly those in the South and West that are experiencing record levels of population growth. This demographic pattern is not a new phenomenon but rather the continuation of a trend that was set in motion decades ago, when the first signs of manufacturing job loss and population out-migration began to emerge. In western New York, all cities have suffered population declines from 2000 to 2006, as have 75 percent of the region’s towns. While western New York is the hardest hit region, similar patterns hold true for other upstate regions, including the Finger Lakes, the Mohawk Valley, the Southern Tier, central New York and the North Country.
These long-standing demographic trends have contributed to an underperformance in the upstate economy. In turn, local governments have struggled to maintain their revenue base and produce structurally balanced budgets in the face of escalating cost drivers such as health care. The serious nature of these fiscal challenges is evidenced by the growing number of deficit financings the Legislature has authorized over the past five years.
A robust downstate economy and State actions such as the Medicaid expenditure cap for counties and multiyear increases to the State’s Aid and Incentives to Municipalities (AIM) revenue sharing program, have helped forestall more widespread local fiscal problems over the last few years. Now, however, the State is also struggling to cope with the same harsh fiscal realities. The collapse of the housing price bubble, Wall Street’s woes, and increasing levels of unemployment are likely to result in stagnant revenue growth. Compounding these problems are increases in energy and other commodity prices that have sent shockwaves through the government expenditure base. The State will undoubtedly have to make difficult but necessary budget adjustments, including reductions in intergovernmental aid – indeed, this exercise is already well underway. Given the current state of the economy, it is likely that these challenges will continue and intensify in the coming year.
Many fiscal, demographic and socioeconomic trends point to an environment of difficult times and difficult choices. In its oversight and advocacy role on behalf of local governments, OSC will put a renewed emphasis on promoting cost savings and best practices, encouraging shared services and regional cooperation, and advocating for policy changes that will help governments operate more efficiently and effectively.
11 DIVISION OF LOCAL GOVERNMENT AND SCHOOL ACCOUNTABILITY
Economic Outlook
Equities have entered a bear market, falling by 20 percent from their 2007 peak. Write-downs at major U.S. financial firms now exceed $225 billion, with more expected over the balance of 2008. The financial crisis is deepened by the impact of a prolonged housing slump, record fuel prices and a weakening job market. The American economy actually contracted during the last quarter of 2007, and July Commerce Department data shows that the economy expanded by only 1.9 percent between April and June 2008. On the employment side, there was also an increase in new claims for unemployment insurance in the U.S. during the same time period, evidence that there will be more workers without jobs in the near future.1 The national unemployment rate climbed to 6.1 percent in August. The rate increase has been attributed to new difficulties in acquiring credit, fallout from the housing market collapse and high energy prices.
At the State level, the forecast is for virtually no growth in employment and very weak income growth due to deteriorating financial sector bonuses and capital gains. Bonuses are expected to fall by 20 percent, and capital gains by 25 percent.2
New York State’s economy has a significant concentration of firms directly affected by the current financial market crisis, and continued weakening of profitability and employment in the financial sector has a major impact on State finances. When the State Budget was enacted in April 2008, Governor Paterson warned that New York’s economy was slowing and he issued a directive to reduce State operations spending. In late July, Governor Paterson announced a current year shortfall of $630 million, noting that the 2009-10 State Fiscal Year budget gap had increased from $5 billion to $6.4 billion. In response, the Governor reduced State operations spending even further and reached agreement with the Legislature on reductions totaling $427 million in local assistance spending for the 2008-09 State Fiscal Year.
At the local level, the continued softening of the housing market is likely to flatten or reduce growth in the property tax base. Based on quarterly sales data from the New York State Association of Realtors, the housing market in New York State slowed dramatically compared to prior periods. The number of sales occurring in the first quarter ( January–March) decreased in 2008 when compared to 2007 for every region of the State. The decrease was greatest in the downstate regions, with the number of sales decreasing 31 percent below that of the first quarter of 2007. In addition to decreasing sales, the median sale price has declined in most areas as well.
According to RealtyTrac, statewide, the number of home foreclosures increased from 21,826 in 2006 to 38,688 in 2007—an increase of 77 percent. In the first two quarters of 2008, this pattern is continuing. The first quarter of 2008 represented a 40 percent increase over 2007 and the second quarter represented a 62 percent increase. If this rate of increase were to continue for the rest of 2008, over 58,000 New York homeowners could experience a foreclosure in 2008. This would represent a 167 percent increase over the 2006 foreclosure figure.
1 Goodman, Peter S. and Michael M. Grynbaum. G.D.P. Grows at Tepid 1.9% Pace Despite Stimulus. Nytimes.com. July 31, 2008.2 The economic information presented in this discussion does not reflect the most recent developments that have occurred on
Wall Street during the month of September.
2008 Annual Report
2008 Annual Report OFFICE OF THE STATE COMPTROLLER12
Snapshot of Revenues - Fiscal Year Ended 2006
In 2006, local governments (counties, cities, towns, villages, school districts and fire districts, excluding New York City) raised $60.7 billion in revenues from all sources – local, State and federal. The majority of these revenues were generated through real property taxes,3 which totaled $26.5 billion, or 43.7 percent, of all revenues. The second largest revenue category was State Aid at $14.5 billion, or 23.9 percent. Sales tax revenues accounted for $7.2 billion, or 12 percent, of total revenues.
Nearly 70 percent of local government revenues are derived from local sources. The remaining 30 percent comes from State and federal sources, at 23.9 and 6.7 percent, respectively.
Economically sensitive revenue sources, particularly the sales tax and mortgage recording tax, but also intergovernmental aid supported by the personal income tax, are hit hardest by poor economic performance.
Sales Tax Collections
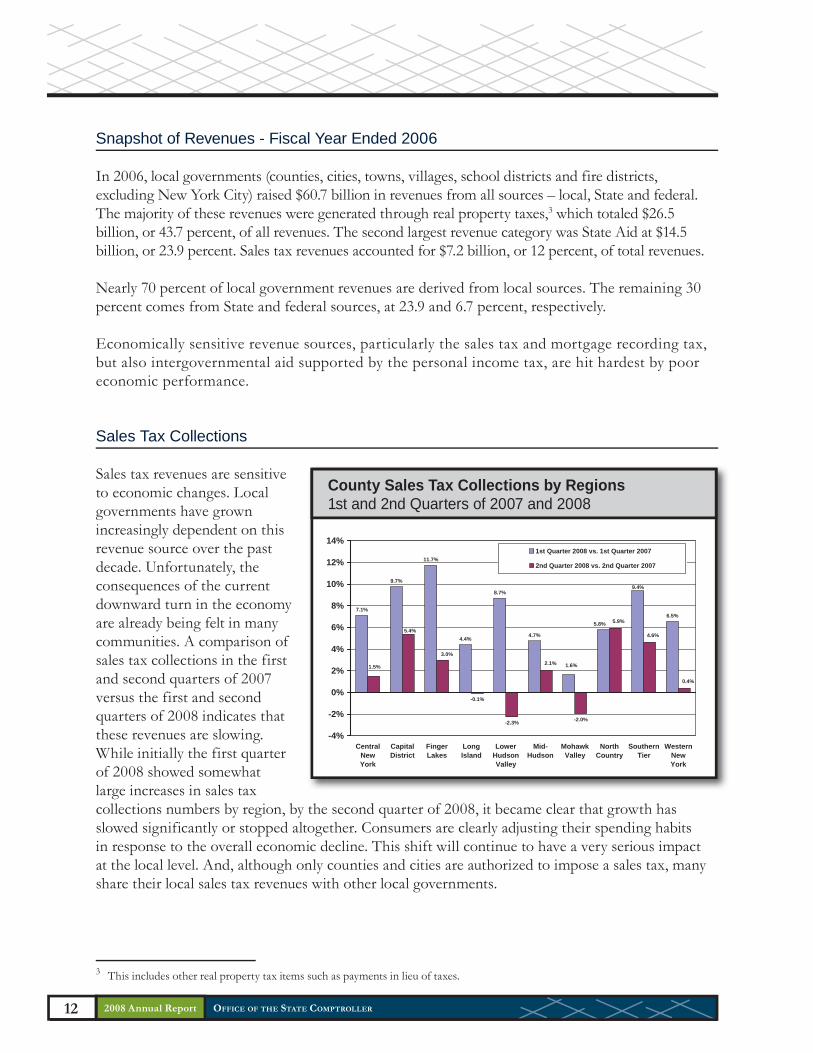
Sales tax revenues are sensitive to economic changes. Local governments have grown increasingly dependent on this revenue source over the past decade. Unfortunately, the consequences of the current downward turn in the economy are already being felt in many communities. A comparison of sales tax collections in the first and second quarters of 2007 versus the first and second quarters of 2008 indicates that these revenues are slowing. While initially the first quarter of 2008 showed somewhat large increases in sales tax collections numbers by region, by the second quarter of 2008, it became clear that growth has slowed significantly or stopped altogether. Consumers are clearly adjusting their spending habits in response to the overall economic decline. This shift will continue to have a very serious impact at the local level. And, although only counties and cities are authorized to impose a sales tax, many share their local sales tax revenues with other local governments.
7.1%
9.7%
11.7%
4.4%
8.7%
4.7%
6.5%
-0.1%
-2.3% -2.0%
5.8%
1.6%
9.4%
0.4%
2.1%3.0%
1.5%
5.4%
5.9%
4.6%
-4%
-2%
0%
2%
4%
6%
8%
10%
12%
14%
CentralNewYork
CapitalDistrict
FingerLakes
LongIsland
LowerHudsonValley
Mid-Hudson
MohawkValley
NorthCountry
SouthernTier
WesternNewYork
1st Quarter 2008 vs. 1st Quarter 2007
2nd Quarter 2008 vs. 2nd Quarter 2007
County Sales Tax Collections by Regions1st and 2nd Quarters of 2007 and 2008
3 This includes other real property tax items such as payments in lieu of taxes.

13 DIVISION OF LOCAL GOVERNMENT AND SCHOOL ACCOUNTABILITY
Mortgage Recording Taxes
The crisis in the housing market affects local governments on many different levels. Towns are most affected when homes are not selling because of their heavy reliance on mortgage recording taxes. Mortgage recording taxes are collected by the counties and distributed to municipalities as State Aid. These mortgage taxes, which made up 6.8 percent of revenues in towns in 2006, had increased at an annual rate of 15.3 percent from 2001 to 2006, although in 2005 and 2006, towns experienced two consecutive decreases in mortgage tax revenues. Some towns on Long Island are particularly affected. In the first half of 2007, mortgage tax collection across Long Island decreased by about $94 million, or 42 percent, compared to the first half of 2006.4
State Aid
Given the current State budget crisis, the risk to future State Aid commitments to local governments is a very real one. As the State struggles to cope with its own lower-than-expected revenues, it will be more difficult to continue to provide the same level of support as is currently provided, or maintain the commitment to increase this aid.
Over the past several years, cities, towns and villages have seen unprecedented increases in revenue sharing aid. The Aid and Incentives for Municipalities (AIM) program was enacted in the 2005-06 State Budget. In 2006, cities received over $464 million in unrestricted State Aid – a one-year increase of more than 13 percent. Cities will receive over $693 million in the 2008-09 State fiscal year, which represents a 68.8 percent increase in unrestricted State Aid since 2004-05. Towns and villages have received 39 and 36 percent increases, respectively, during the same time period. In total, the State has increased revenue sharing payments to local governments by $220 million (28 percent) since March 2005. School districts have also received substantial increases in aid. In 2006, districts outside New York City received $10.3 billion in State Aid. Between 1996 and 2006, school districts benefited from aid increases of more than $3.5 billion (53 percent).
Counties do not receive revenue sharing aid. Most county “aid” comes in the form of reimbursements from the State for providing mandated social services in their communities. In the current budgetary environment, cities, towns and villages could be more vulnerable to aid reductions because those funds are not tied to reimbursable activities. However, county reimbursements could also be reduced without a commensurate reduction in mandated services.
4 Lam, Chau. Mortgage tax revenue down about 42% for LI. Newsday.com. July 25, 2008.
$0
$100
$200
$300
$400
$500
1996 1997 1998 1999 2000 2001 2002 2003 2004 2005 2006
2000 - 2004:167% increase
Mortgage Recording Taxes in Towns
Mill
ions
2008 Annual Report

2008 Annual Report OFFICE OF THE STATE COMPTROLLER14
Property Tax
New York’s property tax burden – the third highest in the country per capita – continues to be a fiscal pressure point. Local governments (including New York City) collect nearly $40 billion in property tax revenues annually, and property taxes have grown faster than inflation in recent years. The increase in other local revenue sources over the last decade reflects efforts by local officials to try and mitigate local property tax increases in their communities.
The State has also taken several steps to help reduce property tax burdens. The STAR program was significantly expanded over the past three years; STAR now provides almost $5 billion in tax relief to homeowners. Yet STAR has done little to reduce local property tax growth, and attention has been increasingly given to property tax caps or circuit breakers as a way to provide additional relief.
In addition, the need for property assessment reform is increasing. New York’s 1,128 assessing units are not required to assess properties on any schedule, nor by any set standard, or even by a given percentage of full market value. Twenty percent of assessing units do not meet minimal standards for assessment uniformity.5 Reform in this area would improve the equity and efficiency of the property tax system, however it may be modified in the future.
Snapshot of Expenditures - Fiscal Year Ended 2006
Total spending for all major classes of local government, excluding New York City, was $64.6 billion in 2006. Current operations accounted for the largest portion of spending – 85.3 percent. Equipment and capital outlay accounted for 8.6 percent and debt service accounted for six percent. Within current operations, personal services account for 43.8 percent of total spending, contractual services for 37.7 percent and employee benefits for 18.5 percent.
Local governments face increasingly tough choices when it comes to paring down budgets. Cutting costs generally means reducing the menu of services available to residents or rethinking how services are delivered. As a result, more attention is being given to streamlining service delivery, cooperative approaches such as functional consolidation or intermunicipal agreements with other governments, and developing multiyear budget and capital plans so that local governments can understand how decisions made today can affect the “bottom line” in the future.
5 See the 2006 Assessment Equity in NYS report at: www.orps.state.ny.us/ref/pubs/cod/2006mvs/reporttext.htm#notstandard
15 DIVISION OF LOCAL GOVERNMENT AND SCHOOL ACCOUNTABILITY
Risks on the Expenditure Side
Growth in Employee Benefits Continues
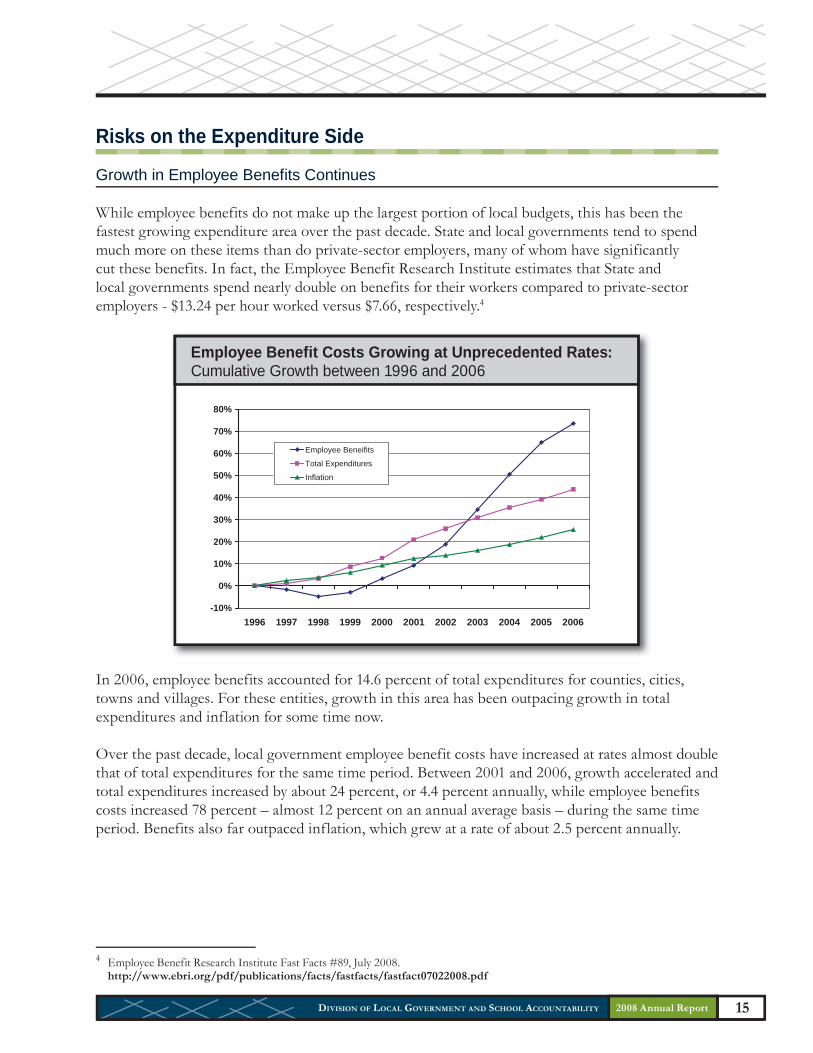
While employee benefits do not make up the largest portion of local budgets, this has been the fastest growing expenditure area over the past decade. State and local governments tend to spend much more on these items than do private-sector employers, many of whom have significantly cut these benefits. In fact, the Employee Benefit Research Institute estimates that State and local governments spend nearly double on benefits for their workers compared to private-sector employers - $13.24 per hour worked versus $7.66, respectively.4
In 2006, employee benefits accounted for 14.6 percent of total expenditures for counties, cities, towns and villages. For these entities, growth in this area has been outpacing growth in total expenditures and inflation for some time now.
Over the past decade, local government employee benefit costs have increased at rates almost double that of total expenditures for the same time period. Between 2001 and 2006, growth accelerated and total expenditures increased by about 24 percent, or 4.4 percent annually, while employee benefits costs increased 78 percent – almost 12 percent on an annual average basis – during the same time period. Benefits also far outpaced inflation, which grew at a rate of about 2.5 percent annually.
4 Employee Benefit Research Institute Fast Facts #89, July 2008. http://www.ebri.org/pdf/publications/facts/fastfacts/fastfact07022008.pdf
-10%
0%
10%
20%
30%
40%
50%
60%
70%
80%
1996 1997 1998 1999 2000 2001 2002 2003 2004 2005 2006
Employee Beneifits
Total Expenditures
Inflation
Employee Benefit Costs Growing at Unprecedented Rates: Cumulative Growth between 1996 and 2006
2008 Annual Report

2008 Annual Report OFFICE OF THE STATE COMPTROLLER16
Employee benefit costs are difficult for local governments to control. These costs are usually tied to labor contracts which are negotiated only every few years, and are sometimes subject to binding arbitration. In addition, medical insurance costs continue to grow significantly faster than inflation.
OSC recently released employer pension contribution rates for 2010. Once again, the rates have dropped. The average employer contribution rate for the Employees’ Retirement System will decrease from 8.5 percent to 7.4 percent, while the average employer contribution rate for the Police and Fire Retirement System will decrease from 15.7 percent to 15.1 percent. Although the savings generated by the lower rates are helpful in these financially difficult times, the Comptroller has cautioned that if current economic conditions result in lower-than-expected investment performance, local governments should expect contribution rates to rise in the future.
Escalating Fuel Costs
The tremendous growth in fuel costs has also presented a new set of challenges for local governments. The price of fuel affects many aspects of a local budget. For example, in school districts not only must officials figure out ways to maximize the efficiency of their existing bus routes, they must also consider the impact that rising fuel costs have on their school lunch programs, since food prices are also influenced by the cost of fuel.
The U.S. Department of Labor energy index, which reflects prices for gasoline and household fuels, rose 2.3 percent in July 2008, due to increases in gasoline prices (0.8 percent), increases in utility gas services (8.3 percent), and electricity (2.9 percent). Overall, the energy index was 31.1 percent higher than in July 2007.5
5 United States Department of Labor, Bureau of Labor Statistics. August 15, 2008. Consumer Prices in the Northeast: July 2008.
$371 $431$782
$1,373 $1,446
$2,522$387$466
$856
$341
$165 $182
$0
$500
$1,000
$1,500
$2,000
$2,500
$3,000
$3,500
$4,000
$4,500
$5,000
1996 2001 2006
City County
Town Village
Employee Benefit Expenditures by Class
Mill
ions
17 DIVISION OF LOCAL GOVERNMENT AND SCHOOL ACCOUNTABILITY
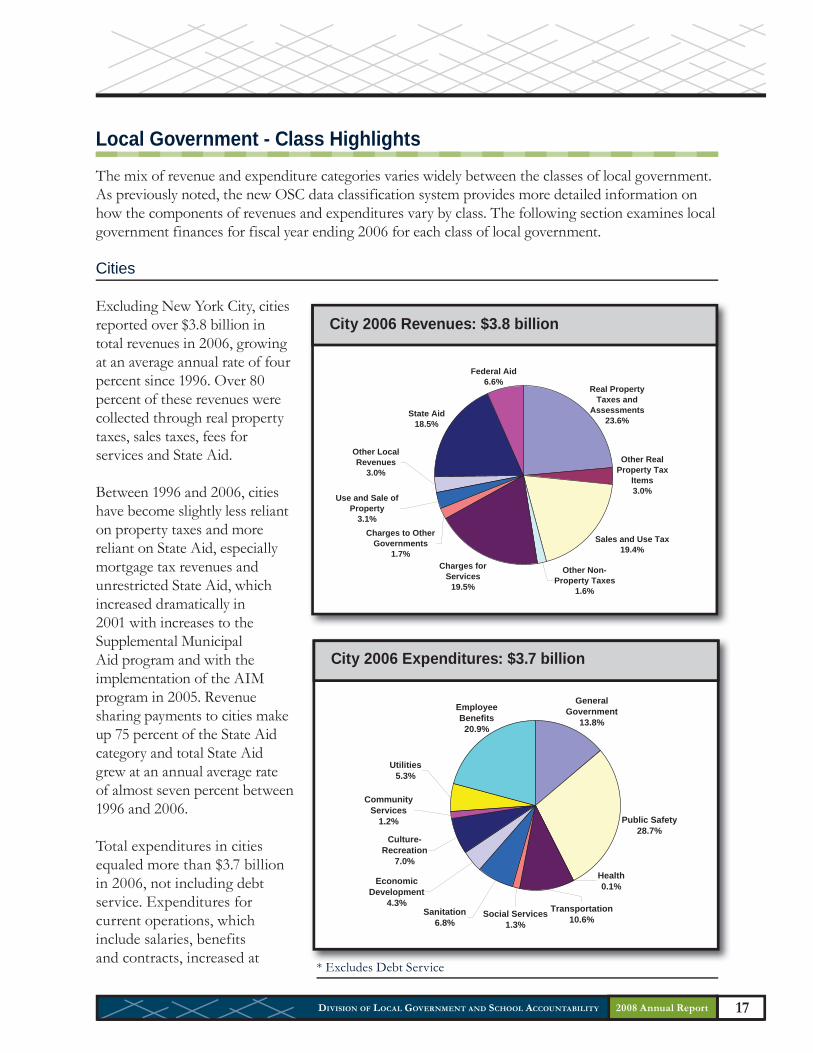
Local Government - Class HighlightsThe mix of revenue and expenditure categories varies widely between the classes of local government. As previously noted, the new OSC data classification system provides more detailed information on how the components of revenues and expenditures vary by class. The following section examines local government finances for fiscal year ending 2006 for each class of local government.
Cities
Excluding New York City, cities reported over $3.8 billion in total revenues in 2006, growing at an average annual rate of four percent since 1996. Over 80 percent of these revenues were collected through real property taxes, sales taxes, fees for services and State Aid.
Between 1996 and 2006, cities have become slightly less reliant on property taxes and more reliant on State Aid, especially mortgage tax revenues and unrestricted State Aid, which increased dramatically in 2001 with increases to the Supplemental Municipal Aid program and with the implementation of the AIM program in 2005. Revenue sharing payments to cities make up 75 percent of the State Aid category and total State Aid grew at an annual average rate of almost seven percent between 1996 and 2006.
Total expenditures in cities equaled more than $3.7 billion in 2006, not including debt service. Expenditures for current operations, which include salaries, benefits and contracts, increased at
* Excludes Debt Service
Other Real Property Tax
Items3.0%
Sales and Use Tax19.4%
State Aid18.5%
Other Local Revenues
3.0%
Use and Sale of Property
3.1%
Other Non-Property Taxes
1.6%
Charges for Services
19.5%
Charges to Other Governments
1.7%
Real Property Taxes and
Assessments23.6%
Federal Aid6.6%
City 2006 Revenues: $3.8 billion
* Excludes Debt Service
CommunityServices
1.2%
GeneralGovernment
13.8%
Social Services1.3%
Transportation10.6%
Health0.1%
Sanitation6.8%
EconomicDevelopment
4.3%
Culture-Recreation
7.0%
EmployeeBenefits
20.9%
Utilities5.3%
Public Safety28.7%
City 2006 Expenditures: $3.7 billion
2008 Annual Report

2008 Annual Report OFFICE OF THE STATE COMPTROLLER18
an average annual rate of almost four percent between 1996 and 2006, while expenditures for equipment and capital increased at about 4.5 percent annually.
The largest category of functional expenditure was public safety, which was responsible for $1.1 billion (29 percent) of all functional expenditures in 2006. Police and fire expenditures make up 93 percent of all public safety expenditures in cities. Public safety expenditures grew at an average annual rate of 4.2 percent between 1996 and 2006.
Counties
Counties collected over $18 billion in revenues in 2006. Counties are now more dependent on the sales tax than on real property taxes. Sales tax revenues have increased dramatically – 78 percent over the past 10 years and 52 percent between 2001 and 2006. Again, sales tax revenues are sensitive to economic fluctuations and are less controllable than other revenue streams. As such, OSC has cautioned counties to project these revenues conservatively given the current economic environment.
Although counties receive no unrestricted State Aid through the AIM program, they received over $2.7 billion in State Aid in 2006, mostly for reimbursement of State-mandated programs for social services, highways, health, public safety and other purposes.
* Excludes Debt Service* Excludes Debt Service
Education5.9%
Public Safety14.0%
Utilities0.5%
EmployeeBenefits
13.4%Culture-Recreation
1.5%
EconomicDevelopment
0.8%
Sanitation4.0%
Health9.3%
Transportation6.9%
Social Services27.8%
GeneralGovernment
14.2%
CommunityServices
1.6%
County 2006 Expenditures: $18.8 billion
Other Real Property Tax
Items1.4%
Sales and Use Tax30.3%
State Aid14.8%
Federal Aid11.3%
Real Property Taxes and
Assessments23.5%
Charges to Other Governments
2.2%Charges for
Services12.3%
Other Non-Property Taxes
0.5%
Use and Sale of Property
1.9%
Other Local Revenues
1.8%
County 2006 Revenues: $18.3 billion
19 DIVISION OF LOCAL GOVERNMENT AND SCHOOL ACCOUNTABILITY
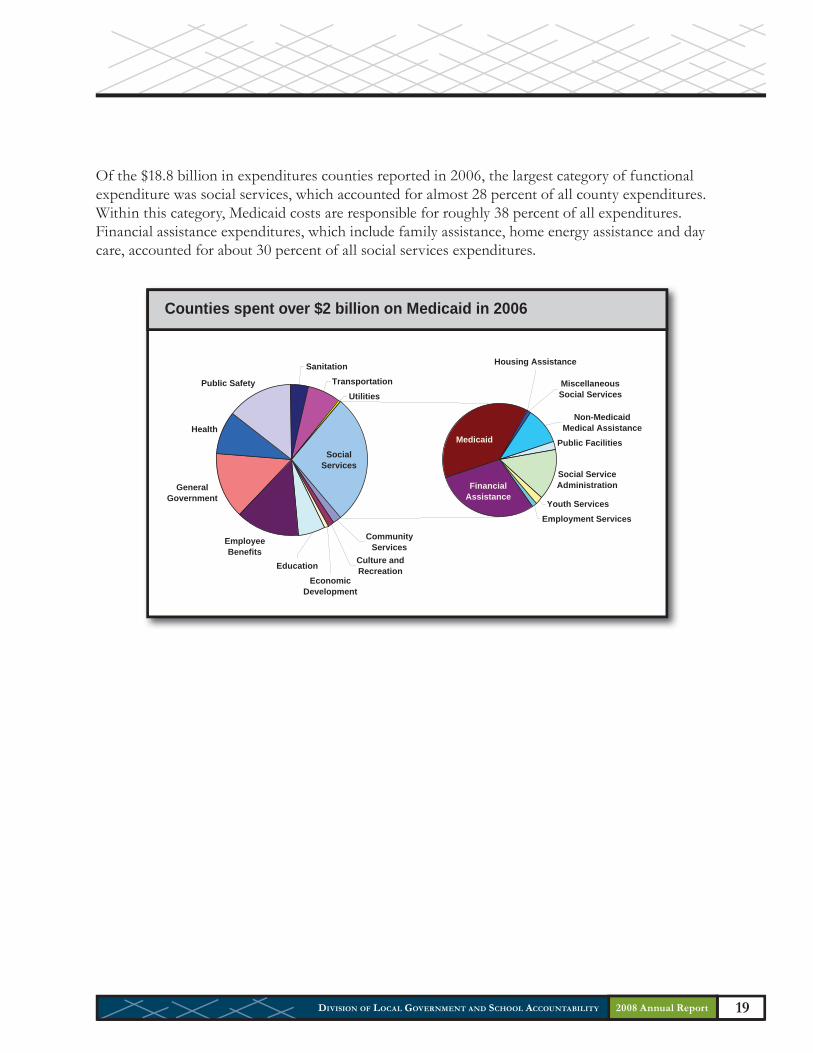
Of the $18.8 billion in expenditures counties reported in 2006, the largest category of functional expenditure was social services, which accounted for almost 28 percent of all county expenditures. Within this category, Medicaid costs are responsible for roughly 38 percent of all expenditures. Financial assistance expenditures, which include family assistance, home energy assistance and day care, accounted for about 30 percent of all social services expenditures.
Employment Services
Youth Services
Public Facilities
Sanitation
Transportation
Utilities
Health
Public Safety
Medicaid
Housing Assistance
Non-MedicaidMedical Assistance
EmployeeBenefits
GeneralGovernment
MiscellaneousSocial Services
Social Service AdministrationFinancial
Assistance
CommunityServices
Culture and RecreationEducation
EconomicDevelopment
SocialServices
Counties spent over $2 billion on Medicaid in 2006
2008 Annual Report

2008 Annual Report OFFICE OF THE STATE COMPTROLLER20
Towns
Towns are heavily dependent on real property tax revenues. Almost half of all revenues in towns, $2.97 billion, are collected through the real property tax. Real property tax revenues have increased at an average annual rate of over five percent between 2001 and 2006.
However, certain towns (particularly suburban towns downstate) have also become more reliant on economically sensitive revenue streams – namely, the mortgage recording tax and sales taxes. Because of the housing boom in the late 1990s and early 2000s, mortgage recording taxes, which are classified as State Aid, increased over 260 percent between 1996 and 2006, or at an average annual rate of 13.7 percent. With the housing market crisis now in full swing, mortgage recording tax revenues are declining. Similarly, sales tax revenues, which are responsible for over nine percent of all town revenues, have increased an average of five percent annually from 1996 to 2006. Unfortunately, that growth is expected to weaken with the economy.
Not including debt service, towns spent $6 billion in 2006, with transportation being the largest single category of expense, responsible for $1.2 billion in costs. Towns spent almost $900 million on highways alone in 2006, more than $250 million more than in 1996.
Many towns are also responsible for garbage collection. Refuse and garbage is the largest component in the sanitation functional category, responsible for $586 million in 2006 expenditures, or 68 percent of all sanitation expenditures. Public safety expenditures also increased significantly in towns– 67 percent from 1996 to 2006, or 5.3 percent on an average annual basis.
* Excludes Debt Service* Excludes Debt Service
Community Services1.8%
General Government17.3%
Sanitation14.4%
Transportation20.2%
Health0.7%
Social Services1.1%
EconomicDevelopment
1.0%
Culture-Recreation9.3%
Employee Benefits14.3%Utilities
6.2%
Public Safety13.6%
Town 2006 Expenditures: $6.0 billion
State Aid11.0%
Sales and Use Tax9.1%
Other Real Property Tax
Items1.1%
Other Local Revenues
2.7%
Use and Sale of Property
3.8%
Other Non-Property Taxes
2.0%
Charges for Services
14.8%
Charges to Other Governments
2.8%
Real Property Taxes and
Assessments49.3%
Federal Aid3.3%
Town 2006 Revenues: $6.0 billion

21 DIVISION OF LOCAL GOVERNMENT AND SCHOOL ACCOUNTABILITY
Villages
Villages had $2.3 billion in total revenue in 2006, with $998 million collected through the real property tax. Real property tax growth has outpaced inflation in villages, growing at an average annual rate of more than 4.2 percent since 1996.
Besides being reliant on real property tax revenues, villages collected over $632 million in charges for services, over half of which comes through the sale of water and electricity. Villages also rely on charges for services, especially payments for utilities, more than any other class of local government. In fact, revenue from the sale of electricity increased 82 percent between 1996 and 2006, or roughly 6.2 percent on an average annual basis.
Villages spent 20 percent of their $2.3 billion budget on public safety, the largest category of functional expenditure. Taking a closer look at public safety expenditures, police and fire were responsible for nearly 90 percent of all expenditures – over $410 million.
Within the utilities category, villages spent over $300 million to operate electric and water plants in 2006.
* Excludes Debt Service
Public Safety20.2%
Utilities13.8%
EmployeeBenefits
14.8%
Culture-Recreation
6.9%
EconomicDevelopment
1.1% Sanitation12.4%
Health0.1%
Transportation12.4%
Social Services1.2%
GeneralGovernment
16.2%
CommunityServices
0.9%
Village 2006 Expenditures: $2.3 billion
State Aid6.2%
Federal Aid3.6%
Real Property Taxes and
Assessments43.7%Charges to Other
Governments3.7%
Charges for Services
27.7%
Other Non-Property Taxes
0.8%
Use and Sale of Property
2.9%
Other Local Revenues
3.5%
Other Real Property Tax
Items1.3%
Sales and Use Tax
6.7%
Village 2006 Revenues: $2.3 billion
2008 Annual Report
2008 Annual Report OFFICE OF THE STATE COMPTROLLER22
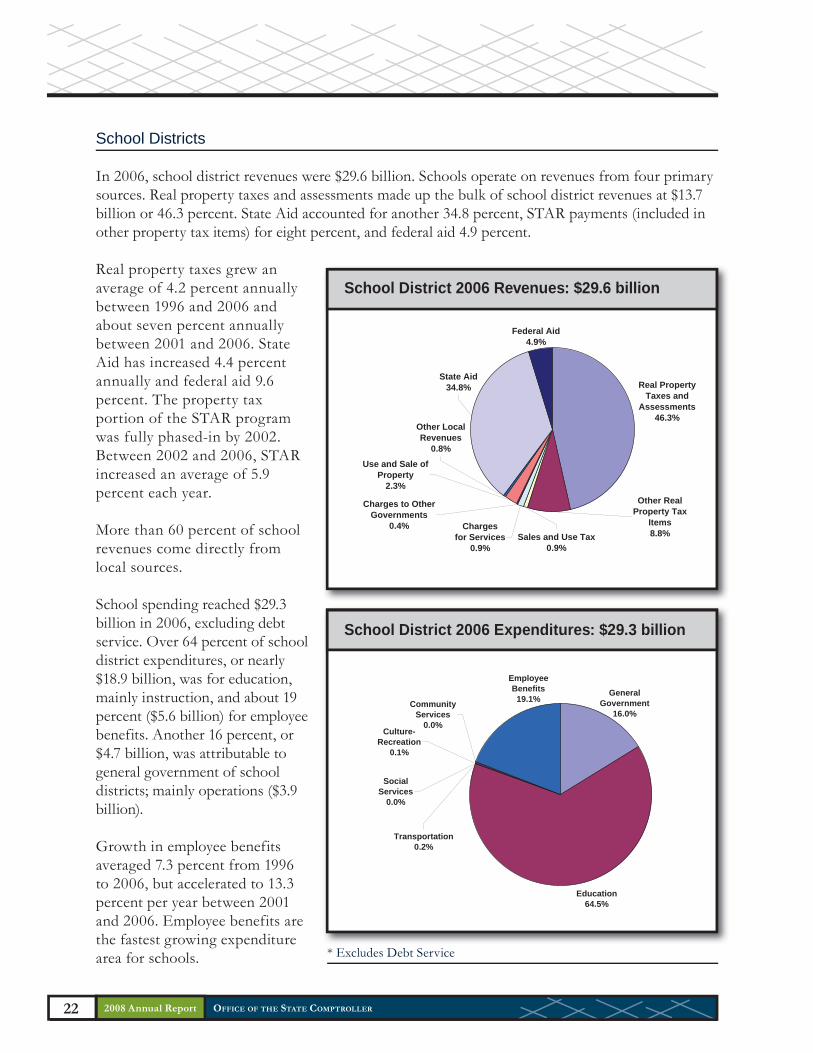
School Districts
In 2006, school district revenues were $29.6 billion. Schools operate on revenues from four primary sources. Real property taxes and assessments made up the bulk of school district revenues at $13.7 billion or 46.3 percent. State Aid accounted for another 34.8 percent, STAR payments (included in other property tax items) for eight percent, and federal aid 4.9 percent.
Real property taxes grew an average of 4.2 percent annually between 1996 and 2006 and about seven percent annually between 2001 and 2006. State Aid has increased 4.4 percent annually and federal aid 9.6 percent. The property tax portion of the STAR program was fully phased-in by 2002. Between 2002 and 2006, STAR increased an average of 5.9 percent each year.
More than 60 percent of school revenues come directly from local sources.
School spending reached $29.3 billion in 2006, excluding debt service. Over 64 percent of school district expenditures, or nearly $18.9 billion, was for education, mainly instruction, and about 19 percent ($5.6 billion) for employee benefits. Another 16 percent, or $4.7 billion, was attributable to general government of school districts; mainly operations ($3.9 billion).
Growth in employee benefits averaged 7.3 percent from 1996 to 2006, but accelerated to 13.3 percent per year between 2001 and 2006. Employee benefits are the fastest growing expenditure area for schools.
Education64.5%
GeneralGovernment
16.0%
Culture-Recreation
0.1%
EmployeeBenefits
19.1%
Transportation0.2%
SocialServices
0.0%
CommunityServices
0.0%
School District 2006 Expenditures: $29.3 billion
Sales and Use Tax0.9%
Other Real Property Tax
Items8.8%
State Aid34.8%
Other Local Revenues
0.8%
Chargesfor Services
0.9%
Charges to Other Governments
0.4%
Use and Sale of Property
2.3%
Real Property Taxes and
Assessments46.3%
Federal Aid4.9%
School District 2006 Revenues: $29.6 billion
* Excludes Debt Service

23 DIVISION OF LOCAL GOVERNMENT AND SCHOOL ACCOUNTABILITY
Fire Districts
Fire districts collected $612 million in revenues in 2006. Real property taxes were responsible for 90 percent of their total revenues. Total revenues grew at an average rate of 5.7 percent annually between 1996 and 2006.
On the expenditure side, 82 percent of fire district spending was on fire protection. Total expenditures, other than debt service, grew at an average rate of 5.3 percent annually between 1996 and 2006. Under employee benefits, the largest expenditures were for Length of Service Award Programs, a pension-like fund for volunteer firefighters (LOSAP), workers’ compensation and medical insurance.
* Excludes Debt Service* E l d D b S i
GeneralGovernment
0.2%
Public Safety81.6%
Employee Benefits18.1%
Fire District 2006 Expenditures: $559 million
Charges to Other Governments
2.1%
Other Real Property Tax Items
0.3%
Federal Aid0.5%
Use and Sale of Property
4.3%
Other Local Revenues
3.0%
State Aid0.2%
Real Property Taxes and
Assessments89.6%
Fire District 2006 Revenues: $612 million
2008 Annual Report
2008 Annual Report OFFICE OF THE STATE COMPTROLLER24
Note: Financial data for New York City comes directly from the City’s Comprehensive Annual Financial Report. This data does not correspond to the same reporting structure to which other classes of local government adhere. More detailed financial data for New York City is included on pages 62 and 63 of this document.
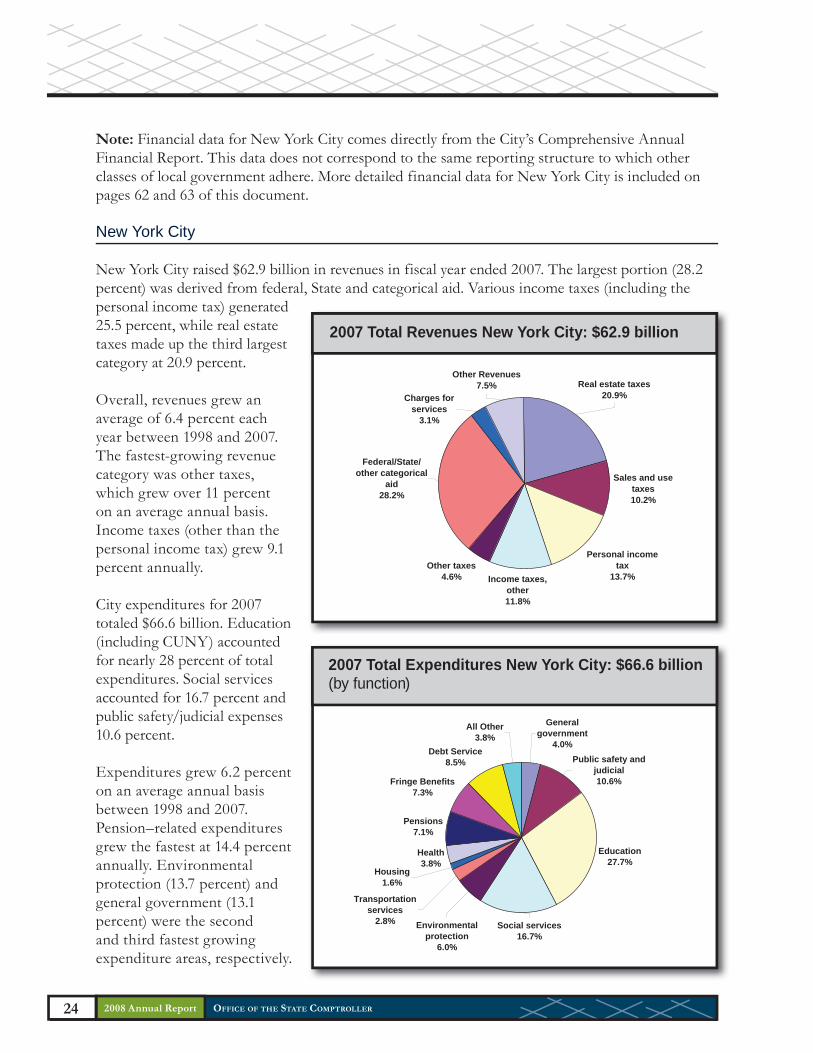
New York City
New York City raised $62.9 billion in revenues in fiscal year ended 2007. The largest portion (28.2 percent) was derived from federal, State and categorical aid. Various income taxes (including the personal income tax) generated 25.5 percent, while real estate taxes made up the third largest category at 20.9 percent.
Overall, revenues grew an average of 6.4 percent each year between 1998 and 2007. The fastest-growing revenue category was other taxes, which grew over 11 percent on an average annual basis. Income taxes (other than the personal income tax) grew 9.1 percent annually.
City expenditures for 2007 totaled $66.6 billion. Education (including CUNY) accounted for nearly 28 percent of total expenditures. Social services accounted for 16.7 percent and public safety/judicial expenses 10.6 percent.
Expenditures grew 6.2 percent on an average annual basis between 1998 and 2007. Pension–related expenditures grew the fastest at 14.4 percent annually. Environmental protection (13.7 percent) and general government (13.1 percent) were the second and third fastest growing expenditure areas, respectively.
Generalgovernment
4.0%Public safety and
judicial10.6%
Education27.7%
Health3.8%
Pensions7.1%
Fringe Benefits7.3%
Debt Service8.5%
Social services16.7%
All Other3.8%
Environmentalprotection
6.0%
Housing1.6%
Transportationservices
2.8%
Sales and use taxes10.2%
Personal income tax
13.7%Income taxes, other11.8%
Other taxes4.6%
Real estate taxes20.9%
Federal/State/other categorical
aid28.2%
Charges for services
3.1%
Other Revenues7.5%
2007 Total Revenues New York City: $62.9 billion
2007 Total Expenditures New York City: $66.6 billion(by function)

25 DIVISION OF LOCAL GOVERNMENT AND SCHOOL ACCOUNTABILITY
2008 State Legislation Affecting Local GovernmentsThe State Legislature approved several bills in the 2008 session that affect New York State’s local governments, some of which were priorities of the State Comptroller.
One topic that garnered significant attention during the 2008 session was the Governor’s program bill to place a cap on property taxes, which was introduced and approved by the Senate but has not been acted upon by the Assembly. Other measures that passed both houses included bills addressing special districts, justice courts, control boards, deficit financing, the subprime mortgage crisis and electronic bidding. While not an exhaustive list, the following are recently passed or enacted laws that will affect local governments:
Special Improvement Districts with Separate Boards of Commissioners (Chapter 421): This legislation was submitted by the Comptroller. Most special improvement districts are administered by the towns in which they are located. In special districts with separate boards of commissioners, towns have little or no control over the budgeting process. The accountability measures included in this bill target these districts, the majority of which are located in Nassau County.
This law requires these special districts to publish notices of public meetings, hearings and elections on the district’s website and also on the website of the town in which the district is located, and requires these districts to hold a public hearing on the annual estimate of proposed revenues and expenditures on a specific date. Access to this information will improve accountability and openness in the operation of these districts.
Deficit Financing (Chapters 260, 270 and 282): Three local governments: the Chenango Valley Central School District (Broome County), the Town of Deerpark (Orange County), and the Town of East Hampton (Suffolk County), are now authorized to issue bonds and bond anticipation notes to liquidate accumulated deficits in various funds.
Justice Court Merging (Chapter 87): This bill amends both the Uniform Justice Court Act and Town Law to provide for the election of a single town justice to serve justice courts in two or more adjacent towns. The focus of this bill is not to consolidate existing justice courts, but instead to permit the election of one justice to preside over multiple justice courts.
Electronic Bidding (Chapter 134): This legislation was submitted by the Comptroller. This bill extends the authorization for local governments to utilize electronic bidding for sales of bonds or notes. The extension continues greater flexibility to local governments in conducting public sales of bonds and soliciting bids for purchase contracts by allowing the use of current technology to accept bids submitted in an electronic format as well as in paper format.
2008 Annual Report

2008 Annual Report OFFICE OF THE STATE COMPTROLLER26
Length of Service Award Program (LOSAP) Audits (Chapter 458): This legislation was submitted by the Comptroller. As part of the fire district reforms passed in the 2006 Legislative session, fire districts were required to complete an audit within 90 days of the end of a LOSAP’s fiscal year. This bill extends the time to file LOSAP audits from 90 to 270 days.
Buffalo Fiscal Stability Authority (Veto Message 85): This bill was vetoed by the Governor. It sought to alter the terms by which a control period could be imposed on the City of Buffalo. It was vetoed on the premise that it may violate bondholder rights, and would set a precedent that could weaken the State’s ability to utilize control boards effectively. A similar bill was vetoed last year.
Subprime Mortgage Borrower Protection (Chapter 472): In the wake of the subprime mortgage crisis affecting taxpayers across the country and in New York State, this bill offers protections to those currently at risk of foreclosure by making it more difficult for lending institutions to foreclose and offering settlement conferences to those currently being foreclosed upon. The bill also establishes new responsibilities for lenders and brokers.
Erie County Fiscal Stability Authority (Veto Message 136): This bill was also vetoed by the Governor. It would have allowed Erie County to borrow on its own behalf if two nationally recognized rating agencies gave it an investment grade bond rating. The Fiscal Stability Authority was created to use its superior bond rating to assist Erie County with borrowing, with a level of supervision. According to the veto message, Governor Paterson rejected this legislation on the grounds that it would undermine the mission of the Authority.
Task Force on Retiree Health Protection (Veto Message 113): This bill would have established a group to study and recommend strategies to protect affordable health insurance coverage for retired public employees and their families and implemented a moratorium on changes affecting retirees in the existing health insurance program. While he openly supported the mission of the bill, the Governor vetoed it, citing the following weaknesses: the structure of the task force was not a diverse enough representation of the stakeholders involved, the bill language was too vague in some parts and too rigid in others, and the retroactive effective date would cause confusion.
In an attempt to stimulate a “productive dialog directed at finding the appropriate balance” between protecting the interests of retirees and insuring flexibility for State and local governments, Governor Paterson has stated that he will issue an Executive Order creating a task force to study the issue, while sidestepping many of the flaws in the original bill.
27 DIVISION OF LOCAL GOVERNMENT AND SCHOOL ACCOUNTABILITY
Audits and OversightOSC has the constitutional and statutory responsibility to oversee the fiscal affairs of more than 4,200 government entities in New York State. OSC’s Division of Local Government and School Accountability works closely with local governments, and performs periodic audits on municipalities and schools throughout the State.
Accountability Audits
The Division’s accountability audits ensure that control systems are in place to safeguard the assets of local governments. A subset of accountability audits – fraud audits – reveals how the lack of adequate controls can lead to criminal abuse of local government assets. In 2007, OSC found nearly $6 million in local government assets that had been misappropriated through fraud.
• Monroe County – County officials used the County of Monroe Industrial Development Agency (COMIDA), a third-party public benefit corporation, to provide State grant funds (to which the County was entitled) to AirTran Airways, a private business enterprise. The County agreed to permit COMIDA to receive $2.5 million in State grants that were intended to be reimbursement payments to the County for a capital improvement project for airport improvements. At the County’s request, COMIDA used these funds to pay $2.5 million to AirTran Airways, a low-cost airline, in the form of a subsidy. These payments represent an indirect gift of County funds to a private entity. Neither the County nor COMIDA is authorized to make outright cash subsidies of its moneys to private entities.
• Poughkeepsie City School District – The District’s former superintendent circumvented internal controls to allow for $1.2 million in questionable expenditures, including four newly created positions and improper payments to administrators and contractors. The former superintendent failed to consider other candidates when filling the four newly created positions, breaking District policy. The District paid these individuals nearly $723,000. In addition, 16 employees, including the former superintendent, were granted additional compensation or benefits totaling $204,000 without proper authorization. The District also made $224,867 in questionable payments to a construction management firm. Two other professional service providers received payments totaling $110,094 from the District, which did not go through a request for proposals process.
• Mamaroneck Union Free School District – The Board did not exercise proper oversight over contractual payments for remote network administration services totaling $685,000. The payments pertained to nine consecutive contracts running from January 1999 through June 2006. None of the contracts were entered into with Board approval, nor was there any indication that the Board had delegated its contracting authority. The Board first became aware of these contracts in 2005. Further, six of the contracts indicated that the former network administrator resided in the country of Greece, and none of the contracts provided performance standards or required documentation of work performed. Finally, controls over the processing of a $1,258 reimbursement for a trip to Greece may have been manipulated and overridden.
2008 Annual Report
2008 Annual Report OFFICE OF THE STATE COMPTROLLER28
• Ithaca Housing Authority – The Authority’s former executive director misused more than $200,000 in Authority funds and resources. This was able to occur because the former executive director could override the Authority’s internal control system and process payments outside of the normal flow of most transactions. The Board had abdicated its oversight role and essentially did not monitor the Authority’s financial operations. Employees who could have identified the problematic expenditures were afraid to bring it to the attention of the Board for fear of being dismissed by the former executive director. In addition, the Authority advanced approximately $40,610 to a not-for-profit corporation, the Cayuga Housing Development Corporation (CHDC), which the CHDC used to purchase real property located outside the City from the Chairman of the Authority’s Board of Commissioners. The Authority lacked authority to advance funds to the CHDC for the purchase of the property, and CHDC’s purchase of the property from the Chairman created at least the appearance of a conflict of interest.
• Village of Port Henry – The clerk-treasurer took advantage of weaknesses in the Village’s internal control structure to divert funds handled as part of her everyday responsibilities. Although the clerk-treasurer admitted to the Village Board that she had taken approximately $4,000 in garbage sticker receipts, the Division’s auditors determined that cash in the amount of at least $152,864 was unaccounted for over a five-year period.
• Hopevale Union Free School District – The District’s former business manager improperly enriched himself in the amount of $108,650 by issuing himself an unauthorized vendor check and additional payroll checks, improperly increasing his salary, and using District funds to pay for his personal tax liability. The audit also found that the District inappropriately paid salaries, retirement incentives, and other benefits totaling $55,200 to a former principal and two teachers.
Internal Control Audits
Government officials entrusted with public resources are responsible for complying with laws and regulations, meeting goals and objectives, and safeguarding assets. A good internal control system is an important element of a local government’s financial and operating structure, and is intended to assist local officials in meeting these responsibilities. In 2007, the Division identified a number of opportunities to improve internal control systems.
• Newfane Central School District – District officials and employees did not use District-owned laptop computers in accordance with the Board’s acceptable use policy and sound business practices. Eight of 12 laptop computers that the auditors tested were used for personal purposes. Some of these computers were used to visit internet sites for pornography, online dating, shopping, travel, banking, games, and music. For example, on one laptop there were more than 2,000 pornographic web pages listed on its history report, which contained graphic pictures, movies, cartoons and games. It is particularly troubling that three of the eight computers were assigned to Board members.

29 DIVISION OF LOCAL GOVERNMENT AND SCHOOL ACCOUNTABILITY
• Town of Brookhaven – The Town’s overtime costs for 2005, at $7.6 million, were more than twice the $3.7 million budgeted for overtime, and payments for out-of-title work in 2005, at $1.1 million, were almost twice the $561,130 budgeted for this expense. Controls over the solicitation of competitive proposals were also not adequate to ensure that the Town received desired goods and services at the most competitive price. The Division’s audit also found that the Town did not publicly advertise for some purchase contracts, as required by the General Municipal Law. The auditors determined that the Town Clerk had not established controls adequate to protect and account for assets in the Clerk’s office. Finally, the Town failed to establish policies and procedures for the security of the computer data system.
• Justice Courts – To strengthen justice court accountability, the Division audited 19 justices in 13 justice courts located in Allegany, Cattaraugus, Chautauqua, Genesee, Greene, Niagara, and Orleans counties. The main issues OSC’s audits found included a lack of board oversight in the form of the annual audit, which is required by the Uniform Justice Court Act, and a failure on the part of the justices to perform monthly written bank reconciliations or to issue monthly accountability reports of court liabilities. For example, of the 13 courts audited, the Division’s auditors found that the boards of 10 courts failed to perform the required annual audit, or the annual audit performed was inadequate. In addition, 15 of the 19 justices either failed to perform monthly written bank reconciliations or to issue a monthly accountability report of court liabilities, or performed inadequate reconciliations and/or issued adequateCourt accountability reports.
• Fire Districts – As part of an initiative to improve fiscal practices in fire districts, the Division audited 18 fire districts and companies located in Chenango, Columbia, Delaware, Erie, Monroe, Otsego, Rockland, Saratoga, Tompkins, Ulster, and Westchester counties. The Division’s audits found concerns in the areas of inadequate purchasing controls, leading to improper, questionable or undocumented expenditures of more than $250,000. For example, at the Brooktondale Fire District, auditors found that the Board overrode proper controls when attempting to purchase a rescue truck, which resulted in the District failing to purchase the truck and caused the loss of a $144,500 unsecured down payment. Also, at the W.K. Mansfield Hose Company, auditors found that inadequate controls over cash allowed funds totaling more than $62,000 to be misappropriated, unaccounted for, or used to pay for improper or questionable expenses. In addition, the audits found problems with inadequate segregation of duties, inadequate recordkeeping, inadequate compliance with legal reporting and auditing requirements, inadequate claims auditing, and inadequate monthly and annual financial reporting to the governing boards.
• Niagara Power Coalition – The Division’s audit found that there were virtually no internal controls in place over Coalition cash disbursements, and there was no evidence that the Coalition Board had established policies and procedures to control its financial activity. The Coalition Board did not approve professional service contracts or review requests for payment. Disbursements were generally made at the direction of the former executive director, and checks were signed by the Coalition’s unpaid bookkeeper, rather than the Coalition’s treasurer. The Coalition incorrectly reported to the Internal Revenue Service, or failed to report, payments it made to the former executive director or to entities that he had created.
2008 Annual Report
2008 Annual Report OFFICE OF THE STATE COMPTROLLER30
Efficiency Audits
As local governments continue to face growing fiscal pressures, saving taxpayer dollars through efficiency improvements is critical. In 2007, Division audits of individual units of government contained myriad recommendations for cost savings and/or revenue enhancements. If followed, these recommendations could provide cost savings or revenue enhancements of more than $6.2 million for the local governments studied. Examples of audits of individual units of government include:
• Buffalo Sewer Authority – In two different audits of the Authority, auditors found revenue enhancements totaling more than $1.3 million related to billing and collection and health insurance. In the billing and collection audit, the auditors determined that the lack of monitoring and oversight over the billing and collection processes has resulted in 3,409 adjustments, which lowered customer sewer account balances by a total of $1.7 million without the Board’s knowledge or approval.
In the health insurance audit, the Division’s auditors identified $134,885 in improper benefits extended to four board members ($87,000), four retirees ($37,000), and three active employees ($10,885). Auditors also estimate that it could cost the Authority an additional $1.1 million to provide health insurance benefits to the four retirees in the future.
• Recovering Costs Related to Social Service Programs – Sullivan, Madison, Rockland, Jefferson and Chautauqua counties are not maximizing their claims of reimbursable indirect and direct social service costs, which resulted in the counties foregoing about $1.3 million in additional revenue during the audit period. Sullivan County did not periodically review operations and billings to determine whether it had claimed reimbursements for all actual costs. In addition, none of the counties had established adequate systems to track interdepartmental service costs and submit associated claims for them.
• Municipal Acquisition of Street Lighting Equipment – If the five municipalities the Division audited acquired street lighting systems at assessed values and maintained the systems in-house, they could achieve potential cost savings averaging over $1.2 million annually on a combined basis, net of potential debt service costs. On a combined basis, after repaying debt, annual savings could increase to over $2 million.

31 DIVISION OF LOCAL GOVERNMENT AND SCHOOL ACCOUNTABILITY
• Health Insurance – In addition to the savings in health insurance costs that auditors found at the Buffalo Sewer Authority, the Division also audited health insurance costs in the cities of Kingston, Niagara Falls, and Tonawanda. The audits found savings comparable to those found at the Buffalo Sewer Authority, totaling $762,000 in the City of Kingston, and totaling $157,000 in the City of Niagara Falls. Auditors also found that the City of Tonawanda has saved more than $200,000 during a 16-month period in 2005 and 2006 by purchasing a lower-cost health insurance plan and funding the additional costs for out-of-pocket expenses.
• County of Otsego – The Board and Treasurer were not effectively managing investments. Based on the Division’s analysis, the County could have earned about $76,000 in additional interest revenue from January 2006 to June 2006 had County staff consolidated all moneys and deposited them into the highest interest-earning checking and savings accounts available. In addition, the County could have earned approximately $9,800 in additional interest revenue had all moneys been on deposit in interest-bearing checking accounts at the highest rate available.
• Statewide Efficiencies – The Division issued seven audits covering multiple units of government during 2007. These performance audits involved working with several local governments or agencies in a particular region or across the State to look at issues or programs to determine if there are ways to improve efficiency and effectiveness. These audits allow us to highlight important operational issues and improvement opportunities of interest to a broad range of local governments. Topics included: administrative expenses of fire districts; local government use of community development block grants to create revolving loan funds; internal controls over payments to childcare service providers; recovering costs related to social service programs; industrial development agencies’ project approval, evaluation, and monitoring; municipal acquisition of street lighting equipment; and policies and procedures of county self-insured workers’ compensation plans.
2008 Annual Report

2008 Annual Report OFFICE OF THE STATE COMPTROLLER32
Budget Reviews
OSC budget reviews help local governments monitor structural balances in their budgets by evaluating the consistency and validity of estimated revenues, appropriations, and appropriated fund balances. In 2007, Division staff performed 25 budget reviews for local governments, 22 of which were mandated by special deficit financing legislation.
• Real-Time Budget Reviews – After finding that the Roosevelt Union Free School District could potentially end the 2006-07 fiscal year with a deficit of almost $12.3 million, Comptroller DiNapoli directed the Division to begin auditing the District on an unprecedented real-time basis to determine whether it was adequately monitoring its own spending and staying within its 2007-08 budget. At the completion of the first quarter of the 2007-08 fiscal year, the District’s spending has generally been within the limits established by the Board in its enacted budget. However, the auditors identified several areas of concern that, if not addressed by District officials, could lead to the District overspending its budget later in the fiscal year. For example, District officials had not established accurate budget appropriations three months into the fiscal year. District officials had not appropriately encumbered funds for millions of dollars in known expenses, such as debt obligations, transportation costs, fringe benefits, etc., which make up about 60 percent of total non-personal service costs. The District has already borrowed $11 million to finance cash flow needs, and it may need to borrow additional amounts later in the year to address expected cash flow difficulties.
• Deficit Financing Reviews – The Division performed 22 budget reviews that were mandated under deficit financing legislation, which included the cities of Batavia, Glen Cove, Rome, Troy, and Yonkers; the towns of Babylon, Mamakating, Sidney, and Stony Point; the villages of Endicott, Hempstead, and Monticello; and the school districts of Amsterdam City, Beacon, Campbell-Savona, East Moriches, Fabius-Pompey, Liberty, Monroe-Woodbury, Patchogue-Medford, Roosevelt, Schenectady, South Country, and Troy. We also performed budget reviews in three other local governments.
• City of Batavia – The Division’s auditors found that the City Council needed to address major operating funds deficits, and identified a number of problems with the City’s 2007-08 budget. As of March 31, 2006, the City’s audited financial statements reported an unreserved, unappropriated, accumulated fund deficit in the general fund of $2.2 million. Also, there were interfund advances of $1.8 million that could not be paid, which would increase the general fund deficit to $4 million, or 16.9 percent of the $23.7 million dollar budget.
33 DIVISION OF LOCAL GOVERNMENT AND SCHOOL ACCOUNTABILITY
Other Division Activities
Policy Reports
21st Century State Aid Formulas: Revenue SharingRevenue sharing among State and local governments has taken many forms in New York State. Originally, the program was designed to provide multipurpose local governments (particularly those with municipal responsibilities) with flexible, predictable unrestricted State Aid. However, the formulas used to allocate aid, which are modified periodically, ignore the changing roles of municipalities - regardless of their designation - in increasingly outdated municipal structures. Previous reports by OSC have pointed out that the terms city, town and village have more to do with history than they do with present-day governmental function. This report looks at urban villages as one type of municipal government and the impact that these historical designations have had on the State revenue sharing funds such governments receive.
Performance of Industrial Development AgenciesThis report provides an overview of financial and employment trends of the 116 active Industrial Development Agencies (IDAs) in New York State. The analysis of the data, as reported to OSC by each IDA, suggests that additional measures to improve the transparency and accountability of IDA operations are needed. As a result, OSC will be initiating a series of steps to strengthen oversight and reporting under existing statutory powers, and intends to work with the Governor’s Office and the Legislature to expand oversight of all local public authorities and local development corporations (LDCs).
Green Best Practices: How Local Governments Can Reduce Energy Cost and Minimize Impact on Global Climate ChangeAs New York’s local governments continue to face mounting pressure to reduce the growth in property taxes and operating costs, many municipalities are investigating opportunities to reduce energy costs by improving energy efficiency. Simultaneously, many municipalities are undertaking efforts to minimize their impact on global climate change by purchasing or providing clean and reliable energy through alternative sources of renewable energy. This report highlights those practices that will reduce energy consumption and promote a greener environment.
GASB 45: Reporting the True Cost of Other Post-Employment BenefitsMany governments, including those in New York, have for decades promised medical and other nonpension benefits to employees when they retire. Under new accounting standards issued by the Governmental Accounting Standards Board (GASB), many state and local governments nationwide are required to report liabilities for these “other post-employment benefits” (OPEB) similarly to the way they report pension liabilities. This report provides information on the requirements under GASB 45 and information on national trends in OPEB liabilities. In 2008 the Comptroller introduced legislation to create the legal authorization for the State and local governments to establish OPEB trusts and fund them at their option (see page 34).
2008 Annual Report

2008 Annual Report OFFICE OF THE STATE COMPTROLLER34
New York State County Sales Tax Collections by RegionSales taxes are an important source of revenue for New York State’s local governments. This revenue stream has helped local governments cope with the rising cost of providing services and mitigate property tax increases. The degree to which local governments depend on sales taxes varies, but their overall reliance has increased over the past ten years. This report examines recent trends in sales tax collections by region, which indicate that there are wide variations by region but also that overall growth continued for the first four months of 2008 despite the economic downturn. However, the report cautioned local governments to project sales tax revenues conservatively for the next fiscal year — given the current economic environment.
Other Post-Employment BenefitsThe Division assembled a task force of local government associations to address the issues raised by the new accounting standards issued as GASB 45. As noted above, under GASB 45, state and many local governments nationwide are required to report liabilities for OPEB – primarily health care benefits – similarly to the way they report pension liabilities.
While GASB 45 does not require governments to fund this liability, the Comptroller feels strongly that a structure needs to be created to permit funding. However, there is currently no mechanism for New York State or its local governments to set aside funds in an irrevocable trust if they choose to begin funding this liability.
OSC drafted legislation based on the input received by the working group, which would create the legal authorization for trusts to fund these obligations. OSC also issued a Frequently Asked Questions document on GASB 45 and OPEB, worked with the State Office of General Services to approve contracts for actuarial services which can be utilized by local governments to determine their OPEB liability, and issued a policy report on OPEB and GASB 45.
The OSC legislative proposal would authorize the creation of OPEB trusts for New York State. Local governments would have the option to invest OPEB assets individually, or to participate in either a State-administered investment fund, or to pool assets with other local governments for investment purposes. No funding requirements are included. Contributions into OPEB trusts would be made at the option of the State and local employers and would be irrevocable; assets of such trusts could be used only for OPEB liabilities and would be protected from the creditors of the sponsoring governments.
Although these bills were introduced, they did not pass in either the Senate or Assembly during the regular 2008 Legislative Session. OSC will continue to advocate for their passage to ensure that local governments and school districts are given the ability to fund the growing cost of OPEB if they wish to do so.
35 DIVISION OF LOCAL GOVERNMENT AND SCHOOL ACCOUNTABILITY
Local Official Training
During 2007, Division staff conducted 116 training sessions at more than 50 statewide, regional and online events. These events included conferences, online training schools, accounting schools, teleconferences and regional workshops. Through these instructional outlets, the Division trained 12,128 local officials. These programs included three key initiatives spearheaded by the Comptroller:
• School Accountability – All school district and BOCES board members are required to receive training on the basics of financial accountability. The Division has formed a partnership with the New York State School Boards Association and Hudson Valley Community College to offer a low-cost, online training program to meet this requirement. During 2007, 364 board members participated in this ongoing training initiative.
• Fire Districts – During 2006 and 2007, the focus on improving financial accountability for fire districts resulted in 11 new laws being enacted, along with a cleanup bill to clarify ambiguities in the legislation. New training regulations were adopted and published in the State Registry, and an application and evaluation process for fire district commissioner training was developed for anyone wishing to have their training curriculum approved. During 2007, OSC approved training courses of three providers for the required fire district commissioner training. As part of the continuing effort to provide fire district officials with up-to-date information, the Division collaborated with the Association of Fire Districts of the State of New York to produce two teleconferences which were viewed by 2,370 fire personnel. In addition, the Division trained 750 fire district officials at one of the Association’s major conferences.
• Justice Courts – The Division continued its emphasis on fiscal responsibility in justice courts by providing training workshops on reporting and accountability to 2,092 magistrates and court clerks. In collaboration with the Office of Court Administration (OCA), the Division produced two teleconferences on DWI legislation and bail. Additionally, the Division and OCA developed an online training program to promote fiscal accountability. In 2007, 480 justices received training through the use of this online program.
During 2008, the Division has continued its work with these three programs and has also been active in other areas. Along with the Division of Retirement Services and the New York State Association of School Business Officials, the Division has led the initiative to inform school district financial officials of continuing efforts to identify individuals that have inappropriately been granted State pension benefits. Also, with the help of Cornell’s Community and Rural Development Institute, the Division has established a statewide and regional clearinghouse which informs local government officials of various training opportunities.
2008 Annual Report

2008 Annual Report OFFICE OF THE STATE COMPTROLLER36
Justice Court Fund
The Division is custodian of the Justice Court Fund (JCF), established to account for the revenues from fines and penalties collected by more than 1,260 town and village justice courts, the Department of Motor Vehicles Administrative Adjudication Bureaus, the Nassau County Traffic and Parking Violations Agency, and for parking surcharges collected by the cities of New York, Buffalo, Rochester, Yonkers, Syracuse and Albany.6 In particular, the Division collects the State portion of these fines and penalties, and accounts for the local shares that are either retained by or refunded to the municipalities.
In the 2007-08 State fiscal year, the JCF distributed $494.2 million in fines, fees and forfeitures derived from the adjudication of motor vehicle, criminal, civil and other cases at the local government level. Local governments received 45 percent of this distribution, or $221.9 million, and the State received 55 percent, or $272.3 million.
The JCF also received and distributed almost $470,000 from cities, towns and villages for the State’s portion of license fees from bingo and other games of chance.
The JCF is nearing completion of a project to employ Optical Character Recognition (OCR) technology when processing non-electronic justice reports. Over 300 courts currently file by paper. When the project is fully implemented, the justice reports will be scanned using OCR software and the information reported will be converted into an electronic format. The use of this technology will improve processing efficiencies and ensure a more accurate and timely distribution of the fine and surcharge monies. It will also improve the response rate to information requests and enhance research and data analysis capabilities. In addition, the JCF has conducted significant outreach to courts to urge them to file their justice reports electronically. As a result, over 100 additional courts have elected to utilize this filing option.
6 Effective January 1, 2008, Buffalo, Rochester, Yonkers, Syracuse and Albany are authorized to retain both the State and the city share of the mandatory parking surcharges until September 1, 2009, at which time the surcharge legislation is scheduled to sunset (see Chapter 56, Laws of 2007, Part C).

37 DIVISION OF LOCAL GOVERNMENT AND SCHOOL ACCOUNTABILITY
The Public Authorities Reporting Information System
The Public Authorities Reporting Information System (PARIS) became operational in November 2007. Since that time, 153 public authorities have utilized this new on-line reporting system to meet their statutory reporting requirements, including 87 of 104 IDAs. Our preliminary review of these annual reports indicates a significant improvement in the overall accuracy and completeness of the report submissions. OSC and the Authority Budget Office (ABO) will continue to work together to make PARIS more user-friendly and to provide the public with more transparent information about public authority operations.
Indigent Legal Services Fund
Legislation enacted in 2003 required increased rates to be paid to assigned counsel providing indigent legal defense services. This legislation also provided that revenues from various sources, including new and increased court and Department of Motor Vehicles-related fees, be deposited in the Indigent Legal Services Fund (ILSF), which would be used to offset the increased costs of the higher rates for assigned counsel, as well as support indigent legal defense services generally. OSC administers the ILSF. Amounts available as of December 31st are distributed to the State, counties and New York City on the following March 31st. State Finance Law requires each county to demonstrate compliance with certain maintenance of effort (MOE) requirements as a precondition for receiving this aid.
Based upon a review of the 2007 ILSF Annual Report submissions, OSC determined that nine counties did not demonstrate compliance with the maintenance of effort (MOE) requirements and were therefore ineligible for a March 2008 distribution. On March 31, 2008, OSC distributed $74,160,682 from the ILSF and held $2,783,868 in reserve, pursuant to Chapter 39 of the Laws of 2008. On May 30, 2008, OSC distributed the remaining $2,783,868 to counties pursuant to Chapter 108 of the Laws of 2008. OSC worked cooperatively with the Governor’s Office and the Legislature to help ensure that all counties received an ILSF distribution.
2008 Annual Report

2008 Annual Report OFFICE OF THE STATE COMPTROLLER38
Population Trends in New York State – UpdateFor many decades, New York State has been struggling to stem the loss of its population. What began in cities as a part of “sprawl without growth” has now spread to wider upstate regions as both cities and towns struggle to attract and retain young families and professionals.
According to recent population estimates, New York State continues to grow at a relatively slow rate—increasing by only 1.6 percent between 2000 and 2007. Most of this growth took place in New York City and was largely fueled by immigration. Much of New York suffered population losses. Overall, New York State ranks towards the bottom of the pack (42nd) compared to other states, particularly those in the South and West where population continues to grow at double digit rates. As a result, New York is significantly lagging the U.S. average of nearly seven percent.
In decades past, population decline was mainly occurring in the urban centers of the State. Recent data using population estimates suggests that this decline is becoming more widespread, encompassing a large part of upstate New York. From 1970 to 2000, 13 upstate counties had some level of population loss. From 2000 to 2007, 32 upstate counties had lost population.
Chautauqua Cattaraugus
ErieWyoming
Niagara
Genesee
Orleans
Monroe
Livingston
Ontario
Allegany Steuben
Yates
Schuyler
Chemung
Tompkins
Seneca
Wayne
CayugaOnondaga
Cortland
Tioga
Broome
Chenango
Delaware
Madison
Otsego
Oneida
Oswego
Lewis
Jefferson
St. LawrenceFranklin
Herkimer
Hamilton
Fulton
Montgomery
Schoharie
Greene
Ulster
SullivanDutchess
Columbia
Rensselaer
Albany
Schenectady
Saratoga
Washington
Warren
Essex
Clinton
PutnamOrange
RocklandWestchester
Nassau
Suffolk
QueensKings
Richmond
New YorkBronx
Lost Population
Grew up to 2.49 percent
Grew between 2.5 and 4.9 percent
Grew between 5 and 7.49 percent
Grew more than 7.5 percent
Chautauqua Cattaraugus Allegany Steuben
ErieWyoming
Genesee
Niagara Orleans
Monroe
Livingston
Ontario
Yates
Wayne
CayugaSeneca
Schuyler
Chemung
Tompkins
TiogaBroome
ChenangoCortland
Delaware
Otsego
Madison
Onondaga
Oswego
Oneida
Lewis
Herkimer
Fulton
Montgomery
HamiltonWarren
Saratoga
Washington
Essex
Clinton
FranklinSt. Lawrence
Jefferson
Rensselaer
AlbanySchoharie
Greene Columbia
Ulster
SullivanDutchess
Orange Putnam
Suffolk
WestchesterRockland
KingsNassau
Richmond
QueensNew York
Bronx
Schenectady
Lost Population
Grew up to 4.9 percent
Grew between 5 and 14.9 percent
Grew between 15 and 24.9 percent
Grew more than 25 percent
Population Change 2000–2007
Population Change 1970–2000

39 DIVISION OF LOCAL GOVERNMENT AND SCHOOL ACCOUNTABILITY
Unlike prior decades, the decline that is occurring is affecting both cities and towns. Cities are continuing to decline, with 80 percent of all cities losing population since the 2000 Census. More significantly, the number of towns losing population in this decade has increased dramatically; over half of the State’s towns have lost population since 2000.
The problem of widespread decline is most pronounced in the upstate and western New York regions. In western New York, all cities have lost population in every decade since 1970, and from 2000 to 2007, 78 percent of the towns in the region have also declined. In the Finger Lakes region, 70 percent of the towns have lost population since 2000, along with all cities.
These demographic trends are the result of long-term economic shifts, and the patterns go a long way toward explaining the fiscal dilemma that many local governments face today and the challenges that lie ahead.
72.1% 72.1%
80.3%
91.8%
51.4%
18.8%
30.8%27.0%
0%
20%
40%
60%
80%
100%
1970s 1980s 1990s 2000-07
Cities Towns
Percentage of Cities and Towns Declining During Each Decade
2008 Annual Report

2008 Annual Report OFFICE OF THE STATE COMPTROLLER40
General Purpose Counties 57 Cities 62 Towns 932 Villages 556 1,607
Special Purpose School Districts 699 Fire Districts 870 1,569
Total Local Government Entities 3,176
Public Authorities 240Other Special Purpose 873
Total Special Purpose Entities 1,113
Total Governmental Entities 4,289
Local Government Entities
Special Purpose Entities
Summary of Local Government Entities
(As of July 2008)

41 DIVISION OF LOCAL GOVERNMENT AND SCHOOL ACCOUNTABILITY
Real Property Taxes and Assessments Real Property Taxes Special Assessments
Other Real Property Tax Items STAR Payments Payments In Lieu of Taxes Interest & Penalties Gain from Sale of Tax Acquired Property Miscellaneous Tax Items
Sales and Use Tax Sales Tax Sales Tax Distribution Utilities Gross Receipts Tax Miscellaneous Use Taxes
Other Non-Property Taxes Franchises Emergency Telephone Systems Surcharge Miscellaneous Non-Property Taxes City Income Tax
Charges for Services General Government Fees Education Fees Public Safety Fees Health Fees Transportation Fees Social Services Fees Economic Development Fees Culture and Recreation Fees Community Services Fees Utility Fees Sanitation Fees Miscellaneous Fees
Charges to Other Governments General Government Charges Education Charges Public Safety Charges Health Charges Transportation Charges Social Services Charges Culture and Recreation Charges Community Services Charges Utility Charges Debt Service Charges Miscellaneous Intergovernmental Charges Sanitation Charges
Use and Sale of Property Interest and Earnings Sale of Property Rental of Property
Level One and Level Two Revenue Categories
Other Local Revenues Fines Forfeitures Compensation for Loss Library Grants from Local Governments Miscellaneous Grants from Local Governments Gifts Employee Contributions Miscellaneous Revenues
State Aid Unrestricted State Aid Mortgage Tax State Aid – General Government State Aid – Education State Aid – Public Safety State Aid – Health State Aid – Transportation State Aid – Social Services State Aid – Economic Development State Aid – Culture and Recreation State Aid – Community Services State Aid – Utilities State Aid – Sanitation Miscellaneous State Aid
Federal Aid Federal Aid – Education Federal Aid – Public Safety Federal Aid – Health Federal Aid – Transportation Federal Aid – Social Services Federal Aid – Economic Development Federal Aid – Culture and Recreation Federal Aid – Community Services Federal Aid – General Government Federal Aid – Utilities Federal Aid – Sanitation Miscellaneous Federal Aid
Proceeds of Debt Sale of Obligations Bans Redeemed from Appropriations Miscellaneous Debt Proceeds
Other Sources Transfers Interfund Revenues Refunds of Prior Year Expenditures Miscellaneous Other Sources
2008 Annual Report
APPENDIX I
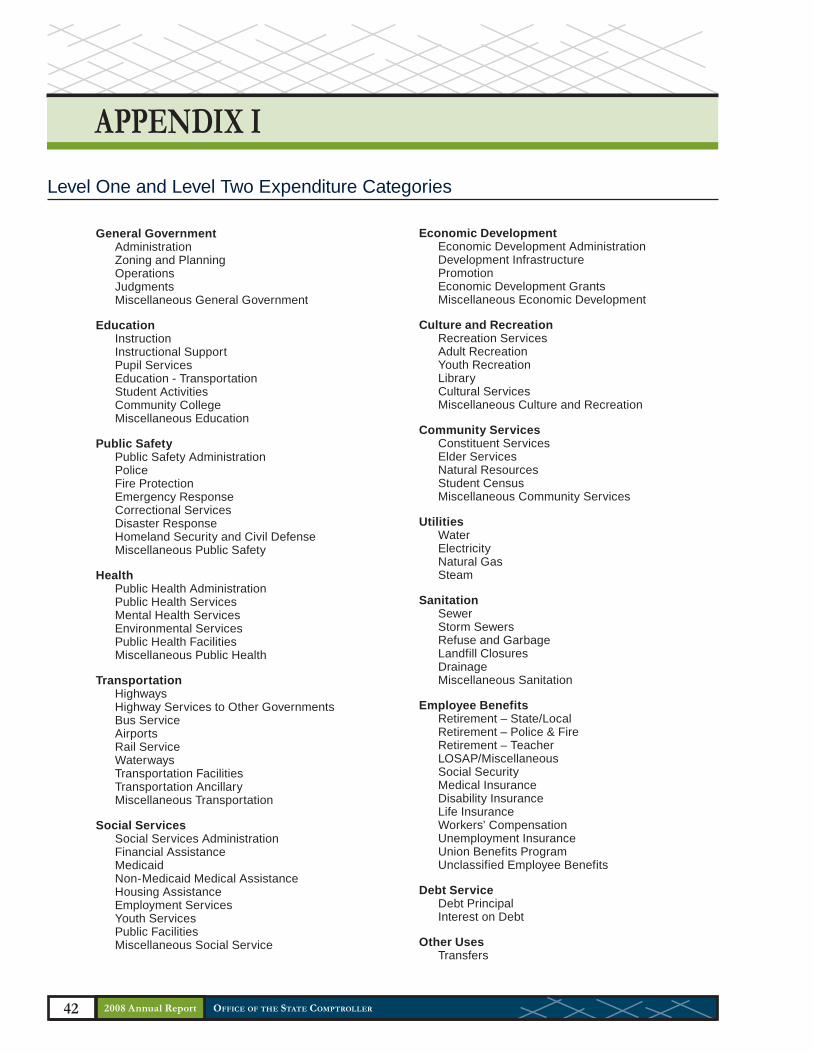
2008 Annual Report OFFICE OF THE STATE COMPTROLLER42
General Government Administration Zoning and Planning Operations Judgments Miscellaneous General Government
Education Instruction Instructional Support Pupil Services Education - Transportation Student Activities Community College Miscellaneous Education
Public Safety Public Safety Administration Police Fire Protection Emergency Response Correctional Services Disaster Response Homeland Security and Civil Defense Miscellaneous Public Safety
Health Public Health Administration Public Health Services Mental Health Services Environmental Services Public Health Facilities Miscellaneous Public Health
Transportation Highways Highway Services to Other Governments Bus Service Airports Rail Service Waterways Transportation Facilities Transportation Ancillary Miscellaneous Transportation
Social Services Social Services Administration Financial Assistance Medicaid Non-Medicaid Medical Assistance Housing Assistance Employment Services Youth Services Public Facilities Miscellaneous Social Service
Level One and Level Two Expenditure Categories
Economic Development Economic Development Administration Development Infrastructure Promotion Economic Development Grants Miscellaneous Economic Development
Culture and Recreation Recreation Services Adult Recreation Youth Recreation Library Cultural Services Miscellaneous Culture and Recreation
Community Services Constituent Services Elder Services Natural Resources Student Census Miscellaneous Community Services
Utilities Water Electricity Natural Gas Steam
Sanitation Sewer Storm Sewers Refuse and Garbage Landfill Closures Drainage Miscellaneous Sanitation
Employee Benefits Retirement – State/Local Retirement – Police & Fire Retirement – Teacher LOSAP/Miscellaneous Social Security Medical Insurance Disability Insurance Life Insurance Workers’ Compensation Unemployment Insurance Union Benefits Program Unclassified Employee Benefits
Debt Service Debt Principal Interest on Debt
Other Uses Transfers
APPENDIX I

43 DIVISION OF LOCAL GOVERNMENT AND SCHOOL ACCOUNTABILITY
CIT
Y R
EVEN
UES
– F
isca
l Yea
rs E
nded
in 1
996
- 200
6 (e
xclu
ding
NYC
)Pe
rcen
t Cha
nge
Ove
rall
Ave
rage
Ann
ual
( $ m
illio
ns )
1996
2001
2002
2003
2004
2005
2006
2001
-200
619
96-2
006
2001
-200
619
96-2
006
Rev
enue
s:
Rea
l Pro
pert
y Ta
xes
and
Ass
essm
ents
645.
169
0.7
701.
274
9.2
803.
787
9.9
903.
330
.8%
40.0
%5.
5%3.
4%
Oth
er R
eal P
rope
rty
Tax
Item
s78
.488
.092
.010
2.5
112.
312
1.1
114.
630
.1%
46.2
%5.
4%3.
9%
Sal
es a
nd U
se T
ax51
0.6
602.
560
1.7
634.
466
0.8
710.
174
0.1
22.8
%45
.0%
4.2%
3.8%
SA
LES
TA
X D
ISTR
IBU
TIO
N29
8.6
352.
135
0.2
369.
138
2.0
418.
043
6.2
23.9
%46
.1%
4.4%
3.9%
Oth
er N
on-P
rope
rty
taxe
s44
.033
.533
.935
.536
.542
.160
.078
.9%
36.3
%12
.3%
3.1%
Cha
rges
for S
ervi
ces
560.
062
4.8
647.
766
0.6
678.
273
3.4
745.
219
.3%
33.1
%3.
6%2.
9%
UTI
LIT
Y F
EE
S24
6.2
259.
027
0.5
278.
028
5.7
297.
230
7.1
18.6
%24
.8%
3.5%
2.2%
Cha
rges
to O
ther
Gov
ernm
ents
60.6
64.7
62.3
53.3
56.2
67.0
66.3
2.5%
9.4%
0.5%
0.9%
Use
and
Sal
e of
Pro
pert
y94
.210
2.2
76.8
142.
666
.187
.711
6.8
14.3
%24
.0%
2.7%
2.2%
Oth
er L
ocal
Rev
enue
s63
.372
.890
.696
.312
4.4
112.
511
6.3
59.8
%83
.7%
9.8%
6.3%
Tota
l Loc
al R
even
ues
$2,0
56.2
$2,2
79.3
$2,3
06.2
$2,4
74.4
$2,5
38.3
$2,7
53.8
$2,8
62.6
25.6
%39
.2%
4.7%
3.4%
Sta
te A
id36
4.6
542.
856
2.9
599.
959
8.9
660.
870
9.1
30.7
%94
.5%
5.5%
6.9%
UN
RE
STR
ICTE
D S
TATE
AID
260.
530
6.6
300.
330
0.1
314.
234
4.2
366.
919
.7%
40.8
%3.
7%3.
5%
Fede
ral A
id16
3.7
206.
024
7.0
279.
527
1.4
256.
425
2.9
22.8
%54
.5%
4.2%
4.5%
Tota
l Sta
te a
nd F
eder
al R
even
ues
$528
.3$7
48.8
$809
.9$8
79.4
$870
.4$9
17.2
$962
.028
.5%
82.1
%5.
1%6.
2%
Tota
l Rev
enue
s (L
ocal
, Sta
te a
nd F
eder
al S
ourc
es)
$2,5
84.5
$3,0
28.1
$3,1
16.0
$3,3
53.8
$3,4
08.6
$3,6
71.0
$3,8
24.6
26.3
%48
.0%
4.8%
4.0%
2008 Annual Report
The
follo
win
g ta
bles
incl
ude
finan
cial
dat
a fo
r cou
ntie
s, c
ities
, tow
ns, v
illag
es, s
choo
l dis
trict
s, a
nd fi
re d
istri
cts.
The
sou
rce
of th
is d
ata
is
the
Ann
ual F
inan
cial
Rep
orts
that
eac
h lo
cal g
over
nmen
t is
requ
ired
to fi
le w
ith O
SC
eve
ry y
ear.
A ta
ble
for t
he C
ity o
f New
Yor
k is
als
o in
clud
ed. P
leas
e no
te th
at S
tate
and
loca
l pol
icy
chan
ges
(e.g
., ch
ange
s to
a lo
cal f
isca
l yea
r, pr
ivat
izat
ion
of c
ount
y he
alth
care
faci
litie
s,
toba
cco
secu
ritiz
atio
n) a
nd c
hang
es to
fina
ncia
l rep
ortin
g re
quire
men
ts (e
.g. c
ount
y sa
les
tax)
may
affe
ct tr
end
lines
. Add
ition
al d
etai
l is
avai
labl
e on
our
web
site
at:
ww
w.o
sc.s
tate
.ny.
us/lo
calg
ov/d
atan
stat
/inde
x.ht
m.
You
can
also
con
tact
the
Div
isio
n of
Loc
al G
over
nmen
t an
d S
choo
l Acc
ount
abili
ty a
t loc
algo
v@os
c.st
ate.
ny.u
s.

2008 Annual Report OFFICE OF THE STATE COMPTROLLER44
CIT
Y EX
PEN
DIT
UR
ES –
Fis
cal Y
ears
End
ed in
199
6 - 2
006
(exc
ludi
ng N
YC)
Perc
ent C
hang
eO
vera
llA
vera
ge A
nnua
l( $
mill
ions
)19
9620
0120
0220
0320
0420
0520
0620
01-2
006
1996
-200
620
01-2
006
1996
-200
6
Exp
endi
ture
s:
Cur
rent
Ope
ratio
ns:
Per
sona
l Ser
vice
s1,
082.
91,
315.
61,
360.
91,
388.
61,
410.
91,
436.
81,
487.
513
.1%
37.4
%2.
5%3.
2%
Em
ploy
ee B
enefi
ts37
0.6
431.
147
2.8
530.
164
9.0
752.
278
2.4
81.5
%11
1.1%
12.7
%7.
8%
Con
tract
ual
711.
982
6.5
821.
086
5.9
883.
389
2.3
918.
411
.1%
29.0
%2.
1%2.
6%
Tota
l Cur
rent
Ope
ratio
ns2,
165.
42,
573.
22,
654.
72,
784.
52,
943.
33,
081.
33,
188.
223
.9%
47.2
%4.
4%3.
9%
Equ
ipm
ent a
nd C
apita
l Out
lay
357.
141
5.5
461.
247
6.0
447.
845
0.8
553.
433
.2%
55.0
%5.
9%4.
5%
Deb
t Ser
vice
276.
429
6.3
300.
535
8.0
287.
531
8.0
327.
010
.4%
18.3
%2.
0%1.
7%
Prin
cipa
l15
5.9
175.
118
2.1
248.
118
9.1
200.
819
7.9
13.0
%26
.9%
2.5%
2.4%
Inte
rest
120.
412
1.2
118.
410
9.9
98.4
117.
212
9.1
6.5%
7.2%
1.3%
0.7%
Tota
l Exp
endi
ture
s (C
urre
nt O
pera
tions
+ E
quip
men
t and
C
apita
l Out
lay
+ D
ebt S
ervi
ce)
$2,7
98.8
$3,2
85.0
$3,4
16.4
$3,6
18.5
$3,6
78.5
$3,8
50.1
$4,0
68.6
23.9
%45
.4%
4.4%
3.8%
Exp
endi
ture
s by
Fun
ctio
n:
Gen
eral
Gov
ernm
ent
385.
148
2.9
485.
349
7.6
517.
552
2.6
515.
86.
8%34
.0%
1.3%
3.0%
Edu
catio
n0.
30.
91.
00.
70.
50.
10.
6-2
9.0%
95.7
%-6
.6%
6.9%
Pub
lic S
afet
y71
4.0
894.
091
8.1
950.
596
3.0
1,00
5.3
1,07
2.3
19.9
%50
.2%
3.7%
4.2%
PO
LIC
E37
9.2
494.
150
4.6
524.
953
5.6
561.
858
8.7
19.2
%55
.3%
3.6%
4.5%
FIR
E P
RO
TEC
TIO
N28
8.1
345.
835
3.9
367.
036
9.5
383.
441
1.2
18.9
%42
.7%
3.5%
3.6%
Hea
lth3.
43.
63.
46.
14.
43.
53.
1-1
3.6%
-6.9
%-2
.9%
-0.7
%
Tran
spor
tatio
n25
7.7
331.
136
1.6
397.
137
3.7
370.
639
7.7
20.1
%54
.3%
3.7%
4.4%
Soc
ial S
ervi
ces
40.7
45.8
45.8
48.3
52.1
51.7
49.5
8.2%
21.6
%1.
6%2.
0%
San
itatio
n25
5.2
226.
823
7.2
235.
024
3.3
249.
125
6.0
12.9
%0.
3%2.
5%0.
0%
Eco
nom
ic D
evel
opm
ent
136.
716
9.5
169.
117
8.0
180.
915
9.4
159.
4-5
.9%
16.7
%-1
.2%
1.6%
Cul
ture
-Rec
reat
ion
156.
618
8.8
177.
416
8.2
164.
516
8.5
261.
638
.5%
67.1
%6.
7%5.
3%
Com
mun
ity S
ervi
ces
27.9
44.2
48.5
58.1
47.4
51.4
45.4
2.6%
62.6
%0.
5%5.
0%
Util
ities
174.
317
0.0
195.
919
0.8
194.
719
7.5
197.
816
.4%
13.5
%3.
1%1.
3%
Em
ploy
ee B
enefi
ts37
0.6
431.
147
2.8
530.
164
9.0
752.
278
2.4
81.5
%11
1.1%
12.7
%7.
8%
Tota
l Exp
endi
ture
s by
Fun
ctio
n (1
)$2
,522
.5$2
,988
.7$3
,115
.9$3
,260
.6$3
,391
.0$3
,532
.1$3
,741
.625
.2%
48.3
%4.
6%4.
0%
(1) e
xclu
des
debt
ser
vice

45 DIVISION OF LOCAL GOVERNMENT AND SCHOOL ACCOUNTABILITY
SUM
MA
RY
OF
CIT
Y FI
NA
NC
ES –
Fis
cal Y
ears
End
ed in
199
6 - 2
006
(Exc
ludi
ng N
YC)
Perc
ent C
hang
eO
vera
llA
vera
ge A
nnua
l( $
mill
ions
)19
9620
0120
0220
0320
0420
0520
0620
01-2
006
1996
-200
620
01-2
006
1996
-200
6
Pop
ulat
ion
- Cen
sus
Est
imat
es2,
256,
226
2,24
9,79
02,
242,
859
2,23
4,09
92,
221,
376
2,21
0,68
0-2
.0%
-0.4
%
Full
Valu
e71
,043
.771
,420
.775
,013
.685
,972
.990
,684
.897
,520
.410
6,03
2.0
48.5
%49
.3%
8.2%
4.1%
Deb
t Iss
ued:
Bon
ds26
1.8
279.
722
4.4
185.
340
4.0
493.
954
7.5
95.7
%10
9.2%
14.4
%7.
7%
Oth
er D
ebt
157.
828
6.0
343.
226
4.7
351.
628
6.5
384.
034
.3%
143.
3%6.
1%9.
3%
Out
stan
ding
Deb
t:
Bon
ds (G
ross
)1,
741.
12,
097.
02,
029.
81,
966.
12,
103.
42,
294.
62,
459.
017
.3%
41.2
%3.
2%3.
5%
Oth
er D
ebt
437.
041
4.6
479.
852
2.7
623.
549
9.3
568.
037
.0%
30.0
%6.
5%2.
7%
Tota
l Out
stan
ding
Deb
t$2
,178
.1$2
,511
.6$2
,509
.6$2
,488
.8$2
,726
.9$2
,793
.9$3
,027
.020
.5%
39.0
%3.
8%3.
4%
Rev
enue
s:
Rea
l Pro
pert
y Ta
xes
and
Ass
essm
ents
645.
169
0.7
701.
274
9.2
803.
787
9.9
903.
330
.8%
40.0
%5.
5%3.
4%
Oth
er R
eal P
rope
rty
Tax
Item
s78
.488
.092
.010
2.5
112.
312
1.1
114.
630
.1%
46.2
%5.
4%3.
9%
Sal
es a
nd U
se T
ax51
0.6
602.
560
1.7
634.
466
0.8
710.
174
0.1
22.8
%45
.0%
4.2%
3.8%
Oth
er N
on-P
rope
rty
taxe
s44
.033
.533
.935
.536
.542
.160
.078
.9%
36.3
%12
.3%
3.1%
Cha
rges
for S
ervi
ces
560.
062
4.8
647.
766
0.6
678.
273
3.4
745.
219
.3%
33.1
%3.
6%2.
9%
Cha
rges
to O
ther
Gov
ernm
ents
60.6
64.7
62.3
53.3
56.2
67.0
66.3
2.5%
9.4%
0.5%
0.9%
Use
and
Sal
e of
Pro
pert
y94
.210
2.2
76.8
142.
666
.187
.711
6.8
14.3
%24
.0%
2.7%
2.2%
Oth
er L
ocal
Rev
enue
s63
.372
.890
.696
.312
4.4
112.
511
6.3
59.8
%83
.7%
9.8%
6.3%
Tota
l Loc
al R
even
ues
$2,0
56.2
$2,2
79.3
$2,3
06.2
$2,4
74.4
$2,5
38.3
$2,7
53.8
$2,8
62.6
25.6
%39
.2%
4.7%
3.4%
Sta
te A
id36
4.6
542.
856
2.9
599.
959
8.9
660.
870
9.1
30.7
%94
.5%
5.5%
6.9%
Fede
ral A
id16
3.7
206.
024
7.0
279.
527
1.4
256.
425
2.9
22.8
%54
.5%
4.2%
4.5%
Tota
l Sta
te a
nd F
eder
al R
even
ues
$528
.3$7
48.8
$809
.9$8
79.4
$870
.4$9
17.2
$962
.028
.5%
82.1
%5.
1%6.
2%
Tota
l Rev
enue
s (L
ocal
, Sta
te a
nd F
eder
al S
ourc
es)
$2,5
84.5
$3,0
28.1
$3,1
16.0
$3,3
53.8
$3,4
08.6
$3,6
71.0
$3,8
24.6
26.3
%48
.0%
4.8%
4.0%
Exp
endi
ture
s:
Cur
rent
Ope
ratio
ns:
Per
sona
l Ser
vice
s1,
082.
91,
315.
61,
360.
91,
388.
61,
410.
91,
436.
81,
487.
513
.1%
37.4
%2.
5%3.
2%
Em
ploy
ee B
enefi
ts37
0.6
431.
147
2.8
530.
164
9.0
752.
278
2.4
81.5
%11
1.1%
12.7
%7.
8%
Con
trac
tual
711.
982
6.5
821.
086
5.9
883.
389
2.3
918.
411
.1%
29.0
%2.
1%2.
6%
Tota
l Cur
rent
Ope
ratio
ns$2
,165
.4$2
,573
.2$2
,654
.7$2
,784
.5$2
,943
.3$3
,081
.3$3
,188
.223
.9%
47.2
%4.
4%3.
9%
Equ
ipm
ent a
nd C
apita
l Out
lay
357.
141
5.5
461.
247
6.0
447.
845
0.8
553.
433
.2%
55.0
%5.
9%4.
5%
Deb
t Ser
vice
276.
429
6.3
300.
535
8.0
287.
531
8.0
327.
010
.4%
18.3
%2.
0%1.
7%
Prin
cipa
l15
5.9
175.
118
2.1
248.
118
9.1
200.
819
7.9
13.0
%26
.9%
2.5%
2.4%
Inte
rest
120.
412
1.2
118.
410
9.9
98.4
117.
212
9.1
6.5%
7.2%
1.3%
0.7%
Tota
l Exp
endi
ture
s (C
urre
nt O
pera
tions
+ E
quip
men
t and
Cap
ital
Out
lay
+ D
ebt S
ervi
ce)
$2,7
98.8
$3,2
85.0
$3,4
16.4
$3,6
18.5
$3,6
78.5
$3,8
50.1
$4,0
68.6
23.9
%45
.4%
4.4%
3.8%
2008 Annual Report

2008 Annual Report OFFICE OF THE STATE COMPTROLLER46
CO
UN
TY R
EVEN
UES
– F
isca
l Yea
rs E
nded
in 1
996
- 200
6Pe
rcen
t Cha
nge
Ove
rall
Ave
rage
Ann
ual
( $ m
illio
ns )
1996
2001
2002
2003
2004
2005
2006
2001
-200
619
96-2
006
2001
-200
619
96-2
006
Rev
enue
s:
Rea
l Pro
pert
y Ta
xes
and
Ass
essm
ents
3,31
9.5
3,15
3.1
3,34
0.5
3,71
9.2
4,00
0.9
4,17
9.1
4,31
4.0
36.8
%30
.0%
6.5%
2.7%
Oth
er R
eal P
rope
rty
Tax
Item
s18
6.6
185.
621
4.7
234.
922
8.8
238.
726
3.4
42.0
%41
.1%
7.3%
3.5%
Sal
es a
nd U
se T
ax3,
116.
33,
664.
13,
922.
44,
198.
54,
574.
44,
891.
75,
551.
951
.5%
78.2
%8.
7%6.
0%
Oth
er N
on-P
rope
rty
taxe
s46
.153
.560
.361
.664
.476
.185
.159
.1%
84.8
%9.
7%6.
3%
Cha
rges
for S
ervi
ces
2,67
0.5
2,28
4.7
2,40
5.6
2,48
5.6
2,31
5.9
2,33
9.6
2,25
5.9
-1.3
%-1
5.5%
-0.3
%-1
.7%
HE
ALT
H F
EE
S1,
931.
71,
270.
91,
316.
91,
323.
11,
052.
41,
039.
01,
074.
5-1
5.5%
-44.
4%-3
.3%
-5.7
%
Cha
rges
to O
ther
Gov
ernm
ents
269.
329
2.0
316.
331
3.8
344.
036
8.1
404.
038
.4%
50.0
%6.
7%4.
1%
Use
and
Sal
e of
Pro
pert
y26
7.7
518.
324
8.8
278.
222
2.9
508.
735
5.8
-31.
4%32
.9%
-7.3
%2.
9%
Oth
er L
ocal
Rev
enue
s17
1.1
502.
754
0.3
403.
040
6.1
413.
733
2.2
-33.
9%94
.1%
-8.0
%6.
9%
Tota
l Loc
al R
even
ues
$10,
047.
0$1
0,65
4.0
$11,
048.
9$1
1,69
4.7
$12,
157.
2$1
3,01
5.7
$13,
562.
427
.3%
35.0
%5.
0%3.
1%
Sta
te A
id2,
076.
52,
460.
62,
483.
62,
646.
82,
750.
82,
701.
12,
706.
210
.0%
30.3
%1.
9%2.
7%
SO
CIA
L S
ER
VIC
ES
908.
81,
069.
41,
093.
51,
210.
11,
230.
91,
181.
61,
033.
3-3
.4%
13.7
%-0
.7%
1.3%
Fede
ral A
id1,
564.
11,
864.
82,
048.
82,
005.
12,
017.
11,
897.
62,
071.
011
.1%
32.4
%2.
1%2.
9%
SO
CIA
L S
ER
VIC
ES
1,18
8.3
1,31
1.2
1,40
1.7
1,38
7.4
1,40
1.0
1,35
1.3
1,42
4.0
8.6%
19.8
%1.
7%1.
8%
Tota
l Sta
te a
nd F
eder
al R
even
ues
$3,6
40.6
$4,3
25.3
$4,5
32.4
$4,6
51.9
$4,7
67.9
$4,5
98.7
$4,7
77.2
10.5
%31
.2%
2.0%
2.8%
Tota
l Rev
enue
s (L
ocal
, Sta
te a
nd F
eder
al S
ourc
es)
$13,
687.
6$1
4,97
9.3
$15,
581.
2$1
6,34
6.7
$16,
925.
1$1
7,61
4.4
$18,
339.
522
.4%
34.0
%4.
1%3.
0%

47 DIVISION OF LOCAL GOVERNMENT AND SCHOOL ACCOUNTABILITY
CO
UN
TY E
XPEN
DIT
UR
ES –
Fis
cal Y
ears
End
ed in
199
6 - 2
006
Perc
ent C
hang
eO
vera
llA
vera
ge A
nnua
l( $
mill
ions
)19
9620
0120
0220
0320
0420
0520
0620
01-2
006
1996
-200
620
01-2
006
1996
-200
6
Exp
endi
ture
s:
Cur
rent
Ope
ratio
ns:
Per
sona
l Ser
vice
s3,
942.
64,
197.
64,
423.
14,
399.
14,
528.
54,
614.
94,
806.
414
.5%
21.9
%2.
8%2.
0%
Em
ploy
ee B
enefi
ts1,
373.
01,
446.
11,
574.
41,
936.
72,
218.
42,
367.
82,
521.
974
.4%
83.7
%11
.8%
6.3%
Con
tract
ual
7,90
7.6
8,75
2.6
9,03
3.2
9,32
3.9
9,81
0.8
9,75
3.0
10,1
65.4
16.1
%28
.6%
3.0%
2.5%
Tota
l Cur
rent
Ope
ratio
ns$1
3,22
3.3
$14,
396.
3$1
5,03
0.7
$15,
659.
7$1
6,55
7.7
$16,
735.
7$1
7,49
3.7
21.5
%32
.3%
4.0%
2.8%
Equ
ipm
ent a
nd C
apita
l Out
lay
859.
41,
233.
71,
140.
21,
098.
11,
152.
91,
193.
11,
353.
89.
7%57
.5%
1.9%
4.7%
Deb
t Ser
vice
1,00
5.7
1,15
0.2
943.
499
2.8
956.
31,
178.
81,
053.
3-8
.4%
4.7%
-1.7
%0.
5%
Prin
cipa
l61
2.2
782.
359
5.5
607.
060
3.6
792.
564
2.4
-17.
9%4.
9%-3
.9%
0.5%
Inte
rest
393.
536
7.9
347.
838
5.8
352.
738
6.3
411.
011
.7%
4.4%
2.2%
0.4%
Tota
l Exp
endi
ture
s (C
urre
nt O
pera
tions
+ E
quip
men
t and
C
apita
l Out
lay
+ D
ebt S
ervi
ce)
$15,
088.
4 $1
6,78
0.3
$17,
114.
2 $1
7,75
0.6
$18,
666.
9 $1
9,10
7.7
$19,
900.
8 18
.6%
31.9
%3.
5%2.
8%
Exp
endi
ture
s by
Fun
ctio
n:
Gen
eral
Gov
ernm
ent
1,85
9.2
1,90
2.9
1,86
0.1
1,86
6.1
2,22
0.2
2,27
9.7
2,68
2.2
41.0
%44
.3%
7.1%
3.7%
Edu
catio
n66
9.4
793.
783
2.5
868.
191
2.9
1,00
0.8
1,10
7.0
39.5
%65
.4%
6.9%
5.2%
Pub
lic S
afet
y1,
704.
72,
092.
32,
228.
72,
302.
52,
394.
52,
482.
82,
637.
126
.0%
54.7
%4.
7%4.
5%
Hea
lth2,
175.
11,
759.
71,
818.
31,
869.
21,
678.
91,
764.
11,
750.
5-0
.5%
-19.
5%-0
.1%
-2.2
%
Tran
spor
tatio
n90
0.7
1,21
9.2
1,12
4.1
1,12
6.8
1,14
9.7
1,23
5.6
1,30
6.9
7.2%
45.1
%1.
4%3.
8%
Soc
ial S
ervi
ces
4,22
8.2
5,01
0.4
5,22
9.4
5,32
9.2
5,65
3.2
5,23
3.2
5,23
9.9
4.6%
23.9
%0.
9%2.
2%
ME
DIC
AID
1,46
3.7
2,09
8.5
2,27
1.7
2,29
1.9
2,56
8.8
2,15
6.2
2,00
4.3
-4.5
%36
.9%
-0.9
%3.
2%
FIN
AN
CIA
L A
SS
ISTA
NC
E1,
628.
91,
450.
51,
392.
01,
478.
11,
467.
51,
497.
31,
555.
47.
2%-4
.5%
1.4%
-0.5
%
San
itatio
n60
0.0
637.
470
4.3
659.
368
0.9
721.
375
9.2
19.1
%26
.5%
3.6%
2.4%
Eco
nom
ic D
evel
opm
ent
97.7
121.
012
7.2
138.
413
7.0
132.
215
0.5
24.3
%53
.9%
4.5%
4.4%
Cul
ture
-Rec
reat
ion
246.
031
7.8
314.
230
9.7
295.
330
4.8
288.
1-9
.3%
17.1
%-1
.9%
1.6%
Com
mun
ity S
ervi
ces
204.
126
4.8
292.
827
5.1
269.
927
6.0
307.
216
.0%
50.5
%3.
0%4.
2%
Util
ities
24.5
64.8
64.8
76.7
99.7
130.
897
.049
.6%
296.
2%8.
4%14
.8%
Em
ploy
ee B
enefi
ts1,
373.
01,
446.
11,
574.
41,
936.
72,
218.
42,
367.
82,
521.
974
.4%
83.7
%11
.8%
6.3%
Tota
l Exp
endi
ture
s by
Fun
ctio
n (1
)$1
4,08
2.7
$15,
630.
1$1
6,17
0.9
$16,
757.
8$1
7,71
0.6
$17,
928.
8$1
8,84
7.4
20.6
%33
.8%
3.8%
3.0%
(1) e
xclu
des
debt
ser
vice
2008 Annual Report

2008 Annual Report OFFICE OF THE STATE COMPTROLLER48
SUM
MA
RY
OF
CO
UN
TY F
INA
NC
ES –
Fis
cal Y
ears
End
ed in
199
6 - 2
006
Perc
ent C
hang
e
Ove
rall
Ave
rage
Ann
ual
( $ m
illio
ns )
1996
2001
2002
2003
2004
2005
2006
2001
-200
619
96-2
006
2001
-200
619
96-2
006
Pop
ulat
ion
- Cen
sus
Est
imat
es11
,005
,960
11,0
38,5
3811
,063
,309
11,0
73,9
8711
,048
,706
11,0
31,4
210.
2%0.
1%
Full
Valu
e53
3,94
1.6
635,
075.
668
8,99
6.4
787,
048.
586
3,69
7.8
942,
536.
31,
045,
294.
664
.6%
95.8
%10
.5%
7.0%
Deb
t Iss
ued:
Bon
ds1,
220.
050
1.6
754.
01,
297.
51,
961.
01,
666.
01,
201.
513
9.5%
-1.5
%19
.1%
-0.2
%
Oth
er D
ebt
1,46
0.7
1,03
9.8
965.
482
3.4
541.
466
8.7
1,08
8.6
4.7%
-25.
5%0.
9%-2
.9%
Out
stan
ding
Deb
t:
Bon
ds (G
ross
)5,
996.
35,
816.
75,
817.
36,
668.
47,
042.
27,
777.
68,
215.
341
.2%
37.0
%7.
2%3.
2%
Oth
er D
ebt
1,52
5.7
1,33
2.2
1,12
6.4
1,27
3.6
1,08
1.4
1,18
2.1
1,22
7.9
-7.8
%-1
9.5%
-1.6
%-2
.2%
Tota
l Out
stan
ding
Deb
t$7
,522
.0$7
,148
.9$6
,943
.7$7
,942
.0$8
,123
.6$8
,959
.6$9
,443
.132
.1%
25.5
%5.
7%2.
3%
Rev
enue
s:
Rea
l Pro
pert
y Ta
xes
and
Ass
essm
ents
3,31
9.5
3,15
3.1
3,34
0.5
3,71
9.2
4,00
0.9
4,17
9.1
4,31
4.0
36.8
%30
.0%
6.5%
2.7%
Oth
er R
eal P
rope
rty
Tax
Item
s18
6.6
185.
621
4.7
234.
922
8.8
238.
726
3.4
42.0
%41
.1%
7.3%
3.5%
Sal
es a
nd U
se T
ax3,
116.
33,
664.
13,
922.
44,
198.
54,
574.
44,
891.
75,
551.
951
.5%
78.2
%8.
7%6.
0%
Oth
er N
on-P
rope
rty
taxe
s46
.153
.560
.361
.664
.476
.185
.159
.1%
84.8
%9.
7%6.
3%
Cha
rges
for S
ervi
ces
2,67
0.5
2,28
4.7
2,40
5.6
2,48
5.6
2,31
5.9
2,33
9.6
2,25
5.9
-1.3
%-1
5.5%
-0.3
%-1
.7%
Cha
rges
to O
ther
Gov
ernm
ents
269.
329
2.0
316.
331
3.8
344.
036
8.1
404.
038
.4%
50.0
%6.
7%4.
1%
Use
and
Sal
e of
Pro
pert
y26
7.7
518.
324
8.8
278.
222
2.9
508.
735
5.8
-31.
4%32
.9%
-7.3
%2.
9%
Oth
er L
ocal
Rev
enue
s17
1.1
502.
754
0.3
403.
040
6.1
413.
733
2.2
-33.
9%94
.1%
-8.0
%6.
9%
Tota
l Loc
al R
even
ues
$10,
047.
0$1
0,65
4.0
$11,
048.
9$1
1,69
4.7
$12,
157.
2$1
3,01
5.7
$13,
562.
427
.3%
35.0
%5.
0%3.
1%
Sta
te A
id2,
076.
52,
460.
62,
483.
62,
646.
82,
750.
82,
701.
12,
706.
210
.0%
30.3
%1.
9%2.
7%
Fede
ral A
id1,
564.
11,
864.
82,
048.
82,
005.
12,
017.
11,
897.
62,
071.
011
.1%
32.4
%2.
1%2.
9%
Tota
l Sta
te a
nd F
eder
al R
even
ues
$3,6
40.6
$4,3
25.3
$4,5
32.4
$4,6
51.9
$4,7
67.9
$4,5
98.7
$4,7
77.2
10.5
%31
.2%
2.0%
2.8%
Tota
l Rev
enue
s (L
ocal
, Sta
te a
nd F
eder
al S
ourc
es)
$13,
687.
6$1
4,97
9.3
$15,
581.
2$1
6,34
6.7
$16,
925.
1$1
7,61
4.4
$18,
339.
522
.4%
34.0
%4.
1%3.
0%
Exp
endi
ture
s:
Cur
rent
Ope
ratio
ns:
Per
sona
l Ser
vice
s3,
942.
64,
197.
64,
423.
14,
399.
14,
528.
54,
614.
94,
806.
414
.5%
21.9
%2.
8%2.
0%
Em
ploy
ee B
enefi
ts1,
373.
01,
446.
11,
574.
41,
936.
72,
218.
42,
367.
82,
521.
974
.4%
83.7
%11
.8%
6.3%
Con
trac
tual
7,90
7.6
8,75
2.6
9,03
3.2
9,32
3.9
9,81
0.8
9,75
3.0
10,1
65.4
16.1
%28
.6%
3.0%
2.5%
Tota
l Cur
rent
Ope
ratio
ns$1
3,22
3.3
$14,
396.
3$1
5,03
0.7
$15,
659.
7$1
6,55
7.7
$16,
735.
7$1
7,49
3.7
21.5
%32
.3%
4.0%
2.8%
Equ
ipm
ent a
nd C
apita
l Out
lay
859.
41,
233.
71,
140.
21,
098.
11,
152.
91,
193.
11,
353.
89.
7%57
.5%
1.9%
4.7%
Deb
t Ser
vice
1,00
5.7
1,15
0.2
943.
499
2.8
956.
31,
178.
81,
053.
3-8
.4%
4.7%
-1.7
%0.
5%
Prin
cipa
l61
2.2
782.
359
5.5
607.
060
3.6
792.
564
2.4
-17.
9%4.
9%-3
.9%
0.5%
Inte
rest
393.
536
7.9
347.
838
5.8
352.
738
6.3
411.
011
.7%
4.4%
2.2%
0.4%
Tota
l Exp
endi
ture
s (C
urre
nt O
pera
tions
+ E
quip
men
t and
C
apit
al O
utla
y +
Deb
t Ser
vice
)$1
5,08
8.4
$16,
780.
3$1
7,11
4.2
$17,
750.
6$1
8,66
6.9
$19,
107.
7$1
9,90
0.8
18.6
%31
.9%
3.5%
2.8%
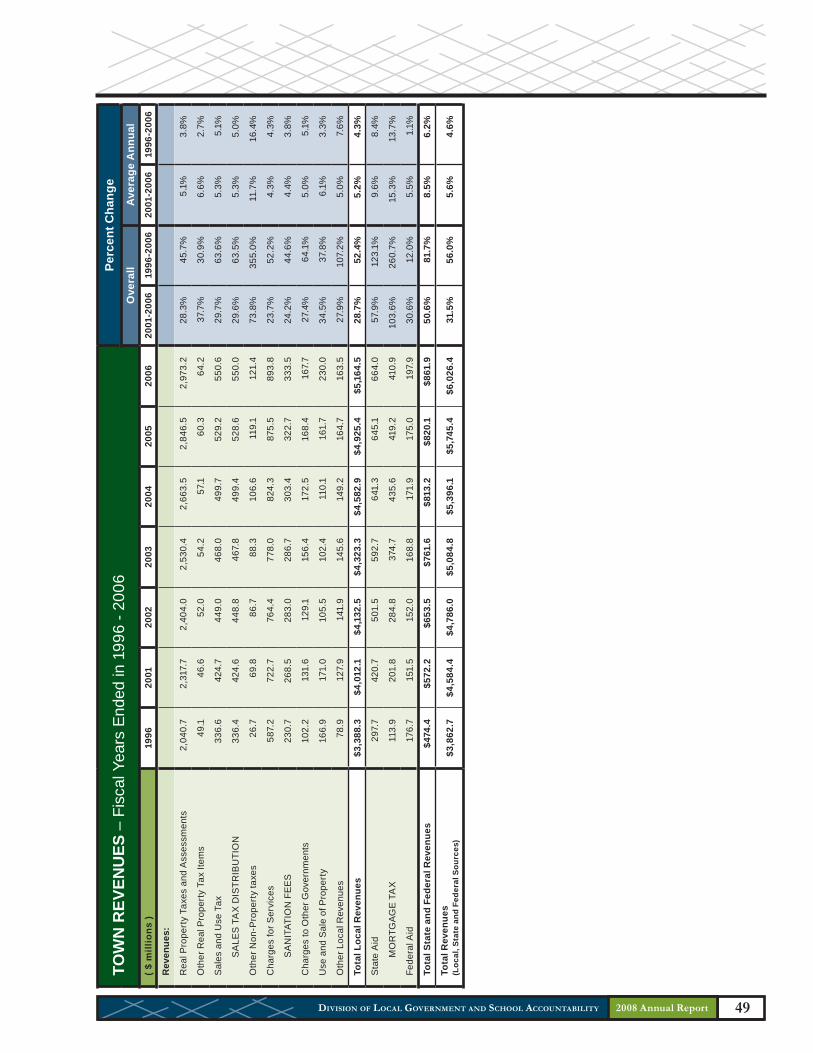
49 DIVISION OF LOCAL GOVERNMENT AND SCHOOL ACCOUNTABILITY
TOW
N R
EVEN
UES
– F
isca
l Yea
rs E
nded
in 1
996
- 200
6Pe
rcen
t Cha
nge
Ove
rall
Ave
rage
Ann
ual
( $ m
illio
ns )
1996
2001
2002
2003
2004
2005
2006
2001
-200
619
96-2
006
2001
-200
619
96-2
006
Rev
enue
s:
Rea
l Pro
pert
y Ta
xes
and
Ass
essm
ents
2,04
0.7
2,31
7.7
2,40
4.0
2,53
0.4
2,66
3.5
2,84
6.5
2,97
3.2
28.3
%45
.7%
5.1%
3.8%
Oth
er R
eal P
rope
rty
Tax
Item
s49
.146
.652
.054
.257
.160
.364
.237
.7%
30.9
%6.
6%2.
7%
Sal
es a
nd U
se T
ax33
6.6
424.
744
9.0
468.
049
9.7
529.
255
0.6
29.7
%63
.6%
5.3%
5.1%
SA
LES
TA
X D
ISTR
IBU
TIO
N33
6.4
424.
644
8.8
467.
849
9.4
528.
655
0.0
29.6
%63
.5%
5.3%
5.0%
Oth
er N
on-P
rope
rty
taxe
s26
.769
.886
.788
.310
6.6
119.
112
1.4
73.8
%35
5.0%
11.7
%16
.4%
Cha
rges
for S
ervi
ces
587.
272
2.7
764.
477
8.0
824.
387
5.5
893.
823
.7%
52.2
%4.
3%4.
3%
SA
NIT
ATIO
N F
EE
S23
0.7
268.
528
3.0
286.
730
3.4
322.
733
3.5
24.2
%44
.6%
4.4%
3.8%
Cha
rges
to O
ther
Gov
ernm
ents
102.
213
1.6
129.
115
6.4
172.
516
8.4
167.
727
.4%
64.1
%5.
0%5.
1%
Use
and
Sal
e of
Pro
pert
y16
6.9
171.
010
5.5
102.
411
0.1
161.
723
0.0
34.5
%37
.8%
6.1%
3.3%
Oth
er L
ocal
Rev
enue
s78
.912
7.9
141.
914
5.6
149.
216
4.7
163.
527
.9%
107.
2%5.
0%7.
6%
Tota
l Loc
al R
even
ues
$3,3
88.3
$4,0
12.1
$4,1
32.5
$4,3
23.3
$4,5
82.9
$4,9
25.4
$5,1
64.5
28.7
%52
.4%
5.2%
4.3%
Sta
te A
id29
7.7
420.
750
1.5
592.
764
1.3
645.
166
4.0
57.9
%12
3.1%
9.6%
8.4%
MO
RTG
AGE
TA
X11
3.9
201.
828
4.8
374.
743
5.6
419.
241
0.9
103.
6%26
0.7%
15.3
%13
.7%
Fede
ral A
id17
6.7
151.
515
2.0
168.
817
1.9
175.
019
7.9
30.6
%12
.0%
5.5%
1.1%
Tota
l Sta
te a
nd F
eder
al R
even
ues
$474
.4$5
72.2
$653
.5$7
61.6
$813
.2$8
20.1
$861
.950
.6%
81.7
%8.
5%6.
2%
Tota
l Rev
enue
s (L
ocal
, Sta
te a
nd F
eder
al S
ourc
es)
$3,8
62.7
$4,5
84.4
$4,7
86.0
$5,0
84.8
$5,3
96.1
$5,7
45.4
$6,0
26.4
31.5
%56
.0%
5.6%
4.6%
2008 Annual Report
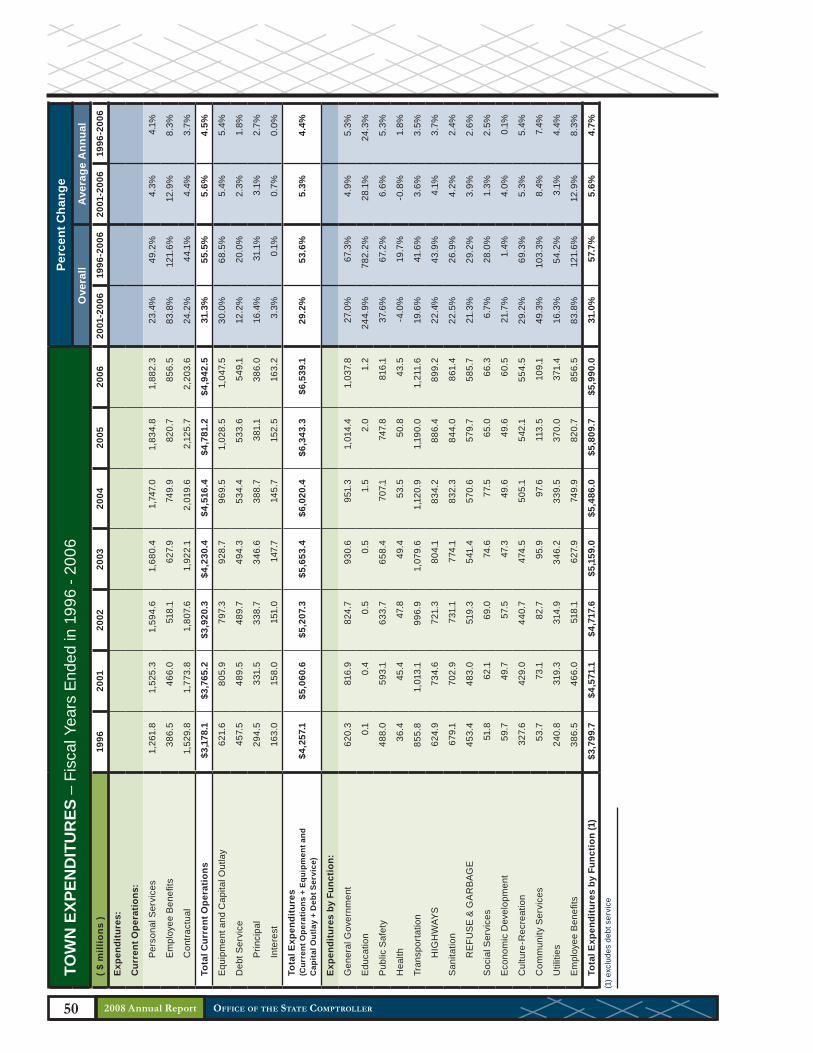
2008 Annual Report OFFICE OF THE STATE COMPTROLLER50
TOW
N E
XPEN
DIT
UR
ES –
Fis
cal Y
ears
End
ed in
199
6 - 2
006
Perc
ent C
hang
eO
vera
llA
vera
ge A
nnua
l( $
mill
ions
)19
9620
0120
0220
0320
0420
0520
0620
01-2
006
1996
-200
620
01-2
006
1996
-200
6
Exp
endi
ture
s:
Cur
rent
Ope
ratio
ns:
Per
sona
l Ser
vice
s1,
261.
81,
525.
31,
594.
61,
680.
41,
747.
01,
834.
81,
882.
323
.4%
49.2
%4.
3%4.
1%
Em
ploy
ee B
enefi
ts38
6.5
466.
051
8.1
627.
974
9.9
820.
785
6.5
83.8
%12
1.6%
12.9
%8.
3%
Con
tract
ual
1,52
9.8
1,77
3.8
1,80
7.6
1,92
2.1
2,01
9.6
2,12
5.7
2,20
3.6
24.2
%44
.1%
4.4%
3.7%
Tota
l Cur
rent
Ope
ratio
ns$3
,178
.1$3
,765
.2$3
,920
.3$4
,230
.4$4
,516
.4$4
,781
.2$4
,942
.531
.3%
55.5
%5.
6%4.
5%
Equ
ipm
ent a
nd C
apita
l Out
lay
621.
680
5.9
797.
392
8.7
969.
51,
028.
51,
047.
530
.0%
68.5
%5.
4%5.
4%
Deb
t Ser
vice
457.
548
9.5
489.
749
4.3
534.
453
3.6
549.
112
.2%
20.0
%2.
3%1.
8%
Prin
cipa
l29
4.5
331.
533
8.7
346.
638
8.7
381.
138
6.0
16.4
%31
.1%
3.1%
2.7%
Inte
rest
163.
015
8.0
151.
014
7.7
145.
715
2.5
163.
23.
3%0.
1%0.
7%0.
0%
Tota
l Exp
endi
ture
s (C
urre
nt O
pera
tions
+ E
quip
men
t and
C
apita
l Out
lay
+ D
ebt S
ervi
ce)
$4,2
57.1
$5,0
60.6
$5,2
07.3
$5,6
53.4
$6,0
20.4
$6,3
43.3
$6,5
39.1
29.2
%53
.6%
5.3%
4.4%
Exp
endi
ture
s by
Fun
ctio
n:
Gen
eral
Gov
ernm
ent
620.
381
6.9
824.
793
0.6
951.
31,
014.
41,
037.
827
.0%
67.3
%4.
9%5.
3%
Edu
catio
n0.
10.
40.
50.
51.
52.
01.
224
4.9%
782.
2%28
.1%
24.3
%
Pub
lic S
afet
y48
8.0
593.
163
3.7
658.
470
7.1
747.
881
6.1
37.6
%67
.2%
6.6%
5.3%
Hea
lth36
.445
.447
.849
.453
.550
.843
.5-4
.0%
19.7
%-0
.8%
1.8%
Tran
spor
tatio
n85
5.8
1,01
3.1
996.
91,
079.
61,
120.
91,
190.
01,
211.
619
.6%
41.6
%3.
6%3.
5%
HIG
HW
AYS
624.
973
4.6
721.
380
4.1
834.
288
6.4
899.
222
.4%
43.9
%4.
1%3.
7%
San
itatio
n67
9.1
702.
973
1.1
774.
183
2.3
844.
086
1.4
22.5
%26
.9%
4.2%
2.4%
RE
FUS
E &
GA
RB
AGE
453.
448
3.0
519.
354
1.4
570.
657
9.7
585.
721
.3%
29.2
%3.
9%2.
6%
Soc
ial S
ervi
ces
51.8
62.1
69.0
74.6
77.5
65.0
66.3
6.7%
28.0
%1.
3%2.
5%
Eco
nom
ic D
evel
opm
ent
59.7
49.7
57.5
47.3
49.6
49.6
60.5
21.7
%1.
4%4.
0%0.
1%
Cul
ture
-Rec
reat
ion
327.
642
9.0
440.
747
4.5
505.
154
2.1
554.
529
.2%
69.3
%5.
3%5.
4%
Com
mun
ity S
ervi
ces
53.7
73.1
82.7
95.9
97.6
113.
510
9.1
49.3
%10
3.3%
8.4%
7.4%
Util
ities
240.
831
9.3
314.
934
6.2
339.
537
0.0
371.
416
.3%
54.2
%3.
1%4.
4%
Em
ploy
ee B
enefi
ts38
6.5
466.
051
8.1
627.
974
9.9
820.
785
6.5
83.8
%12
1.6%
12.9
%8.
3%
Tota
l Exp
endi
ture
s by
Fun
ctio
n (1
)$3
,799
.7$4
,571
.1$4
,717
.6$5
,159
.0$5
,486
.0$5
,809
.7$5
,990
.031
.0%
57.7
%5.
6%4.
7%(1
) exc
lude
s de
bt s
ervi
ce

51 DIVISION OF LOCAL GOVERNMENT AND SCHOOL ACCOUNTABILITY
SUM
MA
RY
OF
TOW
N F
INA
NC
ES –
Fis
cal Y
ears
End
ed in
199
6 - 2
006
Perc
ent C
hang
eO
vera
llA
vera
ge A
nnua
l( $
mill
ions
)19
9620
0120
0220
0320
0420
0520
0620
01-2
006
1996
-200
620
01-2
006
1996
-200
6
Pop
ulat
ion
- Cen
sus
Est
imat
es8,
739,
635
8,77
8,70
48,
810,
457
8,82
9,95
48,
817,
488
8,81
0,98
10.
8%0.
2%
Full
Valu
e46
4,31
3.8
565,
231.
461
5,13
2.2
703,
607.
977
5,48
3.5
847,
490.
494
2,19
2.1
66.7
%10
2.9%
10.8
%7.
3%
Deb
t Iss
ued:
Bon
ds30
5.4
427.
838
6.8
560.
878
5.2
586.
050
8.0
18.7
%66
.3%
3.5%
5.2%
Oth
er D
ebt
313.
335
2.7
292.
641
5.2
346.
232
6.0
314.
9-1
0.7%
0.5%
-2.2
%0.
1%
Out
stan
ding
Deb
t:
Bon
ds (G
ross
)2,
635.
02,
942.
73,
030.
53,
132.
43,
436.
03,
557.
43,
730.
226
.8%
41.6
%4.
9%3.
5%
Oth
er D
ebt
552.
763
8.1
570.
573
2.1
670.
671
8.4
737.
715
.6%
33.5
%2.
9%2.
9%
Tota
l Out
stan
ding
Deb
t$3
,187
.7$3
,580
.8$3
,600
.9$3
,864
.4$4
,106
.6$4
,275
.8$4
,468
.024
.8%
40.2
%4.
5%3.
4%
Rev
enue
s:
Rea
l Pro
pert
y Ta
xes
and
Ass
essm
ents
2,04
0.7
2,31
7.7
2,40
4.0
2,53
0.4
2,66
3.5
2,84
6.5
2,97
3.2
28.3
%45
.7%
5.1%
3.8%
Oth
er R
eal P
rope
rty
Tax
Item
s49
.146
.652
.054
.257
.160
.364
.237
.7%
30.9
%6.
6%2.
7%
Sal
es a
nd U
se T
ax33
6.6
424.
744
9.0
468.
049
9.7
529.
255
0.6
29.7
%63
.6%
5.3%
5.1%
Oth
er N
on-P
rope
rty
taxe
s26
.769
.886
.788
.310
6.6
119.
112
1.4
73.8
%35
5.0%
11.7
%16
.4%
Cha
rges
for S
ervi
ces
587.
272
2.7
764.
477
8.0
824.
387
5.5
893.
823
.7%
52.2
%4.
3%4.
3%
Cha
rges
to O
ther
Gov
ernm
ents
102.
213
1.6
129.
115
6.4
172.
516
8.4
167.
727
.4%
64.1
%5.
0%5.
1%
Use
and
Sal
e of
Pro
pert
y16
6.9
171.
010
5.5
102.
411
0.1
161.
723
0.0
34.5
%37
.8%
6.1%
3.3%
Oth
er L
ocal
Rev
enue
s78
.912
7.9
141.
914
5.6
149.
216
4.7
163.
527
.9%
107.
2%5.
0%7.
6%
Tota
l Loc
al R
even
ues
$3,3
88.3
$4,0
12.1
$4,1
32.5
$4,3
23.3
$4,5
82.9
$4,9
25.4
$5,1
64.5
28.7
%52
.4%
5.2%
4.3%
Sta
te A
id29
7.7
420.
750
1.5
592.
764
1.3
645.
166
4.0
57.9
%12
3.1%
9.6%
8.4%
Fede
ral A
id17
6.7
151.
515
2.0
168.
817
1.9
175.
019
7.9
30.6
%12
.0%
5.5%
1.1%
Tota
l Sta
te a
nd F
eder
al R
even
ues
$474
.4$5
72.2
$653
.5$7
61.6
$813
.2$8
20.1
$861
.950
.6%
81.7
%8.
5%6.
2%
Tota
l Rev
enue
s (L
ocal
, Sta
te a
nd F
eder
al S
ourc
es)
$3,8
62.7
$4,5
84.4
$4,7
86.0
$5,0
84.8
$5,3
96.1
$5,7
45.4
$6,0
26.4
31.5
%56
.0%
5.6%
4.6%
Exp
endi
ture
s:
Cur
rent
Ope
ratio
ns:
Per
sona
l Ser
vice
s1,
261.
81,
525.
31,
594.
61,
680.
41,
747.
01,
834.
81,
882.
323
.4%
49.2
%4.
3%4.
1%
Em
ploy
ee B
enefi
ts38
6.5
466.
051
8.1
627.
974
9.9
820.
785
6.5
83.8
%12
1.6%
12.9
%8.
3%
Con
trac
tual
1,52
9.8
1,77
3.8
1,80
7.6
1,92
2.1
2,01
9.6
2,12
5.7
2,20
3.6
24.2
%44
.1%
4.4%
3.7%
Tota
l Cur
rent
Ope
ratio
ns$3
,178
.1$3
,765
.2$3
,920
.3$4
,230
.4$4
,516
.4$4
,781
.2$4
,942
.531
.3%
55.5
%5.
6%4.
5%
Equ
ipm
ent a
nd C
apita
l Out
lay
621.
680
5.9
797.
392
8.7
969.
51,
028.
51,
047.
530
.0%
68.5
%5.
4%5.
4%
Deb
t Ser
vice
457.
548
9.5
489.
749
4.3
534.
453
3.6
549.
112
.2%
20.0
%2.
3%1.
8%
Prin
cipa
l29
4.5
331.
533
8.7
346.
638
8.7
381.
138
6.0
16.4
%31
.1%
3.1%
2.7%
Inte
rest
163.
015
8.0
151.
014
7.7
145.
715
2.5
163.
23.
3%0.
1%0.
7%0.
0%
Tota
l Exp
endi
ture
s (C
urre
nt O
pera
tions
+ E
quip
men
t and
C
apit
al O
utla
y +
Deb
t Ser
vice
)$4
,257
.1$5
,060
.6$5
,207
.3$5
,653
.4$6
,020
.4$6
,343
.3$6
,539
.129
.2%
53.6
%5.
3%4.
4%
2008 Annual Report
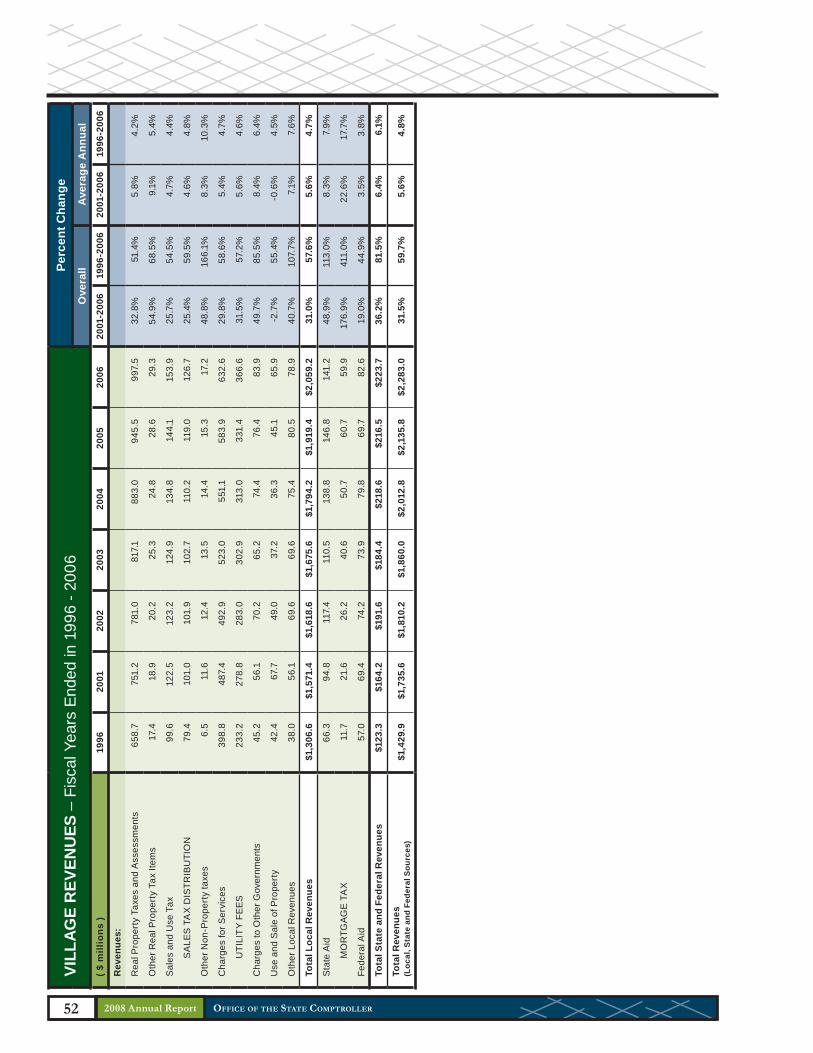
2008 Annual Report OFFICE OF THE STATE COMPTROLLER52
VILL
AGE
REV
ENU
ES –
Fis
cal Y
ears
End
ed in
199
6 - 2
006
Perc
ent C
hang
eO
vera
llA
vera
ge A
nnua
l( $
mill
ions
)19
9620
0120
0220
0320
0420
0520
0620
01-2
006
1996
-200
620
01-2
006
1996
-200
6
Rev
enue
s:
Rea
l Pro
pert
y Ta
xes
and
Ass
essm
ents
658.
775
1.2
781.
081
7.1
883.
094
5.5
997.
532
.8%
51.4
%5.
8%4.
2%
Oth
er R
eal P
rope
rty
Tax
Item
s17
.418
.920
.225
.324
.828
.629
.354
.9%
68.5
%9.
1%5.
4%
Sal
es a
nd U
se T
ax99
.612
2.5
123.
212
4.9
134.
814
4.1
153.
925
.7%
54.5
%4.
7%4.
4%
SA
LES
TA
X D
ISTR
IBU
TIO
N79
.410
1.0
101.
910
2.7
110.
211
9.0
126.
725
.4%
59.5
%4.
6%4.
8%
Oth
er N
on-P
rope
rty
taxe
s6.
511
.612
.413
.514
.415
.317
.248
.8%
166.
1%8.
3%10
.3%
Cha
rges
for S
ervi
ces
398.
848
7.4
492.
952
3.0
551.
158
3.9
632.
629
.8%
58.6
%5.
4%4.
7%
UTI
LIT
Y F
EE
S23
3.2
278.
828
3.0
302.
931
3.0
331.
436
6.6
31.5
%57
.2%
5.6%
4.6%
Cha
rges
to O
ther
Gov
ernm
ents
45.2
56.1
70.2
65.2
74.4
76.4
83.9
49.7
%85
.5%
8.4%
6.4%
Use
and
Sal
e of
Pro
pert
y42
.467
.749
.037
.236
.345
.165
.9-2
.7%
55.4
%-0
.6%
4.5%
Oth
er L
ocal
Rev
enue
s38
.056
.169
.669
.675
.480
.578
.940
.7%
107.
7%7.
1%7.
6%
Tota
l Loc
al R
even
ues
$1,3
06.6
$1,5
71.4
$1,6
18.6
$1,6
75.6
$1,7
94.2
$1,9
19.4
$2,0
59.2
31.0
%57
.6%
5.6%
4.7%
Sta
te A
id66
.394
.811
7.4
110.
513
8.8
146.
814
1.2
48.9
%11
3.0%
8.3%
7.9%
MO
RTG
AGE
TA
X11
.721
.626
.240
.650
.760
.759
.917
6.9%
411.
0%22
.6%
17.7
%
Fede
ral A
id57
.069
.474
.273
.979
.869
.782
.619
.0%
44.9
%3.
5%3.
8%
Tota
l Sta
te a
nd F
eder
al R
even
ues
$123
.3$1
64.2
$191
.6$1
84.4
$218
.6$2
16.5
$223
.736
.2%
81.5
%6.
4%6.
1%
Tota
l Rev
enue
s (L
ocal
, Sta
te a
nd F
eder
al S
ourc
es)
$1,4
29.9
$1,7
35.6
$1,8
10.2
$1,8
60.0
$2,0
12.8
$2,1
35.8
$2,2
83.0
31.5
%59
.7%
5.6%
4.8%
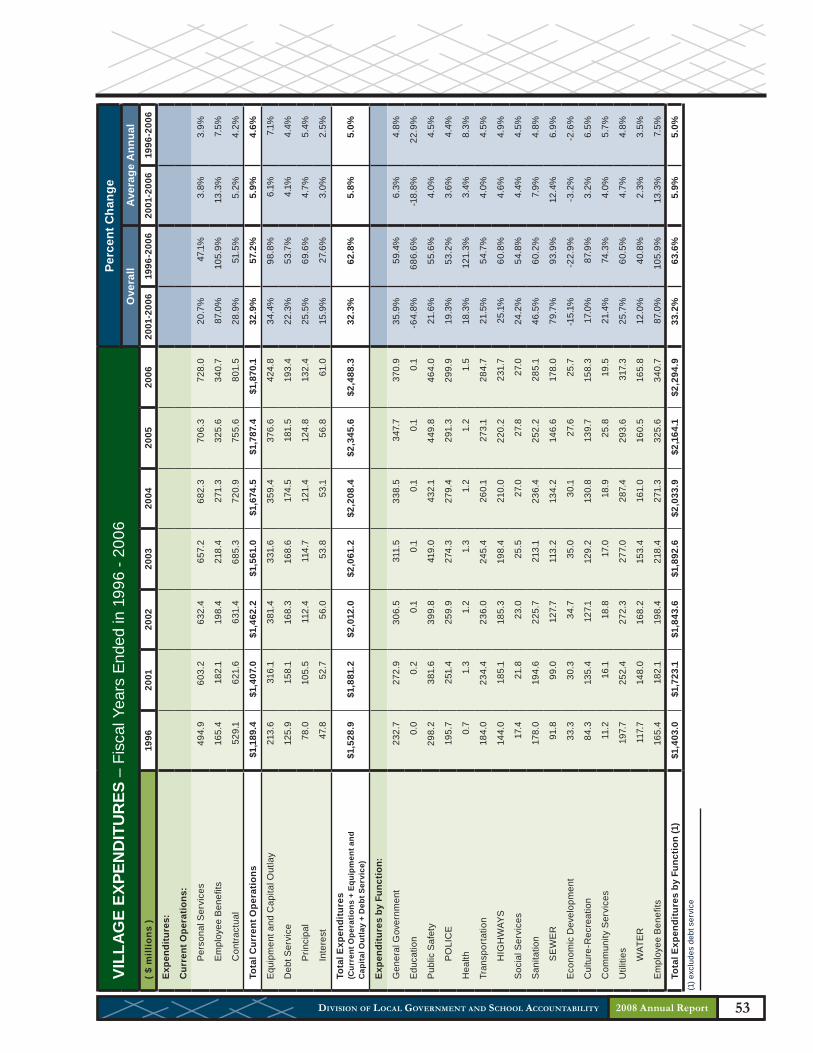
53 DIVISION OF LOCAL GOVERNMENT AND SCHOOL ACCOUNTABILITY
VILL
AGE
EXPE
ND
ITU
RES
– F
isca
l Yea
rs E
nded
in 1
996
- 200
6Pe
rcen
t Cha
nge
Ove
rall
Ave
rage
Ann
ual
( $ m
illio
ns )
1996
2001
2002
2003
2004
2005
2006
2001
-200
619
96-2
006
2001
-200
619
96-2
006
Exp
endi
ture
s:
Cur
rent
Ope
ratio
ns:
Per
sona
l Ser
vice
s49
4.9
603.
263
2.4
657.
268
2.3
706.
372
8.0
20.7
%47
.1%
3.8%
3.9%
Em
ploy
ee B
enefi
ts16
5.4
182.
119
8.4
218.
427
1.3
325.
634
0.7
87.0
%10
5.9%
13.3
%7.
5%
Con
tract
ual
529.
162
1.6
631.
468
5.3
720.
975
5.6
801.
528
.9%
51.5
%5.
2%4.
2%
Tota
l Cur
rent
Ope
ratio
ns$1
,189
.4$1
,407
.0$1
,462
.2$1
,561
.0$1
,674
.5$1
,787
.4$1
,870
.132
.9%
57.2
%5.
9%4.
6%
Equ
ipm
ent a
nd C
apita
l Out
lay
213.
631
6.1
381.
433
1.6
359.
437
6.6
424.
834
.4%
98.8
%6.
1%7.
1%
Deb
t Ser
vice
125.
915
8.1
168.
316
8.6
174.
518
1.5
193.
422
.3%
53.7
%4.
1%4.
4%
Prin
cipa
l78
.010
5.5
112.
411
4.7
121.
412
4.8
132.
425
.5%
69.6
%4.
7%5.
4%
Inte
rest
47.8
52.7
56.0
53.8
53.1
56.8
61.0
15.9
%27
.6%
3.0%
2.5%
Tota
l Exp
endi
ture
s (C
urre
nt O
pera
tions
+ E
quip
men
t and
C
apita
l Out
lay
+ D
ebt S
ervi
ce)
$1,5
28.9
$1,8
81.2
$2,0
12.0
$2,0
61.2
$2,2
08.4
$2,3
45.6
$2,4
88.3
32.3
%62
.8%
5.8%
5.0%
Exp
endi
ture
s by
Fun
ctio
n:
Gen
eral
Gov
ernm
ent
232.
727
2.9
306.
531
1.5
338.
534
7.7
370.
935
.9%
59.4
%6.
3%4.
8%
Edu
catio
n0.
00.
20.
10.
10.
10.
10.
1-6
4.8%
686.
6%-1
8.8%
22.9
%
Pub
lic S
afet
y29
8.2
381.
639
9.8
419.
043
2.1
449.
846
4.0
21.6
%55
.6%
4.0%
4.5%
PO
LIC
E19
5.7
251.
425
9.9
274.
327
9.4
291.
329
9.9
19.3
%53
.2%
3.6%
4.4%
Hea
lth0.
71.
31.
21.
31.
21.
21.
518
.3%
121.
3%3.
4%8.
3%
Tran
spor
tatio
n18
4.0
234.
423
6.0
245.
426
0.1
273.
128
4.7
21.5
%54
.7%
4.0%
4.5%
HIG
HW
AYS
144.
018
5.1
185.
319
8.4
210.
022
0.2
231.
725
.1%
60.8
%4.
6%4.
9%
Soc
ial S
ervi
ces
17.4
21.8
23.0
25.5
27.0
27.8
27.0
24.2
%54
.8%
4.4%
4.5%
San
itatio
n17
8.0
194.
622
5.7
213.
123
6.4
252.
228
5.1
46.5
%60
.2%
7.9%
4.8%
SE
WE
R91
.899
.012
7.7
113.
213
4.2
146.
617
8.0
79.7
%93
.9%
12.4
%6.
9%
Eco
nom
ic D
evel
opm
ent
33.3
30.3
34.7
35.0
30.1
27.6
25.7
-15.
1%-2
2.9%
-3.2
%-2
.6%
Cul
ture
-Rec
reat
ion
84.3
135.
412
7.1
129.
213
0.8
139.
715
8.3
17.0
%87
.9%
3.2%
6.5%
Com
mun
ity S
ervi
ces
11.2
16.1
18.8
17.0
18.9
25.8
19.5
21.4
%74
.3%
4.0%
5.7%
Util
ities
197.
725
2.4
272.
327
7.0
287.
429
3.6
317.
325
.7%
60.5
%4.
7%4.
8%
WAT
ER
117.
714
8.0
168.
215
3.4
161.
016
0.5
165.
812
.0%
40.8
%2.
3%3.
5%
Em
ploy
ee B
enefi
ts16
5.4
182.
119
8.4
218.
427
1.3
325.
634
0.7
87.0
%10
5.9%
13.3
%7.
5%
Tota
l Exp
endi
ture
s by
Fun
ctio
n (1
)$1
,403
.0$1
,723
.1$1
,843
.6$1
,892
.6$2
,033
.9$2
,164
.1$2
,294
.933
.2%
63.6
%5.
9%5.
0%(1
) exc
lude
s de
bt s
ervi
ce
2008 Annual Report
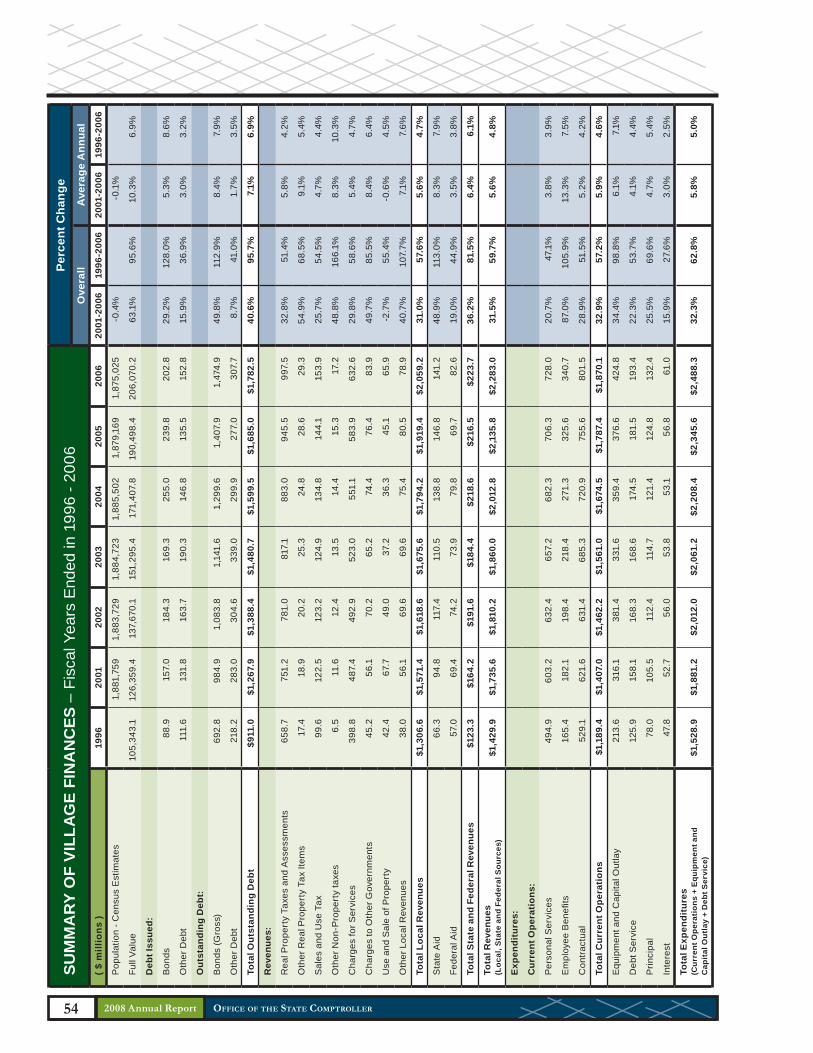
2008 Annual Report OFFICE OF THE STATE COMPTROLLER54
SUM
MA
RY
OF
VIL
LAG
E FI
NA
NC
ES –
Fis
cal Y
ears
End
ed in
199
6 - 2
006
Perc
ent C
hang
eO
vera
llA
vera
ge A
nnua
l( $
mill
ions
)19
9620
0120
0220
0320
0420
0520
0620
01-2
006
1996
-200
620
01-2
006
1996
-200
6
Pop
ulat
ion
- Cen
sus
Est
imat
es1,
881,
759
1,88
3,72
91,
884,
723
1,88
5,50
21,
879,
169
1,87
5,02
5-0
.4%
-0.1
%
Full
Valu
e10
5,34
3.1
126,
359.
413
7,67
0.1
151,
295.
417
1,40
7.8
190,
498.
420
6,07
0.2
63.1
%95
.6%
10.3
%6.
9%
Deb
t Iss
ued:
Bon
ds88
.915
7.0
184.
316
9.3
255.
023
9.8
202.
829
.2%
128.
0%5.
3%8.
6%
Oth
er D
ebt
111.
613
1.8
163.
719
0.3
146.
813
5.5
152.
815
.9%
36.9
%3.
0%3.
2%
Out
stan
ding
Deb
t:
Bon
ds (G
ross
)69
2.8
984.
91,
083.
81,
141.
61,
299.
61,
407.
91,
474.
949
.8%
112.
9%8.
4%7.
9%
Oth
er D
ebt
218.
228
3.0
304.
633
9.0
299.
927
7.0
307.
78.
7%41
.0%
1.7%
3.5%
Tota
l Out
stan
ding
Deb
t$9
11.0
$1,2
67.9
$1,3
88.4
$1,4
80.7
$1,5
99.5
$1,6
85.0
$1,7
82.5
40.6
%95
.7%
7.1%
6.9%
Rev
enue
s:
Rea
l Pro
pert
y Ta
xes
and
Ass
essm
ents
658.
775
1.2
781.
081
7.1
883.
094
5.5
997.
532
.8%
51.4
%5.
8%4.
2%
Oth
er R
eal P
rope
rty
Tax
Item
s17
.418
.920
.225
.324
.828
.629
.354
.9%
68.5
%9.
1%5.
4%
Sal
es a
nd U
se T
ax99
.612
2.5
123.
212
4.9
134.
814
4.1
153.
925
.7%
54.5
%4.
7%4.
4%
Oth
er N
on-P
rope
rty
taxe
s6.
511
.612
.413
.514
.415
.317
.248
.8%
166.
1%8.
3%10
.3%
Cha
rges
for S
ervi
ces
398.
848
7.4
492.
952
3.0
551.
158
3.9
632.
629
.8%
58.6
%5.
4%4.
7%
Cha
rges
to O
ther
Gov
ernm
ents
45.2
56.1
70.2
65.2
74.4
76.4
83.9
49.7
%85
.5%
8.4%
6.4%
Use
and
Sal
e of
Pro
pert
y42
.467
.749
.037
.236
.345
.165
.9-2
.7%
55.4
%-0
.6%
4.5%
Oth
er L
ocal
Rev
enue
s38
.056
.169
.669
.675
.480
.578
.940
.7%
107.
7%7.
1%7.
6%
Tota
l Loc
al R
even
ues
$1,3
06.6
$1,5
71.4
$1,6
18.6
$1,6
75.6
$1,7
94.2
$1,9
19.4
$2,0
59.2
31.0
%57
.6%
5.6%
4.7%
Sta
te A
id66
.394
.811
7.4
110.
513
8.8
146.
814
1.2
48.9
%11
3.0%
8.3%
7.9%
Fede
ral A
id57
.069
.474
.273
.979
.869
.782
.619
.0%
44.9
%3.
5%3.
8%
Tota
l Sta
te a
nd F
eder
al R
even
ues
$123
.3$1
64.2
$191
.6$1
84.4
$218
.6$2
16.5
$223
.736
.2%
81.5
%6.
4%6.
1%
Tota
l Rev
enue
s(L
ocal
, Sta
te a
nd F
eder
al S
ourc
es)
$1,4
29.9
$1,7
35.6
$1,8
10.2
$1,8
60.0
$2,0
12.8
$2,1
35.8
$2,2
83.0
31.5
%59
.7%
5.6%
4.8%
Exp
endi
ture
s:
Cur
rent
Ope
ratio
ns:
Per
sona
l Ser
vice
s49
4.9
603.
263
2.4
657.
268
2.3
706.
372
8.0
20.7
%47
.1%
3.8%
3.9%
Em
ploy
ee B
enefi
ts16
5.4
182.
119
8.4
218.
427
1.3
325.
634
0.7
87.0
%10
5.9%
13.3
%7.
5%
Con
trac
tual
529.
162
1.6
631.
468
5.3
720.
975
5.6
801.
528
.9%
51.5
%5.
2%4.
2%
Tota
l Cur
rent
Ope
ratio
ns$1
,189
.4$1
,407
.0$1
,462
.2$1
,561
.0$1
,674
.5$1
,787
.4$1
,870
.132
.9%
57.2
%5.
9%4.
6%
Equ
ipm
ent a
nd C
apita
l Out
lay
213.
631
6.1
381.
433
1.6
359.
437
6.6
424.
834
.4%
98.8
%6.
1%7.
1%
Deb
t Ser
vice
125.
915
8.1
168.
316
8.6
174.
518
1.5
193.
422
.3%
53.7
%4.
1%4.
4%
Prin
cipa
l78
.010
5.5
112.
411
4.7
121.
412
4.8
132.
425
.5%
69.6
%4.
7%5.
4%
Inte
rest
47.8
52.7
56.0
53.8
53.1
56.8
61.0
15.9
%27
.6%
3.0%
2.5%
Tota
l Exp
endi
ture
s (C
urre
nt O
pera
tions
+ E
quip
men
t and
C
apit
al O
utla
y +
Deb
t Ser
vice
)$1
,528
.9$1
,881
.2$2
,012
.0$2
,061
.2$2
,208
.4$2
,345
.6$2
,488
.332
.3%
62.8
%5.
8%5.
0%
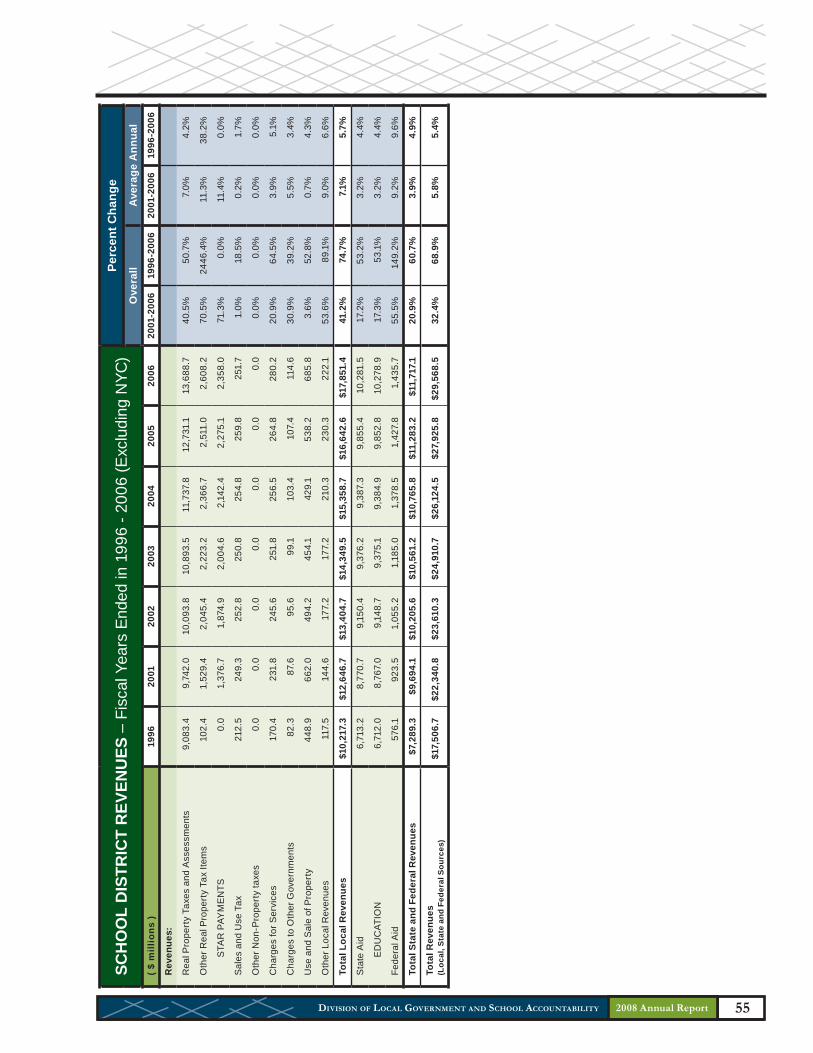
55 DIVISION OF LOCAL GOVERNMENT AND SCHOOL ACCOUNTABILITY
SCH
OO
L D
ISTR
ICT
REV
ENU
ES –
Fis
cal Y
ears
End
ed in
199
6 - 2
006
(Exc
ludi
ng N
YC)
Perc
ent C
hang
eO
vera
llA
vera
ge A
nnua
l( $
mill
ions
)19
9620
0120
0220
0320
0420
0520
0620
01-2
006
1996
-200
620
01-2
006
1996
-200
6
Rev
enue
s:
Rea
l Pro
pert
y Ta
xes
and
Ass
essm
ents
9,08
3.4
9,74
2.0
10,0
93.8
10,8
93.5
11,7
37.8
12,7
31.1
13,6
88.7
40.5
%50
.7%
7.0%
4.2%
Oth
er R
eal P
rope
rty
Tax
Item
s10
2.4
1,52
9.4
2,04
5.4
2,22
3.2
2,36
6.7
2,51
1.0
2,60
8.2
70.5
%24
46.4
%11
.3%
38.2
%
STA
R P
AYM
EN
TS0.
01,
376.
71,
874.
92,
004.
62,
142.
42,
275.
12,
358.
071
.3%
0.0%
11.4
%0.
0%
Sal
es a
nd U
se T
ax21
2.5
249.
325
2.8
250.
825
4.8
259.
825
1.7
1.0%
18.5
%0.
2%1.
7%
Oth
er N
on-P
rope
rty
taxe
s0.
00.
00.
00.
00.
00.
00.
00.
0%0.
0%0.
0%0.
0%
Cha
rges
for S
ervi
ces
170.
423
1.8
245.
625
1.8
256.
526
4.8
280.
220
.9%
64.5
%3.
9%5.
1%
Cha
rges
to O
ther
Gov
ernm
ents
82.3
87.6
95.6
99.1
103.
410
7.4
114.
630
.9%
39.2
%5.
5%3.
4%
Use
and
Sal
e of
Pro
pert
y44
8.9
662.
049
4.2
454.
142
9.1
538.
268
5.8
3.6%
52.8
%0.
7%4.
3%
Oth
er L
ocal
Rev
enue
s11
7.5
144.
617
7.2
177.
221
0.3
230.
322
2.1
53.6
%89
.1%
9.0%
6.6%
Tota
l Loc
al R
even
ues
$10,
217.
3$1
2,64
6.7
$13,
404.
7$1
4,34
9.5
$15,
358.
7$1
6,64
2.6
$17,
851.
441
.2%
74.7
%7.
1%5.
7%
Sta
te A
id6,
713.
28,
770.
79,
150.
49,
376.
29,
387.
39,
855.
410
,281
.517
.2%
53.2
%3.
2%4.
4%
ED
UC
ATIO
N6,
712.
08,
767.
09,
148.
79,
375.
19,
384.
99,
852.
810
,278
.917
.3%
53.1
%3.
2%4.
4%
Fede
ral A
id57
6.1
923.
51,
055.
21,
185.
01,
378.
51,
427.
81,
435.
755
.5%
149.
2%9.
2%9.
6%
Tota
l Sta
te a
nd F
eder
al R
even
ues
$7,2
89.3
$9,6
94.1
$10,
205.
6$1
0,56
1.2
$10,
765.
8$1
1,28
3.2
$11,
717.
120
.9%
60.7
%3.
9%4.
9%
Tota
l Rev
enue
s (L
ocal
, Sta
te a
nd F
eder
al S
ourc
es)
$17,
506.
7$2
2,34
0.8
$23,
610.
3$2
4,91
0.7
$26,
124.
5$2
7,92
5.8
$29,
568.
532
.4%
68.9
%5.
8%5.
4%
2008 Annual Report

2008 Annual Report OFFICE OF THE STATE COMPTROLLER56
SCH
OO
L D
ISTR
ICT
EXPE
ND
ITU
RES
– F
isca
l Yea
rs E
nded
in 1
996
- 200
6 (E
xclu
ding
NYC
)Pe
rcen
t Cha
nge
Ove
rall
Ave
rage
Ann
ual
( $ m
illio
ns )
1996
2001
2002
2003
2004
2005
2006
2001
-200
619
96-2
006
2001
-200
619
96-2
006
Exp
endi
ture
s:
Cur
rent
Ope
ratio
ns:
Per
sona
l Ser
vice
s9,
980.
212
,566
.213
,186
.513
,641
.414
,103
.214
,615
.415
,140
.820
.5%
51.7
%3.
8%4.
3%
Em
ploy
ee B
enefi
ts2,
765.
23,
003.
73,
306.
43,
697.
64,
265.
15,
058.
95,
610.
986
.8%
102.
9%13
.3%
7.3%
Con
tract
ual
3,66
5.7
5,06
2.7
5,25
4.3
5,54
0.8
5,81
9.4
6,18
6.4
6,51
1.9
28.6
%77
.7%
5.2%
5.9%
Tota
l Cur
rent
Ope
ratio
ns$1
6,41
1.1
$20,
632.
6$2
1,74
7.2
$22,
879.
8$2
4,18
7.7
$25,
860.
6$2
7,26
3.5
32.1
%66
.1%
5.7%
5.2%
Equ
ipm
ent a
nd C
apita
l Out
lay
1,04
6.0
2,54
3.8
2,91
7.5
3,05
6.9
2,62
5.0
2,22
4.7
2,03
9.0
-19.
8%94
.9%
-4.3
%6.
9%
Deb
t Ser
vice
851.
01,
388.
01,
488.
81,
351.
41,
424.
71,
612.
11,
722.
324
.1%
102.
4%4.
4%7.
3%
Prin
cipa
l55
1.2
848.
592
7.3
819.
884
4.2
954.
81,
018.
120
.0%
84.7
%3.
7%6.
3%
Inte
rest
299.
853
9.5
561.
553
1.6
580.
665
7.3
704.
230
.5%
134.
9%5.
5%8.
9%
Tota
l Exp
endi
ture
s (C
urre
nt O
pera
tions
+ E
quip
men
t and
C
apita
l Out
lay
+ D
ebt S
ervi
ce)
$18,
308.
1$2
4,56
4.4
$26,
153.
5$2
7,28
8.1
$28,
237.
4$2
9,69
7.4
$31,
024.
826
.3%
69.5
%4.
8%5.
4%
Exp
endi
ture
s by
Fun
ctio
n:
Gen
eral
Gov
ernm
ent
2,71
8.9
4,34
9.2
4,78
1.1
5,11
6.9
4,85
6.2
4,65
2.6
4,68
5.0
7.7%
72.3
%1.
5%5.
6%
OP
ER
ATIO
NS
2,21
0.9
3,73
6.8
4,12
0.8
4,41
8.2
4,13
7.3
3,88
9.8
3,88
4.2
3.9%
75.7
%0.
8%5.
8%
Edu
catio
n11
,891
.715
,736
.216
,486
.217
,027
.417
,590
.018
,267
.318
,898
.120
.1%
58.9
%3.
7%4.
7%
INS
TRU
CTI
ON
9,54
6.5
12,5
78.1
13,1
86.1
13,5
90.0
14,0
22.1
14,5
06.4
14,9
64.7
19.0
%56
.8%
3.5%
4.6%
Pub
lic S
afet
y0.
00.
00.
00.
00.
00.
00.
00.
0%0.
0%0.
0%0.
0%
Hea
lth0.
00.
00.
00.
00.
00.
00.
00.
0%0.
0%0.
0%0.
0%
Tran
spor
tatio
n33
.033
.435
.738
.943
.143
.145
.335
.9%
37.4
%6.
3%3.
2%
Soc
ial S
ervi
ces
6.8
7.4
7.8
7.7
7.4
7.1
7.1
-4.6
%5.
1%-0
.9%
0.5%
San
itatio
n0.
00.
00.
00.
00.
00.
00.
00.
0%0.
0%0.
0%0.
0%
Eco
nom
ic D
evel
opm
ent
0.0
0.0
0.0
0.0
0.0
0.0
0.0
0.0%
0.0%
0.0%
0.0%
Cul
ture
-Rec
reat
ion
30.0
32.7
32.4
33.6
37.4
41.6
43.7
33.6
%45
.8%
6.0%
3.8%
Com
mun
ity S
ervi
ces
11.6
13.8
15.1
14.6
13.4
14.9
12.3
-10.
7%6.
9%-2
.2%
0.7%
Util
ities
0.0
0.0
0.0
0.0
0.0
0.0
0.0
0.0%
0.0%
0.0%
0.0%
Em
ploy
ee B
enefi
ts2,
765.
23,
003.
73,
306.
43,
697.
64,
265.
15,
058.
95,
610.
986
.8%
102.
9%13
.3%
7.3%
Tota
l Exp
endi
ture
s by
Fun
ctio
n (1
)$1
7,45
7.1
$23,
176.
4$2
4,66
4.7
$25,
936.
6$2
6,81
2.7
$28,
085.
4$2
9,30
2.5
26.4
%67
.9%
4.8%
5.3%
(1) e
xclu
des
debt
ser
vice
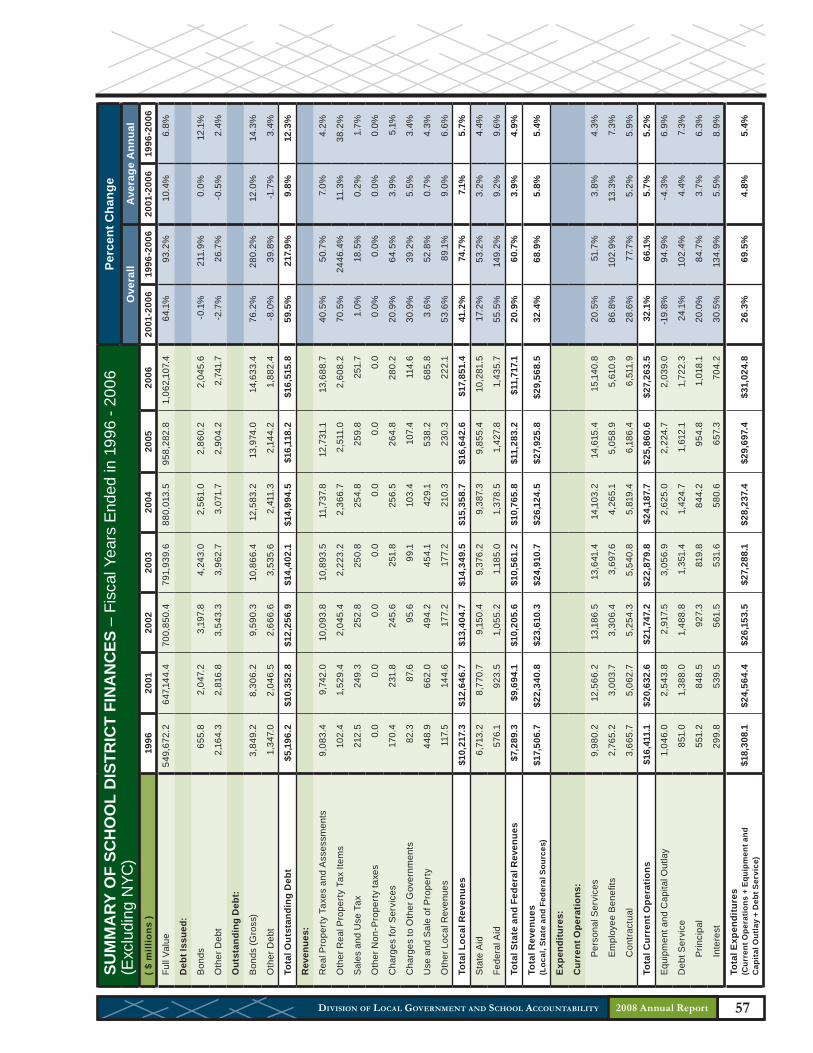
57 DIVISION OF LOCAL GOVERNMENT AND SCHOOL ACCOUNTABILITY
SUM
MA
RY
OF
SCH
OO
L D
ISTR
ICT
FIN
AN
CES
– F
isca
l Yea
rs E
nded
in 1
996
- 200
6(E
xclu
ding
NYC
)Pe
rcen
t Cha
nge
Ove
rall
Ave
rage
Ann
ual
( $ m
illio
ns )
1996
2001
2002
2003
2004
2005
2006
2001
-200
619
96-2
006
2001
-200
619
96-2
006
Full
Valu
e54
9,67
2.2
647,
144.
470
0,85
0.4
791,
939.
688
0,01
3.5
958,
282.
81,
062,
107.
464
.1%
93.2
%10
.4%
6.8%
Deb
t Iss
ued:
Bon
ds65
5.8
2,04
7.2
3,19
7.8
4,24
3.0
2,56
1.0
2,86
0.2
2,04
5.6
-0.1
%21
1.9%
0.0%
12.1
%
Oth
er D
ebt
2,16
4.3
2,81
6.8
3,54
3.3
3,96
2.7
3,07
1.7
2,90
4.2
2,74
1.7
-2.7
%26
.7%
-0.5
%2.
4%
Out
stan
ding
Deb
t:
Bon
ds (G
ross
)3,
849.
28,
306.
29,
590.
310
,866
.412
,583
.213
,974
.014
,633
.476
.2%
280.
2%12
.0%
14.3
%
Oth
er D
ebt
1,34
7.0
2,04
6.5
2,66
6.6
3,53
5.6
2,41
1.3
2,14
4.2
1,88
2.4
-8.0
%39
.8%
-1.7
%3.
4%
Tota
l Out
stan
ding
Deb
t$5
,196
.2$1
0,35
2.8
$12,
256.
9$1
4,40
2.1
$14,
994.
5$1
6,11
8.2
$16,
515.
859
.5%
217.
9%9.
8%12
.3%
Rev
enue
s:
Rea
l Pro
pert
y Ta
xes
and
Ass
essm
ents
9,08
3.4
9,74
2.0
10,0
93.8
10,8
93.5
11,7
37.8
12,7
31.1
13,6
88.7
40.5
%50
.7%
7.0%
4.2%
Oth
er R
eal P
rope
rty
Tax
Item
s10
2.4
1,52
9.4
2,04
5.4
2,22
3.2
2,36
6.7
2,51
1.0
2,60
8.2
70.5
%24
46.4
%11
.3%
38.2
%
Sal
es a
nd U
se T
ax21
2.5
249.
325
2.8
250.
825
4.8
259.
825
1.7
1.0%
18.5
%0.
2%1.
7%
Oth
er N
on-P
rope
rty
taxe
s0.
00.
00.
00.
00.
00.
00.
00.
0%0.
0%0.
0%0.
0%
Cha
rges
for S
ervi
ces
170.
423
1.8
245.
625
1.8
256.
526
4.8
280.
220
.9%
64.5
%3.
9%5.
1%
Cha
rges
to O
ther
Gov
ernm
ents
82.3
87.6
95.6
99.1
103.
410
7.4
114.
630
.9%
39.2
%5.
5%3.
4%
Use
and
Sal
e of
Pro
pert
y44
8.9
662.
049
4.2
454.
142
9.1
538.
268
5.8
3.6%
52.8
%0.
7%4.
3%
Oth
er L
ocal
Rev
enue
s11
7.5
144.
617
7.2
177.
221
0.3
230.
322
2.1
53.6
%89
.1%
9.0%
6.6%
Tota
l Loc
al R
even
ues
$10,
217.
3$1
2,64
6.7
$13,
404.
7$1
4,34
9.5
$15,
358.
7$1
6,64
2.6
$17,
851.
441
.2%
74.7
%7.
1%5.
7%
Sta
te A
id6,
713.
28,
770.
79,
150.
49,
376.
29,
387.
39,
855.
410
,281
.517
.2%
53.2
%3.
2%4.
4%
Fede
ral A
id57
6.1
923.
51,
055.
21,
185.
01,
378.
51,
427.
81,
435.
755
.5%
149.
2%9.
2%9.
6%
Tota
l Sta
te a
nd F
eder
al R
even
ues
$7,2
89.3
$9,6
94.1
$10,
205.
6$1
0,56
1.2
$10,
765.
8$1
1,28
3.2
$11,
717.
120
.9%
60.7
%3.
9%4.
9%
Tota
l Rev
enue
s (L
ocal
, Sta
te a
nd F
eder
al S
ourc
es)
$17,
506.
7$2
2,34
0.8
$23,
610.
3$2
4,91
0.7
$26,
124.
5$2
7,92
5.8
$29,
568.
532
.4%
68.9
%5.
8%5.
4%
Exp
endi
ture
s:
Cur
rent
Ope
ratio
ns:
Per
sona
l Ser
vice
s9,
980.
212
,566
.213
,186
.513
,641
.414
,103
.214
,615
.415
,140
.820
.5%
51.7
%3.
8%4.
3%
Em
ploy
ee B
enefi
ts2,
765.
23,
003.
73,
306.
43,
697.
64,
265.
15,
058.
95,
610.
986
.8%
102.
9%13
.3%
7.3%
Con
tract
ual
3,66
5.7
5,06
2.7
5,25
4.3
5,54
0.8
5,81
9.4
6,18
6.4
6,51
1.9
28.6
%77
.7%
5.2%
5.9%
Tota
l Cur
rent
Ope
ratio
ns$1
6,41
1.1
$20,
632.
6$2
1,74
7.2
$22,
879.
8$2
4,18
7.7
$25,
860.
6$2
7,26
3.5
32.1
%66
.1%
5.7%
5.2%
Equ
ipm
ent a
nd C
apita
l Out
lay
1,04
6.0
2,54
3.8
2,91
7.5
3,05
6.9
2,62
5.0
2,22
4.7
2,03
9.0
-19.
8%94
.9%
-4.3
%6.
9%
Deb
t Ser
vice
851.
01,
388.
01,
488.
81,
351.
41,
424.
71,
612.
11,
722.
324
.1%
102.
4%4.
4%7.
3%
Prin
cipa
l55
1.2
848.
592
7.3
819.
884
4.2
954.
81,
018.
120
.0%
84.7
%3.
7%6.
3%
Inte
rest
299.
853
9.5
561.
553
1.6
580.
665
7.3
704.
230
.5%
134.
9%5.
5%8.
9%
Tota
l Exp
endi
ture
s (C
urre
nt O
pera
tions
+ E
quip
men
t and
C
apita
l Out
lay
+ D
ebt S
ervi
ce)
$18,
308.
1$2
4,56
4.4
$26,
153.
5$2
7,28
8.1
$28,
237.
4$2
9,69
7.4
$31,
024.
826
.3%
69.5
%4.
8%5.
4%
2008 Annual Report

2008 Annual Report OFFICE OF THE STATE COMPTROLLER58
FIR
E D
ISTR
ICT
REV
ENU
ES –
Fis
cal Y
ears
End
ed in
199
6 - 2
006
Perc
ent C
hang
eO
vera
llA
vera
ge A
nnua
l( $
mill
ions
)19
9620
0120
0220
0320
0420
0520
0620
01-2
006
1996
-200
620
01-2
006
1996
-200
6
Rev
enue
s:
Rea
l Pro
pert
y Ta
xes
and
Ass
essm
ents
316.
437
7.4
400.
843
3.6
465.
950
3.7
548.
745
.4%
73.4
%7.
8%5.
7%
Oth
er R
eal P
rope
rty
Tax
Item
s0.
81.
11.
11.
21.
21.
52.
081
.3%
135.
5%12
.6%
8.9%
Sal
es a
nd U
se T
ax0.
00.
00.
00.
00.
00.
00.
00.
0%0.
0%0.
0%0.
0%
Oth
er N
on-P
rope
rty
taxe
s0.
00.
00.
00.
00.
00.
00.
00.
0%0.
0%0.
0%0.
0%
Cha
rges
for S
ervi
ces
0.0
0.0
0.0
0.0
0.0
0.0
0.0
-100
.0%
0.0%
-100
.0%
0.0%
Cha
rges
to O
ther
Gov
ernm
ents
8.1
9.6
9.5
9.6
10.2
11.0
12.7
32.5
%55
.3%
5.8%
4.5%
Use
and
Sal
e of
Pro
pert
y16
.419
.411
.710
.410
.818
.926
.235
.1%
60.2
%6.
2%4.
8%
Oth
er L
ocal
Rev
enue
s6.
87.
712
.014
.110
.913
.718
.413
7.7%
169.
2%18
.9%
10.4
%
Tota
l Loc
al R
even
ues
$348
.6$4
15.1
$435
.1$4
68.9
$499
.1$5
48.8
$608
.046
.4%
74.4
%7.
9%5.
7%
Sta
te A
id0.
00.
60.
40.
80.
91.
21.
210
9.5%
—15
.9%
133.
8%
Fede
ral A
id0.
10.
10.
21.
64.
23.
53.
131
87.7
%27
40.7
%10
1.1%
39.8
%
Tota
l Sta
te a
nd F
eder
al R
even
ues
$0.1
$0.7
$0.7
$2.4
$5.2
$4.8
$4.3
540.
6%38
42.9
%45
.0%
44.4
%
Tota
l Rev
enue
s (L
ocal
, Sta
te a
nd F
eder
al S
ourc
es)
$348
.7$4
15.8
$435
.7$4
71.2
$504
.2$5
53.5
$612
.347
.3%
75.6
%8.
1%5.
8%
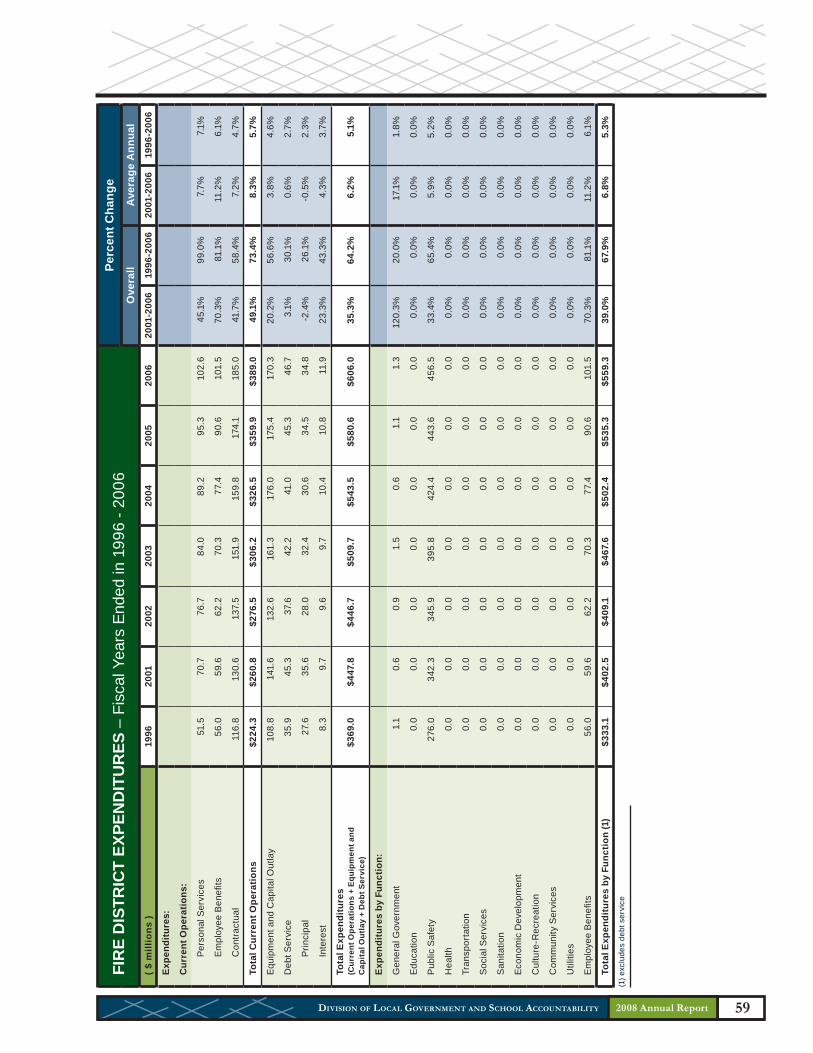
59 DIVISION OF LOCAL GOVERNMENT AND SCHOOL ACCOUNTABILITY
FIR
E D
ISTR
ICT
EXPE
ND
ITU
RES
– F
isca
l Yea
rs E
nded
in 1
996
- 200
6Pe
rcen
t Cha
nge
Ove
rall
Ave
rage
Ann
ual
( $ m
illio
ns )
1996
2001
2002
2003
2004
2005
2006
2001
-200
619
96-2
006
2001
-200
619
96-2
006
Exp
endi
ture
s:
Cur
rent
Ope
ratio
ns:
Per
sona
l Ser
vice
s51
.570
.776
.784
.089
.295
.310
2.6
45.1
%99
.0%
7.7%
7.1%
Em
ploy
ee B
enefi
ts56
.059
.662
.270
.377
.490
.610
1.5
70.3
%81
.1%
11.2
%6.
1%
Con
tract
ual
116.
813
0.6
137.
515
1.9
159.
817
4.1
185.
041
.7%
58.4
%7.
2%4.
7%
Tota
l Cur
rent
Ope
ratio
ns$2
24.3
$260
.8$2
76.5
$306
.2$3
26.5
$359
.9$3
89.0
49.1
%73
.4%
8.3%
5.7%
Equ
ipm
ent a
nd C
apita
l Out
lay
108.
814
1.6
132.
616
1.3
176.
017
5.4
170.
320
.2%
56.6
%3.
8%4.
6%
Deb
t Ser
vice
35.9
45.3
37.6
42.2
41.0
45.3
46.7
3.1%
30.1
%0.
6%2.
7%
Prin
cipa
l27
.635
.628
.032
.430
.634
.534
.8-2
.4%
26.1
%-0
.5%
2.3%
Inte
rest
8.3
9.7
9.6
9.7
10.4
10.8
11.9
23.3
%43
.3%
4.3%
3.7%
Tota
l Exp
endi
ture
s (C
urre
nt O
pera
tions
+ E
quip
men
t and
C
apita
l Out
lay
+ D
ebt S
ervi
ce)
$369
.0$4
47.8
$446
.7$5
09.7
$543
.5$5
80.6
$606
.035
.3%
64.2
%6.
2%5.
1%
Exp
endi
ture
s by
Fun
ctio
n:
Gen
eral
Gov
ernm
ent
1.1
0.6
0.9
1.5
0.6
1.1
1.3
120.
3%20
.0%
17.1
%1.
8%
Edu
catio
n0.
00.
00.
00.
00.
00.
00.
00.
0%0.
0%0.
0%0.
0%
Pub
lic S
afet
y27
6.0
342.
334
5.9
395.
842
4.4
443.
645
6.5
33.4
%65
.4%
5.9%
5.2%
Hea
lth0.
00.
00.
00.
00.
00.
00.
00.
0%0.
0%0.
0%0.
0%
Tran
spor
tatio
n0.
00.
00.
00.
00.
00.
00.
00.
0%0.
0%0.
0%0.
0%
Soc
ial S
ervi
ces
0.0
0.0
0.0
0.0
0.0
0.0
0.0
0.0%
0.0%
0.0%
0.0%
San
itatio
n0.
00.
00.
00.
00.
00.
00.
00.
0%0.
0%0.
0%0.
0%
Eco
nom
ic D
evel
opm
ent
0.0
0.0
0.0
0.0
0.0
0.0
0.0
0.0%
0.0%
0.0%
0.0%
Cul
ture
-Rec
reat
ion
0.0
0.0
0.0
0.0
0.0
0.0
0.0
0.0%
0.0%
0.0%
0.0%
Com
mun
ity S
ervi
ces
0.0
0.0
0.0
0.0
0.0
0.0
0.0
0.0%
0.0%
0.0%
0.0%
Util
ities
0.0
0.0
0.0
0.0
0.0
0.0
0.0
0.0%
0.0%
0.0%
0.0%
Em
ploy
ee B
enefi
ts56
.059
.662
.270
.377
.490
.610
1.5
70.3
%81
.1%
11.2
%6.
1%
Tota
l Exp
endi
ture
s by
Fun
ctio
n (1
)$3
33.1
$402
.5$4
09.1
$467
.6$5
02.4
$535
.3$5
59.3
39.0
%67
.9%
6.8%
5.3%
(1) e
xclu
des
debt
ser
vice
2008 Annual Report

2008 Annual Report OFFICE OF THE STATE COMPTROLLER60
SUM
MA
RY
OF
FIR
E D
ISTR
ICT
FIN
AN
CES
– F
isca
l Yea
rs E
nded
in 1
996
- 200
6Pe
rcen
t Cha
nge
Ove
rall
Ave
rage
Ann
ual
( $ m
illio
ns )
1996
2001
2002
2003
2004
2005
2006
2001
-200
619
96-2
006
2001
-200
619
96-2
006
Deb
t Iss
ued:
Bon
ds9.
534
.028
.527
.536
.732
.829
.2-1
4.2%
206.
2%-3
.0%
11.8
%
Oth
er D
ebt
21.0
20.3
16.6
21.2
22.8
17.9
34.0
66.9
%61
.5%
10.8
%4.
9%
Out
stan
ding
Deb
t:
Bon
ds (G
ross
)11
1.0
155.
116
9.3
176.
421
4.6
228.
423
2.6
50.0
%10
9.6%
8.4%
7.7%
Oth
er D
ebt
25.9
30.8
35.7
44.4
33.1
31.3
42.4
37.7
%63
.3%
6.6%
5.0%
Tota
l Out
stan
ding
Deb
t$1
36.9
$185
.9$2
05.0
$220
.9$2
47.7
$259
.8$2
75.0
47.9
%10
0.8%
8.2%
7.2%
Rev
enue
s:
Rea
l Pro
pert
y Ta
xes
and
Ass
essm
ents
316.
437
7.4
400.
843
3.6
465.
950
3.7
548.
745
.4%
73.4
%7.
8%5.
7%
Oth
er R
eal P
rope
rty
Tax
Item
s0.
81.
11.
11.
21.
21.
52.
081
.3%
135.
5%12
.6%
8.9%
Sal
es a
nd U
se T
ax0.
00.
00.
00.
00.
00.
00.
00.
0%0.
0%0.
0%0.
0%
Oth
er N
on-P
rope
rty
taxe
s0.
00.
00.
00.
00.
00.
00.
00.
0%0.
0%0.
0%0.
0%
Cha
rges
for S
ervi
ces
0.0
0.0
0.0
0.0
0.0
0.0
0.0
-100
.0%
0.0%
-100
.0%
0.0%
Cha
rges
to O
ther
Gov
ernm
ents
8.1
9.6
9.5
9.6
10.2
11.0
12.7
32.5
%55
.3%
5.8%
4.5%
Use
and
Sal
e of
Pro
pert
y16
.419
.411
.710
.410
.818
.926
.235
.1%
60.2
%6.
2%4.
8%
Oth
er L
ocal
Rev
enue
s6.
87.
712
.014
.110
.913
.718
.413
7.7%
169.
2%18
.9%
10.4
%
Tota
l Loc
al R
even
ues
$348
.6$4
15.1
$435
.1$4
68.9
$499
.1$5
48.8
$608
.046
.4%
74.4
%7.
9%5.
7%
Sta
te A
id0.
00.
60.
40.
80.
91.
21.
210
9.5%
—15
.9%
133.
8%
Fede
ral A
id0.
10.
10.
21.
64.
23.
53.
131
87.7
%27
40.7
%10
1.1%
39.8
%
Tota
l Sta
te a
nd F
eder
al R
even
ues
$0.1
$0.7
$0.7
$2.4
$5.2
$4.8
$4.3
540.
6%38
42.9
%45
.0%
44.4
%
Tota
l Rev
enue
s (L
ocal
, Sta
te a
nd F
eder
al S
ourc
es)
$348
.7$4
15.8
$435
.7$4
71.2
$504
.2$5
53.5
$612
.347
.3%
75.6
%8.
1%5.
8%
Exp
endi
ture
s:
Cur
rent
Ope
ratio
ns:
Per
sona
l Ser
vice
s51
.570
.776
.784
.089
.295
.310
2.6
45.1
%99
.0%
7.7%
7.1%
Em
ploy
ee B
enefi
ts56
.059
.662
.270
.377
.490
.610
1.5
70.3
%81
.1%
11.2
%6.
1%
Con
tract
ual
116.
813
0.6
137.
515
1.9
159.
817
4.1
185.
041
.7%
58.4
%7.
2%4.
7%
Tota
l Cur
rent
Ope
ratio
ns$2
24.3
$260
.8$2
76.5
$306
.2$3
26.5
$359
.9$3
89.0
49.1
%73
.4%
8.3%
5.7%
Equ
ipm
ent a
nd C
apita
l Out
lay
108.
814
1.6
132.
616
1.3
176.
017
5.4
170.
320
.2%
56.6
%3.
8%4.
6%
Deb
t Ser
vice
35.9
45.3
37.6
42.2
41.0
45.3
46.7
3.1%
30.1
%0.
6%2.
7%
Prin
cipa
l27
.635
.628
.032
.430
.634
.534
.8-2
.4%
26.1
%-0
.5%
2.3%
Inte
rest
8.3
9.7
9.6
9.7
10.4
10.8
11.9
23.3
%43
.3%
4.3%
3.7%
Tota
l Exp
endi
ture
s (C
urre
nt O
pera
tions
+ E
quip
men
t and
C
apita
l Out
lay
+ D
ebt S
ervi
ce)
$369
.0$4
47.8
$446
.7$5
09.7
$543
.5$5
80.6
$606
.035
.3%
64.2
%6.
2%5.
1%

61 DIVISION OF LOCAL GOVERNMENT AND SCHOOL ACCOUNTABILITY
SU
MM
AR
Y O
F FI
NA
NC
ES
FO
R M
AJO
R C
LAS
SE
S O
F LO
CA
L G
OV
ER
NM
EN
T –
Fis
cal Y
ear E
nded
in 2
006
(Cou
ntie
s, C
itie
s, T
owns
, Vill
ages
, Fir
e D
istr
icts
, Sch
ools
(Exc
ludi
ng N
YC))
( $
mill
ions
)C
ount
yC
ity
Tow
nV
illag
eS
choo
lFi
re D
istr
ict
Tota
l
Pop
ulat
ion
- Cen
sus
Est
imat
es11
,031
,421
2,21
0,68
08,
810,
981
1,87
5,02
5
Full
Val
ue1,
045,
294.
610
6,03
2.0
942,
192.
120
6,07
0.2
1,06
2,10
7.4
Deb
t Iss
ued:
Bon
ds1,
201.
554
7.5
508.
020
2.8
2,04
5.6
29.2
$4,5
34.5
Oth
er D
ebt
1,08
8.6
384.
031
4.9
152.
82,
741.
734
.0$4
,716
.0
Out
stan
ding
Deb
t:
Bon
ds (G
ross
)8,
215.
32,
459.
03,
730.
21,
474.
914
,633
.423
2.6
$30,
745.
4
Oth
er D
ebt
1,22
7.9
568.
073
7.7
307.
71,
882.
442
.4$4
,766
.1
Tota
l Out
stan
ding
Deb
t$9
,443
.1$3
,027
.0$4
,468
.0$1
,782
.5$1
6,51
5.8
$275
.0$3
5,51
1.5
Rev
enue
s:
Rea
l Pro
pert
y Ta
xes
and
Ass
essm
ents
4,31
4.0
903.
32,
973.
299
7.5
13,6
88.7
548.
7$2
3,42
5.4
Oth
er R
eal P
rope
rty
Tax
Item
s26
3.4
114.
664
.229
.32,
608.
22.
0$3
,081
.7
Sal
es a
nd U
se T
ax5,
551.
974
0.1
550.
615
3.9
251.
70.
0$7
,248
.3
Oth
er N
on-P
rope
rty
taxe
s85
.160
.012
1.4
17.2
0.0
0.0
$283
.8
Cha
rges
for S
ervi
ces
2,25
5.9
745.
289
3.8
632.
628
0.2
0.0
$4,8
07.8
Cha
rges
to O
ther
Gov
ernm
ents
404.
066
.316
7.7
83.9
114.
612
.7$8
49.2
Use
and
Sal
e of
Pro
pert
y35
5.8
116.
823
0.0
65.9
685.
826
.2$1
,480
.5
Oth
er L
ocal
Rev
enue
s33
2.2
116.
316
3.5
78.9
222.
118
.4$9
31.4
Tota
l Loc
al R
even
ues
$13,
562.
4$2
,862
.6$5
,164
.5$2
,059
.2$1
7,85
1.4
$608
.0$4
2,10
8.0
Sta
te A
id2,
706.
270
9.1
664.
014
1.2
10,2
81.5
1.2
$14,
503.
2
Fede
ral A
id2,
071.
025
2.9
197.
982
.61,
435.
73.
1$4
,043
.1
Tota
l Sta
te a
nd F
eder
al R
even
ues
$4,7
77.2
$962
.0$8
61.9
$223
.7$1
1,71
7.1
$4.3
$18,
546.
4
Tota
l Rev
enue
s (L
ocal
, Sta
te a
nd F
eder
al S
ourc
es)
$18,
339.
5$3
,824
.6$6
,026
.4$2
,283
.0$2
9,56
8.5
$612
.3$6
0,65
4.4
Exp
endi
ture
s:
Cur
rent
Ope
rati
ons:
Per
sona
l Ser
vice
s4,
806.
41,
487.
51,
882.
372
8.0
15,1
40.8
102.
6$2
4,14
7.5
Em
ploy
ee B
enefi
ts2,
521.
978
2.4
856.
534
0.7
5,61
0.9
101.
5$1
0,21
3.8
Con
trac
tual
10,1
65.4
918.
42,
203.
680
1.5
6,51
1.9
185.
0$2
0,78
5.7
Tota
l Cur
rent
Ope
rati
ons
$17,
493.
7$3
,188
.2$4
,942
.5$1
,870
.1$2
7,26
3.5
$389
.0$5
5,14
7.0
Equ
ipm
ent a
nd C
apita
l Out
lay
1,35
3.8
553.
41,
047.
542
4.8
2,03
9.0
170.
3$5
,588
.8
Deb
t Ser
vice
1,05
3.3
327.
054
9.1
193.
41,
722.
346
.7$3
,891
.9
Prin
cipa
l64
2.4
197.
938
6.0
132.
41,
018.
134
.8$2
,411
.5
Inte
rest
411.
012
9.1
163.
261
.070
4.2
11.9
$1,4
80.4
Tota
l Exp
endi
ture
s (C
urre
nt O
pera
tion
s +
Equ
ipm
ent a
nd
Cap
ital
Out
lay
+ D
ebt S
ervi
ce)
$19,
900.
8$4
,068
.6$6
,539
.1$2
,488
.3$3
1,02
4.8
$606
.0$6
4,62
7.6
2008 Annual Report

2008 Annual Report OFFICE OF THE STATE COMPTROLLER62
THE
CIT
Y O
F N
EW Y
OR
K –
Tot
al G
over
nmen
tal F
unds
( $ m
illio
ns )
1998
1999
2000
2001
2002
2003
2004
2005
2006
2007
Exp
endi
ture
s
Cur
rent
Ope
ratio
ns
Per
sona
l Ser
vice
s$1
2,97
8.3
$13,
672.
2$1
4,79
0.0
$16,
126.
9$1
7,05
5.0
$17,
196.
2$1
7,10
5.4
$18,
440.
6$1
8,72
6.3
$19,
705.
9
Frin
ge B
enefi
ts$4
,663
.7$4
,863
.0$4
,393
.9$5
,055
.7$5
,700
.5$6
,411
.8$7
,304
.9$8
,444
.5$1
0,41
0.0
$12,
056.
0
Oth
er T
han
Per
sona
l Ser
vice
s$1
5,58
6.2
$16,
107.
6$1
6,87
8.1
$16,
953.
1$1
7,09
8.2
$17,
957.
5$1
9,54
4.2
$22,
357.
6$2
1,63
1.8
$23,
026.
2
Tota
l Cur
rent
Ope
ratio
ns$3
3,22
8.1
$34,
642.
8$3
6,06
2.0
$38,
135.
6$3
9,85
3.8
$41,
565.
5$4
3,95
4.5
$49,
242.
7$5
0,76
8.0
$54,
788.
1
Cap
ital O
utla
ys$2
,661
.2$2
,618
.0$2
,898
.7$4
,609
.8$6
,115
.5$5
,658
.4$4
,701
.5$5
,477
.3$5
,541
.3$6
,162
.7
Tota
l Deb
t Ser
vice
$3,0
19.2
$3,0
34.0
$3,3
73.3
$3,7
36.8
$3,7
56.7
$3,9
06.4
$4,1
56.5
$4,0
99.8
$4,9
29.9
$5,6
40.6
Prin
cipa
l$1
,295
.4$1
,274
.2$1
,498
.5$1
,709
.4$1
,797
.3$1
,901
.9$2
,047
.6$2
,016
.3$2
,551
.1$3
,214
.0
Inte
rest
$1,7
23.8
$1,7
59.8
$1,8
74.8
$2,0
27.4
$1,9
59.4
$2,0
04.5
$2,1
08.9
$2,0
83.5
$2,3
78.8
$2,4
26.6
Tota
l Exp
endi
ture
s (G
over
nmen
tal F
unds
)$3
8,90
8.6
$40,
294.
9$4
2,33
4.0
$46,
482.
2$4
9,72
6.0
$51,
130.
3$5
2,81
2.5
$58,
819.
8$6
1,23
9.3
$66,
591.
3
Exp
endi
ture
s by
Fun
ctio
n
Gen
eral
gov
ernm
ent
$884
.8$9
25.9
$1,4
43.0
$1,6
75.0
$2,3
99.9
$1,8
81.2
$1,9
74.4
$3,1
05.2
$2,1
98.4
$2,6
83.3
Pub
lic s
afet
y an
d ju
dici
al$4
,945
.5$5
,317
.5$6
,171
.5$6
,111
.2$7
,290
.8$6
,493
.9$6
,366
.7$7
,502
.8$6
,906
.0$7
,048
.4
Edu
catio
n (1
)$8
,812
.5$9
,478
.4$1
1,78
9.6
$13,
248.
4$1
3,48
0.9
$14,
024.
7$1
4,24
8.5
$14,
747.
2$1
6,57
6.1
$17,
881.
2
City
Uni
vers
ity (1
)$3
64.0
$376
.9$3
98.2
$402
.0$4
28.5
$456
.4$5
08.9
$581
.7$5
64.1
$595
.6
Soc
ial s
ervi
ces
$7,7
85.7
$7,8
91.6
$8,4
68.2
$8,8
79.0
$9,2
03.9
$9,4
01.9
$9,7
62.1
$10,
386.
3$1
0,18
7.0
$11,
150.
7
Env
ironm
enta
l pro
tect
ion
$1,2
66.5
$1,2
41.2
$2,3
13.2
$2,5
36.5
$2,8
24.5
$3,0
53.7
$3,4
42.4
$3,5
44.8
$3,7
71.7
$4,0
23.3
Tran
spor
tatio
n se
rvic
es$7
58.8
$683
.0$1
,669
.9$1
,605
.4$1
,593
.5$2
,201
.4$1
,801
.7$1
,902
.7$1
,737
.1$1
,848
.6
Par
ks, r
ecre
atio
n an
d cu
ltura
l act
iviti
es$2
59.6
$264
.8$5
50.6
$573
.1$6
74.6
$654
.0$6
45.1
$660
.3$7
59.7
$904
.7
Hou
sing
$443
.6$4
29.9
$722
.8$8
91.5
$820
.7$7
38.4
$808
.3$8
54.9
$1,1
80.9
$1,0
77.2
Hea
lth (i
nclu
ding
pay
men
ts to
Hea
lth a
nd
Hos
pita
ls C
orpo
ratio
n)$1
,552
.7$1
,651
.0$1
,852
.9$2
,019
.5$2
,242
.7$2
,356
.5$2
,506
.6$2
,808
.8$3
,027
.5$2
,518
.7
Libr
arie
s$2
02.1
$212
.2$2
53.5
$399
.6$1
58.5
$386
.9$2
85.3
$424
.0$3
13.5
$367
.9
Pen
sion
s$1
,408
.6$1
,342
.4$6
15.1
$1,1
27.1
$1,3
91.9
$1,6
30.6
$2,3
08.4
$3,2
33.8
$3,8
79.0
$4,7
26.2
Judg
men
ts a
nd c
laim
s$3
86.1
$424
.3$4
90.7
$594
.8$5
21.8
$626
.9$5
91.0
$590
.3$5
16.8
$564
.0
Frin
ge b
enefi
ts a
nd o
ther
ben
efi t
clai
ms
$1,8
11.1
$1,8
25.0
$2,0
65.2
$2,2
00.1
$2,4
26.1
$2,6
06.9
$2,7
55.0
$2,9
47.7
$4,1
54.0
$4,8
46.2
Adm
inis
trativ
e an
d ot
her
$377
.8$1
61.1
$(19
.3)
$337
.5$4
00.0
$517
.0$5
14.0
$1,2
25.0
$308
.9$4
05.0
Cap
ital P
roje
cts
$4,1
51.4
$4,8
40.5
$-$-
$-$-
$-$-
$-$-
Deb
t Ser
vice
$3,0
19.2
$3,0
34.0
$3,3
73.3
$3,7
36.8
$3,7
56.7
$3,9
06.4
$4,1
56.5
$4,0
99.8
$4,9
29.9
$5,6
40.6
Leas
e P
aym
ents
$176
.0$8
8.1
$158
.9$9
8.5
$107
.3$1
89.0
$134
.6$2
04.7
$228
.8$3
09.6
Ref
undi
ng E
scro
w$3
02.5
$107
.0$1
6.8
$46.
2$3
.8$4
.4$3
.1$-
$-$-
Tota
l Exp
endi
ture
s$3
8,90
8.6
$40,
294.
9$4
2,33
4.0
$46,
482.
2$4
9,72
6.0
$51,
130.
3$5
2,81
2.5
$58,
819.
8$6
1,23
9.3
$66,
591.
3
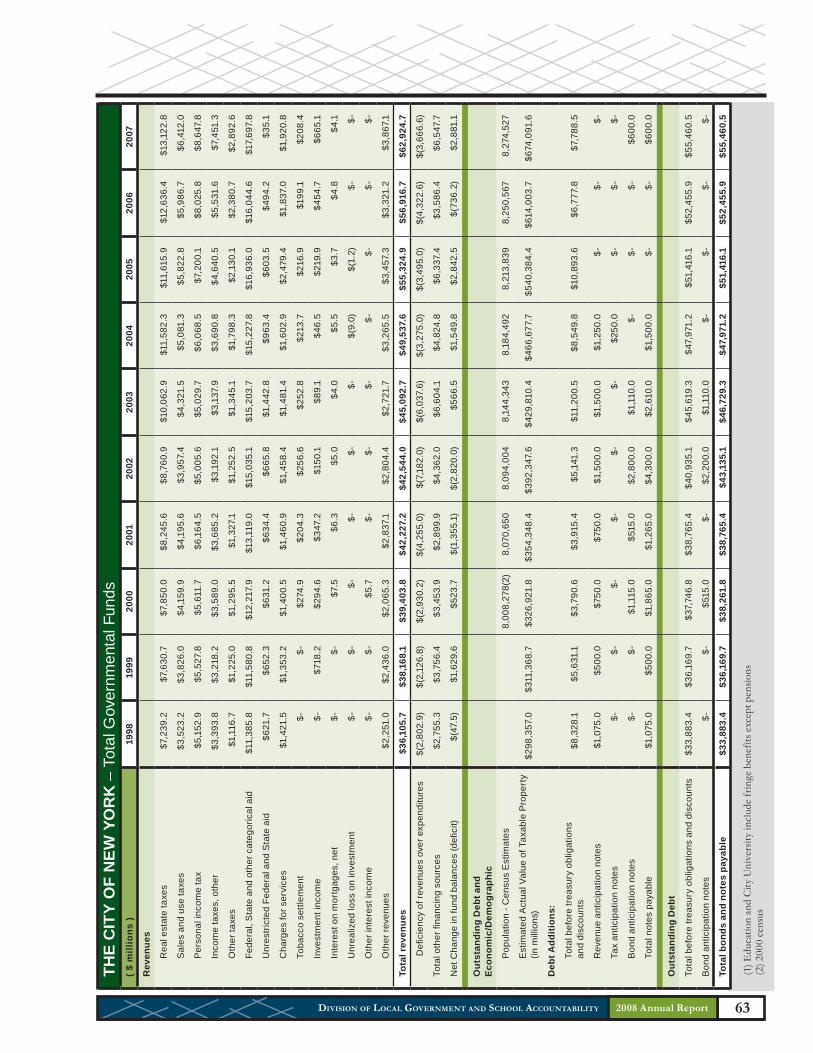
63 DIVISION OF LOCAL GOVERNMENT AND SCHOOL ACCOUNTABILITY
THE
CIT
Y O
F N
EW Y
OR
K –
Tot
al G
over
nmen
tal F
unds
( $ m
illio
ns )
1998
1999
2000
2001
2002
2003
2004
2005
2006
2007
Rev
enue
s
Rea
l est
ate
taxe
s$7
,239
.2$7
,630
.7$7
,850
.0$8
,245
.6$8
,760
.9$1
0,06
2.9
$11,
582.
3$1
1,61
5.9
$12,
636.
4$1
3,12
2.8
Sal
es a
nd u
se ta
xes
$3,5
23.2
$3,8
26.0
$4,1
59.9
$4,1
95.6
$3,9
57.4
$4,3
21.5
$5,0
81.3
$5,8
22.8
$5,9
86.7
$6,4
12.0
Per
sona
l inc
ome
tax
$5,1
52.9
$5,5
27.8
$5,6
11.7
$6,1
64.5
$5,0
05.6
$5,0
29.7
$6,0
68.5
$7,2
00.1
$8,0
25.8
$8,6
47.8
Inco
me
taxe
s, o
ther
$3,3
93.8
$3,2
18.2
$3,5
89.0
$3,6
85.2
$3,1
92.1
$3,1
37.9
$3,6
90.8
$4,6
40.5
$5,5
31.6
$7,4
51.3
Oth
er ta
xes
$1,1
16.7
$1,2
25.0
$1,2
95.5
$1,3
27.1
$1,2
52.5
$1,3
45.1
$1,7
98.3
$2,1
30.1
$2,3
80.7
$2,8
92.6
Fede
ral,
Sta
te a
nd o
ther
cat
egor
ical
aid
$11,
385.
8$1
1,58
0.8
$12,
217.
9$1
3,11
9.0
$15,
035.
1$1
5,20
3.7
$15,
227.
8$1
6,93
6.0
$16,
044.
6$1
7,69
7.8
Unr
estr
icte
d Fe
dera
l and
Sta
te a
id$6
21.7
$652
.3$6
31.2
$634
.4$6
65.8
$1,4
42.8
$963
.4$6
03.5
$494
.2$3
5.1
Cha
rges
for s
ervi
ces
$1,4
21.5
$1,3
53.2
$1,4
00.5
$1,4
60.9
$1,4
58.4
$1,4
81.4
$1,6
02.9
$2,4
79.4
$1,8
37.0
$1,9
20.8
Toba
cco
settl
emen
t$-
$-$2
74.9
$204
.3$2
56.6
$252
.8$2
13.7
$216
.9$1
99.1
$208
.4
Inve
stm
ent i
ncom
e$-
$718
.2$2
94.6
$347
.2$1
50.1
$89.
1$4
6.5
$219
.9$4
54.7
$665
.1
Inte
rest
on
mor
tgag
es, n
et$-
$-$7
.5$6
.3$5
.0$4
.0$5
.5$3
.7$4
.8$4
.1
Unr
ealiz
ed lo
ss o
n in
vest
men
t$-
$-$-
$-$-
$-$(
9.0)
$(1.
2)$-
$-
Oth
er in
tere
st in
com
e$-
$-$5
.7$-
$-$-
$-$-
$-$-
Oth
er re
venu
es$2
,251
.0$2
,436
.0$2
,065
.3$2
,837
.1$2
,804
.4$2
,721
.7$3
,265
.5$3
,457
.3$3
,321
.2$3
,867
.1
Tota
l rev
enue
s$3
6,10
5.7
$38,
168.
1$3
9,40
3.8
$42,
227.
2$4
2,54
4.0
$45,
092.
7$4
9,53
7.6
$55,
324.
9$5
6,91
6.7
$62,
924.
7
Defi
cie
ncy
of re
venu
es o
ver e
xpen
ditu
res
$(2,
802.
9)$(
2,12
6.8)
$(2,
930.
2)$(
4,25
5.0)
$(7,
182.
0)$(
6,03
7.6)
$(3,
275.
0)$(
3,49
5.0)
$(4,
322.
6)$(
3,66
6.6)
Tota
l oth
er fi
nanc
ing
sour
ces
$2,7
55.3
$3,7
56.4
$3,4
53.9
$2,8
99.9
$4,3
62.0
$6,6
04.1
$4,8
24.8
$6,3
37.4
$3,5
86.4
$6,5
47.7
Net
Cha
nge
in fu
nd b
alan
ces
(defi
cit)
$(47
.5)
$1,6
29.6
$523
.7$(
1,35
5.1)
$(2,
820.
0)$5
66.5
$1,5
49.8
$2,8
42.5
$(73
6.2)
$2,8
81.1
Out
stan
ding
Deb
t and
E
cono
mic
/Dem
ogra
phic
Pop
ulat
ion
- Cen
sus
Est
imat
es8,
008,
278(
2)8,
070,
650
8,09
4,00
48,
144,
343
8,18
4,49
28,
213,
839
8,25
0,56
78,
274,
527
Est
imat
ed A
ctua
l Val
ue o
f Tax
able
Pro
pert
y (in
mill
ions
)$2
98,3
57.0
$311
,368
.7$3
26,9
21.8
$354
,348
.4$3
92,3
47.6
$429
,810
.4$4
66,6
77.7
$540
,384
.4$6
14,0
03.7
$674
,091
.6
Deb
t Add
ition
s:
Tota
l bef
ore
treas
ury
oblig
atio
ns
and
disc
ount
s$8
,328
.1$5
,631
.1$3
,790
.6$3
,915
.4$5
,141
.3$1
1,20
0.5
$8,5
49.8
$10,
893.
6$6
,777
.8$7
,788
.5
Rev
enue
ant
icip
atio
n no
tes
$1,0
75.0
$500
.0$7
50.0
$750
.0$1
,500
.0$1
,500
.0$1
,250
.0$-
$-$-
Tax
antic
ipat
ion
note
s$-
$-$-
$-$-
$-$2
50.0
$-$-
$-
Bon
d an
ticip
atio
n no
tes
$-$-
$1,1
15.0
$515
.0$2
,800
.0$1
,110
.0$-
$-$-
$600
.0
Tota
l not
es p
ayab
le$1
,075
.0$5
00.0
$1,8
65.0
$1,2
65.0
$4,3
00.0
$2,6
10.0
$1,5
00.0
$-$-
$600
.0
Out
stan
ding
Deb
t
Tota
l bef
ore
treas
ury
oblig
atio
ns a
nd d
isco
unts
$33,
883.
4$3
6,16
9.7
$37,
746.
8$3
8,76
5.4
$40,
935.
1$4
5,61
9.3
$47,
971.
2$5
1,41
6.1
$52,
455.
9$5
5,46
0.5
Bon
d an
ticip
atio
n no
tes
$-$-
$515
.0$-
$2,2
00.0
$1,1
10.0
$-$-
$-$-
Tota
l bon
ds a
nd n
otes
pay
able
$33,
883.
4$3
6,16
9.7
$38,
261.
8$3
8,76
5.4
$43,
135.
1$4
6,72
9.3
$47,
971.
2$5
1,41
6.1
$52,
455.
9$5
5,46
0.5
(1) E
duca
tion
and
City
Uni
vers
ity in
clud
e fr
inge
ben
efits
exc
ept p
ensio
ns(2
) 200
0 ce
nsus
2008 Annual Report

2008 Annual Report OFFICE OF THE STATE COMPTROLLER64
DIVISION OF LOCAL GOVERNMENT AND SCHOOL ACCOUNTABILITY
RESOURCES AND PUBLICATIONS Website: www.osc.state.ny.us/localgov • Email: [email protected]
DIVISION SERVICES/RESOURCES
In addition to audits, the Division of Local Government and School Accountability provides an extensive range of services to help local governments operate more efficiently and effectively. These services include accounting, management and self-help manuals; technical assistance publications and bulletins; a variety of training opportunities and special consultative services. Moreover, the Division actively promotes government reform by providing State leaders, local government officials and the public with audits, research reports and information about critical local government policy issues.
Most of the Division’s publications, including all those listed below, can be accessed online at www.osc.state.ny.us/localgov/index.htm. Printed copies of these publications can be obtained by calling (518) 474-6975 or emailing us at [email protected].
Audits of Local Governments – The Division completes audits of individual local governments as well as groups of local governments. Performance audits provide an independent assessment of the performance of one or more local governments. Economy and efficiency audits are used to determine whether a locality is operating efficiently, the causes of any inefficiencies or uneconomical practices and whether the entity has complied with pertinent laws and regulations. Program audits are used to evaluate whether desired results or benefits are being achieved and whether the locality has complied with significant laws and regulations applicable to the program. The Division’s website includes audits released from 2003 to the present.
Cost-Saving Ideas – Various Division publications provide advice and assistance on cost-saving ideas local governments can use as they examine their operations. In particular, there is information on cooperation and consolidation, the Local Government Financial Toolbox (a series of fiscal “how-to” guides for local governments) and a model custodial agreement for use with collateral pools.
Data and Statistics – Data and statistics regarding the State’s local governments, including those used in many of the Division’s publications, is available in multiple formats on the Division’s website and by request. This includes information related to individual classes of local government such as villages, special district thresholds, the Aid and Incentives to Municipalities (AIM) program, revenues collected by justice courts and overlapping real property tax rates and levies. Financial data for counties, cities, towns, villages, school districts, fire districts, special purpose units, joint activities and industrial development agencies is also available.

65 DIVISION OF LOCAL GOVERNMENT AND SCHOOL ACCOUNTABILITY
Financial Reporting – Information and forms can be downloaded from the Division’s website in a variety of formats.
• Local Government Electronic Filing – The Division provides local governments with a free, easy-to-use software program they can utilize to prepare and file their annual financial reports.
• Justice Court Report Filing – Information related to the case disposition and receipt data that all town and village justice courts are required to submit to OSC each month is available.
• Indigent Legal Services Fund – Information concerning the annual reporting of expenditures on indigent legal services by counties and New York City and estimates of future distributions to these entities from the Indigent Legal Services Fund can be obtained.
• Constitutional Debt Limits – Information is available about the debt limits imposed by the State Constitution, which constrain the amount of debt that certain municipalities can incur, and the method for applying for exclusions from these limits for certain types of self-liquidating debt.
• Constitutional Tax Limits – Information is available about the provisions of the State Constitution that constrain the amount of taxes that a local government can levy and the tax limit form that local governments must file with OSC.
• Average Estimated Costs for County and Town Special Improvement Districts – Information can be found on the cost thresholds to be used in determining whether the approval of the State Comptroller is necessary for certain special district actions.
• Multiyear Financial Plans and Fiscal Performance Plans – A guide, template, and sample plans that local governments can use when developing their multiyear financial plans are available.
Publications – The Division’s website contains a wealth of documents of value to municipal officials and others interested in local government issues and finance.
DIVISION SERVICES/RESOURCES
2008 Annual Report
2008 Annual Report OFFICE OF THE STATE COMPTROLLER66
• Research Reports – The Division has authored several reports that address major policy issues facing local governments and State policy-makers. Recent subjects addressed includeState revenue sharing formulas, Industrial Development Agencies, energy efficiency and sales tax collections.
• Accounting and Financial Information – Numerous financial accounting, reporting and technical assistance documents are available for use by local governments.
• Audit Reports – The website includes a searchable database of audits of local government entities released by the Division from 2003 to the present.
• Local Government Connection Newsletter – The State Comptroller’s quarterly newsletter for municipalities, school districts and other local government-related entities is available on the website.
• Local Government Management Guide – A series of modules that includes technical information as well as suggested management practices for municipalities is available. Some of the topics covered in the guide are capital assets, fiscal oversight responsibilities, intermunicipal cooperation, internal controls, multiyear capital plans, multiyear financial planning, reserves and strategic planning.
• School Accountability Reform – Information can be found on the State Comptroller’s audit and oversight program to review school district finances and operations and available school board training designed to increase accountability in school districts and strengthen oversight of school finances.
Fire District Reform – Legislation enacted in 2007 institutes a number of significant changes designed to strengthen fire district and fire company accountability and oversight. The enacted legislation, a Frequently Asked Questions (FAQ) document, an accounting bulletin outlining new auditing requirements and a document outlining the internal audit process for fire districts are available.
Training – The Division offers municipal officials a comprehensive array of seminars, including teleconferences, designed to assist them in providing government services as efficiently and effectively as possible. This includes subjects such as accounting principles and procedures, governmental accounting and fiscal oversight training for school board members. A schedule of future classes and information about specific training sessions are also available on the website.
DIVISION SERVICES/RESOURCES

67 DIVISION OF LOCAL GOVERNMENT AND SCHOOL ACCOUNTABILITY
Executive ........................................................................................................................................................................................ 474-4037 Steven J. Hancox, Deputy Comptroller John C. Traylor, Assistant Comptroller
Financial Reporting .................................................................................................................................................................... 474-4014(Annual Financial Reports, Constitutional Limits, Real Property Tax Levies, Local Government Approvals)
Information Services ................................................................................................................................................................. 474-6975(Requests for Publications or Government Data)
Justice Court Fund ......................................................................................................................................................................473-6438
Audits and Local Services ........................................................................................................................................................ 474-5404(Audits, Technical Assistance)
Professional Standards ............................................................................................................................................................ 474-5404(Auditing and Accounting)
Research .......................................................................................................................................................................................... 473-0617
Statewide and Regional Projects.................................................................................................................................607-721-8306
Training.............................................................................................................................................................................................473-0005(Local Offi cial Training, Teleconferences, DVDs)
Electronic Filing
Questions Regarding Electronic Filing of Annual Financial Reports ......................................................... 474-4014Questions Regarding Electronic Filing of Justice Court Reports ................................................................. 486-3166
(Area code for the following is 518 unless otherwise specifi ed)
Mailing Address
for all of the above:
DirectoryCentral Offi ce
email: [email protected]
Offi ce of the State Comptroller,
110 State St., Albany, New York 12236
Division of Local Government and School Accountability
2008 Annual Report
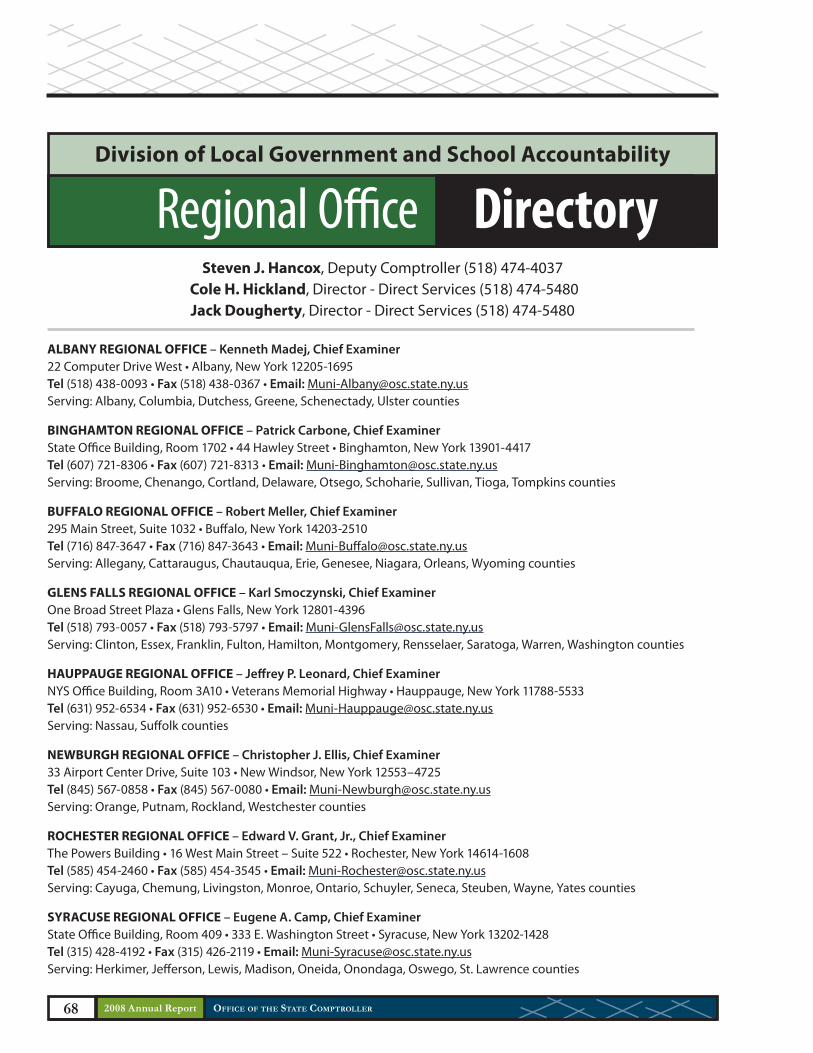
2008 Annual Report OFFICE OF THE STATE COMPTROLLER68
DirectoryRegional Offi ceSteven J. Hancox, Deputy Comptroller (518) 474-4037
Cole H. Hickland, Director - Direct Services (518) 474-5480Jack Dougherty, Director - Direct Services (518) 474-5480
Division of Local Government and School Accountability
ALBANY REGIONAL OFFICE – Kenneth Madej, Chief Examiner
22 Computer Drive West • Albany, New York 12205-1695Tel (518) 438-0093 • Fax (518) 438-0367 • Email: [email protected]: Albany, Columbia, Dutchess, Greene, Schenectady, Ulster counties
BINGHAMTON REGIONAL OFFICE – Patrick Carbone, Chief Examiner
State Offi ce Building, Room 1702 • 44 Hawley Street • Binghamton, New York 13901-4417Tel (607) 721-8306 • Fax (607) 721-8313 • Email: [email protected]: Broome, Chenango, Cortland, Delaware, Otsego, Schoharie, Sullivan, Tioga, Tompkins counties
BUFFALO REGIONAL OFFICE – Robert Meller, Chief Examiner
295 Main Street, Suite 1032 • Buff alo, New York 14203-2510Tel (716) 847-3647 • Fax (716) 847-3643 • Email: Muni-Buff [email protected]: Allegany, Cattaraugus, Chautauqua, Erie, Genesee, Niagara, Orleans, Wyoming counties
GLENS FALLS REGIONAL OFFICE – Karl Smoczynski, Chief Examiner
One Broad Street Plaza • Glens Falls, New York 12801-4396Tel (518) 793-0057 • Fax (518) 793-5797 • Email: [email protected]: Clinton, Essex, Franklin, Fulton, Hamilton, Montgomery, Rensselaer, Saratoga, Warren, Washington counties
HAUPPAUGE REGIONAL OFFICE – Jeff rey P. Leonard, Chief Examiner
NYS Offi ce Building, Room 3A10 • Veterans Memorial Highway • Hauppauge, New York 11788-5533Tel (631) 952-6534 • Fax (631) 952-6530 • Email: [email protected]: Nassau, Suff olk counties
NEWBURGH REGIONAL OFFICE – Christopher J. Ellis, Chief Examiner
33 Airport Center Drive, Suite 103 • New Windsor, New York 12553–4725Tel (845) 567-0858 • Fax (845) 567-0080 • Email: [email protected]: Orange, Putnam, Rockland, Westchester counties
ROCHESTER REGIONAL OFFICE – Edward V. Grant, Jr., Chief Examiner
The Powers Building • 16 West Main Street – Suite 522 • Rochester, New York 14614-1608Tel (585) 454-2460 • Fax (585) 454-3545 • Email: [email protected]: Cayuga, Chemung, Livingston, Monroe, Ontario, Schuyler, Seneca, Steuben, Wayne, Yates counties
SYRACUSE REGIONAL OFFICE – Eugene A. Camp, Chief Examiner
State Offi ce Building, Room 409 • 333 E. Washington Street • Syracuse, New York 13202-1428Tel (315) 428-4192 • Fax (315) 426-2119 • Email: [email protected]: Herkimer, Jeff erson, Lewis, Madison, Oneida, Onondaga, Oswego, St. Lawrence counties
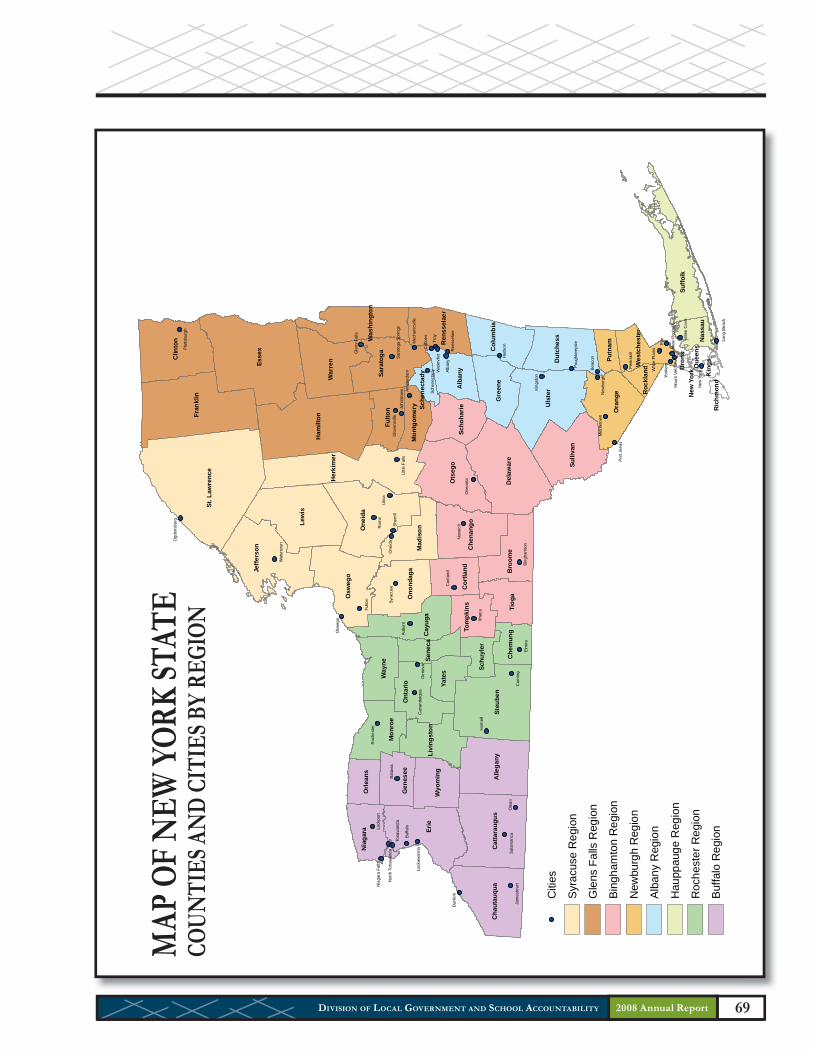
69 DIVISION OF LOCAL GOVERNMENT AND SCHOOL ACCOUNTABILITY
Cha
utau
qua
Cat
tara
ugus
Alle
gany
Steu
ben
Che
mun
gTi
oga
Bro
omeC
hena
ngo
Mad
isonO
neid
a
Lew
is
St. L
awre
nce
Jeffe
rson
Osw
ego
Ono
ndag
a
Cor
tland
Tom
pkin
s
Schu
yler
Yate
s
Sene
caC
ayug
a
Way
ne
Ont
ario
Livi
ngst
onW
yom
ing
Erie
Nia
gara
Orle
ans
Gen
esee
Mon
roe
Fran
klin
Clin
ton
Esse
x
Ham
ilton
Her
kim
er
Fulto
n
War
ren
Was
hing
ton
Sara
toga
Mon
tgom
ery
Ren
ssel
aer
Sche
nect
ady
Alb
any
Scho
harie
Ots
ego
Del
awar
eG
reen
eC
olum
bia
Sulli
van
Uls
ter
Dut
ches
s
Ora
nge
Putn
am
Roc
klan
dWes
tche
ster
Suffo
lk
Nas
sau
Ric
hmon
dK
ingsQue
ens
Bro
nxN
ew Y
ork
Jam
esto
wn
Dun
kirk
Sala
man
caO
lean
Hor
nell
Can
anda
igua
Roc
hest
er
Bata
via
Lock
port
Nia
gara
Fal
ls
Nor
th T
onaw
anda
Tona
wan
da
Buffa
lo
Lack
awan
na
Cor
ning
Elm
iraBi
ngha
mto
n
One
onta
Nor
wic
h
Cor
tland
Ithac
a
Gen
eva
Aubu
rn
Osw
ego
Fulto
n Syra
cuse
Wat
erto
wn
Ogd
ensb
urg
Plat
tsbu
rgh
Gle
ns F
alls
Sara
toga
Spr
ings
Rom
e
One
ida
Sher
rill
Utic
a
Littl
e Fa
lls
Glo
vers
ville
John
stow
n Amst
erda
mM
echa
nicv
ille
Sche
nect
ady
Coh
oes
Troy
Wat
ervl
iet
Ren
ssel
aer
Alba
ny
Hud
son
King
ston
Poug
hkee
psie
Beac
on
New
burg
hM
iddl
etow
n
Port
Jerv
is
Peek
skill
Whi
te P
lain
s
Long
Bea
ch
Gle
n C
ove
New
Yor
k
Rye
New
Roc
helle
Mou
nt V
erno
n
Yonk
ers
Citi
es
Syra
cuse
Reg
ion
Gle
ns F
alls
Reg
ion
Bing
ham
ton
Reg
ion
New
burg
h R
egio
n
Alba
ny R
egio
n
Hau
ppau
ge R
egio
n
Roc
hest
er R
egio
n
Buffa
lo R
egio
n
MAP
OF
NEW
YO
RK
STAT
ECO
UN
TIES
AN
D C
ITIE
S BY
REG
ION
2008 Annual Report


New York StateOffi ce of the State Comptroller
Division of Local Government and School Accountability
110 State Street, 12th Floor • Albany, New York 12236