annual report - pmp limited · pdf filenotes to and forming part of the financial statements...
TRANSCRIPT

ABN 39 050 148 644
ANNUAL REPORT

PMP LIMITED
Level 12
67 Albert Avenue
Chatswood
New South Wales 2067
Tel: 02 9412 6000
Fax: 02 9413 3942
pmplimited.com.au
ANNUAL GENERAL MEETING
The Annual General Meeting will be held
at 11am on Thursday 20 November 2014 at:
The Grace Hotel
77 York Street
Sydney NSW 2000
Details of the business of the meeting
are contained in the Notice of Meeting.
INVESTOR INFORMATION
Shareholders requiring information should
contact the share registry or Chief Financial Officer
Geoff Stephenson.
Tel: 02 9412 6000
Fax: 02 9413 3942
Email [email protected]
ASX Code PMP
SHARE REGISTRY
Computershare Investor Services Pty Limited
Level 5, 115 Grenfell Street
Adelaide SA 5000
GPO Box 1903
Adelaide SA 5001
Enquiries within Australia 1300 556 161
Enquiries outside Australia +61 3 9415 4000
Email [email protected]
computershare.com
BOARD OF DIRECTORS
Matthew Bickford-Smith — Chairman
Peter George — CEO and Managing Director
Anthony Cheong — Non-Executive Director
Peter Margin — Non-Executive Director
Naseema Sparks — Non-Executive Director
ABN 39 050 148 644
Chairman’s Review 02
CEO’s Review 06
Directors’ Report 16
Remuneration Report 28
Independent Auditor’s Declaration 39
Commentary on the Accounts 40
42
Statement of Financial Position 43
Statement of Cash Flows 44
Statement of Changes in Equity 45
Notes to and forming part of the Financial Statements 46
Independent Audit Report 96
Five Year Summary 98
Share Register Information 99
Shareholder Information 100
| |

| PMP LIMITED Annual Report 2014 | 1
FY14HIGHLIGHTS
COMPANY PROFILE
FY14 HIGHLIGHTS
PMP LIMITED’S PRINCIPAL ACTIVITIES ARE COMMERCIAL PRINTING, LETTERBOX DELIVERY, DIGITAL PRE-MEDIA
AND MAGAZINE DISTRIBUTION SERVICES.
The company is structured into three main areas:
PMP Australia, PMP New Zealand and Gordon & Gotch.
PMP Limited is the largest commercial printer in Australia and New Zealand, producing catalogues, directories, magazines and books. PMP Print’s production plants are located strategically in major capital cities, offering web offset printing. PMP’s New Zealand operations also offer sheetfed offset printing. Griffin Press specialises in book manufacture from its printing plant in Adelaide.
The company offers letterbox distribution of catalogues direct to households through its PMP Distribution business, and magazine distribution direct to retail outlets through its Gordon & Gotch business.
The company was listed on the Australian Stock Exchange in 1991, but many of the operating units have a long and distinguished history. Many of the production and distribution facilities were originally founded by various newspaper companies, and these operations have maintained market leadership for over a hundred years.
The company has a highly skilled workforce, with many long serving employees.
THE STRATEGY TO TRANSFORM PMP INTO A LEANER, STRONGER AND MORE CUSTOMER FOCUSED COMPANY CONTINUES TO DELIVER THE RESULTS.
PMP’s transformation strategy remains on track with strong free cashflow
Clear strategy and disciplined execution are delivering benefits
A sustainable and profitable PMP continues to emerge.
Key Financials FY14$M 2014 2013 Var %
Operating Revenue 899.2 975.8 (7.8)
EBITDA* 63.4 71.6 (11.4)
EBIT** 28.8 33.8 (14.7)
11.8 14.3 (17.8)
3.4 (70.2)
44.0 27.5 60.1
Net Debt (89.1) 42.0
(0.8 1.2
(
3.6 4.4
* Earnings before Finance costs, Income tax, Depreciation and Amortisation and Significant Items
** Earnings before Finance costs, Income tax and Significant Items*** Equals EBITDA (before Significant Items) less borrowing costs, Income
tax paid, Capital Expenditure and movement in Working Capital.

2 | PMP LIMITED Annual Report 2014 |
CHAIR MAN’SREVIEW
CHAIRMAN’S REVIEW
Last year PMP Limited articulated a clear strategy to transform the company into a leaner, stronger, more competitive industry leader. Your Board and the Management Team remain clearly focused on achieving this goal and believe that the result for the 2014 financial year vindicates the company’s strategy.
FY14 ResultsI am pleased to report that this year PMP has returned to profit with a Net Profit (after significant items) of $3.4M. Although modest, this profit result compares favourably to a Net Loss (after significant items) of $70.2M last year.
PMP is continuing the steady progress of the last two years and the early signs of recovery evident in the prior year have been confirmed in FY14. Griffin Press, Gordon & Gotch, Distribution in Australia and PMP New Zealand all improved their performance during the year. The company is on track to return a more acceptable level of financial performance.
A noteworthy milestone was achieved during the period with Net Debt reducing by 42% to $51.7M, the lowest level since the company was founded in 1991. In addition our free cash flow result was particularly encouraging, with an increase of 60% over the previous year to $44.0M in FY14. This provides a clear indication of PMP’s strong cash generation capability and the underlying strength of the mix of PMP’s businesses.
There were no impairment charges affecting the result this year resulting in significant items falling to $9.1M, down from $88.5M last year.

| PMP LIMITED Annual Report 2014 | 3
StrategyThe strategy that the company is executing has three priorities: significantly reducing the company’s cost base, significantly reducing the company’s debt, and creating a sustainable and increasingly customer focused company.
The cost base of the company has now been substantially reduced with staffing levels significantly lowered over the past three years resulting in subsequent increases in productivity and efficiency. In FY14 costs were further reduced with the successful completion of Phase 3 of the company’s Transformation Plan which created $16.4M of annualised savings. This follows the effective completion in prior years of the New Zealand Transformation Plan and Phases One and Two of the Australian Transformation Plan. An ongoing continuous improvement program is currently being developed for implementation in FY15 and will deliver additional savings.
Debt has been reduced to an all-time low and our Net Debt to EBITDA ratio is now at a conservative 0.8 times. In addition the company has diversified its financing sources with the successful issue of a $50M corporate bond during the year and our existing banking facility has been extended into FY16.
Having substantially executed the first two elements of our strategy, the ongoing focus now turns to the third priority – creating a sustainable and an increasingly customer focused
company. Future gains are likely to be incremental rather than the step-changes achieved over the past two years. Nevertheless I am confident that we are on the right track with a clear strategy and disciplined execution delivering the desired outcomes.
The organisational restructure, which was completed last year, is delivering significant efficiencies throughout the business as a result of moving from a business unit organisation structure to a simpler and more unified functional structure. We are also now starting to see the benefits of removing organisational impediments to offering bundled distribution and printing services on a national basis to our customers.
PMP is concentrating on increasing its relevance to the retail sector and these enhanced and integrated sales offerings are proving to be attractive to a number of our important retail customers. The company can offer retailers a seamless end-to-end integrated catalogue publishing process with our DMarketer print preparation system, cost effective printing, mass letterbox distribution, and the ability to geodemographically target versions of catalogues.
Catalogues are maintaining their resilience as they remain a crucial element of successful marketing campaigns for retailers. There is a growing appetite by retailers to improve effectiveness though the use of geodemographic targeting.
Print AU impacted by lower Directories volumes and tough markets in Heatset (volume & prices)
Griffin Press secures major new customer and restructures cost base
Distribution Australia market share marginally higher
PMP NZ had stronger Distribution & Sheetfed sales offsetting tough Heatset market.
1093.9
899.2
$M 2012 2013 2014
Operating Revenue
Distribution volumes up 9.5%
Revenue lower 7.8% or $76.6M pcp
Lower Directory/Gordon & Gotch sales $45.6M
Australian catalogue print volumes down 3%.
63.4
$M 2012 2013 2014
EBITDA before significant items
$M 2012 2013 2014
Upper end of market guidance
EBIT down 14.7% pcp
Gordon & Gotch Australia EBIT up pcp from $1.1M to $3.4M from cost restructure/controls.
33.828.8
EBIT before significant items
Net Profit (after significant items) of $3.4M v Net Loss ($70.2M pcp)
Phase 3 completed $11.2M spend, annualised savings $16.4M.
Net profit/(loss) after significant items
3.4
$M 2012 2013 2014

4 | PMP LIMITED Annual Report 2014 |
CHAIR MAN’SREVIEW
PMP has a diversified portfolio of businesses within the broader print and distribution industry in Australia and New Zealand. Some sectors, notably Australian heatset printing, continue to be very challenging, characterised by overcapacity and competitive pricing. Trading conditions in heatset are unlikely to significantly improve until the retailing sector gathers strength and/or some form of industry rationalisation takes place. In other sectors of the industry such as distribution and book printing, conditions are somewhat more favourable and our businesses are performing to expectations. In New Zealand, where we have a broader offering, the strength of the economy and the benefits accruing from the Transformation Plan are underpinning an ongoing solid performance.
Your Board is of the view that the time is not yet right to reinstate dividend payments as it is still too early in the rebuilding process. However it remains a definite goal as we are keen to reward shareholders where ever possible.
During the year Mr Sik Ngee Goh resigned as a Director of PMP and Mr Anthony Cheong was appointed as a Non-Executive Director. Mr Cheong was also appointed a member of the Board’s Audit and Risk Committee. On behalf of shareholders I welcome Mr Cheong to PMP and thank Mr Goh for his contribution to the company.
CHAIRMAN’S REVIEW

| PMP LIMITED Annual Report 2014 | 5
OutlookThe company anticipates the business environment to remain challenging with softer retail markets and excess heatset print capacity resulting in competitive pricing activity. The company will continue to reduce its cost base through the on-going continuous improvement program while at the same time enhancing its capabilities to compete effectively in the marketplace. Guidance for FY15 will be provided at the AGM in November.
I would like to also refer you to the Directors’ Report on pages 16 to 38 which also includes the company’s Remuneration Report (pages 28 to 38). Both reports contain information which I anticipate will be of interest to shareholders.
Thanks Your Board is confident that the company is on the right track to achieve its corporate goals but is mindful that there are challenges still to be met. I would like to sincerely thank PMP’s management and employees for their efforts to date without whom the company’s achievements would not be possible.
6.16.3
Significant items reduced from $88.5M in 2013 to $9.1M in 2014
Net Debt to EBITDA at 0.8x v 1.2x pcp
Interest Cover 5.1x v 4.7x pcp
Significant items Net debt/EBITDA before significant items
9.1
0.8
Safety
Cash interest paid $6.5M lower pcp
Net Debt $51.7M vs $89.1M pcp
Free cashflow $44.0M vs $27.5M pcp
Issued $50M unsecured Corporate Bond
Net Debt
143.3
89.1
41.1
1.9
1.2
2012 2013 2014$M 2012 2013 20142012 20122013 20132014 2014
Long Time Injury Frequency Rate 6.3 v 9.5
Focus on internal capability
$M$M

6 | PMP LIMITED Annual Report 2014 |
The strategy to transform PMP Limited into a leaner, stronger and more customer focused company has delivered another solid result for the 2014 financial year (FY14).
The company recorded a Net Profit (before significant items) of $11.8M while Net Debt as at 30 June 2014 was $51.7M, the lowest in the company’s 23 year history. Net Debt was reduced by 42% over the period which is a testament to our robust cash generation capability with Free Cash Flow for the year up 60% to $44.0M.
EBIT (before significant items) fell by $5.0 million or 14.7% to $28.8M compared to $33.8 million in the previous year, due in part to $4.1 million of higher property rental expense following the successful conclusion of our Australian sale and lease-back program. Cash interest paid fell by $6.5M from $18.0M to $11.5M.
Griffin Press, Gordon & Gotch, Distribution in Australia and PMP New Zealand all performed well during the year and achieved improved profit results. PMP Australia also benefited from transformation savings and lower lease rent costs at Chullora and Digital. However these benefits were offset by the expected lower directory volumes, lower selling prices in heatset and a slight fall in catalogue print volumes. Corporate costs were reduced during the period.
During the year our debt facilities were strengthened via a $50M four year term corporate bond issue which was successfully completed at a fixed 8.75% coupon, while the existing bank facility maturity date was extended to September 2015.
The Australian sale and lease-back program was completed during FY14 when the remaining portion of our Clayton property was sold and leased back for a $4.0M profit. The proceeds of $7.6M were used to retire debt.
The print and distribution industry continues to be a challenging environment and is expected to remain so until much needed substantial structural realignment occurs. Nevertheless, as evidenced above, the company has performed well in these difficult circumstances.
Demand in the major retail sector remained sound during the year, although there was some softening in the medium and smaller retailer categories. Heatset printing continued to be affected by structural factors such as excess industry capacity in Australia and, in conjunction with a softer retail market, pricing continues to remain competitive.
CEO’S REVIEW

| PMP LIMITED Annual Report 2014 | 7
The company has been significantly transformed over the past eighteen months as we have successfully implemented the first two priorities of our three stage strategic vision which I detailed last November at our 2013 Annual General Meeting.
We have substantially reduced the cost base of the business through successive our Transformation Plan since the commencement of the Plan. Phase 3 was successfully completed during the year generating $16.4M of annualised savings, in line with our expectations.
We have also considerably reduced the company’s financial risk to the point where Net Debt, as mentioned above, is at an historical low. Our gearing ratio (Net Debt to EBITDA pre significant items) has been reduced from 1.2 times to a conservative 0.8 times and our Debt to Equity ratio is 19.5%, down from 34.4% last year.
As part of our third strategic priority, building a more leaner, stronger and customer focused PMP, we have enhanced our ability to offer nationwide bundled printing and distribution solutions to our major customers and this is proving to be an increasingly attractive option for a number of our largest accounts.
We are also improving our relevance to retailers and there is an increased recognition by major retailers of the value of catalogues as an effective selling tool. We are developing our capability to assist retailers in targeting versions of their catalogues to specific geographic and demographic audiences.
We are now restructuring and re-training our sales force to better position the benefits of our bundled solution capability to existing and prospective customers.
2015 PrioritiesWe will continue to drive out costs from the business following the completion of our Transformation Plan with an ongoing continuous improvement program. This phase will target efficiencies from process simplification and systems upgrades.
We are focusing on building a more sustainable, customer focused and profitable company by developing and enhancing a winning culture within the business to ensure success in the longer term. This will involve a major cultural shift to create a customer centric workforce with a total focus on winning business and delivering on promises.
Cost base and financial risk reduced
Stronger EBIT* versus pcp from Gordon & Gotch, Griffin Press, Distribution Australia and New Zealand sheetfed reduces reliance on Heatset print in Australia/ New Zealand
Weak consumer spending and industry overcapacity continues to impact Heatset printing
On-going focus on becoming a retail catalogue specialist:
Successfully expanded the use of Dmarketer as part of combined offer to clients
Assist retailers in targeting versions of their catalogues to specific target audiences
Well underway to building a more profitable and sustainable PMP.
* Restated balances $0.6M expense for FY13 due to AASB 119 Employee benefits policy change
** Earnings before Finance costs. Income tax and Significant items.
FY14 FY13 Var $ Var %
PMP Australia 439.9 493.6 (53.7) (10.9)
160.9 158.8 2.1 1.3
298.4 323.4 (25.0) (7.7)
899.2 (7.8)
Segment Performance
FY14 FY13 Var $ Var %
PMP Australia 20.9 30.6 (9.7) (31.6)
9.9 9.7 0.2 2.4
3.4 1.1 2.3 —
Corporate/other (7.7) 2.2 28.5
28.8 33.8 (14.7)

8 | PMP LIMITED Annual Report 2014 |
CEO’SREVIEW
PMP Australia returned an EBIT (before significant items) of $20.9M, down $9.7M compared to the previous year. The integration of the print, distribution and prepress businesses into a functional structure is well progressed.
PMP PrintPrint had another tough year as prices remained very competitive within the heatset segment of the print market. The major influences were the continued resilience of the catalogue business, with printed volumes falling by just 3% despite soft retail conditions. Catalogues continue to be a major element of integrated retail marketing campaigns. Heatset printing continues to be adversely affected by industry overcapacity and weak consumer demand. In line with expectations, Directory volumes fell by 72%. This business has now been successfully consolidated into the Moorebank site.
Operationally, the business spent the year focusing on bedding down the transformation changes with the impact that it had on staff and equipment.
CEO’S REVIEW
FY14 FY13 Var %
439.9 493.6 (10.9)
EBIT 20.9 30.6 (31.6)
PMP Australia

| PMP LIMITED Annual Report 2014 | 9
PMP DistributionCatalogue distribution volumes increased by 11.4%, while newspaper volumes softened. This increase contributed to the Distribution business performing well during the year with total volumes growing by 10% and the business securing several significant new contracts.
Retailers continue to place great reliance on direct letter box distribution as a consequence of the on-going fragmentation of media channels. The business’s ability to target geo-demographic audiences further enhances the effectiveness of catalogue distribution.
PMP DigitalDigital made a positive contribution to the group performance. The transition of the Victorian business to the Clayton facility following the closure of the Southbank site in Victoria was completed during the year. The photography and prepress parts of the business continue to reflect the pressures of the rapidly changing technology in these areas, but the DMarketer product continues to assist the other parts of the business in providing an integral part of the catalogue production solution.
Griffin Press, the largest book printer in Australia, had a solid year and increased profitability compared to the previous year.
Book volumes were steady and the business retained all key contracts while securing a major new customer as a result of the ongoing consolidation of the book publishing industry.
The book publishing industry has moved to printing smaller quantities more often and the business has responded by equipping to meet this demand, offering integrated solutions of on-demand digital printing and conventional coldset printing. This has resulted in an increase in volumes being printed in Australia and has allowed better print management. As well the cost base of the business was restructured during the period to increase efficiency.
Printing Business Industry overcapacity impacted
print sell prices
Customers taking up integrated offer of all PMP products and services
Tighter cost control and lower headcount. Managing peak times with flexible work force
Phase 3 Transformation plan successfully implemented across all plants.
Letterbox Distribution Business Transformation plan
successfully implemented
Unaddressed volumes up 12% for same period last year
Major customers have increased volume compared to same period last year.
PMP Digital Digital made a positive contribution
to group performance
Dmarketer product provides an integral part of its catalogue production process.
Griffin Press is the largest book printer in Australia
Increased profitability on steady volumes
Offering on-demand digital printing as well as conventional coldset printing
Increase in volumes possible from more work being printed in Australia, and from on-going consolidation of the book publishing industry.
PMP Australia

10 | PMP LIMITED Annual Report 2014 |
CEO’SREVIEW
CEO’S REVIEW
PMP New Zealand returned an EBIT (pre significant items) of $9.9M, up $0.2M on the prior year.
The main factors contributing to the results were higher Distribution volumes and improved sheetfed sales along with a relentless focus on cost control, input costs and additional Transformation benefits for Auckland sheetfed. These positives were partially offset by lower selling prices in the heatset market which continues to be challenging.
The consolidation of the business into one North Island and one South Island site has enhanced efficiency and reduced costs.
The integration of the sales force was completed during the year and this has been complemented by substantial training to enable the business to offer fully integrated printing and distribution solutions. As a result several major contracts were renewed during the year.
A new focus for the sales team has been the corporate market and there are early indications that the company’s broadened offer is attractive to this sector as evidenced by the securing of a major new corporate client.
Printing Ongoing cost savings and
operational improvements post transformation
Competitive heatset marketplace continuing to put pressure on margins
Sheetfed offer in market is gaining traction offsetting Heatset reductions
A broader offering is going to market attracting a new customer base.
Letterbox Distribution Business Year-on-year volume and market
share increase
Yield under pressure in small market
Strong retail pressure despite improving NZ economy
Better community newspaper volumes.
Magazine Distribution Business
Year-on-year EBIT improvement despite lower revenue
Lower volumes due to ongoing market shrinkage and loss of contract
Logistics savings being realised and ongoing cost reduction.
FY14 FY13 Var %
160.9 158.8 1.3
EBIT 9.9 9.7 2.4

| PMP LIMITED Annual Report 2014 | 11
[ AUSTRALIA ]
Gordon & Gotch returned an EBIT (pre significant items) of $3.4M for the period, up $2.3M on last year due to a continuing focus on further cost restructuring and efficiency gains.
Magazine distribution scheduling was overhauled to more effectively respond to demand and to deliver cost efficiencies.
This more than offset lower volumes which were down 5.3% as the magazine industry continued to contract.
Magazine Distribution Business
EBIT improvement despite volume decline in magazine circulations of 5.3%
Continued focus on restructuring initiatives – reduced number full time employees
Freight initiatives – route optimisation and retail delivery consolidation.
FY14 FY13 Var %
298.4 323.4 (7.7)
EBIT 3.4 1.1 —
[ AUSTRALIA ]

12 | PMP LIMITED Annual Report 2014 |
CEO’SREVIEW
CEO’S REVIEW
SustainabilityPMP strives to be a sustainable business which meets our responsibilities to the environment through long-term objectives of reducing emissions, preventing pollution, minimising waste and conserving and renewing natural resources.
We will achieve these goals by applying the “four R’s” principle in all areas of our operations – reduce, re-use, recycle and replenish.
With growing customer, employee, government and public awareness on environmental issues, PMP acknowledges its responsibility to remain transparent on the current and emerging exposures that the company faces. PMP have identified the key risks and opportunities and have devised strategic programmes in response to these exposures.
Paper purchasing
Energy consumption
Greenhouse gas emissions
Transport of raw materials and finished product
Waste water treatment.
Delivering business savings through reducing energy consumption
Minimisation of transport impacts through a multi-site printing strategy
Improving the quality of waste water through reducing or eliminating harmful press-room chemicals
Carbon sequestration through improved forestry practices by suppliers and by purchasing carbon offsets on behalf of customers.
Right: Regenerative Thermal Oxidisers increase the
volatile organic compound combustion rate, resulting in the release of cleaner air into
the atmosphere. They are energy efficient, enabling the heat of the ink solvent
combustion to largely offset the use of natural gas.

| PMP LIMITED Annual Report 2014 | 13
PMP continues to support responsible forestry through its chain-of-custody programme, and has achieved both PEFC and FSC certification at every print site across the group. PMP works closely with its customers to promote the use of paper sourced responsibly.
PMP recycles over 99% of the waste generated in the printing process. PMP has targets in place to reduce waste to landfill and paper waste. PMP is actively focused on reducing waste to landfill by improving our systems and auditing the suppliers’ disposal process activities. PMP’s main recycling streams are paper, aluminium, cardboard, plastics, steel and timber.
PMP has complied with a number of state and federal reporting programs, including:
National Pollutants Inventory
Energy Efficiency Opportunities (discontinued on 29 June 2014)
Carbon Disclosure Project
National Greenhouse and Energy Reporting.
PMP have developed an environmental procurement policy which ensures that environmental criteria are embedded in the procurement process. The policy outlines four main principles:
Transparent and accurate sustainability profiles prepared for major suppliers
Value for money including environmental factors considered in total cost of ownership analysis
Ongoing relationship with suppliers to drive continuous improvement
Site audits of suppliers to ensure best practice processes are being followed.
Gathering detailed information from our suppliers ensures that PMP is able to perform accurate life cycle calculations on our printed products for our customers.
PMP Print’s year on year Greenhouse Gas (GHG) emissions reduced by 9% in FY14, taking the total reduction since 2008 to 34%. PMP will continue to pursue energy efficiency measures across all businesses to further reduce our overall emissions.
FY13/14 FY12/13 Var %
198.8 (10.8)
39.3 40.3 (2.6)
(thousands) 239.1
10.0
648.2 602.3 7.6
(millions) 3,186.9 2,911.1
131.0 138.3 (5.3)
21.2 (25.6)
(millions)
100
0
GH
G E
MIS
SIO
NS
(k
t)
FINANCIAL YEARS
FY08 FY09 FY10 FY11 FY12 FY14FY13
147137
122 122
97107113

14 | PMP LIMITED Annual Report 2014 |
CEO’SREVIEW
SafetyWe have made significant progress on meeting our safety targets during the year.
During the year the company strengthened its safety management capability with the appointment of a highly qualified and experienced senior safety manager reporting to the CEO. Safety reporting and education have been reviewed and strengthened throughout the company and our Lost Time Injury Frequency Rate dropped during the year, from last year’s figure of 9.5 occurrences per million man hours worked to 6.3 in FY14.
Reducing safety risks will remain a focus throughout FY15. Enhanced reporting mechanisms and metrics are being introduced to provide greater clarity on our safety performance. There will also be a focus on personal behaviours, which with the enhanced reporting, will continue to reinforce a safety conscious culture throughout the company.
ThanksWe would like to again acknowledge the support and dedication of our team of loyal employees at PMP. Although it has been another very difficult year, I continue to be gratified by the focus and commitment of our people. I offer my sincere thanks to you all, and also to our shareholders, customers and suppliers.
CEO’S REVIEW

| PMP LIMITED Annual Report 2014 | 15
PMP AustraliaPMP Australia is the integration of print, distribution, digital workflow and pre-media businesses offering contract printing for publishers, retailers and others; book printing/manufacture; letterbox distribution of catalogues; and photography services.
Multi-channel content management
Workflow solutions
Image Libraries and Asset Management
Production and Creative Services
Onsite Production Studios
Photography Services
Retail Catalogues
Magazines
Newspapers
Directories
Books
Government & Corporate Documents
Government Material
Unaddressed Catalogue Delivery
Targeted Catalogue Delivery
Newspaper Delivery
Product Sample Delivery.
Market Retailers
Marketing and Advertising Agencies & Media Buying Agencies
Newspaper, Magazine & Directory Publishers
Direct Marketers & Mailhouses
Corporate – Financial Services, Telecommunications and Utilities
Government
Fast Moving Consumer Goods
International & Local Book Publishers.
The market leader with access to printing plants and distribution centres in every State and Territory of Australia and New Zealand.
PMP New ZealandPMP New Zealand provides highly specialised stand alone media services that, together, offer fully integrated supply chain solutions to print media, retail, SME’s, real estate, publishing and micromarketing clients.
Magazines
Catalogues
Directories
Books
Financial documents
Corporate documents
Government material
Newspapers
Digital printing
Targeted catalogue delivery
Mail house facilities
DMarketer solutions for retailers.
Market Corporate
Financial services
Government
International & local book publishers
Marketing, advertising & media buying agencies
Newspaper, magazine & directory publishers
Retail.
The market leader with access to plants across Australia and New Zealand.
Gordon & GotchGordon & Gotch is a magazine distributor offering circulation management, merchandising, and distribution into newsagents and major supermarkets in Australia and New Zealand.
Deep market knowledge and 160 years experience
Established, strong retail relationships
Sales and market analysis
Bespoke predictive analytics
National merchandising solutions
Range and display management
Distribution solutions to multiple retail channels including newsagents, grocery chain, petrol/convenience and speciality outlets
Multi platform, global digital distribution solution.
Market Mailing House (NZ)
Domestic Publishers
International Publishers
International Distributors
Diverse category/product clients.
The largest independent distributor of print and digital magazines in Australia and New Zealand.

16 | PMP LIMITED Annual Report 2014 |
The Directors of PMP Limited (referred to as “PMP” or “Company”) submit their report and the company’s consolidated financial report for the year ending 30 June 2014 and the auditor’s report thereon.
1. DIRECTORS
The Directors of PMP in office during or since the end of the financial year are:
Matthew Bickford-Smith
Chairman Appointed 2 June 2009 Age 54
Mr Bickford-Smith has been a Non-Executive Director of PMP since 2009 and has been Chairman of the Board of Directors and Chairman of the Appointments and Compensation Committee since 2012. Mr Bickford-Smith is also a Director of Eastern Agricultural Australia, and until 1 June 2013 a Director of The Julian Burton Burns Trust.
Mr Bickford-Smith was previously CEO of Ridley Corporation Limited from 2000 to 2007. He was previously with the Man Group and was MD of the Australian operations from 1996 to 2000. Before moving to Australia Mr Bickford-Smith was based in Hong Kong with responsibility for managing risk relating to the Man Group’s sugar business within the region. Before moving to the Man Group he spent five years with Phibro, the commodity trading division of Salomon Brothers.
Anthony Cheong FCA (Singapore)
Non-Executive Director Appointed 4 March 2014 Age 59
Mr Cheong was appointed to the PMP Board of Directors by the Directors on 4 March 2014.
Mr Cheong is the Group Company Secretary of Fraser and Neave, Limited (“F&N”), which is the holding company of the Fraser and Neave Group (“F&N Group”) and Acting Chief Executive Officer of Times Publishing Limited (“TPL”). He joined the F&N Group in TPL as Corporate General Manager (Group Finance) and Company Secretary in 2001.
Mr Cheong has more than 25 years of varied financial and corporate experience in the packaging, property, printing, publishing, retail and education sectors. As the Group Company Secretary of F&N, he is responsible for the Corporate Secretarial, Internal Audit, Legal, Risk Management and Human Resources functions. He holds directorships in various F&N Group subsidiaries, associated and joint venture entities in ASEAN, Australia, United States and the United Kingdom. He is a Non-Executive Director of Fraser and Neave Holdings Berhad, a company listed on BURSA Malaysia (previously known as Kuala Lumpur Stock Exchange) and Frasers Centrepoint Asset Management Limited (the manager of Frasers Centrepoint Trust, listed on the Main Board of the Singapore Exchange).
He began his career with Ernst & Whinney in 1989 and, immediately prior to joining the F&N Group, was the Company Secretary of Carnaud Metalbox Asia Ltd, previously listed in Singapore.
Mr Cheong is a member of the Institute of Chartered Accountants of England and Wales and a Fellow of the Institute of Singapore Chartered Accountants.
Peter George B Com, LLB
CEO and Managing Director Appointed 22 October 2012 Age 61
Mr George is an experienced Executive and Non-Executive Director with an extensive background in telecommunications, media and corporate finance including four years on the Board of Australia’s second largest telecommunications carrier, Optus Communications.
Mr George is currently also a Non-Executive Director of Asciano Ltd. He was also Executive Director, Strategy and Policy Development Cable and Wireless Optus Ltd from 1998 to 2001, and the Executive Chairman of Nylex Limited 2006 to 2008.
Peter Margin BSc (Hons), MBA
Non-Executive Director Appointed 30 January 2012 Age 54
Mr Margin has a strong record of managing large Australian consumer food companies delivering operational efficiency, brand development and profitable growth having served amongst other things as the Chief Executive Officer and Managing Director of Goodman Fielder Ltd, and before that National Foods Ltd.
Mr Margin has been a Director of Bega Cheese Limited since June 2011, Nufarm Ltd since October 2011 and Ricegrowers Limited since September 2012.
Mr Margin is Chairman of the Audit and Risk Management Committee.
DIRECTORS’ REPORT FOR THE YEAR ENDED 30 JUNE 2014

| PMP LIMITED Annual Report 2014 | 17
Naseema Sparks BPharm, MBA, GAICD
Non-Executive Director Appointed 17 August 2010 Age 61
Ms Sparks is a professional Non-Executive Director specialising in e-commerce, digital and tech industries, media and marketing.
She has a background in strategic consulting, marketing, digital media and applications with over 20 years experience in the advertising industry.
She has held senior positions in leading agencies in Australia and UK, her most recent being Managing Director of M&C Saatchi.
Ms Sparks is currently a Director of Sydney Dance Company, and Independent Director of Melbourne IT and AIG. Ms Sparks is also Chairman of DealsDirect and Deputy Chairman of Racing NSW.
Ms Sparks was previously a Director of Shadforth Financial Group Ltd from May 2012 to August 2014.
Goh Sik Ngee B Eng(Hons), MSc, EMSF, BBM, PBM, PPA(P)
Non-Executive Director Appointed 17 August 2010 Completion 3 March 2014 Age 61
Mr Goh Sik Ngee was Chief Executive Officer of Times Publishing Limited, a wholly-owned subsidiary of Fraser and Neave, Limited (“F&N”), and on the Board of Fung Choi Media Group Ltd, a listed company on the Singapore Stock Exchange (“SGX”), until 2 October 2013. Mr Goh has 39 years of varied experience, including publishing, printing, retail and education. He held appointments at the helm of a number of organisations which included CEO of Yellow Pages (Singapore) Limited, a listed company on the SGX, and CEO of MediaCorp Publishing Pte Ltd. He started his career with the Ministry of Defence with the last appointment as Director of Manpower. He has been awarded several honours by the President of the Republic of Singapore in recognition of his contributions in Community Service and Civil Service.
2. DIRECTORS’ AND EXECUTIVES’ DISCLOSURES
The disclosures required for Director share holdings and Director and Executive remuneration are included within the Remuneration Report.
3. COMPANY SECRETARY – QUALIFICATIONS AND EXPERIENCE
Alistair Clarkson (B.Com, LLB, MBA, ACIS, GradDipACG).
Mr Alistair Clarkson was appointed Company Secretary of PMP Limited on 24 April 2009 and has been Company Secretary of PMP’s subsidiaries since December 2005.
Mr Clarkson holds a Bachelor of Commerce, a Bachelor of Laws, a Masters of Business Administration with Distinction and a post graduate diploma of Applied Corporate Governance. He is an associate of the Institute of Chartered Secretaries and a member of the Law Society of NSW.
As Company Secretary of PMP, Mr Clarkson is responsible for managing the Company’s corporate governance framework, its continuous disclosure and listing rule compliance and managing all matters relating to the Company’s Board of Directors and Board Committees.
Mr Clarkson has been Corporate Counsel for PMP since 2001 and General Counsel since 2009. Prior to joining PMP, Mr Clarkson was an associate at a law firm in New Zealand.
4. DIRECTORS’ MEETINGS
The number of Directors’ meetings (including meetings of Board Committees) and the number of meetings attended by each of the Directors of PMP during the financial year were:
Board of Directors Audit & Risk Management Appointment & Compensation
AttendedMaximum possible attended
AttendedMaximum possible attended
AttendedMaximum possible attended
M Bickford-Smith 11 11 5 5 5 5
P George 11 11 <a> <a> <a> <a>
A Cheong <b> 4 4 1 1 <a> <a>
P Margin 11 11 5 5 <a> <a>
Goh S N <c> 7 7 4 4 <a> <a>
N Sparks 10 11 <a> <a> 5 5 <a> Directors may attend Committee meetings but where not Committee members, their attendance is not recorded.
<b> A Cheong appointed Non-Executive Director on 04/03/2014.
<c> Goh S N retired as Non-Executive Director on 03/03/2014.

18 | PMP LIMITED Annual Report 2014 |
Recommendation Section Reference
Principle 1: Lay solid foundations for management and oversight
1.1 Companies should establish the functions reserved to the board and those delegated to senior executives and disclose those functions.
5.1
1.2 Companies should disclose the process for evaluating the performance of senior executives. 7.4
1.3 Companies should provide the following information in the corporate governance statement in the annual report:
whether a performance evaluation for senior executives has taken place in the reporting period and whether it was in accordance with the process disclosed; and
an explanation for any departure from Recommendations 1.1 to 1.3.
7.4
Principle 2: Structure the Board to add value
2.1 A majority of the board should be independent directors. 1
2.2 The chair should be an independent director. 1
2.3 1
2.4 The board should establish a nomination committee. This is called the Appointments and Compensation Committee
2.5 Companies should disclose the process for evaluating the performance of the board, its committees and individual directors.
5.1
2.6 Companies should provide the following information in the corporate governance statement in the annual report:
the skills, experience and expertise relevant to the position of director held by each director in 1
the names of the directors considered by the board to constitute independent directors and the company’s materiality thresholds used in determining a director’s independence;
1
the existence of any of the relationships listed as affecting independence status of directors, and an explanation of why the board considers a director to be independent notwithstanding the existence of these relationships;
5.1
a statement as to whether there is a procedure agreed by the board of directors to take independent professional advice at the expense of the company;
5.1
a statement as to the mix of skills and diversity for which the board of directors is looking to achieve in membership of the board;
5.1
1
the names of members of the nomination committee and their attendance at meetings of the committee, or where a company does not have a nomination committee, how the functions of a nomination committee are carried out; whether a performance evaluation for the board, its committees and directors has taken place in the reporting period and whether it was in accordance with the process disclosed; and
4
an explanation of any departures from Recommendations 2.1 to 2.6. —
Principle 3: Promote ethical and responsible decision making
3.1 Companies should establish a code of conduct and disclose the code or a summary of the code as to: 5.4
the practices necessary to take into account their legal obligations and the reasonable expectations of their stakeholders; and
the responsibility and accountability of individuals for reporting and investigating reports of unethical practices.
5. CORPORATE GOVERNANCE STATEMENT
PMP’s corporate governance is based on the belief that good governance practices are a critical prerequisite of a successful company and is intrinsically linked to creation of value. The core principles of good corporate governance that PMP has based its corporate governance framework on are:
PMP’s corporate governance framework is designed and implemented in accordance with best practice recommendations set by the ASX Governance Council’s Corporate Governance Principles and Recommendations (“ASX Principles”). The following table indicates where specific ASX principles are dealt within this Statement.

| PMP LIMITED Annual Report 2014 | 19
3.2 Companies should establish a policy concerning diversity and disclose the policy or a summary of that policy. The policy should include requirements for the board to establish measurable objectives for achieving gender diversity and for the board to assess annually both the objectives and progress in achieving them.
5.4
3.3 Companies should disclose in each annual report the measurable objectives for achieving gender diversity set by the board in accordance with the diversity policy and progress towards achieving them.
5.4
3.4 Companies should disclose in each annual report the proportion of women employees in the whole organisation, women in senior executive positions and women on the board.
5.4
3.5 Companies should provide an explanation of any departures from Recommendations 3.1 to 3.4 in the corporate governance statement in the annual report.
—
4.1. The board should establish an audit committee. 5.2
4.2. The audit committee should be structured so that it:
consists only of non-executive directors;
consists of a majority of independent directors;
is chaired by an independent chair, who is not chair of the board; and
has at least three members.
5.2
4.3. The audit committee should have a formal charter. 5.2
4.4. The following material should be included in the corporate governance statement in the annual report:
meetings of the committee, or, where a company does not have an audit committee, how the functions of an audit committee are carried out;
the number of meetings of the audit committee; and
explanation of any departures from Recommendations 4.1 to 4.4.
1, 4
—
Principle 5 - Make timely and balanced disclosures
5.1 Companies should establish written policies and procedures designed to ensure compliance with ASX Listing Rule disclosure requirements and to ensure accountability at a senior executive level for that compliance and disclose those policies or a summary of those policies.
5.4
5.2 Companies should provide an explanation of any departures from Recommendation 5.1 in the corporate governance statement in the annual report.
—
Principle 6 - Respect the rights of shareholders
6.1 Companies should design a communications policy for promoting effective communication with shareholders and encouraging their participation at general meetings and disclose their policy or a summary of that policy.
5.4
6.2. Companies should provide an explanation of any departure from Recommendation 6.1 in the corporate governance statement in the annual report.
—
Principle 7 - Recognise and manage risk
7.1 Companies should establish policies for the oversight and management of material business risks and disclose a summary of those policies.
5.3
7.2 The board should require management to design and implement the risk management and internal control system to manage the company’s material business risks and report to it on whether those risks are being managed effectively. The board should disclose that management has reported to it as to the effectiveness of the company’s management of its material business risks.
5.3
7.3
with section 295A of the Corporations Act is founded on a system of risk management and internal
reporting risks.
5.3
7.4 The following material should be included in the corporate governance statement in the annual report:
whether the board has received the report from management under Recommendation 7.2; and
explanation of any departures from Recommendations 7.1 to 7.4.
5.3
5.3
5.3 —

20 | PMP LIMITED Annual Report 2014 |
Principle 8 - Remunerate fairly and responsibly
8.1. The board should establish a remuneration committee. 5.2
8.2 The remuneration committee should be structured so that it:
consists of a majority of independent directors;
is chaired by an independent director; and
has at least three members.
5.2 only two members
8.3 The company should clearly distinguish the structure of non-executive directors’ remuneration from that of executive directors and senior executives.
7
8.4 The following material or a clear cross-reference to the location of the material should be included in the corporate governance statement in the annual report:
the names of the members of the remuneration committee and their attendance at the meetings of the committee or where a company does not have a remuneration committee, how the functions of a remuneration committee are carried out;
non-executive directors; and
an explanation of any departures from Recommendations 8.1 to 8.3.
4
4
7.3
—
5.1 BOARD OF DIRECTORS
Board
Directors are selected to achieve a broad range of skills, experience and expertise complimentary to the Group’s activities. Details of individual Directors are in section 1. The Board comprises five
Director and three other Non-Executive Directors.
The roles of Chairman and Chief Executive Officer are not exercised by the same individual.
PMP’s Board Charter sets out the role, responsibilities and powers of the Board of Directors and the Managing Director.
The company’s Board is responsible for:
monitoring systems of risk management, internal control, code of conduct and legal compliance, that are designed to ensure
ratifying the appointment and, where appropriate, the removal
The Managing Director, as CEO, is responsible for:
and general business and affairs
the Board in an accurate and timely manner.
The Board has set through the Delegation of Authority Policy specific limits to management’s ability to incur expenditure, enter into contracts or acquire or dispose of assets or businesses without Board approval.
The Charter requires that PMP’s Board must consist of a majority of independent Non-Executive Directors who have a broad range of commercial expertise and experience and/or appropriate professional qualifications. They must also demonstrate a proven ability and capacity to monitor company performance and participate in strategy development. Under the Charter, Directors are encouraged to own shares in PMP.
Board composition and membership
The Board (through the Appointments and Compensation Committee) seeks to ensure that the Board and its Committees continue to have the right balance of skills, knowledge qualifications, diversity and business experience necessary to direct the Company in accordance with high standards of corporate governance. The Board considers the skills, experience and expertise which they believe to be particularly relevant for that available position. In doing so the Board takes into account the existing collective capability of the Board, PMP’s strategy and the prevailing and expected market conditions.

| PMP LIMITED Annual Report 2014 | 21
The table below sets out some of the key skills of the Directors and the extent to which they are represented on the Board.
Name Skills and experience Board Audit and risk Committee
Appointments and compensation Committee
Matthew Bickford-Smith Manufacturing
Risk Management
x x x
Peter George Finance
Strategic Planing
Transformation
Telecommunications
Corporate Finance
x
Peter Margin Capital Management
Brand Development
x x
Naseema Sparks Digital Media
Marketing
x x
Anthony Cheong Publishing
Printing
Retail
x x
In respect of diversity on the Board, Directors strongly believe that differences in gender, age, ethnicity and cultural background in Board membership encourage diversity of thought and decision making. This will, in turn, drive and improve business efficiency and results for the company and shareholders.
Director retirement and re-election
The Constitution requires Directors to retire at the third AGM following the election or most recent re-election. The appointment of any new Directors will be based on the principle of further strengthening the diversified composition of the Board.
Board performance evaluation
The Appointments and Compensation Committee is responsible for, amongst other things, evaluating the performance of the Board and individual Directors. The Chairman continuously reviews and discusses with the Directors their and his contribution to the Board, but has determined not to use an external facilitator to undertake a performance assessment.
Board independence
The Board’s policy is that there should be a majority of independent Non-Executive Directors on the Board and this requirement is embodied in the Board Charter, ensuring that all Board discussions and decisions have the benefit of independent judgment.
The Board reviews the independence of the Directors before they are appointed, on an annual basis and at any other time where the circumstances of a Director changes such as to require reassessment. Such assessment is consistent with the ASX Corporate Governance Principles. The Board assesses materiality of any contractual relationship that may affect independence on a case-by-case basis. All Non-Executive Directors of PMP are considered independent with the exception of Mr Cheong, who is directly associated with Fraser & Neave Ltd, a substantial shareholder of the company.
Upon their appointment, Directors are requested to disclose to the Company any interest or directorships which they may hold with other organisations and to update this information if it changes during the course of their directorship. Directors and senior management are also required to identify any conflicts of interest they may have in dealing with PMP’s affairs and refrain, where required, from participating in any discussion or voting on those matters.
Chairman
The Chairman of the Board, Mr Matthew Bickford-Smith, is an independent Non-Executive Director. The Chairman is responsible for leadership and effective performance of the Board and the maintenance of productive relations between the Directors and the management team. The Chairman’s responsibilities are set out in more detail in the Board Charter.
Director appointment, training and continuing education
Each independent Non-Executive Director has signed a letter of appointment detailing the terms of their appointment, which sets out the key terms and conditions of their appointment, including duties, rights and responsibilities and the matters recommended in the ASX’s principles.
Induction training is provided to all new Directors. It includes an induction manual with information on the Company and its financial position, culture and values, company policies, rights and responsibilities of Directors and the role of the Board and management. The Board has regular discussions with the CEO and management and is invited to attend tours of PMP’s operational sites.
Directors are expected to maintain the skills required to discharge their obligations to the Company. PMP undertakes an ongoing program to keep Directors abreast of the nature of its business,

22 | PMP LIMITED Annual Report 2014 |
current issues and corporate strategy. Directors also have access to, and are encouraged to undertake, continuing education opportunities to update and enhance their skills and knowledge and have a strong working relationship with operational management.
Board access to information and independent advice
Subject to identification of any conflict of interest, Directors have direct access to senior executives as required and to any Company information in the possession of management it considers necessary to make informed decisions and to discharge its responsibilities.
All Directors have access to the Company Secretary who is accountable to the Board, through the Chairman. The Board must approve the appointment and removal of the Company Secretary.
Any Director can seek independent professional advice in the discharge of their duties and responsibilities to PMP. PMP will reimburse reasonable expenses incurred in obtaining this advice. Unless the Chairman determines otherwise, the advice will generally be circulated to the Board.
Board meetings
The Board and the Committees meet on a regular basis and additional meetings at call required to address specific issues. The Chairman, in conjunction with the CEO and the Company Secretary, sets the agenda for each meeting. Any Director may request matters to be included on the agenda.
Directors receive Board papers in advance of the Board meetings and these papers provide them with sufficient information to enable them to participate in informed discussion at each meeting. The Board’s practice is for Non-Executive Directors to meet regularly without the presence of management.
Details of Board and Committee meetings held during the 2014 financial year and attendance at those meetings are set out on pages 17, 22 and 23 of this Report.
5.2 BOARD COMMITTEES
Role, membership and charters
The Board has the ability under the Constitution to delegate its powers and responsibilities to Committees of the Board. This allows the Directors to spend additional and more focused time on specific issues.
The Board has established standing Committees to assist with the effective discharge of its duties, as follows:
Membership of the Committees is based on Directors’ qualifications, skills and experience.
Non-Committee members, including the CEO, attend Committee meetings by invitation.
Each Committee operates under a specific Charter approved by the Board, detailing its role, duties and membership requirements. The Board reviews the appropriateness of the existing Committee
structure, as well as the membership and Charter of each Committee.
Audit and Risk Management Committee*
MembersThe current members are:
Peter Margin (Chairman)
Matthew Bickford-Smith
Anthony Cheong
Attendance
Committee Member Meetings attended
M Bickford-Smith
A Cheong
Goh S N
Composition
The charter provides that the Committee must comprise:
who is not the Chairman of the Board.
Responsibilities
The Audit and Risk Management Committee provides assistance to the Board in relation to its corporate governance and oversight responsibilities by reviewing, assessing and making recommendations in relation to:
The Audit and Risk Management Committee has direct and unlimited access to the external auditors. The external and internal auditors and the Executive General Manager – OHSE & Risk have direct and unlimited access to the Audit and Risk Management Committee.

| PMP LIMITED Annual Report 2014 | 23
Appointments and Compensation Committee
MembersThe current members are:
Matthew Bickford-Smith
Naseema Sparks
Attendance
Committee Member Meetings attended
Naseema Sparks
Composition
The Charter provides that the Committee may only comprise Non-Executive Directors. Despite the recommendation in Recommendation 8.2, that the Committee is chaired by an independent chair and the committee has at least three members, the Chairman of the Board is also the Chairman of this Committee and the Committee only comprises two members. The Board believes with this structure the committee is of sufficient size and independence to discharge its mandate effectively. The committee’s members and their record of attendance in the last financial year are set out in section 4.
Responsibilities
PMP combines the roles and responsibilities of the Nomination Committee and the Remuneration Committee in its Appointments and Compensation Committee.
The Appointments and Compensation Committee has ultimate authority for executive remuneration policy. The Remuneration Report provides further detail on the role of the Committee in respect of compensation.
In relation to appointments, the Committee:
for appointing or removing Directors.
In relation to compensation, the Committee makes recommendations to the Board on:
The Committee is also responsible for evaluating potential candidates for executive positions, including the role of CEO, and overseeing the development of executive succession plans.
The CEO has the authority to employ and remunerate executives within the scope of the policy established by the Committee. In
carrying out its duties, the Committee is committed to providing sound remuneration policies and practices that enable PMP to:
into account the interests of shareholders, the Company’s performance, the performance of the relevant executive and market conditions.
In executing its responsibilities, the Committee has unlimited access to senior management. It also has the Board’s authority to seek information it requires from employees and external parties and obtain outside legal or other professional advice at the expense of PMP Limited.
5.3 RISK MANAGEMENT
PMP believes that shareholder value is driven by taking considered risks, and that effective risk management is fundamental to achieving strategic, operational and compliance objectives of PMP. PMP views risk management as a continuous process and a fundamental driver of effective corporate governance and value generation.
The Board is responsible for overseeing the implementation of an effective system of risk management and internal control. The responsibility for designing, implementing and maintaining a sound system of risk management and internal control has been delegated to management through the CEO.
The Audit and Risk Management committee assists the Board with its oversight responsibility by reviewing, assessing and making recommendations to the Board in relation to the risk management framework and internal control structures put in place by management.
In order to assist the CEO to oversee the implementation and effective operation of the systems of internal controls and risk management, the executive management team meets at least quarterly and formally reviews the material strategic, operational and compliance risks. Management is also responsible for completing, on a six monthly basis, the internal control
and attending Audit and Risk Management Committee meetings as required, to assist the committee in its oversight of risk.
PMP’s policy is to apply a common framework across all businesses to identify material risks and implement appropriate mitigation processes. To this end, PMP maintains a risk management framework that provides a consistent and systematic view of the risks faced by the company. The risk identification, analysis, treatment and monitoring procedures follow Risk Management Standard ISO: 31000 and Principle 7 of the ASX Principles.
Risk Management Framework
The risk management framework incorporates input from a range of existing systems, programs and policies including:

24 | PMP LIMITED Annual Report 2014 |
approval limits for operational and capital expenditure and
annual strategic planning cycle.
Management Representation
Detailed and comprehensive questionnaires are completed by all business units and functional management on a six monthly basis. These questionnaires include management’s assessment of risk management, financial reporting and the internal control environment operating within each business unit. The questionnaires are reviewed by executive management as part of the half-yearly reporting to the market and to achieve compliance with section 295A of the Corporations Act and Recommendation 7.3 of the ASX Principles.
Based on the questionnaires, the Board has received written assurance from the Chief Executive Officer and the Chief Financial Officer that, to the best of their knowledge and belief, the declaration provided to them is founded on a sound system of risk management and internal control and that the system is operating effectively in relation to financial reporting risks.
Internal audit
The internal audit function conducts a series of risk-based reviews based on a plan agreed with management, the internal auditors and the Audit and Risk Management Committee. In order to ensure the independence of the internal audit function, the Audit and Risk Management Committee review and endorse the planned internal audit activities. The internal audits are undertaken by an external firm of accountants. The risk management framework is periodically independently reviewed to provide assurance as to the adequacy of the framework.
Inherent Operational Risks
The company believes there are a number of operational risks which are inherent in the industry in which it operates. These include:
The identification of these risks is provided to assist stakeholders to understand the nature of risks faced by PMP and the industry in which it operates. It is not necessarily an exhaustive list.
Occupational health and safety regulation
The safety and security of our staff are of paramount importance to the Company. Staff and management continue to work to improve safety performance and to make a safer workplace. PMP has plans in place and continue to implement initiatives to drive improvement. The 2014 financial year saw the continuation of the SafetyMAP certification for the Company. During the year, the Lost Time Injury Frequency Rate has decreased from 9.5 to 6.3. Safety, health and environment policy and procedures have been enhanced to ensure the health, safety and welfare of workers underpin the Company’s safety management plans, and are in line with the prescribed requirements of the applicable health and safety legislation.
During the year PMP Print was charged with a safety violation in Victoria. The Victorian incident related to an injury to a maintenance employee who was employed by PMP Print in 2013. Gordon and Gotch is also expected to be sentenced on 7 October 2014 in relation to a contractor fatality that occurred in NSW in 2010. Board and management regret the impact both incidents have had on the individuals, their colleagues and families, and have reviewed and continue to monitor the practices required to ensure the incidents do not repeat.
Whilst recognising an improved Lost Time Injury Frequency Rate from previous years the Company has been designing a new reporting methodology to commence in the new fiscal year. This includes the move to a more inclusive reporting metric for injuries (significant injury frequency rate) and a focus on positive performance indicators. These changes are also being incorporated into the short term incentive program which will be implemented across all site managers and senior leadership roles in the company.
5.4 GOVERNANCE POLICIES
Code of Conduct
Code of Conduct* The Code of Conduct is PMP’s cornerstone corporate governance policy. The Code of Conduct provides a consistent understanding of the expected behaviour towards each stakeholder. It stipulates that:
or apparent conflicts of interest that could compromise the
including complying with laws and regulations of Australia and

| PMP LIMITED Annual Report 2014 | 25
negative impacts on the environment and the communities
for material items of concern between employees and the Board via open and non-hierarchical communications including whistleblower provisions.
Whistleblower Policy and Fraud and Corruption Prevention
Key elements of PMP’s whistleblower policy are as follows:
violations of the standards, requirements and expectations
or suspected violation of this Code of Conduct, the position of the reporting officer will be protected and remain confidential unless disclosure is required by law.
Trading in PMP Shares
Director and Executive Share Purchasing Policy* Under its share purchasing policy, PMP Directors and Executives are not permitted to buy and sell shares in the company when they are in possession of information that is not generally available and if it were available, it would - or would be likely to – influence investors in trading PMP shares, and they also may not trade in PMP shares during specific black-out periods. The black out periods are:
a. the period of 30 days immediately leading up to 31 December through to the day half year results are announced (including the
b. the period of 30 days immediately leading up to 30 June through to the day full year results are announced (including the day full
c. the period of 30 days immediately leading up to the Annual General Meeting (including the day of the Annual General Meeting).
The Board of PMP may also declare a black out period for a specified period at other times (such as prior to the announcement to the Australian Securities Exchange of a significant event such as change in control transaction or capital raising). At all other times these officers are permitted to trade in PMP shares.
Appropriate Communication and Disclosure
PMP recognises the importance of open and effective communication with all stakeholders. Therefore, PMP requires its officers and employees to act at all times with integrity and in accordance with the law, including the disclosure requirements of the ASX Listing Rules, ASX Principles and the Corporations Act. PMP has a Disclosure Committee comprising the Chief Executive Officer, Chief Financial Officer and Company Secretary/General
Counsel, which meet as and when required.
Disclosure and Shareholder Communication Policy*
PMP’s Disclosure Policy requires any price sensitive information concerning PMP to be disclosed to the market and to be communicated to the ASX before any other person. The policy prevents selective disclosure by:
release that has been previously channelled through the Chief Executive Officer.
It also sets out protocols for handling trading halts, responding to market speculation and avoiding inadvertent disclosure. The Policy ensures shareholders can make informed decisions about their investment in PMP by providing them with:
Diversity Policy*
Diversity Policy StatementPMP strives to provide industry leadership for workforce diversity by:
against inappropriate workplace and business behaviour that does not value diversity including discrimination, harassment, bullying, victimisation and vilification.
During the reporting period the company produced its public report to the Workplace Gender Equality Agency, a copy of which can be found on PMP’s website. As a diverse business, PMP employs a broad range of occupational groups to staff its creative, analytic, print and distribution businesses. Consequently PMP seeks to attract talent from different labour markets, trades and professions. PMP’s current gender profile reflects our reliance on trades and engineering for our print business and the associated lack of gender balance in that sector. Measureable objectives have not been set while recruitment and pay freezes are in place and the Company focuses on completing its transformation program.

26 | PMP LIMITED Annual Report 2014 |
The proportion of females employed in the Company under the following classifications is set out as follows:
Board of Directors 20%
PMP Executive Management Team 10%
25%
* Summaries of these documents are available in the Corporate Governance section of PMP Limited’s web site: www.pmplimited.com.au
6. Other Matters
6.1 REMUNERATION POLICY
The Group’s remuneration policies for Directors and management are detailed in the Remuneration Report included in this report. Non-Executive Directors’ fees are within the limits set by shareholders at the 2004 Annual General Meeting, and are set at levels which fairly represent the responsibilities of, and time spent by, the Non-Executive Directors on Group matters.
6.2 PRINCIPAL ACTIVITIES
The principal activities of the PMP Group are commercial printing, digital premedia, letterbox delivery, and magazine distribution services.
6.3 RESULTS
The consolidated result after income tax of the PMP Group for the financial year ended 30 June 2014 was a $3.4 million profit (2013: $70.2 million loss).
6.4 DIVIDENDS
No dividends were paid or declared to members during the financial year.
2014 2013
$000’s $000’s
No dividends were declared or paid during the — —
— —
6.5 REVIEW OF OPERATIONS
For a full report on operations for the FY14 year, see the Chief Executive Officer’s Review on pages 6 to 14 of this Annual Report.
In summary, FY14 EBIT (before significant items) fell by $5.0M or 14.7% to $28.8M compared to $33.8M in the prior year due in part to $4.1 million of higher property rental expense associated with the property sale and leaseback. This was in the upper end of market guidance while net profit after tax (before significant items) for FY14 fell 17.8% to $11.8M ($14.3M in FY13). Balances for the prior year have been restated due to the adoption by PMP on 1 July 2013 of AASB 119 Employee Benefits (revised). Prior year EBIT of $34.4M was restated down by $0.6M to $33.8M and net profit after tax (before significant items) of $14.8M was restated down to
$14.3M. Cash interest paid fell $6.5M from $18.0M to $11.5M.
The third phase of transformation has been undertaken resulting in a broad range of restructures and cost reduction programmes across the company with savings at Gordon & Gotch, Griffin Press, PMP New Zealand, PMP Australia and the Corporate functions.
As such, PMP has now reduced its cost base, reduced the financial risk with lower debt and will now continue to focus on making the company more competitive especially across Print and Distribution.
PMP Australia’s EBIT (before significant items) was down from $30.6M last year to $20.9M in fiscal 2014. While we were successful in growing the Distribution business with a 10% increase in volumes, Print had another tough year. We signed new cross sell contracts however, this was offset by anticipated lower Directory volumes down 72% in metro and regional print volumes.
Following the closure of the Chullora site the remaining programme was successfully transitioned to our Moorebank site.
Heatset sell prices remained very competitive in a softer retail market with catalogue volumes 3% lower pcp, while book printing at Griffin Press had a good year retaining existing contracts and winning new business. The phase 3 transformation savings and lower lease costs at Chullora and Digital were partially offset by $4.1M of additional property rental expense.
Gordon & Gotch EBIT (pre significant items) of $3.4M was $2.3M higher pcp as benefits from further cost restructuring more than offset the impact of lower volumes (down 5.3% pcp).
PMP New Zealand EBIT (pre significant items) of $9.9M was up year on year. Tough Heatset market conditions continued with lower sell prices but this was largely offset by higher Distribution activity, improved sheet-fed sales and further focus on cost controls, input costs and additional transformation around the sheet-fed business in Auckland.
The Board has set down a clear strategy and the disciplined execution of this strategy is delivering benefits. The company’s Transformation Plan Phase 3 has delivered $16.4M of annualised savings with a full year cash cost of $11.2M.
EBITDA margin (before significant items) has fallen slightly to 7.1% compared to 7.3% in prior year, while Free Cash Flow increased to $44.0M compared to $27.5M in FY13.
Net debt reduced to $51.7M, down by 42% compared to FY13 and the company’s net debt to EBITDA (before significant items) was 0.8 times, down from 1.2 times in the prior year.
6.6 SIGNIFICANT CHANGES IN THE STATE OF AFFAIRS
In October 2013, the company announced the issue of an unsecured $50 million corporate bond. The bond has a fixed coupon of 8.75% per annum and a four year term. The proceeds were used to pay down bank debt, diversify funding sources and increase the tenure of the company’s debt.
The final element of the company’s Australian property sale and lease back program was completed in February with the sale of the remaining portion of the Clayton site in Victoria, receiving net

| PMP LIMITED Annual Report 2014 | 27
proceeds of $7.6M which generated a profit on sale of $4.0M.
6.7 RISKS, LIKELY DEVELOPMENTS AND FUTURE PROSPECTS
PMP’s business segments are in printing and distribution of publications including catalogues, magazines, books, and directories. PMP’s long term profitability and cash flows are responsive to domestic economic conditions in Australia and New Zealand. For example, catalogue printing and distribution is driven by consumer confidence and retailer activity and the printing of these publications are all influenced by user migration to electronic information platforms.
As noted under Inherent Operational Risks on page 24, the company believes there are a number of operational risks which are inherent in the industry in which it operates. These include
company’s reliance on the continuity of supply from utilities and the
and ongoing weak consumer confidence.
Catalogue printing and distribution make up the majority of PMP’s earnings and recent experience indicates that retailers are using an integrated advertising approach where online media and traditional media are combined for greater effect. However, the company expects that the current challenging market conditions will continue with cyclical weakness in consumer spending, pagination and volumes.
In response to this the company has transformed its cost base to recognise the new revenue realities. It has reduced financial risk by prioritizing strong free cash flow to reduce debt in order to build a more competitive PMP.
Overall the core print industry has been progressively shrinking for a number of years and the company expects that the industry will undergo rationalisation before achieving equilibrium, however in the meantime the impacts of overcapacity will continue to be felt. The company will investigate opportunities to participate in any industry rationalisation and will develop strategies to become retail specialists delivering content to mass market through multiple channels.
During fiscal 2015, it is expected a further phase of transformation will take place and it will not be as material as earlier stages. It will look to achieve efficiencies from a range of measures that include process simplification and benefits from system upgrades.
6.8 ENVIRONMENTAL REGULATION PERFORMANCE
PMP is committed to conducting its business activities with respect for the environment, while continuing to meet its obligations to its shareholders, employees, customers and suppliers. PMP believes its operations are in compliance with all environmental regulations to the extent material to its financial position or results of its continuing operations. As of the date of this report, there were no material legal proceedings concerning environmental matters pending against PMP or against any of its properties.
PMP completed the required Australian Federal Government Environmental Indicators Survey, National Pollution Inventory and the Energy Efficiency Opportunities reports.
6.9 SHARE ISSUES
There were no shares issued during the year ended 30 June 2014.
6.10 SHARE RIGHTS
The names of the persons who currently hold rights are entered in the register of rights kept by the Company pursuant to Section 168 of the Corporations Act 2001. Pursuant to an Australian Securities and Investments Commission Class Order, the Directors have taken advantage of relief available from the requirement to disclose the names of executives not being Directors (other than the key management personnel executives of the Group) to whom rights are issued, and the number of rights issued to each person.
6.11 NON-AUDIT SERVICES
The Audit and Risk Management Committee reviewed the non-audit services provided by Deloitte Touche Tohmatsu. These non-audit services include taxation compliance and consulting services. The following non-audit services were provided during the 12 months to 30 June 2014:
Australia New Zealand
Description of non-audit services <a> $ $
- Consulting services — —
- Taxation and related advisory services 72,275 73,916
72,275 73,916
In accordance with advice provided by the Audit and Risk Management Committee, the Directors are satisfied that – based on the approval procedures required for the external auditors to provide non-audit services to PMP and from a review of actual services provided – the non-audit services provided by Deloitte Touche Tohmatsu met the standards of independence.
6.12 AUDITOR’S INDEPENDENCE DECLARATION
In accordance with the Audit Independence requirements of the Corporations Act 2001, the Directors have received and are satisfied with the “Audit Independence Declaration” provided by the PMP Group external auditors, Deloitte Touche Tohmatsu. The Audit Independence Declaration has been attached to the Directors’ Report on page 39.
6.13 DIRECTORS’ AND OFFICERS’ LIABILITY INSURANCE AND INDEMNITY
PMP has liability insurance policies for all Directors and Officers of the PMP Group.
The policy agreement prohibits disclosure of the policy terms and the premium paid. Directors and Officers are also indemnified by the company against all liabilities to another person (other than

28 | PMP LIMITED Annual Report 2014 |
PMP or a related body corporate) that may arise from their position as Directors or Officers of PMP and the PMP Group. The insurance cover and indemnity is not applicable where the liability arises out of conduct involving a lack of good faith.
6.14 SIGNIFICANT EVENTS AFTER BALANCE DATE
The Directors are not aware of any matter or circumstance post balance date not otherwise dealt with in this report or the consolidated financial statements that has significantly affected or may significantly affect the operations of the PMP Group, the results of those operations or the state of affairs of the Group in subsequent years.
6.15 ROUNDING OF AMOUNTS
Pursuant to class order 98/0100 made by the Australian Securities and Investments Commission, the Company has rounded amounts in this report and the accompanying financial statements to the nearest thousand dollars unless specifically stated to be otherwise.
7. Remuneration Report
7.1 COVERAGE
This remuneration report outlines the Director and executive remuneration arrangements in accordance with the requirements of the Corporations Act 2001 and its Regulations. It covers the Directors of PMP, including the Chief Executive Officer (CEO), and other key management personnel with the authority and responsibility for planning, directing and controlling the activities of PMP. The report also contains information about the broader remuneration practices applying to management below the executive level.
7.2 REMUNERATION PRINCIPLES
PMP’s Remuneration Policy provides a direct link between remuneration and corporate performance by:
remuneration.
The Board also recognises that, although remuneration is a major factor in recruiting and retaining talented and effective people, other factors play a substantial role in attracting suitable candidates, including: PMP’s business operations, corporate reputation, ethical culture and other human resources’ policies and practices.
Combined with its policies, PMP’s remuneration principles ensure that:
benchmarked against the market for comparative roles in similar
personnel include an at risk variable component that is developed
Current standard performance criterion includes: Earnings
that align personal behaviours and professional development with the overall goals of the company.
7.3 REMUNERATION STRUCTURE
The roles and responsibilities of the Remuneration Committee are discussed on page 23. The Board believes well designed and managed short and long term incentive plans are important elements of employee remuneration, providing tangible incentives for employees to strive to improve PMP’s short term and long term performance, and giving them a common interest with shareholders.
The three tiers of the structure are:
rights plan (LTI), which usually pertain to the senior leadership.
This three-tier structure results in management having more of their total remuneration and reward package at risk, linked to individual performance and business results and, in the case of longer term incentives, to the long term performance of the company.
To ensure executives are sufficiently motivated and aligned with PMP company performance objectives, executives are expected to have at least 25% of their maximum potential remuneration at risk.
Base salary
PMP generally sets salaries based on a classification structure which is referenced to the market median, while also allowing flexibility from this reference point where it is warranted by individual performance levels. The remuneration structure is managed by the Human Resources function leveraging tools such as: job evaluation, career level benchmarking and salary reviews. PMP’s remuneration system allows flexible packaging of benefits via salary sacrifice at no additional Total Employment Cost (TEC) to the company.
Superannuation
PMP complies with all relevant statutory superannuation obligations to its employees. The standard company superannuation plan is

| PMP LIMITED Annual Report 2014 | 29
primarily an accumulation plan, providing a lump sum benefit equal to the balance of a member’s account, which includes contributions made by the member and the relevant PMP group entity, together with net fund earnings.
Relevant superannuation contributions for all senior executives form part of the executive’s total remuneration package. All such amounts are included in the fixed remuneration disclosed for the CEO and members of the senior executive team in this report.
PMP does not provide senior executives or Directors with benefits such as life insurance, vehicle allowance, club memberships or retirement benefits other than the superannuation benefits previously discussed.
Variable remuneration
PMP links all variable remuneration to performance. The proportion of variable remuneration increases with job responsibility, with senior executives having a greater proportion of their remuneration at risk.
Short term incentives - STIs
The STI plan applies to key middle and senior personnel roles, directly linking variable remuneration to PMP’s corporate strategy.
The employee’s STI percentage is the maximum amount that will be paid for achieving performance goals. Results above the target goal will not increase the incentive payment above the STI percentage, unless authorised by the CEO. As a general rule, no discretionary bonuses outside the STI program will be approved. Proposals for discretionary bonuses outside the STI program must be authorised by the CEO.
STI entitlements are formalised after the end of year accounts have been finalised and paid in September. STI payments to the CEO and other specified executives satisfying the definition of Key Management Personnel are disclosed in this report.
Target achieved Percentage of STI target achieved
Percentage of base
TEC achieved
EMT Other (EMT example)
Below threshold None None —
Target 100% 100% 25%
Exceptional CEO discretion CEO discretion
Table 1. STI percentages.
STIs - Performance conditions
PMP’s primary measure for STIs is EBIT - Earnings Before Interest and tax (before significant items) - a commonly used financial indicator of operating performance. Other non-financial performance conditions focus management and executive activities on operating performance and employee safety and align individual behaviours with company strategy. Non-financial performance criteria of executives are set by the CEO in consultation with the Appointments and Compensation Committee.
Long term incentives – LTIs
The LTI plan aligns an element of executive rewards with the creation of shareholder wealth. LTIs apply to executive managers with the greatest authority and most strategic influence over PMP’s direction, profitability and growth.
Under the LTI plan, participants are granted performance rights, which entitle them to receive PMP shares after a vesting period, if the performance conditions are satisfied. The rights are granted annually (following the announcement of the Group’s results) to each participant to the value of between 25% and 50% of that person’s TEC. The number of rights granted is based on the Company’s weighted average share price for the one week period up to and including the grant date. These rights only vest if the Group achieves the long-term performance conditions detailed in [Table 3].
The Executive Share Purchasing Policy prohibits executives from hedging pre-vested awards under the LTI plan.
2014 Fixed annual remuneration <a>
STI <a> Total Performance related remuneration
$ $ $ %
P George CEO and MD <b> 600,000 421,000 1,021,000 41%
J Nichols 377,319 133,500 510,819 26%
G Stephenson 475,000 166,488 641,488 26%
P Trainor <c> 103,860 36,130 139,990 26%
Table 2. Take home pay of the Executive Director and continuing Executives for the year ended 30 June 2014.
<a> Fixed annual remuneration based on current gross salary package, which includes base salary, annual leave, superannuation contributions and the

30 | PMP LIMITED Annual Report 2014 |
Ref Rights Performance Hurdles Assessment Method Vesting
A Rights - $0
EMT and Senior Managers
Issued 01 Oct 09
Expiry 31 Aug 14
50% of Rights granted are to be subject to each hurdle.
Will be determined on TSR and ROCE result for FY10, FY11 and FY12.
0% vested on 27 Aug 12
Total Shareholder Return
exceeds the change in the ASX All Ordinaries Accumulation Index over the
become exercisable.
Return on Capital Employed hurdle
ROCE over the performance period is at least equal to the target average ROCE set by the Board on commencement of the Performance Period.
The target ROCE is the greater of the average budgeted ROCE or the average weighted average cost of capital over the performance period.
The Board retains discretion to include/exclude from the calculation of ROCE, items which the Board considers are, for example, unusual or non-recurring.
B Rights - $0
EMT and Senior Managers
Issued 01 Oct 10
Expiry 31 Aug 15
50% of Rights granted are to be subject to each hurdle.
Will be determined on TSR and ROCE result for FY11, FY12 and FY13.
0% vested on 28 Aug 13
Total Shareholder Return
exceeds the change in the ASX All Ordinaries Accumulation Index over the
become exercisable.
Return on Capital Employed hurdle detail as in “B” above.
C Rights - $0
EMT and Senior Managers
Issued 01 Oct 11
Expiry 31 Aug 16
50% of Rights granted are to be subject to each hurdle.
Will be determined on TSR and EBITDA result for FY12, FY13 and FY14.
N/A
Total Shareholder Return
measured against a comparator group of ASX listed companies ranked between S&P/ASX 200 to 300 entities. If a rank of less than the 51st percentile is achieved nil vest, if a rank of between the 51st and if a rank of between the 51st and 75th percentile is achieved75th percentile is achieved 50-100% of rights vest and if a rank of greater than 75th percentile is achieved 100% vest.
EBITDA
14 is measured against a target for the PMP Group. The number of rights to vest are pro rated based on a target EBTIDA range.
The Board retains discretion to exclude from the calculation
restructuring costs or rationalisations..
D Rights - $0
CEO/MD, EMT and Senior Managers
Issued 01 Oct 12
Expiry 31 Aug 17
50% of Rights granted are to be subject to each hurdle.
Will be determined on TSR and EBITDA result for FY13, FY14 and FY15.
N/A
Total Shareholder Return
measured against a comparator group of ASX listed companies ranked between S&P/ASX 200 to 300 entities. If a rank of less than the 51st percentile is achieved nil vest, if a rank of between the 51st and if a rank of between the 51st and 75th percentile is achieved 75th percentile is achieved 50-100% of rights vest and if a rank of greater than 75th percentile is achieved 100% vest.
EBITDA
15 is measured against a target for the PMP Group. The number of rights to vest are pro rated based on a target EBTIDA range.
The Board retains discretion to exclude from the calculation
restructuring costs or rationalisations.
E Rights - $0
EMT and Senior Managers
Issued 01 Oct 13
Expiry 31 Aug 18
50% of Rights granted are to be subject to each hurdle.
Will be determined on TSR and EBITDA result for FY14, FY15 and FY16.
N/A
Total Shareholder Return
measured against a comparator group of ASX listed companies ranked between S&P/ASX 200 to 300 entities. If a rank of less than the 51st percentile is achieved nil vest, if a rank of between the 51st and if a rank of between the 51st and 75th percentile is achieved 75th percentile is achieved 50-100% of rights vest and if a rank of greater than 75th percentile is achieved 100% vest.
EBITDA
16 is measured against a target for the PMP Group. The number of rights to vest are pro rated based on a target EBTIDA range.
The Board retains discretion as per details in “A” above.
Table 3. LTI Performance Hurdles and Assessment Methods

| PMP LIMITED Annual Report 2014 | 31
LTIs - Performance conditions
[Table 3] summarises the Key Management Personnel LTIs, including their performance conditions and achievement assessment methods.
7.4 SENIOR EXECUTIVE PERFORMANCE EVALUATION
PMP rewards executives for performance. At the beginning of the financial year, the CEO sets objectives for each direct report. This includes corporate goals (such as EBIT excluding significant items, and safety), and personal objectives, including activities
to drive the development of business opportunities across the Group. The CEO reviews performance against objectives during the year and at the financial year-end the outcomes are used to determine overall performance and STI payments. The CEO provides recommendations to the Appointments and Compensation Committee in relation to the STI payments and the performance of the executives in relation to these payments for the Committee to ratify. This was undertaken at the August 2014 Appointments and Compensation Committee meeting.
Table 4a. PMP Share Price Performance against ASX All Ords Index.
July 09 July 10 July 11 July 12 July 13 July 14
Perc
enta
ge ch
ange
(%)
300 -
250 -
200 -
150 -
100 -
50 -
0 - - - - - - -
July 09 July 10 July 11 July 12 July 13 July 14
- - - - - -
Table 4b. PMP Actual Share Price performance.
1.20 -
1.00 -
0.80 -
0.60 -
0.40 -
0.20 -
0.00-
Shar
e pr
ice (c
ents
)
7.6 COMPANY PERFORMANCE
Tables 4a and 4b show PMP’s performance over the last five years with regard to earnings and shareholder returns.
ASX All Ordinaries
PMP
Earnings performance indicators 2010 2011 2012 2013 2014
cents 6.2 1.0
cents 6.1 1.0
Dividend per share cents <a> 1.0 <b> 1.0 <c> 1.0 — —
External sales revenue A$ mill 1,212.1 1,194.3 1,093.9 975.8 899.2
A$ mill 52.2 56.7 32.7 34.4 28.8
Table 4c. PMP earnings performance indicators.
<a> Final dividend FY10, paid FY11.
<b> Final dividend FY11, paid FY12.
<c> 1.0 cent interim FY12 dividend, paid FY12

32 | PMP LIMITED Annual Report 2014 |
7.7 CHIEF EXECUTIVE OFFICER
The following section details the remuneration arrangement for Mr Peter George, the CEO of PMP.
Employment contract
Mr Peter George is employed under a 3 year contract which expires on 22 October 2015. The Company may terminate Mr Peter George’s employment with the Company or Mr Peter George may cease his employment by giving not less than six months notice. Where there is significant and material adverse change to Mr Peter George’s duties or responsibilities or there is a change of control either Mr Peter George or the Company may terminate Mr Peter George’s employment with the Company by paying to Mr Peter George a sum equal to the remuneration plus any STI payment made or due to be made in respect of the prior financial year.
Summary of remuneration structure
Fixed Remuneration:Base salary including superannuation is $600,000 per annum.
Short Term Incentive:Mr Peter George has an STI of up to 100% of his fixed remuneration for the 2013/14 financial year, dependent on achieving a number of targets including EBIT and safety:
Personal objectives (between 10% - 20% of STI)
Any STI achieved will be paid 66.7% in cash and 33.3% in PMP shares. The number of shares acquired as a result of achievement of this STI is dependent upon the share price at the time of the acquisition as the STI dollar value is fixed. The PMP shares will be purchased on market and will not vest with Mr Peter George until 12 months after the year end to which they relate.
Long Term Incentive:After shareholder approval at the 2013 Annual General Meeting Mr Peter George was awarded performance rights under the PMP Long Term Incentive Plan to acquire fully paid ordinary shares in the Company with the performance rights being tested against the performance hurdles following the performance period ending 30 June 2015. The maximum number of share rights awarded to Mr Peter George as his LTI was 2,100,000.
The share rights offered to Mr Peter George are split evenly amongst two categories of performance hurdles and will vest subject to the achievement of those hurdles. The first performance hurdle compares PMP’s Total Shareholder Return (‘TSR’) measured against a comparator group consisting primarily of ASX listed entities that are ranked between S&P/ASX 200 – ASX 300 (excluding entities in the metals and mining and materials indexes). The period over which the TSR performance condition is measured is the three year period commencing 1 July 2012. The number of rights that vest is based on rank. Nil rights vest if a rank of less than the 51st percentile is achieved. 50% – 100% of the rights vest if a
rank between the 51st and 75th percentile is achieved. The second performance hurdle is an internal hurdle and is based on PMP achieving target earnings before interest, tax, depreciation and amortisation (EBITDA) at the end of a three year period ending on 30 June 2015.
All rights held by the CEO are disclosed in Table 10.
Remuneration summary
The remuneration paid to Mr Peter George for the year ended 30 June 2014 is set out in the table below:
Salary Component 2014
- Base Salary $549,199
- Superannuation $50,801
- LSL $ —
- STI: Cash $280,807
- STI: Shares $140,193
- LTI <a> $79,200
Total $1,100,200
Fixed annual remuneration including superannuation of $600,000.
non-market conditions associated with these rights were not taken into
period.

| PMP LIMITED Annual Report 2014 | 33
7.8 KEY MANAGEMENT PERSONNEL (OTHER THAN NON-EXECUTIVE DIRECTORS)
PMP’s Key Management Personnel during the financial year are: <a>
P George
J Nichols
G Stephenson
P Trainor <b>
Employment contracts
PMP does not include termination or severance payments for PMP executives in their employment contracts other than agreed notice provisions and the application of the PMP redundancy policy (where applicable).
Name Notice Period PMP Notice Period Employee Termination Payments
J Nichols 3 Months 3 Months
G Stephenson 6 Months 6 Months
P Trainor 6 Months 6 Months
Table 6. Executive Employment Contracts
Remuneration
The table below outlines the remuneration packages of key management personnel (excluding Non-Executive Directors).
All rights are valued in accordance with AASB 2 which have been independently valued in accordance with the Binomial Option Pricing Model or the Monte Carlo Simulation Model. The value of rights awarded to executives during the year are disclosed in Table 8 in the column headed “Actual LTI”. This value is based on the intrinsic value of rights on vesting date.
Key management personnel Short term Post Employment
Superannuation
Long Term
LSL
Total excluding
rights
Equity rights
(m)
Grand total
Rights as a
percentage of total
remuneration
Salary STI
$ $ $ $ $ $ $ %
P George 2014 549,199 421,000 50,801 — 1,021,000 79,200 1,100,200 7%
<a> 2013 550,459 511,170 49,541 — 1,111,170 59,400 1,170,570 5%
J Nichols 2014 347,826 133,500 29,493 5,762 516,581 108,731 625,312 17%
<b> 2013 302,694 161,870 27,242 6,047 497,853 33,589 531,442 6%
G Stephenson 2014 457,225 166,488 17,775 — 641,488 156,806 798,294 20%
2013 436,921 202,338 16,470 — 655,729 63,425 719,154 9%
P Trainor <c> 2014 103,860 36,130 — — 139,990 10,971 150,961 7%
Total Remuneration KMP: 2014 1,458,110 757,118 98,069 5,762 2,319,058 355,708 2,674,766
2013 1,290,074 875,378 93,253 6,047 2,264,752 156,414 2,421,166
Table 7. Key management personnel remuneration of the company and the group

34 | PMP LIMITED Annual Report 2014 |
Fixed annual remuneration
Maximum STI
Actual STI
Actual STI percentage
of maximum STI
Maximum LTI
Actual LTI
Actual LTI percentage
of maximum LTI
Maximum potential
reward
Actual reward
At risk remuneration (of potential
total)
<f> <a> <c> <d><e> <e> <b> <b>
$ $ $ % $ $ % $ $ %
P George <g> 600,000 600,000 421,000 70 79,200 — — 1,279,200 1,021,000 53%
J Nichols 377,319 190,000 133,500 70 108,731 — — 676,050 510,819 44%
G Stephenson 475,000 237,500 166,488 70 199,435 — — 911,935 641,488 48%
P Trainor <h> 103,860 51,930 36,130 70 10,971 — — 166,760 139,990 38%
Table 8. Key management personnel achievement of performance hurdles
independently valued.
between the share price and exercise price on the date exercised.
accrued accounting value.
goals are at CEO discretion.
during the year.

| PMP LIMITED Annual Report 2014 | 35
Share rights
The table below shows share rights granted and vested to key management personnel during the year. No Directors (excluding P George) were granted or hold rights over shares of PMP Limited.
Terms & Conditions for each grant of share rights during the year ending 30 June 2014 30 June 2014
Granted number
Grant date
Value per right at
grant date $
Exercise price
per share $
First exercise
date
Last exercise
date
Vested Number
P George — — — — — — —
C Amos 229,412 10/1/2013 <a> N/A <b> 8/31/2018 Nil
A Clarkson 420,588 10/1/2013 <a> N/A <b> 8/31/2018 Nil
D Hogan 202,206 10/1/2013 <a> N/A <b> 8/31/2018 Nil
J Nichols 558,824 10/1/2013 <a> N/A <b> 8/31/2018 Nil
G Stephenson 698,529 10/1/2013 <a> N/A <b> 8/31/2018 Nil
Total 2,109,559 Nil
Terms & Conditions for each grant of share rights during the year ending 30 June 2013 30 June 2013
Granted number
Grant date
Value per right at
grant date $
Exercise price
per share $
First exercise
date
Last exercise
date
Vested Number
P George <e> 2,100,000 10/1/2012 <c> N/A <d> 8/31/2017 Nil
C Amos 975,000 10/1/2012 <c> N/A <d> 8/31/2017 Nil
A Clarkson 893,750 10/1/2012 <c> N/A <d> 8/31/2017 Nil
J Nichols 1,187,500 10/1/2012 <c> N/A <d> 8/31/2017 Nil
G Stephenson 1,328,125 10/1/2012 <c> N/A <d> 8/31/2017 Nil
Total 6,484,375 Nil
Table 9. Top 5 remunerated personnel rights granted

36 | PMP LIMITED Annual Report 2014 |
Balance 1-Jul 2013
Granted as Remuneration
Rights Exercised
Rights Lapsed
Rights Cancelled
Other Balance 30-Jun
2014
Not Exercisable
Value at exercise
date
Share Price at
Lapse Date
Value at
Lapse Date
$ $ $
2014 <a> <e>
P George 2,100,000 — — — — — 2,100,000 2,100,000 — — —
J Nichols 1,187,500 558,824 — — — — 1,746,324 1,746,324 — — —
G Stephenson 1,915,625 698,529 — — — 2,339,154 2,339,154 — 0.34 93,500
P Trainor <b> — 95,875 — — — — 95,875 95,875 — — —
Total 5,203,125 1,353,228 — — — 6,281,353 6,281,353 — — 93,500
Balance 1-Jul 2012
Granted as Remuneration
Rights Exercised
Rights Lapsed
Rights Cancelled
Other Balance 30-Jun
2013
Not Exercisable
Value at exercise
date
Share Price at
Lapse Date
Value at
Lapse Date
$ $ $
2013 <a>
P George <c> — 2,100,000 — — — — 2,100,000 2,100,000 — — —
J Nichols <d> — 1,187,500 — — — — 1,187,500 1,187,500 — — —
G Stephenson 707,783 1,328,125 — — — 1,915,625 1,915,625 — 0.28 33,679
Total 707,783 4,615,625 — — — 5,203,125 5,203,125 — — 33,679
Table 10. Rights holdings key management personnel
nil). have been recorded with shareholder approval Prior to this, he commenced employment with
<e> Volume weighted average share price on 01/10/13.
2014 Balance 1 July 2013
On Exercise of Rights
Purchases Sales Other Balance 30 June 2014
Directors
M Bickford-Smith 200,000 — — — — 200,000
P George <a> 92,619 — — — 499,004 591,623
A Cheong <b> — — — — — —
Goh S N <c> — — — — — —
P Margin 49,900 — — — — 49,900
N Sparks — — — — — —
Total 342,519 — — — 499,004 841,523
Executives
J Nichols — — — — — —
G Stephenson 50,000 — — — — 50,000
P Trainor <d> — — — — — —
Total 50,000 — — — — 50,000
Table 11. Shareholdings of Directors and key management personnel
<b> Appointed 04/03/14.

| PMP LIMITED Annual Report 2014 | 37
7.9 NON-EXECUTIVE DIRECTOR REMUNERATION
The remuneration of Non-Executive Directors is determined by the full Board, within a maximum amount approved by shareholders in a general meeting and with regard to the level of fees paid to Non-Executive Directors by other companies of similar size.
The maximum allowance for the aggregate amount of fees has remained unchanged since 2004 at $750,000 per annum. In the last financial year, the Board paid $536,050 of this amount for Non-Executive Director remuneration - as shown in Table 12.
Non-Executive Directors are not entitled to retirement benefits other than statutory superannuation or other statutory required benefits. Director fees (excluding superannuation) are comprised as follows:
Chairman of the Board $170,550
Non-Executive Director $75,000
Chair of Audit and Risk Management Committee $20,000
Member of Audit and Risk Management Committee $12,000
Chair of Appointments and Compensation Committee $13,000
Member of Appointments and Compensation Committee
$8,000
Statutory superannuation 9.25%
There is no element of Non-Executive Director salaries contingent on performance.
7.10 PERFORMANCE ASSESSMENT
In view of the size of the Board the Chairman continuously evaluates Board and Director performance on a one-on-one basis.
7.11 RETIREMENT BENEFITS
Non-Executive Directors receive cash remuneration plus statutory superannuation contributions only.

38 | PMP LIMITED Annual Report 2014 |
Salary & Fees
STI Share Purchases
Post Employment
Superannuation
Long term Employment
LSL
Total excluding
share-based
Equity Share-based
Grand Total
$ $ $ $ $ $ $ $
M Bickford-Smith 2014 195,550 — — 18,088 — 213,638 — 213,638
<a> 2013 157,909 — — 14,212 — 172,121 — 172,121
A Cheong <b> 2014 28,655 — — — — 28,655 — 28,655
I L Fraser <c> 2013 76,063 — — 6,846 — 82,909 — 82,909
Goh S N <d> 2014 58,345 — — 3,342 — 61,687 — 61,687
<e> 2013 87,000 — — — — 87,000 — 87,000
P Margin 2014 95,000 8,788 — 103,788 — 103,788
2013 95,000 8,550 — 103,550 — 103,550
N Sparks 2014 83,000 — — 7,678 — 90,678 — 90,678
2013 83,000 — — 7,470 — 90,470 — 90,470
Total Remuneration:
- Non-Executive Directors 2014 460,550 — — 37,895 — 498,445 — 498,445
2013 498,972 — — 37,078 — 536,050 — 536,050
2014 549,199 421,000 — 50,801 — 1,021,000 79,200 1,100,200
<f> 2013 382,928 511,170 — 34,463 — 928,561 59,400 987,961
R I Allely <g> 2013 254,510 — — 5,550 — 260,060
Total Remuneration:
- Executive Directors 2014 549,199 421,000 — 50,801 — 1,021,000 79,200 1,100,200
2013 637,438 511,170 — 40,013 — 1,188,621 950,521
Total Remuneration:
- Directors 2014 1,009,749 421,000 — 88,696 — 1,519,445 79,200 1,598,645
2013 1,136,410 511,170 — 77,091 — 1,724,671 1,486,571
were made to Goh S N.
This report has been made in accordance with a resolution of Directors.
Matthew Bickford-Smith Peter George
Sydney, 29 August 2014

| PMP LIMITED Annual Report 2014 | 39
29 August 2014 Dear Directors,
PMP Limited In accordance with section 307C of the Corporations Act 2001, I am pleased to provide the following declaration of independence to the directors of PMP Limited. As lead audit partner for the audit of the financial statements of PMP Limited for the financial year ended 30 June 2014, I declare that to the best of my knowledge and belief, there have been no contraventions of:
(i) the auditor independence requirements of the Corporations Act 2001 in relation to the audit; and
(ii) any applicable code of professional conduct in relation to the audit. Yours sincerely
DELOITTE TOUCHE TOHMATSU
T Hynes Partner Chartered Accountants
The Board of Directors PMP Limited Level 12 67 Albert Avenue Chatswood NSW 2067
Liability limited by a scheme approved under Professional Standards Legislation.
Member of Deloitte Touche Tohmatsu Limited
Deloitte Touche Tohmatsu A.B.N. 74 490 121 060 Grosvenor Place 225 George Street Sydney NSW 2000 PO Box N250 Grosvenor Place Sydney NSW 1220 Australia DX 10307SSE Tel: +61 (0) 2 9322 7000 Fax: +61 (0) 2 9322 7001 www.deloitte.com.au
INDEPENDENT AUDITOR’S DECLARATION

40 | PMP LIMITED Annual Report 2014 |
Geoff StephensonB.Bus CPA GAICD
Chief Financial Officer
OPERATING SALES REVENUE
Operating sales revenue for FY14 was $899.2 million, a 7.8% decrease on the prior year with PMP Australia sales down $53.7 million while Gordon & Gotch sales fell by $29 million, a decrease of 8%. Distribution volumes were up 9.5% as new contracts increased market share. Catalogue volumes were 3% lower and directory tonnes fell by 72%.
Sales at PMP Australia (which incorporates the former Print Australia, Digital, Distribution and book printing businesses) fell by 10.9% or $53.7 million versus last year on lower print sell prices, less volumes from existing print customers in softer retail markets and a 72% fall in Directory volumes. Distribution Australia volumes were up 10.0% from new contract wins. Revenue at PMP New Zealand was up 1.3% or $2.1 million as higher Sheetfed revenues and a stronger New Zealand dollar offset lower sales in Heatset and at Gordon & Gotch.
EARNINGS BEFORE INTEREST AND TAX (EBIT)
The full-year EBIT (before significant items) was $28.8 million, down 14.7% or $5.0 million on the prior year EBIT of $33.8 million, due in part to $4.1 million of higher property rental expense (the prior year result has been re-stated by $0.6 million after adoption of AASB119). Improved EBIT (before significant items) was recorded at Griffin Press which retained contracts and lowered costs, and at Gordon and Gotch which offset lower volumes with further cost restructuring, route changes and retail delivery consolidation. PMP Australia EBIT (before significant items) was down $9.7 million as Distribution gains, lower lease costs at Chullora and Digital and transformation savings were offset by lower print sell prices, reduced directory tonnes, $4.1 million higher property rental expense and a 3% fall in catalogue volumes. Corporate costs fell $2.2 million versus prior year on further cost restructuring.
NET PROFIT AFTER TAX (NPAT)
A net profit of $3.4 million was recorded for FY14 which was $73.6 million higher than the $70.2 million loss in the previous year (re-stated AASB119). The major factor impacting this was a $76.1 million reduction in significant items in FY14.
EBIT (before significant items) was $5.0 million lower and interest expense reduced by $2.3 million. Significant items of $8.4 million post tax in FY14 consisted mainly of redundancies across all of the businesses partially offset by a profit on sale of the remaining portion of the Clayton property and minor plant disposals.
support functions in the Company, leading a corporate team
treasury, taxation and investor relations.
Mr Stephenson has over 30 years of experience with a range of blue chip companies including Iplex Pipelines, Fairfax Media and Goodman Fielder. He has held a range of senior commercial and
in Australia and also offshore.
CASH FLOW
The Group’s free cash flow * was $44.0 million compared to $27.5 million in FY13 mainly due to lower interest payments (down $6.5 million) and capex ($18.6 million lower) more than offsetting lower EBITDA (down $8.2 million). Cash from Operations at $35.5 million was $27.9 million up year on year on lower significant items. Net debt fell from $89.1 million to $51.7 million down 42%.
BALANCE SHEET
At year end, net assets for the group were $264.8 million, up $6.2 million from $258.6 million in the previous year. The Group’s gearing remains strong, with net debt to EBITDA (before significant items) at 0.8 times down from 1.2 times last year, and Net Debt to Equity at 19.5% versus 34.4%. Interest cover was up 5.1 versus 4.7 times. During the year, one property was sold for $7.6 million and leased back. In October 2013, a $50M unsecured 4 year corporate bond was issued at a fixed 8.75% coupon with proceeds used to reduce bank debt. The maturity date on the ANZ/CBA debt facility has been extended until September 2015. The $3.9 million of assets held for sale represents the Christchurch site.
CFO REVIEW

| PMP LIMITED Annual Report 2014 | 41
HIGHLIGHTS
$M 2014 2013 % Change
EBITDA 63.4 71.6
Depreciation & Amortisation
(34.6)
EBIT 28.8 33.8
(11.6) 16.5%
Income Tax (5.4) 3.6%
11.8 14.3
(9.1) —
0.7 4.0 —
Net gain/(loss) 3.4 —
SEGMENT REVENUE
$M 2014 2013 VARIANCE
Sales Revenue
PMP Australia 439.9 493.6
160.9 158.8 1.3%
Gordon and Gotch 298.4 323.4
Corporate — — —
Total 899.2 975.8
SEGMENT EBIT BEFORE SIGNIFICANT ITEMS
$M 2014 2013 VARIANCE
items
PMP Australia 20.9 30.6
9.9 9.7 2.4%
Gordon and Gotch 3.4 1.1 —
Corporate (5.5) 29.0%
Total 28.8 33.8
CASH FLOW
$M 2014 2013
EBITDA 63.4 71.6
Borrowing costs (11.5)
Income tax 0.3 —
Net movement in working capital
(3.0)
49.2 51.3
(13.7)
operating activities
35.5 7.6
Asset sales 10.7 74.8
Capital expenditure (5.2)
41.0 58.6
revaluation
(3.7)
Reconciliation to net debt movement
37.4 54.2
# 44.0 27.5
#
working capital.
amortisation.
BALANCE SHEET
$M 2014 2013
Current assets 202.4 220.4
Non-current assets 300.2 328.8
Total assets 502.7 549.2
Current liabilities 163.9 198.0
Non-current liabilities 73.9 92.6
Total liabilities 237.9 290.6
Net assets 264.8 258.6

42 | PMP LIMITED Annual Report 2014 |
PMP Group
2014 2013(Restated*)
Year ended 30 June 2014 NOTES $’000 $’000
Continuing operations
Sales revenue 899,218 975,810
Other revenue 9,178 33,118
Raw materials and consumables used (233,733)
(285,190)
Employee expenses (244,549)
Outside production services (23,359)
Freight (17,526)
Repairs and maintenance (14,990)
Occupancy costs (18,092)
Other expenses (16,197)
Depreciation and amortisation (34,592)
Finance costs 3 (12,077)
—
8,091
(567) 12,127
(4,122)
4 (4,689)
3,402
Other comprehensive income/(expense)
22 443 516
(133)
310 361
Exchange differences arising on translation of foreign operations 6,150 2,428
(6,068) 6,388
1,782
1,864 6,913
2,174 7,274
5,576
26 1.1
26 1.1
Weighted average number of ordinary shares outstanding during the period used in the calculation 26 323,781 323,781
CONSOLIDATED STATEMENT OF PROFIT OR LOSS AND OTHER COMPREHENSIVE INCOME

| PMP LIMITED Annual Report 2014 | 43
PMP Group
2014 2013(Restated*)
Year ended 30 June 2014 NOTES $’000 $’000
Current assets
Cash and cash equivalents 28,745 21,211
Receivables 5 85,125 96,169
Inventories 6 75,048 80,710
Financial assets 15 — 5,740
Other 7 9,359 8,597
198,277 212,427
8 4,136 7,952
Total current assets 202,413 220,379
Non-current assets
Property, plant and equipment 9 207,393 233,425
Deferred tax assets 11 58,197 62,074
Goodwill and intangible assets 10 28,415 26,541
Financial assets 15 2,610 2,527
Other 7 3,626 4,262
Total non-current assets 300,241 328,829
Total assets 502,654 549,208
Current liabilities
Payables 12 120,825 138,897
15,017 32,848
Income tax payable 20 21
Financial liabilities 15 2,961 1,096
Provisions 14 25,112 25,155
Total current liabilities 163,935 198,017
Non-current liabilities
68,708 80,470
Deferred tax liabilities 11 2,535 4,068
Financial liabilities 15 144 632
Provisions 14 2,539 7,405
Total non-current liabilities 73,926 92,575
Total liabilities 237,861 290,592
Net assets 264,793 258,616
Equity
Contributed equity 16 356,035 356,035
Reserves 18 9,456 7,434
Accumulated losses (100,698)
Total equity 264,793 258,616
CONSOLIDATED STATEMENT OF FINANCIAL POSITION

44 | PMP LIMITED Annual Report 2014 |
PMP Group
2014 2013Year ended 30 June 2014 NOTES $’000 $’000
Receipts from customers 1,008,230 1,088,108
Payments to suppliers and employees (961,277)
Interest rate swap close out costs 3 (443)
Interest received 253 267
(11,499)
280
35,544 7,596
Payments for property, plant and equipment (4,765)
Proceeds from sale of property, plant and equipment 10,187 69,606
Payments for development costs and licences (443)
Proceeds from sale of business 537 5,179
5,516 51,014
Proceeds from borrowings 50,000 —
Repayments of borrowings (84,140)
(51)
(34,191)
Net increase in cash and cash equivalents6,869 8,999
21,211 11,703
Effects of exchange rate changes on cash and cash equivalents 665 509
28,745 21,211
CONSOLIDATED STATEMENT OF CASH FLOWS

| PMP LIMITED Annual Report 2014 | 45
PMP Group ($’000)
Contributed equity
Accumulated losses
Foreign currency
translation reserve
Share-based
payment reserve
hedge reserve
Total equity
(Restated*) (Restated*) (Restated*)
Year ended 30 June 2014 Attributable to equity holders of PMP Limited
At 1 July 2012 356,035 1,459 1,120 321,514
— — 2,428 — — 2,428
— — — — 4,485 4,485
— 361 — — — 361
— 361 2,428 — 4,485 7,274
— — — —
— 2,428 — 4,485
Share-based payments — — — — — —
At 30 June 2013 356,035 3,887 1,120 2,427 258,616
At 1 July 2013 356,035 3,887 1,120 2,427 258,616
Currency translation differences — — 6,150 — — 6,150
— — — —
— 310 — — — 310
— 310 6,150 — 2,174
— 3,402 — — — 3,402
— 3,712 6,150 — 5,576
Share-based payments — 443 — 158 — 601
At 30 June 2014 356,035 (100,698) 10,037 1,278 (1,859) 264,793
The above statement of changes in equity should be read in conjunction with the accompanying notes.
CONSOLIDATED STATEMENT OF CHANGES IN EQUITY

46 | PMP LIMITED Annual Report 2014 |
FINANCIAL INDEX01
2a Revenue
2b
2c
2d Auditors’ remuneration
2e Depreciation and amortisation
03 Finance costs
04 Income tax
05 Receivables
06 Inventories
07 Other assets
08
09 Property, plant and equipment
10 Goodwill and intangible assets
11 Deferred tax
12 Payables
13 Interest bearing liabilities
14 Provisions
15
16 Contributed equity
17 Dividends
18 Reserves
19 Commitments
20 Controlled entities
21 Segmental information
22 Pension plans
23 Share-based payment plans
24 Related parties
25 Sale of business
26 Earnings per share
27
28 Financial instruments
29 Contingent liabilities
30 Subsequent events
31 Interest in jointly controlled entity
32 Parent
Directors’ declaration
Independent Audit Report
1 Summary of significant accounting policies
BASIS OF PREPARATION
The financial report is a general-purpose financial report, which has been prepared in accordance with the requirements of the Corporations Act 2001, Accounting Standards and Interpretations, and complies with other mandatory professional reporting requirements.
The financial report comprises the financial statements of the consolidated entity (PMP Group) consisting of PMP Limited (parent) and its controlled entities. For the purposes of preparing the consolidated financial statements, PMP Limited is a for-profit entity.
Historical cost convention
The financial statements have been prepared in accordance with the historical cost convention, except for the revaluation of derivative financial instruments and non-current assets classified as held for sale that have been measured at fair value, and fair value less costs to sell respectively. Cost is based on the fair values of the consideration given in exchange for assets.
STATEMENT OF COMPLIANCE
Compliance with IFRS
The financial statements comply with Australian Accounting Standards, which include Australian Equivalents to International Financial Reporting Standards (‘AIFRS’). Compliance with AIFRS ensures that the financial statements, comprising the financial statements and notes, thereto comply with International Financial Reporting Standards (‘IFRS’). The financial statements were authorised for issue by the Directors on 29 August 2014.
ADOPTION OF NEW AND REVISED ACCOUNTING STANDARDS
In the current year, PMP Group has adopted all of the new and revised Standards and Interpretations issued by the Australian

| PMP LIMITED Annual Report 2014 | 47 | PMP LIMITED Annual Report 2014 | 47
NOTES TO AND FORMING PART OF THE FINANCIAL STATEMENTS
Accounting Standards Board (AASB) that are relevant to its operations and effective for the year ended 30 June 2014.
PMP Group, applies for the first time, certain standards and amendments that apply retrospectively and require restatement of previous financial statements.
CHANGES IN ACCOUNTING POLICIES
The PMP Group adopted AASB 119 Employee Benefits (revised) and AASB 2011-10 Amendments to Australian Accounting Standards arising from AASB 119 on 1 July 2013. The revised standard includes changes to the recognition of income and expenses associated with the PMP Group’s defined superannuation plan. Under the revised standard, return on plan assets has been calculated based on the rate used to discount the obligations rather than the expected rate of return on these assets. Furthermore, the discount rate applied has changed from a net discount rate to a gross tax discount rate.
The PMP Group has obtained actuarial assessments and applied amendments resulting in a $218,000 increase in loss after tax ($312,000 before tax) for the financial year ended 30 June 2013, $291,000 increase in the defined benefit asset, increase in deferred tax liabilities of $87,000 and an increase of $422,000 in other comprehensive income.
In addition, the revised standard requires discounting of annual leave provisions for balances which are not expected to be utilised within 12 months. This change which has been applied retrospectively has resulted in a $211,000 increase in loss after tax ($301,000 before tax) for the financial year ended 30 June 2013, a $536,000 decrease in the provision for annual leave, a $158,000 decrease in deferred tax assets, a $5,000 increase in foreign currency translation reserve and an increase of $584,000 in other comprehensive income.
There has been a (0.2) cent change in earnings per share for the financial year ended 30 June 2013.
Fair value measurement
AASB 13 Fair value measurement and AASB 2011-8 Amendments to Australian Accounting Standards arising from AASB 13 requires inclusion of a measure for credit risk in the calculations of assets and liabilities recorded at fair value. This standard has not had a significant impact on any of the amounts recognised in the financial statements.
Control, joint arrangements and interest in other entities
The following standards have been adopted by the PMP Group for the first time for the year ended 30 June 2014:
- AASB 2011-7 Amendments to Australian Accounting Standards
and
- AASB 2012-10 Amendments to Australian Accounting Standards - Transition Guidance and Other Amendments
AASB 10 Consolidated Financial Statements provides a single consolidation model for all entities, based on control, and irrespective of the nature of the investee. The definition of control is focused on power over the investee and the ability to use this power to affect returns from the entity, whether obtained through voting rights or some other contractual arrangement.
AASB 11 Joint Arrangements provides a new definition of joint venture and joint operation and removes optionality around accounting for joint arrangements. Joint ventures are defined by a right to net profit and net assets of the joint arrangement and are required to be equity accounted. Joint operations are defined by a right to assets and obligations for liabilities of the joint arrangements. Share of assets, liabilities, revenues and expenses of joint operations are proportionately consolidated.
AASB 12 Disclosure of Interests in Other Entities requires the extensive disclosure of information that enables users of financial statements to evaluate the nature of, and risks associated with, interests in other entities and the effect of those interests on financial position, financial performance and cashflows.
There has been no change in accounting for existing arrangements for the year ended 30 June 2014 as a result of applying these standards. However, should any arrangements take place which change existing interests or create new interests in controlled entities, the accounting for such transactions may be different to that applied to transactions in the past.
Key management personnel disclosure requirements
AASB 2011-4 removes the individual key management personnel disclosure requirements in AASB 124 ‘Related Party Disclosures’. As a result the Group only discloses the key management personnel compensation in total and for each of the categories required in ASSB 124 (refer to Note 24). In the current year the individual key management personnel disclosure previously required by AASB 124 is now disclosed in the remuneration report due to an amendment to Corporations Regulations 2001 issued in June 2013.
AASB 2012-5 amends Australian Accounting Standards arising from the annual improvements 2009 - 2011 cycle. The amendment which is relevant to the Group relates to the requirement to present a third statement of financial position as at the beginning of the preceding period when applying an accounting policy retrospectively or making a retrospective restatement of items in financial statements, or when reclassifying items in financial statements that have a material effect on the information in the third statement of financial position. PMP is of the view that the retrospective application of AASB 119 (revised) has not had a material effect and accordingly, a third statement of financial position is not required to be disclosed.

48 | PMP LIMITED Annual Report 2014 |
STANDARDS AND INTERPRETATIONS ISSUED NOT YET ADOPTED
At the date of authorisation of the financial statements, the Standards and Interpretations listed below were in issue but not yet effective.
Standard/Interpretation
Effective for annual reporting periods
beginning on or after
Expected to be initially
year ending
1 January 2017 30 June 2018
1 January 2014 30 June 2015
1 January 2014 30 June 2015
1 January 2014 30 June 2015
Disclosures for Non-Financial Assets’
1 January 2014 30 June 2015
Novation of Derivatives and Continuation of Hedge Accounting’
1 January 2014 30 June 2015
Investment Entities
1 January 2014 30 June 2015
Conceptual Framework, Materiality and Financial Instruments
1 January 2014 30 June 2015
AASB 9 Financial Instruments addresses the classification, measurement and derecognition of financial assets and financial liabilities. The standard is not applicable until 1 January 2017 but is available for early adoption. The Group has not yet assessed its impact and has not yet decided when to adopt AASB 9.
At the date of authorisation of the financial statements, the following IASB Standards and IFRIC Interpretations were also in issue but not yet effective, although Australian equivalent Standards and Interpretations have not yet been issued.
Standard/Interpretation
Effective for annual reporting periods
beginning on or after
Expected to be initially
year ending
1 July 2014 30 June 2015
- Annual Improvements to IFRSs 2010-2012 Cycle 1 July 2014 30 June 2015
- Annual Improvements to IFRSs 2011-2013 Cycle 1 July 2014 30 June 2015
- IFRS 15 Revenue from contracts with customers 1 July 2017 30 June 2018
BASIS OF CONSOLIDATION
Subsidiaries
The consolidated financial statements are those of the economic entity (PMP Group) comprising PMP Limited (the head entity ‘PMP’) and its subsidiaries.
The consolidated financial statements include the information contained in the financial statements of PMP and each of its subsidiaries as from the date PMP obtains control until such time as control ceases. Control is achieved when PMP Limited:
Is expected, or has rights to variable returns from its involvement
Has the ability to use its power to affect its returns
The financial statements of controlled entities are prepared for the same reporting period as PMP using consistent accounting policies.
All intercompany balances, transactions, and unrealised profits arising on transactions between Group companies have been eliminated in full.
RECOVERABLE AMOUNT OF ASSETS
At each reporting date, the PMP Group assesses whether there is any indication that an asset may be impaired. Where an indicator of impairment exists, the PMP Group makes a formal estimate of recoverable amount. Where the carrying amount of an asset exceeds its recoverable amount the asset is considered impaired and is written down to its recoverable amount.
Recoverable amount is the greater of fair value less costs to sell and value in use. It is determined for an individual asset, unless it does not generate inflows that are largely independent of those from other assets or groups of assets, in which case, the recoverable amount is determined for the cash generating unit to which the asset belongs.
In assessing value in use, the estimated future cash flows are discounted to their present value using a pre-tax discount rate that approximates the weighted average cost of capital for that cash generating unit.
The assumptions used in the assessment of recoverable amount are discussed in Note 10.

| PMP LIMITED Annual Report 2014 | 49
NOTES TO AND FORMING PART OF THE FINANCIAL STATEMENTS
FOREIGN CURRENCIES
Both the functional and presentation currency of PMP Limited and its Australian subsidiaries is Australian dollars. The functional currencies of the overseas operations equates to their local currency.
Transactions in foreign currencies are converted to functional currency at the rate of exchange ruling at the date of the transaction.
Monetary amounts payable to and by the entities within the PMP Group that are outstanding at the balance date and are denominated in foreign currencies have been converted to functional currency using rates of exchange at the end of the year.
Non-monetary amounts that are measured at historical cost in a foreign currency are translated using the exchange rate as at the date of the initial transaction.
The assets and liabilities of the controlled entities incorporated overseas are translated into the PMP Group presentation currency at the rates of exchange ruling at balance date. The Statements of profit or loss and other comprehensive income are translated at an average rate for the year.
Exchange differences arising on translation are taken directly to the foreign currency translation reserve.
On the disposal of a foreign operation, a proportionate share of the amount recognised in the foreign currency translation reserve relating to that particular foreign operation is recognised in the Statement of profit or loss and other comprehensive income, as part of the gain or loss on sale.
CASH AND CASH EQUIVALENTS
For the purposes of the cash flow statement, cash includes cash on hand and in banks. Cash on hand and in banks is stated at nominal amount.
TRADE RECEIVABLES
Trade debtors are recognised and carried at original invoice amount less a provision for any uncollectible debts. An estimate for doubtful debts is made when collection of the full amount is no longer probable. Bad debts are written-off as incurred.
Receivables from related parties are recognised and carried at the nominal amount due less provision for amounts not receivable.
INVENTORIES
Inventories are valued at the lower of cost and net realisable value.
Costs incurred in bringing each product to its present location and condition are accounted for as follows:
and
Finished goods and work-in-progress: cost of direct material and labour and an appropriate proportion of fixed and variable manufacturing overheads based on normal operating capacity.
PROPERTY, PLANT AND EQUIPMENT
Property, plant and equipment is stated at cost less accumulated
depreciation and any impairment in value. Subsequent costs are included either in the assets carrying value or as a separate asset only when it is probable that future economic benefits will flow to the Group and the cost can be reliably measured.
Depreciation
Property, plant and equipment, excluding freehold land, is depreciated or amortised at rates based upon their expected useful lives using the straight line method. Major depreciation periods are consistent with the prior period and are as follows:
Freehold buildings 40 years
Leasehold improvements to the lease term
Printing presses 7.5 to 20 years
Computer equipment 3 to 4 years
Useful lives are reviewed, and adjusted, if appropriate at each reporting date.
NON-CURRENT ASSETS (OR DISPOSAL GROUPS) HELD FOR SALE
Non-current assets (or disposal groups) are classified as held for sale if their carrying value will be recovered principally through a sale transaction rather than through continuing use. They are measured at the lower of their carrying amount and fair value less costs to sell. An impairment loss is recognised for any initial or subsequent write-down of the asset. Non-current assets classified as held for sale are not depreciated while they are classified as held for sale.
Where subsequently the decision has been made not to sell an asset classified as held for sale, the asset is valued at the lower of its carrying amount before it was classified as held for sale, adjusted for depreciation that would have been recognised had the asset not been classified held for sale, and its recoverable amount.
PAYABLES
Liabilities for trade creditors and other amounts are carried at cost which is the fair value of the consideration to be paid in the future for goods and services received, whether or not billed to the consolidated entity.
Payables to related parties are carried at the principal amount.
LEASES
Finance leases, which transfer to the Group substantially all the risks and benefits incidental to ownership of the leased item, are capitalised at the lower of present value of the minimum lease payments or the fair value of the leased property, disclosed as leased property, plant and equipment, and amortised over the shorter of the lease term and useful life of the asset.
The cost of improvements to leasehold property related to these finance leases is capitalised and amortised over the unexpired period of the lease or the estimated useful lives of the improvements, whichever is the shorter.
Operating leases, which do not transfer to the Group substantially all the risks and benefits of the leased item, are not capitalised and rental payments are included in the determination of the profit and

50 | PMP LIMITED Annual Report 2014 |
loss in equal instalments over the lease term.
In the event that lease incentives are received to enter into operating leases, such incentives are initially recorded as a liability and are then recognised as a reduction in rental expense on a straight line basis over the lease term.
INTANGIBLE ASSETS
Goodwill
Goodwill represents the excess of the purchase consideration plus incidental expenses over the fair value of identifiable net assets and contingent liabilities acquired at the date of acquisition of a business.
Following initial recognition, goodwill is measured at cost less any accumulated impairment losses. Goodwill is not amortised, but is reviewed for impairment each reporting date, or more frequently if events or changes indicate that the carrying amount may be impaired.
At the date of any acquisition, goodwill acquired is allocated to the cash generating unit or groups of cash generating units expected to benefit from the acquisition.
Where the recoverable amount of the cash generating unit is less than the carrying amount of goodwill, an impairment loss is recognised.
Where goodwill forms part of a cash generating unit and part of the operation within that unit is disposed of, the goodwill associated with the operation disposed of is included within the carrying amount of the operation when determining the gain or loss on disposal of the operation.
Development and licence costs
Costs incurred in developing or acquiring products or systems that will generate future benefits are capitalised.
Amortisation is charged on a straight-line basis, the expense is taken to the Statement of profit or loss and other comprehensive income through the ‘amortisation’ line item as follows:
Database development costs 3 years
Software development costs 3 - 7 years
Useful lives are examined on an annual basis and adjustments, where applicable, are made on a prospective basis.
REVENUE RECOGNITION
Revenues are recognised at the fair value of consideration received or receivable net of the amount of goods and services tax (GST).
Revenue is recognised to the extent that it is probable that the economic benefits will flow to the entity and the revenue can be reliably measured. Revenue is recognised net of returns, discounts and allowances.
When rendering services under contract and the contract outcome, control of the right to be compensated for the services, and the stage of completion can be reliably measured, revenue is recognised on a progressive basis as the costs to complete the service contract are performed.
Dividend revenue is recognised when the Group’s right to receive payment is established.
Rental income is recognised as income in the periods in which it is earnt.
TAXES
Income tax
The income tax expense or benefit for the year is the tax payable on the current year’s taxable income based on the notional income tax rate for each jurisdiction adjusted by changes in deferred tax assets and liabilities attributable to temporary differences between the tax bases of assets and liabilities and their carrying amounts in the financial statements, and unused tax losses.
Deferred tax assets and liabilities are recognised for temporary differences at the rates expected to apply when the assets are recovered or liabilities are settled, based on the tax rates for each jurisdiction. The relevant tax rates are applied to the cumulative amounts of deductible and taxable temporary differences to measure the deferred tax asset or liability.
Deferred tax assets are recognised for deductible temporary differences and unused tax losses only if it is probable that future taxable amounts will be available to utilise those temporary differences and losses.
TAX CONSOLIDATION LEGISLATION
PMP Limited and its wholly-owned Australian controlled entities have implemented tax consolidation legislation.
The head entity, PMP Limited, and the controlled entities in the tax consolidated group account for their own current and deferred amounts. These are measured as if each entity continued to be a stand alone taxpayer in its own right.
In addition to its own current and deferred tax amounts, PMP Limited also recognises the current tax liabilities (or assets) and the deferred tax assets arising from unused tax losses and unused tax credits assumed from controlled entities in the tax consolidated group. Assets or liabilities arising are accounted for in accordance with the tax funding agreement, details of which are disclosed in Note 4.
PMP’s 100% owned subsidiaries operating in New Zealand also adopt the same approach, with PMP (NZ) Limited heading up the consolidated tax group in New Zealand.
Goods and services tax (GST)
Revenues, expenses and assets are recognised net of the amount of GST except where:
the GST incurred on purchase of goods and services is not recoverable from the taxation authority, in which case, the GST is recognised as part of the cost of acquisition of the asset or as
receivables and payables are stated with the GST amount included.
The net amount of GST recoverable from, or payable to, the

| PMP LIMITED Annual Report 2014 | 51
NOTES TO AND FORMING PART OF THE FINANCIAL STATEMENTS
taxation authority is included as part of receivables or payables in the balance sheet.
Cash flows are included in the cash flow statement on a gross basis and the GST component of cash flows arising from investing and financing activities, which is recoverable from, or payable to, the taxation authority are classified as operating cash flows.
EMPLOYEE BENEFITS
Wages and salaries, annual leave, sick leave, workers’ compensation and long service leave
Provision has been made in the financial statements for benefits accruing to employees in relation to sick leave (where mandatory obligation exists), annual leave, long service leave and workers’ compensation. All on-costs, including superannuation, payroll tax, workers’ compensation premiums and fringe benefits tax are included in the determination of provisions.
Liabilities arising in respect of wages and salaries, sick leave and any other employee benefits expected to be settled within twelve months of the reporting date are measured at their nominal amounts based on remuneration rates which are expected to be paid when the liability is settled. All other employee benefit liabilities are measured at the present value of the estimated future cash outflow to be made in respect of services provided by employees up to the reporting date. In determining the present value of future cash outflows, the market yield as at the reporting date on corporate bonds, which have terms to maturity approximating the terms of the related liability, are used.
Employee benefit expenses and revenues arise in respect of the following categories:
wages and salaries, non-monetary benefits, annual leave, long
other types of employee benefits are recognised against profits on a net basis in respective categories.
Superannuation
The PMP Group has a defined benefit fund that provides defined benefits based on years of membership and final average salary and accumulation benefits (defined contribution fund). Employees contribute to the plan at various percentages of their wages and salaries.
An asset or liability in respect of the defined benefit fund is recognised in the balance sheet, and is measured as the present value of the defined benefit obligation plus unrecognised actuarial gains/losses less the fair value of the superannuation fund’s assets at that date and any unrecognised past service cost. The present value of the defined benefit fund has been determined using the projected unit credit actuarial valuation method. Various assumptions are required when determining the Group’s benefit obligation. These assumptions and the related carrying amounts are discussed in Note 22.
Contributions to the defined contribution fund are recognised as an expense as they become payable.
Share-based payment transactions
Share-based payment transactions are provided to employees via the PMP employee long term incentive plan and the CEO short-term incentive plan. Information relating to these schemes is set out in Note 23.
The fair value of rights is recognised as an employee benefit expense with a corresponding increase in equity. The fair value is measured at grant date and recognised over the period during which the employees become unconditionally entitled to the rights. The fair value is determined by an external valuer taking into account the terms and conditions upon which the instruments were granted as discussed in Note 23.
The fair value of the rights excludes the impact of any non-market based vesting conditions. Non-market based vesting conditions are included in assumptions about the number of rights that are expected to ultimately vest. At each balance sheet date, the PMP Group revises its estimate of the number of rights that are expected to become exercisable. The employee benefit expense recognised each period takes into account the most recent estimate.
No expense is recognised for rights that do not ultimately vest, except for rights where vesting is conditional upon a market condition.
INTEREST BEARING LIABILITIES
All loans are measured at the principal amount, being the fair value of the consideration received net of issue costs associated with the borrowing.
After initial recognition, loans are subsequently measured at amortised cost using the effective interest method. Amortised cost is calculated by taking into account any issue costs, and any discount or premium on settlement.
FINANCE COSTS
Interest costs on funds invested in qualifying assets are recorded as a capitalised cost of the project until commercial production commences. Thereafter, the capitalised interest is amortised over the period that the benefits are expected to be received. Other finance costs are expensed.
PROVISIONS
Provisions are recognised when the PMP Group has a legal, equitable or constructive obligation to make a future sacrifice of economic benefits to other entities as a result of past transactions or other past events, it is probable that a future sacrifice of economic benefits will be required and a reliable estimate can be made of the amount of the obligation.
If the effect of the time value of money is material, provisions are determined by discounting the expected future cash flows at a pre-tax rate that reflects current market assessments of the time value of money and, where appropriate, the risks specific to the liability. Where discounting is used, the increase in the provision due to the passage of time is recognised as a finance cost.

52 | PMP LIMITED Annual Report 2014 |
FINANCIAL INSTRUMENTS
The PMP Group uses derivative financial instruments such as forward exchange contracts, interest rate swaps and cross currency swaps to hedge its risks associated with interest rate and foreign currency fluctuations. Derivative financial instruments are initially recognised at cost on the date a derivative contract is entered into and are subsequently re-measured to their fair value.
The fair value of forward exchange contracts is calculated by reference to current forward contracts with similar maturity profiles. The fair value of interest rate swap and cross currency swap contracts are determined by reference to market values for similar instruments.
The method of recognising the resulting gain or loss depends on whether the derivative is designated as a hedging instrument, and if so, the nature of the hedge relationship. The PMP Group policy is to undertake hedging in respect of certain recognised assets or
and for highly probable forecast sales or purchases (cash flow hedge relationships).
The PMP Group documents at the inception of the transaction the relationship between hedging instruments and hedged items, as well as its risk management objective and strategy for undertaking various hedge transactions. The PMP Group also documents its assessment, both at hedge inception and on an ongoing basis, of whether the derivatives that are used in the hedging relationship have been and will continue to be highly effective in offsetting changes in fair values and cash flows of hedged items.
(i) Fair value hedge
Changes in fair value of derivatives that are designated and qualify as fair value hedges are recorded in the statement of profit or loss and other comprehensive income, together with any changes in the fair value of the hedged asset or liability that are attributable to the hedged risk.
The effective portion of changes in the fair value of derivatives that are designated and qualify as cash flow hedges is recognised in equity in the hedging reserve. The gain or loss relating to the ineffective portion is recognised immediately in the Statement of profit or loss and other comprehensive income.
Amounts accumulated in equity are recycled in the Statement of profit or loss and other comprehensive income in the periods when the hedged item will affect the profit and loss. However, when the forecast purchase or sale transaction that is hedged results in the recognition of a non-financial asset, the gains and losses previously deferred in equity are transferred from equity and included as a basis adjustment to the initial cost or carrying amount of the asset.
Hedge accounting is discontinued when the hedging instrument expires or is sold, terminated or exercised, or no longer qualifies for hedge accounting. At that point in time, any cumulative gain or loss on the hedging instrument recognised in equity is kept in equity until the forecasted transaction occurs. If a hedged transaction is no
longer expected to occur, the net cumulative gain or loss recognised in equity is transferred to net profit or loss for the year.
(iii) Derivatives that do not qualify for hedge accounting
Certain derivatives do not qualify for hedge accounting. Changes in the fair value of any derivative instrument that does not qualify for hedge accounting are recognised immediately in the Statement of profit or loss and other comprehensive income.
EARNINGS PER SHARE
Basic EPS is calculated as net result attributable to members, adjusted to exclude costs of servicing equity (other than dividends), divided by the weighted average number of ordinary shares, adjusted for any bonus element.
Diluted EPS is calculated as net result attributable to members, adjusted for:
the after tax effect of dividends and interest associated with dilutive potential ordinary shares that have been recognised as
other non-discretionary changes in revenues or expenses during the period that would result from the dilution of potential
divided by the weighted average number of ordinary shares and dilutive potential ordinary shares, adjusted for any bonus element.
CONTRIBUTED EQUITY
Issued and paid up capital is recognised at the fair value of the consideration received by the company. Any transaction costs arising on the issue of the ordinary shares are recognised directly in equity as a reduction of the share proceeds received. Transaction costs arising on the buy-back of ordinary shares is also recognised directly in equity as an increase in the cost of the buy-back.
DIVIDENDS
Provision is made for the amount of any dividend declared, being properly authorised and no longer at the discretion of the entity, on or prior to the financial year end but not distributed at balance date.
SEGMENT REPORTING
Operating segments are reported in a manner consistent with the internal reporting provided to the chief operating decision maker. The chief operating decision maker is responsible for allocating resources and assessing performance of the operating segments. Segment information is presented on the same basis as that used for internal reporting purposes.
CRITICAL ACCOUNTING ESTIMATES, ASSUMPTIONS AND JUDGEMENTS
The preparation of financial statements requires management to make judgements, estimates and assumptions that affect the application of accounting policies and the reported amounts of assets, liabilities, income and expenses. Actual results may differ from these estimates.

| PMP LIMITED Annual Report 2014 | 53
NOTES TO AND FORMING PART OF THE FINANCIAL STATEMENTS
Estimates and underlying assumptions are reviewed on an ongoing basis. Revisions to accounting estimates are recognised in the period in which the estimate is revised and in any future periods affected.
In particular, information about significant areas of estimation uncertainty and critical judgements in applying accounting policies that have the most significant effect on the amount recognised in the financial statements are described in the following notes:
Note 10 - Impairment testing of goodwill and intangibles with indefinite useful lives
Note 11 - Deferred tax
Note 28 - Financial instruments
(i) Goodwill, intangible assets, property, plant and equipment
The Group determines whether goodwill is impaired on a bi-annual basis and assesses impairment of all other assets at each reporting date by evaluating conditions specific to the Group and to the particular asset that may lead to impairment. These include technology, economic and political environments. If an impairment trigger exists the recoverable amount of the asset is determined. Recoverable amount is the greater of fair value less costs of disposal and value in use. It is determined for an individual asset, unless it does not generate inflows that are largely independent of those from other assets or group of assets, in which case, the recoverable amount is determined for the cash generating unit to which the asset belongs. An estimation of recoverable amount of cash generating units is made by using a value in use model or fair value less costs of disposal. A number of assumptions are made by the Group in this estimation of recoverable amount.
In assessing value in use, the estimated future cash flows, excluding future uncommitted restructurings and associated benefits, are
discounted to their present value using a pre-tax discount rate that approximates the weighted average cost of capital for that cash
generating unit.
In assessing fair value less costs of disposal, primary consideration is given to external sources of value such as comparable transactions adjusted for costs to sell, market price in an actively traded market or the best information available to reflect the amount to be obtained from disposal. In the absence of comparable transactions, fair value has been assessed using a discounted cash flow methodology. This is supported by EBITDA multiples which serve as an external cross check. PMP believe that this provides the best indication of the recoverable amount to be obtained from disposal of the cash generating unit at arms length between knowledgeable and willing parties.
(ii) Deferred tax assets
Deferred tax assets are recognised for all unused tax losses to the extent that it is probable that future taxable profits will be available against which the losses can be utilised. Significant management judgement is required to determine the amount of deferred tax asset that can be recognised, based on the likely timing and level of future taxable profits.
PMP incurred tax losses in both the 2013 and 2014 financial years due to the transformation plan where the Company incurred significant redundancy costs. This has resulted in an extension of the time frame for utilisation of the Australian tax losses and increased the risk of realisation of this asset. The Directors considered it prudent to not recognise $15.8 million of tax losses (equating to the $13.2 million 2013 and forecast $2.6 million 2014 Australian tax losses). Despite the non-recognition of these losses on the balance sheet, the losses will remain available indefinitely for offset against future taxable profits, subject to continuing to meet the statutory tax tests of continuity of ownership or failing that, the same business test.
The Directors believe the Australian deferred tax asset value of $35 million, attributable to tax losses, is supportable given the level of redundancy costs incurred in the previous two years are not expected to re-occur and PMP expects to be earning future tax profits from the 2016 financial year onwards, making it probable that the tax losses will be recouped over a period of 7 to 8 years. The New Zealand deferred tax asset value of $8.5 million, attributable to tax losses (which were partly recouped this year), are also expected to be fully recouped over a period of 3 to 4 years. It should be noted that this will need to be reassessed on an ongoing basis to ensure the deferred tax asset value continues to be supportable, taking into account updated earnings forecast and relevant income tax legislation.
(iii) Fair value measurement and valuation process
PMP has financial instruments that are carried at fair value in the statement of financial position. The best evidence of fair value is quoted prices in an active market. If the market for a financial instrument is not active, PMP determines fair value by using various valuation models. The objective of using a valuation technique is to establish the price that would be received to sell an asset or paid to transfer a liability between market participants. The chosen valuation models make maximum use of market inputs and relies as little as possible on entity specific inputs. The fair values of all positions include assumptions made on the recoverability based on the counterparty’s and PMP’s credit risk.
Details of the inputs to the fair value of financial instruments are included in Note 19.
COMPARATIVE AMOUNTS
Where necessary, comparatives have been reclassified and repositioned for consistency with current year disclosures.

54 | PMP LIMITED Annual Report 2014 |
PMP Group
2014 2013Year Ended 30 June 2014 NOTES $’000 $’000
2a Revenue
Sales revenue 899,218 975,810
Other income - external 2,968 3,593
Rental income 1,647 2,090
Net gain on disposal of business — 5,885
Net gain on disposal of property 3,979 21,033
Net gain on disposal of plant and equipment 319 250
Interest
Bank interest 3 265 267
Total other revenue 9,178 33,118
Total revenue 21 908,396 1,008,928
2b
expense:
(3,979)
—
(420)
Directories’ closure costs — 18,114
Restructure initiatives and other one off costs 13,052 31,956
Impairment of plant, equipment, intangibles and goodwill due to restructure initiatives — 65,861
Finance cost interest rate swap unwind —
3 443 —
9,096 88,504
2,969 13,688
Tax losses not brought to account (2,649)
Use of capital gains tax losses not previously recognised 411 3,531
731 4,013
comprehensive income within the following categories:
Other revenue (4,399)
Employee expenses 10,751 37,164
Repairs and maintenance 111 209
Occupancy costs 763 7,980
1,427 70,578
Finance costs 443
9,096 88,504
Gain on disposal of property is related to sale and lease-back transactions.
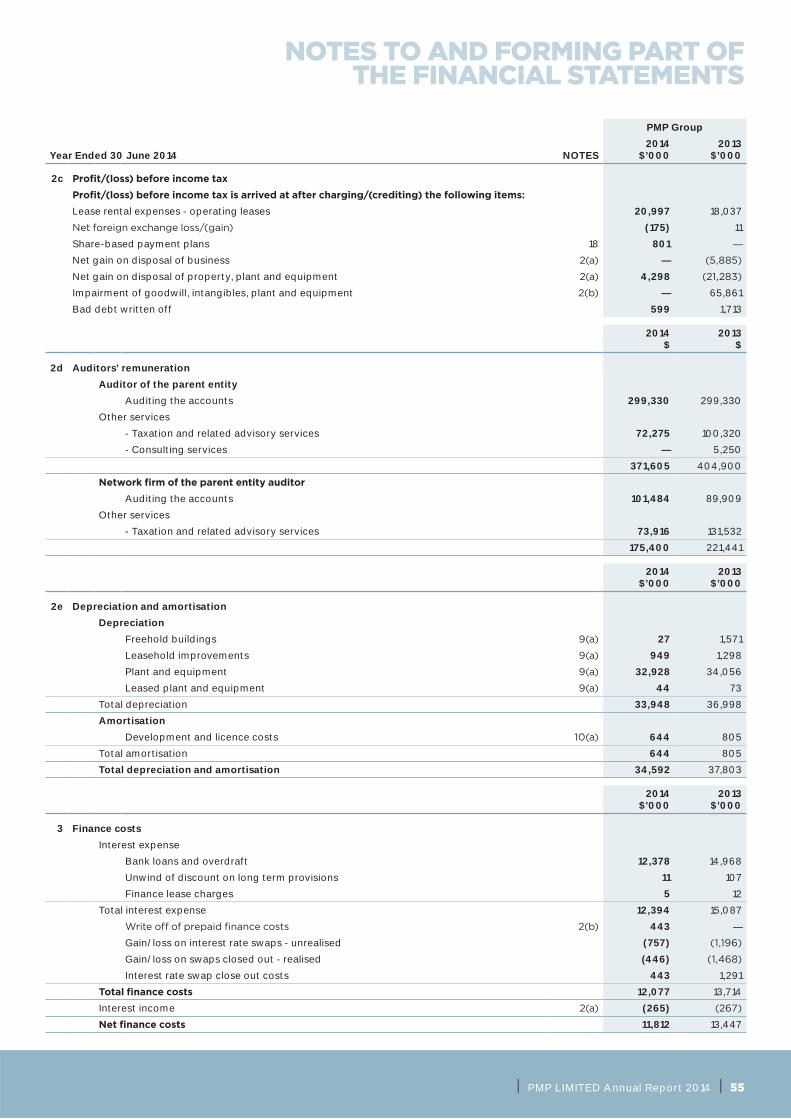
| PMP LIMITED Annual Report 2014 | 55
NOTES TO AND FORMING PART OF THE FINANCIAL STATEMENTS
PMP Group
2014 2013Year Ended 30 June 2014 NOTES $’000 $’000
2c
Lease rental expenses - operating leases 20,997 18,037
(175) 11
Share-based payment plans 18 801 —
Net gain on disposal of business —
Net gain on disposal of property, plant and equipment 4,298
Impairment of goodwill, intangibles, plant and equipment — 65,861
Bad debt written off 599 1,713
2014 2013$ $
2d Auditors’ remuneration
Auditor of the parent entity
Auditing the accounts 299,330 299,330
Other services
- Taxation and related advisory services 72,275 100,320
- Consulting services — 5,250
371,605 404,900
Auditing the accounts 101,484 89,909
Other services
- Taxation and related advisory services 73,916 131,532
175,400 221,441
2014 2013$’000 $’000
2e Depreciation and amortisation
Depreciation
Freehold buildings 27 1,571
Leasehold improvements 949 1,298
Plant and equipment 32,928 34,056
Leased plant and equipment 44 73
Total depreciation 33,948 36,998
Amortisation
Development and licence costs 644 805
Total amortisation 644 805
Total depreciation and amortisation 34,592 37,803
2014 2013$’000 $’000
3 Finance costs
Interest expense
Bank loans and overdraft 12,378 14,968
Unwind of discount on long term provisions 11 107
Finance lease charges 5 12
Total interest expense 12,394 15,087
443 —
Gain/loss on interest rate swaps - unrealised (757)
Gain/loss on swaps closed out - realised (446)
Interest rate swap close out costs 443 1,291
12,077 13,714
Interest income (265)
11,812 13,447

56 | PMP LIMITED Annual Report 2014 |
PMP Group
2014 2013(Restated*)
Year ended 30 June 2014 NOTES $’000 $’000
4 Income tax
(a)
8,091
2,427
Tax effect of timing and other differences:
Non assessable income (800)
Capital gains tax losses not previously recognised (411)
Effect of differences in overseas tax rate (119)
(147)
Non deductible items for tax purposes 1,090 17,083
2,649 13,206
4,689 1,557
567
4,122 13,684
Income tax expense attributable to loss* 4,689 1,557
30 June 2013. Refer to Changes in Accounting Policies.
(b) Deferred tax assets and deferred tax liabilities
At 30 June 2014 there is no recognised or unrecognised deferred tax liability for taxes that would be payable on the unremitted earnings of PMP’s wholly owned subsidiaries, as the PMP Group has no liability for additional taxation should such amounts be remitted
(c) Franking credits
The amount of franking credits available are:
1,280 1,580
Franking account balance 1,280 1,580
loss carry back legislation. Having received the refund the franking credits were reduced by $0.3 million.
(d) Tax consolidation and tax effect accounting by members of the tax consolidated group
Effective 1 July 2003, for the purposes of income taxation, PMP Limited and its 100% owned Australian subsidiaries formed a tax consolidated group. Members of the group have entered into a tax sharing agreement in order to allocate income tax expense to the wholly owned subsidiaries on a pro-rata basis. The agreement also provides for the allocation of income tax liabilities between the entities should the head entity default on its obligations. At the balance date the possibility of default is remote. The head entity of the tax consolidation group is PMP Limited.
Members of the Australian tax consolidated group have also entered into a tax funding agreement. The tax funding agreement provides for the allocation of current tax assets and liabilities between wholly owned group members. Each group member of the PMP tax group calculates its current year tax liability on the basis of the stand alone approach. Once each member has calculated its own current year tax liability/tax loss the head entity will then assume these current year tax liabilities/tax losses and be paid/pay compensation for this assumption by way of an intercompany receivable/payable. Allocations under the tax funding agreement are made on a yearly basis.
payable on a yearly basis, in the same manner as the Australian tax funding agreement operates.
$000Gross Tax effected
(e) Tax losses not brought to account
Revenue losses 52,850 15,855
Capital losses 284,088 85,226
details. In addition, capital losses are only able to be used against capital gains and so are not recognised until used in any tax year.

| PMP LIMITED Annual Report 2014 | 57
NOTES TO AND FORMING PART OF THE FINANCIAL STATEMENTS
PMP Group
2014 2013Year ended 30 June 2014 NOTES $’000 $’000
5 Receivables
86,236 94,658
Provision for doubtful debts (2,573)
Net trade debtors 83,663 93,079
Other debtors 1,462 3,090
Total current receivables 85,125 96,169
There were no material unhedged foreign currency receivables.
(a) Impaired trade receivables
PMP Group:
been recognised. This relates to a variety of customers who are in unexpectedly
Movements in the provision for doubtful debts are as follows:
Balance as at 1 July 1,579 2,164
Provision for doubtful debts recognised 2,153 2,506
Amounts written off (599)
Amounts recovered (183)
Unused amount reversed (440)
Net foreign currency translation difference 63 31
Balance at 30 June 2,573 1,579
In determining the recoverability of trade receivables the Group will consider any change in the credit quality of the receivable from the date credit was originally granted up to the reporting date. The creation and release of the provision for
or loss and other comprehensive income. Amounts due are generally written off when there is no expectation of recovering additional cash.
(b) Past due but not impaired
the PMP Group past due but not impaired.
The aging analysis of these trade receivables is as follows:
Past due 1 - 30 days 5,345 5,963
Past due 31 - 60 days 2,858 449
Past due 61 - 90 days 31 384
Past due greater than 90 days 13 161
8,247 6,957
There are no receivables that have had renegotiated terms that would otherwise, without that renegotiation, have been past due or impaired.
(c) Other debtors
Other debtors generally arise from transactions outside of usual operating activities of the Group. Other debtors does not contain impaired assets and are not past due. Collateral is not usually obtained.

58 | PMP LIMITED Annual Report 2014 |
PMP Group
2014 2013Year ended 30 June 2014 NOTES $’000 $’000
6 Inventories
Raw materials, spare parts and stores at cost 43,797 44,237
Less: provision for diminution (1,577)
Net raw materials, spare parts and stores 42,220 42,815
Finished goods at cost 29,251 34,981
Work in progress at cost 3,577 2,914
Total current inventories 75,048 80,710
7 Other assets
Current other assets
Prepayments 9,359 8,597
Total current other assets 9,359 8,597
Non-current other assets
Shares in other entities - unlisted at cost 280 280
Write-down to realisable value (40)
1,374 592
Other assets 2,012 3,430
Total non-current other assets 3,626 4,262
30 June 2013. Refer to Changes in Accounting Policies.
8
Plant and equipment 4,136 7,952
4,136 7,952
(a) Reconciliation
Carrying amount at beginning of year 7,952 1,000
9 — 7,952
(3,816)
Carrying amount at end of year 4,136 7,952

| PMP LIMITED Annual Report 2014 | 59
NOTES TO AND FORMING PART OF THE FINANCIAL STATEMENTS
PMP Group
2014 2013Year ended 30 June 2014 NOTES $’000 $’000
9 Property, plant and equipment
Land
At cost — —
Freehold buildings
At cost 160 160
Accumulated depreciation (160)
Net freehold buildings — 27
Leasehold improvements
At cost 11,597 13,372
Accumulated amortisation (3,313)
Impairment (1,970)
Net leasehold improvements 6,314 6,113
Plant and equipment
At cost 635,086 659,167
Accumulated depreciation (405,855)
Impairment (28,167)
Net plant and equipment 201,064 227,226
Leased plant and equipment
At cost 338 338
Accumulated depreciation (323)
Net leased plant and equipment 15 59
Total net property, plant and equipment 207,393 233,425

60 | PMP LIMITED Annual Report 2014 |
PMP Group
2014 2013Year ended 30 June 2014 NOTES $’000 $’000
9 Property, plant and equipment (continued)
(a) Reconciliations
Reconciliations of the carrying amounts for each class of property, plant and equipment are set out below:
Land
Carrying amount at beginning of year — 16,098
Disposals —
8 —
Net foreign currency translation difference — 54
Carrying amount at end of year — —
Freehold buildings
Carrying amount at beginning of year 27 38,429
Disposals
8 —
—
Depreciation (27)
Net foreign currency translation difference — 188
Carrying amount at end of year — 27
Leasehold improvements
Carrying amount at beginning of year 6,113 8,888
Additions 3 27
Disposals (100)
751 82
Impairment charge —
Prior year correction of impairment misallocation —
Depreciation (949)
Net foreign currency translation difference 496 337
Carrying amount at end of year 6,314 6,113
Plant and equipment
Carrying amount at beginning of year 227,226 235,408
4,762 35,052
Disposals (993)
Disposals on sale of business 25 —
8 —
Impairment charge
(751) 902
Prior year correction of impairment misallocation — 237
Transfer to development costs —
Depreciation (32,928)
(163)
Net foreign currency translation difference 3,911 2,600
Carrying amount at end of year 201,064 227,226
Leased plant and equipment
Carrying amount at beginning of year 59 132
Additions — —
Depreciation (44)
Carrying amount at end of year 15 59
Total net property, plant and equipment 207,393 233,425

| PMP LIMITED Annual Report 2014 | 61
NOTES TO AND FORMING PART OF THE FINANCIAL STATEMENTS
PMP Group
2014 2013YEAR ENDED 30 JUNE 2014 NOTES $’000 $’000
9 Property, plant and equipment (continued)
(b) Impairment charge
Other impairments to plant and equipment — 9,827
— 9,827
plant and equipment written down to fair value less cost to sell before being transferred to assets held for sale.
The PMP Australia cash generating unit has been assessed for impairment as at 30 June
10 Goodwill and intangibles assets
Development and licence costs
At cost 4,741 4,298
Accumulated amortisation (2,281)
Closing net book amount 2,460 2,661
At cost 98,760 98,760
(75,224)
Net foreign currency translation difference 2,419 344
Closing net book amount 25,955 23,880
Total net intangibles 28,415 26,541
(a) Reconciliations
Development and licence costs
Carrying amount at beginning of year 2,661 3,560
Additions 443 21
Transfer from plant and equipment — 71
Disposal on sale of business 25 —
Amortisation (644)
Carrying amount at end of year 2,460 2,661
Carrying amount at beginning of year 23,880 78,670
—
Net foreign currency translation difference 2,075 1,244
Carrying amount at end of year 25,955 23,880
Total net intangibles 28,415 26,541
reductions in 2012 and 2013. This resulted in lower volumes and margins. The recoverable amount of the PMP Australia cash generating unit has been determined using fair value less costs to sell. PMP’s shares are thinly traded and in the absence of a
external indicators such as EBITDA multiples. The long term cash forecasts associated with this cash generating unit were unable to support the carrying value of goodwill, when taking into account the higher risk associated with this cash generating unit given the

62 | PMP LIMITED Annual Report 2014 |
PMP Group
2014 2013Year ended 30 June 2014 NOTES $’000 $’000
10 Goodwill and intangibles (continued)
(b) Impairment testing of goodwill
Carrying amount of goodwill allocated to each cash generating unit:
PMP Australia — —
5,015 5,015
18,904 17,030
2,038 1,835
Total goodwill 25,957 23,880
together represent the lowest level that goodwill is monitored for internal management purposes.
in use model and a fair value less costs of disposal model.
PMP Australia
The recoverable amount of this cash generating unit is determined based on a fair value less costs of disposal calculation. In the absence
external indicators such as EBITDA multiples. This represents a level 3 model in line with the fair value hierarchy in accordance with AASB13. PMP believe that this methodology provides the best indication of the price that would be received to sell the business in an orderly transaction between market participants at balance sheet date.
following page.
recoverable amount of the cash generating unit to be below the carrying value.
The recoverable amount of this cash generating unit is determined based on a value in use calculation. In assessing value in use, the
using a pre-tax discount rate. The key assumptions used are disclosed in the table on the following page.
The Directors believe that any reasonably possible change in the key assumptions on which recoverable amount is based is not expected to cause the aggregate of the carrying amount to exceed the aggregate recoverable amount of the cash generating unit.
Maxum and heat set web printing - New Zealand
The recoverable amount of this cash generating unit is determined based on a fair value less costs of disposal calculation. In the absence
external indicators such as EBITDA multiples. This represents a level 3 model in line with the fair value hierarchy in accordance with AASB13. PMP believe that this methodology provides the best indication of the price that would be received to sell the business in an orderly transaction between market participants at balance sheet date.
The key assumptions used are disclosed in the table on the following page.
of the cash generating unit exceeding the recoverable amount of the cash generating unit by up to $5-10 million.
Distribution - New Zealand
The recoverable amount of this cash generating unit is determined based on a value in use calculation. The key assumptions used are disclosed in the table on the following page.
The Directors believe that any reasonably possible change in the key assumptions on which recoverable amount is based would not cause the aggregate of the carrying amount to exceed the aggregate recoverable amount of the cash generating unit.

| PMP LIMITED Annual Report 2014 | 63
NOTES TO AND FORMING PART OF THE FINANCIAL STATEMENTS
10 Goodwill and intangibles (continued)
(b) Impairment testing of goodwill (continued)
Key assumptions:
Management judgement is required in assessing whether the carrying value of assets can be supported by the net present value of
Area of judgement Assumption used in value in use calculation
Budgeted EBITDA The Group prepares three year plans which are internally approved by senior management. These
upon past experience and future outlook. Adjustments are made to budgeted EBITDA as follows:
- inclusion of working capital movements
Long term growth rate
business.
An annual growth rate of 0% has been applied in perpetuity.
Budgeted capital expenditure
account budgeted repairs and maintenance.
Pre-tax discount rate
The pre tax discount rate is approximated by applying a gross up formula to the calculated post tax rate. The discount rate is based on the risk free rate for ten year government bonds adjusted
to the market as a whole.
Area of judgement Assumption used in fair value less costs of disposal calculation - PMP Australia, Maxum and heat set web printing New Zealand
Budgeted EBITDA The Group prepares three year plans which are internally approved by senior management. These
are based upon past experience and future outlook.
restructurings.
Post-tax discount rate
to the continuing volatility of the current operating environment.

64 | PMP LIMITED Annual Report 2014 |
PMP Group
2014 2013(Restated*)
Year ended 30 June 2014 NOTES $’000 $’000
11 Deferred tax
Deferred tax assets
Temporary differences:
- Provisions/accruals 13,946 16,025
- Other liabilities — —
777 —
Tax losses 43,474 46,049
Total deferred tax assets 58,197 62,074
Deferred tax liabilities
Temporary differences:
- Property, plant and equipment 892 1,636
- Other assets 1,643 1,427
— 1,005
Total deferred tax liabilities 2,535 4,068
Provisions/Accruals (Restated *)
Other Liabilities hedges
Tax losses Total
(a) Movements in deferred tax assets $000 $000 $000 $000 $000
At 1 July 2012 15,844 344 904 46,443 63,535
497 — — — 497
— — —
-foreign currency translation reserve 54 — — 621 675
Adjustment for sale of subsidiary — — —
Adjustment for reallocation of opening balance — —
Utilisation of tax losses — — —
At 30 June 2013 16,025 — — 46,049 62,074
(2,276) — — — (2,276)
- to other comprehensive income — — 1,819 — 1,819
-foreign currency translation reserve 197 — (37) 951 1,111
Adjustment for reallocation of opening balance — — (1,005) — (1,005)
Loss carry back — — — (300) (300)
Adjustment of prior year losses (2,161) (2,161)
Utilisation of tax losses — — — (1,065) (1,065)
At 30 June 2014 13,946 — 777 43,474 58,197
Property, Plant and Equipment
Other Assets (Restated*) hedges
Total
Movements in deferred tax liabilities $000 $000 $000 $000
At 1 July 2012 —
— —
—
-foreign currency translation reserve — —
Adjustment for sale of subsidiary — 99 — 99
Adjustment for reallocation of opening balance — 344 904 1,248
At 30 June 2013
886 (83) — 803
- to other comprehensive income — (133) — (133)
-foreign currency translation reserve (142) — — (142)
Adjustment for reallocation of opening balance — — 1,005 1,005
At 30 June 2014 (892) (1,643) — (2,535)

| PMP LIMITED Annual Report 2014 | 65
NOTES TO AND FORMING PART OF THE FINANCIAL STATEMENTS
11 Deferred tax (continued)
(b) Deferred tax losses
increased the risk of realisation of this asset. The Directors considered it prudent to not recognise $15.8 million of tax losses
meet the statutory tax tests of continuity of ownership or failing that, the same business test.
The Directors believe the Australian deferred tax asset value of $35 million, attributable to tax losses, is supportable given the level of redundancy costs incurred in the previous two years are not expected to re-occur and PMP expects to be earning future tax
expected to be fully recouped over a period of 3 to 4 years. It should be noted that this will need to be reassessed on an ongoing basis to ensure the deferred tax asset value continues to be supportable, taking into account updated earnings forecast and relevant income tax legislation..
PMP Group
2014 2013Year ended 30 June 2014 NOTES $’000 $’000
12 Payables
Current payables
Creditors - unsecured
119,604 138,005
Interest payable 1,221 892
Total current payables 120,825 138,897
13 Interest bearing liabilities
(a)
Secured
Bank loans - repayable in: Australian dollars — 30,000
Bank loans - repayable in: 12,120 —
Bank loans - repayable in: 2,878 2,797
19 51
15,017 32,848
(b)
Secured
Bank loans - repayable in: Australian dollars — 20,000
Bank loans - repayable in: — 39,473
Bank loans - repayable in: 18,708 20,979
— 18
Unsecured
Corporate bond 50,000 —
68,708 80,470
exchange rate prevailing at balance date.

66 | PMP LIMITED Annual Report 2014 |
PMP Group
2014 2013Year ended 30 June 2014 NOTES $’000 $’000
Cash (28,745)
Bank loans repayable in Australian dollars — 50,000
Corporate Bond repayable in Australian dollars 50,000 —
Bank loans 12,120 39,473
Bank loans repayable in Euros - measured at the exchange rate prevailing at balance date
21,586 23,776
Cross currency swap revaluation of the Australian obligation
(3,276)
Finance lease liabilities 18 69
Net debt 51,703 89,082
Facility Drawn AvailableYear ended 30 June 2014 $’000s $’000s $’000s
13 Interest bearing liabilities (continued)
(c) Interest bearing liabilities - facility details
Facility details:
2014
Secured
Overdraft facility 14,662 — 14,662
Revolving facility 27,929 12,120 15,809
21,586 21,586 —
Unsecured
Corporate Bond 50,000 50,000 —
Total facilities 114,177 83,706 30,471
2013
Secured
Overdraft facility 14,199 — 14,199
Revolving facility 115,000 89,473 25,527
23,776 23,776 —
Unsecured
Corporate Bond — — —
Total facilities 152,975 113,249 39,726
(d) Terms and conditions
PMP entered a fully secured multi-currency $210 million loan agreement in May 2011 with an effective start date of 4 May 2012. As at 30 June 2014 this has amortised to a $28 million facility. This facility has a maturity date of 10 September 2015. The lenders are
against a maximum Debt/EBITDA ratio, a minimum Fixed Charge Ratio and a minimum EBITDA/Interest ratio. They are also subject to the warranties and conditions of the agreements during the term of the facilities, including a change of control clause.
30 June 2014, this loan was fully drawn and after amortisation payments had a balance of Euro 14.9 million. This facility has a maturity date of 30 September 2021 with semi-annual amortisations. The lender is Commerzbank AG.
Secured Debt/EBITDA ratio and a minimum EBITDA/Interest ratio.
exposure.
(e) Net debt

| PMP LIMITED Annual Report 2014 | 67
NOTES TO AND FORMING PART OF THE FINANCIAL STATEMENTS
Deferred Consideration
Restructure Make good Onerous leases & contracts
Other Total
Current $000 $000 $000 $000 $000 $000
Carrying amount at start of year 550 714 110 4,102 1,458 6,934
- additional provisions recognised — 533 192 543 3,908 5,176
- unused amounts reversed — (176) (44) (387) (530) (1,137)
Amounts used during the period (550) (734) (66) (850) (944) (3,144)
Carrying amount at end of year — 337 192 3,408 3,892 7,829
Make good Onerous leases & contracts
Other Total
Non-Current $000 $000 $000 $000
Carrying amount at start of year 1,084 3,582 893 5,559
- additional provisions recognised 32 140 237 409
- unused amounts reversed (350) — (8) (358)
Amounts used during the period (409) (3,718) (688) (4,815)
Carrying amount at end of year 357 4 434 795
PMP Group
2014 2013(Restated*)
Year ended 30 June 2014 NOTES $’000 $’000
14 Provisions
(a) Current provisions
17,283 18,221
Other 7,829 6,934
Total current provisions 25,112 25,155
Non-current provisions
Employee entitlements 1,744 1,846
Other 795 5,559
Total non-current provisions 2,539 7,405
Total provisions 27,651 32,560
(b) Movements in provisions
PMP Group
2014 2013Year ended 30 June 2014 $’000 $’000
15
Forward currency contracts — 5,740
— 5,740
Forward currency contracts 6 —
Cross currency swaps 2,604 2,527
2,610 2,527
2,610 8,267
Forward currency contracts 2,669 —
Interest rate swaps 262 919
Cross currency swaps 30 177
2,961 1,096
Interest rate swaps 144 632
144 632
3,105 1,728
All derivatives designated as effective hedging instruments are carried at fair value apart from interest rate swaps which are carried

68 | PMP LIMITED Annual Report 2014 |
Number PMP Group
2014 2013 2014 2013Year ended 30 June 2014 ‘000 ‘000 $’000 $’000
16 Contributed equity
Issued and paid up capital
Movements in ordinary share capital:
Balance as at 1 July - ordinary shares 323,781 323,781 356,035 356,035
Balance at 30 June - ordinary shares 323,781 323,781 356,035 356,035
Ordinary shares have no par value. Fully paid ordinary shares carry one vote per share and carry the right to dividends.
PMP Group
2014 2013Year ended 30 June 2014 NOTES $’000 $’000
17 Dividends
— —
Total dividends — —
18 Reserves
Foreign currency translation reserve
Opening balance 3,887 1,459
Movement in reserve relating to:
6,150 2,428
Total foreign currency translation reserve 10,037 3,887
Share-based payment reserve
Opening balance 1,120 1,120
Movement in reserve relating to:
- Share-based payment expense 801 —
- Transfer to retained earnings (443) —
- Purchase of shares (200) —
Total share-based payment reserve 1,278 1,120
Opening balance 2,427
Movement in reserve relating to:
(6,068) 6,388
1,782
(1,859) 2,427
Total reserves 9,456 7,434
restatement of balances for the year ended 30 June 2013. Refer to Changes in Accounting Policies.
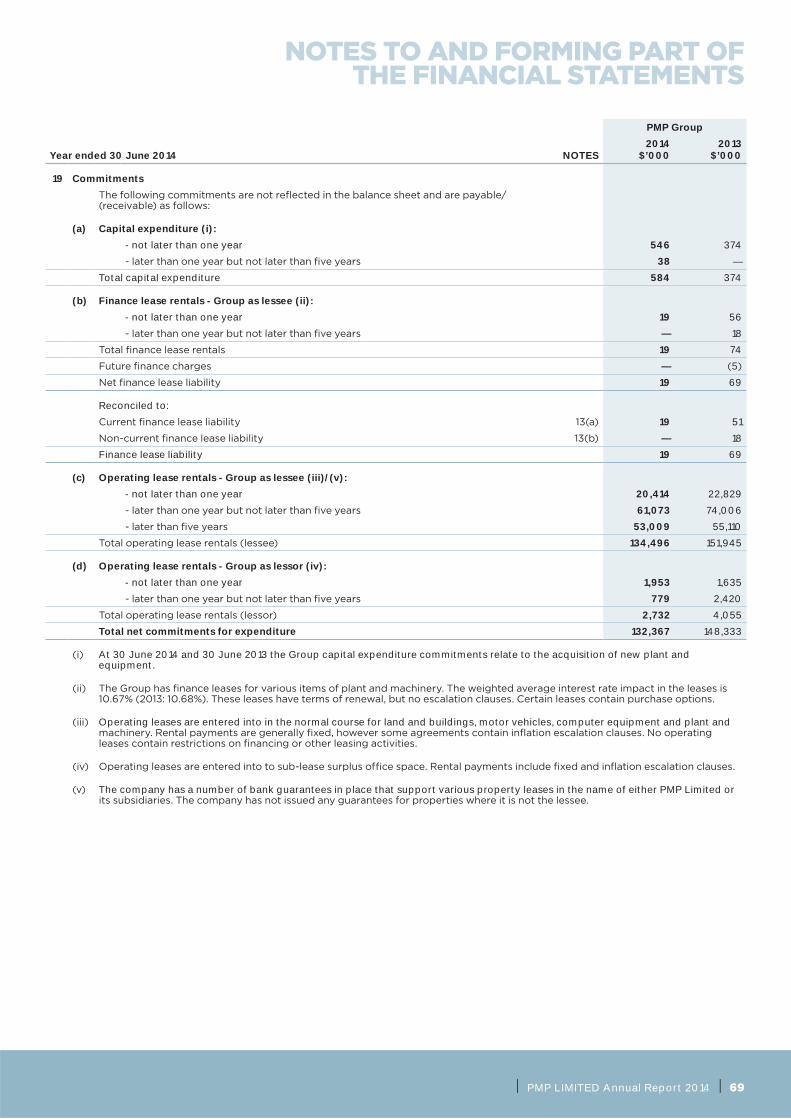
| PMP LIMITED Annual Report 2014 | 69
NOTES TO AND FORMING PART OF THE FINANCIAL STATEMENTS
PMP Group
2014 2013Year ended 30 June 2014 NOTES $’000 $’000
19 Commitments
(a) Capital expenditure (i):
- not later than one year 546 374
38 —
Total capital expenditure 584 374
(b) Finance lease rentals - Group as lessee (ii):
- not later than one year 19 56
— 18
19 74
—
19 69
Reconciled to:
19 51
— 18
Finance lease liability 19 69
(c) Operating lease rentals - Group as lessee (iii)/(v):
- not later than one year 20,414 22,829
61,073 74,006
53,009 55,110
134,496 151,945
(d) Operating lease rentals - Group as lessor (iv):
- not later than one year 1,953 1,635
779 2,420
2,732 4,055
Total net commitments for expenditure 132,367 148,333
At 30 June 2014 and 30 June 2013 the Group capital expenditure commitments relate to the acquisition of new plant and equipment.
Operating leases are entered into in the normal course for land and buildings, motor vehicles, computer equipment and plant and
The company has a number of bank guarantees in place that support various property leases in the name of either PMP Limited or

70 | PMP LIMITED Annual Report 2014 |
Year ended 30 June 2014Country of
Incorporation NOTES
Interest held 2014
%
Interest held 2013
%
20 Controlled entities (d)
Australia 100 100
Attic Futura Pty Limited Australia 100 100
Australia 100 100
Total Sampling Pty Limited Australia 100 100
PMP Publishing Pty Limited Australia 100 100
PMP Print Pty Limited Australia 100 100
PMP Property Pty Limited Australia 100 100
PT Pac-Rim Kwartanusa Printing Indonesia 95 95
PMP Advertising Solutions Pty Limited Australia 100 100
PMP Home Media Pty Limited Australia 100 100
Shomega Pty Limited Australia 100 100
Show-Ads Pty Limited Australia 100 100
Linq Plus Pty Limited Australia 100 100
PMP Wholesale Pty Limited Australia 100 100
PMP Digital Pty Limited Australia 100 100
Australia 100 100
The Argus & Australasian Pty Limited Australia 100 100
Gordon and Gotch Australia Pty Limited Australia 100 100
Australia 100 100
Scribo Holdings Pty Limited Australia 100 100
The Scribo Group Pty Limited Australia 100 100
Tower Books Pty Limited Australia 100 100
Gary Allen Pty Limited Australia 100 100
Australia 100 100
PMP Directories Pty Limited Australia 100 100
Argyle Print Pty Limited Australia 100 100
Red PPR Holdings Pty Limited Australia 100 100
PMP Finance Pty Limited Australia 100 100
PMP Share Plans Pty Limited Australia 100 100
Manningtree Investments Pty Limited Australia 100 100
Canberra Press Pty Limited Australia 100 100
100 100
PMP Print Limited 100 100
PMP Maxum Limited 100 100
PMP Distribution Limited 100 100
100 100
100 100
PMP Digital Limited 100 100
These companies entered into a deed of cross guarantee dated 27 June 2008 with PMP Limited which replaced the previous deed dated 10 June 1992. The deed provides that all parties to the deed will guarantee to each creditor payment in full of any debt of each company participating in the deed on winding up of that company. As a result of a Class Order issued by the Australian
On 11 June 2009 these companies were joined as parties to the Deed of Cross Guarantee referred above.

| PMP LIMITED Annual Report 2014 | 71
NOTES TO AND FORMING PART OF THE FINANCIAL STATEMENTS
2014 2013(Restated*)
Year ended 30 June 2014 NOTES $’000 $’000
20 Controlled entities (continued)
The aggregate assets, liabilities and net result after income tax of the companies which are parties to the Deed of Cross Guarantees are as follows :
Statements of comprehensive income of the closed group
Sales revenue 738,284 817,016
Other revenue 8,979 32,447
Revenue 747,263 849,463
Raw materials and consumables used (174,256)
(259,198)
Employee expenses (199,985)
Outside production services (17,483)
Freight (17,553)
Repairs and maintenance (11,845)
Occupancy costs (15,640)
Other expenses (13,203)
—
38,100
Depreciation and amortisation (26,921)
11,179
Finance costs (9,050)
2,129
(2,936)
(807)
Notes on the closed group:
- PMP Limited is the ultimate parent company of the PMP Group.
- All companies have ordinary share capital.

72 | PMP LIMITED Annual Report 2014 |
2014 2013(Restated*)
Year ended 30 June 2014 NOTES $’000 $’000
20 Controlled entities (continued)
Balance sheet of the closed group
Current assets
Cash and cash equivalents 22,194 15,438
Receivables 69,791 79,023
Inventories 60,864 67,034
Financial assets — 4,363
Other 9,105 8,437
104 4,320
Total current assets 162,058 178,615
Non-current assets
Property, plant and equipment 166,366 190,641
Goodwill and intangible assets 7,476 7,677
Deferred tax assets 47,911 51,692
Financial assets 2,611 2,527
Other 67,190 50,076
Total non-current assets 291,554 302,613
Total assets 453,612 481,228
Current liabilities
Payables 100,627 115,933
15,016 32,848
Income tax payable — —
Provisions 20,323 22,147
Financial liabilities 1,997 687
Total current liabilities 137,963 171,615
Non-current liabilities
56,588 40,997
Deferred tax liabilities 803 2,366
Provisions 2,427 7,405
Financial liabilities 101 331
Total non-current liabilities 59,919 51,099
Total liabilities 197,882 222,714
Net assets 255,730 258,514
Equity
Contributed equity 356,035 356,035
Reserves (60) 2,670
Accumulated losses (100,245)
Total equity 255,730 258,514

| PMP LIMITED Annual Report 2014 | 73 | PMP LIMITED Annual Report 2014 | 73
NOTES TO AND FORMING PART OF THE FINANCIAL STATEMENTS
Ye
ar
en
de
d 3
0 J
un
e 2
014
21
Se
gm
en
tal in
form
ati
on
De
scri
pti
on
of
seg
me
nts
Tra
nsa
cti
on
s b
etw
een s
eg
men
ts a
re c
arr
ied
ou
t at
arm
’s len
gth
an
d a
re e
limin
ate
d o
n c
on
solid
ati
on
.
Se
gm
en
t re
ve
nu
es
an
d r
esu
lts
Th
e f
ollo
win
g is
an a
naly
sis
of
the G
rou
p’s
reven
ue a
nd
resu
lts
by r
ep
ort
ab
le s
eg
men
t fo
r th
e p
eri
od
s p
rese
nte
d:
(a)
Op
era
tin
g S
eg
me
nts
PM
P A
ust
rali
a
(excl. G
&G
)G
ord
on
an
d G
otc
hN
ew
Ze
ala
nd
Co
rpo
rate
Eli
min
ati
on
Co
nso
lid
ate
d
20
142
013
20
142
013
20
142
013
20
142
013
20
142
013
20
142
013
(Re
state
d*)
(Re
state
d*)
$’0
00
$’0
00
$’0
00
$’0
00
$’0
00
$’0
00
$’0
00
$’0
00
$’0
00
$’0
00
$’0
00
$’0
00
Reve
nu
e
Sale
s re
ven
ue
43
9,8
56
4
93
,58
3
29
8,4
26
3
23
,43
0
160
,93
6
158
,79
7
—
—
—
—
89
9,2
18
975
,810
Oth
er
reven
ue
38
1,
08
9
2,4
91
3,0
32
64
4
26
2
,18
6
1,72
9
—
4,7
79
5
,86
8
4,3
99
2
1,3
65
—
—
—
24
5
3,7
93
9
,44
6
(3,7
93
)4
,39
9
27,
25
0
To
tal s
eg
men
t re
ven
ue
44
4,2
93
5
16,0
37
30
0,9
17
326
,46
2
161,
00
0
159
,46
8
5,9
79
11
,175
(3
,79
3)
90
8,3
96
1,
00
8,9
28
Inte
r-se
gm
en
t re
ven
ue
—
—
—
—
—
(3,7
93
)3
,79
3
4,2
14
—
—
To
tal r
even
ue
44
4,2
93
5
15,6
29
3
00
,917
3
26
,46
2
161,
00
0
159
,46
8
2,1
86
7,
36
9
—
—
90
8,3
96
1,
00
8,9
28
46
,78
8
59
,95
8
3,6
80
1,
35
1 17
,611
16
,89
8
(4,6
66
) —
—
6
3,4
13
71,
58
3
Dep
recia
tio
n a
nd
am
ort
isati
on
(25
,85
3)
(23
7)
(7,6
70
)(8
32
) —
—
(3
4,5
92
)
20
,93
5
30
,60
4
3,4
43
1,
142
9,9
41
9,7
09
(5
,49
8)
—
—
28
,82
1 3
3,7
80
(6,3
31)
(3,9
92
)(9
43
)2
,613
7,
740
—
—
(8
,65
3)
14,6
04
(5
49
)4
43
8
,99
8
7,3
99
(2
,88
5)
65
—
—
2
0,1
68
(44
3)
177
Fin
an
ce c
ost
s(1
1,6
34
)
Co
nso
lidate
d e
nti
ty lo
ss b
efo
re in
co
me
8,0
91
(4,6
89
)
Ne
t lo
ss a
fte
r in
com
e t
ax*
3,4
02
Ju
ne 2
013
. Refe
r to
Ch
an
ges
in A
cco
un
tin
g P
olic
ies.

74 | PMP LIMITED Annual Report 2014 |
Ye
ar
en
de
d 3
0 J
un
e 2
014
21
Se
gm
en
tal in
form
ati
on
(co
nti
nu
ed
)
(b)
PM
P A
ust
rali
a
(excl. G
&G
)G
ord
on
an
d G
otc
hN
ew
Ze
ala
nd
Co
rpo
rate
Eli
min
ati
on
Co
nso
lid
ate
d
20
142
013
20
142
013
20
142
013
20
142
013
20
142
013
20
142
013
$’0
00
$’0
00
$’0
00
$’0
00
$’0
00
$’0
00
$’0
00
$’0
00
$’0
00
$’0
00
$’0
00
$’0
00
Gain
on d
isp
osa
l of
pla
nt
an
d e
qu
ipm
en
t
for
sale
42
0
33
2
—
—
—
—
—
—
—
—
42
0
33
2
—
—
—
—
—
24
5
—
5,6
40
—
—
—
5
,88
5
Gain
on d
isp
osa
l of
pro
pert
y3
,97
9
21,
03
3
—
—
—
—
—
—
—
—
3,9
79
2
1,0
33
Inte
r-se
gm
en
t d
eb
t fo
rgiv
en
ess
—
—
—
—
—
—
3,7
93
3
,80
6
(3,7
93
) —
—
4,3
99
2
1,3
65
—
—
—
24
5
3,7
93
9
,44
6
(3,7
93
)4
,39
9
27,
25
0
Dir
ecto
ries’
clo
sure
co
sts
—
—
—
—
—
—
—
— —
—
Rest
ructu
re in
itia
tives
an
d o
ther
on
e o
ff
co
sts
(10
,73
0)
(19
9)
(94
3)
(1,1
80
) —
—
(13
,05
2)
Imp
air
men
t o
f p
lan
t, e
qu
ipm
en
t,
inta
ng
ible
s an
d g
oo
dw
ill d
ue t
o
rest
ructu
re in
itia
tives
—
—
—
—
—
— —
— —
Imp
air
men
t o
f p
lan
t an
d e
qu
ipm
en
t h
eld
fo
r sa
le t
o f
air
valu
e less
co
sts
to s
ell
—
—
—
—
—
—
—
—
— —
—
—
Inte
r-se
gm
en
t d
eb
t fo
rgiv
en
ess
—
(3,7
93
) —
—
—
—
—
3
,79
3
3,8
06
—
—
(10
,73
0)
(3,9
92
)(9
43
)(1
,18
0)
3,7
93
3
,80
6
(13
,05
2)
inco
me t
ax
(6,3
31)
(3,9
92
)(9
43
)2
,613
7,
740
—
—
(8
,65
3)
Fin
an
ce c
ost
s —
—
—
—
—
2
91
(44
3)
—
—
(44
3)
177
—
—
—
—
—
29
1 (4
43
) —
—
(4
43
)17
7

| PMP LIMITED Annual Report 2014 | 75
NOTES TO AND FORMING PART OF THE FINANCIAL STATEMENTS
Ye
ar
en
de
d 3
0 J
un
e 2
014
21
Se
gm
en
tal in
form
ati
on
(co
nti
nu
ed
)
(c)
Oth
er
seg
me
nt
info
rmati
on
i)G
eo
gra
ph
ic S
eg
me
nts
Au
stra
lia
New
Ze
ala
nd
Co
nso
lid
ate
d
20
142
013
20
142
013
20
142
013
$’0
00
$’0
00
$’0
00
$’0
00
$’0
00
$’0
00
Sale
s re
ven
ue
73
8,2
82
8
17,0
13
160
,93
6
158
,79
7
89
9,2
189
75
,810
Oth
er
reven
ue
4,7
15
5,4
42
64
4
26
4
,77
95
,86
8
4,3
99
27,
00
5
—
24
5
4,3
99
27,
25
0
To
tal re
ve
nu
e74
7,3
96
8
49
,46
0
161,
00
0
159
,46
8
90
8,3
96
1,
00
8,9
28
No
n-c
urr
en
t ass
ets
174
,67
1 20
4,5
14
65
,99
9
61,
64
9
24
0,6
70
26
6,1
63
ii)
Majo
r p
rod
uct
an
d s
erv
ice o
ffe
rin
gs
Th
e G
rou
p’s
exte
rnal r
even
ue f
rom
each g
rou
p o
f si
mila
r p
rod
ucts
an
d s
erv
ices
were
as
follo
ws:
Pri
nt
Dis
trib
uti
on
Go
rdo
n a
nd
Go
tch
PM
P D
igit
al
Co
nso
lid
ate
d
20
142
013
20
142
013
20
142
013
20
142
013
20
142
013
$’0
00
$’0
00
$’0
00
$’0
00
$’0
00
$’0
00
$’0
00
$’0
00
$’0
00
$’0
00
Reve
nu
e
Sale
s re
ven
ue
44
6,2
23
4
91,
22
1 10
6,3
14
101,
30
1 3
31,
63
4
36
0,6
52
15,0
47
2
2,6
36
8
99
,218
9
75
,810
To
tal r
even
ue
44
6,2
23
4
91,
22
1 10
6,3
14
101,
30
1 3
31,
63
4
36
0,6
52
15,0
47
2
2,6
36
8
99
,218
9
75
,810

76 | PMP LIMITED Annual Report 2014 |
Year ended 30 June 2014
22 Pension plans
The PMP Group contributes to accumulation plans as a consequence of legislation or Trust Deeds. Legal enforceability is dependent upon the terms of the legislation and the Trust Deeds.
AMP SuperSignature Plan.
PMP manages superannuation commitments through a Superannuation Policy Committee in conjunction with the trustees of
Accumulation funds
i.
ii. Regulatory framework
within which superannuation plans operate. The SIS Regulations require an actuarial valuation to be performed for each
iii. Governance of the plan
The Plan’s Trustee is responsible for the governance of the Plan. The Trustee has a legal obligation to act solely in the best
rules;
- management and investment of the Plan assets; and
- compliance with superannuation laws and other applicable regulations.
superannuation plans.
iv. Risks
are:
Investment risk the risk that investment returns will be lower than assumed and the Company will need to increase contributions to offset this shortfall.
Salary growth risk
Legislative risk
v.
PMP Group
2014 2013(Restated*)
Financial year ending 30 June 2014 NOTES $’000 $’000
(a)
11,046 12,370
Less:fair value of plan assets 12,420 12,962
Net superannuation liability/(asset) (1,374)
(b)
(592) 480
Adjustment to other comprehensive income following adoption of revised AASB 119 —
502 747
Remeasurements (443)
Employer contributions (841)
Net superannuation liability/(asset) (1,374)

| PMP LIMITED Annual Report 2014 | 77
NOTES TO AND FORMING PART OF THE FINANCIAL STATEMENTS
PMP Group
2014 2013(Restated*)
Year ended 30 June 2014 NOTES $’000 $’000
22 Pension plans (continued)
(c)
(592) 480
Adjustment to other comprehensive income following adoption of revised AASB 119 —
Current service cost 361 416
Net interest (49)
190 355
Actual return on plan assets less interest income (891)
142 325
306 345
Employer contributions (841)
(1,374)
If a surplus exists in the plan, PMP Limited expect to be able to take advantage of it in the form of a reduction in the required contribution rate, depending on the advice of the plan’s actuary.
PMP Limited may at any time by notice to the Trustee terminate its contributions. PMP Limited has a liability to pay the contributions due prior to the effective date of the notice, but there is no requirement for it to pay any further contributions,
PMP Group
2014 2013NOTES $’000 $’000
Fair value of plan assets at beginning of the year 12,962 14,170
Interest income 664 798
Actual return on plan assets less interest income 891 1,186
Employer contributions 841 917
Contributions by plan participants 194 246
(991)
Taxes, premiums and expenses paid (113)
Settlements (2,028)
Fair value of plan assets at end of the year 12,420 12,962
PMP Group
2014 2013(Restated*)
NOTES $’000 $’000
(d)
12,370 14,264
Current service cost 361 416
Interest cost 615 774
Contributions by plan participants 194 246
142 325
306 345
(991)
Taxes, premiums and expenses paid (113)
Curtailments 190 355
Settlements (2,028)
11,046 12,370
(e)
Recognised in employee expenses
Current service cost 361 416
Net interest (49)
Loss on curtailments 190 355
Superannuation expense 502 747

78 | PMP LIMITED Annual Report 2014 |
PMP Group
2014 2013(Restated*)
Year ended 30 June 2014 NOTES $’000 $’000
22 Pension plans (continued)
(f) Amounts recognised in other comprehensive income
443 516
(g) Fair value of plan assets
Total
Quoted prices in active markets for
identical assets- Level 1
observable inputs - Level 2
Unobservable inputs - Level 3
As at 30 June 2014 $000 $000 $000 $000
Asset category
Cash and cash equivalents — — — —
Equity instruments — — — —
Derivatives — — — —
Real Estate — — — —
Investment funds 12,420 — 12,420 —
Asset-backed securities — — — —
Structured debt — — — —
Total 12,420 — 12,420 —
by or other assets used by PMP.
PMP Group
2014 2013% %
The percentage invested in each asset class at the reporting date is:
Australian equity 30 30
International equity 28 28
Fixed income 15 16
Property 7 7
Alternatives/Other 17 16
Cash 3 3
(i)
5.1 5.70
Expected salary increase rate 3.50 3.50
4.8 5.10
Expected salary increase rate 3.50 3.50
based on corporate bond yields.

| PMP LIMITED Annual Report 2014 | 79
NOTES TO AND FORMING PART OF THE FINANCIAL STATEMENTS
Year ended 30 June 2014
22 Pension plans (continued)
(j) Sensitivity Analysis
Scenario A and B relate to discount sensitivity. Scenario C and D relate to assumed salary increase rate sensitivity.
Scenario A: 0.5% pa lower discount rate assumption
Scenario B: 0.5% pa higher discount rate assumption
Scenario C: 0.5% pa lower assumed salary increase rate assumption
Scenario D: 0.5% pa higher assumed salary increase rate assumption
Base case Scenario A Scenario B Scenario C Scenario D
-0.5% pa discount rate
+0.5% pa discount rate
-0.5%pa salary increase rate
+0.5% pa salary increase rate
Discount rate 4.80% pa 4.3% pa 5.30% pa 4.80% pa 4.80% pa
Salary increase rate 3.50% pa 3.50% pa 3.50% pa 3.00% pa 4.00% pa
11,046 11,604 10,522 10,842 11,261
other assumptions.
(k) Asset-Liability matching strategies
We are not aware of any asset and liability matching strategies adopted by the Plan.
(l) Funding arrangements
Category % of Salary
N1 6.0
N2 7.5
D 15.0
E1 18.5
- top-up contributions of $45,800 per month from 1 July 2012; and
provided in the plan.
contributions);any pre-tax member contributions; and
100%) exceeds the cumulative value of the top-up employer contributions outlined above, further top-up contributions be made to bring these measures in to line.
(m) Expected contributions
(n)
ending on$000
30 June 2014 781
30 June 2015 945
30 June 2016 1,105
30 June 2017 905
30 June 2018 1,142
Following 5 years 6,508

80 | PMP LIMITED Annual Report 2014 |
Year ended 30 June 2014
23 Share-based payment plans
(a) Employee long term incentive plan
term incentive plan.
Total number of employee options/performance rights issued since commencement: 70,638,024
Total number of employee performance rights issued as at balance date: 11,861,492
3.66%
Total number of employee performance rights issued during the year 3,315,975
Total number of employee performance rights issued post balance date: —
(i) Performance rights
Allotment Date 1/10/10 (i) 1/10/11 (ii) 1/10/12 (iii) 1/10/13 (iv)Total
Number
On issue at beginning of year 710,371 1,338,743 10,094,652 — 12,143,766
Issued during the year — — — 3,315,975 3,315,975
Lapsed during the year —
On issue at end of year — 793,194 7,752,323 3,315,975 11,861,492
— — —
Outstanding at date of Directors’ report — — 7,752,323 3,315,975 11,068,298
— 4 8 12
FY13 results FY14 results FY15 results FY16 results
$0.47 $0.50 $0.06 $0.42
$0.66 $0.63 $0.16 $0.47
October 2010, granted rights to the value of between 15% - 50% of each participant’s total employment cost. The number of rights granted was determined based on the weighted average share price for the one week period up to
Performance rights entitle participants to receive PMP shares for nil cost after vesting. Rights will only vest if relevant performance hurdles are achieved across the following three years FY11, FY12 and FY13 as follows:
exercisable;
target average ROCE set by the Board on commencement of the performance period. The target ROCE for these
exercisable.
These performance rights lapsed on 28 August 2013, following the announcement of the results for the year ended 30 June 2013. Neither the TSR nor the ROCE performance hurdles were met over the three year performance period.

| PMP LIMITED Annual Report 2014 | 81
NOTES TO AND FORMING PART OF THE FINANCIAL STATEMENTS
Year ended 30 June 2014
23 Share-based payment plans (continued)
(a) Employee long term incentive plan (continued)
(i) Performance rights (continued)
In October 2011, granted rights to the value of between 15% - 50% of each participant’s total employment cost. The number of rights granted was determined based on the weighted average share price for the one week period up to
Performance rights entitle participants to receive PMP shares for nil cost after vesting. Rights will only vest if relevant performance hurdles are achieved across the following three years FY12, FY13 and FY14 as follows:
measured against a comparator group of ASX listed companies ranked between S&P/ASX 200 to 300 entities. 50% of rights granted are subject to the TSR hurdle. If a rank of less than the 51st percentile is achieved nil vest, if a rank of between the 51st and 75th percentile is achieved 50-100% of rights vest and if a rank of greater than 75th percentile is achieved 100% vest.
FY12, FY13 and FY14 is measured against a target for the PMP Group. 50% of rights granted are subject to an EBITDA hurdle. The number of rights to vest are pro rated based on a target EBTIDA range.
In October 2012, rights to the value of between 15% - 50% of each executive participant’s total employment cost were granted to executives. The number of rights granted was determined based on the weighted average share price for
Managing Director, Mr Peter George. This grant was approved by shareholders at the 2013 Annual General Meeting.
Performance rights entitle participants to receive PMP shares for nil costing after vesting. Rights will only vest if
In October 2013, rights to the value of between 15% - 50% of each executive participant’s total employment cost were granted to executives. The number of rights granted was determined based on the weighted average share price for
Performance rights entitle participants to receive PMP shares for nil costing after vesting. Rights will only vest if
Rights subject to the TSR hurdle have been independently valued using a Monte Carlo simulation and the Black Scholes model has been used to value the rights with a ROCE and EBITDA performance condition.
The following table lists the inputs to the models used to value the rights granted:
1/10/2010 1/10/2011 1/10/2012 1/10/2013
Dividend yield 2.40% 1.82% 0.00% 0.00%
Expected volatility 50% 50% 60% 60%
Risk-free interest rate 4.80% 3.62% 2.81% 3.11%
Correlation 0.24 Historical share prices used to
calculate the correlation of returns
of PMP and the constituents of the
peer group.
Historical share prices used to
calculate the correlation of returns
of PMP and the constituents of the
peer group.
Historical share prices used to
calculate the correlation of returns
of PMP and the constituents of the
peer group.
Share price at grant date $0.70 $0.66 $0.16 $0.47
The fair value does not contain any discount for forfeiture due to employee leaving before vesting.
(b)
his base remuneration of which 33.3% will be paid in PMP shares, subject to the achievement of the following targets:

82 | PMP LIMITED Annual Report 2014 |
Year ended 30 June 2014
24 Related parties
(a) Key management personnel
Details of key management personnel, including remuneration, are included in the section titled “Remuneration Report” included in the Directors’ report.
amount of emoluments. Any transactions with key management personnel are made on normal commercial terms and conditions.
(b) Compensation of key management personnel
The aggregate compensation made to Directors and other members of key management personnel of the company and the Group is set out below:
PMP Group
2014 2013$ $
2,674,923 4,678,947
5,762 25,684
135,885 232,477
Termination payments — 1,000,000
355,708
Total compensation 3,172,278 5,829,316
accordance with AASB 2 have been independently valued. In accordance with AASB 2 the non-market conditions associated with these rights were not taken into account when estimating the fair value at grant date. Instead, the number of rights expected to eventually vest is re-assessed at the end of each reporting period.
(c) Key management personnel shareholdings
This information is disclosed within the “Remuneration Report” included in the Directors’ Report.
(d) Transactions with key management personnel and their related parties
A number of key management personnel, or their related parties, hold positions in other companies that result in them having
One of these companies transacted with the Group during the year. The terms and conditions of this transaction were no more favourable than those available, or which might reasonably expected to be available, in similar transactions with non-key management personnel related companies on an arm’s length basis.
The aggregate value of transactions and outstanding balances related to key management personnel and entities over which
Transaction value for the year ended 30 June
Balance outstanding as at 30 June
2014 2013 2014 2013Director Transaction $’000 $’000 $’000 $’000
N Sparks Catalogue printing 740 — 74 —
Amounts were billed based on normal market rates for such services and payable under normal payment terms.
(e) Transactions with related parties in the wholly owned group
Details of controlled entities are set out in Note 20. The entities and PMP conduct business transactions between themselves. Such transactions include the purchase and sale of goods, services, plant and equipment and the receipt and payment of management fees, dividends and interest. All such transactions are conducted on the basis of normal commercial terms and conditions, have been eliminated on consolidation and are not disclosed in this note. PMP Limited has made a $448.2 million
(f) Transactions with other related parties
There were no transactions with any other related parties of the PMP Group.

| PMP LIMITED Annual Report 2014 | 83
NOTES TO AND FORMING PART OF THE FINANCIAL STATEMENTS
Year ended 30 June 2014
25 Sale of business
2014
No sale of business occurred during the year ended 30 June 2014.
2013
During the year ended 30 June 2013 PMP Limited accepted Experian Australia Pty Limited’s offer to acquire all the shares in
business was sold on 21st December 2012 and reported as a sale of a business.
Details of the sale of the business were as follows:
2013$’000
Consideration received or receivable 5,661
Carrying amount of net assets sold
Gain on sale before income tax 5,885
Income tax expense 219
Gain on sale after income tax 5,666
The carrying amounts of assets and liabilities as at the date of sale were:
Receivables 1,692
Other assets 478
Property, plant and equipment 342
Intangible assets 186
Deferred tax assets 124
Total assets 2,822
Payables 2,620
Provisions 327
Deferred tax liabilities 99
Total liabilities 3,046
Net assets
US$0.5 million of the sales proceeds was deferred for twelve months. The amount was retained by Experian Australia Pty Limited as a retention fund against any warranty claims or claims in respect of any breaches of the sale and purchase agreement. This amount was received in full in January 2014.
2014 2013Number Number
‘000 ‘000
26 Earnings per share
(a) Weighted average number of ordinary shares
Weighted average number of ordinary shares on issue used in the calculation of basic earnings per share
323,781 323,781
Effect of dilutive securities: —
— —
Weighted average number of shares used in the calculation of diluted earnings per share 323,781 323,781
11,861,492 rights outstanding as at 30 June 2014 are considered anti-dilutive and excluded from the calculation of diluted
share in the future.2014 2013
(Restated)*$’000 $’000
(b) Earnings
3,402
3,402

84 | PMP LIMITED Annual Report 2014 |
PMP Group
2014 2013Year ended 30 June 2014 NOTES $’000 $’000
27
(a)income tax
3,402
Adjustments for non-cash items:
Depreciation 33,948 36,998
Amortisation 644 805
Impairment of plant, equipment, goodwill and intangibles — 65,861
(994)
Movement in provision for tax (1)
Gain on disposal of business —
Net gain on disposal of property, plant and equipment 4,298
Share-based payment plans 801 —
502 747
(2,004)
Change in assets and liabilities:
Accounts receivable 10,049 10,758
Inventories 5,662
(23,474) 7,397
5,295
(1,822)
Prepayments and other assets (762)
Net cash provided from/(used in) operating activities 35,544 7,596
resulting in a change in accounting policy and a restatement of balances for the year ended 30 June 2013. Refer to Changes in Accounting Policies.
(b) Reconciliation of cash and cash equivalents
Cash and cash equivalents 28,745 21,211
Total cash and cash equivalents 28,745 21,211

| PMP LIMITED Annual Report 2014 | 85 | PMP LIMITED Annual Report 2014 | 85
NOTES TO AND FORMING PART OF THE FINANCIAL STATEMENTS
PMP Group
2014 2013Year ended 30 June 2014 NOTES $’000 $’000
28 Financial instruments
currency and interest rate risk), credit risk and liquidity risk. The Group’s overall risk
group.
Financial assets
Cash and cash equivalents 28,745 21,211
Trade and other receivables 5, 7 87,137 99,599
15 2,610 8,267
Other 7 240 240
118,732 129,317
Financial liabilities
Trade and other payables 12 120,825 138,897
Interest bearing liabilities 13a, 13b 83,725 113,318
15 3,105 1,728
207,655 253,943
Details of the accounting policies and methods adopted, including the criteria for recognition, the basis of measurement and
disclosed in Note 1.
(a) Hedging policy - overview
The economic entity trades internationally, giving rise to exposure to market risks from changes in foreign currency exchange rates
a) It does not trade in derivatives that are not used in hedging the underlying business exposure of the economic entity;
b) All hedging is undertaken through the Group’s central treasury operation and is in accordance with Board approved policies.
(b) Interest Rate Management
with the PMP Group policy. These activities are regularly evaluated to ensure that the Group is not exposed to interest rate
covenants.

86 | PMP LIMITED Annual Report 2014 |
Year ended 30 June 2014
28 Financial instruments (continued)
(b) Interest Rate Management (continued)
i) Interest rate risk exposure
outstanding.
30 June 2014 30 June 2013
Weighted average
interest rate Balance
Weighted average
interest rate Balance
% $’000 % $’000
Bank loans — — 6.4%
Bank loans 6.7% 6.2%
Bank loans 2.4% 2.3%
Corporate Bond 8.8% — —
Cross Currency Interest Rate Swaps
2.4% 21,586 2.3% 23,776
6.7% 7.1%
2.7% 15,000 2.8% 40,000
4.2% 4.6%
3.4% 6,992 2.6% 29,394
4.9% 5.0%
Finance Lease Liabilities 10.7% 10.7%
8.3% 7.7%
Cash and cash equivalents 2.6% 28,745 2.6% 21,211
a margin between 275 and 350 basis points. In 2014, the average borrowing rate excluding capitalised fees and charges was
PMP Group
2014 2013NOTES $’000 $’000
ii) Fair value of interest rate swaps
Australian Dollar interest rate swaps (301)
(105)
Total fair value of interest rate swaps 15 (406)
At 30 June 2014, $0.8 million of income has been recorded in the Statement of
iii) Fair value of cross currency swaps
Australian Dollar / Euro cross currency interest rate swaps 2,574 2,350
Total fair value of cross currency swaps 15 2,574 2,350
iv) Interest rate sensitivity analysis - Fair Value Interest Rate Risk
PMP Group
2014 2013$’000 $’000
Interest rates increase 1% 377 1,170
Interest rates decrease 1% (385)

| PMP LIMITED Annual Report 2014 | 87 | PMP LIMITED Annual Report 2014 | 87
NOTES TO AND FORMING PART OF THE FINANCIAL STATEMENTS
Year ended 30 June 2014
28 Financial instruments (continued)
(b) Interest Rate Management (continued)
v)
PMP Group
2014 2013$’000 $’000
Interest rates increase 1% (264)
Interest rates decrease 1% 264 325
(c) Liquidity risk management
PMP manages liquidity risk by maintaining adequate reserves, banking facilities and borrowing facilities by continually
groupings based on the remaining period at the reporting date to the contractual maturity date. The amounts shown in the
PMP Group
30 June 2014 Carrying amount
Contractual Less than one year
1 to 2 years
2 to 5 years
> 5 years
Interest bearing liabilities $’000 $’000 $’000 $’000 $’000 $’000
Bank Overdraft - Australia — — — — — —
Corporate Bond - Australia 50,000 65,313 4,375 4,375 56,563 —
Bank Loans - Australia — — — — — —
Bank Loans 12,120 12,549 12,549 — — —
Bank Loans - Euro 21,586 23,928 3,374 3,300 9,652 7,602
Interest Rate Swaps - Aust 301 301 200 101 — —
Interest Rate Swaps 105 105 62 32 11 —
Cross Currency Swaps - AUD/EURO
3,624 3,482 9,652 6,871
Finance lease liabilities 19 19 19 — — —
Forward FX Contracts
— — —
70,530 70,530 — — —
Payables 120,825 120,825 120,825
Total 199,718 292,897 211,810 7,990 66,226 6,871
PMP Group
30 June 2013 Carrying amount
Contractual Less than one year
1 to 2 years
2 to 5 years
> 5 years
Interest bearing liabilities $’000 $’000 $’000 $’000 $’000 $’000
Bank Overdraft - Australia — — — — — —
Bank Loans - Australia 50,000 53,149 32,805 20,344 — —
Bank Loans 39,473 42,986 2,799 40,187 — —
Bank Loans - Euro 23,776 27,274 3,311 3,341 9,933 10,689
Interest Rate Swaps - Aust 753 856 559 239 58 —
Interest Rate Swaps 798 893 441 237 215 —
Cross Currency Swaps - AUD/EURO 602
3,826 3,676 10,419 10,129
Finance lease liabilities 69 74 56 18 — —
Forward FX Contracts
— — —
2 68,060 68,060 — — —
Payables 138,897 138,897 138,897 — — —
Total 245,676 332,400 247,000 64,684 10,642 10,074
Refer to next page.

88 | PMP LIMITED Annual Report 2014 |
Year ended 30 June 2014
28 Financial instruments (continued)
(c) Liquidity risk management (continued)
This represents the Australian Dollar equivalents of the interest and principal payments due on the cross currency swap.
This represents the Australian Dollar equivalents of the foreign currency payment/receipt leg of the forward foreign exchange contracts.
(d) Foreign exchange management
to changes in foreign currency rates. The Group’s foreign currency exchange risk arises primarily from where the Group has
currencies, where the price is dependant on foreign currencies, or where there is a risk that arises on translation of net investments in foreign operations.
Dollar, the US Dollar, the Euro and the Great British Pound.
various foreign suppliers) in each currency in accordance with the Group’s risk management policy.
Foreign exchange risk arises from foreign denominated borrowings. These borrowings are hedged back into the local currency via the use of hedging instruments. This is to ensure that the risk from movements in exchange rates and foreign interest rates are eliminated.
Foreign currency risk also arises on translation of the net assets of PMP’s non-Australian controlled entities which have a different functional currency. The foreign currency gains or losses arising from this risk are recorded through the foreign currency translation reserve on translation to Australian Dollars on consolidation. This translation foreign currency risk is managed with borrowings denominated in the currency of the entity concerned.
appropriate.
i) Foreign currency borrowings
Liabilities Assets
2014 2013 2014 2013$’000 $’000 $’000 $’000
Euro borrowings 21,586 20,751 — —
Cross Currency Swap (21,586) — —
— —
ii) Australian entity contracts to exchange foreign currency - relating to receipts and payments
Average exchange rate PMP Group
2014 2013 2014 2013$ $ $’000 $’000
United States Dollars - less than one year 0.912 0.999 22,426 11,711
UK Pounds - less than one year — 0.607 — 34
UK Pounds receivables - less than one year 0.552 0.609 (324)
Euros - less than one year 0.651 0.775 26,537 35,947
48,639 47,301
iii) New Zealand entity contracts to exchange foreign currency - relating to receipts and payments
NZ Dollars AUD $ EquivalentAverage exchange rate PMP Group
2014 2013 2014 2013 2014 2013$ $ NZD $’000 NZD $’000 $’000 $’000
United States Dollars - less than one year 0.828 0.824 22,657 24,180 21,124 20,308
22,657 24,180 21,124 20,308

| PMP LIMITED Annual Report 2014 | 89
NOTES TO AND FORMING PART OF THE FINANCIAL STATEMENTS
Year ended 30 June 2014
28 Financial instruments (continued)
(d) Foreign exchange management (continued)
iv) Australian entity contracts to exchange foreign currency - relating to capital expenditure
Average exchange rate PMP Group
2014 2013 2014 2013$ $ $’000 $’000
Euros - less than one year — 0.775 — 60
— 60
v) New Zealand entity contracts to exchange foreign currency - relating to capital expenditure
NZ Dollars AUD $ EquivalentAverage exchange rate PMP Group
2014 2013 2014 2013 2014 2013$ $ NZD $’000 NZD $’000 $’000 $’000
UK Pounds - less than one year 0.506 — 475 — 443 —
475 — 443 —
vi) Fair value of forward exchange contracts
PMP Group
2014 2013NOTES $’000 $’000
Australian entity - foreign exchange contracts relating to receipts (1)
Australian entity - foreign exchange contracts relating to payments (1,759) 4,361
- foreign exchange contracts relating to payments (896) 1,376
Australian entity - foreign exchange contracts relating to capital expenditure — 5
- foreign exchange contracts relating to capital expenditure (8) —
Total fair value of forward exchange contracts (2,663) 5,740
Comprised of:
Financial assets - current 15 — 5,740
Financial assets - non current 15 6 —
Financial liabilities - current 15 (2,669) —
Total fair value of forward exchange contracts (2,663) 5,740

90 | PMP LIMITED Annual Report 2014 |
Year ended 30 June 2014
28 Financial instruments (continued)
(d) Foreign currency management (continued)
vii) Fair value of forward exchange contracts (continued)
viii) Foreign currency sensitivity risk
The following table shows the effect on equity excluding tax effect as at 30 June from a 10% adverse / favourable movement in exchange rates at that date on a total portfolio basis with all other variables held constant, taking into account all underlying exposures and related hedges.
Adverse versus favourable movements are determined relative to the underlying exposure. An adverse movement in
A favourable movement in exchange rates implies a reduction in foreign currency risk exposure and an improvement in
A sensitivity of 10% has been selected as this is considered reasonable given the current level of exchange rates and the volatility observed both on an historical basis and market expectations for future movement. Comparing the Australian dollar
year end rates would give the following adverse and favourable rates:
Year end 10% rate 10% raterate increase decrease
Australia dollar to:
United States dollar 0.941 1.035 0.856
Euro 0.691 0.760 0.628
United States dollar 0.877 0.965 0.798
PMP Group
Equity at 30 June
2014 2013$000 $000
(6,458)
If there was a 10% decrease in exchange rates with all other variables held constant - increase 3,853 5,371
The impact on the parent entity PMP Limited would be $nil as the entity does not hold forward exchange contracts.
For the PMP Group, foreign currency translation risk associated with PMP’s foreign investments results in some volatility to the foreign currency translation reserve. The impact on the foreign currency translation reserve relates to the translation of the net assets of foreign currency controlled entities on consolidation.
(e) Credit Risk
Group’s exposure to credit risk arises from the potential default of the counter party, with a maximum exposure equal to the
institution.
PMP has an approved Credit Policy Manual which provides guidelines for the management of credit risk. This provides guidance for the way in which the credit risk of customers is assessed, and the use of credit risk rating and other information in order to set appropriate trading limits with customers.
In some instances security may be required to be supplied to PMP from customers to minimise risk. The security is either in the form of Director guarantees for their business which is secured over a residential property or may be an upfront payment of between 75% - 50% of the trade before executing the sale.

| PMP LIMITED Annual Report 2014 | 91
NOTES TO AND FORMING PART OF THE FINANCIAL STATEMENTS
Year ended 30 June 2014
28 Financial instruments (continued)
(f) Capital management
returns to investors based on the following considerations:
- Listed comparables and market expectations;
shareholder returns.
The group has target gearing levels in the range of:
- Net debt to EBITDA below 2 times. As at 30 June 2014 it was at 0.8 times
the range taking into account the earnings of the business over the next 12-24 months. Due to the level of EBITDA and the industry we operate in, we believe that the investors expect PMP to maintain a lower level of gearing.
(g) Fair values
(h) Fair value measurements
purposes.
The fair value measurement hierarchy:
The following tables present the Group’s assets and liabilities measured and recognised at fair value.
Level 1 Level 2 Level 3 TotalPMP Group - 30 June 2014 $’000 $’000 $’000 $’000
Financial derivatives being hedge accounted
Forward Foreign Exchange Contracts — —
Cross Currency Swaps — 2,574 — 2,574
Interest Rate Swaps — —
Foreign Exchange Option Contracts — — — —
— —
Level 1 Level 2 Level 3 TotalPMP Group - 30 June 2013 $’000 $’000 $’000 $’000
Financial derivatives being hedge accounted
Forward Foreign Exchange Contracts — 5,740 — 5,740
Cross Currency Swaps — 2,350 — 2,350
Interest Rate Swaps — —
Foreign Exchange Option Contracts — — — —
— 6,539 — 6,539
determined using valuation techniques adjusted for non-performance/credit risk. The Group uses a variety of methods and makes assumptions that are based on market conditions existing at the end of each reporting period. Quoted market prices or dealer
reference to market values for similar instruments. The fair value of forward exchange contracts is calculated by reference to

92 | PMP LIMITED Annual Report 2014 |
Year ended 30 June 2014
29 Contingent liabilities
The Company:
- PMP has guaranteed the debts of certain wholly owned Australian controlled entities in accordance with a Deed of Guarantee and class order number 98/1418 issued by the Australian Securities and Investments Commission, which
Related bodies corporate:
arrangements.
- Wholly owned entities in the PMP Group have provided guarantees to banks, in respect of debt and foreign currency management.
contribute annually such amounts as the actuaries consider necessary to secure the rights of members.
30 Subsequent events
The Directors are not aware of any matters or circumstance arising since balance date not otherwise dealt with in this report
Group, the results of those operations or the state of affairs of the PMP Group in subsequent years.
31 Interest in jointly controlled entity
which was resident in Australia and the principal activity of which was operating a merchandising business in Australia. This
method of accounting and was carried at cost by Gordon & Gotch Australia Pty Ltd.

| PMP LIMITED Annual Report 2014 | 93
NOTES TO AND FORMING PART OF THE FINANCIAL STATEMENTS
PMP Limited
2014 2013Year ended 30 June 2014 NOTES $’000 $’000
32 Parent
PMP Limited.
Financial performance of the parent
(96,254)
310 209
Total comprehensive income (95,944)
Financial position of the parent at year end
Current assets 151,725 505,830
Non-current assets 134,199 204,004
Total assets 285,925 709,834
Current liabilities 122,462 451,394
Non-current liabilities 279 406
Total liabilities 122,741 451,800
Total equity of the parent comprising of:
Contributed equity 356,035 356,035
Accumulated losses (194,129)
Share-based payment reserve 1,278 1,120
Total equity 163,184 258,034
30 June 2013. Refer to Changes in Accounting Policies.

94 | PMP LIMITED Annual Report 2014 |
PMP Limited
2014 2013Year ended 30 June 2014 $’000 $’000
32 Parent (continued)
Parent capital commitments for acquisition of property, plant and equipment
Capital expenditure :
- not later than one year — —
Total capital expenditure — —
Parent operating commitments for lease rental
Operating lease rentals - parent as lessee :
- not later than one year 3,554 4,404
7,553 7,563
2,023 3,326
13,130 15,293
Operating lease rentals - parent as lessor :
- not later than one year 1,413 1,367
— 1,917
1,413 3,284
Investment in controlled entities
PMP Limited has impaired its investment in controlled entities during the year ended 30 June 2014 by $84.5 million
Parent capital guarantees in respect of debts of certain subsidiaries
The parent has entered into a deed of guarantee whereby the parent guarantees debts in respect of subsidiaries. Further details of the deed of cross guarantee and the subsidiaries subject to the deed are disclosed in Note 20.
Parent contingent liabilities

| PMP LIMITED Annual Report 2014 | 95
DIRECTORS’ DECLARATION
In accordance with a resolution of the Directors of PMP Limited, we state that:
in the Directors’ opinion, there are reasonable grounds to believe that the company will be able to pay its debts as and when they become due and payable;
the Corporations Act 2001, including compliance with accounting standards and giving a true and fair
the Directors have been given the declarations required by section 295A of the Corporations Act 2001
At the date of this declaration, the company is within the class of companies affected by ASIC Class Order 98/1418. The nature of the deed of cross guarantee is such that each company which is party to the deed guarantees to each creditor payment in full of any debt in accordance with the deed of cross guarantee.
In the Directors’ opinion there are reasonable grounds to believe that the company and the companies to
able to meet any obligations or liabilities to which they are, or may become liable, subject by virtue of the deed of cross guarantee.
Act 2001.
On behalf of the Directors
Matthew Bickford-Smith
Chairman
Peter George
Sydney, 29th August 2014

96 | PMP LIMITED Annual Report 2014 |
INDEPENDENT AUDIT REPORT
Independent Auditor’s Report to the members of PMP Limited
Report on the Financial Report We have audited the accompanying financial report of PMP Limited, which comprises the statement of financial position as at 30 June 2014, the statement of profit or loss and other comprehensive income, the statement of cash flows and the statement of changes in equity for the year ended on that date, notes comprising a summary of significant accounting policies and other explanatory information, and the directors’ declaration of the consolidated entity, comprising the company and the entities it controlled at the year’s end or from time to time during the financial year as set out on pages 42 to 95. Directors’ Responsibility for the Financial Report The directors of the company are responsible for the preparation of the financial report that gives a true and fair view in accordance with Australian Accounting Standards and the Corporations Act 2001 and for such internal control as the directors determine is necessary to enable the preparation of the financial report that gives a true and fair view and is free from material misstatement, whether due to fraud or error. In Note 1, the directors also state, in accordance with Accounting Standard AASB 101 Presentation of Financial Statements, that the financial statements comply with International Financial Reporting Standards. Auditor’s Responsibility Our responsibility is to express an opinion on the financial report based on our audit. We conducted our audit in accordance with Australian Auditing Standards. Those standards require that we comply with relevant ethical requirements relating to audit engagements and plan and perform the audit to obtain reasonable assurance whether the financial report is free from material misstatement. An audit involves performing procedures to obtain audit evidence about the amounts and disclosures in the financial report. The procedures selected depend on the auditor’s judgement, including the assessment of the risks of material misstatement of the financial report, whether due to fraud or error. In making those risk assessments, the auditor considers internal control, relevant to the entity’s preparation of the financial report that gives a true and fair view, in order to design audit procedures that are appropriate in the circumstances, but not for the purpose of expressing an opinion on the effectiveness of the entity’s internal control. An audit also includes evaluating the appropriateness of accounting policies used and the reasonableness of accounting estimates made by the directors, as well as evaluating the overall presentation of the financial report.
Deloitte Touche Tohmatsu A.B.N. 74 490 121 060 Grosvenor Place 225 George Street Sydney NSW 2000 PO Box N250 Grosvenor Place Sydney NSW 1220 Australia DX 10307SSE Tel: +61 (0) 2 9322 7000 Fax: +61 (0) 2 9322 7001 www.deloitte.com.au
Liability limited by a scheme approved under Professional Standards Legislation.
Member of Deloitte Touche Tohmatsu Limited

| PMP LIMITED Annual Report 2014 | 97
We believe that the audit evidence we have obtained is sufficient and appropriate to provide a basis for our audit opinion. Auditor’s Independence Declaration In conducting our audit, we have complied with the independence requirements of the Corporations Act 2001. We confirm that the independence declaration required by the Corporations Act 2001, which has been given to the directors of PMP Limited, would be in the same terms if given to the directors as at the time of this auditor’s report. Opinion In our opinion, the financial report of PMP Limited is in accordance with the Corporations Act 2001, including: (a) giving a true and fair view of the consolidated entity’s financial position as at 30 June 2014 and of
its performance for the year ended on that date; and (b) complying with Australian Accounting Standards and the Corporations Regulations 2001. Report on the Remuneration Report We have audited the Remuneration Report included in pages 28 to 38 of the directors’ report for the year ended 30 June 2014. The directors of the company are responsible for the preparation and presentation of the Remuneration Report in accordance with section 300A of the Corporations Act 2001. Our responsibility is to express an opinion on the Remuneration Report, based on our audit conducted in accordance with Australian Auditing Standards. Opinion In our opinion the Remuneration Report of PMP Limited for the year ended 30 June 2014, complies with section 300A of the Corporations Act 2001.
DELOITTE TOUCHE TOHMATSU
T Hynes Partner Chartered Accountants Sydney, 29 August 2014

98 | PMP LIMITED Annual Report 2014 |
2010 <a> 2011 <a> 2012 <a> 2013 <a> 2014 % change(Restated)*
SALES REVENUE
PMP Australia A$ mill 607.7 591.9 564.0 493.6 439.9
Gordon and Gotch Australia A$ mill 408.9 413.4 358.5 323.4 298.4
A$ mill 195.5 189.0 171.4 158.8 160.9 1.3
Total Sales Revenue A$ mill 1,212.1 1,194.3 1,093.9 975.8 899.2
PROFITABILITY
EBITDA A$ mill 92.8 100.1 76.5 71.6 63.4
EBIT
PMP Australia A$ mill 49.0 56.6 39.9 30.6 20.9
Gordon and Gotch Australia A$ mill 7.5 3.7 1.0 1.1 3.4 —
A$ mill 5.5 4.8 1.6 9.7 9.9 2.4
Corporate A$ mill (5.5) 28.4
Total EBIT A$ mill 52.2 56.7 32.7 33.8 28.8
PMP Australia EBIT/sales % 8.1 6.9 7.1 6.2 4.8
Gordon and Gotch Australia EBIT/sales % 1.8 0.9 0.3 0.4 1.2 —
% 2.8 2.6 0.9 6.1 6.2 1.0
Total EBIT/sales % 4.3 4.7 3.0 3.5 3.2
OTHER
Net cash provided by operating activities A$ mill 74.7 70.2 31.4 7.6 35.5 —
cents 6.2 1.1 —
cents 6.1 1.1 —
cents — <b> 1.0 <c> 2.0 — — —
Total assets A$ mill 792.8 738.1 661.8 549.2 502.7
Total net debt A$ mill 168.1 141.0 143.3 89.1 51.7
Total shareholders equity A$ mill 374.9 355.3 320.7 258.6 264.8 2.4
Debt/Equity Ratio % 44.8 39.7 44.7 34.4 19.5 43.3
Interest Cover times 5.3 6.7 4.9 4.7 5.1 7.8
Depreciation A$ mill 39.5 39.6 40.2 37.0 34.0 8.2
Amortisation A$ mill 1.2 3.8 3.6 0.8 0.6 21.0
Capital Expenditure A$ mill 30.9 <d> 39.7 <e> 29.6 23.8 5.2 78.2
Employees Full Time No. 2,678 2,622 2,159 1,587 1,360 14.3
<a> During 2013 PMP changed its segment reporting structures due to a change in its functional organisational structure. Comparatives
have been restated for 2009.
<b> Final dividend for the year ended 30 June 2010 of 1.0 cent, fully franked
<c> Final dividend for the year ended 30 June 2011 of 1.0 cent and interim dividend for the year ended 30 June 2012 of 1.0 cent both fully franked.
<d> Includes cash paid for the business and assets of International Print Limited.
<e> Includes cash pre-paid for the construction of a printing press.
restatement of balances for the year ended 30 June 2013. Refer to Changes in Accounting Policies.
FIVE YEAR SUMMARY

| PMP LIMITED Annual Report 2014 | 99
Shares and Options / Rights
Shares on issue 323,781,124
Rights on issue —
11,861,492
Total rights/options 11,861,492
Distribution of Shareholders Number of Shareholders
Number of Shares
% of Issued Capital
1 - 1,000 724 417,693 0.13
1,001 - 5,000 1,801 5,075,456 1.57
5,001 - 10,000 422 3,405,024 1.05
10,001 - 100,000 636 24,087,787 7.44
100,001 and over 111 290,795,164 89.81
Total number 3,694 323,781,124 100
Unmarketable Parcels: minimum $500.00 parcel at $ 0.475 per unit is 1,053 739 433,186 —
Name of Substantial Shareholder Number of Securities
% Voting Power
Allan Gray Investment Management 55,495,063 17.1
48,405,278 14.9
Fraser & Neave 39,020,117 12.1
Lanyon Asset Management 37,983,137 11.7
PM Capital 28,211,489 8.7
Dimensional Fund Advisors 16,399,475 5.1
Twenty Largest Shareholders Number of Shares
% of Total Issued
Citicorp Nominees Pty Limited 75,593,396 23.35
J P Morgan Nominees Australia Limited 65,439,935 20.21
National Nominees Limited 50,448,573 15.58
Lanyon Asset Management Pty Limited <Sp No 1 A/C> 19,241,426 5.94
Aust Executor Trustees Ltd <Lanyon Aust Value Fund> 18,741,711 5.79
BNP Paribas Noms Pty Ltd <DRP> 9,068,814 2.80
8,332,442 2.57
UBS Nominees Pty Ltd 7,158,356 2.21
RBC Investor Services Australia Nominees Pty Limited <Bkcust A/C> 6,563,120 2.03
2,199,043 0.68
Idriscorp Pty Ltd <Morgan Super Fund A/C> 1,900,000 0.59
Mr Peter Murray + Mr Michael Gannon <Peter Murray Super Fund A/C> 1,300,000 0.40
Mr Anthony Cotterell + Ms Bridget Mary Naude + Mr Marc Paul Dineen <Ancot A/C> 1,195,295 0.37
Miss Yan Li 1,100,000 0.34
ABN Amro Clearing Sydney Nominees Pty Ltd <Custodian A/C> 797,425 0.25
Philanthropic Investors Club Pty Ltd <Philanthropic Invst Fnd A/C> 796,569 0.25
Dr Janet Dawn Kencian 761,633 0.24
Mr Mark Herdman + Mrs Heather Fletcher Herdman <The Constantia A/C> 700,000 0.22
Rooster Booster Pty Limited 643,000 0.20
QIC Limited C/- National Nominees Limited, 514,713 0.16
Total Top 20 Holders of Fully Paid Ordinary Shares 272,495,451 84.16
Total Remaining Holders Balance 51,285,673 15.84
SHARE REGISTER INFORMATION AS AT 19 AUGUST 2014

100 | PMP LIMITED Annual Report 2014 |
SHAREHOLDER DETAILS
PMP shareholders who:
have changed their name or address
wish to consolidate two or more separate holdings
wish to lodge their tax file numbers
do not wish to receive an Annual Report
should advise PMP’s share registry by completing the relevant forms available from www.computershare.com or by telephoning 1300 556 161 to request the appropriate forms.
Shareholders accessing the Computershare website will need to key in their Holder Identification Number (HIN) if their securities are broker-sponsored and held in CHESS, while shareholders with securities held in an issuer-sponsored sub-register will need to key in their Security Reference Number (SRN).
TAX FILE NUMBERS
It is important that Australian resident shareholders have their tax file number or exemption details noted by the share registry. While it is not compulsory to provide a tax file number or exemption details, PMP is required by law to deduct tax at the top marginal rate from the unfranked part of any dividend paid to Australian resident shareholders who have not supplied these details.
RECEIVE INFORMATION BY EMAIL
Shareholders can receive notifications about company announcements, annual and periodic reports and other company information by email.
By registering for this service, shareholders can be kept up to date with significant company announcements as they happen.
TO REGISTER ELECTRONICALLY:
Visit www.pmplimited.com.au and follow these easy steps:
Click on Register Your Email Address for shareholder information
Then enter your personal security information:
Holder Identification Number (HIN) or Security Reference Number (SRN)
Postcode
Click on “Submit” and follow the prompts
Then just click on ‘reply’ to confirm your details, then ‘send’.
SHARE REGISTRY
Computershare Investor Services Pty Limited Level 5, 115 Grenfell Street Adelaide SA 5000 GPO Box 1903 Adelaide SA 5001
Enquiries within Australia: 1300 556 161
Enquiries outside Australia: +61 3 9415 4000
Email: [email protected]
Website: www.computershare.com
CHIEF ENTITY AUDITORS
Deloitte Touche Tohmatsu
PRINCIPAL BANKERS
ANZ Banking Group Limited Commonwealth Bank of Australia Commerzbank AG
INVESTOR INFORMATION
Shareholders requiring information should contact the share registry, or:
Geoff Stephenson Chief Financial Officer
Telephone: 02 9412 6000 Facsimile: 02 9413 3942 Email: [email protected]
SHAREHOLDER INFORMATION ASX CODE: PMP
The PMP Limited Annual General Meeting
will be held at 11:00am on Thursday 20 November 2014 at
The Grace Hotel 77 York Street, Sydney NSW 2000
Details of the business of the meeting are contained in the separate Notice of Meeting sent to shareholders
Alistair ClarksonBCom LLB MBA ACIS GradDipACG
Company Secretary

The 2014 Annual Report was produced by PMP Limited companies
| PMP LIMITED Annual Report 2014 |
Concept, Design and Photography
Dimension Studios
Units 14-17
32 Ralph Street
Alexandria NSW 2015
Australia
Tel: +61 02 9490 7239
PMP Maxum (NZ) Limited
122 Kerrs Rd,
Wiri, Auckland, New Zealand
Tel: +64 09 928 4200
Paper sourcing
PMP’s Paper Procurement Policy requires that
all paper used by the company is sourced in a
sustainable and responsible manner consistent
with recognised international standards. This
policy enables our customers to have a high level
of confidence in the sustainability of their printed
communications.
When producing this annual report, PMP applied
the following additional criteria:-
Support paper suppliers who are striving to
achieve the highest sustainability targets;
Insist on FSC or PEFC accredited paper;
Support a printer which is also striving to
achieve the highest sustainability targets
(PMP Maxum);
Offset the life cycle greenhouse gas emissions
from the annual report.
The paper used in this report is produced from
well managed and legally harvested forests,
is manufactured under an ISO14001 compliant
environmental management system and uses
elemental chlorine free, FSC certified pulp.
The life cycle greenhouse gas emissions
of this annual report were calculated in
line with PAS 2050 and offset with Verified
Carbon Standard credits.

PMP LIMITEDABN 39 050 148 644
Level 12 67 Albert Avenue Chatswood New South Wales 2067
Tel: 02 9412 6000 Fax: 02 9413 3942 pmplimited.com.au