annual report - sherwood state school model developed by fisher and frey (2014); - developing a...
TRANSCRIPT

1
Sherwood State School
2016 ANNUAL REPORT
Queensland State School Reporting
Inspiring minds. Creating opportunities. Shaping Queensland’s future. Every student succeeding. State Schools Strategy 2016-2020
Department of Education and Training

2
Contact Information
Postal address: PO Box 19 Sherwood 4075
Phone: (07) 3716 2111
Fax: (07) 3716 2100
Email: [email protected]
Webpages: Additional reporting information pertaining to Queensland state schools is located on the My School website and the Queensland Government data website.
Contact Person: Dr Greg Nelson

3
School Overview
Sherwood performs exceptionally across many school dimensions. Reading and mathematics are particular
strengths. We also perform significantly better than the National mean in many other curriculum areas.
Remarkably high percentages of our students achieve in the top two bands of the NAPLAN results. Sherwood
employs full time music and physical education specialists. Chinese Mandarin is taught in Years 5, 6 and 7. La
Bella Voci, our audition choir, has achieved a rare Platinum Award at the Brisbane Choral Festival on numerous
occasions. The instrumental music program provides specialist tuition for strings, brass, woodwind and
percussion. The social skills and student leadership programs are at the heart of our high quality education
programs, and our students are recognised for their friendly caring manner. Facilities include a swimming pool,
tennis courts and generous playing fields. All classrooms are air-conditioned and utilise high quality computer
facilities including electronic whiteboards. Robotics is an expanding area of interest. Our school community has a
strong sense of care and pride in what we do daily for students.
Principal’s Forwarde
Introduction
The 2016 School Annual Report (SAR) provides an overview of important information about our school. The
information provided includes progress towards our school targets, the aspirations we have for the future, a
profile of student enrolments and an overview of our curriculum offerings. The SAR also includes information
about parent, student and staff satisfaction with the school, ways in which parents are involved in the school,
and a staff profile. In addition, there is important information about student performance as well as links to
further information located on the MySchool website.
School Progress towards its goals in 2016
We have a strong commitment to continuous improvement that builds on our enviable success over many years.
In 2016 our priorities included:
- Writing within the broader context of literacy across the curriculum;
- Building a core consistent approach to teaching across all classrooms based on the Gradual Release of
Responsibility model developed by Fisher and Frey (2014);
- Developing a strong school wide competency for using key data to inform effective teaching and
learning.
The focus on reading across the school has resulted in impressive improvements in student capacities
particularly in the way students understand and apply what they are reading. The approach the school has taken
is founded on systematic collection of key reading data and effectively matching the needs of students with the
appropriate teaching strategies. This approach supports students who are struggling with their learning as well
as the students who are exceeding their Year Level expectations. Differentiation is a foundation of daily teaching
practices at Sherwood.
The Gradual Release of Responsibility model developed by Fisher and Frey (2014) is one that our teachers feel
familiar with but our strategy is to refine and extend on already high quality teaching. There are a series of
phases to this model:
4
Phase 1: Focussed Instruction – where the teacher outlines the purpose of the lesson and expertly
models what the students are expected to learn.
Phase 2: Guided Instruction – where the teacher works together with students to co-construct an
activity, the teacher asks timely questions to prompt student thinking, and provides cues and
prompts when required to help scaffold the students’ progress.
Phase 3: Collaborative Learning – where the students work productively in pairs or small groups to
practice their learning. In this phase the teacher is actively teaching the students how to work together
effectively as a team.
Phase 4: Independent Learning – where the students work independently to further develop their
mastery. High quality teacher feedback is vital in this phase as is student capacities for time
management, persistence and problem solving.
This Gradual Release of Responsibility model of teaching is evident in all classrooms at Sherwood and teachers
continue to build their expertise around this core approach to effective teaching and learning. In 2016 the work
focussed on Effective Feedback and Productive Group Work as a continuation of this model.
The third priority is using key data to inform effective teaching and learning. The systematic collection and
analysis of student data at all levels across the school has helped identify the greatly varied needs of students
and helped to ensure we can address these needs with the appropriate resources and teaching strategies.
We know that great teachers make the greatest difference and our whole-of-school efforts consistently focus on
extending teacher expertise.
Future Outlook
The explicit improvement agenda for 2017 is:
Writing: The focus on writing continues on from 2016. A Master Teacher is employed to work with Year 2 to 6
teachers – coaching, modelling, collaborating, as well as providing professional development for all teaching staff.
Significant teacher aide time is also allocated to support teachers putting into place the writing improvement plans.
This focus on writing is very much linked with the school Signature Pedagogy based on the Gradual Release of
Responsibility framework developed by Fisher and Frey (2014).
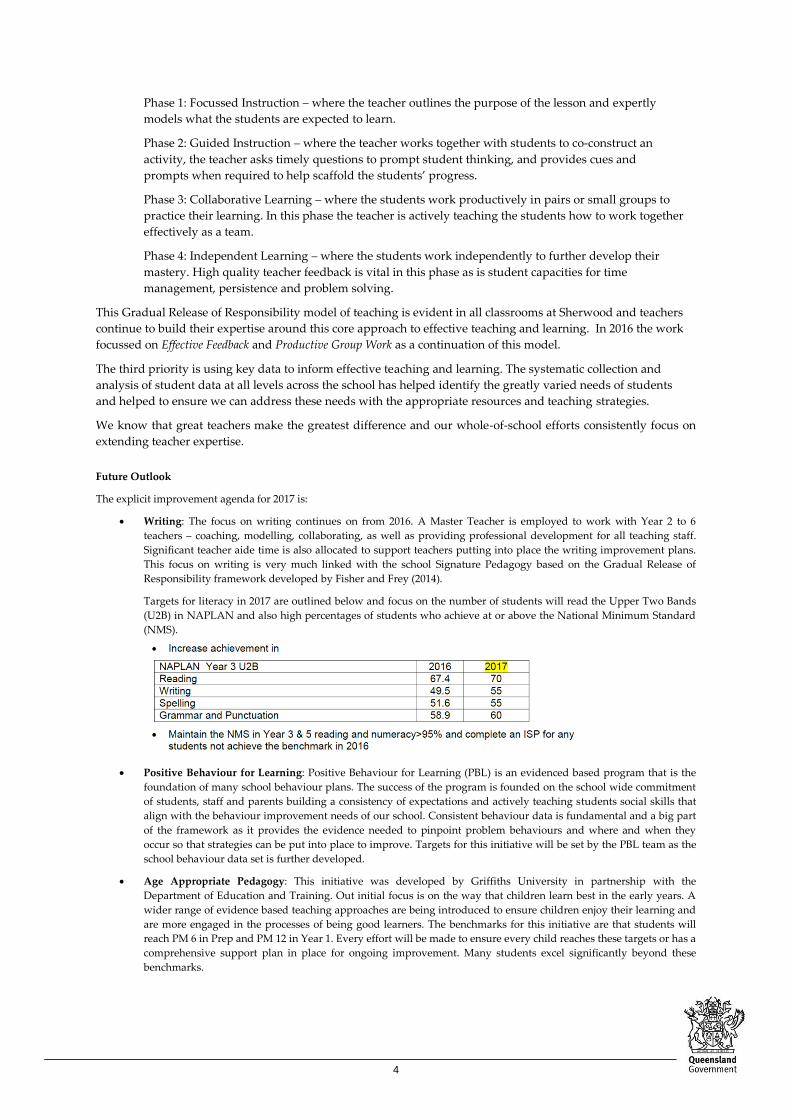
Targets for literacy in 2017 are outlined below and focus on the number of students will read the Upper Two Bands
(U2B) in NAPLAN and also high percentages of students who achieve at or above the National Minimum Standard
(NMS).
Positive Behaviour for Learning: Positive Behaviour for Learning (PBL) is an evidenced based program that is the
foundation of many school behaviour plans. The success of the program is founded on the school wide commitment
of students, staff and parents building a consistency of expectations and actively teaching students social skills that
align with the behaviour improvement needs of our school. Consistent behaviour data is fundamental and a big part
of the framework as it provides the evidence needed to pinpoint problem behaviours and where and when they
occur so that strategies can be put into place to improve. Targets for this initiative will be set by the PBL team as the
school behaviour data set is further developed.
Age Appropriate Pedagogy: This initiative was developed by Griffiths University in partnership with the
Department of Education and Training. Out initial focus is on the way that children learn best in the early years. A
wider range of evidence based teaching approaches are being introduced to ensure children enjoy their learning and
are more engaged in the processes of being good learners. The benchmarks for this initiative are that students will
reach PM 6 in Prep and PM 12 in Year 1. Every effort will be made to ensure every child reaches these targets or has a
comprehensive support plan in place for ongoing improvement. Many students excel significantly beyond these
benchmarks.
5
Our School at a Glance
School Profile
Coeducational or single sex: Coeducational
Independent Public School: No
Year levels offered in 2016: Prep Year - Year 6
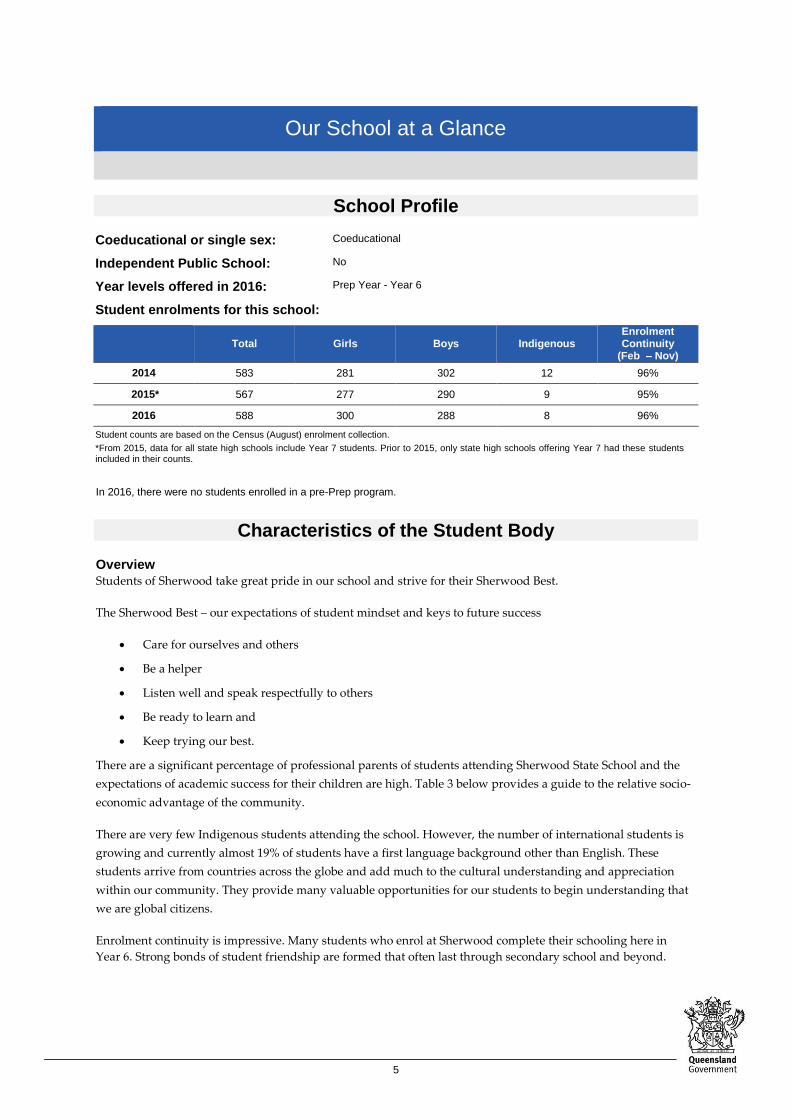
Student enrolments for this school:
Total Girls Boys Indigenous
Enrolment Continuity
(Feb – Nov)
2014 583 281 302 12 96%
2015* 567 277 290 9 95%
2016 588 300 288 8 96%
Student counts are based on the Census (August) enrolment collection.
*From 2015, data for all state high schools include Year 7 students. Prior to 2015, only state high schools offering Year 7 had these students included in their counts.
In 2016, there were no students enrolled in a pre-Prep program.
Characteristics of the Student Body
Overview
Students of Sherwood take great pride in our school and strive for their Sherwood Best.
The Sherwood Best – our expectations of student mindset and keys to future success
Care for ourselves and others
Be a helper
Listen well and speak respectfully to others
Be ready to learn and
Keep trying our best.
There are a significant percentage of professional parents of students attending Sherwood State School and the
expectations of academic success for their children are high. Table 3 below provides a guide to the relative socio-
economic advantage of the community.
There are very few Indigenous students attending the school. However, the number of international students is
growing and currently almost 19% of students have a first language background other than English. These
students arrive from countries across the globe and add much to the cultural understanding and appreciation
within our community. They provide many valuable opportunities for our students to begin understanding that
we are global citizens.
Enrolment continuity is impressive. Many students who enrol at Sherwood complete their schooling here in
Year 6. Strong bonds of student friendship are formed that often last through secondary school and beyond.

6
Average Class Sizes The following table shows the average class size information for each phase of schooling.
AVERAGE CLASS SIZES
Phase 2014 2015* 2016
Prep – Year 3 23 23 23
Year 4 – Year 7 27 26 25
Curriculum Delivery
Our Approach to Curriculum Delivery
Sherwood State School is delivering the Australian Curriculum (AC). The school employs a full time Head of
Curriculum who works both with individual teachers and year level teams to build the consistency of curriculum
delivery across the school. Each week the Year Level teams meet with both the Head of Curriculum and the
Master Teacher to support the delivery of the Australian Curriculum consistently across the year level and across
the school. The consistency also includes common assessment across year levels and robust moderation to ensure
student progress is validated from one class to another. There are also comprehensive data collections and
analysis to identify areas where students need additional support including the extension of our highly capable
learners.
Specialist teachers who also work with students to deliver a range of programs that also align with the
Australian Curriculum:
- Healthy and Physical Education
- Music
- LOTE (Mandarin Chinese in Year 5 and 6).
Building a cohesive collaboratively developed curriculum reflecting the Australian Curriculum is one of the
projects embedded in our Towards 2020 strategic plan.
Co-curricular Activities
There is an extraordinary range of co-curricula offerings for students attending Sherwood State School.
The instrumental music program is large and of exceptional quality. Each week instrumental music teachers
instruct students in strings, woodwind, brass and percussion. In 2016 Senior Band and the Senior Strings
(Sinfonia) competed successfully in Education Queensland’s Band Fanfare. A number of our students are
regularly offered places in the Westcent Music Camp each year – these students are selected through audition.
Our ensembles compete successfully in the Brisbane Bands Festival. There is an extensive Choral Program
comprising two choirs - La Bella Voci and Cantorri. The auditioned senior choir and non-auditioned junior choir
compete well each year in Musicfest, often taking a place in the top 3 choirs across Brisbane.
The Friends of the Nature Area group has a 30+ year history at Sherwood and meets regularly in the school
Nature Area to garden and further develop their appreciation and understanding of natural history. This group
has grown in popularity over recent years and now has over 50 members. In 2015 the school received a $25,000
grant to enhance our nature area and to extend the educational possibilities of this beautiful part of the school
located next to our pool.
The Sherwood Arrows also has a long history stretching to 35 years in 2017. This Jump Rope for Heart
demonstration skipping team is the longest serving in Australia and is an icon of the school. Their skipping skills
are legendary and to be part of this team is highly coveted. Many students across the year levels take the
opportunity to train with the Sherwood Arrows weekly.

7
Each odd year the school enters several teams in the creative and very demanding OptiMinds competition. Our
teams have often won awards at this competition and in recent times were selected for the State Finals.
Sherwood also has an Artist-in-Residence Program that has been operating now for more than a decade. The
artist works collaboratively with teachers and students extending their knowledge of visual arts techniques, and
also is sponsored annually by the Student Council to create a public art work.
Before and after school there are extensive curriculum choices for students including visual arts, drama, dance,
instrumental music (strings, keyboards), computer programming, tennis, swimming and many other sports.
How Information and Communication Technologies are used to Assist Learning
Computers are used by students and staff in all classrooms and many other learning areas around the school.
The infrastructure supporting the use of ICTs is improving each year. All of the school is now covered by a
wireless network.
Altogether there are 180 PC computers for student use, all of which are connected to the school intranet and the
internet. These computers are now on a 5 year replacement schedule to ensure their quality. There are computers
in every classroom as well as 28 located in a computer lab. All classrooms and many other teaching spaces have
large Interactive Whiteboards that are also internet enabled. In addition, 60 laptops were purchased by the
Parents and Citizens Association (P&C) for Year 5 and 6 students to use in preparation for Junior High.
In recent years a small group of six iPads has been purchased by the P&C for each Prep to 3 class and these prove
to be highly engaging and valuable learning tools.
To assist the implementation of the Australian National Curriculum, Education Queensland has developed
enormous digital resources that are accessed on-line by teachers and students. Sherwood is ideally placed to take
advantage of these resources. All teachers are provided with laptops which enable excellent access to the
resources provided on-line, and which can be used to bring these resources into life in the classrooms.
Robotics is becoming increasingly important. In 2016 we held the first intra-school Robotics competition for
students in Years 3 to 6. Plans are in place to extend this from Prep to Year 2 in alternate years. Prior to this the
school entered teams in the Brisbane Robotics Competition where they excelled winning significant awards.
Mathletics was trialled in 2011 and introduced across the school in 2012 – a great on-line mathematics resource
that students can access both at home and at school.
Social Climate
Overview
Visitors to Sherwood often remark that there is a very friendly atmosphere. As Principal, I would hope there is a
sense of warm demandedness from our teachers – we build solid relationships of high expectations to Aim Higher
(our school motto). The Sherwood Best guides the actions of both staff and students. The values of the school focus
on the aspirations for our students as they build their capacities through the school.
In 2016 we developed a new strategic plan – Towards 2020. The new school vision is Courageous resilient life-
long learners, and our Mission – Engaging every student every day. As we progress through 2017 significant
consultation and review is underway to identify our new core values. However, until this review is complete we
continue to work with our long-standing documents first developed in 2001!
At Sherwood we value:

8
Optimistic and happy learners
Flexibility and honesty in the way we interact with others
A strong sense of self-expression and well developed communication skills
Confident and socially competent active members of the community
People who work purposefully and with persistence to achieve realistic goals
Co-operative, considerate and well-adjusted contributors to our own wellbeing and the wellbeing of
others around us
A love of learning and creative thinking
Life-long learners with the skills and abilities to participate productively in local and global
communities.
The Student Leadership Framework (SLF) was developed in 2001. The SLF provides a standard of excellence,
linking with The Sherwood Best, to inform parents and students about how we are building effective social and
emotional intelligences through the years. A progress report based on the SLF is provided to Year 4-6 parents
and students at the end of Term 3. This report determines whether students are eligible for important student
leadership positions in Year 6, including nominations for School Captain.
The Student Council meets weekly. There are two representatives from each of the Year 4 and 5 classes and a
UNICEF representative from each of the Year 6 classes. The Executive of the Student Council comprises the
School Captains and Vice-Captains. As well as undertaking weekly leadership activities, this group assists with
important school functions helping to organise the school disco, run weekly parade and special events such as
ANZAC Day.
The school farewells our long standing adopt-a-cop, Detective Kim Jackson, who visited classrooms and
addressed parade regularly to talk about child safety issues. In 2017 we welcome two new adopt-a-cops to
Sherwood: Senior Sergeant Jacqueline McLeod and Constable Nic Berrett. In addition, the Year 5s undertake a
comprehensive bike education and road safety program that includes bike safety checks, and a range of activities
to help children learn the road safety rules when riding their bikes.
At the end of 2013 a pro-social skills program based on Skill Streaming was introduced across the school. This
program includes weekly lessons for each class and a commitment to whole-of-school action to support
outstanding student behaviour. The weekly lesson is discussed in all classrooms and included in the weekly
school Newsletter. In 2017 our involvement with Positive Behaviour for Learning will see this program replaced
with one bespoke for our school.
Parent, Student and Staff Satisfaction Parent opinion survey
Performance measure
Percentage of parents/caregivers who agree# that: 2014 2015 2016
their child is getting a good education at school (S2016)
94% 94% 95%
this is a good school (S2035) 96% 95% 95%
their child likes being at this school* (S2001) 98% 95% 99%
their child feels safe at this school* (S2002) 98% 95% 98%
their child's learning needs are being met at this school* (S2003)
88% 93% 96%
9
Performance measure
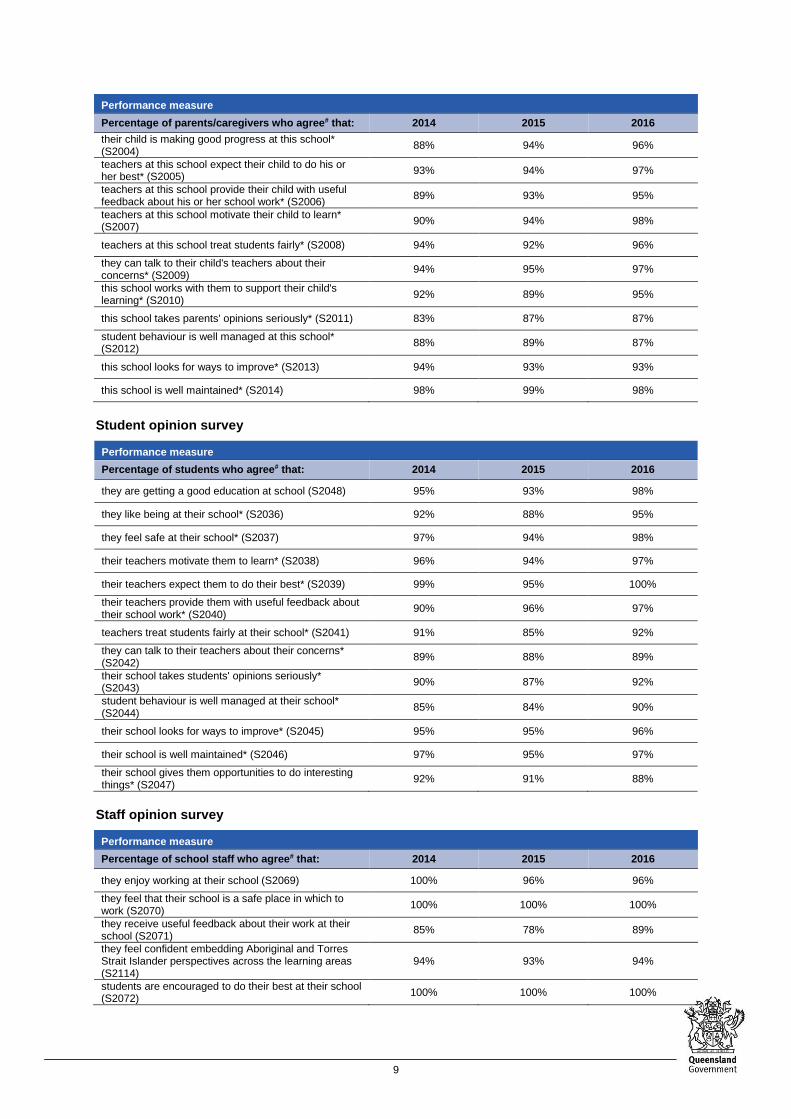
Percentage of parents/caregivers who agree# that: 2014 2015 2016
their child is making good progress at this school* (S2004)
88% 94% 96%
teachers at this school expect their child to do his or her best* (S2005)
93% 94% 97%
teachers at this school provide their child with useful feedback about his or her school work* (S2006)
89% 93% 95%
teachers at this school motivate their child to learn* (S2007)
90% 94% 98%
teachers at this school treat students fairly* (S2008) 94% 92% 96%
they can talk to their child's teachers about their concerns* (S2009)
94% 95% 97%
this school works with them to support their child's learning* (S2010)
92% 89% 95%
this school takes parents' opinions seriously* (S2011) 83% 87% 87%
student behaviour is well managed at this school* (S2012)
88% 89% 87%
this school looks for ways to improve* (S2013) 94% 93% 93%
this school is well maintained* (S2014) 98% 99% 98%
Student opinion survey
Performance measure
Percentage of students who agree# that: 2014 2015 2016
they are getting a good education at school (S2048) 95% 93% 98%
they like being at their school* (S2036) 92% 88% 95%
they feel safe at their school* (S2037) 97% 94% 98%
their teachers motivate them to learn* (S2038) 96% 94% 97%
their teachers expect them to do their best* (S2039) 99% 95% 100%
their teachers provide them with useful feedback about their school work* (S2040)
90% 96% 97%
teachers treat students fairly at their school* (S2041) 91% 85% 92%
they can talk to their teachers about their concerns* (S2042)
89% 88% 89%
their school takes students' opinions seriously* (S2043)
90% 87% 92%
student behaviour is well managed at their school* (S2044)
85% 84% 90%
their school looks for ways to improve* (S2045) 95% 95% 96%
their school is well maintained* (S2046) 97% 95% 97%
their school gives them opportunities to do interesting things* (S2047)
92% 91% 88%
Staff opinion survey
Performance measure
Percentage of school staff who agree# that: 2014 2015 2016
they enjoy working at their school (S2069) 100% 96% 96%
they feel that their school is a safe place in which to work (S2070)
100% 100% 100%
they receive useful feedback about their work at their school (S2071)
85% 78% 89%
they feel confident embedding Aboriginal and Torres Strait Islander perspectives across the learning areas (S2114)
94% 93% 94%
students are encouraged to do their best at their school (S2072)
100% 100% 100%

10
Performance measure
Percentage of school staff who agree# that: 2014 2015 2016
students are treated fairly at their school (S2073) 100% 100% 100%
student behaviour is well managed at their school (S2074)
90% 78% 75%
staff are well supported at their school (S2075) 90% 78% 89%
their school takes staff opinions seriously (S2076) 83% 73% 79%
their school looks for ways to improve (S2077) 100% 91% 93%
their school is well maintained (S2078) 95% 95% 100%
their school gives them opportunities to do interesting things (S2079)
85% 78% 89%
* Nationally agreed student and parent/caregiver items # ‘Agree’ represents the percentage of respondents who Somewhat Agree, Agree or Strongly Agree with the statement. DW = Data withheld to ensure confidentiality.
Parent and community engagement
Parent involvement at Sherwood is very high and takes many forms. The Parents and Citizens Association
supports many sub-committees including:
Fete Committee
Uniform Shop Committee
Tuckshop Committee
Sherwood Sharks Swimming Club
Sherwood Arrows Skipping Team
Out-of-Hours School Care
The executive of the sub-committees are volunteers who are not on the executive of the P&C. This breadth of
commitment to the school is enormous. Many of these sub-committees also have many additional non-executive
members who take an interest in decision making and attend meetings regularly.
Each year there is a Fete. The 2015 Fete was a wonderful community event and the substantial proceeds support
wonderful learning opportunities and teaching resources for Sherwood students.
There are also many parents who assist as volunteers in classrooms and for special events such as Under 8s Day
and excursions. There are opportunities for parents to learn more about education related topics through the
school, including child protection and support-a-reader programs
Respectful relationships programs
The school has developed a range of programs that focus on appropriate, respectful and healthy relationships.
These programs appropriately align with the needs of students ranging in age from Prep to Year 6.
- Adopt-a-Cop personal safety talks across all classes and at whole school assemblies through the year;
- Anti-bullying programs aligned with the High Five framework;
- Weekly Skill Streaming lessons skilling students in expected behaviours;
- Cyber Safety talks for Year 5 & 6 students;
- Relationships Education lessons provided through a personal safety and child protection lens for Year 4,
5 and 6 students.
In 2017 the school will form a well-being committee that will include consideration of both students and staff.

11
School Disciplinary Absences The following table shows the count of incidents for students recommended for each type of school disciplinary absence reported at the school.
SCHOOL DISCIPLINARY ABSENCES
Type 2014* 2015** 2016
Short Suspensions – 1 to 5 days 10 19 17
Long Suspensions – 6 to 20 days 0 0 0
Exclusions 0 0 0
Cancellations of Enrolment 0 0 0
* Caution should be used when comparing post 2013 SDA data as amendments to EGPA disciplinary provisions and changes in methodology
created time series breaks in 2014 and 2015.
**From 2015, Exclusion represents principal decisions to exclude rather than recommendations for exclusion. From 2015 where a principal decided not to exclude, a small number of recommendations for exclusions have been counted as a long suspension. Exclusions, Cancellations and Long & Charge Suspensions may be upheld or set aside through an appeals process.
Environmental Footprint
Reducing the school’s environmental footprint
Sherwood State School is serious about reducing the school’s environmental footprint. In recent years we have
accessed significant grants:
Installation of extensive water capture and storage – used for gardens and irrigation
Solar power to alleviate electricity usage
Waste management – recycling, and ensuring the grounds are rubbish free
Improved access to the school – bike paths, and the installation of a bike cage (along with school
funded annual bike safety program)
Creation of vegetable and herb gardens and promotion of the Friends of the Nature Area club
Increasing the bio-diversity of the school grounds – creating bird, possum and micro-bat habitats.
School resources are also used to maintain many trees in our grounds that have significant historic importance
ENVIRONMENTAL FOOTPRINT INDICATORS
Years Electricity
kWh Water
kL
2013-2014 360,333 523
2014-2015 234,029 331
2015-2016 258,793 1,401
The consumption data is compiled from sources including ERM, Ergon reports and utilities data entered into OneSchool by each school. The data provides an indication of the consumption trend in each of the utility categories which impact on the school’s environmental footprint.
School Funding
School income broken down by funding source
School income, reported by financial year accounting cycle using standardized national methodologies and
broken down by funding source is available via the My School website at http://www.myschool.edu.au/.
To access our income details, click on the My School link above. You will then be taken to the My School website
with the following ‘Find a school’ text box.
12
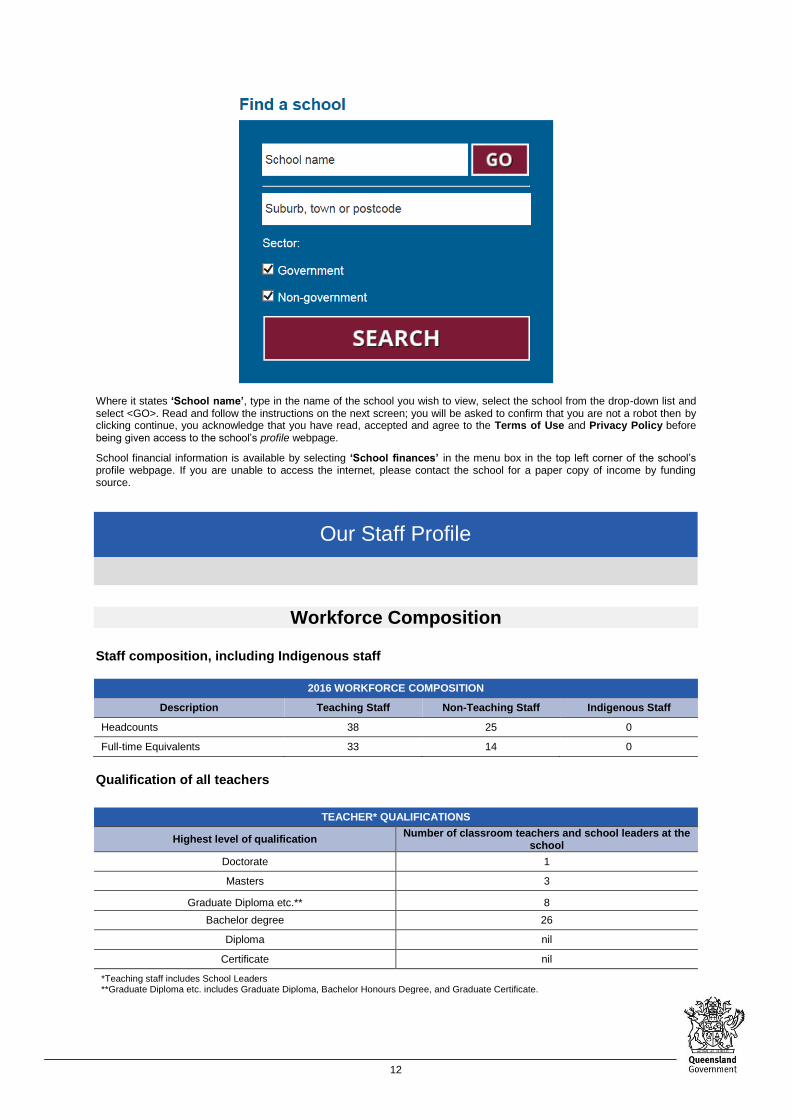
Where it states ‘School name’, type in the name of the school you wish to view, select the school from the drop-down list and select <GO>. Read and follow the instructions on the next screen; you will be asked to confirm that you are not a robot then by clicking continue, you acknowledge that you have read, accepted and agree to the Terms of Use and Privacy Policy before being given access to the school’s profile webpage.
School financial information is available by selecting ‘School finances’ in the menu box in the top left corner of the school’s profile webpage. If you are unable to access the internet, please contact the school for a paper copy of income by funding source.
Our Staff Profile
Workforce Composition
Staff composition, including Indigenous staff
2016 WORKFORCE COMPOSITION
Description Teaching Staff Non-Teaching Staff Indigenous Staff
Headcounts 38 25 0
Full-time Equivalents 33 14 0
Qualification of all teachers
TEACHER* QUALIFICATIONS
Highest level of qualification Number of classroom teachers and school leaders at the
school
Doctorate 1
Masters 3
Graduate Diploma etc.** 8
Bachelor degree 26
Diploma nil
Certificate nil
*Teaching staff includes School Leaders **Graduate Diploma etc. includes Graduate Diploma, Bachelor Honours Degree, and Graduate Certificate.

13
Professional Development
Expenditure On and Teacher Participation in Professional Development
The total funds expended on teacher professional development in 2016 were $61,000
The major professional development initiatives are as follows:
- Tuesday afternoon professional learning sessions were held regularly through 2016 – topics aligned
with the school priorities including writing, productive group work, effective feedback and
vocabulary development;
- The Master Teacher provided coaching across the school with a focus on writing;
- The Head of Curriculum and the Master Teacher met weekly with all Year Levels assisting teachers
to align their programs with the Australian Curriculum;
- Teachers the Annual Performance Review including a focus on reading improvement for students
not achieving the school benchmarks.
The proportion of the teaching staff involved in professional development activities during 2016 was 100%.
Staff Attendance and Retention Staff attendance
AVERAGE STAFF ATTENDANCE (%)
Description 2014 2015 2016
Staff attendance for permanent and temporary staff and school leaders. 95% 95% 96%
Proportion of Staff Retained from the Previous School Year From the end of the previous school year, 91% of staff was retained by the school for the entire 2016.
Performance of Our Students
Key Student Outcomes
In the following sections the school is justifiably proud of high achievement across many measures: academic achievement, individual improvement and high attendance.
Student Attendance
Student attendance
The table below shows the attendance information for all students at this school.
STUDENT ATTENDANCE 2016
Description 2014 2015 2016
The overall attendance rate* for the students at this school (shown as a percentage). 96% 95% 95%
The attendance rate for Indigenous students at this school (shown as a percentage). 94% 95% 92%
*The student attendance rate is generated by dividing the total of full-days and part-days that students attended, and comparing this to the total of all possible days for students to attend, expressed as a percentage.
14
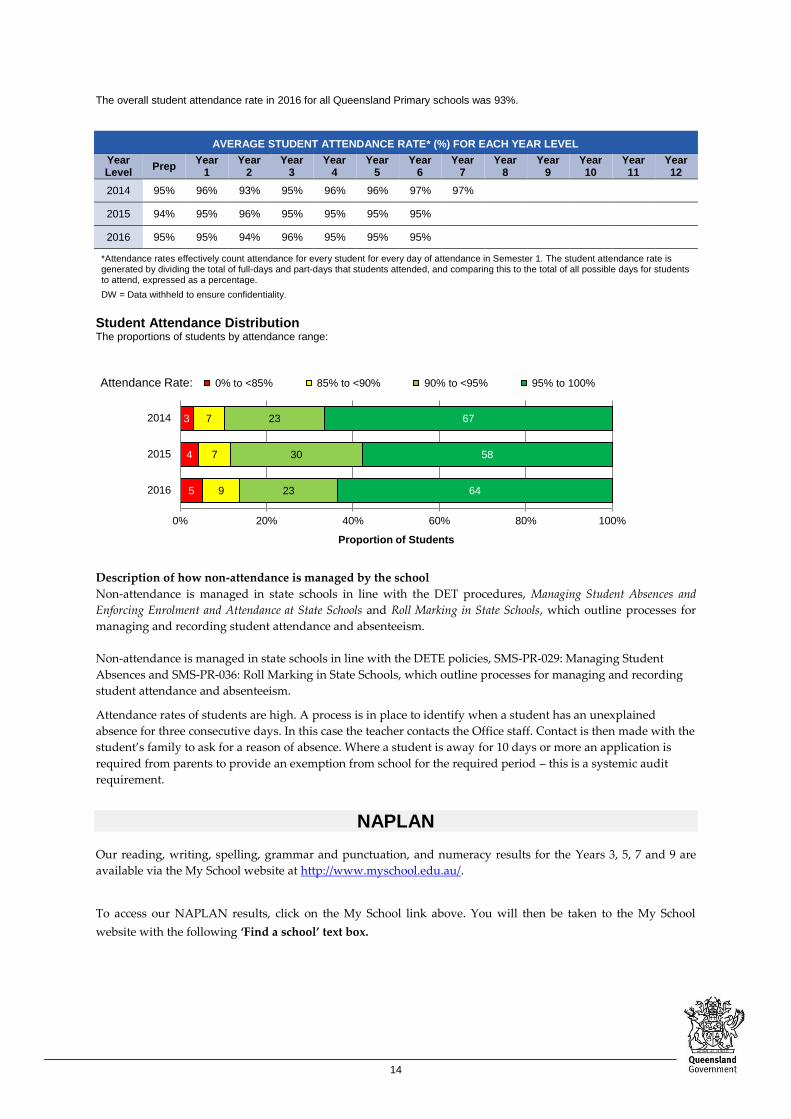
The overall student attendance rate in 2016 for all Queensland Primary schools was 93%.
AVERAGE STUDENT ATTENDANCE RATE* (%) FOR EACH YEAR LEVEL
Year Level
Prep Year
1 Year
2 Year
3 Year
4 Year
5 Year
6 Year
7 Year
8 Year
9 Year 10
Year 11
Year 12
2014 95% 96% 93% 95% 96% 96% 97% 97%
2015 94% 95% 96% 95% 95% 95% 95%
2016 95% 95% 94% 96% 95% 95% 95%
*Attendance rates effectively count attendance for every student for every day of attendance in Semester 1. The student attendance rate is generated by dividing the total of full-days and part-days that students attended, and comparing this to the total of all possible days for students to attend, expressed as a percentage.
DW = Data withheld to ensure confidentiality.
Student Attendance Distribution The proportions of students by attendance range:
5
4
3
9
7
7
23
30
23
64
58
67
0% 20% 40% 60% 80% 100%
2016
2015
2014
Proportion of Students
Attendance Rate: 0% to <85% 85% to <90% 90% to <95% 95% to 100%
Description of how non-attendance is managed by the school
Non-attendance is managed in state schools in line with the DET procedures, Managing Student Absences and
Enforcing Enrolment and Attendance at State Schools and Roll Marking in State Schools, which outline processes for
managing and recording student attendance and absenteeism.
Non-attendance is managed in state schools in line with the DETE policies, SMS-PR-029: Managing Student
Absences and SMS-PR-036: Roll Marking in State Schools, which outline processes for managing and recording
student attendance and absenteeism.
Attendance rates of students are high. A process is in place to identify when a student has an unexplained
absence for three consecutive days. In this case the teacher contacts the Office staff. Contact is then made with the
student’s family to ask for a reason of absence. Where a student is away for 10 days or more an application is
required from parents to provide an exemption from school for the required period – this is a systemic audit
requirement.
NAPLAN
Our reading, writing, spelling, grammar and punctuation, and numeracy results for the Years 3, 5, 7 and 9 are
available via the My School website at http://www.myschool.edu.au/.
To access our NAPLAN results, click on the My School link above. You will then be taken to the My School
website with the following ‘Find a school’ text box.

15
Where it states ‘School name’, type in the name of the school you wish to view, select the school from the drop-
down list and select <GO>. Read and follow the instructions on the next screen; you will be asked to confirm that
you are not a robot then by clicking continue, you acknowledge that you have read, accepted and agree to the
Terms of Use and Privacy Policy before being given access to the school’s profile webpage.
School NAPLAN information is available by selecting ‘NAPLAN’ in the menu box in the top left corner of the
school’s profile webpage. If you are unable to access the internet, please contact the school for a paper copy of
our school’s NAPLAN results.
Conclusion
In 2016 a comprehensive School Review was conducted by the School Improvement Unit – this process occurs
at the end of a four year strategic planning cycle in all State schools in Queensland. A summary of this Review
is located on our website. The school also engaged in a comprehensive strategic planning process which
provided opportunities for input from all parents, staff and many students. The Strategic Leadership Team
also analyzed school performance data for trends over the previous four years and worked with a specialist
strategic planner to develop the Towards 2020 strategic plan.
In 2017 Sherwood State School celebrates 150 years of history and through the year there will be many
occasions to acknowledge the wonderful history of our school. Community interest in these celebrations is
enormous and reflects the enormous pride and support the school has generated over many years.
Sherwood State school has a community heart and the efforts of so many people from so many quarters is
wonderful to feel – a source of enormous pride for us all as we play our part in this wonderful school.