annual report - ubp · the annual report of the united basalt products limited (“ubp”) for the...
TRANSCRIPT

ANNUAL REPORT2016Head Office:
Trianon, Quatre Bornes,MauritiusT: (+230) 454 1964F: (+230) 454 8043www.ubp.mu
UBP
AN
NUA
L RE
PORT
201
6

1
UB
P A
NN
UA
L R
EP
OR
T 2
016
As part of its ongoing programme to help protect the environment, IBL Ltd subsidiaries have chosen to use Lenza Green paper for their Annual Reports.
Lenza Green paper is made from 100% recycled pulp, certified FSC (Forest Stewardship Council).
FSC is an international, non-governmental, non-profit making organisation created in 1993.
It encourages socially, ecologically and economically responsible forestry management initiatives.
Fibre source: 40 / 40
Fossil CO2 emissions from manufacturing: 18 / 20
Waste to landfill: 10 / 10
Water pollution from bleaching: 10 / 10
Organic water pollution: 9 / 10
Environmental management systems: 10 / 10
Detailed Environmental Profile
1
UB
P A
NN
UA
L R
EP
OR
T 2
016

Marc FreismuthChairman
The Board of Directors is pleased to present to you the Annual Report of The United Basalt Products Limited (“UBP”) for the year ended June 30, 2016, the contents of which are listed hereafter.
This report was approved by the Board of Directors on September 27, 2016.
Stéphane UlcoqChief Executive Officer
3
UB
P A
NN
UA
L R
EP
OR
T 2
016
2
UB
P A
NN
UA
L R
EP
OR
T 2
016
DEARSHAREHOLDER

CONTENTS 7 Notice of Annual Meeting to Shareholders 8 Management and Administration 9 Board of Directors and Board Committees 10 Directors’ and Senior Officers’ Profiles 15 Group Shareholding Structure 16 Financial Highlights and Ratios 18 Value Added Statement
54 Statements of Financial Position 55 Statements of Profit or Loss and Other Comprehensive Income 56 Statements of Changes in Equity 57 Statements of Cash Flows 58 Notes to the Financial Statements 115 Proxy Form
21 Chairman’s Report 25 Chief Executive Officer’s Report 29 Corporate Governance Report 43 Corporate Social Responsibility Report 46 Statement of Directors’ Responsibilities 47 Other Statutory Disclosures 51 Company Secretary’s Certificate 52 Independent Auditors’ Report to the Members
5
UB
P A
NN
UA
L R
EP
OR
T 2
016
4
UB
P A
NN
UA
L R
EP
OR
T 2
016

7
UB
P A
NN
UA
L R
EP
OR
T 2
016
By order of the Board
Bhooneshi Nemchand Company Secretary
September 27, 2016
To re-appoint Messrs Ernst & Young as Auditors of the Company for the year ending June 30, 2017 and to authorise the Board of Directors to fix their remuneration.
Notice is hereby given that the Annual Meeting of Shareholders of The United Basalt Products Limited will be held at the registered office of the Company, Trianon, Quatre Bornes, on Wednesday December 14, 2016 at 15.00 hours to transact the following business in the manner required for the passing of Ordinary Resolutions:
1
2
3
4
5
15
6-14
To consider the Annual Report 2016 of the Company.
To receive the report of Messrs Ernst & Young, the Auditors of the Company, for the year ended June 30, 2016.
To consider and adopt the Company’s and the Group’s Audited Financial Statements for the year ended June 30, 2016.
To re-elect as Director of the Company, Mr E. Jean Mamet, aged above 70, who offers himself for re-election upon recommendation from the Corporate Governance Committee, to hold office until the next Annual Meeting in accordance with Section 138(6) of the Companies Act 2001.
To re-elect as Director of the Company, Mr Jean Claude Maingard, aged 70, who offers himself for re-election upon recommendation from the Corporate Governance Committee, to hold office until the next Annual Meeting in accordance with Section 138(6) of the Companies Act 2001.
A shareholder of the Company entitled to attend and vote at this meeting may appoint a proxy (whether a shareholder or not) to attend and vote on his/her behalf. The instrument appointing a proxy or any general power of attorney shall be deposited at the registered office of the Company, Trianon, Quatre Bornes, not less than twenty-four hours before the time fixed for the holding of the meeting or else the instrument of proxy shall not be treated as valid.
A proxy form is included for this purpose at the end of the Annual Report.
For the purpose of this Annual Meeting, the Directors have resolved, in compliance with Section 120(3) of the Companies Act 2001, that the shareholders who are entitled to receive notice of the meeting and attend such meeting shall be those shareholders whose names are registered in the share register of the Company as at November 14, 2016.
The minutes of proceedings of the preceding Annual Meeting held on December 17, 2015 are available for consultation by the shareholders during office hours at the registered office of the Company.
To re-elect as Directors of the Company and by way of separate resolutions, the following persons who offer themselves for re-election upon recommendation from the Corporate Governance Committee, to hold office until the next Annual Meeting:
6 Mr Marc Freismuth
7 Mr François Boullé
8 Mr Joël Harel
9 Mr Laurent de la Hogue
10 Mr Arnaud Lagesse
11 Mr Stéphane Lagesse
12 Mr Thierry Lagesse
13 Mr Christophe Quevauvilliers
14 Mr Stéphane Ulcoq
NOTICE OF ANNUAL MEETINGTO SHAREHOLDERS
6
UB
P A
NN
UA
L R
EP
OR
T 2
016

9
UB
P A
NN
UA
L R
EP
OR
T 2
016
8
UB
P A
NN
UA
L R
EP
OR
T 2
016
MANAGEMENT AND ADMINISTRATION MANAGEMENT TEAMStéphane Ulcoq Chief Executive Officer
Christophe Quevauvilliers Group Finance Manager
Rémi de Gersigny Project and Business Development Manager
Laurent Béga Group Engineering Manager
Caroline Tyack Group Marketing and Communication Manager
Dwight Hamilton Group IT Manager
Jocelyne L’Arrogant Group Procurement and Logistics Manager
Priscilla Chinien Acting Group Human Resources Manager
Jean Marc Selvon Sales Manager
Dhuenesh Rambarassah Financial Controller
Francis Koenig Quarry and Field Manager
Amaury Lacoste Production Manager (Central and Southern Regions)
Fabien Harel Production Manager (Northern Region)
Bruno de Spéville Manager – Marbella Division
Ashwin Ramsaha Manager – PPB Division
Edley Michaud Personnel Manager
Benoit Béchard General Manager – Espace Maison Ltée
Christopher Blackburn General Manager – Compagnie de Gros Cailloux Limitée
Jean Claude Bellepeau General Manager – Dry Mixed Products Ltd
LEGAL FORM The United Basalt Products Limited is a public company incorporated in Mauritius in July 1953 and listed on the Official Market of the Stock Exchange of Mauritius Ltd since 1989.
HEAD OFFICETrianon, Quatre Bornes – MauritiusTel. : (230) 454 1964Fax : (230) 454 8043Email : [email protected] : www.ubp.mu
REGISTERED OFFICETrianon, Quatre Bornes – Mauritius
COMPANY SECRETARYBhooneshi Nemchand A.C.I.S.
AUDITORSErnst & Young
BANKERSBarclays Bank Mauritius LtdHSBC (Mauritius) LtdState Bank of Mauritius LtdThe Mauritius Commercial Bank Ltd
BOARD OF DIRECTORS
Marc Freismuth - Chairman François Boullé Joël Harel Laurent de la HogueArnaud Lagesse Stéphane Lagesse Thierry LagesseJean Claude MaingardE. Jean Mamet Christophe QuevauvilliersStéphane Ulcoq – Chief Executive Officer (CEO)
BOARD COMMITTEES
CORPORATE GOVERNANCE COMMITTEEJoël Harel - ChairmanMarc FreismuthThierry Lagesse
AUDIT COMMITTEEE. Jean Mamet - ChairmanFrançois BoulléJoël Harel
RISK MONITORING COMMITTEEFrançois Boullé - ChairmanE. Jean Mamet Christophe QuevauvilliersStéphane Ulcoq
COMPANY SECRETARY
Bhooneshi Nemchand A.C.I.S.
BOARD OF DIRECTORS AND BOARD COMMITTEES
11
UB
P A
NN
UA
L R
EP
OR
T 2
016
10
UB
P A
NN
UA
L R
EP
OR
T 2
016
01
02
03 05
06 08 09 11
07 10
04
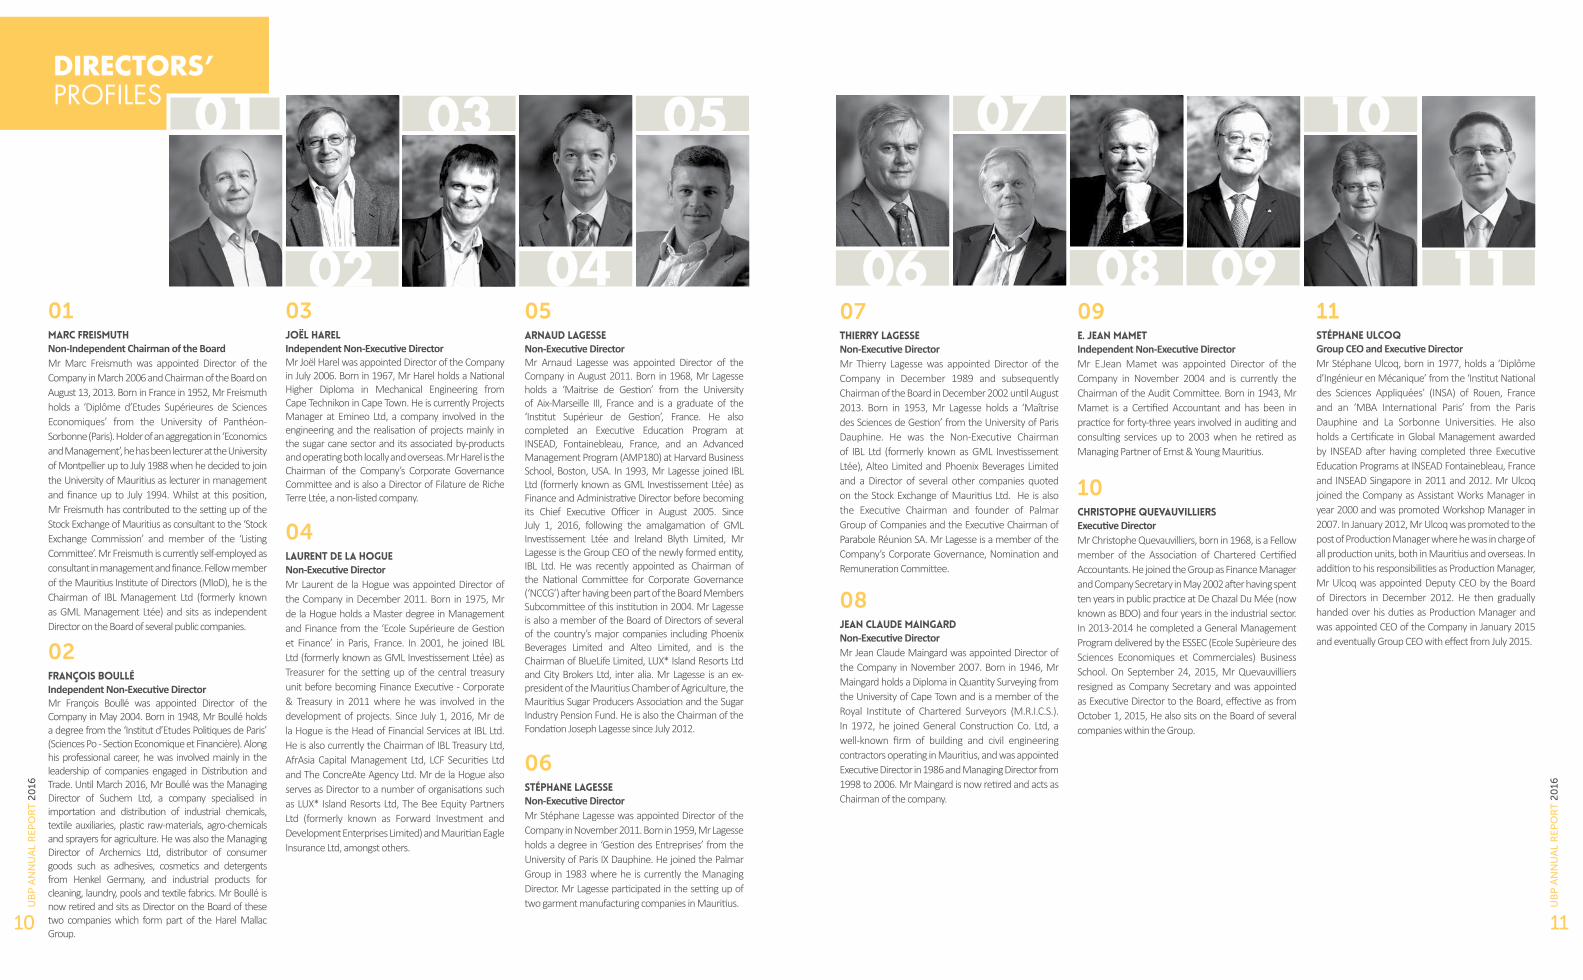
DIRECTORS’PROFILES
01 marc freismuthNon-Independent Chairman of the BoardMr Marc Freismuth was appointed Director of the Company in March 2006 and Chairman of the Board on August 13, 2013. Born in France in 1952, Mr Freismuth holds a ‘Diplôme d’Etudes Supérieures de Sciences Economiques’ from the University of Panthéon-Sorbonne (Paris). Holder of an aggregation in ‘Economics and Management’, he has been lecturer at the University of Montpellier up to July 1988 when he decided to join the University of Mauritius as lecturer in management and finance up to July 1994. Whilst at this position, Mr Freismuth has contributed to the setting up of the Stock Exchange of Mauritius as consultant to the ‘Stock Exchange Commission’ and member of the ‘Listing Committee’. Mr Freismuth is currently self-employed as consultant in management and finance. Fellow member of the Mauritius Institute of Directors (MIoD), he is the Chairman of IBL Management Ltd (formerly known as GML Management Ltée) and sits as independent Director on the Board of several public companies.
04 Laurent de la HogueNon-Executive DirectorMr Laurent de la Hogue was appointed Director of the Company in December 2011. Born in 1975, Mr de la Hogue holds a Master degree in Management and Finance from the ‘Ecole Supérieure de Gestion et Finance’ in Paris, France. In 2001, he joined IBL Ltd (formerly known as GML Investissement Ltée) as Treasurer for the setting up of the central treasury unit before becoming Finance Executive - Corporate & Treasury in 2011 where he was involved in the development of projects. Since July 1, 2016, Mr de la Hogue is the Head of Financial Services at IBL Ltd. He is also currently the Chairman of IBL Treasury Ltd, AfrAsia Capital Management Ltd, LCF Securities Ltd and The ConcreAte Agency Ltd. Mr de la Hogue also serves as Director to a number of organisations such as LUX* Island Resorts Ltd, The Bee Equity Partners Ltd (formerly known as Forward Investment and Development Enterprises Limited) and Mauritian Eagle Insurance Ltd, amongst others.
02 François Boullé Independent Non-Executive Director Mr François Boullé was appointed Director of the Company in May 2004. Born in 1948, Mr Boullé holds a degree from the ‘Institut d’Etudes Politiques de Paris’ (Sciences Po - Section Economique et Financière). Along his professional career, he was involved mainly in the leadership of companies engaged in Distribution and Trade. Until March 2016, Mr Boullé was the Managing Director of Suchem Ltd, a company specialised in importation and distribution of industrial chemicals, textile auxiliaries, plastic raw-materials, agro-chemicals and sprayers for agriculture. He was also the Managing Director of Archemics Ltd, distributor of consumer goods such as adhesives, cosmetics and detergents from Henkel Germany, and industrial products for cleaning, laundry, pools and textile fabrics. Mr Boullé is now retired and sits as Director on the Board of these two companies which form part of the Harel Mallac Group.
05 Arnaud LagessENon-Executive DirectorMr Arnaud Lagesse was appointed Director of the Company in August 2011. Born in 1968, Mr Lagesse holds a ‘Maitrise de Gestion’ from the University of Aix-Marseille III, France and is a graduate of the ‘Institut Supérieur de Gestion’, France. He also completed an Executive Education Program at INSEAD, Fontainebleau, France, and an Advanced Management Program (AMP180) at Harvard Business School, Boston, USA. In 1993, Mr Lagesse joined IBL Ltd (formerly known as GML Investissement Ltée) as Finance and Administrative Director before becoming its Chief Executive Officer in August 2005. Since July 1, 2016, following the amalgamation of GML Investissement Ltée and Ireland Blyth Limited, Mr Lagesse is the Group CEO of the newly formed entity, IBL Ltd. He was recently appointed as Chairman of the National Committee for Corporate Governance (‘NCCG’) after having been part of the Board Members Subcommittee of this institution in 2004. Mr Lagesse is also a member of the Board of Directors of several of the country’s major companies including Phoenix Beverages Limited and Alteo Limited, and is the Chairman of BlueLife Limited, LUX* Island Resorts Ltd and City Brokers Ltd, inter alia. Mr Lagesse is an ex-president of the Mauritius Chamber of Agriculture, the Mauritius Sugar Producers Association and the Sugar Industry Pension Fund. He is also the Chairman of the Fondation Joseph Lagesse since July 2012.
03 Joël HarelIndependent Non-Executive DirectorMr Joël Harel was appointed Director of the Company in July 2006. Born in 1967, Mr Harel holds a National Higher Diploma in Mechanical Engineering from Cape Technikon in Cape Town. He is currently Projects Manager at Emineo Ltd, a company involved in the engineering and the realisation of projects mainly in the sugar cane sector and its associated by-products and operating both locally and overseas. Mr Harel is the Chairman of the Company’s Corporate Governance Committee and is also a Director of Filature de Riche Terre Ltée, a non-listed company.
06 Stéphane Lagesse Non-Executive DirectorMr Stéphane Lagesse was appointed Director of the Company in November 2011. Born in 1959, Mr Lagesse holds a degree in ‘Gestion des Entreprises’ from the University of Paris IX Dauphine. He joined the Palmar Group in 1983 where he is currently the Managing Director. Mr Lagesse participated in the setting up of two garment manufacturing companies in Mauritius.
07 Thierry Lagesse Non-Executive DirectorMr Thierry Lagesse was appointed Director of the Company in December 1989 and subsequently Chairman of the Board in December 2002 until August 2013. Born in 1953, Mr Lagesse holds a ‘Maîtrise des Sciences de Gestion’ from the University of Paris Dauphine. He was the Non-Executive Chairman of IBL Ltd (formerly known as GML Investissement Ltée), Alteo Limited and Phoenix Beverages Limited and a Director of several other companies quoted on the Stock Exchange of Mauritius Ltd. He is also the Executive Chairman and founder of Palmar Group of Companies and the Executive Chairman of Parabole Réunion SA. Mr Lagesse is a member of the Company’s Corporate Governance, Nomination and Remuneration Committee.
08 Jean Claude Maingard Non-Executive DirectorMr Jean Claude Maingard was appointed Director of the Company in November 2007. Born in 1946, Mr Maingard holds a Diploma in Quantity Surveying from the University of Cape Town and is a member of the Royal Institute of Chartered Surveyors (M.R.I.C.S.). In 1972, he joined General Construction Co. Ltd, a well-known firm of building and civil engineering contractors operating in Mauritius, and was appointed Executive Director in 1986 and Managing Director from 1998 to 2006. Mr Maingard is now retired and acts as Chairman of the company.
09 E. Jean Mamet Independent Non-Executive DirectorMr E.Jean Mamet was appointed Director of the Company in November 2004 and is currently the Chairman of the Audit Committee. Born in 1943, Mr Mamet is a Certified Accountant and has been in practice for forty-three years involved in auditing and consulting services up to 2003 when he retired as Managing Partner of Ernst & Young Mauritius.
10 Christophe Quevauvilliers Executive DirectorMr Christophe Quevauvilliers, born in 1968, is a Fellow member of the Association of Chartered Certified Accountants. He joined the Group as Finance Manager and Company Secretary in May 2002 after having spent ten years in public practice at De Chazal Du Mée (now known as BDO) and four years in the industrial sector. In 2013-2014 he completed a General Management Program delivered by the ESSEC (Ecole Supèrieure des Sciences Economiques et Commerciales) Business School. On September 24, 2015, Mr Quevauvilliers resigned as Company Secretary and was appointed as Executive Director to the Board, effective as from October 1, 2015, He also sits on the Board of several companies within the Group.
11 Stéphane Ulcoq Group CEO and Executive DirectorMr Stéphane Ulcoq, born in 1977, holds a ‘Diplôme d’Ingénieur en Mécanique’ from the ‘Institut National des Sciences Appliquées’ (INSA) of Rouen, France and an ‘MBA International Paris’ from the Paris Dauphine and La Sorbonne Universities. He also holds a Certificate in Global Management awarded by INSEAD after having completed three Executive Education Programs at INSEAD Fontainebleau, France and INSEAD Singapore in 2011 and 2012. Mr Ulcoq joined the Company as Assistant Works Manager in year 2000 and was promoted Workshop Manager in 2007. In January 2012, Mr Ulcoq was promoted to the post of Production Manager where he was in charge of all production units, both in Mauritius and overseas. In addition to his responsibilities as Production Manager, Mr Ulcoq was appointed Deputy CEO by the Board of Directors in December 2012. He then gradually handed over his duties as Production Manager and was appointed CEO of the Company in January 2015 and eventually Group CEO with effect from July 2015.

12
UB
P A
NN
UA
L R
EP
OR
T 2
016
13
UB
P A
NN
UA
L R
EP
OR
T 2
016
Rémi de Gersigny
Mr Rémi de Gersigny, born in 1953, joined the Company as supervisor in 1978 and was promoted to the post of Plant Manager in 1981. In the early nineties, he was appointed Area Manager of the western and central regions where he was in charge of three crushing plants. In 2004, Mr de Gersigny was promoted to the post of Operations and Project Manager where he was in charge of all operational matters for our plants in Mauritius and overseas. In January 2012, he was promoted to the post of Project and Business Development Manager.
Laurent Béga
Mr Laurent Béga, born in 1979, holds a BSc in Mechanical Engineering from the University of Cape Town (SA) and an MBA from the University of Surrey (UK). He joined the Company as Group Engineering Manager in May 2014 where he is since responsible for all engineering services, machinery maintenance and supplies as well as projects, both in Mauritius and overseas. While working at Forges Tardieu Ltd and subsequently at Emineo Ltd, Mr Béga has been involved in heavy machinery engineering design and project realisation in the sugar cane industry in various African countries. He had previously gained experience in heavy machinery maintenance at the Construction and Materials Handling department (CMH) of IBL Ltd, now known as CMH Ltd. Caroline Tyack
Mrs Caroline Tyack, born in 1979, holds a ‘Diplôme d’Etudes Approfondies’ (DEA) en ‘Veilles et Intelligence Compétitive’ from the ‘Université Paul Valéry’, Montpellier, France. She joined the Company as Communication Manager in January 2005 after having followed a crash course in ‘Administration et Gestion du Personnel’ at CNAM (Conservatoire National des Arts et Métiers) at Montpellier, France. In November 2006, Mrs Tyack was promoted to the post of Group Marketing and Communication Manager where she is since responsible for all marketing and communication matters relevant to the Group. She is also responsible for developing the CSR strategies of the Group.
Dwight Hamilton
Mr Dwight Hamilton, born in 1974, holds a Professional Graduate Diploma in Information Technology from the National Council for Vocational Qualification (NCVQ). He joined the Company as System’s Coordinator in 2004 where he was in charge for the implementation of the ERP for the Group. In 2011, he was promoted to the post of IT Manager for the Group where he is since responsible for the information technology and computer systems required to meet the enterprise goals.
Jocelyne L’Arrogant
Ms Jocelyne L’Arrogant, born in 1969, holds a diploma in Management (Financial Management) from the University of Mauritius. She joined the Company as Accounts Officer in 1989 and was given the responsibility of the Import and Logistic department of Espace Maison Ltée and the Procurement department of the UBP Group in 2002. In 2011, Ms L’Arrogant was promoted to the post of Group Procurement and Logistic Manager.
Priscilla Chinien
Mrs Priscilla Chinien, born in 1968, holds a Diploma in Human Resources Management from the Association of Business Executive (UK). She joined the Company as Personal Assistant to the Administrative Manager in 2003 after having held executive administrative positions at PwC. In 2009, Mrs Chinien moved to our HR department and was promoted to the post of HR Lead in 2014, assisting directly the Group Human Resources Manager. Upon the resignation of the latter in April 2015, Mrs Chinien was appointed Acting Group Human Resources Manager.
Jean Marc Selvon
Mr Jean-Marc Selvon, born in 1962, holds a Higher Diploma in Integrated Marketing and Communication from AAA South Africa. He joined Pre-mixed Concrete Ltd as Sales Representative in 1982 and held successively the posts of Assistant Sales Manager, Sales Manager and Sales and Marketing Manager until 2012. Mr Selvon thereafter joined Dry Mixed Products Ltd as Sales and Marketing Manager up to March 2015 when he was offered the job of Sales Manager of UBP where he oversees since all the core business sales function.
Dhuenesh Rambarassah
Mr Dhuenesh Rambarassah, born in 1976, is a Fellow member of the Association of Chartered Certified Accountants and holder of an MBA with a specialisation in strategic planning from the Edinburg Business School of Scotland. He joined the Company as Financial Accountant in February 2006 after having spent more than eight years successively in the Audit and Assurance department of Ernst & Young and De Chazal Du Mée (now known as BDO) where he was involved in the audit of several of the major companies in Mauritius. In July 2013, Mr Rambarassah was designated Financial Controller of the majority of companies within the Group.
Francis Koenig
Mr Francis Koenig, born in 1957, joined the Company in 1981 and was in charge of Stone Utilities Ltd. In the same year, he was promoted to the post of Plant Manager for Terre Rouge, Roche Bois and Coromandel plants. After two years at this position, he was promoted to the post of Area Manager for the northern region until 1991 when he moved to the southern region. In February 2012, he was promoted to the post of Quarry and Field Manager where he is since in charge of our Land Reclamation Unit involved in quarrying operations and the supply of raw-materials to the majority of our production sites.
Amaury Lacoste
Mr Amaury Lacoste, born in 1985, holds a Master in Civil Engineering ‘Conception d’Ouvrage d’Art & Bâtiment’ from the ‘Université Paul Sabatier’, Toulouse, France. In 2009, he completed his final year project and worked in a geotechnical engineering office in St Denis, Réunion Island. In January 2010, he joined the Company as Project Engineer and Coordinator within the engineering department up to January 2013 when he was appointed Assistant Production Manager for our crushing and block-making activities. In January 2015, Mr Lacoste was promoted to the post of Production Manager for the central and southern regions.
Fabien Harel
Mr Fabien Harel, born in 1981, holds a ‘Maitrise en Science Economique et Sociale’ from the University of Toulouse 1 and an ‘MBA International Paris’ from the Paris Dauphine and La Sorbonne Universities. He joined the Group as Shop Manager of Espace Maison Ltée in August 2005. In 2009, he moved to UBP as Property Development Manager until July 2011 when he was appointed Area Manager of the northern region in charge of two crushing plants and one sales ‘dépôt’. In 2012, he was promoted to the post of Sales Manager where he was responsible for the sales strategy and customer care of the core business activities whilst still being in charge of all properties within the Group. In March 2015, Mr Harel was promoted to the post of Production Manager for our crushing and block-making activities in the northern region.
Bruno de Spéville
Mr Bruno de Spéville, born in 1960, followed an induction course with Euro Brevet in a cement tiles factory in the UK. He joined the Company as Sales Manager in September 1994 after having managed Bocaro Ltd from 1979 to 1987 and worked as Sales Manager at Rogers Building Materials Products Ltd from 1988 to 1994. In 2002, Mr de Spéville was appointed Project and Commercial Manager of Espace Maison Ltée. In January 2016, Mr de Spéville was appointed Manager of UBP – Marbella Division where he is since responsible of the production of precast products, concrete pipes, roof tiles and rustic pavements.
Ashwin Ramsaha
Mr Ashwin Ramsaha, born in 1959, holds an MSc in Civil Engineering with a specialization in Structural Engineering from the University of Architecture, Civil Engineering and Geodesy-Sofia. He is a Registered Professional Engineer of the Council of Engineers in Mauritius and has been practicing continuously in the private and public sectors in Mauritius and in Toronto since 1987. In 2007, Mr Ramsaha joined the Company as Assistant Manager of our PPB Division which is involved in the production of precast concrete slabs. In February 2015, he was promoted to the post of Manager of that division.
Edley Michaud
Mr Edley Michaud, born in 1951, holds a Certificate in Personnel Management and Industrial Relations, a Diploma in Occupational Safety and Health from the National College of Industrial Hygiene (Australia). He is also a Fellow member of the British Safety Council and a registered Safety Officer under the Occupational Safety and Health Act. Mr Michaud joined the Company as Production Supervisor in 1973 and became Personnel Manager in July 1987. He is closely involved in all safety, health and environmental regulations within the Group.
Benoit Béchard
Mr Benoit Béchard, born in 1965, holds a Master of Business Administration with specialisation in Finance from the Charles Stuart University NSW, Australia, an ISM Diploma in Management from the Institute of Leadership and Management of UK and a Foundation Certificate in Tax from the Taxation Institute of Australia. He is a member of the Australian Institute of Management and of the Taxation Institute of Australia and he is also an affiliate member of the Institute of Leadership and Management of UK. Mr Béchard joined the Group as General Manager of Espace Maison Ltée in January 2016 after having occupied senior managerial positions in various sectors of activity over the past twenty years, namely: Transport and Logistic, Finance and Accounting, Manufacturing and Processing and Property.
Christopher Blackburn
Mr Christopher Blackburn, born in 1969, holds a ‘Brevet de Technicien Agricole’ with a specialisation in ‘Jardin Espace Vert’ (France) and a Bachelor of Commerce (Bcom) in Marketing from Curtin University Australia. He is currently pursuing a Master in Strategic and Consulting Organisation with ESCP Paris. Mr Blackburn joined the Group as General Manager of Compagnie de Gros Cailloux Limitée in May 2012 after having worked as General Manager of the Landscaping and Nursery department at Médine Ltd.
Jean Claude Bellepeau
Mr Jean Claude Bellepeau, born in 1963, holds a ‘Diplôme d’Ingénieur Chimiste’ from EHICS, Strasbourg, France. After having spent ten years in the textile and industrial chemicals sectors in Mauritius, he joined the Lafarge Group to launch the cement terminal in Mayotte. He then joined Pre-mixed Concrete Ltd as Operations Manager in 2003 and was promoted General Manager of Pre-mixed Concrete Ltd and Dry Mixed Products Ltd in 2008. In 2011, further to the reorganisation of the two companies, Mr Bellepeau directed the integration of Dry Mixed Products Ltd into the UBP Group and is henceforth the General Manager of the company.
Bhooneshi Nemchand
Mrs Bhooneshi Nemchand, born in 1987, holds a BA (Hons) Law and Management and an MBA (International Business) from the University of Mauritius and is an Associate member of the Institute of Chartered Secretaries and Administrators (UK). She joined the Group as Company Secretary Designate in May 2015 after having spent six years in the financial services sector and was appointed Company Secretary in October 2015. In February and July 2016, Mrs Nemchand was appointed Company Secretary of several companies within the Group.
SENIOR OFFICERS’PROFILES

100% Espace Maison Ltée
100% Compagnie de Gros Cailloux Limitée
100% Société d’investissement Rodriguais
75.9% Welcome Industries Ltd
100% UBP Madagascar
100% UBP International Limited
77% United Granite Product (Private) Limited
100% DHK Metal Crusher (Private) Limited
100% Sheffield Trading (Private) Limited
76.5% Sainte Marie Crushing Plant Limited
100% Société des Petits Cailloux
51% Dry Mixed Products Ltd
100% Marbella Ltd
100% Land Reclamation Limited
100% Stone and Bricks Limited
100% The Stone Masters Co. Ltd
100% Pricom Ltd
Operational Dormant
* Via UBP Madagascar
THE UNITED BASALT PRODUCTS LIMITEDSUBSIDIARIES
THE UNITED BASALT PRODUCTS LIMITEDASSOCIATES
46% Terrarock Ltd
49% Pre-mixed Concrete Limited
25% Sud Concassage Limitée
25% Cement Transport Ltd
20% Compagnie Mauricienne d’Entreprise Ltée
34% Prochimad Mines et Carrières SARL*
GROUP STRUCTURE
14
UB
P A
NN
UA
L R
EP
OR
T 2
016
15
UB
P A
NN
UA
L R
EP
OR
T 2
016

17
UB
P A
NN
UA
L R
EP
OR
T 2
016
16
UB
P A
NN
UA
L R
EP
OR
T 2
016
FINANCIAL HIGHLIGHTS AND RATIOS
NET ASSETS VALUE PER SHARE
SHARE PRICE
EQUITY ATTRIBUTABLE TO SHAREHOLDERS OF THE PARENT
DIVIDEND PER SHARE
Note 1: Figures of Net Assets Value Per Share, Equity attributable to Shareholders of the Parent and Earnings Per Share for years 2012 and 2013 have been adjusted to reflect the effect of adopting IAS 19.Note 2: Figures of Net Assets Value Per Share, Equity attributable to Shareholders of the Parent and financial ratios for years 2012 to 2015 have been adjusted to reflect a prior year adjustment arising on the consolidation of group results - see note 2.6 on page 76.
2012
2012 2012
20122013
2013 2013
20132014
2014 2014
20142015
2015 2015
20152016
2016 2016
201694.00
0.00 2.60
2,500,000
95.00
20.002.65
2,550,000
96.00
40.00
2.70
2,600,00097.00
60.00
2.75
2,650,00098.00
80.00
2.80
2,700,00099.00
100.00
2.85
2,750,000
2,66
1,76
1
2,69
6,19
8
2,61
7,38
0
2,57
3,93
6 2,63
1,48
1
101.00
Rs
100.00
120.00
108.
00
98.0
0
84.0
0
85.0
0
83.0
0 2.90
102.00
100.
41
101.
70
98.7
3
97.0
9
99.2
6
Rs
2.95
3.00
Rs
2.75
2.75
2.75
3.00
3.00
Rs ‘000
Rs
2012 2013 2014 2015 2016
EARNINGS PER SHARE
Rs’000
3,000,000
2,500,000
2,000,000
1,500,000
1,000,000
500,000
0
2012 2013 2014 2015 2016
REVENUEUBP SHARE PRICE V/S SEMDEX
100
92
84
76
68
01/07/15 01/09/15 01/11/15 01/01/16 01/03/16 01/05/16 01/07/16
Rs
UBP Share Price SEMDEX 2,000
Rs
1,900
1,800
1,700
1,600
8
7
6
5
4
3
2
1
0
Rs
2012 2013 2014 2015 2016
EARNINGS PER SHARE
Rs’000
2,700,000
2,58
0,44
9
2,44
3,42
4
2,36
2,56
2
2,35
5,24
0
2,63
6,45
0
2,600,000
2,500,000
2,400,000
2,300,000
2,200,000
2012 2013 2014 2015 2016
REVENUE
UBP SHARE PRICE V/S SEMDEX
100
92
84
76
68
01/07/15 01/09/15 01/11/15 01/01/16 01/03/16 01/05/16 01/07/16
Rs
UBP Share Price SEMDEX 2,000
Rs
1,900
1,800
1,700
1,600
8.00
5.54
6.09
2.59
2.56
5.14
7.00
6.00
5.00
4.00
3.00
2.00
1.00
0.00
Rs
2012 2013 2014 2015 2016
EARNINGS PER SHARE
Rs’000
2,700,000
2,58
0,44
9
2,44
3,42
4
2,36
2,56
2
2,35
5,24
0
2,63
6,45
0
2,600,000
2,500,000
2,400,000
2,300,000
2,200,000
2012 2013 2014 2015 2016
REVENUE
UBP SHARE PRICE V/S SEMDEX
100
92
84
76
68
01/07/15 01/09/15 01/11/15 01/01/16 01/03/16 01/05/16 01/07/16
Rs
UBP Share Price SEMDEX 2,000
Rs
1,900
1,800
1,700
1,600
8.00
5.54
6.09
2.59
2.56
5.14
7.00
6.00
5.00
4.00
3.00
2.00
1.00
0.00Statement of Financial Position
THE GROUPJune 30, June 30,
2016 2015Rs’ 000 Rs’ 000
RestatedTotal assets 4,306,485 4,284,276Interest-bearing loans and borrowings 1,014,546 1,030,171
Borrowings excluding bank overdrafts 767,567 750,444
Equity attributable to shareholders of the parent
2,631,481 2,573,936
Rs RsNet assets value per share 99.26 97.09
Financial Ratios 2016 2015Operating margin - % 9.65 6.98
Interest cover - times 4.85 2.71
Dividend cover - times 1.71 0.93
Return on equity - % 5.18 2.64
Return on assets - % 3.17 1.58
Debt to equity - times 0.39 0.40
Statement of Profit or Loss andOther Comprehensive Income
THE GROUP
June 30, June 30,2016 2015
Rs’ 000 Rs’ 000Revenue 2,636,450 2,355,240EBITDA 500,999 393,254
Depreciation and amortisation (246,675) (228,831)
Operating profit 254,324 164,423
Net finance costs (49,160) (57,716)
Share of results of associates (6,367) (3,163)
Profit before tax 198,797 103,544
Income tax expense (40,694) (20,432)
Profit for the year 158,103 83,112
Non-controlling interests (21,757) (15,262)
Profit for the year attributable to equity holders of the parent 136,346 67,850
Rs RsEarnings per share
Basic, profit for the year attributable to ordinary equity holders of the parent 5.14 2.56
Dividend per share 3.00 2.75

18
UB
P A
NN
UA
L R
EP
OR
T 2
016
June 30, June 30,2016 2015
Rs’ 000 Rs’ 000
Sale of goods and services 2,636,450 2,355,240
Paid to suppliers for materials and services 1,727,898 1,565,973
Value added 908,552 789,267
Other operating income 82,822 68,762
Total wealth created 991,374 858,029
Distributed as follows:
EmployeesSalaries and other benefits 488,005 455,075
Providers of capitalDividend 79,530 72,903
Interest paid on borrowings 51,633 60,706
Dividend to non-controlling interests 15,010 12,583
146,173 146,192
Government and parastatal corporationsIncome tax (current and deferred) 40,694 20,432
Environment protection fee 10,544 9,528
Licences and permits 2,467 3,024
53,705 32,984
Reinvested in the Group to maintain and develop operationsDepreciation, amortisation and impairment
246,675 228,831
Retained Profit/(Loss) 56,816 (5,053)
303,491 223,778
Total wealth distributed and retained 991,374 858,029
VALUE ADDED STATEMENT
JUNE 30, 2015
JUNE 30, 2016
JUNE 30, 2015
JUNE 30, 2016
49% Employees
15% Providers of capital
5% Government & parastatal corporation
31% Reinvested in the Group
53% Employees
17% Providers of capital
4% Government & parastatal corporation
26% Reinvested in the Group
19
UB
P A
NN
UA
L R
EP
OR
T 2
016

21
UB
P A
NN
UA
L R
EP
OR
T 2
016
20
UB
P A
NN
UA
L R
EP
OR
T 2
016
CHAIRMAN’SREPORT
Dear Shareholder,
I am pleased to present to you the Annual Report of The United Basalt Products Limited (“UBP”) and of the Group for the year ended June 30, 2016 and to comment on the performance and achievements for the year.
AN IMPROVED PERFORMANCE
The Group’s performance improved significantly during the financial year 2015-2016. The Group’s revenue increased by 11.9% to Rs 2.6 billion whilst the Group’s profit increased from Rs 83.1 million in 2015 to Rs 158.1 million for the year under review. This rise in performance was attributable mainly to our local core business and retail segments. In terms of our core business, the improved results were driven mainly by a rise in revenue and the positive impact of our cost reduction actions on both our stone crushing and dry mortar activities. In terms of our retail segment, our subsidiary Espace Maison Ltée saw its net profit increase from Rs 5.5 million in 2015 to Rs 28.4 million for the year under review, a significant leap attributable mainly to a rise in revenue and an improved stock and supply chain management.
The Group’s financial position remained strong with total assets of Rs 4.3 billion, total liabilities of Rs 1.6 billion and a debt to equity ratio of 0.39 times. This ‘good-standing’ situation enables the Group to pursue its development strategy by seizing new business growth opportunities, both locally and overseas. In so doing, the Company acquired a 15% stake in a company manufacturing clay bricks in Zambia in December 2015.
Marc FreismuthChairman

22
UB
P A
NN
UA
L R
EP
OR
T 2
016
DESPITE A DIFFICULT ECONOMIC CONTEXT
The real GDP growth rate decreased from 3.6% for calendar year 2014 to 3.0% for calendar year 2015 whilst the level of investment as a % of GDP dropped from 18.9% to 17.4% for the same periods. The economic context remains difficult despite an increased real GDP growth rate forecast of 3.9% and a forecasted level of investment to GDP of 17.5% for 2016.
The real growth rate of the construction sector, although still negative, ‘improved’ from -8.5% for calendar year 2014 to -4.9% for calendar year 2015 compared to a forecast of -2.6%. For 2016, the forecasted real growth rate has just recently been revised from +1.6% to 0.0%.
Despite experiencing an improvement over previous year, the construction sector remains in a difficult situation due to a lack of major public infrastructure and private property development projects. According to a report from the Bank of Mauritius, the amount of housing loans granted by banks for individual house projects has increased since January 2016 whilst loans granted to enterprises of the construction sector have dropped. The property market is still characterised by an oversupply which forces prices down and hence reduces profit prospects for investors and promoters. This situation, if persisting, might be very damaging for companies operating in the sector.
To restore a ‘feel good factor’, the entrepreneurs are waiting for strong measures from the Government to reinstate confidence and economic growth in the medium to long term. The key success factors required to trigger the private sector investment need to be present, namely a stable political climate, a consistent economic policy and a favourable international perspective.
INCREASED SHAREHOLDERS’ RETURN
The Group’s Earnings Per Share (EPS) increased from Rs 2.56 in previous year to Rs 5.14 for the year under review. Consequently, an increased Dividend Per Share (DPS) of Rs 3.00 (2015 : Rs 2.75 per share) was declared and paid by the Company in respect of the financial year ended on June 30, 2016.
Our share price decreased by 2.4% to Rs 83.00 at June 30, 2016 (2015 : Rs 85.00) whereas the SEMDEX decreased by 11.5% during the financial year 2015-2016. The dividend yield increased from 3.23% in previous year to 3.61% for the year under review.
At the time of writing, the share of the Company is quoted at Rs 87.00 on the Official Market of the Stock Exchange of Mauritius Ltd.
ENHANCED GOVERNANCE AND RISK MANAGEMENT FRAMEWORKS
This year again, the Corporate Governance Committee worked actively to improve governance practices within the Group. In so doing, the Committee recommended to the Board for approval, the new Company’s Code of Ethics, a Directors’ Charter and a Share Dealing Policy. The Committee also recommended the nomination of a second Executive Director to the Board and considered the provisions contained in the new Code of Corporate Governance, to be complied with by the end of June 2017.
The Board of Directors is conscious of its responsibilities in terms of corporate citizenship and sustainable development practices to safeguard the interests of all stakeholders. In so doing, it ensures a full respect of the working and social environment through a set of preventive measures and a clearly-defined CSR programme.
The Board is also concerned about risk management and compliance issues. To this end, a Risk Monitoring Committee was set up this year to assist the Board in the discharge of its duties in terms of risk governance practices. Furthermore, the Board approved the implementation of an Enterprise Risk Management framework and a Business Continuity Management plan within the Group. At the time of writing, the risk management framework and the risk registers are in an advanced stage of completion, pending the approval of the Risk Monitoring Committee.
ENCOURAGING PERSPECTIVES
The achievement of the Group’s performance forecast for the financial year 2016-2017 is dependent on the prevailing economic climate which in turn depends on the economic measures taken by the Government to promote and assist various sectors of our economy. If prevailing, such conditions should favour investments in property development projects which, if combined with investments in public infrastructure projects, should boost up the construction industry going forward.
The Group’s revenue trend since July 2016 denotes an improvement over that of the corresponding period in 2015. Nevertheless, the Group remains committed to pursue its development plan by focusing on innovation and cost control and by seeking new business opportunities, both locally and overseas.
ACKNOWLEDGEMENTS
I wish to thank my fellow members of the Board of Directors for their contribution and support during the year under review.
I also wish, on behalf of the Board of Directors, to thank the Chief Executive Officer, his management team and the personnel at large for their hard work and dedication during the year under review.
Finally, I would like to acknowledge with thanks the faithful contribution of our partners and customers to the success of our Group over the years.
Marc Freismuth Chairman
September 27, 2016
23
UB
P A
NN
UA
L R
EP
OR
T 2
016

25
UB
P A
NN
UA
L R
EP
OR
T 2
016
24
UB
P A
NN
UA
L R
EP
OR
T 2
016
CHIEF EXECUTIVE OFFICERREPORT
DEAR SHAREHOLDER,
I am pleased to report to you on the operations and performance of The United Basalt Products Limited (“UBP”) and of the Group for the year ended June 30, 2016 and to share with you our development plans.
OPERATIONAL REVIEW
Revenue and results by operations segmentThe Group’s revenue for the year increased by 11.9% to reach Rs 2.6 billion whilst the Group’s operating profit increased from Rs 164.4 million in 2015 to Rs 254.3 million this year, a rise of 54.7%. The operating profit to revenue ratio increased from 7.0% in 2015 to 9.6% this year. This upward performance was attributable mainly to our local core business and retail operations segments.
Despite the difficult economic conditions prevailing, our core business activities locally experienced a growth in sales volumes whilst our selling prices were kept almost constant due to the fierce competition prevailing on the market. Sales to the private-dwelling’s market improved whilst sales to projects, although improving, were still low due to the unfavourable business climate prevailing in the construction sector. At Company level, the revenue for the year under review increased by 10.1% whilst the operating profit decreased by 5.9% from Rs 145.1 million to Rs 136.6 million due to an exceptional impairment provision on amounts receivable from our subsidiary in Sri Lanka. Without this impairment provision, our operating profit would have increased by 34.1% from Rs 145.1 million in 2015 to Rs 194.6 million this year, thereby denoting an increase from 11.4% to 14.0% of revenue. This increase was attributable mainly to a drop in the cost of production of our core products and synergies resulting from the upgrading and centralisation of our production plants. Our stone-crushing subsidiary companies operating in Mauritius and Rodrigues also performed well similarly to our dry mortar entity which experienced a 7.9% rise in revenue and an improved operating profit compared to prior year where our performance was affected by exceptional increases in production costs and administrative expenses.
Overseas, our subsidiary company operating in Madagascar experienced a drop in revenue and operating performance due to the poor market conditions prevailing, increased production costs and administrative constraints imposed by local authorities. In Sri Lanka, our subsidiary experienced a significant drop in revenue resulting from the non-renewal of its crushing permit since December 2015. Consequently, our subsidiary’s operating loss increased compared to prior year. Furthermore, the investment of our Sri Lankan company in two subsidiaries was impaired by Rs 14.5 million to reflect the uncertainty around the realisable value of assets held by these subsidiaries. In view of the above, the amounts receivable by UBP from our subsidiary operating in Sri Lanka were impaired by Rs 58 million and disclosed as part of administrative expenses in the statement of profit or loss and other comprehensive income for the year with no impact on the Group figures as this relates to a subsidiary company. Stéphane Ulcoq
Chief Executive Officer
27
UB
P A
NN
UA
L R
EP
OR
T 2
016
26
UB
P A
NN
UA
L R
EP
OR
T 2
016
CHIEF EXECUTIVE OFFICER’S REPORT (CONT’D)
In terms of our retail segment, the revenue from Espace Maison Ltée for the year increased by 19.7% to Rs 871.3 million, boosted by both shop sales and project sales. The operating profit increased from Rs 7.4 million in 2015 to Rs 28.9 million for the year under review. This improved performance was attributable mainly to an improved supply chain and stock management and a widened choice of quality products. The performances of our shop in Flacq and of ‘Ma Jardinerie’ at Gros Cailloux have improved but are still operating at a loss.
In terms of our agriculture segment, the revenue from Compagnie de Gros Cailloux Limitée for the year was equivalent to that of 2015 but denoting a drop in sugar proceeds and landscaping revenue which was somewhat compensated by an increase in vegetable sales proceeds and revenue from leisure activities. The sugar crop tonnage dropped by 13.1% to 1,612 tons of sugar whilst the price increased slightly from Rs 14,693 per ton in 2015 to Rs 15,166 per ton this year, including a special compensation of Rs 2,000 per ton from the SIFB. The operating performance of the company, although still loss-making, improved by Rs 7.6 million to end up at a loss of Rs 18.6 million for the year under review.
Finance income and finance costsThe Group’s finance income dropped from Rs 3.0 million in 2015 to Rs 2.5 million this year whilst at Company level the reverse was noted due to higher dividend income from subsidiaries and associates. In terms of finance costs, an appreciable drop was noted both at Group and Company levels due to the reduction of our borrowings, the drop in interest rates and our improved cash flow situation resulting from our improved performance and the lower capital expenditure for the year under review compared to previous year.
Share of results from associatesOur share of results from associates, net of tax, was impacted by significant losses incurred by our 49%-owned ready-mixed concrete entity attributable to a major non-recurrent bad debt provision of Rs 13.2 million and restructuring costs. After taking into consideration the improved performance of our other core business associates, the net share of results moved from a loss of Rs 3.1 million in 2015 to a loss of Rs 6.3 million this year.
EPS and DPSThe Group’s profit for the year increased from Rs 83.1 million in 2015 to Rs 158.1 million this year. After taking into consideration the share attributable to non-controlling interests, the Group’s Earnings Per Share (EPS) increased significantly from Rs 2.56 in previous year to Rs 5.14 for the year under review. Consequently, an increased Dividend Per Share (DPS) of Rs 3.00 (2015 : Rs 2.75 per share) was declared and paid by the Company in respect of the financial year under review.
STATEMENT OF FINANCIAL POSITION
The Group’s financial position remained strong during the year under review with total assets of Rs 4.3 billion and total liabilities of Rs 1.6 billion whilst the equity attributable to shareholders of the parent company increased by Rs 57.5 million to Rs 2.6 billion. The trade and other receivables and payables for 2015 and 2014 were restated further to an adjustment of Rs 165.4 million arising on the consolidation of overseas group results, thus giving rise to an adverse movement of Rs 165.4 million in our reserves brought forward at July 1, 2015. Despite an increase in leasing finance, the Group’s borrowings were reduced slightly during the year with no new term loans contracted. On June 30, 2016 our Rs 560 million 5-year bonds were trading at Rs 100.00 per unit with a maturity set for October 2018. The debt to equity ratio moved from 0.40 (restated) times in 2015 to 0.39
times this year whilst the Net Assets Value (NAV) per share increased from Rs 97.09 (restated) at June 30, 2015 to Rs 99.26 this year. At Company level, an amount of Rs 78.5 million receivable from Compagnie de Gros Cailloux Limitée was converted into equity during the year with an additional investment of Rs 21.5 million subscribed for to provide our subsidiary with working capital and financing means to realise its agricultural diversification project as explained below.
The Group’s total investment in property, plant and equipment decreased from Rs 355.3 million in 2015 to Rs 257.9 million for the year under review and was almost fully financed out of funds generated from our operations. Besides the normal replacement of existing assets, a major part of the Group’s capital expenditure for the year was spent on new development projects as detailed thereafter.
The other major movements in the Group’s Statement of Financial Position during the year comprised of an increase of Rs 20.8 million in available-for-sale investments, a decrease of Rs 8.5 million in trade and other receivables, a decrease of Rs 15.4 million in employee benefit liability and a decrease of Rs 18.2 million in trade and other payables. The cash and cash equivalent increased by Rs 54.8 million for the year under review compared to a decrease of Rs 42.0 million in 2015, a significant turnaround. The other major group cash outflows made during the year comprised of the servicing of loans and leases and the payment of dividends.
DEVELOPMENT PLANS
The major development projects realised during the financial year under review in terms of our core business segment of activities comprised of the installation of a new crusher with increased capacity for our plant at Geoffroy Road, the construction of a settling pond at Plaine Magnien, the upgrading of our main crushing plants at Poudre d’Or and St Julien, the extension of our block shed at St Julien, the extension and upgrading of our laboratory for improved product testing and R&D experimentation, the purchase of additional equipment to increase the capacity of our quarrying division and the implementation of new IT systems to automate and increase the efficiency of our aggregates delivery process as well as our quarrying and PPB precast slabs operations. In terms of our dry mortar activities, the major developments comprised of the completion of a newly-built store, the extension of the laboratory and the installation of a new packer and palletizer, thereby completing our three-year upgrading ‘Capex’ program. Besides production-related projects, a significant part of our capital expenditure for the year under review was spent for the upgrading of canteen and mess room facilities for our employees. New development projects in the pipeline for the financial year 2016-2017 comprise of the upgrading of our primary crusher at Plaine Magnien, the construction of a new production tunnel to improve the stock-piling at Geoffroy Road, the continuous upgrading of our crushing plants at Geoffroy Road, Poudre d’Or and St Julien, the purchase of new moulds for blocks and pavers production and the acquisition of more sophisticated equipments for our laboratory at ‘Drymix’.
In terms of our foreign operations, we are still considering the setting up of a crushing plant in the region of Colombo the capital of Sri Lanka. The discussions with a major local company in view of setting up a joint-venture for the manufacture of rocksand did not succeed so far. Besides this, we started exploring some business opportunities in Africa. Consequently, in December 2015, we acquired a 15% stake in a company manufacturing clay bricks in Zambia, the main objective behind this acquisition being to gain market knowledge in view of
considering the setting up a crushing plant in that country, going forward. In that aim, we intend to recruit a high-calibre Business Development Manager who will drive and manage our overseas business development projects. At the time of writing, we are considering to increase our stake in the Zambian company.
In terms of our Espace Maison retail segment of activities, there was no major development project during the year under review besides normal recurring capital expenditure aimed at the replacement of existing assets. In fact, this year was a transition year in terms of management since a new General Manager was recruited in January 2016. The new management team in place is focusing their efforts to improve the product range in order to gain extra market share and to increase efficiency across all processes and departments while containing overhead costs. The capital expenditure budget for the financial year 2016-2017 provides for the improvement of our warehousing facilities situated at Roche-Bois and Terre-Rouge including the implementation of a new IT Warehouse Management System and a major refurnishing and relooking of all our shops in order to improve and revitalize our customers shopping experience.
The major development projects realised for the year under review by our subsidiary Compagnie de Gros Cailloux Limitée comprised of a vegetable-growing diversification project, the extension of our nursery and the construction of a new club house for our exhibition area. Significant investments were made in specialised equipment and soil preparation to materialise the vegetables cultivation project over 32.3 hectares of land which has proved to be very successful so far. Besides this, we signed a lease for 5 hectares of land and entered into a partnership with a French company which specialises in vegetables cultivation using an innovative technique aimed at shortening the cultivation process and producing healthy products. Our capital expenditure budget for the financial year 2016-2017 provides for additional investments in our vegetable-growing diversification project with a view to increase the cultivation area to 55.7 hectares of land. We also plan to invest in the construction of a building to be rented out to a local company engaged in the distribution of vegetables.
In terms of the property development potential of the estate, the master plan definition by an international firm was put on hold temporarily. However, we are currently considering an agricultural land-parcelling project and the subdivision of an industrial plot of land to enable the construction of the above-mentioned building, to finance a VRS plan for our sugar cane cultivation activity and to generate profits for our future development plans.
The above-referred investments for financial year 2016-2017 are higher than those of the financial year under review but should be realised with a minimum of borrowings, thereby pursuing our overall debt reduction strategy.
Our future development strategy relies significantly on innovation, both in terms of processes and products. To this end, we spend significant capital expenditure in latest-technology plant and machinery every year. In terms of IT equipments, we have launched an ‘Open Innovation Program’ aimed at automating many of our business processes, including accounting tools, by making use of latest technology, including mobile applications, in order to bring more efficiency across all our functions and services, including our sales force. In terms of product innovation, we have appointed an R&D consultant to test and document new products to be introduced onto the market. In so doing, we recently launched an advertising campaign for ‘Smart Blocks’ which include the Block 20.15, the Ecoblock, the Corner Block and the U Block for very specific usage as explained on our new website.
FUTURE PROSPECTS
The recently published economic indicators denote a real GDP growth rate forecast of 3.9% for 2016 compared to 3.0% realised in 2015. In terms of the construction industry, the forecasted growth rate for 2016 stands at 0.0% compared to a negative growth rate of -4.9% realised in 2015. This announces improved business perspectives going forward but there is no clear visibility about the realisation timing of announced projects, both private and public.
The Group’s revenue since July 2016 is ahead of that of the corresponding period in 2015. Our future performance locally remains highly dependent on the level of investment in property development and public infrastructure projects which in turn depends on the prevailing economic climate. The somewhat altered Vision 2030 project and the recent national budget incentive measures aimed at boosting the property market and the construction industry are encouraging in many respect, with benefits spanning partly in the coming financial year 2016-2017 and over many years ahead. However, the Group remains committed to pursue its development plan by focusing on innovation, quality, customer fidelity, efficiency, cost control, resource optimisation and synergies between entities within the Group through the complementarity of our products. The Group is also continuously seeking for new business growth opportunities with an adequate risk management approach. Overseas, the situation remains challenging, mainly in Sri Lanka.
APPRECIATION
I wish to thank the members of the Board of Directors for their guidance and support during the financial year 2015-2016.
I also wish to express my appreciation and thanks to my colleagues of the management team and to the personnel at large for their restless efforts and commitment to the progress of our Group during the past financial year.
Finally, I would like to thank our business partners and our customers for their trust in our products and in our Group.
Stéphane Ulcoq Chief Executive Officer
September 27, 2016
29
UB
P A
NN
UA
L R
EP
OR
T 2
016
STATEMENT OF COMPLIANCE (AS PER SECTION 75(3) OF THE FINANCIAL REPORTING ACT),
The Board of Directors of The United Basalt Products Limited confirms that to the best of their knowledge, the Company has complied with all its obligations and requirements under the Code of Corporate Governance for the year ended June 30, 2016 except for Section 2.8 (Remuneration of Directors) of the Code. The reason for non-compliance to this section is included under the relevant heading on page 39 of this report.
On behalf of the Board
Marc Freismuth Stéphane UlcoqChairman Chief Executive Officer
September 27, 2016
The United Basalt Products Limited was incorporated as a public company in July 1953. The shares of the Company are listed on the Official Market of the Stock Exchange of Mauritius since 1989.
The Board of Directors acknowledges that the Code of Corporate Governance (‘the Code’) sets out the best practices in terms of corporate governance and this report describes how the main corporate governance principles have been applied within the Company.
SHAREHOLDING STRUCTURE
The shareholding structure of the Group at June 30, 2016 is as detailed on page 15. The share capital of the Company amounts to Rs 265,100,420 made up of 26,510,042 ordinary shares of no par value.
The Company has as Holding Company IBL Ltd (formerly known as GML Investissement Ltée) incorporated in Mauritius.
COMMON DIRECTORS
The list of common Directors with the shareholder companies holding more than 5% of the share capital of the Company at June 30, 2016 was as follows:
Directors UBP IBL Ltd*
Arnaud Lagesse
Thierry Lagesse
*Formerly known as GML Investissement Ltée.
CORPORATE GOVERNANCEREPORT
28
UB
P A
NN
UA
L R
EP
OR
T 2
016

31
UB
P A
NN
UA
L R
EP
OR
T 2
016
30
UB
P A
NN
UA
L R
EP
OR
T 2
016
CORPORATE GOVERNANCE REPORT (CONT’D)
SUBSTANTIAL SHAREHOLDERS
The only shareholder holding more than 5% of the share capital of the Company at June 30, 2016 was as follows:
Shareholders Number of shares % Holding
IBL Ltd (formerly known as GML Investissement Ltée) 8,785,100 33.14
Except for the above, no other entity or individual had an interest of 5% or more in the ordinary share capital of the Company.
In February 2016, Forward Investment and Development Enterprises Limited (now known as Bee Equity Partners Ltd), which held 11.01% of the ordinary share capital of the Company at June 30, 2015, distributed all its shares to its shareholders (including IBL Ltd) via a dividend in specie. Consequently, the number of shareholders of the Company nearly doubled.
SHAREHOLDING PROFILE
The share ownership and categories of shareholders at June 30, 2016 were as follows:
Size of shareholding Number of shareholders Number of shares owned Percentage (%)
1 - 500 2,301 268,217 1.01
501 – 1,000 393 285,150 1.08
1,001 – 5,000 753 1,807,434 6.82
5,001 – 10,000 222 1,552,814 5.86
10,001 – 50,000 213 4,131,438 15.58
50,001 – 100,000 35 2,424,086 9.14
100,001 – 250,000 12 1,672,042 6.31
250,001 – 1,000,000 10 4,355,488 16.43
Over 1,000,000 2 10,013,373 37.77
Total 3,941 26,510,042 100.00
Category of shareholders Number of shareholders Number of shares owned Percentage (%)
Individuals 3,561 7,934,395 29.93
Insurance and assurance companies 22 1,608,210 6.07
Pension and providence funds 74 3,959,036 14.93
Investment and trust companies 54 9,722,083 36.67
Other corporate bodies 230 3,286,318 12.40
Total 3,941 26,510,042 100.00
SHARES IN PUBLIC HANDS
In accordance with the Listing Rules of the Stock Exchange of Mauritius Ltd, at least 25% of the shareholding of the Company is in public hands.
SHARE REGISTRY AND TRANSFER OFFICE
The Company’s Share Registry and Transfer Office is administered in-house.
SHARE PRICE INFORMATION
The Company’s share price decreased by 2.4 % over the past financial year, from Rs 85.00 at June 30, 2015 to Rs 83.00 at June 30, 2016, whereas the SEMDEX decreased by 11.5% over the same period.
At the time of writing, the share of the Company is quoted at Rs 87.00 on the Official Market of the Stock Exchange of Mauritius Ltd compared to Rs 78.00 on September 24, 2015, date of the preceding Annual Report. The Price Earnings Ratio (PER) is at 33.98, the Dividend Yield at 3.45% and the Price to Net Assets Value (NAV) at 0.85.
Please refer to Financial Highlights and Ratios on page 16 for indicators, the share price movements over the past five years to June 30, 2016 and a comparison of the Company’s share price movement to the SEMDEX over the past financial year.
TOTAL SHAREHOLDERS’ RETURN AND MARKET DATA
Total Shareholders’ Return 2012 2013 2014 2015 2016
Share price at the end of the current year Rs 108.00 98.00 84.00 85.00 83.00
Share price at the end of the previous year Rs 135.00 108.00 98.00 84.00 85.00
Increase/(Decrease) in share price Rs (27.00) (10.00) (14.00) 1.00 (2.00)
Dividend per share Rs 2.75 3.00 2.75 2.75 3.00
Total return per share Rs (24.25) (7.00) (11.25) 3.75 1.00
Total return based on previous year’s share price % (17.96) (6.48) (11.48) 4.46 1.18
Market Data 2012 2013 2014 2015 2016
Market price per share:
High Rs 135.00 107.00 98.00 90.00 85.00
Low Rs 100.00 90.00 81.00 73.50 73.75
Average Rs 117.14 98.83 90.47 82.15 78.86
Share price at the end of the current year Rs 108.00 98.00 84.00 85.00 83.00
Value of shares traded Rs’m 129.00 216.52 178.16 119.93 61.66
Market capitalisation at June 30, Rs’m 2,863.08 2,597.98 2,226.84 2,253.35 2,200.33
DIVIDEND POLICY
The Company has no formal set dividend policy. The payment of dividend is subject to the Company’s performance, its cash flow position, its capital expenditure and debt servicing requirements as well as its foreseeable investments and growth opportunities. In so doing, the Board of Directors attempts to distribute a yearly dividend which, under normal circumstances, should remain sustainable in the medium to long term.
Based on results forecasts, the Company declares a final dividend in April/May each year provided the trend in the Group’s profitability is firmly established. Accordingly, on April 29, 2016, the Company declared a dividend of Rs 3.00 per share in respect of the financial year 2015-2016. This dividend was paid on June 24, 2016 to all ordinary shareholders registered at close of business on May 18, 2016.
Please refer to Financial Highlights and Ratios on page 16 for indicators and dividend paid per ordinary share over the past five years to June 30, 2016.

33
UB
P A
NN
UA
L R
EP
OR
T 2
016
32
UB
P A
NN
UA
L R
EP
OR
T 2
016
SHAREHOLDERS’ AGREEMENT
At the time of writing, there is no shareholders’ agreement to the knowledge of the Company.
ANNUAL MEETING OF SHAREHOLDERS
The Company’s Annual Meeting is the main forum where the shareholders exercise their rights to decide on the Company’s affairs and receive direct feedback from Board members. A number of Directors and Board Committee members normally attend the meeting to share insights pertaining to the operations, performance, strategies and perspectives of the Group and to answer any question relevant to the Company’s affairs. Shareholders are encouraged to attend the meeting as it is an opportunity for them to glean valuable information as well as raise and discuss any matter relevant to the Company and its performance. The external auditors are also present at the meeting.
Besides the Annual Meeting, shareholders are informed in a timely manner of any relevant information concerning the Company and the Group such that they are able to take decisions in full awareness of their implications. These communications are made either by announcements in the press, the publication of quarterly interim Abridged Group Financial Statements and disclosures in the Annual Report.
Furthermore, the Chief Executive Officer and the Group Finance Manager often meet institutional investors, financial analysts and fund managers upon request to discuss the state of affairs of the Group.
SHAREHOLDERS’ CALENDAR OF EVENTS
Further to the financial year-end in June, the calendar of key events is as follows:
• September : Publication of audited abridged group year-end results to June 30
• November : Publication of unaudited abridged group first quarter’s results to September 30
• December : Annual Meeting of shareholders• February : Publication of unaudited abridged group half-year’s results
to December 31• April/May : Publication of unaudited abridged group third quarter’s
results to March 31 Declaration of dividend
• June : Payment of dividend
COMPANY’S CONSTITUTION
The shareholders adopted a new Constitution in 2004 which complies with the provisions of The Companies Act 2001 and those of the Listing Rules of the Stock Exchange of Mauritius Ltd.
Its salient features are as follows:• the Company has full capacity to carry on and/or undertake any
business activity;• the Company has full rights, powers and privileges;• the Company may acquire and hold its own shares;• fully paid up shares are transferable without restriction;
• the quorum for a meeting of shareholders is 6 shareholders present or represented and holding at least 35% of the share capital of the Company;
• the Board of Directors shall consist of not less than 7 or not more than 15 Directors;
• the quorum for a Board meeting is 4 Directors when the Board consists of 7 members and 5 Directors when the Board consists of more than 7 members;
• the Chairman has a casting vote in case of equality of votes at either a Board meeting or a shareholders’ meeting;
• the Directors have the power to appoint any person to be a Director, either to fill a casual vacancy or as an addition to the existing Directors but so that the total number of Directors does not at any time exceed the number fixed by the Constitution. Any Director so appointed shall hold office only until the next following Annual Meeting of shareholders and shall then be eligible for re-election;
• a Director is not required to hold shares in the Company;• the Company may indemnify and/or insure any Director or employee
of the Company or a related corporation.
BOARD OF DIRECTORS
The Board of Directors as a whole is responsible for the stewardship of the Group and is ultimately accountable for the affairs and overall performance of the Group. As such, the Board is committed to uphold the highest standard of integrity, accountability and transparency in the governance of the Group. Its primary role is to protect and enhance shareholders’ interests and maximise long-term value creation by ensuring that proper systems and controls are in place to safeguard the Group’s assets and good reputation. Referring to recommendations made by management, the Board identifies key risk areas and endorses the strategic directions to be pursued, approves the Company’s investments, operating and capital expenditure budgets, monitors the implementation of strategies whilst maintaining an effective corporate governance framework. In so doing, the Board may delegate certain duties to Board Committees and to management.
The Directors perform their duties and exercise their powers to the extent permitted by law. They have the right to seek independent professional advice at the expense of the Company to enable them to discharge their responsibilities effectively.
The roles of the Chairman and of the Chief Executive Officer are clearly separated. The Chairman has no executive or management responsibilities and his main role is to lead and monitor effectively the work of the Board of Directors, to encourage active participation of Directors, to ensure smooth and timely flow of information to management and shareholders and to ensure the accurate documentation of proceedings. He is elected by the members of the Board and also acts as Chairman at shareholders’ meetings. The Chief Executive Officer is responsible for the day-to-day management of the Group, preparing and recommending business development plans and budgets to the Board in line with the Group’s long-term strategy and vision, making and implementing operational decisions, promoting the Group’s business, achieving the Group’s financial and operating goals and objectives and ensuring an effective management team.
All Directors, whether executive, non-executive or independent non-executive are bound by fiduciary duties. They have both a legal and
moral duty to act independently, in good faith, with due care and skill, and without fetter or instruction. A Directors’ Charter duly endorsed by the Board during the year enables the Directors to better perform their duties and ensure that their contribution is fully effective and meets the standards expected from them in terms of independence, ethics and integrity. Non-executive and independent Directors perform their duties intermittently and have less regular access to the Company’s books and records than executive Directors do but they play a particularly vital role in providing independent judgement in all circumstances. They are individuals of calibre and credibility and have the necessary skills and experience to constructively bring judgement, independent of management, on issues of strategy, performance evaluation, resources, transformation, equal opportunities and standards of conduct. Executive Directors on the other hand, manage the conflict between their management responsibilities and their fiduciary duties in the best interests of the Company.
COMPANY SECRETARY
All Directors have access to the advice and services of the Company Secretary who is responsible for ensuring that Board procedures are followed and for providing guidance and proper induction to Directors concerning their duties, responsibilities and powers.
The Company Secretary administers, attends and prepares minutes of all Board and shareholders’ meetings. She assists the Chairman in ensuring that Board procedures are followed and that the Company’s Constitution and relevant rules and regulations are complied with and in implementing and strengthening good governance and ethical practices and processes within the Group with a view to enhance long-term shareholders’ value.
BOARD COMPOSITION
The Company’s Constitution stipulates that the Board shall consist of a minimum of 7 and a maximum of 15 Directors.
The Company is currently headed by a unitary Board of 11 Directors comprising 6 Non-Executive Directors, 3 Independent Non-Executive Directors and 2 Executive Directors who are the Chief Executive Officer and the Group Finance Manager. On September 24, 2015, the Group Finance Manager, Mr Christophe Quevauvilliers was appointed as Executive Director to the Board of the Company, with effect from October 1, 2015, upon the recommendation from the Corporate Governance Committee, in order to comply with the recommendation of the Code of Corporate Governance to have at least two executive Directors appointed to the Board.
The Directors bring a wide range of experience and skills to the Board and ensure that their other responsibilities do not interfere with their responsibilities as Director of the Company.
APPOINTMENT AND RE-ELECTION OF DIRECTORS
According to the Company’s Constitution, the Board has the power to appoint any person to be a Director, either to fill a casual vacancy or as an addition to the existing Directors but so that the total number of Directors at any time does not exceed the number fixed by the
Constitution. Any Director so appointed shall hold office only until the next following Annual Meeting of shareholders and shall then be eligible for re-election.
New Directors appointed to the Board are familiarised with the Company’s operations, its business environment and senior management. They are also made aware of their fiduciary duties and responsibilities. A suitable induction of Directors contributes to ensure that the Company maintains a well-informed and competent Board and enables any new Director to make the maximum contribution as quickly as possible. In addition to this, all Directors are invited to enrol onto the Directors Development Programme (DDP) of the Mauritius Institute of Directors (MIoD) which provides a complete range of training relevant to the role and responsibilities of Board members.
During the year ended June 30, 2016, Mr Christophe Quevauvilliers was appointed as Director to the Board and, at the last Annual Meeting of shareholders held on December 17, 2015, he was duly elected to continue to hold office until the next Annual Meeting of shareholders of the Company in accordance with Clause 23.5(a) of the Company’s Constitution. On April 29, 2016, Mr Jean Michel Giraud resigned as Director to the Board, with immediate effect.
In accordance with Section 138(6) of the Companies Act 2001, two separate resolutions will be submitted at the forthcoming Annual Meeting of shareholders of the Company for the re-election of Messrs E. Jean Mamet and Jean Claude Maingard, aged 70 and above, to continue to hold office as Directors of the Company until the next Annual Meeting of shareholders.
The Corporate Governance Committee, in its role as Nomination Committee, is responsible for the review of the composition of the Board of Directors and Board Committees and to make recommendations to the Board for the re-election of Directors and for the approval of candidates to fill any vacancy arising on the Board and on Board Committees or as an addition to the existing Directors.
The Company’s Constitution does not provide for the rotation of Directors. The Code of Corporate Governance provides that each Director should be elected or re-elected every year at the Annual Meeting of shareholders.
Although being of the opinion that the holding of office by Directors relies on their experience and knowledge of the Group’s activities to ensure that they exercise the appropriate degree of leadership, skill and judgement required to achieve a sustainable performance over the years, the Corporate Governance Committee has decided to comply with the Code and to include the re-election of all Directors at the agenda of the Annual Meeting of shareholders of the Company. In addition, the Board is continuously encouraging its members to acquire new skills.
DIRECTORS’ PROFILES
Please refer to Directors’ Profiles on pages 10 and 11 for an update of their profiles.
CORPORATE GOVERNANCE REPORT (CONT’D)

35
UB
P A
NN
UA
L R
EP
OR
T 2
016
34
UB
P A
NN
UA
L R
EP
OR
T 2
016
DIRECTORS’ DIRECTORSHIPS
AL BLL BMHL IBLL IGF LUX MEI PBLDirectorsMarc Freismuth
Laurent de la Hogue Arnaud Lagesse * * Stéphane Lagesse Thierry Lagesse E. Jean Mamet
* Chairman
Abbreviations:
The other Directors of the Company did not have any directorships in companies listed on the Official Market of the Stock Exchange of Mauritius Ltd at June 30, 2016.
DIRECTORS’ AND SENIOR OFFICERS’ INTERESTS AND DEALINGS IN SHARES
The Directors’ and Senior Officers’ interests in the ordinary shares of the Company are set out in the table on page 49 of Other Statutory Disclosures.
On June 23, 2016, the Share Dealing Policy of the Company was endorsed by the Board. This document sets out the Group’s policy in respect of dealings in the shares of the Group’s company/companies by Directors, designated employees and their associates. The purpose of the policy is to provide clear guidance on the practice to be followed when dealing in the shares of the Group’s company/companies, connected by business or common shareholding, to avoid any beneficial misuse of price-sensitive information.
The Directors of the Company use their best endeavours to abide to the principles set out in the Share Dealing Policy of the Company and in the Model Code on Securities Transactions by Directors as stipulated in Appendix 6 of the Listing Rules of the Stock Exchange of Mauritius Ltd. All newly appointed Directors are required to notify the Company Secretary in writing about their direct and indirect holdings in the shares of the Company although, as per the Company’s Constitution, a Director is not required to hold shares in the Company. Subsequently, any Director willing to deal in the shares of the Company should notify the Chairman of the Board and obtain a written acknowledgement before proceeding further.
The Directors and Senior Officers of the Company are prohibited from dealing in the shares of the Company for a period of one month preceding the publication of the Company’s quarterly and yearly financial statements and prior to the announcement of a dividend payment or other distribution and more generally, at any time when in possession of unpublished price-sensitive information relevant to the Company.
During the year under review, Mr Francis Koenig (Senior Officer) acquired 2,000 shares in the Company whereas the interests of Messrs Arnaud Lagesse, Stéphane Lagesse and Thierry Lagesse were increased as shown in the table on page 49 of Other Statutory Disclosures, further to the distribution of a dividend in specie by The Bee Equity Partners Ltd (formerly known as Forward Investment and Development Enterprises Limited). Except for the aforesaid transactions, none of the Directors and Senior Officers dealt in the shares of the Company, either directly or indirectly.
Furthermore, pursuant to the provisions of The Securities Act 2005, the Company is registered as a reporting issuer with the Financial Services Commission (FSC) since 2008 and its insiders are identified according to the definitions within the Act. All insiders and their associates are required to disclose their interest in the shares of the Company and in those of the associates of the Company. Any movement thereon is being recorded and notified to the Commission as and when they occur. In addition, the abridged group quarterly financial statements and the audited financial statements for the year are sent to the Commission in accordance with Section 88 of the Act.
DIRECTORS’ AND SENIOR OFFICERS’ INSURANCE AND INDEMNIFICATION
The Directors and the Secretary of the Company benefit from an indemnity insurance cover for liabilities incurred while performing their duties, to the extent permitted by law.
BOARD EVALUATION
At the initiative of the Corporate Governance Committee, a Board evaluation, in the form of a questionnaire inspired from the MIoD model and covering all the aspects of the Board’s function, was carried out in 2014. All the members of the Board were consulted and the results duly compiled were communicated to enable the Board to take appropriate actions to improve its effectiveness and its functioning.
In accordance with the Code of Corporate Governance and in view of further improving the effectiveness and functioning of the Board, an evaluation exercise was initiated in September 2016.
BOARD MEETINGS
The Chairman and the Chief Executive Officer, assisted by the Company Secretary, are responsible for fixing the agenda and the date for each Board meeting. Certain matters are considered at all Board meetings such as the latest available management accounts, business and operations updates and where applicable, reports from the Corporate Governance Committee, the Audit Committee and the Risk Monitoring Committee. In addition to standing agenda items, there may be discussions on some specific topics related to the Company’s business or strategy. The Board promotes open discussions and constructive debates during meetings. Special meetings may also be called from time to time as required. The minutes of proceedings of each Board meeting are recorded and entered in the Minutes Book by the Company Secretary and are submitted for approval at each following meeting of the Board.
The quorum for Board meetings is 4 Directors when the Board consists of 7 members and 5 Directors when the Board consists of more than 7 members. In case of equality of votes, the Chairman has a casting vote.
Directors are expected to spend the time and effort necessary for them to properly discharge their responsibilities. Accordingly, they are expected to regularly prepare for and attend meetings of the Board and all Committees on which they sit with the understanding that, on occasion, they may be unable to attend a meeting. The attendance record for the year under review is as shown on page 39.
The Board met seven times this year to examine, consider, discuss or approve, amongst other items:• the activity reports of the Chief Executive Officer;• the appeals and court cases relevant to our plant at Geoffroy Road;• the review of our operational strategy and a potential partnership in
Sri Lanka;• the production and sale of fillers;• the risk management framework for the Group;• the internal audit reports;• the capital restructuring of Compagnie de Gros Cailloux Limitée;
• the proposed capital restructuring of UBP Madagascar;• the investment in a Zambian company manufacturing clay bricks;• the review of the remuneration of Directors and members of Board
Committees;• the appointment of an Executive Director;• the appointment of a new Company Secretary;• the compliance audit report;• the proposal for leasing facilities;• the audited group financial statements, the audited abridged group
financial statements and the Annual Report for year ended June 30, 2015;
• the remuneration of external auditors;• the abridged group financial statements for the quarters to September
30, 2015, December 31, 2015 and March 31, 2016;• the setting up of a Risk Monitoring Committee and the nomination of
a Risk Officer;• the new Code of Ethics for the Group;• the new Director’s Charter;• the recommendations of the Corporate Governance Committee and of
the Audit Committee;• the approval of short term banking facilities;• the Board meetings calendar for 2016;• the impact of a distribution of dividend in specie by The Bee Equity
Partners Ltd (formerly known as Forward Investment and Development Enterprises Limited);
• the closure of one of the Company’s associates;• the results forecasts to June 30, 2016;• the declaration of a dividend; • the operating and capital expenditure budgets for the financial year
2016–2017; and• the bid for a potential investment opportunity within the Group.
Decisions were also taken by way of resolutions in writing, signed by all the Directors.
BOARD COMMITTEES
In order to fulfil its obligations and duties, the Board delegates certain duties and responsibilities to Board Committees to ensure a more comprehensive evaluation of specific matters. This delegation does not however reduce the overall responsibilities of the Board.
In line with the requirements of the Code, the Corporate Governance Committee and the Audit Committee were set up in 2005 with clearly defined terms of reference. In November 2015, a Risk Monitoring Committee was also constituted to focus on risks within the Group. These Board Committees report regularly to the Board on their activities and make recommendations thereof for its approval.
The Board Committees are authorised to obtain, at the Company’s expense, professional advice both within and outside the Company in order for them to perform their duties.
The minutes of each Board Committee meeting are submitted for consideration and approval at the following meeting and are accessible to all members of the Board of Directors.
CORPORATE GOVERNANCE REPORT (CONT’D)
AL – Alteo LimitedBLL – BlueLife Limited BMHL – Belle Mare Holding LtdIBLL – IBL Ltd
IGF – Ipro Growth Fund LtdLUX – LUX* Island Resorts LtdMEI – Mauritian Eagle Insurance LtdPBL – Phoenix Beverages Limited
The directorships of the Directors of the Company in other companies listed on the Official Market of the Stock Exchange of Mauritius Ltd at June 30, 2016 were as follows:

37
UB
P A
NN
UA
L R
EP
OR
T 2
016
36
UB
P A
NN
UA
L R
EP
OR
T 2
016
CORPORATE GOVERNANCE COMMITTEE
The composition of the Corporate Governance Committee is as follows:
Chairman : Joël Harel Members : Marc Freismuth Thierry Lagesse
As per the Code’s aspiration, the Corporate Governance Committee is chaired by an Independent Non-Executive Director whilst the members are Non-Executive Directors.
The mandate of the Corporate Governance Committee is to devise the policy on Corporate Governance in accordance with the principles of the Code, to advise and make recommendations to the Board of Directors on all aspects of Corporate Governance and to report to shareholders on compliance with the provisions of the Code.
The Corporate Governance Committee is also responsible for Nomination and Remuneration aspects of the Code and its functions are as follows:• In its role as Nomination Committee, it reviews the structure, size and
composition of the Board, it ensures the right balance of independence, skills and expertise on the Board, it assesses and evaluates the role and independence of each current and potential Director and makes recommendations to the Board for the election and re-election of Directors and for matters relevant to succession planning.
• In its role as Remuneration Committee, its terms of reference include inter alia the development of the Group’s general policy on executive and senior management remuneration including the definition of performance measurement criteria and specific remuneration packages for Executive Directors and senior management and the making of recommendations to the Board on all aspects of remuneration.
In accordance with the Code, the Committee considers an Independent Director as one who:• is not a representative or member of the immediate family of a
shareholder who has the ability to control or significantly influence the Board or management;
• has not been employed by the Company or the group of which the Company currently forms part in any executive capacity for the preceding three financial years;
• is not a professional advisor to the Company or the group of which the Company currently forms part other than in a Director capacity;
• is not a significant supplier to, debtor or creditor of, or customer of the Company or the group of which the Company currently forms part, or does not have a significant influence in any group related company in any one of the above roles;
• has no significant contractual relationship with the Company or the group of which the Company currently forms part;
• is free from any business or other relationship which could be seen to materially impede the individual’s capacity to act in an independent manner.
The Committee met eight times during the financial year 2015-2016 to:• determine, discuss and approve the remuneration of the Chief Executive
Officer, Senior Officers, Directors, Committee members and the staff in general;
• examine and take decisions on corporate governance compliance issues;• consider and recommend to the Board for approval the new Code of
Ethics and a Directors’ Charter;
• consider the Board’s Charter;• recommend to the Board the nomination of an Executive Director and
the appointment of a new Company Secretary;• receive the resignation of a Director and consider his replacement on
the Board of several companies within the Group;• consider the enforceability of the Corporate Governance Charter and
the Directors’ Charter; • consider a review of the bonus scheme for Senior Officers;• determine the retirement benefits policy for managers with long term
service;• follow-up a claim made for constructive dismissal by an ex Senior
Officer of the Company; • approve and monitor the recruitment of a General Manager for one
of the subsidiaries, a Group Human Resources Manager and a Group Business Development Manager with focus on the international development;
• consider and recommend to the Board for approval a Share Dealing Policy; and
• consider the key issues applicable to the Company and to the Group under the new Code of Corporate Governance.
The Corporate Governance Committee confirms that it has assumed its responsibilities in accordance with its terms of reference for the year under review.
The attendance record for the year under review is as shown on page 39. A quorum of two members is currently required for a Corporate Governance Committee meeting. The two Executive Directors are in attendance at almost all meetings of the Committee.
The remuneration of the Chairman and of each member of the Corporate Governance Committee for the year ended June 30, 2016 amounted to Rs 100,000 ( 2015: Rs 30,000) and Rs 75,000 (2015: Rs 30,000) respectively.
AUDIT COMMITTEE
The composition of the Audit Committee is as follows:
Chairman : E. Jean MametMembers : François Boullé Joël Harel
As recommended by the Code, the Chairman of this Committee is an Independent Non-Executive Director similarly to the two members. The Board of Directors is of the view that the members of the Committee have sufficient financial management knowledge and experience to discharge their responsibilities properly.
The Audit Committee Charter was approved by the Board of Directors in May 2005. The main duty of the Committee is to ensure the integrity of accounting and financial reporting and to review internal control systems and procedures in order to assist the Board of Directors in carrying out its responsibilities. The Committee also monitors the role and scope of work of internal and external auditors, including the identification of any risk areas and the adequacy of risk management systems, and ensures compliance with legal and regulatory provisions. The Committee has the authority to conduct or authorise investigations into any matter within its scope of responsibilities and to engage any
firm of professionals it deems fit to provide independent expert advice. The Committee has full access to all management personnel and can call upon any member of management and staff or any member of the Board to attend its meetings.
The Committee met six times during the financial year 2015-2016, mainly to:• review and recommend to the Board for approval the audited group
financial statements, the Annual Report and the audited abridged group financial statements for year ended June 30, 2015;
• review and recommend to the Board for approval and publication the unaudited abridged group quarterly financial statements to September 30, 2015, December 31, 2015 and March 31, 2016;
• review the external audit Management Letters from Messrs Ernst & Young (EY) for 2015;
• to re-appoint and fix the remuneration of Messrs Ernst & Young as external auditors;
• review the internal audit report of Messrs BDO & Co. on our Land Reclamation Unit (LRU) quarrying operations;
• review the internal audit report of Messrs BDO & Co. on our retail operations;• follow-up remedial actions by management based on the
recommendations of internal and external auditors;• consider and approve the capital structuring of UBP Madagascar;• review the report on IT policies and procedures and the methodology
to ensure compliance thereto;• review the compliance audit report of Abax Corporate Services Ltd
which listed various acts and regulations to which the Company and the Group should abide;
• review the proposed internal audit plan of Messrs BDO & Co. for 2016-2019;• consider and recommend to the Board the setting up of a Risk
Monitoring Committee; and• consider a potential conflict of interest in reference to the appointment
of our external auditors.
In so doing, the Committee reviewed internal control systems and procedures in place at all the subsidiary companies within the Group.
The Audit Committee confirms that it has assumed its responsibilities in accordance with its terms of reference for the year under review.
The attendance record for the year under review is as shown on page 39. A quorum of two members is currently required for an Audit Committee meeting. The Group Finance Manager is in attendance at all meetings of the Committee whilst the Chief Executive Officer, the internal and external auditors and some members of the management attend the meetings by invitation depending on the agenda.
The remuneration of the Chairman and of each member of the Audit Committee for the year ended June 30, 2016 amounted to Rs 150,000 (2015: Rs 150,000) and Rs 100,000 (2015: Rs 100,000) respectively.
RISK MONITORING COMMITTEE
The composition of the Risk Monitoring Committee is as follows:
Chairman : François BoulléMembers : E.Jean Mamet Christophe Quevauvilliers Stéphane Ulcoq
As recommended by the Code, the Risk Monitoring Committee is chaired by an Independent Non-Executive Director. Its members comprise of an additional Independent Non-Executive Director and two Executive Directors, namely the Chief Executive Officer and the Group Finance Manager, the latter also acting as the Risk Officer.
The role of the Risk Monitoring Committee is to assist the Board in the discharge of its duties relating to the setting up and monitoring of the risk governance process, including setting the risk appetite and monitoring relevant risk portfolios and management’s performance against such risk appetite. The Committee is mainly responsible for the approval of risk management policies for recommendation to the Board, the review and assessment of the integrity of risk control systems and the assurance that the risk policies and strategies are effectively managed. The Committee shall also provide to the Board an independent and objective oversight of the financial, business and strategic risks of the Company and of the Group.
The key duties of the Risk Monitoring Committee include the monitoring of the Group’s risk portfolios against the risk appetite set by the Board, the review of the adequacy, implementation and overall effectiveness of the Group’s risk function including management and both internal and external auditors, the assessment of legal matters that could have a significant impact on the Group’s operations and the review of internal and external auditors’ reports on significant exposures to risk.
The Committee is also responsible for the review of key risks such as industry risks, operational risks, technology risks, country risks and financial risks. Operational risks include human resources risks, fraud risks, physical risks, business continuity risks and reputational risks.
The Committee has access to all relevant information it requires to fulfil its responsibilities and is authorized to seek professional advice, both inside and outside the Company, as considered necessary to perform its duties.
The Committee met once since its inception in November 2015, mainly to:• consider and approve its mandate;• consider the Group’s risk assessment and review; and• consider the report of Messrs BDO & Co. on the Group’s ‘Enterprise
Risk Management’ and ‘Business Continuity Plan’ exercise.
The attendance record for the year under review is as shown on page 39. A quorum of three members is currently required for a Committee meeting.
The remuneration of the Chairman and of each member of the Committee for the year ended June 30, 2016 amounted to Rs 75,000 (2015: N/A) and Rs 50,000 (2015: N/A) respectively.
INTERNAL AUDIT FUNCTION
The internal audit function is responsible for providing independent, objective assurance to the Board regarding the implementation, operation and effectiveness of internal control systems and risk management. The objective is to ascertain the extent of compliance to procedures, policies, regulations and legislation, to facilitate proper risk management practices and to recommend improvements in control, performance and productivity within the Group.
CORPORATE GOVERNANCE REPORT (CONT’D)

39
UB
P A
NN
UA
L R
EP
OR
T 2
016
38
UB
P A
NN
UA
L R
EP
OR
T 2
016
INTERNAL AUDIT FUNCTION (CONT’D)
Up to December 2014, the internal audit function was carried out internally by a member of our staff who had access to all the Company’s records, systems and personnel and who maintained an open and constructive communication line with the management and the Audit Committee. In so doing, the internal auditor carried out regular visits to all our operational sites to ensure the controls and procedures are adhered to and to improve processes where necessary in order to minimise risks. His findings were classified in terms of risk level and his recommendations were discussed and commented by management. In April 2015, Messrs BDO & Co. were engaged to assume the internal audit function within the Group. The internal audit plan, as approved by the Audit Committee, sets out the extent of coverage attributable to each business process cycle within the organisation depending on the degree of risk. The methodology used is based on the selection of specific business cycles, the identification of inherent risks, the verification of key controls in place in view of eliminating or reducing the risks to an acceptable level, the verification of the said controls to ensure they are operating satisfactorily, the performance of walkthrough tests on procedures and processes and the formulation of necessary recommendations.
This year again, no material financial problems were identified which would affect materially the figures reported in the financial statements. The recommendations are being implemented gradually by management under the close follow-up of our internal auditors.
In June 2016, further to recommendations from the Audit Committee, the Board of Directors has reiterated its intention to have our own internal audit team to ensure a more extensive coverage of all business process cycles and better assess the effectiveness of recommended procedures and controls within the Group.
INTERNAL CONTROL AND RISK MANAGEMENT
The Board of Directors recognises effective risk management as a core competency and is ultimately responsible for the setting up and monitoring of the risk governance process, including setting the risk appetite, and the adequacy and effectiveness of the internal control system which is designed to manage the risk of failure to achieve business objectives. To this end, the Board of Directors approved the designation of Messrs BDO & Co. to implement an Enterprise Risk Management framework and a Business Continuity Management plan within the Group with a view to fully identify, measure, assess and mitigate our exposure to risks. This mission shall enable the Group to manage risks in an efficient and effective manner, in line with ISO 31000/2009.
The Group promotes a risk culture, whereby the related set of objectives, policies and practices are shared across the organisation. The management is responsible for the implementation of internal control and risk management systems under the supervision of the Risk Monitoring Committee to ensure their effectiveness. Such systems must ensure that proper accounting records are maintained and that the strategies and policies adopted by the Board are being implemented. The Board relies on the internal and external audit functions to report on any weaknesses and to make recommendations via the Audit Committee and as relevant, to the Risk Monitoring Committee, the objective being to ensure the
effective and efficient use of available resources and ascertaining the accuracy of information used in the preparation of financial statements.At the time of writing, the formulation of a group-wide risk management framework is almost completed further to interactive working sessions held with the Board of Directors and senior management. The risk registers have been completed with relevant inherent and residual likelihood and impact ratings attributed to each of the 350 identified risks and depending on the effectiveness of existing controls. The next step will be to design appropriate risk treatment plans for those risks which fall beyond the risk tolerance limit defined by the Board of Directors via the risk appetite statement and thereafter to monitor the risk management process continuously. As regards the Business Continuity Management plan, the mission is in progress.
Further to the above exercise, the key risks categories relevant to the Group at this stage are as follows:• Operational risks: risks defined as risks of loss resulting from
inadequate or failed internal processes and procedures, human error or system failure or from external events. They include all processes and sub processes from the time the raw materials are extracted and the manufacturing process up to the point of receipt by the customer;
• Legal and regulatory risks: risks linked to the legislations and regulations surrounding the operations and functioning of the Group e.g. competition laws, the Employment Rights Act, health and safety regulations and the Code of Corporate Governance;
• Financial risks: risks linked to liquidity, interest rates, foreign currency exchange rates, capital structure and profitability;
• People risks: risks associated with recruitment and retirement, on-going talent management and succession planning, relations with trade unions and regulatory bodies and staff disciplinary issues;
• Marketing and customer risks: risks associated with maintaining the quality and reputation of our branded products and innovation in our offer to customers;
• Technology risks: risks that hardwares and softwares are not operating as intended thereby compromising the integrity and reliability of data and information and exposing significant assets to potential loss or misuse or exposing the Group’s ability to maintain a high standard in its main business processes. They include all IT and telephony systems and the use of latest technologically-prone equipments;
• Health and safety risks: risks associated with all events that can cause serious injury and harm to the Group’s workforce and customers;
• Business environment and market risks: risks relating to macro-economic evolution, politics, foreign investments and climatic conditions that are outside our control; and
• Strategic risks: risks associated with uncertainties and opportunities embedded in the Group’s strategic plan and the manner in which they are executed.
The Risk Monitoring Committee and the Audit Committee via the internal audit function ensure that the significant risks above are managed and kept at an acceptable level. In addition, risks are managed as follows;• our sales, marketing and operations staff follow closely the actions of
our existing or potential competitors;• our core business production is scheduled as per an adequate planning
to avoid any disruption in production whilst our plant and machinery are regularly serviced by our workshop to avoid any breakdown;
• the quality of our core business products are tested daily in our laboratory to ensure that they are of the required standard whilst the majority of our plant and machinery are of latest technology;
• our customer service staff are regularly trained and provided with best logistics to better serve our customers;
• the supply of our core business raw materials is partly ensured by our own quarrying services to avoid any threat from outside suppliers although we maintain very good relationships with them. In addition, we own several acres of land at Gros Cailloux and St Julien to ensure our own supplies;
• our internal auditors do regular testing aimed at detecting any potential weaknesses in our internal control systems and any likely risk of fraud and preventing same to recur through new procedures and controls;
• our HR function manages human resources risks via proper and adequate recruitment, training, coaching, job reviews, performance evaluation and succession planning;
• our health and safety function ensures that all necessary measures are taken to protect our employees and the environment;
• our assets are insured against fire and allied perils and other all risks insurance cover as relevant to the type of asset whilst our offices and operational sites are all equipped with fire extinguishers and security systems;
• our IT function ensures that latest technologies are used for our tailor-made ERP, that our systems are secured by latest versions of antivirus, that a complex password policy is in place, that daily back-ups are kept, that our database is secured via a disaster recovery plan and that our communication networks are duplicated; and
• our operational managers follow closely the political events in Madagascar and Sri Lanka to avoid any risk of business failure.
For financial risks management, please refer to note 4 of the Notes to the Financial Statements on pages 79 to 83.
MEETINGS ATTENDANCE
BoardCorporate
Governance Committee
Audit Committee
Risk Monitoring Committee
Annual Meeting of
Shareholders
Marc Freismuth 7 out of 7 8 out of 8 1 out of 1
François Boullé 5 out of 7 4 out of 6 1 out of 1 1 out of 1
Jean Michel Giraud*
4 out of 7 1 out of 1
Joël Harel 6 out of 7 8 out of 8 5 out of 6 0 out of 1
Laurent de la Hogue
7 out of 7 1 out of 1
Arnaud Lagesse 2 out of 7 0 out of 1
Stéphane Lagesse
4 out of 7 1 out of 1
Thierry Lagesse 6 out of 7 8 out of 8 1 out of 1
Jean Claude Maingard
6 out of 7 1 out of 1
E. Jean Mamet 6 out of 7 5 out of 6 1 out of 1 1 out of 1
Christophe Quevauvilliers**
6 out of 7 1 out of 1 1 out of 1
Stéphane Ulcoq 7 out of 7 1 out of 1 1 out of 1
* On April 29, 2016, Mr Jean Michel Giraud resigned as Director to the Board, with
immediate effect.
** On September 24, 2015, Mr Christophe Quevauvilliers was appointed Director to the
Board, with effect from October 1, 2015.
MANAGEMENT AGREEMENT
There is no management agreement between any third party and the Company or its subsidiaries. However, the Company itself has management agreements with subsidiaries and associates within the Group.
REMUNERATION PHILOSOPHY STATEMENT
The Corporate Governance Committee in its role as Remuneration Committee is responsible for making recommendations to the Board with regard to the definition and development of the Group’s general remuneration policy, including determining performance measurement criteria and specific remuneration packages for executive Directors and senior management and the level of remuneration of non-executive Directors, taking into consideration the market trend and the Group’s performance.
Our current remuneration policy is due to be reviewed in an aim to favour greater alignment between remuneration and performance objectives. This exercise should enable the Company to assess the competencies of all staff in view of identifying any training need and hence elaborate an effective rewarding system to motivate, retain and attract best employees capable of achieving set objectives.
Please refer to Other Statutory Disclosures on page 48 for a table of total emoluments and benefits received by Directors from the Company and subsidiary companies. Although acknowledging that the Code requires that the remuneration received by Directors should be disclosed on an individual basis, the Corporate Governance Committee, in its role as Remuneration Committee, has recommended that the remuneration be disclosed by category of Directors only in view of the confidentiality and sensitivity of this information.
The current remuneration package of the Chief Executive Officer comprises a basic salary, an annual performance bonus and other benefits in kind. The proportion of variable pay to fixed pay is significant and aims at aligning the interests of the Chief Executive Officer to those of the Group.
INTEGRATED SUSTAINABILITY REPORTING
The Board embeds corporate responsibility as a core tenet of its activities and believes that it is in the long-term economic interest of the Company to conduct itself as a responsible corporate citizen, that is in a manner which is non-exploitative, non-discriminatory and respectful of human rights. In terms of ethics, the Company has during the year adopted its own Code of Ethics based on the core values of the Company which are namely: integrity, respect, citizenship, innovation, professionalism and excellence. The Code sets out the standard of conduct required by employees for both internal relations and external interactions. The Company strongly believes that it is essential that all its employees act
CORPORATE GOVERNANCE REPORT (CONT’D)

40
UB
P A
NN
UA
L R
EP
OR
T 2
016
INTEGRATED SUSTAINABILITY REPORTING (CONT’D)
with honesty, integrity and respect and extend the highest courtesy to colleagues, suppliers, visitors, customers and all other stakeholders, thereby nurturing long-lasting and transparent relationship and ensuring the good reputation of the Company. In terms of the environment, the Company is continuously making significant investments in appropriate equipment aimed at reducing dust emission from its production plants. Our largest plant at Geoffroy Road is the first eco-friendly plant of its kind in Mauritius. Furthermore, a few years ago the Company launched a concrete recycling project aimed at reducing the level of demolition waste dumping.
In terms of health and safety, the Company’s Health and Safety Officer performs regular risk assessments to ensure that all our production units are equipped to run in a safely manner thereby minimising the risk of causing damage to the environment and to the community within which it operates. As regards the health and safety of employees, regular training initiatives are undertaken to enhance the level of health and safety practices in the workplace and to help increase the awareness of employees on security and health issues by insisting on the use of protective clothing and accessories. Furthermore, all our workers undergo full health tests on a yearly basis to detect any illness and ensure appropriate remedial and preventive treatments.
In terms of social responsibility, our policies and practices are as detailed in our Corporate Social Responsibility report on page 43.
DONATIONS
Please refer to Other Statutory Disclosures on page 50 for details of donations made during the year.
EMPLOYEE SHARE OPTION PLAN
The Company has no employee share option plan.
PROVISION FOR PENSION BENEFITS
Please refer to note 21 of the Notes to the Financial Statements on pages 101 to 104 for details of total provisions booked or otherwise recognised by the Company and the Group for the payment of pension benefits.
RELATED PARTY TRANSACTIONS
Please refer to note 29 of the Notes to the Financial Statements on page 107 for details on related party transactions.
Bhooneshi NemchandCompany Secretary
September 27, 2016
CORPORATE GOVERNANCE REPORT (CONT’D)
41
UB
P A
NN
UA
L R
EP
OR
T 2
016

43
UB
P A
NN
UA
L R
EP
OR
T 2
016
OUR ENGAGEMENT
Our CSR programme reflects our engagement to make our country a better place to live in while creating value for our customers, partners and society at large as well as preserving the environment.
As responsible citizens, we at UBP Group are committed to go even further in our mission by engaging our expertise, our resources and our time for the cause of our beneficiaries to ensure a more sustainable improvement in the quality of life of the society at large.
We are proud to state that all the challenges, targets and progress plans for our various fields of intervention were achieved successfully during the year 2015-2016.
OUR CSR COMMITTEE
Our active involvement on the field has led us to assess and review our CSR structure for a better implementation of our CSR policy. In so doing, a CSR Committee was set up in November 2015 to manage our projects, bringing on board ten staff members in line with our corporate culture.
The creation of a committee has enabled us to better convey our CSR policy and to better assess the implication and impact of our projects. The committee also enables employees to volunteer in CSR projects and to engage themselves towards social causes. The committee meets quarterly to discuss about progress of works, the needs of beneficiaries, actions to be taken and new projects.
OUR FOCUS
Our focus this year was directed towards: Education & Training, the Welfare of Vulnerable Persons, Sports and the Environment. Under these four clusters, we were active in poverty alleviation, child welfare, youth development and the preservation of the environment.
CORPORATE SOCIALRESPONSIBILITY REPORT
• Budget : 2.6M • Continue our efforts in social
projects • Support long term collaboration
which demonstrate good results
• Be present in regions where we are in operation
• Increase number of employees to volunteer in our projects
OBJECTIVES• Education & Training • Welfare of Vulnerable Persons• Sports • Environment
AREAS OF INTERVENTION• 15 CSR projects• Employees volunteered in projects• More than 500 persons beneficiated directly from our actions• A new CSR Committee• Better CSR policy conveyence• Own project set up in collaboration with ABAX, AfrAsia & Fondation Joseph Lagesse
ACHIEVEMENTS
51%Welfare of Vulnerable Persons
12%
3%
19%
15%Education & TrainingEnvironment
Sports
‘Coup de Cœur’Project
OUR DASHBOARD
OUR DASHBOARD
42
UB
P A
NN
UA
L R
EP
OR
T 2
016
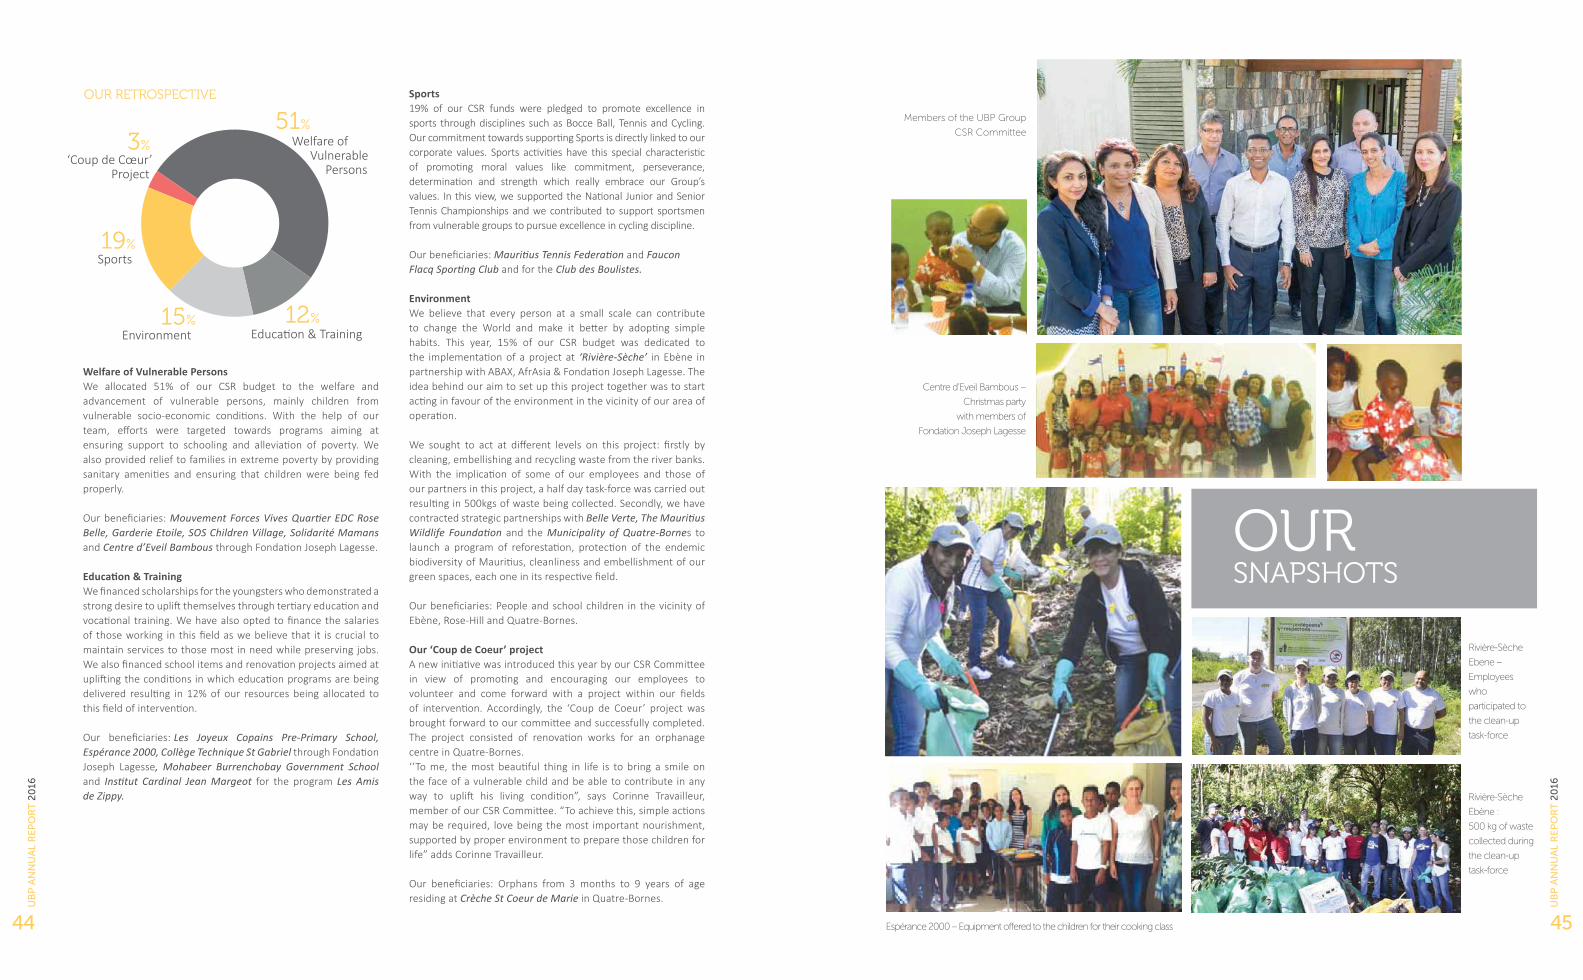
45
UB
P A
NN
UA
L R
EP
OR
T 2
016
44
UB
P A
NN
UA
L R
EP
OR
T 2
016
Welfare of Vulnerable PersonsWe allocated 51% of our CSR budget to the welfare and advancement of vulnerable persons, mainly children from vulnerable socio-economic conditions. With the help of our team, efforts were targeted towards programs aiming at ensuring support to schooling and alleviation of poverty. We also provided relief to families in extreme poverty by providing sanitary amenities and ensuring that children were being fed properly.
Our beneficiaries: Mouvement Forces Vives Quartier EDC Rose Belle, Garderie Etoile, SOS Children Village, Solidarité Mamans and Centre d’Eveil Bambous through Fondation Joseph Lagesse.
Education & TrainingWe financed scholarships for the youngsters who demonstrated a strong desire to uplift themselves through tertiary education and vocational training. We have also opted to finance the salaries of those working in this field as we believe that it is crucial to maintain services to those most in need while preserving jobs. We also financed school items and renovation projects aimed at uplifting the conditions in which education programs are being delivered resulting in 12% of our resources being allocated to this field of intervention.
Our beneficiaries: Les Joyeux Copains Pre-Primary School, Espérance 2000, Collège Technique St Gabriel through Fondation Joseph Lagesse, Mohabeer Burrenchobay Government School and Institut Cardinal Jean Margeot for the program Les Amis de Zippy.
Sports19% of our CSR funds were pledged to promote excellence in sports through disciplines such as Bocce Ball, Tennis and Cycling. Our commitment towards supporting Sports is directly linked to our corporate values. Sports activities have this special characteristic of promoting moral values like commitment, perseverance, determination and strength which really embrace our Group’s values. In this view, we supported the National Junior and Senior Tennis Championships and we contributed to support sportsmen from vulnerable groups to pursue excellence in cycling discipline.
Our beneficiaries: Mauritius Tennis Federation and Faucon Flacq Sporting Club and for the Club des Boulistes.
EnvironmentWe believe that every person at a small scale can contribute to change the World and make it better by adopting simple habits. This year, 15% of our CSR budget was dedicated to the implementation of a project at ‘Rivière-Sèche’ in Ebène in partnership with ABAX, AfrAsia & Fondation Joseph Lagesse. The idea behind our aim to set up this project together was to start acting in favour of the environment in the vicinity of our area of operation.
We sought to act at different levels on this project: firstly by cleaning, embellishing and recycling waste from the river banks. With the implication of some of our employees and those of our partners in this project, a half day task-force was carried out resulting in 500kgs of waste being collected. Secondly, we have contracted strategic partnerships with Belle Verte, The Mauritius Wildlife Foundation and the Municipality of Quatre-Bornes to launch a program of reforestation, protection of the endemic biodiversity of Mauritius, cleanliness and embellishment of our green spaces, each one in its respective field.
Our beneficiaries: People and school children in the vicinity of Ebène, Rose-Hill and Quatre-Bornes.
Our ‘Coup de Coeur’ projectA new initiative was introduced this year by our CSR Committee in view of promoting and encouraging our employees to volunteer and come forward with a project within our fields of intervention. Accordingly, the ‘Coup de Coeur’ project was brought forward to our committee and successfully completed. The project consisted of renovation works for an orphanage centre in Quatre-Bornes.‘‘To me, the most beautiful thing in life is to bring a smile on the face of a vulnerable child and be able to contribute in any way to uplift his living condition”, says Corinne Travailleur, member of our CSR Committee. “To achieve this, simple actions may be required, love being the most important nourishment, supported by proper environment to prepare those children for life” adds Corinne Travailleur.
Our beneficiaries: Orphans from 3 months to 9 years of age residing at Crèche St Coeur de Marie in Quatre-Bornes.
Centre d’Eveil Bambous –
Christmas party
with members of
Fondation Joseph Lagesse
Rivière-Sèche
Ebène :
500 kg of waste
collected during
the clean-up
task-force
OUR SNAPSHOTS
Members of the UBP Group
CSR Committee
Espérance 2000 – Equipment offered to the children for their cooking class
Rivière-Sèche
Ebene –
Employees
who
participated to
the clean-up
task-force
• Budget : 2.6M • Continue our efforts in social
projects • Support long term collaboration
which demonstrate good results
• Be present in regions where we are in operation
• Increase number of employees to volunteer in our projects
OBJECTIVES• Education & Training • Welfare of Vulnerable Persons• Sports • Environment
AREAS OF INTERVENTION• 15 CSR projects• Employees volunteered in projects• More than 500 persons beneficiated directly from our actions• A new CSR Committee• Better CSR policy conveyence• Own project set up in collaboration with ABAX, AfrAsia & Fondation Joseph Lagesse
ACHIEVEMENTS
51%Welfare of Vulnerable Persons
12%
3%
19%
15%Education & TrainingEnvironment
Sports
‘Coup de Cœur’Project
OUR RETROSPECTIVE
47
UB
P A
NN
UA
L R
EP
OR
T 2
016
46
UB
P A
NN
UA
L R
EP
OR
T 2
016
STATEMENT OF DIRECTOR’S RESPONSIBILITIES
OTHER STATUTORY DISCLOSURES
in respect of the preparation of financial statements and internal control.
pursuant to section 221 of the companies act 2001
The Directors are responsible for the preparation of financial statements which give a true and fair view of the financial position, financial performance and cash flows of the Company. In so doing, they are required to:• select suitable accounting policies and apply them consistently;• make judgements and estimates that are reasonable and prudent;• comply with the provisions of the Companies Act 2001 and the
International Financial Reporting Standards (IFRS), and explain any material departure thereto;
• prepare the financial statements on a going concern basis unless it is inappropriate to presume that the Company will continue in business in the foreseeable future.
The Directors are also responsible for the proper maintenance of accounting records which disclose at any time and with reasonable accuracy, the financial position and performance of the Company. They are also responsible for maintaining an effective system of internal control and risk management, for safeguarding the assets of the Company and for taking all reasonable steps to prevent and detect fraud and other irregularities.
The Directors acknowledge that they have exercised their responsibilities as described above and confirm that they have complied with the above requirements in preparing the financial statements for the year ended June 30, 2016. They also acknowledge the responsibility of the external auditors to report on these financial statements and to express an opinion as to whether they are fairly presented.
The Directors confirm that they have established an internal audit function and report that proper accounting records have been maintained during the year ended June 30, 2016 and that nothing has come to their attention which could indicate any material breakdown in the functioning of internal control systems and have a material impact on the trading and financial position of the Company.
On behalf of the Board
Marc Freismuth Stéphane UlcoqChairman Chief Executive Officer
September 27, 2016
ACTIVITIES
The principal activity of the Group remains the manufacture and sale of building materials which consist mainly of our core products: aggregates, rocksand and hollow concrete blocks. Other products include precast concrete slabs, ready-to-use dry mortar, various concrete building components including paving-blocks and roof tiles, imported floor and wall tiles, sanitary ware and a complete range of home building and decorating products, fittings, tools and garden accessories. Services rendered consist mainly of engineering works by the Company’s workshop and contracting services.
The Group is also involved in sugar cane cultivation, the sale of agricultural products, landscaping services and leisure activities through one of its subsidiaries.
DIRECTORS
Members of the Board of Directors at June 30, 2016 were:
The Company Messrs: Marc Freismuth - Chairman François Boullé Joël Harel Laurent de la Hogue Arnaud Lagesse Stéphane Lagesse Thierry Lagesse Jean Claude Maingard E. Jean Mamet Christophe Quevauvilliers – Appointed on September 24,
2015, effective as from October 1, 2015. Stéphane Ulcoq
Mr Jean Michel Giraud resigned as Director to the Board on April 29, 2016. SUBSIDIARY COMPANIES
Espace Maison Ltée Messrs: Thierry Lagesse - Chairman François Boullé Marc Freismuth Joël Harel Laurent de la Hogue Stéphane Lagesse Jean Claude Maingard E. Jean Mamet Stéphane Ulcoq
Mr Jean Michel Giraud resigned as Director to the Board on April 29, 2016.
Compagnie de Gros Cailloux Limitée Messrs: Thierry Lagesse - Chairman François Boullé Christophe Quevauvilliers Stéphane Ulcoq
Mr Jean Michel Giraud resigned as Director to the Board on April 29, 2016.
Welcome Industries Ltd Messrs: Thierry Lagesse - Chairman Christophe Quevauvilliers Stéphane Ulcoq
UBP International Limited Messrs: Thierry Lagesse - Chairman Louis Raoul Harel
Mr Jean Michel Giraud resigned as Director to the Board on April 29, 2016.
UBP Madagascar Mr: Steve René – Manager
United Granite Products (Private ) Limited Messrs: Joseph Albert A. Mahir Didi Rémi de Gersigny Hussain Sadd Hashim Christophe Quevauvilliers
Mr Jean Michel Giraud resigned as Director to the Board on April 29, 2016. Mr Stéphane Ulcoq is in the process of being appointed as Director and Chairman to the Board.
Sainte Marie Crushing Plant Limited Messrs: Thierry Lagesse - Chairman Richard Koenig Christophe Quevauvilliers Stéphane Ulcoq
Dry Mixed Products Ltd Messrs: Marc Freismuth - Chairman Vincent Jacques Bouckaert - Appointed on September 11,
2015 in replacement of Mr Brice Audren Riché who resigned on the same date.
- alternate : Jamshed Khan - Appointed in June 27, 2016. Jean Yves Koenig – Appointed on June 30, 2016 in replacement
of Mr Alexandre Roland Maurel who resigned on the same date. Thierry Lagesse - alternate : Christophe Quevauvilliers Colin Taylor - alternate : Eric Adam Stéphane Ulcoq

49
UB
P A
NN
UA
L R
EP
OR
T 2
016
48
UB
P A
NN
UA
L R
EP
OR
T 2
016
Dry Mixed Products Ltd (Cont’d)On August 4, 2015, Mr Stéphane Ulcoq was appointed full-fledged Director and nominated Chairman of the company whilst Mr Jean Michel Giraud remained as Director to the Board. On the same date, Mr Christophe Quevauvilliers resigned as Director and was appointed alternate-Director to Mr Thierry Lagesse.
On April 29, 2016, Mr Jean Michel Giraud resigned as Director to the Board and was replaced by Mr Marc Freismuth. On June 23, 2016, Mr Marc Freismuth was nominated Chairman of the company whilst Mr Stéphane Ulcoq remained as Director to the Board.
Land Reclamation Limited Messrs: François Boullé Joël Harel
Mr Jean Michel Giraud resigned as Director to the Board on April 29, 2016.
Stone & Bricks Limited Messrs: Christophe Quevauvilliers - Chairman – Appointed on April 29, 2016 in replacement of Mr Jean Michel Giraud who resigned on the same date. Joël Harel
The Stone Masters Co. Ltd Messrs: Christophe Quevauvilliers - Chairman – Appointed on April 29, 2016 in replacement of Mr Jean Michel Giraud
who resigned on the same date. Joël Harel
Pricom Ltd Messrs: Thierry Lagesse - Chairman Joël Harel Stéphane Ulcoq
DIRECTORS’ REMUNERATION AND BENEFITS
Total remuneration and benefits received by the Directors from the Company and its subsidiary companies were as follows:Total remuneration and benefits received by the Directors from the Company and its subsidiary companies were as follows:
Executive Non-executive
2016 2015 2016 2015
Rs’000 Rs’000 Rs’000 Rs’000The Company 9,186 *23,643 2,060 1,850Subsidiary Companies :Espace Maison Ltée - 966 770 536Compagnie de Gros Cailloux Limitée - 966 80 -Welcome Industries Ltd - - - -UBP International Limited - - - -UBP Madagascar - - - -United Granite Products (Private) Limited - - - -Sainte Marie Crushing Plant Limited - - 120 120Dry Mixed Products Ltd - - - -Land Reclamation Limited - - - -Stone & Bricks Limited - - - -The Stone Masters Co. Ltd - - - -
Pricom Ltd - - - -
* Included in the above are retirement benefits paid to the retiring CEO.
DIRECTORS’ AND SENIOR OFFICERS’ INTERESTS IN SHARES
The Directors’ and Senior Officers’ interests in the ordinary shares of the Company at June 30, 2016 were as follows:
Ordinary sharesCategory Direct Indirect
Number % Number %DirectorsMarc Freismuth - Chairman NICB - - - -François Boullé INED - - 26,270 0.099Joël Harel INED - - - -Laurent de la Hogue NED - - - -Arnaud Lagesse NED - - 12,200 0.046Stéphane Lagesse NED 216 0.001 45,137 0.170Thierry Lagesse NED 2,090 0.008 45,137 0.170Jean Claude Maingard NED - - - -E. Jean Mamet INED - - 2,000 0.007Christophe Quevauvilliers ED 600 0.002 12 0.000Stéphane Ulcoq ED - - - -Senior OfficersFrancis Koenig * 2,000 0.007 - -Jocelyne L’Arrogant * 10 0.000 - -Edley Michaud * 605 0.002 - -Dhuenesh Rambarassah * 480 0.002 - -ED – Executive Director INED – Independent Non-Executive Director
NED – Non-Executive Director NICB – Non-Independent Chairman of the Board
* The job titles of the Senior Officers are as described in their profile on pages 12 and 13.
Except for the above, none of the other Senior Officers had an interest in the shares of the Company, either directly or indirectly.
None of the Directors and Senior Officers of the Company had an interest in the shares of the subsidiary companies.
DIRECTORS’ SERVICE CONTRACTS
Except for Messrs Stéphane Ulcoq and Christophe Quevauvilliers who each have a contract of employment with the Company, there is no service contract between the Company and any of the Directors.
DIRECTORS’ AND OFFICERS’ INSURANCE AND INDEMNIFICATION
The Directors and the Secretary of the Company benefit from an indemnity insurance cover for liabilities incurred while performing their duties, to the extent permitted by law.
OTHER STATUTORY DISCLOSURES (CONT’D)

51
UB
P A
NN
UA
L R
EP
OR
T 2
016
50
UB
P A
NN
UA
L R
EP
OR
T 2
016
SHAREHOLDERS
Substantial Shareholders
The only shareholder holding more than 5% of the share capital of the Company at June 30, 2016 was as follows:
Shareholders Number of shares % Holding
IBL Ltd (formerly known as GML Investissement Ltée) 8,785,100 33.14
Except for the above, no other entity or individual had an interest of 5% or more in the ordinary share capital of the Company.
In February 2016, Forward Investment and Development Enterprises Ltd (now known as Bee Equity Partners Ltd), which held 11.01% of the ordinary share capital of the Company at June 30, 2015, distributed all its shares to its shareholders (including IBL Ltd) via a dividend in specie. Consequently, the number of shareholders of the Company nearly doubled.
CONTRACTS OF SIGNIFICANCE
No Director or any substantial shareholder had a material interest, either directly or indirectly, in a contract of significance entered into by the Company or its subsidiaries.
DONATIONS
The Company and its subsidiary companies have donated Rs 836,356 during the year ended June 30, 2016 (2015: Rs 2,841,758) out of which Rs 77,965 (2015: Rs 2,714,997) were political donations.
AUDITORS’ REMUNERATION
The auditors’ remuneration was as follows:
THE GROUP THE COMPANY2016 2015 2016 2015
Rs’000 Rs’000 Rs’000 Rs’000Audit fees:Ernst & Young 2,678 2,678 1,129 1,129Other firms - - - -Non-audit fees:Ernst & Young 506 748 158 153Other firms 450 450 - 450
The non-audit fees paid by the Group to Ernst & Young comprised of tax services for Rs 275,865 (2015 : Rs 268,500) and of assistance for a tax assessment for Rs 230,000 (2015 : Rs 480,000).
The Group paid Rs 450,000 as non-audit fees to other firms for the year ended June 30, 2016 (2015 : Rs 450,000).
COMPANY SECRETARY’S CERTIFICATE
I certify that, to the best of my knowledge and belief, the Company has filed with the Registrar of Companies all such returns as are required of the Company under the Companies Act 2001.
Bhooneshi NemchandCompany Secretary
September 27, 2016
OTHER STATUTORY DISCLOSURES (CONT’D)

53
UB
P A
NN
UA
L R
EP
OR
T 2
016
52
UB
P A
NN
UA
L R
EP
OR
T 2
016
Report on the Financial Statements
We have audited the financial statements of The United Basalt Products Limited (the “Company”), and its subsidiaries (the “Group”) on pages 54 to 111 which comprise the statements of financial position as at June 30, 2016 and the statements of profit or loss and other comprehensive income, statements of changes in equity and statements of cash flows for the year then ended and a summary of significant accounting policies and other explanatory notes.
Directors’ Responsibility for the Financial Statements
The Directors are responsible for the preparation and fair presentation of these financial statements in accordance with International Financial Reporting Standards and in compliance with the requirements of the Companies Act 2001 and Financial Reporting Act 2004, and for such internal control as the Directors determine is necessary to enable the preparation of financial statements that are free from material misstatement, whether due to fraud or error.
Auditors’ Responsibility
Our responsibility is to express an opinion on these financial statements based on our audit. We conducted our audit in accordance with International Standards on Auditing. Those Standards require that we comply with ethical requirements and plan and perform the audit to obtain reasonable assurance about whether the financial statements are free from material misstatement.
An audit involves performing procedures to obtain audit evidence about the amounts and disclosures in the financial statements. The procedures selected depend on the auditors’ judgement, including the assessment of the risks of material misstatement of the financial
statements, whether due to fraud or error. In making those risk assessments, the auditors consider internal control relevant to the company’s preparation and fair presentation of the financial statements in order to design audit procedures that are appropriate in the circumstances, but not for the purpose of expressing an opinion on the effectiveness of the Company’s internal control. An audit also includes evaluating the appropriateness of accounting policies used and the reasonableness of accounting estimates made by the Directors, as well as evaluating the overall presentation of the financial statements.
We believe that the audit evidence we have obtained is sufficient and appropriate to provide a basis for our audit opinion.
Opinion
In our opinion, the financial statements on pages 54 to 111 give a true and fair view of the financial position of the Group and the Company as at June 30, 2016 and of their financial performances and cash flows for the year then ended in accordance with International Financial Reporting Standards and comply with the Companies Act 2001 and the Financial Reporting Act 2004.
Other matter
This report has been prepared solely for the Company’s members, as a body, in accordance with Section 205 of the Companies Act 2001. Our audit work has been undertaken so that we might state to the Company’s members those matters we are required to state to them in an auditors’ report and for no other purpose. To the fullest extent permitted by law, we do not accept or assume responsibility to anyone other than the Company and the Company’s members, as a body, for our audit work, for this report, or for the opinions we have formed.
REPORT ON OTHER LEGAL AND REGULATORY REQUIREMENTS
Companies Act 2001
We have no relationship with or interests in the Group and the Company other than in our capacities as auditors, tax advisors, and dealings in the ordinary course of business.
We have obtained all the information and explanations we have required.
In our opinion, proper accounting records have been kept by the Company as far as it appears from our examination of those records.
Financial Reporting Act 2004
The Directors are responsible for preparing the Corporate Governance Report. Our responsibility is to report on the extent of the compliance with the Code of Corporate Governance (the “Code”) as disclosed in the annual report and on whether the disclosure is consistent with the requirements of the Code.
In our opinion, the disclosure in the Corporate Governance Report is consistent with the requirements of the Code.
INDEPENDENT AUDITORS’ REPORT TO THE MEMBERS OF THE UNITED BASALT PRODUCTS LIMITED
ERNST & YOUNG LI KUNE LAN POOKIM, A.C.A, F.C.C.AEbène, Mauritius Licensed by FRC
September 27, 2016

55
UB
P A
NN
UA
L R
EP
OR
T 2
016
54
UB
P A
NN
UA
L R
EP
OR
T 2
016
THE UNITED BASALT PRODUCTS LIMITED AND ITS SUBSIDIARIESNOTES TO THE FINANCIAL STATEMENTS FOR THE YEAR ENDED JUNE 30, 2016
THE UNITED BASALT PRODUCTS LIMITED AND ITS SUBSIDIARIESSTATEMENTS OF PROFIT OR LOSS AND OTHER COMPREHENSIVE INCOME FOR THE YEAR ENDED JUNE 30, 2016
Certain amounts shown here do not correspond to the 2014 and 2015 financial statements and reflect adjusments made, refer to note 2.6.
These financial statements were approved by the Board of Directors on September 27, 2016 and signed on its behalf by:
Marc Freismuth Stéphane Ulcoq Chairman Chief Executive Officer
The notes on pages 58 to 111 form an integral part of these financial statements.Auditors’ report on pages 52 and 53.
THE GROUP THE COMPANYRestated
2016 2015 2014 2016 2015ASSETS Notes Rs’000 Rs’000 Rs’000 Rs’000 Rs’000Non-current assetsProperty, plant and equipment 5 2,888,908 2,890,185 2,757,798 1,462,520 1,453,311 Investment properties 6 16,033 14,572 16,481 193,259 200,565 Bearer biological assets 7 13,779 12,446 12,428 - - Intangible assets 8 24,762 20,903 20,716 9,451 3,620 Investment in subsidiaries 9 - - - 1,079,659 979,659 Investment in associates 10 146,865 168,928 191,121 107,248 110,306 Available-for-sale investments 11 75,216 54,398 58,628 71,139 49,225 Deferred tax assets 13(c) - 921 2,883 - -
3,165,563 3,162,353 3,060,055 2,923,276 2,796,686
Current assetsConsumable biological assets 14 35,894 29,487 33,201 - - Inventories 15 671,575 672,517 670,347 247,237 232,448 Other current financial asset 12 13,795 13,795 13,795 13,795 13,795 Trade and other receivables 17 369,370 377,903 432,282 387,445 506,208 Cash at bank and on hand 18 50,288 28,221 38,700 3,108 2,176
1,140,922 1,121,923 1,188,325 651,585 754,627 Asset classified as held for sale 16 - - 80,000 - -
1,140,922 1,121,923 1,268,325 651,585 754,627 TOTAL ASSETS 4,306,485 4,284,276 4,328,380 3,574,861 3,551,313
EQUITY AND LIABILITIESEquityIssued capital 19(a) 265,100 265,100 265,100 265,100 265,100 Reserves 2,366,381 2,308,836 2,352,280 1,913,060 1,892,083 Equity attributable to shareholders of the parent 2,631,481 2,573,936 2,617,380 2,178,160 2,157,183Non-controlling interests 46,238 40,848 39,298 - -Total equity 2,677,719 2,614,784 2,656,678 2,178,160 2,157,183
Non-current liabilities Interest-bearing loans and borrowings 20 596,904 573,556 599,131 560,000 565,333Deferred tax liability 13(c) 38,316 38,681 46,001 32,941 34,289Employee benefit liability 21 282,656 298,066 249,001 233,679 245,942
917,876 910,303 894,133 826,620 845,564
Current liabilitiesInterest-bearing loans and borrowings 20 417,642 456,615 440,944 417,790 434,402Trade and other payables 22 258,925 277,093 323,909 130,711 104,734Dividend 7,210 13,878 4,800 - -Income tax payable 13(b) 27,113 11,603 7,916 21,580 9,430
710,890 759,189 777,569 570,081 548,566Total liabilities 1,628,766 1,669,492 1,671,702 1,396,701 1,394,130TOTAL EQUITY AND LIABILITIES 4,306,485 4,284,276 4,328,380 3,574,861 3,551,313
The notes on pages 58 to 111 form an integral part of these financial statements.Auditors’ report on pages 52 and 53.
THE GROUP THE COMPANY2016 2015 2016 2015
Notes Rs’000 Rs’000 Rs’000 Rs’000Revenue 23 2,636,450 2,355,240 1,394,917 1,267,254
Operating profit 24 254,324 164,423 136,602 145,093
Finance income 25 2,473 2,990 40,821 35,977
Finance costs 26 (51,633) (60,706) (51,630) (55,722)
Share of results of associates 10 (6,367) (3,163) - -
Profit before tax 198,797 103,544 125,793 125,348
Income tax expense 13 (a) (40,694) (20,432) (30,140) (12,358)
Profit for the year 158,103 83,112 95,653 112,990
Other comprehensive income Other comprehensive income to be reclassified to profit or loss in subsequent periods:Net loss on available-for-sale investments 11 (8,002) (640) (6,906) (454)Reclassification of fair value of available-for-sale investments - (1,560) - (1,560)
Exchange differences on translation of foreign operations (10,089) 301 - - Net other comprehensive income to be reclassified to profit or loss in subsequent periods (18,091) (1,899) (6,906) (2,014)
Items not to be reclassified to profit or loss in subsequent periods:Re-measurement gains/(losses) on defined benefit plans 21 21,731 (30,963) 14,169 (29,048)
Income tax effect 13 (a) (2,730) 4,732 (2,409) 4,938
Reversal of revaluation of land and buildings 5 - (760) - (760)
Share of movement in reserves in associates 10 (1,538) (10,630) - -
Net other comprehensive income not to be reclassified to profit or loss in subsequent periods 17,463 (37,621) 11,760 (24,870)
Other comprehensive income for the year, net of tax (628) (39,520) 4,854 (26,884)
Total comprehensive income for the year, net of tax 157,475 43,592 100,507 86,106
Profit for the year attributable to:Equity holders of the parent 136,346 67,850 95,653 112,990
Non-controlling interests 21,757 15,262 - -
158,103 83,112 95,653 112,990 Total comprehensive income for the year attributable to:Equity holders of the parent 137,075 29,459 100,507 86,106
Non-controlling interests 20,400 14,133 - -
157,475 43,592 100,507 86,106
Earnings per share - Basic and diluted (Rs) 27 5.14 2.56

57
UB
P A
NN
UA
L R
EP
OR
T 2
016
56
UB
P A
NN
UA
L R
EP
OR
T 2
016
THE UNITED BASALT PRODUCTS LIMITED AND ITS SUBSIDIARIESSTATEMENTS OF CHANGES IN EQUITY FOR THE YEAR ENDED JUNE 30, 2016
THE UNITED BASALT PRODUCTS LIMITED AND ITS SUBSIDIARIESSTATEMENTS OF CASH FLOWS FOR THE YEAR ENDED JUNE 30, 2016
Attributable to equity shareholders of the parent
THE GROUP
Issued Capital
SharePremium
AssociateCompanies
RevaluationReserve
Fair Value
ReserveTranslation
ReserveRetainedEarnings Total
Non- controlling
Interests TotalRs’000 Rs’000 Rs’000 Rs’000 Rs’000 Rs’000 Rs’000 Rs’000 Rs’000 Rs’000
At July 1, 2014- As previously reported 265,100 7,354 76,106 1,173,574 38,815 60,645 1,144,878 2,766,472 55,582 2,822,054
- Prior year adjustment (note 2.6) - - - - - (47,287) (101,805) (149,092) (16,284) (165,376)
As restated at July 1, 2014 265,100 7,354 76,106 1,173,574 38,815 13,358 1,043,073 2,617,380 39,298 2,656,678
Profit for the year - - - - - - 67,850 67,850 15,262 83,112 Other comprehensive income - - (10,630) (760) (2,200) 1,986 (26,787) (38,391) (1,129) (39,520)Total comprehensive income for the year
-
- (10,630) (760) (2,200)
1,986
41,063
29,459
14,133
43,592
Transfer - - - (79,776) - - 79,776 - - - Dividends (note 28) - - - - - - (72,903) (72,903) (12,583) (85,486)At June 30, 2015 265,100 7,354 65,476 1,093,038 36,615 15,344 1,091,009 2,573,936 40,848 2,614,784As restated at July 1, 2015 265,100 7,354 65,476 1,093,038 36,615 15,344 1,091,009 2,573,936 40,848 2,614,784Profit for the year - - - - - - 136,346 136,346 21,757 158,103
Other comprehensive income - - (1,538) - (8,002) (7,900) 18,169 729 (1,357) (628)
Total comprehensive income for the year - - (1,538) - (8,002) (7,900) 154,515 137,075 20,400 157,475Dividends (note 28) - - - - - - (79,530) (79,530) (15,010) (94,540)
At June 30, 2016 265,100 7,354 63,938 1,093,038 28,613 7,444 1,165,994 2,631,481 46,238 2,677,719
THE COMPANY
Issued Capital
Share Premium
Revaluation Reserve
Fair Value
Reserve Retained Earnings Total
Rs’000 Rs’000 Rs’000 Rs’000 Rs’000 Rs’000 At July 1, 2014 265,100 7,354 505,970 35,857 1,329,699 2,143,980
Profit for the year - - - - 112,990 112,990
Other comprehensive income - - (760) (2,014) (24,110) (26,884)
Total comprehensive income for the year
- - (760) (2,014) 88,880 86,106
Dividend (note 28) - - - - (72,903) (72,903)
At June 30, 2015 265,100 7,354 505,210 33,843 1,345,676 2,157,183
At July 1, 2015 265,100 7,354 505,210 33,843 1,345,676 2,157,183
Profit for the year - - - - 95,653 95,653
Other comprehensive income - - - (6,906) 11,760 4,854
Total comprehensive income for the year - - - (6,906) 107,413 100,507Dividend (note 28) - - - - (79,530) (79,530)
At June 30, 2016 265,100 7,354 505,210 26,937 1,373,559 2,178,160
THE GROUP THE COMPANYRestated
2016 2015 2016 2015Notes Rs’000 Rs’000 Rs’000 Rs’000
OPERATING ACTIVITIESProfit before tax 198,797 103,544 125,793 125,348 Adjustment for:Depreciation of property, plant and equipment 5 237,227 219,414 168,012 152,552 Depreciation of investment properties 6 2,065 1,909 16,688 16,255 Amortisation of intangible assets 8 3,944 3,500 1,160 880 Impairment of investment in associates 10 2,968 - 2,968 -Impairment of receivable from subsidiary 24 - - 58,000 - Write-off of intangible assets 8 1,653 - - - Write-off of property, plant and equipment 5 874 1,979 - - Amortisation of bearer biological assets 7 3,439 4,008 - - Impairment of bearer biological assets 7 (380) 380 - - Movement in retirement benefit obligations 21 6,321 18,102 1,906 13,940 Profit on disposal of property, plant and equipment 24 (6,840) (4,588) (3,818) (2,671)Profit on disposal of investment (808) (1,648) (808) (1,648)Share of results of associates 10 6,367 3,163 - - Finance costs 26 51,633 60,706 51,630 55,722
Finance income 25 (2,473) (2,990) (40,821) (35,977)Movement in working capital:(Increase)/decrease in consumable biological assets (6,407) 3,714 - - Decrease/(increase) in inventories 942 (2,170) (14,789) (6,347)Decrease/(increase) in trade and other receivables 6,320 52,525 (19,950) (11,740)(Decrease)/Increase in trade and other payables (18,164) (46,816) 25,977 (1,580)Cash generated from operations 487,478 414,732 371,948 304,734 Interest paid (51,633) (60,706) (51,630) (55,722)Finance income 144 669 1,520 4,176 Income tax paid 13 (b) (25,145) (15,517) (19,534) (7,080)Net cash flows from operating activities 410,844 339,178 302,304 246,108
INVESTING ACTIVITIESProceeds from disposal of property, plant and equipment 21,111 6,155 12,386 2,974 Proceeds from sale of investment - 3,876 899 3,876 Proceeds from assets held for sale 16 - 80,000 - - Purchase of property, plant and equipment 18 (232,742) (347,092) (185,789) (233,150)Purchase of investment properties 6 (1,918) - (9,382) (6,181)Purchase of intangible assets 8 (9,456) (3,687) (6,992) (1,933)Expenditure on bearer biological assets 7 (4,392) (4,406) - - Purchase of available for sale investments 11 (28,820) (200) (28,820) (200)Investment in subsidiary 9 - - (21,500) - Dividend received from associates 10 11,100 8,400 - - Dividend received from other equity investment 25 2,329 2,321 39,301 31,801 Net cash flows used in investing activities (242,788) (254,633) (199,897) (202,813)
FINANCING ACTIVITIESProceeds from borrowings 909,000 548,307 955,500 566,050 Repayment of term loans (898,356) (567,018) (916,180) (562,843)Repayment of finance lease liabilities (18,692) (30,998) (12,788) (26,027)Dividend paid - The Company 28 (79,530) (72,903) (79,530) (72,903)Dividend paid - Minority shareholders (21,678) (1,800) - - Net cash flows used in financing activities (109,256) (124,412) (52,998) (95,723)
Increase/(decrease) in cash and cash equivalents 58,800 (39,867) 49,409 (52,428)
MOVEMENT IN CASH AND CASH EQUIVALENTSAt July 1, (251,506) (209,464) (245,547) (193,119)Exchange difference (3,985) (2,175) - - Movement 58,800 (39,867) 49,409 (52,428)At June 30, 18 (196,691) (251,506) (196,138) (245,547)
Certain amounts shown here do not correspond to the 2014 and 2015 financial statements and reflect adjusments made, refer to note 2.6.
The notes on pages 58 to 111 form an integral part of these financial statements.Auditors’ report on pages 52 and 53.
Certain amounts shown here do not correspond to the 2015 financial statements and reflect adjusments made, refer to note 2.6.
The notes on pages 58 to 111 form an integral part of these financial statements.Auditors’ report on pages 52 and 53.

59
UB
P A
NN
UA
L R
EP
OR
T 2
016
58
UB
P A
NN
UA
L R
EP
OR
T 2
016
THE UNITED BASALT PRODUCTS LIMITED AND ITS SUBSIDIARIESNOTES TO THE FINANCIAL STATEMENTS FOR THE YEAR ENDED JUNE 30, 2016
THE UNITED BASALT PRODUCTS LIMITED AND ITS SUBSIDIARIESNOTES TO THE FINANCIAL STATEMENTS FOR THE YEAR ENDED JUNE 30, 2016
1. CORPORATE INFORMATION
The United Basalt Products Limited is a public Company incorporated and domiciled in Mauritius and listed on the official market of the Stock Exchange of Mauritius. Its registered office is situated at Trianon, Quatre-Bornes.
The main activities of the Company and its subsidiaries, together referred to as the ‘Group’, are the manufacturers and sellers of building materials, provision of workshop services and sellers of agricultural products.
The consolidated and separate financial statements for the year ended June 30, 2016 were authorised for issue by the Board of Directors on September 27, 2016 and the statements of financial position were signed on the Board’s behalf by Messrs Marc Freismuth and Stéphane Ulcoq. The consolidated and separate financial statements will be submitted to the shareholders for approval at the annual meeting.
2. ACCOUNTING POLICIES
2.1 BASIS OF PREPARATION The consolidated and separate financial statements of the Group and the Company have been prepared in accordance with International Financial Reporting Standards (“IFRS”) as issued by the International Accounting Standards Board (“IASB”) and complied with the Companies Act 2001 and Financial Reporting Act 2004.
The consolidated and separate financial statements have been prepared on a historical cost basis except for land and buildings classified under property, plant and equipment, available-for-sale investments and consumable biological assets that have been measured at their fair value as disclosed in the accounting policies hereafter.
The consolidated and separate financial statements are presented in Mauritian Rupees and all values are rounded to the nearest thousand (Rs’000) except where otherwise indicated.
The consolidated financial statements provide comparative information in respect of the previous period. In addition, the Group presents an additional statement of financial position at the beginning of the earliest period presented when there is a retrospective restatement. An additional statement of financial position as at July 1, 2014 is presented in these consolidated financial statements due to the correction of an error retrospectively.
2.2 BASIS OF CONSOLIDATION
The consolidated financial statements comprise the financial statements of The United Basalt Products Limited and its subsidiaries as at June 30, 2016.
Control is achieved when the Group is exposed or has rights to variable returns from its involvement with the investee and has the ability to affect those returns through its power over the investee. Specifically, the Group controls an investee if and only if the Group has:
• Power over the investee (i.e. existing rights that give it the current ability to direct the relevant activities of the investee)• Exposure or rights to variable returns from its involvement with the investee, and• The ability to use its power over the investee to affect its returns
When the Group has less than a majority of the voting or similar rights of an investee, the Group considers all relevant facts and circumstances in assessing whether it has power over an investee, including:
• The contractual arrangement with the other vote holders of the investee• Rights arising from other contractual arrangements• The Group’s voting rights and potential voting rights
The Group re-assesses whether or not it controls an investee if facts and circumstances indicate that there are changes to one or more of the three elements of control. Consolidation of a subsidiary begins when the Group obtains control over the subsidiary and ceases when the Group loses control of the subsidiary. Assets, liabilities, income and expenses of a subsidiary acquired or disposed of during the year are included in the statement of financial position and statement of comprehensive income from the date the Group gains control until the date the Group ceases to control the subsidiary.
Profit or loss and each component of other comprehensive income (OCI) are attributed to the equity holders of the parent of the Group and to the non-controlling interests, even if this results in the non-controlling interests having a deficit balance. When necessary, adjustments are made to the financial statements of subsidiaries to bring their accounting policies in line with the Group’s accounting policies. All intra-group assets and liabilities, equity, income, expenses and cash flows relating to transactions between members of the Group are eliminated in full on consolidation.
A change in the ownership interest of a subsidiary, without a loss of control, is accounted for as an equity transaction. If the Group loses control over a subsidiary, it:
• Derecognises the assets (including goodwill) and liabilities of the subsidiary• Derecognises the carrying amount of any non-controlling interest• Derecognises the cumulative translation differences, recorded in equity• Recognises the fair value of the consideration received• Recognises the fair value of any investment retained• Recognises any surplus or deficit in statement of profit or loss• Reclassifies the parent’s share of components previously recognised in other comprehensive income to statement of profit or loss or retained
earnings, as appropriate, as would be required if the Group had directly disposed of the related assets or liabilities.
2.3 SUMMARY OF SIGNIFICANT ACCOUNTING POLICIES
(a) Business combinations and goodwill
Business combinations are accounted for using the acquisition method. The cost of an acquisition is measured as the aggregate of the consideration transferred, measured at acquisition date at fair value and the amount of any non-controlling interest in the acquiree. For each business combination, the Group elects whether to measure the non-controlling interest in the acquiree either at fair value or at the proportionate share of the acquiree’s identifiable net assets. Acquisition related costs are expensed as incurred and included in administrative expenses.
When the Group acquires a business, it assesses the financial assets and liabilities assumed for appropriate classification and designation in accordance with the contractual terms, economic circumstances and pertinent conditions as at the acquisition date. This includes the separation of embedded derivatives in host contracts by the acquiree.
If the business combination is achieved in stages, the previously held equity interest is re-measured at its acquisition date fair value and any resulting gain or loss is recognised in the statement of profit or loss and other comprehensive income. It is then considered in the determination of goodwill.
Any contingent consideration to be transferred by the acquirer will be recognised at fair value at the acquisition date. Contingent consideration classified as an asset or liability that is a financial instrument and within the scope of IAS 39 Financial Instruments: Recognition and Measurement, is measured at fair value with changes in fair value recognised in the statement of profit or loss and other comprehensive income. If the contingent consideration is not within the scope of IAS 39, it is measured in accordance with the appropriate IFRS. Contingent consideration that is classified as equity is not re-measured and subsequent settlement is accounted for within equity.
Goodwill is initially measured at cost, being the excess of the aggregate of the consideration transferred and the amount recognised for non-controlling interests, and any previous interest held, over the net identifiable assets acquired and liabilities assumed. If the fair value of the net assets acquired is in excess of the aggregate consideration transferred, the Group re-assesses whether it has correctly identified all of the assets acquired and all of the liabilities assumed and reviews the procedures used to measure the amounts to be recognised at the acquisition date. If the re-assessment still results in an excess of the fair value of net assets acquired over the aggregate consideration transferred, then the gain is recognised in profit or loss.
After initial recognition, goodwill is measured at cost less any accumulated impairment losses. For the purpose of impairment testing, goodwill acquired in a business combination is, from the acquisition date, allocated to each of the Group’s cash-generating units that are expected to benefit from the combination, irrespective of whether other assets or liabilities of the acquiree are assigned to those units.
Where goodwill forms part of a cash-generating unit and part of the operation within that unit is disposed of, the goodwill associated with the operation disposed of is included in the carrying amount of the operation when determining the gain or loss on disposal of the operation. Goodwill disposed of in this circumstance is measured based on the relative values of the operation disposed of and the portion of the cash-generating unit retained.

61
UB
P A
NN
UA
L R
EP
OR
T 2
016
60
UB
P A
NN
UA
L R
EP
OR
T 2
016
THE UNITED BASALT PRODUCTS LIMITED AND ITS SUBSIDIARIESNOTES TO THE FINANCIAL STATEMENTS FOR THE YEAR ENDED JUNE 30, 2016
THE UNITED BASALT PRODUCTS LIMITED AND ITS SUBSIDIARIESNOTES TO THE FINANCIAL STATEMENTS FOR THE YEAR ENDED JUNE 30, 2016
2.3 SUMMARY OF SIGNIFICANT ACCOUNTING POLICIES (CONT”D)
(b) Fair value measurement
The Group measures its non-financial assets such as biological assets at fair value at each reporting date.
Fair value is the price that would be received to sell an asset or paid to transfer a liability in an orderly transaction between market participants at the measurement date. The fair value measurement is based on the presumption that the transaction to sell the asset or transfer the liability takes place either:
• In the principal market for the asset or liability, or• In the absence of a principal market, in the most advantageous market for the asset or liability
The principal or the most advantageous market must be accessible by the Group.
The fair value of an asset or a liability is measured using the assumptions that market participants would use when pricing the asset or liability, assuming that market participants act in their economic best interest.
A fair value measurement of a non-financial asset takes into account a market participant’s ability to generate economic benefits by using the asset in its highest and best use or by selling it to another market participant that would use the asset in its highest and best use.
The Group uses valuation techniques that are appropriate in the circumstances and for which sufficient data are available to measure fair value, maximising the use of relevant observable inputs and minimising the use of unobservable inputs.
All assets and liabilities for which fair value is measured or disclosed in the financial statements are categorised within the fair value hierarchy, described as follows, based on the lowest level input that is significant to the fair value measurement as a whole:
• Level 1 - Quoted (unadjusted) market prices in active markets for identical assets or liabilities• Level 2 - Valuation techniques for which the lowest level input that is significant to the fair value measurement is directly or indirectly observable• Level 3 - Valuation techniques for which the lowest level input that is significant to the fair value measurement is unobservable
For assets and liabilities that are recognised in the financial statements on a recurring basis, the Group determines whether transfers have occurred between levels in the hierarchy by re-assessing categorisation (based on the lowest level input that is significant to the fair value measurement as a whole) at the end of each reporting period.
The Group’s management determines the policies and procedures for both recurring fair value measurement, such as unquoted available-for-sale financial assets, and for non-recurring measurement, such as assets held for sale.
Financial assets that are unquoted are fair valued by management at least annually at the reporting date. The use of external valuers is decided by the management when the situation dictates it, taking into consideration the relevant factors. Involvement of external valuers for the valuation of its properties is decided upon by management after discussion with and approval of the audit committee, usually every three years. Selection criteria include market knowledge, reputation, independence and whether professional standards are maintained. Management decides, after discussions with the Group’s external valuers, which valuation techniques and inputs to use for each case. Management assesses the changes in the inputs, as well as those in the environment, from both internal and external sources, that affect the fair value of the property since the last valuation, and thereafter decides on the involvement of external valuers.
At each reporting date, management analyses the movements in the values of assets and liabilities which are required to be re-measured or re-assessed as per the Group’s accounting policies. For this analysis, management verifies the major inputs applied in the latest valuation by agreeing the information in the valuation computation to relevant documents.
Management, in conjunction with the Group’s external valuers, also compares the changes in the fair value of each asset and liability with relevant external sources to determine whether the change is reasonable.
The fair values of the Group’s consumable biological assets are determined by Management at least annually at the reporting date through the income approach. Inputs and assumptions used in the determination of the fair value are verified and validated to their respective sources and documents.
For the purpose of fair value disclosures, the Group has determined classes of assets and liabilities on the basis of the nature, characteristics and risks of the asset or liability and the level of the fair value hierarchy as explained above.
(c) Property, plant and equipment
Except for freehold land and buildings, property, plant and equipment is stated at cost, net of accumulated depreciation and accumulated impairment losses, if any. Such cost includes the cost of replacing part of the property, plant and equipment. When significant parts of property, plant and equipment are required to be replaced at intervals, the Group recognises such parts as individual assets with specific useful lives and depreciates them accordingly. Likewise, when a major inspection is performed, its cost is recognised in the carrying amount of the plant and equipment as a replacement if the recognition criteria are satisfied. All other repair and maintenance costs are recognised in profit or loss as incurred.
Freehold land and buildings are measured at fair value less accumulated depreciation on buildings and impairment losses recognised at the date of the revaluation. Valuations are performed with sufficient frequency (3 to 5 years) to ensure that the fair value of a revalued asset does not differ materially from its carrying amount.
A revaluation surplus is recorded in other comprehensive income and credited to the asset revaluation reserve in equity, except to the extent that it reverses a revaluation decrease of the same asset previously recognised in profit or loss, in which case, the increase is recognised in profit or loss. A revaluation deficit is recognised in profit or loss, except to the extent that it offsets an existing surplus on the same asset recognised in the asset revaluation reserve.
Upon disposal, any revaluation reserve relating to the particular asset being sold is transferred to retained earnings.
Depreciation is calculated on a straight-line basis over the estimated useful lives of the assets as follows:
%
Buildings 2 to 5
Leasehold improvements Land improvements
Over lease period20
Plant and equipment 10 to 33
Motor vehicles 20
An item of property, plant and equipment and any significant part initially recognised is derecognised upon disposal or when no future economic benefits are expected from its use or disposal. Any gain or loss arising on derecognition of the asset (calculated as the difference between the net disposal proceeds and the carrying amount of the asset) is included in profit or loss when the asset is derecognised.
Leasehold properties are not capitalised and the lease payments are charged to profit or loss on accrual straight-lined basis. Improvements on leasehold properties are capitalised and amortised over the lease period.
The useful lives and methods of depreciation of property, plant and equipment are reviewed at each financial year end and adjusted prospectively, if appropriate.
(d) Investment properties
Investment properties are initially measured at cost, including transaction costs.
The cost includes the cost of replacing part of an existing investment property at the time that cost is incurred if the recognition criteria are met and excludes the costs of day-to-day servicing of an investment property. Subsequently, the investment properties are stated at historical cost less accumulated depreciation and any impairment in value.

63
UB
P A
NN
UA
L R
EP
OR
T 2
016
62
UB
P A
NN
UA
L R
EP
OR
T 2
016
THE UNITED BASALT PRODUCTS LIMITED AND ITS SUBSIDIARIESNOTES TO THE FINANCIAL STATEMENTS FOR THE YEAR ENDED JUNE 30, 2016
THE UNITED BASALT PRODUCTS LIMITED AND ITS SUBSIDIARIESNOTES TO THE FINANCIAL STATEMENTS FOR THE YEAR ENDED JUNE 30, 2016
2.3 SUMMARY OF SIGNIFICANT ACCOUNTING POLICIES (CONT’D)
(d) Investment properties (Cont’d)
Investment properties are derecognised when either they have been disposed of or when they are permanently withdrawn from use and no future economic benefit is expected from their disposal. The difference between the net disposal proceeds and the carrying amount of the asset is recognised in profit or loss in the period of derecognition. Transfers are made to or from investment property only when there is a change in use. For a transfer from investment property to owner-occupied property, the deemed cost for subsequent accounting is the cost less depreciation at the date of transfer. If owner-occupied property becomes an investment property, the Group accounts for such property in accordance with the policy stated under property, plant and equipment up to the date of change in use.
Depreciation is calculated on the straight-line method at the rate of 2% to 5% per annum.
(e) Biological assets
Bearer biological assets
Bearer biological assets comprising of sugar cane ratoons and plantation costs are capitalised and amortised over the period during which the Group expects to benefit from the asset, usually seven years. In prior year, the Group early adopted amendments brought to IAS 16 and IAS 41 to account for bearer plants in the same way as property, plant and equipment. No impact was noted as the Group previously used the same method to account for its bearer plants.
Consumable biological assets
Consumable biological assets represent standing cane and plants and are stated at fair value less costs to sell. The fair value is measured as the expected net cash flows from the sale of the cane and plants discounted at the relevant market determined pre-tax rate.
(f) Intangible assets
Intangible assets acquired separately are measured on initial recognition at cost. The cost of intangible assets acquired in a business combination is their fair value as at the date of acquisition. Following initial recognition, intangible assets are carried at cost less any accumulated amortisation and any accumulated impairment losses. Internally generated intangible assets, excluding capitalised development costs, are not capitalised and the related expenditure is reflected in profit or loss in the year in which the expenditure is incurred.
The useful lives of intangible assets are assessed to be either finite or indefinite. Intangible assets with finite lives are amortised over the useful economic life and assessed for impairment whenever there is an indication that the intangible asset may be impaired. The amortisation period and the amortisation method for an intangible asset with a finite useful life are reviewed at least at the end of each reporting period. Changes in the expected useful life or the expected pattern of consumption of future economic benefits embodied in the asset are considered to modify the amortisation period or method, as appropriate, and are treated as changes in accounting estimates. The amortisation expense on intangible assets with finite lives is recognised in profit or loss in the expense category consistent with the function of the intangible asset.
Intangible assets such as goodwill with indefinite useful lives are not amortised, but are tested for impairment annually, either individually or at the cash-generating unit level. The assessment of indefinite life is reviewed annually to determine whether the indefinite life continues to be supportable. If not, the change in useful life from indefinite to finite is made on a prospective basis.
Gains or losses arising from derecognition of an intangible asset are measured as the difference between the net disposal proceeds and the carrying amount of the asset and are recognised in profit or loss when the asset is derecognised.
Intangible assets include computer software, which is amortised using the straight line method over 6 years.
(g) Investment in subsidiaries
Subsidiaries are those entities controlled by the Company. Control is achieved when the company is exposed to, or has right to, variable returns from its investment with the entity and has the ability to affect those returns through its power over the entity.
Separate financial statements
Investments in subsidiaries in the separate financial statements of the Company are carried at cost, net of any impairment. Where the carrying amount of an investment is greater than its estimated recoverable amount, it is written down immediately to its recoverable amount and the difference is recognised in profit or loss. Upon disposal of the investment, the difference between the net disposal proceeds and the carrying amount is recognised in profit or loss.
(h) Investment in associates
An associate is an entity over which the Group has significant influence. Significant influence is the power to participate in the financial and operating policy decisions of the investee, but is not control over those policies.
The considerations made in determining significant influence are similar to those necessary to determine control over subsidiaries.
The Group’s investments in its associates are accounted for using the equity method.
Under the equity method, the investment in an associate is initially recognised at cost. The carrying amount of the investment is adjusted to recognise changes in the Group’s share of net assets of the associate since the acquisition date. Goodwill relating to the associate is included in the carrying amount of the investment and is neither amortised nor individually tested for impairment.
The profit or loss reflects the Group’s share of the results of operations of the associate. Any change in other comprehensive income of those investees is presented as part of the Group’s in other comprehensive income. In addition, when there has been a change recognised directly in the equity of the associate, the Group recognises its share of any changes, when applicable, in the statement of changes in equity.
Unrealised gains and losses resulting from transactions between the Group and the associate are eliminated to the extent of the interest in the associate.
The aggregate of the Group’s share of profit or loss of an associate is shown on the face of the statement of profit or loss and other comprehensive income outside operating profit and represents profit or loss after tax.
The financial statements of the associate are prepared for the same reporting period as the Group. When necessary, adjustments are made to bring the accounting policies in line with those of the Group.
After application of the equity method, the Group determines whether it is necessary to recognise an impairment loss on its investment in its associates. At each reporting date, the Group determines whether is objective evidence that the investment in the associates is impaired. If there is such evidence, the Group calculates the amount of impairment as the difference between the recoverable amount of the associate and its carrying value, then recognises the loss as ‘Share of profit of an associate’ in profit or loss.
Upon loss of significant influence over the associate, the Group measures and recognises any retained investment at its fair value. Any difference between the carrying amount of the associate upon loss of significant influence and the fair value of the retained investment and proceeds from disposal is recognised in profit or loss.
In the Company’s separate financial statements, investment in associates is stated at cost. The carrying amount is reduced to recognise any impairment in the value of the investment.

65
UB
P A
NN
UA
L R
EP
OR
T 2
016
64
UB
P A
NN
UA
L R
EP
OR
T 2
016
2.3 SUMMARY OF SIGNIFICANT ACCOUNTING POLICIES (CONT’D)
(i) Foreign currency translation
The financial statements of the Group and the Company are presented in Mauritian rupees, which is also the parent company’s functional currency. For each entity, the Group determines the functional currency and items included in the financial statements of each entity are measured using that functional currency. The Group uses the direct method of consolidation and has elected to recycle the gain or loss that arises from using this method.
Transactions and balances
Transactions in foreign currencies are initially recorded by the Group’s entities at their respective functional currency spot rates at the date the transaction first qualifies for recognition.
Monetary assets and liabilities denominated in foreign currencies are retranslated at the functional currency spot rate of exchange ruling at the reporting date.
Differences arising on settlement or translation of monetary items are recognised in profit or loss with the exception of monetary items that are designated as part of the hedge of the Group’s net investment of a foreign operation. These are recognised in other comprehensive income until the net investment is disposed, at which time, the cumulative amount is reclassified to profit or loss. Tax charges and credits attributable to exchange differences on those monetary items are also recorded in other comprehensive income.
Non-monetary items that are measured in terms of historical cost in a foreign currency are translated using the exchange rates as at the dates of the initial transactions. Non-monetary items measured at fair value in a foreign currency are translated using the exchange rates at the date when the fair value is determined. The gain or loss arising on retranslation of non-monetary items measured at fair value is treated in line with the recognition of gain or loss on change in fair value of the item (i.e., translation differences on items whose fair value gain or loss is recognised in other comprehensive income or profit or loss is also recognised in other comprehensive income or profit or loss, respectively).
Any goodwill arising on the acquisition of a foreign operation and any fair value adjustments to the carrying amounts of assets and liabilities arising on the acquisition are treated as assets and liabilities of the foreign operation and translated at the spot rate of exchange at the reporting date.
Group companies
On consolidation, the assets and liabilities of foreign operations are translated into Mauritian rupees at the rate of exchange prevailing at the reporting date and their profit or loss is translated at exchange rates prevailing at the date of the transactions. The exchange differences arising on the translation are recognised in other comprehensive income. On disposal of a foreign operation, the component of other comprehensive income relating to that particular foreign operation is recognised in profit or loss.
(j) Financial assets
Initial recognition and measurement
Financial assets are classified at initial recognition, as financial assets at fair value through profit or loss, loans and receivables, held-to-maturity investments, available-for-sale financial assets, or as derivatives designated as hedging instruments in an effective hedge, as appropriate. All financial assets are recognised initially at fair value plus, in the case of financial assets not recorded at fair value through profit or loss, transaction costs that are attributable to the acquisition of the financial asset.
Purchases or sales of financial assets that require delivery of assets within a time frame established by regulation or convention in the market place (regular way trades) are recognised on the trade date, i.e., the date that the Group commits to purchase or sell the asset.
The Group’s financial assets include cash at bank and on hand, trade and other receivables, loans receivables and quoted and unquoted financial instruments.
Subsequent measurement
The subsequent measurement of financial assets depends on their classification as follows:
Loans and receivables
Loans and receivables are non-derivative financial assets with fixed or determinable payments that are not quoted in an active market. After initial measurement, such financial assets are subsequently measured at amortised cost using the effective interest rate (EIR) method, less impairment. Amortised cost is calculated by taking into account any discount or premium on acquisition and fees or costs that are an integral part of the EIR. The EIR amortisation is included in finance income in profit or loss. The losses arising from impairment are recognised in profit or loss in finance cost for loans and in cost of sales or other operating expenses for receivables. This category generally applies to trade and other receivables and other financial assets.
Available-for-sale financial investments
Available-for-sale financial investments include equity and debt securities. Equity investments classified as available-for-sale are those that are neither classified as held for trading nor designated at fair value through profit or loss.
After initial measurement, available-for-sale financial investments are subsequently measured at fair value with unrealised gains or losses recognised in other comprehensive income and credited in the available-for-sale reserve until the investment is derecognised, at which time the cumulative gain or loss is recognised in other operating income, or the investment is determined to be impaired, when the cumulative loss is reclassified from the available-for-sale reserve to profit or loss in finance costs. Interest earned whilst holding available-for-sale investment is reported as interest income using the EIR method.
The Group evaluates whether the ability and intention to sell its available-for-sale financial assets in the near term is still appropriate. When, in rare circumstances, the Group is unable to trade these financial assets due to inactive markets, the Group may elect to reclassify these financial assets if the management has the ability and intention to hold the assets for foreseeable future or until maturity.
For a financial asset reclassified from the available-for-sale category, the fair value carrying amount at the date of reclassification becomes its new amortised cost and any previous gain or loss on the asset that has been recognised in equity is amortised in profit or loss over the remaining life of the investment using the EIR. Any difference between the new amortised cost and the maturity amount is also amortised over the remaining life of the asset using the EIR. If the asset is subsequently determined to be impaired, then the amount recorded in equity is reclassified to profit or loss.
Available-for-sale equity instruments that do not have a quoted market price in an active market and whose fair value cannot be reliably measured are stated at cost less any impairment losses.
Derecognition
A financial asset (or, where applicable a part of a financial asset or part of a group of similar financial assets) is derecognised when:
• The rights to receive cash flows from the asset have expired, or• The Group has transferred its rights to receive cash flows from the asset or has assumed an obligation to pay the received cash flows in full without
material delay to a third party under a ‘pass-through’ arrangement; and either (a) the Group has transferred substantially all the risks and rewards of the asset, or (b) the Group has neither transferred nor retained substantially all the risks and rewards of the asset, but has transferred control of the asset.
When the Group has transferred its rights to receive cash flows from an asset or has entered into a pass-through arrangement, it evaluates if and to what extent it has retained the risks and rewards of ownership. When it has neither transferred nor retained substantially all of the risks and rewards of the asset, nor transferred control of the asset, the Group continues to recognise the transferred asset to the extent of the Group’s continuing involvement in the asset. In that case, the Group also recognises an associated liability. The transferred asset and the associated liability are measured on a basis that reflects the rights and obligations that the Group has retained.
Continuing involvement that takes the form of a guarantee over the transferred asset is measured at the lower of the original carrying amount of the asset and the maximum amount of consideration that the Group could be required to repay.
THE UNITED BASALT PRODUCTS LIMITED AND ITS SUBSIDIARIESNOTES TO THE FINANCIAL STATEMENTS FOR THE YEAR ENDED JUNE 30, 2016
THE UNITED BASALT PRODUCTS LIMITED AND ITS SUBSIDIARIESNOTES TO THE FINANCIAL STATEMENTS FOR THE YEAR ENDED JUNE 30, 2016

67
UB
P A
NN
UA
L R
EP
OR
T 2
016
66
UB
P A
NN
UA
L R
EP
OR
T 2
016
2.3 SUMMARY OF SIGNIFICANT ACCOUNTING POLICIES (CONT’D)
(j) Financial assets (Cont’d)
Impairment of financial assets
The Group assesses, at each reporting date, whether there is objective evidence that a financial asset or a group of financial assets is impaired. An impairment exists if one or more events that has occurred since the initial recognition of the asset (an incurred ‘loss event’), has an impact on the estimated future cash flows of the financial asset or the group of financial assets that can be reliably estimated. Evidence of impairment may include indications that the debtors or a group of debtors is experiencing significant financial difficulty, default or delinquency in interest or principal payments, the probability that they will enter bankruptcy or other financial reorganisation and observable data indicating that there is a measurable decrease in the estimated future cash flows, such as changes in arrears or economic conditions that correlate with defaults.
Financial assets carried at amortised cost
For financial assets carried at amortised cost, the Group first assesses whether impairment exists individually for financial assets that are individually significant, or collectively for financial assets that are not individually significant. If the Group determines that no objective evidence of impairment exists for an individually assessed financial asset, whether significant or not, it includes the asset in a group of financial assets with similar credit risk characteristics and collectively assesses them for impairment. Assets that are individually assessed for impairment and for which an impairment loss is, or continues to be, recognised are not included in a collective assessment of impairment.
The amount of any impairment loss identified is measured as the difference between the asset’s carrying amount and the present value of estimated future cash flows (excluding future expected credit losses that have not yet been incurred). The present value of the estimated future cash flows is discounted at the financial asset’s original effective interest rate.
The carrying amount of the asset is reduced through the use of an allowance account and the loss is recognised in profit or loss. Interest income (recorded as finance income in profit or loss) continues to be accrued on the reduced carrying amount and is accrued using the rate of interest used to discount the future cash flows for the purpose of measuring the impairment loss. Loans together with the associated allowance are written off when there is no realistic prospect of future recovery and all collateral has been realised or has been transferred to the Group. If, in a subsequent year, the amount of the estimated impairment loss increases or decreases because of an event occurring after the impairment was recognised, the previously recognised impairment loss is increased or reduced by adjusting the allowance account. If a write-off is later recovered, the recovery is credited to in profit or loss.
Available-for-sale financial investments
For available-for-sale financial investments, the Group assesses at each reporting date whether there is objective evidence that an investment or a group of investments is impaired.
In the case of equity investments classified as available-for-sale, objective evidence would include a significant or prolonged decline in the fair value of the investment below its cost. ‘Significant’ is evaluated against the original cost of the investment and ‘prolonged’ against the period in which the fair value has been below its original cost. Where there is evidence of impairment, the cumulative loss – measured as the difference between the acquisition cost and the current fair value, less any impairment loss on that investment previously recognised in profit or loss – is removed from other comprehensive income and recognised in profit or loss. Impairment losses on equity investments are not reversed through profit or loss; increases in their fair value after impairment are recognised directly in other comprehensive income.
In the case of debt instruments classified as available-for-sale, impairment is assessed based on the same criteria as financial assets carried at amortised cost. However, the amount recorded for impairment is the cumulative loss measured as the difference between the amortised cost and the current fair value, less any impairment loss on that investment previously recognised in profit or loss.
Future interest income continues to be accrued based on the reduced carrying amount of the asset, using the rate of interest used to discount the future cash flows for the purpose of measuring the impairment loss. The interest income is recorded as part of finance income. If, in a subsequent year, the fair value of a debt instrument increases and the increase can be objectively related to an event occurring after the impairment loss was recognised in profit or loss, the impairment loss is reversed through profit or loss.
If there is objective evidence that an impairment loss on an unquoted equity instrument that is not carried at fair value because its fair value cannot be reliably measured, or on a derivative asset that is linked to and must be settled by delivery of such an unquoted equity instrument has been incurred, the amount of the loss is measured as the difference between the asset’s carrying amount and the present value of estimated future cash flows discounted at the current market rate of return for a similar financial asset.
(k) Financial liabilities
Initial recognition and measurement
Financial liabilities are classified, at initial recognition, as financial liabilities at fair value through profit or loss, loans and borrowings, payables, or as derivatives designated as hedging instruments in an effective hedge, as appropriate.
All financial liabilities are recognised initially at fair value and in the case of loans and borrowings, and payables, net of directly attributable transaction costs.
The Group’s financial liabilities include trade and other payables, and loans and borrowings including bank overdrafts.
Subsequent measurement
The measurement of financial liabilities depends on their classification as follows:
Loans and borrowings
After initial recognition, interest bearing loans and borrowings are subsequently measured at amortised cost using the effective interest rate (EIR) method. Gains and losses are recognised in profit or loss when the liabilities are derecognised as well as through the EIR amortisation process.
Amortised cost is calculated by taking into account any discount or premium on acquisition and fees or costs that are an integral part of the EIR. The EIR amortisation is included in finance costs in profit or loss.
Derecognition
A financial liability is derecognised when the obligation under the liability is discharged or cancelled, or expires. When an existing financial liability is replaced by another from the same lender on substantially different terms, or the terms of an existing liability are substantially modified, such an exchange or modification is treated as a derecognition of the original liability and the recognition of a new liability. The difference in the respective carrying amounts is recognised in profit or loss.
(l) Offsetting of financial instruments
Financial assets and financial liabilities are offset and the net amount is reported in the statement of financial position if there is a currently enforceable legal right to offset the recognised amounts and there is an intention to settle on a net basis, to realise the assets and settle the liabilities simultaneously.
(m) Inventories
Inventory items are valued at the lower of cost and net realisable value.
Costs incurred in bringing each product to its present location and conditions are accounted for using the weighted average cost method.
Work-in-progress consists of cost incurred on works performed but not yet completed and invoiced at the reporting date.
Net realisable value (NRV) is the estimated selling price in the ordinary course of business, less estimated costs of completion and the estimated costs necessary to make the sale.
THE UNITED BASALT PRODUCTS LIMITED AND ITS SUBSIDIARIESNOTES TO THE FINANCIAL STATEMENTS FOR THE YEAR ENDED JUNE 30, 2016
THE UNITED BASALT PRODUCTS LIMITED AND ITS SUBSIDIARIESNOTES TO THE FINANCIAL STATEMENTS FOR THE YEAR ENDED JUNE 30, 2016

69
UB
P A
NN
UA
L R
EP
OR
T 2
016
68
UB
P A
NN
UA
L R
EP
OR
T 2
016
2.3 SUMMARY OF SIGNIFICANT ACCOUNTING POLICIES (CONT’D)
(n) Provisions
Provisions are recognised when the Group has a present obligation (legal or constructive) as a result of a past event, it is probable that an outflow of resources embodying economic benefits will be required to settle the obligation and a reliable estimate can be made of the amount of the obligation. Where the Group expects some or all of a provision to be reimbursed, for example under an insurance contract, the reimbursement is recognised as a separate asset but only when the reimbursement is virtually certain. The expense relating to any provision is presented in profit or loss net of any reimbursement.
If the effect of the time value of money is material, provisions are discounted using a current pre-tax rate that reflects, where appropriate, the risks specific to the liability. Where discounting is used, the increase in the provision due to the passage of time is recognised as a finance cost.
(o) Retirement benefit obligations
Defined benefit plan
The Group operates a final salary defined benefit plan, the assets of which are held independently and administered by the Anglo-Mauritius Assurance Society Limited. These benefits are funded. The cost of providing pensions under the plan is determined using the projected unit credit valuation method.
Re-measurements, comprising of actuarial gains and losses, the effect of the asset ceiling, excluding net interest and the return on plan assets (excluding net interest), are recognised immediately in the statement of financial position with a corresponding debit or credit to retained earnings through the other comprehensive income in the period in which they occur. Re-measurements are not reclassified to profit or loss in subsequent periods.
Past service cost are recognised in profit or loss on the earlier of:
• The date of the plan amendment or curtailment, and• The date that the Group recognises restructuring related costs
Net interest is calculated by applying the discount rate to the net defined benefit liability or asset. The Group recognise the following changes in the net defined benefit obligation under administrative expenses in profit or loss:
• Service costs comprising current service costs, past service costs, gains and losses on curtailments and non-routine settlements.• Net interest expense or income
Severance allowance on retirement
For employees that are not covered under any pension plan, the net present value of severance allowances payable under the Employee Rights Act 2008 is calculated independently by a qualified actuary, AON Hewitt Ltd. The expected cost of these benefits is accrued over the service lives of employees on a similar basis to that for the defined benefit plan. The present value of severance allowances has been disclosed as unfunded obligations under employee benefit liability.
(p) Cash and cash equivalents
Cash at bank and on hand in the statement of financial position are measured at amortised cost.
For the purpose of the consolidated statement of cash flows, cash and cash equivalents consist of cash at bank and in hand net of outstanding bank overdrafts.
(q) Distribution to equity holders
The Company recognises a liability to make distributions to equity holders of the parent when the distribution is authorised and the distribution is no longer at the discretion of the Company. A distribution is authorised when it is approved by the Board of Directors. A corresponding amount is recognised directly in equity.
(r) Impairment of non-financial assets
The Group assesses at each reporting date whether there is an indication that an asset may be impaired. If any indication exists, or when annual impairment testing for an asset is required, the Group estimates the asset’s recoverable amount. An asset’s recoverable amount is the higher of an asset’s or cash-generating units (CGU) fair value less costs of disposal and its value in use. Recoverable amount is determined for an individual asset, unless the asset does not generate cash inflows that are largely independent of those from other assets or groups of assets. Where the carrying amount of an asset or CGU exceeds its recoverable amount, the asset is considered impaired and is written down to its recoverable amount.
In assessing value in use, the estimated future cash flows are discounted to their present value using a pre-tax discount rate that reflects current market assessments of the time value of money and the risks specific to the asset. In determining fair value less costs of disposal, recent market transactions are taken into account, if available. If no such transactions can be identified, an appropriate valuation model is used. These calculations are corroborated by valuation multiples, quoted share prices for publicly traded companies or other available fair value indicators.
The Group bases its impairment calculation on detailed budgets and forecast calculations, which are prepared separately for each of the Group’s CGUs to which the individual assets are allocated. These budgets and forecast calculations generally cover a period of five years. For longer periods, a long-term growth rate is calculated and applied to project future cash flows after the fifth year.
Impairment losses of continuing operations, including impairment on inventories, are recognised in statement of profit or loss in expense categories consistent with the function of the impaired asset, except for a property previously revalued with the revaluation was taken to other comprehensive income. In this case, the impairment is also recognised in other comprehensive income up to the amount of any previous revaluation.
For assets excluding goodwill, an assessment is made at each reporting date as to whether there is any indication that previously recognised impairment losses may no longer exist or may have decreased. If such indication exists, the Group estimates the asset’s or cash-generating unit’s recoverable amount. A previously recognised impairment loss is reversed only if there has been a change in the assumptions used to determine the asset’s recoverable amount since the last impairment loss was recognised. The reversal is limited so that the carrying amount of the asset does not exceed its recoverable amount, nor exceed the carrying amount that would have been determined, net of depreciation, had no impairment loss been recognised for the asset in prior years. Such reversal is recognised in profit or loss unless the asset is carried at a revalued amount, in which case, the reversal is treated as a revaluation increase.
The following criteria are also applied in assessing impairment of specific assets:
Goodwill
Goodwill is tested for impairment annually at the reporting date, and when circumstances indicate that the carrying value may be impaired. Impairment is determined for goodwill by assessing the recoverable amount of each cash-generating unit (or group of cash-generating units) to which the goodwill relates. When the recoverable amount of the cash generating unit is less than their carrying amount, an impairment loss is recognised. Impairment losses relating to goodwill cannot be reversed in future periods.
Intangible assets
Intangible assets with indefinite useful lives are tested for impairment annually at each reporting date; either individually or at the cash-generating unit level, as appropriate and when circumstances indicate that the carrying value may be impaired.
(s) Leases
The determination of whether an arrangement is (or contains) a lease is based on the substance of the arrangement at inception date. The arrangement is assessed for whether fulfilment of the arrangement is dependent on the use of a specific asset or assets or the arrangement conveys a right to use the asset, even if that right is not explicitly specified in an arrangement.
Group as a lessee
A lease is classified at the inception date as a finance lease or an operating lease. A lease that transfers substantially at the risks and records accidental to ownership to the Group is classified as a finance lease.
Finance leases that transfer substantially all the risks and benefits incidental to ownership of the leased item to the Group, are capitalised at the commencement of the lease at the fair value of the leased asset or, if lower, at the present value of the minimum lease payments. Lease payments are apportioned between finance charges and reduction of the lease liability so as to achieve a constant rate of interest on the remaining balance of the liability. Finance charges are recognised in finance costs in profit or loss.
THE UNITED BASALT PRODUCTS LIMITED AND ITS SUBSIDIARIESNOTES TO THE FINANCIAL STATEMENTS FOR THE YEAR ENDED JUNE 30, 2016
THE UNITED BASALT PRODUCTS LIMITED AND ITS SUBSIDIARIESNOTES TO THE FINANCIAL STATEMENTS FOR THE YEAR ENDED JUNE 30, 2016

71
UB
P A
NN
UA
L R
EP
OR
T 2
016
70
UB
P A
NN
UA
L R
EP
OR
T 2
016
2.3 SUMMARY OF SIGNIFICANT ACCOUNTING POLICIES (CONT’D)
(s) Leases (Cont’d)
Group as a lessee (Cont’d)
A leased asset is depreciated over the useful life of the asset. However, if there is no reasonable certainty that the Group will obtain ownership by the end of the lease term, the asset is depreciated over the shorter of the estimated useful life of the asset and the lease term.
Operating lease payments are recognised as an operating expense in profit or loss on a straight-line basis over the lease term.
Group as a lessor
Leases in which the Group does not transfer substantially all the risks and benefits of ownership of the asset are classified as operating leases. Initial direct costs incurred in negotiating an operating lease are added to the carrying amount of the leased asset and recognised over the lease term on the same basis as rental income. Contingent rents are recognised as revenue in the period in which they are earned.
Rental income
Rental income arising from investment properties under operating leases is accounted for on a straight-line basis over the lease terms and is included in revenue in profit or loss due to its operating nature.
(t) Borrowing costs
Borrowing costs directly attributable to the acquisition, construction or production of an asset that necessarily takes a substantial period of time to get ready for its intended use or sale are capitalised as part of the cost of the asset. All other borrowing costs are expensed in the period in which they occur. Borrowing costs consist of interest and other costs that an entity incurs in connection with the borrowing of funds.
(u) Revenue
Revenue is recognised to the extent that it is probable that the economic benefits will flow to the Group and the revenue can be reliably measured, regardless of when the payment is being made. Revenue is measured at the fair value of the consideration received or receivable, taking into account contractually defined terms of payment and excluding taxes or duty. The Group has concluded that it is the principal in all of its revenue arrangements since it is the primary obligor in all the revenue arrangements, has pricing latitude and is also exposed to inventory and credit risks.
The specific recognition criteria described below must also be met before revenue is recognised.
Sales of goods
Revenue from the sale of goods is recognised when the significant risks and rewards of ownership of the goods have passed to the buyer, usually on delivery of the goods. Revenue from sugar is recognised based on amount produced and delivered on a sugar price based on the recommendation of the Mauritius Chamber of Agriculture after consultation with the Mauritius Sugar Syndicate.
Rendering of services
Revenue from rendering of services is recognised by reference to the stage of completion. When the contract outcome cannot be measured reliably, revenue is recognised to the extent that the expenses incurred are eligible to be recovered.
Interest income
For all financial instruments measured at amortised cost and interest bearing financial assets classified as available for sale, interest income is recorded using the effective interest rate (EIR). EIR is the rate that exactly discounts the estimated future cash payments or receipts over the expected life of the financial instrument or a shorter period, where appropriate, to the net carrying amount of the financial asset or liability. Interest income is included in finance income in profit or loss.
Dividend income
Dividend income is recognised when the Group’s right to receive the payment is established, which is generally when the board of Directors of the investee declare the dividend.
(v) Taxes
Current tax
Current tax assets and liabilities for the current and prior periods are measured at the amount expected to be recovered from or paid to the taxation authorities. The tax rates and tax laws used to compute the amount are those that are enacted or substantively enacted at the reporting date, in the countries where the Group operates and generates taxable income.
Current tax relating to items recognised directly in equity is recognised in equity and not in profit or loss. Management periodically evaluates positions taken in the tax returns with respect to situations in which applicable tax regulations are subject to interpretation and establishes provisions where appropriate.
Deferred income tax
Deferred tax is provided using the liability method on temporary differences between the tax bases of assets and liabilities and their carrying amounts for financial reporting purposes at the reporting date.
Deferred tax liabilities are recognised for all taxable temporary differences, except:
• where the deferred tax liability arises from the initial recognition of goodwill or of an asset or liability in a transaction that is not a business combination and, at the time of the transaction, affects neither the accounting profit nor taxable profit or loss; and
• in respect of taxable temporary differences associated with investments in subsidiaries, associates and interests in joint ventures, where the timing of the reversal of the temporary differences can be controlled and it is probable that the temporary differences will be reversed in the foreseeable future.
Deferred tax assets are recognised for all deductible temporary differences, the carry-forward of unused tax credits and unused tax losses. Deferred tax assets are recognised to the extent that it is probable that taxable profit will be available against which the deductible temporary differences, and the carry-forward of unused tax credits and unused tax losses can be utilised except:
• where the deferred tax asset relating to the deductible temporary difference arises from the initial recognition of an asset or liability in a transaction that is not a business combination and, at the time of the transaction, affects neither the accounting profit nor taxable profit or loss; and
• in respect of deductible temporary differences associated with investments in subsidiaries, associates and interests in joint ventures, deferred tax assets are recognised only to the extent that it is probable that the temporary differences will reverse in the foreseeable future and taxable profit will be available against which the temporary differences can be utilised.
The carrying amount of deferred tax assets is reviewed at each reporting date and reduced to the extent that it is no longer probable that sufficient taxable profit will be available to allow all or part of the deferred income tax asset to be utilised. Unrecognised deferred tax assets are reassessed at each reporting date and are recognised to the extent that it has become probable that future taxable profit will allow the deferred tax asset to be recovered.
Deferred tax assets and liabilities are measured at the tax rates that are expected to apply in the year when the asset is realised or the liability is settled, based on tax rates (and tax laws) that have been enacted or substantively enacted at the reporting date.
THE UNITED BASALT PRODUCTS LIMITED AND ITS SUBSIDIARIESNOTES TO THE FINANCIAL STATEMENTS FOR THE YEAR ENDED JUNE 30, 2016
THE UNITED BASALT PRODUCTS LIMITED AND ITS SUBSIDIARIESNOTES TO THE FINANCIAL STATEMENTS FOR THE YEAR ENDED JUNE 30, 2016

73
UB
P A
NN
UA
L R
EP
OR
T 2
016
72
UB
P A
NN
UA
L R
EP
OR
T 2
016
2.3 SUMMARY OF SIGNIFICANT ACCOUNTING POLICIES (CONT’D)
(v) Taxes (Cont’d)
Deferred income tax (Cont’d)
Deferred tax relating to items recognised outside profit or loss is recognised outside of profit or loss. Deferred tax items are recognised in correlation to the underlying transaction either in other comprehensive income or directly in equity.
Deferred tax assets and deferred tax liabilities are offset, if a legally enforceable right exists to set off current tax assets against current tax liabilities and the deferred income taxes relate to the same taxable entity and the same taxation authority.
Tax benefits acquired as part of a business combination, but not satisfying the criteria for separate recognition at that date, are recognised subsequently if new information about facts and circumstances change. The adjustment is either treated as a reduction to goodwill (as long as it does not exceed goodwill) if it was incurred during the measurement period or recognised in statement of profit or loss.
Value Added Tax
Revenues, expenses and assets are recognised net of the amount of value added tax except:
• where the value added tax incurred on a purchase of assets or services is not recoverable from the taxation authority, in which case the value added tax is recognised as part of the cost of acquisition of the asset or as part of the expense item as applicable; and
• receivables and payables that are stated with the amount of value added tax included.
The net amount of value added tax recoverable from, or payable to, the taxation authority is included as part of receivables or payables in the statement of financial position.
Corporate Social Responsibility
In line with the definition within the Income Tax Act 1995, Corporate Social Responsibility (CSR) is regarded as a tax and is therefore subsumed with the income tax shown on the statement of comprehensive income and the income tax liability on the statement of financial position.
The CSR charge for the current period is measured at the amount expected to be paid to the Mauritian tax authorities. The CSR rate and laws used to compute the amount are those charged or substantively enacted by the reporting date.
(w) Segmental reporting
A business segment is a group of assets and operations engaged in providing products or services that are subject to risks and returns that are different from those of other business segments.
The Group’s business segments consist of core business activities, retail and agriculture. Most of its activity is performed in Mauritius.
(x) Non-current asset held for sale
Non-current assets and disposal groups are classified as held for sale if their carrying amount will be recovered principally through a sale transaction rather than through continuing use. This condition is regarded as met only when the asset (or disposal group) is available for immediate sale in its present condition subject only to terms that are usual and customary for sales of such asset (or disposal group) and its sale is highly probable. Management must be committed to the sale, which should be expected to qualify for recognition as a completed sale within one year from the date of classification.
Non-current assets (and disposal groups) classified as held for sale are measured at the lower of their previous carrying amount and fair value less costs to sell.
Property, plant and equipment is not depreciated once classified as held for sale. Assets classified as held for sale for are presented separately as current items in the statement of financial position.
2.4 CHANGES IN ACCOUNTING POLICIES AND DISCLOSURES
New and amended standards and interpretations
The accounting policies adopted are consistent with those of the previous year. There were no new standards and interpretations which were effective for this financial year.
2.5 ACCOUNTING STANDARDS AND INTERPRETATIONS ISSUED BUT NOT YET EFFECTIVE
Standards and interpretations issued but not yet effective up to the date of issuance of the Group’s financial statements are listed below. This listing is of standards and interpretations issued, which the Group reasonably expects to be applicable at a future date. The Group intends to adopt those standards when they become effective.
Effective for accounting period beginning on
or after
IFRS 9 Financial Instruments January 1, 2018
IFRS 15 Revenue from Contracts with Customers January 1, 2018
IFRS 16 Leases January 1, 2019
Sale or contribution of assets between an investor and its associate or joint venture (Amendments to IFRS 10 and IAS 28) *
Accounting for Acquisitions of Interests in Joint Operations (Amendments to IFRS 11) January 1, 2016
Clarification of Acceptable Methods of Depreciation and Amortisation (Amendments to IAS 16 and IAS 38) January 1, 2016
Agriculture: Bearer Plants (Amendments to IAS 16 and IAS 41) January 1, 2016
Amendments to IAS 27: Equity Method in Separate Financial Statement January 1, 2016
Annual improvements 2012 – 2014 Cycle July 1, 2016
Disclosure initiative – Amendments to IAS 1 January 1, 2016
All other new standards/amendments that are not yet effective are not considered to have a significant impact on the Group.
*In December 2015, the IASB postponed the effective date indefinitely pending the outcome of its research project on the equity method of accounting
IFRS 9 Financial Instruments – Classification and measurement of financial assets, Accounting for financial liabilities and derecognition – effective January 1, 2018.
IFRS 9 introduces new requirements for classifying and measuring financial assets, as follows:
Classification and measurement of financial assets
All financial assets are measured at fair value on initial recognition, adjusted for transaction costs if the instrument is not accounted for at fair value through profit or loss (FVTPL). Debt instruments are subsequently measured at FVTPL, amortised cost or fair value through other comprehensive income (FVOCI), on the basis of their contractual cash flows and the business model under which the debt instruments are held. There is a fair value option (FVO) that allows financial assets on initial recognition to be designated as FVTPL if that eliminates or significantly reduces an accounting mismatch. Equity instruments are generally measured at FVTPL. However, entities have an irrevocable option on an instrument-by-instrument basis to present changes in the fair value of non-trading instruments in other comprehensive income (OCI) (without subsequent reclassification to profit or loss). Classification and measurement of financial liabilities
For financial liabilities designated as FVTPL using the FVO, the amount of change in the fair value of such financial liabilities that is attributable to changes in credit risk must be presented in OCI. The remainder of the change in fair value is presented in profit or loss, unless presentation of the fair value change in respect of the liability’s credit risk in OCI would create or enlarge an accounting mismatch in profit or loss. All other IAS 39 Financial Instruments: Recognition and Measurement classification and measurement requirements for financial liabilities have been carried forward into IFRS 9, including the embedded derivative separation rules and the criteria for using the FVO.
THE UNITED BASALT PRODUCTS LIMITED AND ITS SUBSIDIARIESNOTES TO THE FINANCIAL STATEMENTS FOR THE YEAR ENDED JUNE 30, 2016
THE UNITED BASALT PRODUCTS LIMITED AND ITS SUBSIDIARIESNOTES TO THE FINANCIAL STATEMENTS FOR THE YEAR ENDED JUNE 30, 2016

75
UB
P A
NN
UA
L R
EP
OR
T 2
016
74
UB
P A
NN
UA
L R
EP
OR
T 2
016
2.5 ACCOUNTING STANDARDS AND INTERPRETATIONS ISSUED BUT NOT YET EFFECTIVE (CONT’D)
IFRS 9 Financial Instruments – Classification and measurement of financial assets, Accounting for financial liabilities and derecognition – effective January 1, 2018 (Cont’d)
Impairment
The impairment requirements are based on an expected credit loss (ECL) model that replaces the IAS 39 incurred loss model. The ECL model applies to: debt instruments accounted for at amortised cost or at FVOCI; most loan commitments; financial guarantee contracts; contract assets under IFRS 15; and lease receivables under IAS 17 Leases. Entities are generally required to recognise either 12-months’ or lifetime ECL, depending on whether there has been a significant increase in credit risk since initial recognition (or when the commitment or guarantee was entered into). For some trade receivables, the simplified approach may be applied whereby the lifetime expected credit losses are always recognised.
Hedge accounting
Hedge effectiveness testing is prospective, without the 80% to 125% bright line test in IAS 39, and, depending on the hedge complexity, can be qualitative. A risk component of a financial or non-financial instrument may be designated as the hedged item if the risk component is separately identifiable and reliably measureable. The time value of an option, any forward element of a forward contract and any foreign currency basis spread, can be excluded from the designation as the hedging instrument and accounted for as costs of hedging. More designations of groups of items as the hedged item are possible, including layer designations and some net positions.
The application of IFRS 9 may change the measurement and presentation of many financial instruments, depending on their contractual cash flows and business model under which they are held. The impairment requirements will generally result in earlier recognition of credit losses. The new hedging model may lead to more economic hedging strategies meeting the requirements for hedge accounting.The impact of the new standard is currently being assessed.
IFRS 15 Revenue from Contracts with Customers - effective January 1, 2018
IFRS 15 provides a single, principles based five-step model to be applied to all contracts with customers.
The five steps in the model are as follows:
• Identify the contract with the customer;• Identify the performance obligations in the contract;• Determine the transaction price;• Allocate the transaction price to the performance obligations in the contracts; and • Recognise revenue when (or as) the entity satisfies a performance obligation.
Guidance is provided on topics such as the point in which revenue is recognised, accounting for variable consideration, costs of fulfilling and obtaining a contract and various related matters. New disclosures about revenue are also introduced.
The Group is still assessing the impact of this new standard, but it is not expected to have a significant effect on financial performance. There may be an impact on the level of disclosure provided.
Sale or contribution of assets between an investor and its associate or joint venture (Amendments to IFRS 10 and IAS 28) - effective January 1, 2016
This amendment to IFRS 10 Consolidated Financial Statements and IAS 28 Investments in Associates and Joint Ventures (2011) was made to clarify the treatment of the sale or contribution of assets from an investor to its associate or joint venture, as follows:
• it requires full recognition in the investor’s financial statements of gains and losses arising on the sale or contribution of assets that constitute a business (as defined in IFRS 3 Business Combinations); and
• it requires the partial recognition of gains and losses where the assets do not constitute a business, i.e. a gain or loss is recognised only to the extent of the unrelated investors’ interests in that associate or joint venture.
These requirements apply regardless of the legal form of the transaction, e.g. whether the sale or contribution of assets occurs by an investor transferring shares in a subsidiary that holds the assets (resulting in loss of control of the subsidiary), or by the direct sale of the assets themselves.
The Directors will assess the impact of the amendments when they become effective. Accounting for Acquisitions of Interests in Joint Operations (Amendments to IFRS 11) - effective January 1, 2016
Amends IFRS 11 Joint Arrangements to require an acquirer of an interest in a joint operation in which the activity constitutes a business (as defined in IFRS 3 Business Combinations) to:
• Apply all of the business combinations accounting principles in IFRS 3 and other IFRSs, except for those principles that conflict with the guidance in IFRS 11
• Disclose the information required by IFRS 3 and other IFRSs for business combinations.
The amendments apply both to the initial acquisition of an interest in joint operation, and the acquisition of an additional interest in a joint operation (in the latter case, previously held interests are not remeasured).
The amendment will not have an impact since the Group does not have any interests in joint operations.
Clarification of Acceptable Methods of Depreciation and Amortisation (Amendments to IAS 16 and IAS 38) - effective January 1, 2016
Amends IAS 16 Property, Plant and Equipment and IAS 38 Intangible Assets to:
• Clarify that a depreciation method that is based on revenue that is generated by an activity that includes the use of an asset is not appropriate for property, plant and equipment;
• Introduce a rebuttable presumption that an amortisation method that is based on the revenue generated by an activity that includes the use of an intangible asset is inappropriate, which can only be overcome in limited circumstances where the intangible asset is expressed as a measure of revenue, or when it can be demonstrated that revenue and the consumption of the economic benefits of the intangible asset are highly correlated; and
• Add guidance that expected future reductions in the selling price of an item that was produced using an asset could indicate the expectation of technological or commercial obsolescence of the asset, which, in turn, might reflect a reduction of the future economic benefits embodied in the asset.
The amendment will not have an impact since the Group does not use a depreciation method based on revenue for its plant and equipment and intangible assets.
Agriculture: Bearer Plants (Amendments to IAS 16 and IAS 41) - effective January 1, 2016
Amends IAS 16 - Property, Plant and Equipment and IAS 41 - Agriculture to:
• Include ‘bearer plants’ within the scope of IAS 16 rather than IAS 41, allowing such assets to be accounted for a property, plant and equipment and measured after initial recognition on a cost or revaluation basis in accordance with IAS 16;
• Introduce a definition of ‘bearer plants’ as a living plant that is used in the production or supply of agricultural produce, is expected to bear produce for more than one period and has a remote likelihood of being sold as agricultural produce, except for incidental scrap sales; and
• Clarify that produce growing on bearer plants remains within the scope of IAS 41.
The Group early adopted these amendments and there was no impact on the financial position and performance of the Group.
Amendments to IAS 27: Equity Method in Separate Financial Statements - effective January 1, 2016
The amendments will allow entities to use the equity method to account for investments in subsidiaries, joint ventures and associates in their separate financial statements. Entities already applying IFRS and electing to change to the equity method in its separate financial statements will have to apply that change retrospectively.
For first-time adopters of IFRS electing to use the equity method in its separate financial statements, they will be required to apply this method from the date of transition to IFRS. The amendments are effective for annual periods beginning on or after January 1, 2016, with early adoption permitted.
The Group is still assessing whether to adopt this change in IAS 27.
THE UNITED BASALT PRODUCTS LIMITED AND ITS SUBSIDIARIESNOTES TO THE FINANCIAL STATEMENTS FOR THE YEAR ENDED JUNE 30, 2016
THE UNITED BASALT PRODUCTS LIMITED AND ITS SUBSIDIARIESNOTES TO THE FINANCIAL STATEMENTS FOR THE YEAR ENDED JUNE 30, 2016

77
UB
P A
NN
UA
L R
EP
OR
T 2
016
76
UB
P A
NN
UA
L R
EP
OR
T 2
016
2.5 ACCOUNTING STANDARDS AND INTERPRETATIONS ISSUED BUT NOT YET EFFECTIVE (CONT’D)
Amendments to IAS 27: Equity Method in Separate Financial Statements - effective January 1, 2016 (Cont’d)
The amendments to IAS 27 Separate Financial Statements allow an entity to use the equity method as described in IAS 28 to account for its investments in subsidiaries, joint ventures and associates in its separate financial statements. Therefore, an entity must account for these investments either:
• At cost• In accordance with IFRS 9 (or IAS 39) Or• Using the equity method
The amendment is not expected to have an impact, as the Company will continue to recognise investments in subsidiaries and associates at cost in the separate financial statements.
Annual improvements 2012 – 2014 Cycle - effective July 1, 2016
The annual improvements 2012-2014 Cycle make amendments to the following standards:
• IFRS 5 - Adds specific guidance in IFRS 5 for cases in which an entity reclassifies an asset from held for sale to held for distribution or vice versa and cases in which held-for-distribution accounting is discontinued;
• IFRS 7 – Additional guidance given to clarify whether a servicing contract is continuing involvement in a transferred assets, and clarification made on offsetting disclosures in condensed interim financial statements;
• IAS 19 – Clarifies that the high quality corporate bonds used in estimating the discount rate for post-employment benefits should be denominated in the same currency as the benefits to be paid; and
• IAS 34 – Clarifies the meaning of “elsewhere in the interim report” and require a cross reference.
The Directors will assess the impact of the amendments when they become effective.
Disclosure Initiative (Amendments to IAS 1) - effective January 1, 2016
Amends IAS 1 Presentation of Financial Statements to address perceived impediments to preparers exercising their judgement in presenting their financial reports by making the following changes:
• clarification that information should not be obscured by aggregating or by providing immaterial information, materiality considerations apply to the all parts of the financial statements, and even when a standard requires a specific disclosure, materiality considerations do apply;
• clarification that the list of line items to be presented in these statements can be disaggregated and aggregated as relevant and additional guidance on subtotals in these statements and clarification that an entity’s share of OCI of equity-accounted associates and joint ventures should be presented in aggregate as single line items based on whether or not it will subsequently be reclassified to profit or loss; and
• additional examples of possible ways of ordering the notes to clarify that understandability and comparability should be considered when determining the order of the notes and to demonstrate that the notes need not be presented in the order so far listed in paragraph 114 of IAS 1.
No early adoption of these standards and interpretations is intended by the Board of Directors.
2.6 PRIOR PERIOD RESTATEMENT
The restatement relates to the following:
• Prior year adjustment made to an overseas subsidiary’s financial statements as a result of its payables being understated. The Group financial statements were restated accordingly;
• Recurring eliminating entries made with respect to capital reduction of a subsidiary not properly performed. The payables, translation reserves and retained earnings were misstated.
To correct the above, in accordance with the provisions of IAS 8 ‘Accounting Policies, Changes in Accounting Estimates and Errors’, the figures were recalculated and comparatives have been restated for the Group, with adjustments made to the following captions: retained earnings, translation reserves, non-controlling interests and trade and other payables in the Statement of Financial Position. There was no impact to the Company’s reported figures. The following adjustments were made to the comparatives for the Group:
Statement of financial position and statement of changes in equity:
2014 (000’s) 2015 (000’s)
As previously stated Adjustments As restated As previously
stated Adjustments As restated
Retained earnings 1,144,878 (101,806) 1,043,072 1,192,814 (101,806) 1,091,008
Translation reserves 60,645 (47,286) 13,359 62,631 (47,286) 15,345
Non-controlling interest 55,582 (16,284) 39,298 57,132 (16,284) 40,848
Net assets 2,822,054 (165,376) 2,656,678 2,780,160 (165,376) 2,614,784
Statement of profit or loss and other comprehensive income:
The restatement had no impact on the statement of profit or loss and other comprehensive income.
3. SIGNIFICANT ACCOUNTING JUDGEMENTS, ESTIMATES AND ASSUMPTIONS The preparation of the consolidated and separate financial statements requires management to make judgments, estimates and assumptions that affect the reported amounts of revenues, expenses, assets and liabilities, and the accompanying disclosures, and the disclosure of contingent liabilities. Uncertainty about these assumptions and estimates could result in outcomes that require a material adjustment to the carrying amount of the asset or liability affected in future periods.
Judgements
In the process of applying the Group’s accounting policies, management has made the following judgments, which have the most significant effect on the amounts recognised in the consolidated financial statements:
Operating Lease Commitments - Group as Lessee
The entity has entered into leases for motor vehicles and plant and equipment. The Group has classified these leases as operating leases where it has determined that it does not retain all the significant risks and rewards of ownership of these assets.
Capitalisation of spare parts
Spare parts and servicing equipment which have an expected life of more than one year, usually in connection to the life of specific item of property, plant and equipment are classified as property, plant and equipment. They are depreciated over the shorter of the life of the spare or the item of property, plant and equipment they are attached to. All other spares are recognised as inventories and expensed in profit or loss upon consumption.
Estimates and assumptions
The key assumptions concerning the future and other key sources of estimation uncertainty at the reporting date, that have a significant risk of causing a material adjustment to the carrying amounts of assets and liabilities within the next financial year, are described below. The Group based its assumptions and estimates on parameters available when the consolidated financial statements were prepared. Existing circumstances and assumptions about future developments however, may change due to market changes or circumstances arising beyond the control of the Group. Such changes are reflected in the assumptions when they occur.
Useful lives and residual values of property, plant and equipment
Determining the carrying amounts of property, plant and equipment requires the estimation of the useful lives and residual values of these assets which carry a degree of uncertainty. The Directors have used historical information relating to the Group and the relevant industries in which the Group’s entities operate in order to best determine the useful lives and residual values of property, plant and equipment. There has been no impact on the re-assessment made by management.
THE UNITED BASALT PRODUCTS LIMITED AND ITS SUBSIDIARIESNOTES TO THE FINANCIAL STATEMENTS FOR THE YEAR ENDED JUNE 30, 2016
THE UNITED BASALT PRODUCTS LIMITED AND ITS SUBSIDIARIESNOTES TO THE FINANCIAL STATEMENTS FOR THE YEAR ENDED JUNE 30, 2016

79
UB
P A
NN
UA
L R
EP
OR
T 2
016
78
UB
P A
NN
UA
L R
EP
OR
T 2
016
3. SIGNIFICANT ACCOUNTING JUDGEMENTS, ESTIMATES AND ASSUMPTIONS (CONT”D) Estimates and assumptions (Cont’d)
Revaluation of property, plant and equipment
The Group measures land and buildings at revalued amounts with changes in fair value being recognised in other comprehensive income. The fair values are determined by independent professional valuers by reference to market-based evidence, using comparable prices adjusted for specific market factors such as nature, location and condition of the properties. Refer to note 5.
Valuation of standing cane
The fair value of biological assets is based on the estimated net present value of future cash flows for the coming crop. The standing cane valuation has been arrived at based on an estimate of the future cash flows arising on a normal crop with sugar proceeds being adjusted for the drop in sugar price as well as estimated foreign currency movements and budgeted costs and applying a suitable discount rate in order to calculate the net present value. Refer to note 14 for key assumptions used to determine valuation of standing cane.
Valuation of plants
The fair value of plants is based on the estimated net present value of future cash flows for the coming crops. Standing plants has been arrived at based on an estimate of the future cash flows arising on a normal crop less budgeted costs discounted at a suitable rate in order to calculate the net present value. Refer to note 14 for key assumptions used to determine valuation of plants.
Allowance for doubtful debts An allowance for doubtful debts is determined using a combination of factors to ensure that the trade receivables are not overstated due to uncollectibility. The allowance for doubtful debts for all customers is based on a variety of factors, including the overall quality and ageing of the receivables, continuing credit evaluation of the customer’s financial conditions. Also, specific provisions for individual accounts are recorded when the Group becomes aware of the customer’s inability to meet its financial obligation such as in the case of deterioration in the customers operating results or financial position. Refer to note 17.
Estimated impairment of goodwill
Determining whether goodwill is impaired requires an estimation of the value in use of the cash-generating units to which goodwill has been allocated. The value in use calculation requires the entity to estimate the future cash flows expected to arise from the cash generating units and a suitable discount rate in order to calculate present value. Refer to note 8 for key assumptions used.
Pension benefits The cost of defined benefit pension plans and the present value of pension obligation are determined using actuarial valuations. The actuarial valuation involves making assumptions about discount rates, expected rates of return on assets, future salary increases, mortality rates and future pension increases. Due to the complexity of the valuation, the underlying assumptions and its long-term nature, a defined benefit obligation is highly sensitive to changes in these assumptions. All assumptions are reviewed at each reporting date. Refer to note 21.
Fair value of financial instruments Where the fair value of financial assets and financial liabilities recorded in the statement of financial position cannot be derived from active markets, their fair value is determined using valuation techniques including the discounted cash flow model. The inputs to these models are taken from observable markets where possible, but where this is not feasible, a degree of judgment is required in establishing fair values. The judgments include considerations of inputs such as liquidity risk, credit risk and volatility. Changes in assumptions about these factors could affect the reported fair value of financial instruments. Refer to note 11.
Recognition of deferred tax assets
Deferred tax assets are recognised for all unused tax losses to the extent that is probable that taxable profit will be available against which losses can be utilised. Significant management judgement is required to determine the amount of deferred tax assets that can be recognised, based upon the likely timing and level of future taxable profits together with future tax planning strategies.
4. FINANCIAL RISK MANAGEMENT OBJECTIVES AND POLICIES
The Group’s principal financial liabilities comprise bank loans and overdrafts, finance leases, loan from shareholders, debentures, and trade and payables. The main purpose of these financial liabilities is to finance the Group’s operations. The Group’s principal financial assets included loans and receivables, trade and other receivables, and cash at bank and on hand that arise directly from its operations. The Group also holds available-for-sale investments.
The Group is exposed to market risk, credit risk and liquidity risk. The Group’s senior management oversees the management of these risks. Senior management ensures that the Group’s financial risk-taking activities are governed by appropriate policies and procedures and that financial risks are identified, measured and managed in accordance with group policies and group risk objectives.
A description of the various risks to which the Group is exposed is shown below as well as the approach taken by management to control and mitigate those risks.
(a) Market risk
Market risk is the risk that the fair value of future cash flows of a financial instrument will fluctuate because of changes in market prices. Market risk to which the Group is exposed comprises three types of risk: interest rate risk, foreign currency risk, and equity price risk. Financial instruments affected by market risk include loans and borrowings, available-for-sale investments, and trade and other payables. The sensitivity analyses in the following sections relate to the position as at June 30, 2016 and 2015.
(i) Interest rate risk
Interest rate risk is the risk that the fair value or future cash flows of a financial instrument will fluctuate because of changes in market interest rates. The Group’s exposure to the risk of changes in market interest rates relates primarily to the Group’s debt obligations with floating interest rates.
The Group’s income and operating cash flows are subject to the risks of changes in market interest rates.
The Group’s policy is to manage its interest risk using a mix of fixed and variable rate debts.
Interest rate sensitivity
The following table demonstrates through the impact on floating rate borrowings the sensitivity of the Group’s and the Company’s profit before tax to a reasonable possible change in interest rates with all other variables held constant. There is no impact on the Group’s and the Company’s equity.
THE GROUP THE COMPANY
Increase/(decrease) in basis point 2016 2015 2016 2015
Rs’000 Rs’000 Rs’000 Rs’000
+ 50% 3,296 3,677 (3,217) (3,677)
- 25% (1,648) (1,838) 1,608 1,838
THE UNITED BASALT PRODUCTS LIMITED AND ITS SUBSIDIARIESNOTES TO THE FINANCIAL STATEMENTS FOR THE YEAR ENDED JUNE 30, 2016
THE UNITED BASALT PRODUCTS LIMITED AND ITS SUBSIDIARIESNOTES TO THE FINANCIAL STATEMENTS FOR THE YEAR ENDED JUNE 30, 2016

81
UB
P A
NN
UA
L R
EP
OR
T 2
016
80
UB
P A
NN
UA
L R
EP
OR
T 2
016
4. FINANCIAL RISK MANAGEMENT OBJECTIVES AND POLICIES (CONT’D)
(a) Market risk (cont’d)
(ii) Foreign currency risk
Foreign currency risk is the risk that the fair value or future cash flows of a financial instrument will fluctuate because of changes in foreign exchange rates.
The Group has transactional currency exposures. Such exposure arises from sales or purchases by an operating unit in currencies other than the unit of the functional currency. While revenue is generated principally in the functional currency, significant expenditures are incurred in Euro and US Dollars. The Group does not have a policy to hedge against foreign currency risk.
Foreign currency sensitivity
The following table demonstrates due to changes in the fair value of monetary assets and liabilities the sensitivity of the Group’s profit after tax to a reasonably possible change in Euro and US Dollars exchange rates, with all other variables held constant. There is no impact on the Group’s equity.
THE GROUP THE COMPANY
Increase/(decrease) in exchange rate 2016 2015 2016 2015
Rs’000 Rs’000 Rs’000 Rs’000
Euro +5% (1,676) (1,738) (775) (922)
Euro -10% 3,352 3,477 1,449 1,844
US Dollar +5% 1,379 (493) 1,471 (2)
US Dollar -10% (2,758) 986 (2,941) 4
South African Rand +5% 78 174 (11) (2)
South African Rand -10% (156) (394) 22 5
Singapore Dollar +5% - (4) - (4)
Singapore Dollar -10% - 7 - 7
Pound Sterling +5% (1) - (1) -
Pound Sterling -10% 3 - 3 -
(iii) Equity price risk
The Group’s listed and unlisted equity securities are susceptible to market price risk arising from uncertainties about future values of the investment securities.
The following table demonstrates the impact of a reasonably possible change in the equity prices, with all other variables held constant, on the Group’s and the Company’s profit after tax or equity, depending on whether the decline is significant or prolonged.
THE GROUP THE COMPANY
Increase/(decrease) in equity prices 2016 2015 2016 2015
Rs’000 Rs’000 Rs’000 Rs’000
+5% 155 145 138 125
-10% (86) (54) 28 (25)
(b) Credit risk
Credit risk is the risk that counterparty will not meet its obligations under a financial instrument or customer contract, leading to a financial loss. The Group is exposed to credit risk from its operating activities and from its financing activities, including trade and other receivables and cash at bank.
Trade receivables
Customer credit risk is managed to the Group’s established policy, procedures and control relating to customer credit risk management. The Group has established internal policies to determine the credit worthiness and reliability of potential customers.
’Based on the ageing, debtors who have exceeded their credit terms are identified and followed up. Following assessment of the credit quality and discussion with the customers, the amounts are either impaired or considered past due and not impaired. In addition, trade receivables are also grouped into homogeneous groups and assessed for collective impairment. The maximum exposure to credit risk at the reporting date is the carrying value of each class of financial assets disclosed in note 17, excluding prepayments. The Group evaluates the concentration of risk with respect to trade receivables as low, as its customers are diversified and located in well-established industries and markets.
Financial instruments and cash at bank
Credit risk from balances with banks and financial institutions is managed by the Group’s treasury department in accordance with the Group’s policy. Counterparty credit limits are reviewed by the Group’s Senior Management on an annual basis, and may be updated throughout the year. The limits are set to minimise the concentration of risks and therefore mitigate financial loss through potential counterparty’s failure. The Group’s maximum exposure to credit risk for the components of the statement of financial position is the carrying amounts.
(c) Liquidity risk
Liquidity risk refers to the possibility of default by the Group to meet its obligations because of unavailability of funds to meet both operational and capital requirements. The Group monitors its risk to a shortage of funds using a recurring liquidity planning tool. This tool considers the maturity of both its financial investments and financial assets (e.g. accounts receivables and other financial assets), the maturity of its financial obligations and projected cash flows from operations. Moreover, the Group has access to various types of funding such as leasing, loans and share capital.
THE UNITED BASALT PRODUCTS LIMITED AND ITS SUBSIDIARIESNOTES TO THE FINANCIAL STATEMENTS FOR THE YEAR ENDED JUNE 30, 2016
THE UNITED BASALT PRODUCTS LIMITED AND ITS SUBSIDIARIESNOTES TO THE FINANCIAL STATEMENTS FOR THE YEAR ENDED JUNE 30, 2016
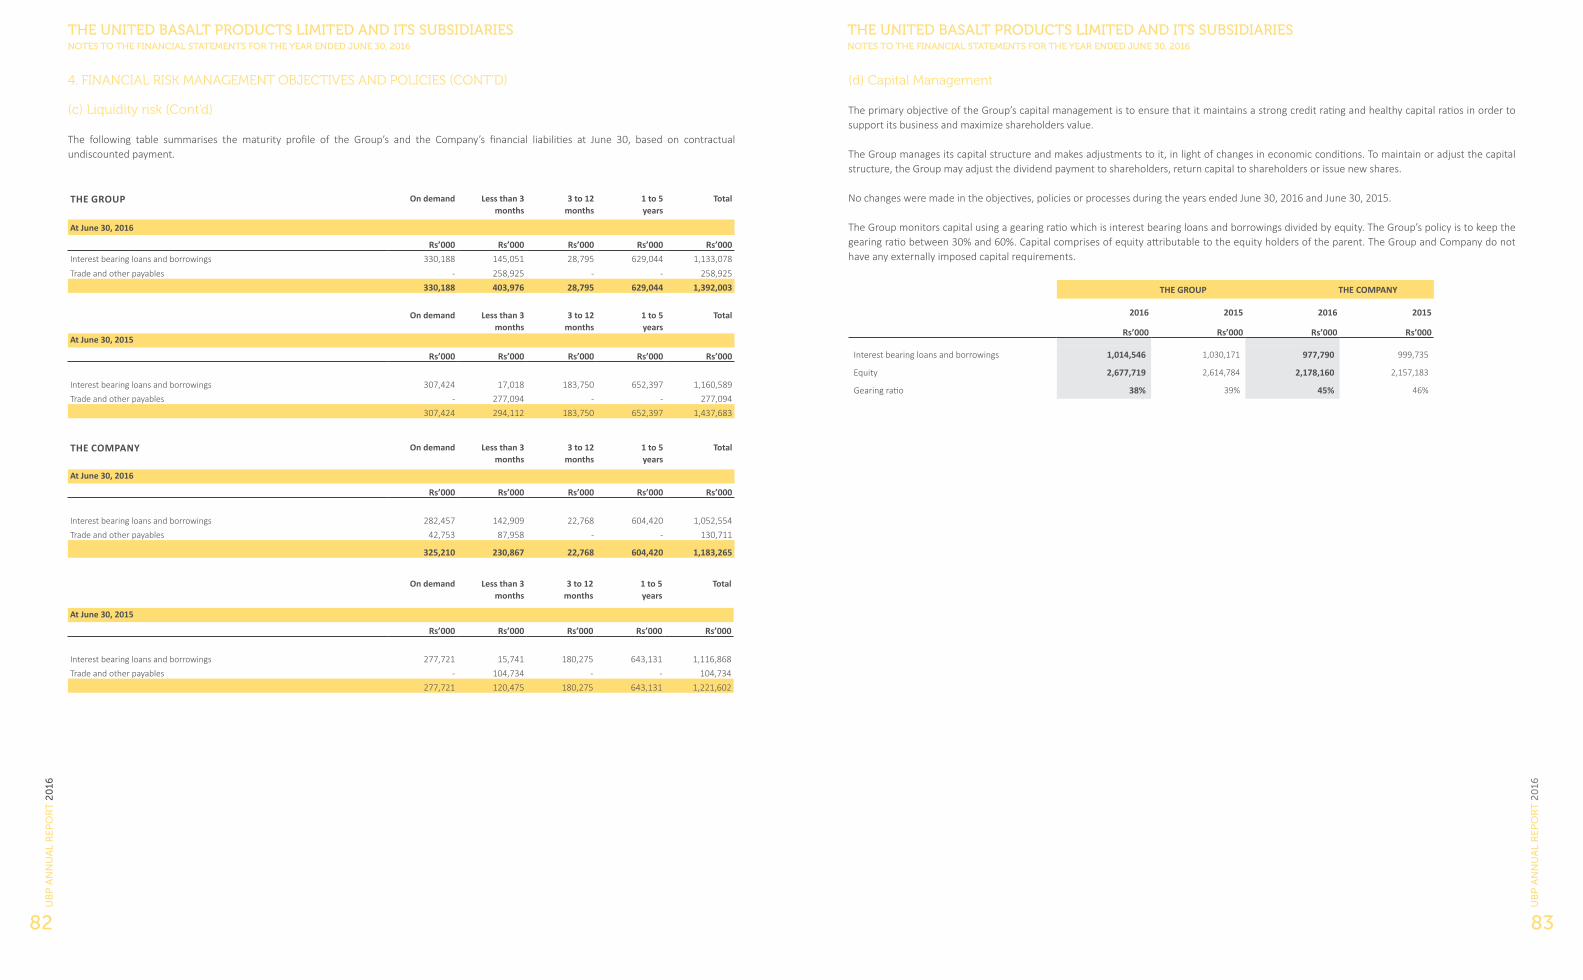
83
UB
P A
NN
UA
L R
EP
OR
T 2
016
82
UB
P A
NN
UA
L R
EP
OR
T 2
016
4. FINANCIAL RISK MANAGEMENT OBJECTIVES AND POLICIES (CONT’D)
(c) Liquidity risk (Cont’d)
The following table summarises the maturity profile of the Group’s and the Company’s financial liabilities at June 30, based on contractual undiscounted payment.
THE GROUP On demand Less than 3 months
3 to 12months
1 to 5years
Total
At June 30, 2016
Rs’000 Rs’000 Rs’000 Rs’000 Rs’000Interest bearing loans and borrowings 330,188 145,051 28,795 629,044 1,133,078
Trade and other payables - 258,925 - - 258,925
330,188 403,976 28,795 629,044 1,392,003
On demand Less than 3 months
3 to 12months
1 to 5years
Total
At June 30, 2015
Rs’000 Rs’000 Rs’000 Rs’000 Rs’000
Interest bearing loans and borrowings 307,424 17,018 183,750 652,397 1,160,589
Trade and other payables - 277,094 - - 277,094
307,424 294,112 183,750 652,397 1,437,683
THE COMPANY On demand Less than 3 months
3 to 12months
1 to 5years
Total
At June 30, 2016
Rs’000 Rs’000 Rs’000 Rs’000 Rs’000
Interest bearing loans and borrowings 282,457 142,909 22,768 604,420 1,052,554
Trade and other payables 42,753 87,958 - - 130,711
325,210 230,867 22,768 604,420 1,183,265
On demand Less than 3 months
3 to 12months
1 to 5years
Total
At June 30, 2015
Rs’000 Rs’000 Rs’000 Rs’000 Rs’000
Interest bearing loans and borrowings 277,721 15,741 180,275 643,131 1,116,868
Trade and other payables - 104,734 - - 104,734
277,721 120,475 180,275 643,131 1,221,602
(d) Capital Management
The primary objective of the Group’s capital management is to ensure that it maintains a strong credit rating and healthy capital ratios in order to support its business and maximize shareholders value.
The Group manages its capital structure and makes adjustments to it, in light of changes in economic conditions. To maintain or adjust the capital structure, the Group may adjust the dividend payment to shareholders, return capital to shareholders or issue new shares.
No changes were made in the objectives, policies or processes during the years ended June 30, 2016 and June 30, 2015.
The Group monitors capital using a gearing ratio which is interest bearing loans and borrowings divided by equity. The Group’s policy is to keep the gearing ratio between 30% and 60%. Capital comprises of equity attributable to the equity holders of the parent. The Group and Company do not have any externally imposed capital requirements.
THE GROUP THE COMPANY
2016 2015 2016 2015
Rs’000 Rs’000 Rs’000 Rs’000
Interest bearing loans and borrowings 1,014,546 1,030,171 977,790 999,735
Equity 2,677,719 2,614,784 2,178,160 2,157,183
Gearing ratio 38% 39% 45% 46%
THE UNITED BASALT PRODUCTS LIMITED AND ITS SUBSIDIARIESNOTES TO THE FINANCIAL STATEMENTS FOR THE YEAR ENDED JUNE 30, 2016
THE UNITED BASALT PRODUCTS LIMITED AND ITS SUBSIDIARIESNOTES TO THE FINANCIAL STATEMENTS FOR THE YEAR ENDED JUNE 30, 2016

85
UB
P A
NN
UA
L R
EP
OR
T 2
016
84
UB
P A
NN
UA
L R
EP
OR
T 2
016
5. PROPERTY, PLANT AND EQUIPMENT
FreeholdLand and Buildings
Leasehold and land
improvementPlant and
EquipmentMotor
VehiclesAsset in
Progress TotalTHE GROUP
Rs’000 Rs’000 Rs’000 Rs’000 Rs’000 Rs’000COST OR VALUATIONAt July 1, 2014 2,066,492 79,846 2,175,817 156,474 88,801 4,567,430
Additions 37,345 56 231,933 20,706 65,294 355,334
Transfer 65,476 - 11,584 - (77,060) -
Disposals - - (36,823) (15,810) - (52,633)
Write-off (2,104) - (607) - - (2,711)
Exchange differences (1,849) 858 (1,339) 115 (1,478) (3,693)
At June 30, 2015 2,165,360 80,760 2,380,565 161,485 75,557 4,863,727
Additions 38,851 5,504 153,717 30,366 29,475 257,913
Transfer 24,272 - 4,107 (3,971) (24,408) -
Transfer to investment properties (note 6) (1,608) - - - - (1,608)
Disposals - - (54,188) (20,526) - (74,714)
Write-off - - (1,140) - - (1,140)
Exchange diferences (196) 1,953 (8,125) (498) (1,765) (8,631)
At June 30, 2016 2,226,679 88,217 2,474,936 166,856 78,859 5,035,547
DEPRECIATIONAt July 1, 2014 85,950 20,739 1,597,861 105,082 - 1,809,632
Charge for the year 38,685 4,021 156,528 20,180 - 219,414
Disposals - (35,217) (15,849) - (51,066)
Write off (140) - (592) - - (732)
Exchange differences (1,350) 255 (2,534) (77) - (3,706)
At June 30, 2015 123,145 25,015 1,716,046 109,336 - 1,973,542
Charge for the year 44,121 2,724 170,158 20,224 - 237,227
Disposals - - (41,817) (18,626) - (60,443)
Write off - - (266) - - (266)
Exchange differences (39) 2,476 (5,562) (296) - (3,421)
At June 30, 2016 167,227 30,215 1,838,559 110,638 - 2,146,639
CARRYING AMOUNTAt June 30, 2016 2,059,452 58,002 636,377 56,218 78,859 2,888,908At June 30, 2015 2,042,215 55,745 664,519 52,149 75,557 2,890,185
Bank borrowings are secured by fixed and floating charges over the assets of the Group.Leased liabilities are effectively secured as the rights to the leased asset revert to the lessor in the event of default.
(a) The carrying amount of plant and equipment and motor vehicles held under finance lease as at June 30, 2016 and 2015 were as follows:
Plant and Motor Plant and Motor
Equipment Vehicles 2016 Equipment Vehicles 2015Rs’000 Rs’000 Rs’000 Rs’000 Rs’000 Rs’000
Cost 37,616 45,161 82,777 74,501 46,920 121,421
Accumulated depreciation (22,959) (23,854) (46,813) (64,765) (31,519) (96,284)
Carrying amount 14,657 21,307 35,964 9,736 15,401 25,137
FreeholdLand and Buildings
Leasehold and land
improvementPlant and
EquipmentMotor
VehiclesAsset in
Progress TotalTHE COMPANY
Rs’000 Rs’000 Rs’000 Rs’000 Rs’000 Rs’000COST OR VALUATIONAt July 1, 2014 937,856 43,126 1,671,091 82,357 10,032 2,744,462
Additions 20,287 - 197,389 9,716 5,758 233,150
Disposals - - (34,262) (9,846) - (44,108)
Transfer 3,935 - 6,097 - (10,032) -
Write off (860) - - - - (860)
At June 30, 2015 961,218 43,126 1,840,315 82,227 5,758 2,932,644
Additions 48,806 - 114,755 12,910 9,318 185,789
Disposals - - (48,497) (9,293) - (57,790)
Transfer 5,758 - - - (5,758) -
At June 30, 2016 1,015,782 43,126 1,906,573 85,844 9,318 3,060,643
DEPRECIATIONAt July 1, 2014 49,365 17,766 1,250,960 52,595 - 1,370,686
Charge for the year 19,294 2,156 120,080 11,022 - 152,552
Disposal - - (33,959) (9,846) - (43,805)
Write off (100) - - - - (100)
At June 30, 2015 68,559 19,922 1,337,081 53,771 - 1,479,333
Charge for the year 20,897 2,156 133,203 11,756 - 168,012
Disposal - - (40,048) (9,175) - (49,222)
At June 30, 2016 89,456 22,078 1,430,236 56,352 - 1,598,123
CARRYING AMOUNTAt June 30, 2016 926,326 21,048 476,337 29,492 9,318 1,462,520 At June 30, 2015 892,659 23,204 503,234 28,456 5,758 1,453,311
Bank borrowings are secured by fixed and floating charges over the assets of the Company.Leased liabilities are effectively secured as the rights to the leased asset revert to the lessor in the event of default.
(a) The carrying amount of plant and equipment and motor vehicles held under finance lease as at June 30, 2016 and 2015 were as follows:
Plant and Motor Plant and MotorEquipment Vehicles 2016 Equipment Vehicles 2015
Rs’000 Rs’000 Rs’000 Rs’000 Rs’000 Rs’000
Cost 25,058 8,850 33,908 73,409 18,147 91,556
Accumulated depreciation (22,376) (8,312) (30,688) (64,704) (14,827) (79,531)
Carrying amount 2,682 538 3,220 8,705 3,320 12,025
(b) Revaluation of land and buildings
The fair value of the freehold land and buildings were determined by Société d’Hotman de Spéville, an independent valuer. Fair value is determined by reference to market based evidence; that is, the valuations are based on active market prices, adjusted for any differences in the nature, location or condition of a specific property. The date of the revaluation was June 3, 2012. Freehold land and buildings have been classified as level 2 as it is based on sales comparison approach.
The cost, accumulated depreciation and carrying amount of the land and buildings, had they been stated at historical cost would be as follows:
THE GROUP THE COMPANY2016 2015 2016 2015
Rs’000 Rs’000 Rs’000 Rs’000Cost 1,208,092 1,107,429 1,110,835 1,078,608
Accumulated depreciation (395,902) (361,293) (378,110) (353,133)
Carrying amount 812,190 746,136 732,725 725,475
THE UNITED BASALT PRODUCTS LIMITED AND ITS SUBSIDIARIESNOTES TO THE FINANCIAL STATEMENTS FOR THE YEAR ENDED JUNE 30, 2016
THE UNITED BASALT PRODUCTS LIMITED AND ITS SUBSIDIARIESNOTES TO THE FINANCIAL STATEMENTS FOR THE YEAR ENDED JUNE 30, 2016

87
UB
P A
NN
UA
L R
EP
OR
T 2
016
86
UB
P A
NN
UA
L R
EP
OR
T 2
016
THE UNITED BASALT PRODUCTS LIMITED AND ITS SUBSIDIARIESNOTES TO THE FINANCIAL STATEMENTS FOR THE YEAR ENDED JUNE 30, 2016
7. BEARER BIOLOGICAL ASSETS
THE GROUP2016 2015
Plant canes Rs’000 Rs’000At July 1, 12,446 12,428
Expenditure for the year 4,392 4,406
Amortisation for the year (3,439) (4,008)
Impairment adjustment 380 (380)
At June 30, 13,779 12,446
Other information:Area harvested (Arpents) 506 520
Cost per Arpent (Rs) 70,120 88,117
At June 30, 2016, the Directors have made an assessment of the carrying value of the bearer plants and have concluded that no impairment was required (2015: impairment loss of Rs 0.38 m) based on their forecasts. This assessment was based on an average sugar price of Rs 15,000 per ton over the projected period.
8. INTANGIBLE ASSETSTHE GROUP THE COMPANY
Computer ComputerSoftware Goodwill Total Software
COST Rs’000 Rs’000 Rs’000 Rs’000At July 1, 2014 34,469 134,103 168,572 10,800
Additions 3,687 - 3,687 1,933
At June 30, 2015 38,156 134,103 172,259 12,733
Additions 4,891 - 4,891 2,427
Work in progress 4,565 - 4,565 4,565
Write off (2,633) - (2,633) -
At June 30, 2016 44,979 134,103 179,082 19,724
AMORTISATIONAt July 1, 2014 19,185 128,671 147,856 8,233
Amortisation charge 3,500 - 3,500 880
At June 30, 2015 22,685 128,671 151,356 9,113
Amortisation charge 3,944 - 3,944 1,160
Write off (980) - (980) -
At June 30, 2016 25,649 128,671 154,320 10,273
CARRYING AMOUNTAt June 30, 2016 19,330 5,432 24,762 9,451 At June 30, 2015 15,471 5,432 20,903 3,620
6. INVESTMENT PROPERTIES
THE GROUP THE COMPANY2016 2015 2016 2015
COST Rs’000 Rs’000 Rs’000 Rs’000At July 1, 45,216 45,216 360,929 354,748
Transfer from property, plant and equipment (note 5) 1,608 - - - Additions 1,918 - 8,802 6,181
Work in progress - - 580 -
At June 30, 48,742 45,216 370,311 360,929
DEPRECIATIONAt July 1, 30,644 28,735 160,364 144,109
Charge for the year 2,065 1,909 16,688 16,255
At June 30, 32,709 30,644 177,052 160,364
CARRYING AMOUNT
At June 30, 16,033 14,572 193,259 200,565
The investment properties were last revalued on June 3, 2012 by an external independent valuer. The Directors performed a valuation of its investment properties and believe that there has been no significant change in the fair value of the investment pertaining to the parent company since last independent valuation. The valuation was carried out at that date by Société d’Hotman de Speville. Fair value is determined by reference to market based evidence; that is, the valuations are based on active market prices, adjusted for any differences in the nature, location or condition of a specific property. The fair value at June 30, 2016 was Rs 200.8 m (2015: Rs 200.8 m) for the Group and Rs 663 m (2015: Rs 653.6 m) for the Company. The rental income arising during the year amounted to Rs 11.8 m (2015: Rs 11.5 m) for the Group and for the Company Rs 39.4 m (2015: Rs 38.2 m). Direct operating expenses incurred on the investment properties for the Company during the year was Rs 0.8 m (2015: Rs 0.6 m) and Nil (2015:Nil) for the Group. The investment properties have been classified as level 2, based on sales comparison approach.
The Group and the Company have no restrictions on the realisability of its investment properties and no contractual obligations to purchase, construct or develop investment properties or for repairs, maintenance and enhancements.
THE UNITED BASALT PRODUCTS LIMITED AND ITS SUBSIDIARIESNOTES TO THE FINANCIAL STATEMENTS FOR THE YEAR ENDED JUNE 30, 2016

89
UB
P A
NN
UA
L R
EP
OR
T 2
016
88
UB
P A
NN
UA
L R
EP
OR
T 2
016
THE UNITED BASALT PRODUCTS LIMITED AND ITS SUBSIDIARIESNOTES TO THE FINANCIAL STATEMENTS FOR THE YEAR ENDED JUNE 30, 2016
The carrying amount of goodwill is allocated to the ‘Agriculture’ cash generating unit (‘’CGU’’). The recoverable amount of that CGU has been determined using the fair value less costs to sell model which is similar to prior year. Fair value less cost to sell is adjusted for with other assets and liabilities of the CGU, excluding the fair value less cost to sell of the land. No impairment was required as a result of the analysis.
The fair value less costs to sell calculation is most sensitive to the following main assumption:
Selling prices – The prices are obtained from the relevant bodies and adjusted for expected changes for future periods.
Management believes that reasonably possible changes in the above assumption will not cause the carrying amount of the cash generating unit to materially exceed its recoverable amount. A 5% decrease in the unit selling price will still result in a recoverable amount higher than the carrying amount.
9. INVESTMENT IN SUBSIDIARIES
THE COMPANY
2016 2015Rs’000 Rs’000
At July 1, 979,659 979,659
Additions (a) 100,000 -
At June 30, 1,079,659 979,659
Analysed as follows:
Unquoted equity instruments 928,839 828,839
Interest- free loans (b) 150,820 150,820
1,079,659 979,659
The Directors have assessed the recoverable amount of the investments and are of the opinion that the carrying amount has not suffered any impairment.
Particulars of interests in the Group’s subsidiary companies:
2016 AND 2015
Country of incorporation
% Holding
OPERATIONAL Direct Indirect
Espace Maison Ltée Mauritius 100.0 -
Compagnie de Gros Cailloux Limitée (a) Mauritius 100.0 -
Société d'Investissement Rodriguais Mauritius 100.0 -
Welcome Industries Ltd Mauritius - 75.9
UBP International Limited Mauritius 100.0 -
UBP Madagascar Madagascar - 100.0
United Granite Products (Private) Limited Sri-Lanka - 77.0
DHK Metal Crusher (Private) Limited Sri-Lanka - 100.0
Sheffield Trading (Private) Limited Sri-Lanka - 100.0
Sainte Marie Crushing Plant Limited Mauritius 76.5 -
Societe des Petits Cailloux Mauritius - 76.5
Dry Mixed Products Ltd Mauritius 51.0 -
DORMANTLand Reclamation Limited Mauritius 100.0 -
Stone and Bricks Limited Mauritius 100.0 -
The Stone Masters Co. Ltd Mauritius 100.0 -
Pricom Ltd Mauritius 100.0 -
(a) During the year, the Company increased its investment in its wholly-owned subsidiary, namely Compagnie de Gros Cailloux Limitée by Rs 100m. The investment was financed by cash (Rs 21.5m) and conversion of intercompany receivable balance (Rs 78.5m).
(b) Following Board approval on June 18, 2015, an interest free loan of Rs 150.8m to UBP Madagascar is shown under investments.
THE UNITED BASALT PRODUCTS LIMITED AND ITS SUBSIDIARIESNOTES TO THE FINANCIAL STATEMENTS FOR THE YEAR ENDED JUNE 30, 2016
Summarised financial information of subsidiaries that have material non-controlling interests, based on their IFRS financial statements and before inter-company eliminations are provided below:
Dry Mixed Products Ltd
Welcome Industries Ltd
United Granite Products (Private)
Limited
Sainte Marie Crushing Plant Ltd
2016 Rs'000 Rs'000 Rs'000 Rs'000Proportion of non-controlling interests 49.00% 24.10% 23.00% 23.50%
Financial positionNon-current assets 100,855 11,981 65,122 61,310
Current assets 105,740 35,159 18,832 19,410
Non-current liabilities (26,632) (7,294) (774) (5,178)
Current liabilities (65,029) (13,205) (129,230) (16,658)
Net assets/(shareholders’ deficit) 114,934 26,641 (46,050) 58,884
Carrying amounts of non-controlling interests 56,318 6,420 (10,592) 13,838
Comprehensive incomeRevenue 305,244 50,454 15,360 69,944
Profit/(loss) for the year 46,098 9,392 (23,248) 9,017
Other comprehensive income/(loss) 1,620 209 - (51)
Total comprehensive income/(loss) 47,718 9,601 (23,248) 8,966
Profit allocated to non-controlling interests 22,588 2,263 (5,347) 2,119
Total comprehensive income/(loss) allocated to non-controlling interests 23,382 2,314 (5,347) 2,107
Dividend to non-controlling interests 9,800 2,410 - 2,800
Cash flowsOperating activities 56,404 6,286 (854) 24,784
Investing activities (32,101) (6,237) 143 (15,024)Financing activities (20,443) - 901 (11,350)
Net increase/(decrease) in cash and cash equivalents 3,860 49 190 (1,590)

91
UB
P A
NN
UA
L R
EP
OR
T 2
016
90
UB
P A
NN
UA
L R
EP
OR
T 2
016
THE UNITED BASALT PRODUCTS LIMITED AND ITS SUBSIDIARIESNOTES TO THE FINANCIAL STATEMENTS FOR THE YEAR ENDED JUNE 30, 2016
9. INVESTMENT IN SUBSIDIARIES (CONT’D)
Summarised financial information of subsidiaries that have material non-controlling interests, based on their IFRS financial statements and before inter-company eliminations are provided below:
Dry Mixed Products Ltd
Welcome Industries Ltd
United Granite Products (Private)
Limited
Sainte Marie Crushing Plant Ltd
2015 Rs'000 Rs'000 Rs'000 Rs'000Proportion of non-controlling interests 49.00% 24.10% 23.00% 23.50%
Financial positionNon-current assets 76,235 16,350 74,407 59,059
Current assets 77,619 24,221 40,667 13,058
Non-current liabilities (10,665) (6,741) (1,000) (5,449)
Current liabilities (55,971) (6,790) (135,988) (5,400)
Net assets/(shareholders’ deficit) 87,218 27,040 (21,914) 61,268
Carrying amounts of non-controlling interests 42,737 6,517 (5,040) 14,398
Comprehensive incomeRevenue 282,897 38,902 19,280 64,805
Profit/(loss) for the year 31,156 4,311 (7,130) 2,536
Other comprehensive income/(loss) 1,035 (43) - 252
Total comprehensive income/(loss) 32,191 4,268 (7,130) 2,788
Profit/(loss) allocated to non-controlling interests 15,266 1,039 (1,640) 596
Total comprehensive income/(loss) allocated to non-controlling interests 15,774 1,029 (1,640) 655
Dividend to non-controlling interests 9,800 983 - 1,800
Cash flowsOperating activities 37,963 12,764 335 8,566
Investing activities (37,824) (7,574) (46) (728)
Financing activities - - - (7,100)
Net increase in cash and cash equivalents 139 5,190 289 738
10. INVESTMENT IN ASSOCIATES
THE GROUP THE COMPANY2016 2015 2016 2015
Rs’000 Rs’000 Rs’000 Rs’000UnquotedAt July 1, 168,928 191,121 110,306 110,306
Disposals (90) - (90) -
Share of loss (6,367) (3,163) - -
Movement in reserves (1,538) (10,630) - -
Impairment (2,968) - (2,968) -
Dividend received (11,100) (8,400) - -
At June 30, 146,865 168,928 107,248 110,306
THE UNITED BASALT PRODUCTS LIMITED AND ITS SUBSIDIARIESNOTES TO THE FINANCIAL STATEMENTS FOR THE YEAR ENDED JUNE 30, 2016
CompagnieTHE GROUP Mauricienne2016 Pre-mixed d’Entreprise
Concrete Limited Terrarock Ltd LtéeRs’000 Rs’000 Rs’000
Financial positionNon-current assets 76,639 53,726 82,135
Cash and cash equivalents - 461 11,651
Other current assets 148,660 54,805 46,081 Current trade and other payables (113,177) (10,945) (453)Current loans and borrowings (7,705) (6,531) - Other current liabilities (15,168) (9,124) (70,892)
Equity 89,249 82,392 68,522
Proportion of Group's ownership 49.0% 46.0% 20.0%
43,732 37,900 13,704
Goodwill 48,619 - -
Carrying amount of investments 92,351 37,900 13,704
Statement of profit or loss and other comprehensive incomeRevenue 455,529 172,560 5,531
Interest income - 919 639
Other income - 843 1,813
Depreciation and amortisation (14,042) (11,840) -
Interest expense - (5) -
Other expenses (482,174) (132,032) (2,424)
(Loss)/profit before tax (40,687) 30,445 5,559
Income tax expense 1,149 (3,263) -
(Loss)/profit for the year (39,538) 27,182 5,559
Other comprehensive loss (2,597) (578) (2,099)
Total comprehensive (loss)/income (42,135) 26,604 3,460
Group's share of (loss)/profit (19,374) 12,504 692
Group's share of total comprehensive (loss)/income (20,646) 12,238 692
Details pertaining to the interests in associates are as follows:
Principal activitiesName of companyCountry of
incorporation Proportion of ownership interest
(direct & indirect) 2016 2015
Pre-mixed Concrete LimitedInvolve in the manufacturing and placing of ready-mixed
concrete. Mauritius 49.0% 49.0%
Cement Transport Ltd Operating a fleet of bulk cement transport truck, tractors
and tankers. Mauritius 25.0% 25.0%
Compagnie des Transports Reunis Ltée (*) Operating a fleet of lorries. Mauritius - 30.0%Terrarock Ltd Manufacture and sale of building materials. Mauritius 46.0% 46.0%
Sud Concassage Limitée Manufacture and sale of building materials. Mauritius 25.0% 25.0%
Prochimad Mines et Carrières SARL Mine operation. Madagascar 34.0% 34.0%
Compagnie Mauricienne d'Entreprise Ltée Renting of properties. Mauritius 20.0% 20.0%
(*) The Company disposed of one of its associates, namely Compagnie des Transports Reunis Ltée, during the year.
Summarised financial information of the associates that are material to the Group, based on their IFRS financial statements, and reconciliation with the carrying amount of the investment in the Group’s financial statements are set out below:

93
UB
P A
NN
UA
L R
EP
OR
T 2
016
92
UB
P A
NN
UA
L R
EP
OR
T 2
016
THE UNITED BASALT PRODUCTS LIMITED AND ITS SUBSIDIARIESNOTES TO THE FINANCIAL STATEMENTS FOR THE YEAR ENDED JUNE 30, 2016
10. INVESTMENT IN ASSOCIATES (CONT’D)
THE GROUPCompagnie
Mauricienne 2015 Pre-mixed d’Entreprise
Concrete Limited Terrarock Ltd LtéeRs’000 Rs’000 Rs’000
Financial positionNon-current assets 97,831 50,923 85,125
Cash and cash equivalents - 731 30,023
Other current assets 153,761 44,257 21,645 Current trade and other payables (85,535) (4,446) (448)Current loans and borrowings (15,266) (5,081) - Other current liabilities (19,404) (8,096) (71,282)Equity 131,387 78,288 65,063 Proportion of Group's ownership 49.0% 46.0% 20.0%
64,380 36,012 13,013
Goodwill 48,619 - -
Carrying amount of investment 112,999 36,012 13,013
Statement of profit or loss and other comprehensive incomeRevenue 492,494 130,257 4,990
Interest income - 631 648
Other income 332 814 3,552
Depreciation and amortisation (14,143) (11,753) -
Interest expense - (11) -
Other expenses (491,106) (101,270) (978)
(Loss)/profit before tax (12,423) 18,668 8,212
Income tax expense (8,781) (3,865) (812)
(Loss)/profit for the year (21,204) 14,803 7,400
Other comprehensive income/(loss) 8,007 (789) (68,976)
Total comprehensive (loss)/income (13,197) 14,014 (61,576)
Group's share of (loss)/profit (10,390) 6,809 1,480
Group's share of total comprehensive (loss)/income (6,467) 6,446 (12,315)
Aggregate information on individually immaterial associates THE GROUP
2016 2015Rs’000 Rs’000
Carrying amount of investments 2,910 6,905
Group's share of loss for the year (189) (1,062)
Group's share of other comprehensive loss - (396)
Group's share of total comprehensive loss (189) (1,458)
The associates had no other contingent liabilities or capital commitment as at June 30, 2016 and 2015 except as disclosed in note 32.
THE UNITED BASALT PRODUCTS LIMITED AND ITS SUBSIDIARIESNOTES TO THE FINANCIAL STATEMENTS FOR THE YEAR ENDED JUNE 30, 2016
11. AVAILABLE-FOR-SALE INVESTMENTSQuoted equity
sharesUnquoted equity
shares TotalTHE GROUP Rs’000 Rs’000 Rs’000At July 1, 2014 40,138 18,490 58,628
Additions - 200 200
Disposals (3,790) - (3,790)
Fair value movements (2,307) 1,667 (640)
At June 30, 2015 34,041 20,357 54,398
Additions - 28,820 28,820
Fair value movements (2,551) (5,451) (8,002)
At June 30, 2016 31,490 43,726 75,216
Quoted equity shares
Unquoted equity shares Total
THE COMPANY Rs’000 Rs’000 Rs’000At July 1, 2014 34,832 18,437 53,269
Additions - 200 200
Disposals (3,790) - (3,790)
Fair value movements (1,990) 1,536 (454)
At June 30, 2015 29,052 20,173 49,225
Additions - 28,820 28,820
Fair value movements (1,455) (5,451) (6,906)
At June 30, 2016 27,597 43,542 71,139
FAIR VALUE HIERARCHY
The following table provides an analysis of available-for-sale investments at fair value categorised according to the fair value hierarchy disclosures in note 2.3 (b).
THE GROUP 2016 Level 1 Level 2 Level 3 Total
Rs’000 Rs’000 Rs’000 Rs’000Available-for-sale investments 31,490 28,820 10,430 70,740
THE COMPANYLevel 1 Level 2 Level 3 TotalRs’000 Rs’000 Rs’000 Rs’000
Available-for-sale investments 27,597 28,820 10,430 66,847
THE GROUP 2015 Level 1 Level 2 Level 3 Total
Rs’000 Rs’000 Rs’000 Rs’000Available-for-sale investments 34,041 - 15,881 49,922
THE COMPANYLevel 1 Level 2 Level 3 TotalRs’000 Rs’000 Rs’000 Rs’000
Available-for-sale investments 29,052 - 15,881 44,933

95
UB
P A
NN
UA
L R
EP
OR
T 2
016
94
UB
P A
NN
UA
L R
EP
OR
T 2
016
THE UNITED BASALT PRODUCTS LIMITED AND ITS SUBSIDIARIESNOTES TO THE FINANCIAL STATEMENTS FOR THE YEAR ENDED JUNE 30, 2016
11. AVAILABLE-FOR-SALE INVESTMENTS (CONT’D)2016 2015
Rs’000 Rs’000
Other available-for-sale investments at costThe Group 4,476 4,476
The Company 4,292 4,292
Certain of the unquoted investments were stated at cost since their fair value could not be reliably ascertained due to the absence of a market and track records for such similar instruments. P/E ratio of quoted investments was used and discounted to arrive at the fair value of Flacq Associated Stonemasters Ltd which has been disclosed under level 3.
Transfer between levelsDuring the year ended June 30 , 2015, there was a transfer of Rs 14.3m between level 2 to level 3 due to the signficance of adjustments in unobservable inputs used during the current financial year.
2016 2015Rs’000 Rs’000
At July 1, 15,881 -
Transfer from level 2 - 14,345
Net unrealised changes in fair value of available-for-sale investments (5,451) 1,536At June 30, 10,430 15,881
Valuation techniques
Unlisted equity investments classified as level 2The Company invests in equity securities. In the absence of a quoted price in an active market, they are valued using observable inputs such as recently executed transaction price in securities of issuer. Adjustments are made to the valuations when necessary to recognise the difference in the instrument’s terms. In the event the significant inputs are observable, the Company categorises these investments as Level 2.
Unlisted equity investments classified as level 3The Company invests in companies which are not quoted in an active market. Transactions in such investments do not occur on a regular basis. The Company uses a market based valuation technique for these positions.
Valuation process for Level 3 valuation
The fair value of unquoted equity shares held by the Company is based on comparable P/E ratio.
The valuation process for the investments is completed on a yearly basis and is designed to determine a reasonable fair value while subjecting the valuation of such investment to an appropriate level of review. Yearly valuations are performed at Group level by the Directors. For assets classified as Level 3, the finance professionals are responsible for documenting preliminary valuations based on their collection of financial and operating data, company specific developments, market valuation of comparable companies and model projections, among other factors. The Board then reviews the preliminary valuations and all inputs for accuracy and reasonableness. The Board finally approves all investment valuations.
The following table presents additional information about the valuation techniques and inputs used for investments that are measured at fair value and categorized within level 3 as of June 30, 2016:
Private equity investments
Fair value Rs’000
Valuation technique Observable input Unobservable input Range
Flacq Associated Stonemasters Limited
(FAST)
10,400 Market comparables P/E ratio Discount for lack of marketability
50%
Had the marketability discount increased by 5% at June 30, 2016, the Group and the Company’s profit would have decreased by Rs. 522,000. Had the marketability discount decreased by 5% at June 30, 2016, the Group and the Company’s profit would have increased by Rs 522,000.
12. OTHER FINANCIAL ASSET
THE GROUP AND THE COMPANY 2016 2015
Rs’000 Rs’000
Loan receivable from associate 13,795 13,795
The loan receivable is unsecured, bears no interest and will be repayable on demand. The fair value of the loan approximates its carrying amount.
THE UNITED BASALT PRODUCTS LIMITED AND ITS SUBSIDIARIESNOTES TO THE FINANCIAL STATEMENTS FOR THE YEAR ENDED JUNE 30, 2016
13. INCOME TAX
THE GROUP THE COMPANY2016 2015 2016 2015
Rs’000 Rs’000 Rs’000 Rs’000
(a) In the statements of profit or loss and other comprehensive income:Income tax on the adjusted profit for the year 37,182 20,200 28,782 14,182
Corporate social responsibility tax 4,912 2,646 3,838 1,891
Under/(over) provision of corporate social responsibility tax 43 (38) 43 -
Under/(over) provision of income tax in previous year 731 (1,750) 1,234 (2,179)
Under/(over) provision of deferred tax in previous years 2,141 822 2,599 (1,884)
Deferred tax (credit)/charge (4,315) (1,448) (6,356) 348
Income tax expense 40,694 20,432 30,140 12,358
Amount in other comprehensive income Deferred tax on losses on actuarial gains and losses (2,730) 4,732 (2,409) 4,938
(b) In the statements of financial position:At July 1, 11,603 7,916 9,430 4,549
Payment during the year (25,145) (15,517) (19,534) (7,080)
Tax withheld (2,213) (1,854) (2,213) (1,933)
Under/(over) provision of corporate social responsibility tax 43 (38) 43 -
Under/(over) provision of income tax in previous year 731 (1,750) 1,234 (2,179)
Income tax expense 42,094 22,846 32,620 16,073
At June 30, 27,113 11,603 21,580 9,430
(c) Deferred tax:Deferred tax assets - 921 - -
Deferred tax liabilities (38,316) (38,681) (32,941) (34,289)
Net deferred tax liabilities (38,316) (37,760) (32,941) (34,289)
(d) Movement in deferred tax:At July 1, (37,760) (43,118) (34,289) (40,763)
(Under)/over provision of deferred tax in previous years (2,141) (822) (2,599) 1,884 Income tax effect recognised in other comprehensive income (2,730) 4,732 (2,409) 4,938
Deferred tax credit/(charge) 4,315 1,448 6,356 (348)
At June 30, (38,316) (37,760) (32,941) (34,289)
Unused tax losses of the Group that have not been recognised as deferred tax asset amounted to Rs 109m (2015: Rs 97m). Deferred tax asset has not been recognised in respect of these losses due to the unpredictability of future profit streams to utilise these losses.
(e) Deferred tax assets and liabilities are attributable to the following:
Deferred tax liabilities - Accelerated capital allowances (22,255) (18,470) (13,462) (14,078)
- Deferred tax on revaluation gain (68,433) (68,433) (68,433) (68,433)
(90,688) (86,903) (81,895) (82,511)
Deferred tax assets - Employee benefit obligations 41,584 43,709 39,726 41,810
- Allowance for doubtful debts 6,082 2,308 4,877 2,871
- Provision for obsolete stock 4,706 3,126 4,351 3,541
52,372 49,143 48,954 48,222
Net deferred tax liabilities (38,316) (37,760) (32,941) (34,289)
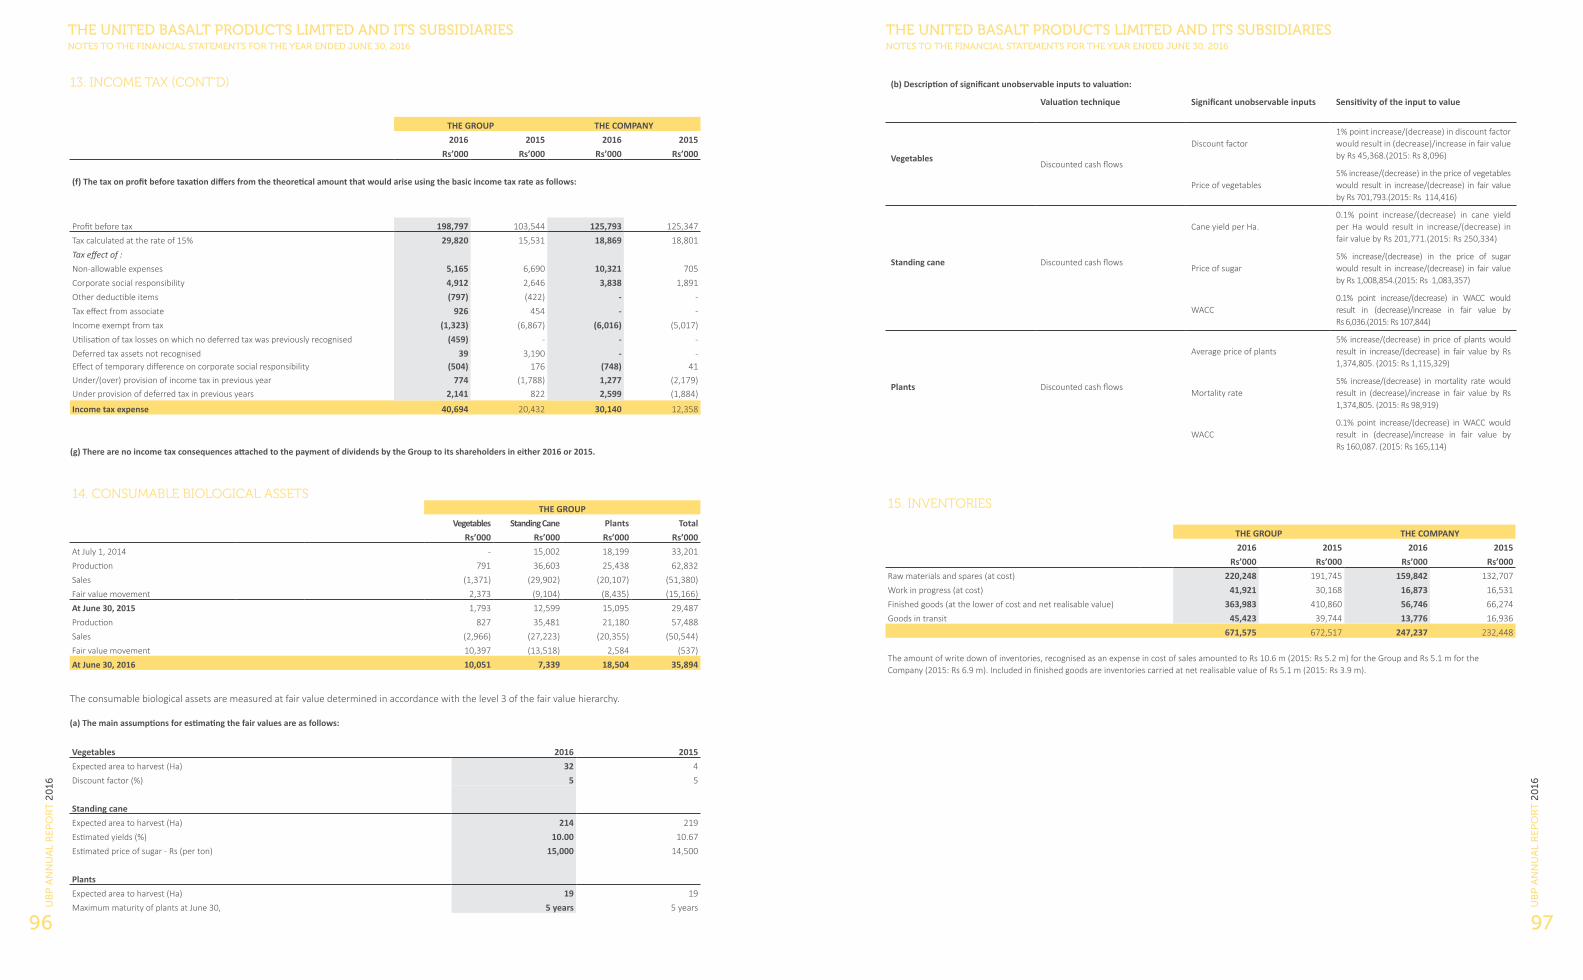
97
UB
P A
NN
UA
L R
EP
OR
T 2
016
96
UB
P A
NN
UA
L R
EP
OR
T 2
016
THE UNITED BASALT PRODUCTS LIMITED AND ITS SUBSIDIARIESNOTES TO THE FINANCIAL STATEMENTS FOR THE YEAR ENDED JUNE 30, 2016
13. INCOME TAX (CONT’D)
THE GROUP THE COMPANY2016 2015 2016 2015
Rs’000 Rs’000 Rs’000 Rs’000
(f) The tax on profit before taxation differs from the theoretical amount that would arise using the basic income tax rate as follows:
Profit before tax 198,797 103,544 125,793 125,347
Tax calculated at the rate of 15% 29,820 15,531 18,869 18,801
Tax effect of :Non-allowable expenses 5,165 6,690 10,321 705
Corporate social responsibility 4,912 2,646 3,838 1,891
Other deductible items (797) (422) - -
Tax effect from associate 926 454 - -
Income exempt from tax (1,323) (6,867) (6,016) (5,017)
Utilisation of tax losses on which no deferred tax was previously recognised (459) - - -
Deferred tax assets not recognised 39 3,190 - - Effect of temporary difference on corporate social responsibility (504) 176 (748) 41 Under/(over) provision of income tax in previous year 774 (1,788) 1,277 (2,179)Under provision of deferred tax in previous years 2,141 822 2,599 (1,884)
Income tax expense 40,694 20,432 30,140 12,358
14. CONSUMABLE BIOLOGICAL ASSETSTHE GROUP
Vegetables Standing Cane Plants TotalRs’000 Rs’000 Rs’000 Rs’000
At July 1, 2014 - 15,002 18,199 33,201
Production 791 36,603 25,438 62,832
Sales (1,371) (29,902) (20,107) (51,380)
Fair value movement 2,373 (9,104) (8,435) (15,166)
At June 30, 2015 1,793 12,599 15,095 29,487
Production 827 35,481 21,180 57,488
Sales (2,966) (27,223) (20,355) (50,544)
Fair value movement 10,397 (13,518) 2,584 (537)
At June 30, 2016 10,051 7,339 18,504 35,894
The consumable biological assets are measured at fair value determined in accordance with the level 3 of the fair value hierarchy.
(a) The main assumptions for estimating the fair values are as follows:
Vegetables 2016 2015Expected area to harvest (Ha) 32 4
Discount factor (%) 5 5
Standing cane Expected area to harvest (Ha) 214 219
Estimated yields (%) 10.00 10.67
Estimated price of sugar - Rs (per ton) 15,000 14,500
PlantsExpected area to harvest (Ha) 19 19
Maximum maturity of plants at June 30, 5 years 5 years
THE UNITED BASALT PRODUCTS LIMITED AND ITS SUBSIDIARIESNOTES TO THE FINANCIAL STATEMENTS FOR THE YEAR ENDED JUNE 30, 2016
(b) Description of significant unobservable inputs to valuation:
Valuation technique Significant unobservable inputs Sensitivity of the input to value
VegetablesDiscounted cash flows
Discount factor1% point increase/(decrease) in discount factor would result in (decrease)/increase in fair value by Rs 45,368.(2015: Rs 8,096)
Price of vegetables5% increase/(decrease) in the price of vegetables would result in increase/(decrease) in fair value by Rs 701,793.(2015: Rs 114,416)
Standing cane
Cane yield per Ha.0.1% point increase/(decrease) in cane yield per Ha would result in increase/(decrease) in fair value by Rs 201,771.(2015: Rs 250,334)
Discounted cash flowsPrice of sugar
5% increase/(decrease) in the price of sugar would result in increase/(decrease) in fair value by Rs 1,008,854.(2015: Rs 1,083,357)
WACC0.1% point increase/(decrease) in WACC would result in (decrease)/increase in fair value by Rs 6,036.(2015: Rs 107,844)
Plants
Average price of plants5% increase/(decrease) in price of plants would result in increase/(decrease) in fair value by Rs 1,374,805. (2015: Rs 1,115,329)
Discounted cash flowsMortality rate
5% increase/(decrease) in mortality rate would result in (decrease)/increase in fair value by Rs 1,374,805. (2015: Rs 98,919)
WACC0.1% point increase/(decrease) in WACC would result in (decrease)/increase in fair value by Rs 160,087. (2015: Rs 165,114)
15. INVENTORIES
THE GROUP THE COMPANY2016 2015 2016 2015
Rs’000 Rs’000 Rs’000 Rs’000Raw materials and spares (at cost) 220,248 191,745 159,842 132,707
Work in progress (at cost) 41,921 30,168 16,873 16,531
Finished goods (at the lower of cost and net realisable value) 363,983 410,860 56,746 66,274
Goods in transit 45,423 39,744 13,776 16,936
671,575 672,517 247,237 232,448
The amount of write down of inventories, recognised as an expense in cost of sales amounted to Rs 10.6 m (2015: Rs 5.2 m) for the Group and Rs 5.1 m for the Company (2015: Rs 6.9 m). Included in finished goods are inventories carried at net realisable value of Rs 5.1 m (2015: Rs 3.9 m).
(g) There are no income tax consequences attached to the payment of dividends by the Group to its shareholders in either 2016 or 2015.

99
UB
P A
NN
UA
L R
EP
OR
T 2
016
98
UB
P A
NN
UA
L R
EP
OR
T 2
016
THE UNITED BASALT PRODUCTS LIMITED AND ITS SUBSIDIARIESNOTES TO THE FINANCIAL STATEMENTS FOR THE YEAR ENDED JUNE 30, 2016
16. ASSET CLASSIFIED AS HELD FOR SALE
In 2014, the Group resolved to dispose of a certain parcel of freehold land that was no longer utilised. The land was disposed for Rs 80m during the financial year ended
June 30, 2015.
17. TRADE AND OTHER RECEIVABLES
THE GROUP THE COMPANYRestated
2016 2015 2016 2015Rs’000 Rs’000 Rs’000 Rs’000
Trade receivables 282,977 245,225 116,238 116,689
Receivables from subsidiaries - - 216,088 290,648
Receivables from associates 30,940 25,332 30,713 25,211
Loan receivable from subsidiary - - - 53,871
Other receivables 34,481 78,871 17,606 15,389
Prepayments 20,972 28,475 6,800 4,400
369,370 377,903 387,445 506,208
Trade receivables are non-interest bearing and are generally on 30 days’ terms. Other receivables are non-interest bearing and have an average term of 6 months. For
terms and conditions relating to receivables from related parties, refer to note 29. The fair values of the trade and other receivables approximate their carrying amounts.
As at June 30, 2016, the Group’s trade receivables of intial value of Rs 58.3 m (2015: Rs 43.8 m) were impaired and provided for. As at June 30, 2016, the Company’s trade
receivables of intial value of Rs 28.5 m (2015: Rs 16.9 m) were impaired and provided for.
As at June 30, the ageing analysis of trade receivables was as follows:
Neither past due Past due but not impairedTotal nor impaired 30-60 days 61-90 days 90 - 1 yr More than 1 yr
THE GROUP Rs’000 Rs’000 Rs’000 Rs’000 Rs’000 Rs’0002016 282,977 90,825 72,371 37,968 43,957 37,856 2015 245,225 106,868 57,242 26,644 41,844 12,627
THE COMPANY
2016 116,238 46,594 29,152 10,756 28,550 1,185 2015 116,689 38,859 34,190 15,628 25,115 2,897
See note 4(b) on credit risk of trade receivables, which explains how the Group manages and measures credit quality of trade receivables that are neither past due nor
impaired.
THE UNITED BASALT PRODUCTS LIMITED AND ITS SUBSIDIARIESNOTES TO THE FINANCIAL STATEMENTS FOR THE YEAR ENDED JUNE 30, 2016
The movements in the provision for impairment of trade receivables were as follows:
THE GROUP THE COMPANY2016 2015 2016 2015
Rs’000 Rs’000 Rs’000 Rs’000Individually and collectively impairedAt July 1, 43,894 38,003 16,887 15,328
Charge for the year 16,488 8,510 11,803 3,971
Write-off (150) (6) - -
Release (1,906) (2,613) (216) (2,412)
At June 30, 58,326 43,894 28,474 16,887
Other receivables comprise of prepayments and advances made to suppliers, amongst others.
18. CASH AND CASH EQUIVALENTS
For the purpose of the statements of cash flows, cash at banks and on hand comprise of the following at June 30:
THE GROUP THE COMPANY2016 2015 2016 2015
Rs’000 Rs’000 Rs’000 Rs’000Cash at banks and on hand 50,288 28,221 3,108 2,176
Bank overdraft (note 20) (246,979) (279,727) (199,246) (247,723)
(196,691) (251,506) (196,138) (245,547)
The acquisition of property, plant and equipment was financed as follows:
THE GROUP THE COMPANY2016 2015 2016 2015
Rs’000 Rs’000 Rs’000 Rs’000Non-cash transactionsTotal acquisition cost (note 5) 257,913 355,334 185,789 233,150
Financed by cash (232,742) (347,092) (185,789) (233,150)
Financed by finance leases 25,171 8,242 - -
19. EQUITYTHE GROUP AND THE COMPANY
2016 2015 2016 2015(a) Issued capital Number of Number of
shares shares Rs’000 Rs’000At June 30, 26,510,042 26,510,042 265,100 265,100
THE GROUP THE COMPANYRestated
(b) Reserves 2016 2015 2016 2015Rs’000 Rs’000 Rs’000 Rs’000
Share premium 7,354 7,354 7,354 7,354
Associate companies (note (i)) 63,938 65,476 - -
Revaluation reserve (note (ii)) 1,093,038 1,093,038 505,210 505,211
Fair value reserve (note (iii)) 28,613 36,615 26,937 33,843
Translation reserve (note (iv)) 7,444 15,344 - -
Retained earnings 1,165,994 1,091,009 1,373,559 1,345,675 2,366,381 2,308,836 1,913,060 1,892,083

101
UB
P A
NN
UA
L R
EP
OR
T 2
016
100
UB
P A
NN
UA
L R
EP
OR
T 2
016
THE UNITED BASALT PRODUCTS LIMITED AND ITS SUBSIDIARIESNOTES TO THE FINANCIAL STATEMENTS FOR THE YEAR ENDED JUNE 30, 2016
19. EQUITY (CONT’D)
(i) Associate companies represent reserves other than retained earnings arising on equity accounting of associates.(ii) The revaluation reserve is used to record increases in the fair value of land and buildings and decreases to the extent that such decrease relates to an increase on
the same asset previously recognised in equity. (iii) The fair value reserve records fair value changes on available-for-sale financial assets.(iv) The translation reserve is used to record exchange differences arising from the translation of the financial statements of overseas operations.
20. INTEREST-BEARING LOANS AND BORROWINGS
THE GROUP THE COMPANY2016 2015 2016 2015
Rs’000 Rs’000 Rs’000 Rs’000Non-currentBank loans (note (a)) 12,384 1,500 - 1,500
Obligations under finance lease (note (b)) 24,520 12,056 - 3,833
Debentures (note (c)) 560,000 560,000 560,000 560,000
596,904 573,556 560,000 565,333
CurrentBank overdrafts (note 18) 246,979 279,727 199,246 247,723
Bank loans (note (a)) 134,116 144,557 131,500 144,267
Unsecured loans (note (c)) 25,784 15,591 83,211 29,625
Obligations under finance lease (note (b)) 10,763 16,740 3,833 12,787
417,642 456,615 417,790 434,402
Total borrowings 1,014,546 1,030,171 977,790 999,735
The fair values of the loans and borrowings approximate their carrying amount, except for debentures. The debentures are classiffied under level 1 in the level of hierarchy since they are listed on the Stock Exchange of Mauritius Ltd. The fair value of the debentures at 30 June 2016 amounted to Rs 560m (2015: Rs 562.3m).
(a) Bank loans are payable as follows:
Within one year 134,116 144,557 131,500 144,267
After one year and before two years 2,795 1,500 - 1,500
After two years and before five years 9,589 - - -
146,500 146,057 131,500 145,767
Bank loans and overdrafts are secured by fixed and floating charges on the Group’s assets and bear interest between PLR +0.5% and PLR +1.5% per annum.
(b) Finance lease liabilities
Minimum lease payments:Within one year 13,003 18,339 3,938 13,586
After one year and before two years 11,685 7,261 - 3,938
After two years and before five years 16,314 5,943 - -
41,002 31,543 3,938 17,524
Future finance charges on finance leases (5,719) (2,747) (105) (904)
Present value of finance lease liabilities 35,283 28,796 3,833 16,620
Within one year 10,763 16,740 3,833 12,787
After one year and before two years 9,570 6,626 - 3,833
After two years and before five years 14,950 5,430 - -
35,283 28,796 3,833 16,620
Lease finance carries interest at an annual rate between 7.5% and 9.75%. Leased liabilities are effectively secured as the rights to the leased assets revert to the lessor in the event of default.
(c) The debentures are unsecured, repayable in November 2018 and bear interest at repo rate +1.20%. Unsecured loans are repayable at call, the rate of interest per annum at June 30, 2016 was 5.60% (2015: 5.85%).
THE UNITED BASALT PRODUCTS LIMITED AND ITS SUBSIDIARIESNOTES TO THE FINANCIAL STATEMENTS FOR THE YEAR ENDED JUNE 30, 2016
21. EMPLOYEE BENEFIT LIABILITY
The benefits of employees of the Group and the Company fall under two different types of arrangements:(a) A defined benefit scheme which is funded. The plan assets are held independently by an insurance company; and
(b) Retirement benefits, as defined under the Employment Rights Act 2008, which are unfunded.
The liabilities in respect of the retirement benefit schemes (a) and (b) above are analysed as follows:
THE GROUP THE COMPANY2016 2015 2016 2015
Rs’000 Rs’000 Rs’000 Rs’000 Funded obligation (note a) 139,962 156,366 118,435 131,633
Unfunded obligation (note b) 142,694 141,700 115,244 114,309
282,656 298,066 233,679 245,942
(a) Funded obligation
(i) The amounts recognised in the statements of financial position in respect of funded obligation are as follows:
THE GROUP THE COMPANY2016 2015 2016 2015
Rs’000 Rs’000 Rs’000 Rs’000 Present value of funded obligation 356,064 349,266 309,923 297,392
Fair value of plan assets (216,102) (192,900) (191,488) (165,759)
Benefit liability 139,962 156,366 118,435 131,633
At July 1, 156,366 115,040 131,633 94,255
Amounts recognised in profit or loss 25,754 20,741 20,424 16,301
Amounts recognised in other comprehensive income (15,814) 32,729 (9,203) 29,630
Employer's contribution (26,344) (12,144) (24,419) (8,553)
At June 30, 139,962 156,366 118,435 131,633
(ii) Changes in the present value of the employee benefit liability are as follows:
THE GROUP THE COMPANY2016 2015 2016 2015
Rs’000 Rs’000 Rs’000 Rs’000 At July 1, 349,266 296,949 297,392 249,811
Amounts recognised in profit or loss:Current service cost 12,297 10,257 8,967 7,280
SIPF 1 liabilities - - - -
Interest cost 24,018 22,651 20,463 19,077
36,315 32,908 29,430 26,357
Benefits paid (11,720) (10,708) (6,477) (5,630)
Amounts recognised in other comprehensive income:(Gains)/losses due to changes in financial assumptions (17,901) 30,035 (10,422) 26,854
Employee’s contribution 106 82 - -
Present value of employee benefit liability at June 30, 356,065 349,266 309,923 297,392

103
UB
P A
NN
UA
L R
EP
OR
T 2
016
102
UB
P A
NN
UA
L R
EP
OR
T 2
016
THE UNITED BASALT PRODUCTS LIMITED AND ITS SUBSIDIARIESNOTES TO THE FINANCIAL STATEMENTS FOR THE YEAR ENDED JUNE 30, 2016
21. EMPLOYEE BENEFIT LIABILITY (CONT’D)
THE GROUP THE COMPANY
2016 2015 2016 2015
(iii) Changes in the fair value of plan assets are as follows Rs’000 Rs’000 Rs’000 Rs’000 At July 1, 192,900 181,909 165,759 155,556
Amounts recognised in profit or loss:Current cost (906) 145 (942) (283)
Cost of insuring risk benefits (1,585) (1,669) (1,257) (1,211)
Interest cost 13,051 13,690 11,205 11,550
10,560 12,166 9,006 10,056
Benefits paid (11,720) (10,708) (6,477) (5,630)
Amounts recognised in other comprehensive income:Gains due to changes in financial assumptions (2,088) (2,642) (1,219) (2,776)
Employer's contribution 26,450 12,175 24,419 8,553
Fair value of plan assets at June 30, 216,102 192,900 191,488 165,759
(iv) Description of assets
The assets of the plan are invested in the Deposit Administration Policy which is a pooled insurance product for Group Pension Schemes, underwritten by Swan Life (ex Anglo-Mauritius). The long-term investment policy aims to provide a smooth progression of returns from one year to the next without regular fluctuations associated with asset-linked investment such as equity funds. Moreover, the Deposit Adminstration Policy offers a minimum guaranteed return of 4% per annum.
The actual return on plan assets for the Company was Rs 9,986,920 for the year ended June 30, 2016.
The actual return on plan assets for the Group was Rs 10,964,536 for the year ended June 30, 2016.
Maturity profile of the defined benefit obligation.
The weighted average duration of the liabilities for the Group and the Company as at June 30, 2016 is 16 years and 14 years respectively.
(v) Expected contribution for the next year
The Group and the Company are expected to contribute Rs 25,702,186 and Rs 19,491,840 respectively to the pension scheme for the year ending June 30, 2017.
(vi) The main actuarial assumptions used for accounting purposes were:
THE GROUP THE COMPANY
2016 2015 2016 2015
Discount rate 6.50% 6.75% 6.50% 6.75%
Future salary increase 4.00% 5.25% 4.00% 5.25%
Mortality during active service is assumed to follow that of the standard table known as A67/70 Ultimate. Mortality after retirement is assumed to follow that of the standard table known as PA(90) rated down by two years.
Employees are assumed to retire at 60. No allowance has been made for early retirement on the grounds of ill-health or otherwise, or for late retirements.
THE UNITED BASALT PRODUCTS LIMITED AND ITS SUBSIDIARIESNOTES TO THE FINANCIAL STATEMENTS FOR THE YEAR ENDED JUNE 30, 2016
(a) Funded obligation (cont’d)
(vii) Settlements and curtailments There have been no events that would need to be treated as settlements or curtailments under IAS 19.
(viii) Risks associated with the plansThe Defined Benefit Plans expose the Group and the Company to actuarial risks such as longevity risk, interest rate risk, market (investment) risk, and salary risk.
Longevity riskThe liabilities disclosed are based on the mortality tables A 67/70 and PA(90)/AMAS buyout rate. Should the experience of the pension plans be less favourable than the
standard mortality tables, the liabilities will increase.
Interest rate risk If the bond interest rate decreases, the liabilities would be calculated using a lower discount rate, and would therefore increase.
Investment riskThe present value of the liabilities of the plan are calculated using a discount rate. Should the returns on the assets of the plan be lower than the discount rate, a deficit
will arise for funded benefits only.
Salary riskIf salary increases are higher than assumed in our basis, the liabilities would increase giving rise to actuarial losses.
(ix) Sensitivity analysis on defined benefit obligation at the end of the year:
THE GROUP THE COMPANY Impact
2016 2015 2016 2015
Discount rate Rs'000 Rs'000 Rs'000 Rs'000
1% increase (48,965) (47,029) (41,286) (37,849)
1% decrease 48,965 47,029 41,286 37,849
Salary increase
1% increase 18,945 21,950 12,376 15,140
1% decrease (18,945) (21,950) (12,376) (15,140)
The sensitivity analysis above have been determined based on sensibly possible changes of the discount rate or salary increase rate occuring at the end of the reporting period if all other assumptions remain unchanged.
The major categories of the planned assets are as follows:
THE GROUP THE COMPANY
2016 2015 2016 2015
Local equities 1 % 1 % - -
Overseas equities and mutual funds 1 % 1 % - -
Fixed interest 1 % 1 % - -
Property 1 % 1 % - -
Qualifying insurances policies 96 % 96 % 100 % 100 %
100 % 100 % 100 % 100 %
(b) Unfunded obligation
The amounts recognised in the statements of financial position in respect of unfunded obligation are as follows:
(i) Movement in the liability recognised in the statements of financial position:
THE GROUP THE COMPANY2016 2015 2016 2015
Rs'000 Rs'000 Rs'000 Rs'000 Present value of unfunded obligation 142,694 141,700 115,244 114,309

105
UB
P A
NN
UA
L R
EP
OR
T 2
016
104
UB
P A
NN
UA
L R
EP
OR
T 2
016
THE UNITED BASALT PRODUCTS LIMITED AND ITS SUBSIDIARIESNOTES TO THE FINANCIAL STATEMENTS FOR THE YEAR ENDED JUNE 30, 2016
21. EMPLOYEE BENEFIT LIABILITY (CONT’D)
(b) Unfunded obligation (cont’d)
THE GROUP THE COMPANY2016 2015 2016 2015
(ii) Movement of defined benefit of unfunded oblgation Rs’000 Rs’000 Rs’000 Rs’000 At July 1, 141,700 133,961 114,309 108,699
Amount recognised in profit or loss:Current service cost 6,426 6,473 4,822 4,756 Interest expense 9,502 10,344 7,756 8,422
Past service cost 270 (99) 464 (430) 16,198 16,718 13,042 12,748
Amount recognised in other comprehensive income:Liability experience gains (5,563) (1,552) (4,966) (392)Gains due to changes in financial assumptions (354) (214) - (190)
(5,917) (1,766) (4,966) (582)
Benefits paid (9,287) (7,213) (7,141) (6,556)
At June 30, 142,694 141,700 115,244 114,309
(iii) Principal assumptions used were as follows:
Financial assumptions:
Discount rate 7% 7% 7% 7%Future salary increase 5.5% 5.5% 5.5% 5.5%Future pension increase 4.5% 4.5% 4.5% 4.5%
Demographic assumptions:
Withdrawal before retirement 5% per annum to age 40, reducing to nil after age 45.A1967/70(2) Ultimate PA(90) (rated down by 2 years).65.
Mortality before retirement
Mortality in retirement
(iv) Sensitivity analysis on unfunded defined benefit obligation at the end of the year:
THE GROUP THE COMPANYImpact
2016 2015 2016 2015 Rs'000 Rs’000 Rs'000 Rs’000
1% increase in discount rate (13,949) (13,052) (11,129) (11,249)1% decrease in discount rate 11,959 11,062 9,469 9,562 1% increase in future salary increase 14,171 13,565 11,187 11,308 1% decrease in future salary increase (12,359) (11,573) (9,679) (9,775)1% increase in future pension increase 1,905 1,970 1,905 1,970 1% decrease in future pension increase (1,630) (1,763) (1,630) (1,763)
The above sensitivity analysis has been carried out by recalculating the present value of obligation at end of period after increasing or decreasing the discount rate while leaving all other assumptions unchanged. Any similar variation in the other assumptions would have shown smaller variations in the defined benefit obligation.
(v) Future cashflows
The funding policy is to pay benefits out of the reporting entity’s cashflow as and when due.The expected employer contribution for next year is Rs 2.1 m.The weighted average duration of the defined benefit obligation for the Group and the Company is 12 years and 11 years respectively.
The Group and the Company have recognised net defined liabilites of Rs 142.7 m and Rs 115.2 m respectively in the statement of financial position as at June 30, 2016 (2015: Group Rs 141.7 m and Company Rs 114.3 m) in respect of any retirement gratuities that are expected to be paid out of the Company’s cash flow to its employees under the Employment Rights Act 2008.
THE UNITED BASALT PRODUCTS LIMITED AND ITS SUBSIDIARIESNOTES TO THE FINANCIAL STATEMENTS FOR THE YEAR ENDED JUNE 30, 2016
22. TRADE AND OTHER PAYABLESTHE GROUP THE COMPANY
Restated2016 2015 2016 2015
Rs’000 Rs’000 Rs’000 Rs’000Trade payables 159,655 181,952 32,159 54,327
Payables to subsidiaries - - 42,753 12,665
Payables to associates 737 - - -
Other payables and accruals 98,533 95,141 55,799 37,742
258,925 277,093 130,711 104,734
Trade payables are non-interest bearing and are normally settled on 60-day terms. Other payables are non-interest bearing and have an average term of six months. For terms and conditions relating to payables to related parties, refer to note 29. Other payables comprise mainly of accruals, deposits from customers, amongst others.
23. REVENUE
THE GROUP THE COMPANY2016 2015 2016 2015
Rs’000 Rs’000 Rs’000 Rs’000Sale of goods 2,402,957 2,208,240 1,288,292 1,181,734
Rendering of services 233,493 147,000 106,625 85,520
2,636,450 2,355,240 1,394,917 1,267,254
24. OPERATING PROFIT
THE GROUP THE COMPANY2016 2015 2016 2015
Operating profit is arrived at after: Rs’000 Rs’000 Rs’000 Rs’000(a) Crediting:- Rental income 11,794 11,487 39,350 38,163
- Other operating income 64,188 52,687 60,868 55,784
- Profit on disposal of property, plant and equipment 6,840 4,588 3,818 2,671
(b) Charging:- Cost of sales 1,758,774 1,577,025 876,042 798,580
- Administrative expenses 662,813 636,900 468,333 403,206
- Selling and distribution costs 43,361 45,654 17,976 16,993
Depreciation of property, plant and equipment - owned assets 211,759 183,566 161,230 135,938
- leased assets 25,468 35,848 6,782 16,614
Depreciation of investment properties 2,065 1,909 16,688 16,255
Cost of inventories recognised as expenses 1,390,232 1,235,052 468,538 448,329
Amortisation of bearer biological assets 3,439 4,008 - -
Amortisation of intangible assets 3,944 3,500 1,160 880
Impairment of investment in associates 2,968 - 2,968 -
Impairment (reversal)/loss on bearer biological assets (380) 380 - -
Staff costs (note (i)) 488,005 455,075 298,279 302,399
Included in administrative expenses are:
Impairment of receivables from subsidiary - - 58,000 -
- - 58,000 -

107
UB
P A
NN
UA
L R
EP
OR
T 2
016
106
UB
P A
NN
UA
L R
EP
OR
T 2
016
THE UNITED BASALT PRODUCTS LIMITED AND ITS SUBSIDIARIESNOTES TO THE FINANCIAL STATEMENTS FOR THE YEAR ENDED JUNE 30, 2016
25. FINANCE INCOME
THE GROUP THE COMPANY2016 2015 2016 2015
Rs’000 Rs’000 Rs’000 Rs’000Dividend income:
- Quoted 774 157 774 157
- Unquoted 1,555 2,164 38,527 31,644
Interest income 144 669 1,520 4,176
2,473 2,990 40,821 35,977
26. FINANCE COSTS
THE GROUP THE COMPANY2016 2015 2016 2015
Interest expense on: Rs’000 Rs’000 Rs’000 Rs’000Bank overdrafts 6,678 9,548 6,163 10,013
Bank loans 8,341 12,023 7,106 7,344
Leases 1,958 3,574 796 2,612
Loans at call 2,704 2,801 5,613 2,993
Debentures 31,952 32,760 31,952 32,760
51,633 60,706 51,630 55,722
27. EARNINGS PER SHARE
THE GROUP2016 2015
Profit attributable to equity holders of the parent (Rs’000) 136,346 67,850
Number of shares in issue 26,510,042 26,510,042
Earnings per share - Basic (Rs) 5.14 2.56
There are no instruments (including contingently issuable shares) that could potentially dilute basic earnings per share in the future.
28. DIVIDENDS
THE GROUP THE COMPANY2016 2015 2016 2015
Rs’000 Rs’000 Rs’000 Rs’000Dividend on ordinary shares:Dividend paid of Rs 3.00 per share (2015: Rs 2.75 per share) 79,530 72,903 79,530 72,903
24. OPERATING PROFIT (CONT’D)
THE GROUP THE COMPANY2016 2015 2016 2015
Included in cost of sales and administrative expenses are: Rs’000 Rs’000 Rs’000 Rs’000(i) analysis of staff costs:- Wages and salaries 404,887 378,600 255,278 261,661
- Social security costs 19,295 17,770 10,551 10,168
- Pension costs 63,823 58,705 32,450 30,570
488,005 455,075 298,279 302,399
THE UNITED BASALT PRODUCTS LIMITED AND ITS SUBSIDIARIESNOTES TO THE FINANCIAL STATEMENTS FOR THE YEAR ENDED JUNE 30, 2016
29. RELATED PARTY DISCLOSURES
The Company
SubsidiaryCompanies
AssociateCompanies
EnterprisesUnder Common
Management
Key Management
Personnel
Enterprises WithCommon Major
Shareholders2016 2015 2016 2015 2016 2015 2016 2015 2016 2015 2016 2015
Rs’000 Rs’000 Rs’000 Rs’000 Rs’000 Rs’000 Rs’000 Rs’000 Rs’000 Rs’000 Rs’000 Rs’000(a) Nature of transactions
Purchase of goods and services 67,898 64,153 341,854 263,382 5,041 2,548 593 316 - - 143,689 143,174
Purchase of property, plant and equipment 54,873 24,263 10,958 8,379 4,154 297 - - - - 48,075 24,073
Sale of goods and services 400,456 320,583 124,466 136,882 156,170 145,863 20,817 17,058 1,079 1,689 83,492 103,925
Sale of property, plant and equipment 19,424 6,350 650 1,922 - - - - - - - -
Management fees received 21,280 37,907 - - - - - - - - - -
Rental income 29,044 28,753 32,424 31,024 466 466 - - - - - -
Rental expenses - - 2,914 1,805 - - - - - - - -
Management fees paid - 13,555 18,539 5,498 10,744 3,802 8,624 - - - -
Interest received 187 2,991 1,620 4,080 - - - - - - - -
Interest paid 5,441 4,080 187 958 926 830 926 381 - - 2,467 823
(b) Outstanding balances at June 30,
Amounts receivable 246,801 315,859 16,649 19,119 10,113 25,332 11,038 6,080 575 1,472 8,451 15,597
Amounts payable 42,753 12,665 62,715 82,781 - - 550 - - - 14,960 13,584
Loans receivable - 53,871 57,426 14,064 - - - - - - - -
Loans payable 83,211 29,625 - 50,000 23,942 15,979 1,842 414 - - - -
(c) Compensation of key management personnel
THE GROUP THE COMPANY 2016 2015 2016 2015
Rs’000 Rs’000 Rs’000 Rs’000Short term employee benefits 71,321 71,045 45,371 47,681
Post-employment benefits 8,566 5,784 6,279 3,623
79,887 76,829 51,650 51,304
Terms and conditions of transactions with related parties:The sales to and purchases from related parties are made at normal market prices. Outstanding balances at the year end are unsecured, interest free and settlement occurs in cash. There have been no guarantees provided or received for any related party receivables and payables. At each financial year, an assessment of provision for impairment is undertaken through examining the financial position of the related party and the market in which the related party operates. For the year ended June 30, 2016, the Group has not recorded any impairment of receivables relating to amounts owed by related parties (2015: Nil). The Company has recorded impairment of Rs 58m during the year ended 30 June 2016 (2015: Nil) relating to related parties. This assessment is undertaken each financial year through examination of the financial position of the related party and the market in which the related party operates.

109
UB
P A
NN
UA
L R
EP
OR
T 2
016
108
UB
P A
NN
UA
L R
EP
OR
T 2
016
THE UNITED BASALT PRODUCTS LIMITED AND ITS SUBSIDIARIESNOTES TO THE FINANCIAL STATEMENTS FOR THE YEAR ENDED JUNE 30, 2016
30. CONTRACTS OF SIGNIFICANCE
Except for transactions as disclosed in note 29 on related party transactions, the Group did not have any contract of significance as defined by the Listing Rules of the Stock Exchange of Mauritius Ltd with any of its Directors and controlling shareholders.
31. CAPITAL COMMITMENTS
THE GROUP THE COMPANYCapital expenditure: 2016 2015 2016 2015
Rs’000 Rs’000 Rs’000 Rs’000Contracted for but not provided in the financial statements 7,198 2,229 6,458 2,229
Approved by the Directors but not contracted for 278,021 262,966 194,462 180,391
285,219 265,195 200,920 182,620
The expenditure for property, plant and equipment will be financed by cash generated by Group activities and from available borrowing facilities.The Group’s capital committments relating to its associates are as follows:
THE GROUP2016 2015
Capital expenditure: Rs’000 Rs’000Contracted for but not provided in the financial statements - 238
Approved by the Directors but not contracted for 29,036 11,383
29,036 11,621
32. CONTINGENT LIABILITIES
Bank guaranteesAt June 30, 2016, the Group had contingent liabilities in respect of bank guarantees amounting to Rs 10 m (2015: Rs 9.3 m) arising in the ordinary course of business from which it is anticipated that no material liabilities would arise.
Pre-mixed Concrete Limited, one of the Group’s associates had contingent liabilities in respect of bank guarantees of Rs 0.19 m (2015: Rs 0.38 m) arising in the ordinary course of business from which it is anticipated that no material liabilities would arise.
Legal claim contingenciesLegal action has been initiated by former employees against the Group in respect of unpaid severance allowances. The estimated payout is Rs 29 m (2015:Rs 25.7m), should the action be successful. Trials are ongoing and therefore it is not practicable to state the timing of payment, if any. The Group has been advised by its legal counsel that it is only possible, but not probable, that the action will succeed. Accordingly, no provision for any liability has been made in the financial statements.
33. OPERATING LEASE COMMITMENTS
Future minimum rentals payable under operating leases are as follows:
THE GROUP THE COMPANY2016 2015 2016 2015
Rs’000 Rs’000 Rs’000 Rs’000 Within one year 2,738 4,952 573 573
After one year and before two years 2,289 3,204 924 573
After two years and before five years 1,442 5,130 255 1,179
6,469 13,286 1,752 2,325
34. HOLDING COMPANY
The Directors regard GML Investissement Ltée incorporated in Mauritius as the holding company. It’s registered address is 4th Floor, IBL House, Caudan Waterfront, Port Louis.
35. EVENTS AFTER REPORTING DATE
Subsequent to the year end, GML Investissement Ltée; the holding company and Ireland Blyth Limited (IBL) have amalgamated. The future amalgamated entity, renamed IBL Ltd, will be operational as from July 1, 2016 and thereafter listed on the Stock Exchange of Mauritius Ltd.
Except as disclosed above, there have been no other material event after the reporting date which require disclosure or adjustment to the financial statements for the year ended June 30,2016.
THE UNITED BASALT PRODUCTS LIMITED AND ITS SUBSIDIARIESNOTES TO THE FINANCIAL STATEMENTS FOR THE YEAR ENDED JUNE 30, 2016
36. SEGMENTAL INFORMATION
Operating segment information
The Building materials segment is involved in the manufacture and sale of building materials which consists principally of aggregates, rocksand, hollow-concrete blocks and various concrete building components which constitutes our core business. The retail business under the Building materials segment consist of the sale of roof tiles, imported floor and wall tiles, sanitary ware and a complete range of home building products and garden accessories.
The Agriculture segment is involved in the cultivation of sugar cane, plants and landscaping services.
Management monitors the operating results of its business units separately for the purpose of making decisions about resourcce allocation and performance assessment. Segment performance is evaluated based on operating profit or loss and is measured consistently with operating profit or loss in the consolidated financial statements.
Transfer prices between operating segments are on an arm’s length basis in a manner similar to transactions with third parties.
THE GROUP
Building materials Agriculture Consolidation TotalAdjustments
Retail Core Business
2016 Rs’000 Rs’000 Rs’000 Rs’000 Rs’000Revenue 871,313 1,900,111 71,291 (206,265) 2,636,450
Operating profit/(loss) 28,894 244,036 (18,606) - 254,324
Net finance cost (487) (1,688) (1,956) (45,029) (49,160)
Share of results of associates - - - (6,367) (6,367)
Profit/(loss) before taxation 28,407 242,348 (20,562) (51,396) 198,797
Income tax expense (45) (40,649) - - (40,694)
Profit/(loss) after taxation 28,362 201,699 (20,562) (51,396) 158,103
Non-controlling interests - (21,757) - - (21,757)
Profit/(loss) for the year attributable to the parent 28,362 179,942 (20,562) (51,396) 136,346
Other segment information:Segment assets 505,935 4,288,326 908,099 (1,542,740) 4,159,620
Investment in associates - 107,248 - 39,617 146,865
Total segment assets 505,935 4,395,574 908,099 (1,503,123) 4,306,485 Total segment liabilities 185,606 1,974,153 56,921 (587,914) 1,628,766
Capital expenditure:Property, plant and equipment 15,799 203,789 38,325 - 257,913
Intangible assets 1,456 7,399 601 - 9,456
Depreciation and amortisation 12,110 217,600 11,461 - 241,171

111
UB
P A
NN
UA
L R
EP
OR
T 2
016
110
UB
P A
NN
UA
L R
EP
OR
T 2
016
THE UNITED BASALT PRODUCTS LIMITED AND ITS SUBSIDIARIESNOTES TO THE FINANCIAL STATEMENTS FOR THE YEAR ENDED JUNE 30, 2016
36. SEGMENTAL INFORMATION (CONT’D)
THE GROUPBuilding materials Agriculture Consolidation Total
AdjustmentsRetail Core
Business2015 Rs’000 Rs’000 Rs’000 Rs’000 Rs’000Revenue 727,890 1,743,167 71,838 (187,655) 2,355,240
Operating profit/(loss) 7,429 183,192 (26,198) - 164,423
Net finance costs (1,929) (18,395) (4,817) (32,575) (57,716)
Share of results of associates - - - (3,163) (3,163)
Profit/(loss) before taxation 5,500 164,797 (31,015) (35,738) 103,544
Income tax expense - (20,432) - - (20,432)
Profit/(loss) after taxation 5,500 144,365 (31,015) (35,738) 83,112
Non-controlling interests - (15,262) - - (15,262)
Profit/(loss) for the year attributable to the parent 5,500 129,103 (31,015) (35,738) 67,850
Other segment information:Segment assets 476,673 4,200,952 88,295 (650,572) 4,115,348
Investment in associates - 110,306 - 58,622 168,928
Total segment assets 476,673 4,311,258 88,295 (591,950) 4,284,276 Total segment liabilities 185,791 1,970,752 114,838 (601,889) 1,669,492
Capital expenditure:Property, plant and equipment 13,631 294,602 47,101 - 355,334
Intangible assets 1,056 2,586 45 - 3,687
Depreciation and amortisation 13,927 205,006 3,981 - 222,914
37. COMPARATIVES
During the current year, management reassessed the classification and presentation of certain account balances in the financial statements. Accordingly, comparative figures have been reclassified to conform with the current year’s presentation. There is neither any effect on the result for the year in the comparative statements of profit or loss and other comprehensive income nor on the assets and liabilities in the comparative statements of financial position.
THE UNITED BASALT PRODUCTS LIMITED AND ITS SUBSIDIARIESNOTES TO THE FINANCIAL STATEMENTS FOR THE YEAR ENDED JUNE 30, 2016
38. FINANCIAL REVIEW
2016 2015THE GROUP Rs’m Rs’mShare capital 265.1 265.1 Reserves 2,366.4 2,308.8 Equity attributable to shareholders of the parent 2,631.5 2,573.9 Assets 4,306.5 4,284.3 Liabilities 1,628.8 1,669.5
Revenue 2,636.5 2,355.2 Profit before taxation 198.8 103.5 Income tax expense (40.7) (20.4)Profit for the year 158.1 83.1 Dividend (79.5) (72.9)
Rs RsBasic net assets value per share 99.26 97.09 Basic earnings per share 5.14 2.56 Dividend per share 3.00 2.75
2016 2015THE COMPANY Rs’m Rs’mShare capital 265.1 265.1 Reserves 1,913.1 1,892.1 Equity attributable to shareholders of the parent 2,178.2 2,157.2 Assets 3,574.9 3,551.3 Liabilities 1,396.7 1,394.1
Revenue 1,394.9 1,267.3 Profit before taxation 125.8 125.3 Income tax expense (30.1) (12.4)Profit for the year 95.7 113.0 Dividend (79.5) (72.9)
Rs RsBasic net assets value per share 82.16 81.37 Basic earnings per share 3.61 4.26Dividend per share 3.00 2.75

113
UB
P A
NN
UA
L R
EP
OR
T 2
016
112
UB
P A
NN
UA
L R
EP
OR
T 2
016
Notes Notes

115
UB
P A
NN
UA
L R
EP
OR
T 2
016
THE UNITED BASALT PRODUCTS LIMITEDPROXY FORM
I / We … … … … … … … … . … … … … … . . . . . . . . . … … … … … … … … o f… … … … … … … … … … … … … . … … … … … … … … … … … … … … … … … . … … … … … … … … … … … … … … … … …
……………........................................................................…..… being a shareholder/shareholders of The United Basalt Products Limited,
do hereby appoint….................……………………………………….……………………………of………………..………………...…………………………………..…………....................
failing him/her,…………………..………….....................................………………….....................................................................................................................................
………………...……............................................................…of…………………………...…........................………..………............……………………………….
as my/our proxy to vote for me/us and on my/our behalf at the Annual Meeting of the Company to be held on Wednesday, December 14, 2016 at 15.00 hours
and at any adjournment thereof.
I/We wish my/our proxy to vote on the Ordinary Resolutions in the following manner:
1 To consider the Annual Report 2016 of the Company.
2 To receive the report of Messrs Ernst & Young, the Auditors of the Company, for the year ended June 30, 2016.
3 To consider and adopt the Company’s and the Group’s Audited Financial Statements for the year ended June 30, 2016.
4 To re-elect as Director of the Company, Mr E. Jean Mamet, aged above 70, who offers himself for re-election upon recommendation from the Corporate Governance Committee in accordance with Section 138(6) of the Companies Act 2001 to hold office until the next Annual Meeting.
5 To re-elect as Director of the Company, Mr Jean Claude Maingard, aged 70, who offers himself for re-election upon recommendation from the Corporate Governance Committee in accordance with Section 138(6) of the Companies Act 2001 to hold ofice until the next Annual Meeting.
6-14 To elect as Directors of the Company and by way of separate resolutions, the following persons who offer themselves for re-election upon recommendation from the Corporate Governance Committee to hold office until the next Annual Meeting:
6 Mr Marc Freismuth
7 Mr François Boullé
8 Mr Joël Harel
9 Mr Laurent de la Hogue
10 Mr Arnaud Lagesse
11 Mr Stéphane Lagesse 12 Mr Thierry Lagesse 13 Mr Christophe Quevauvilliers
14 Mr Stéphane Ulcoq
15 To re-appoint Messrs Ernst & Young as Auditors of the Company for the year ending June 30, 2017 and to authorise the Board of Directors to fix their remuneration.
Dated this ………………………………day of ………………….........…………..2016.
……………………………................………………….Signature(s)
Notes:1. A shareholder of the Company entitled to attend and vote at this meeting may appoint a proxy of his/her own choice (whether a shareholder or not) to attend and vote on his/her behalf.
2. Please mark in the appropriate box how you wish to vote. If no specific direction as to voting is given, the proxy will exercise his/her discretion as to how he/she votes.
3. A vote withheld is not a vote in law and will not be counted in the calculation of the proportion of votes for and against the respective resolutions.
4. The instrument appointing a proxy or any general power of attorney, duly signed, should be deposited at the registered office of the Company, Trianon, Quatre Bornes, not less than twenty-four hours before the time fixed for the holding of the meeting or else the instrument of proxy shall not be treated as valid.
For Against Abstain
Notes
114
UB
P A
NN
UA
L R
EP
OR
T 2
016

ANNUAL REPORT2016Head Office:
Trianon, Quatre Bornes,MauritiusT: (+230) 454 1964F: (+230) 454 8043www.ubp.mu
UBP
AN
NUA
L RE
PORT
201
6