annual report west sound utility district - port orchardwsud.us/pdfs/financial/2016 new.pdf · mcag...
TRANSCRIPT

Page 1
ANNUAL REPORT
West Sound Utility District 2946
MCAG No.
Submitted pursuant to RCW 43.09.230 to the STATE AUDITOR’S OFFICE
FOR THE FISCAL YEAR ENDED DECEMBER 31, 2015
Certified correct this 12th day of May, 2016, to the best of my knowledge and belief:
GOVERNMENT INFORMATION:
Official Mailing Address: 2924 SE Lund Avenue – Port Orchard, Washington 98366 Official Web Site Address: www.wsud.us
PREPARER INFORMATION and CERTIFICATION:
Prepared by Finance Department Phone (360) 876-2545 Fax (360) 874-5030 Email [email protected] Signature _____________________
Michael R. Wilson – General Manager
Table of Contents
Page 2
Elected and Appointed Officials, 2015 ............................................................................................1
Management’s Discussion and Analysis .........................................................................................2
Financial Statements
Statement of Net Position .............................................................................................................8
Statement of Revenues, Expenses, and Changes in Fund Net Position .....................................10
Statement of Cash Flows ............................................................................................................11
Note to Financial Statements
Note 1 – Summary of Significant Accounting Policies .........................................................13
Note 2 – Deposits and Investments .......................................................................................16
Note 3 – Construction in Progress .........................................................................................17
Note 4 – Lease Commitments ...............................................................................................17
Note 5 – Capital Assets .........................................................................................................18
Note 6 – Long-term Debt and Liabilities ..............................................................................18
Note 7 – Restricted Cash .......................................................................................................19
Note 8 – Investment in Joint Wastewater Treatment Facility ...............................................19
Note 9 – Pension Plans ..........................................................................................................20
Note 10 – Risk Management ..................................................................................................27
Summary of Insurance ...........................................................................................30
Note 11 – Other Disclosures...................................................................................................32
Note 12 – Subsequent Events .................................................................................................32
Schedule of Proportional Share of Net Pension Liability ..............................................................33
Schedule of Employer Contributions .............................................................................................34
Notes to Required Supplemental Information - Pension ...............................................................35
Schedule 01 – Revenue/Expenditures ............................................................................................36
Schedule 09 - Liabilities ................................................................................................................38

MCAG No. 2946 West Sound Utility District
Elected and Appointed Officals, 2016
Page 1
WSUD Elected Officials
Commissioner, James J. Hart
Commissioner, Jerry Lundberg
Commissioner, Susan Way
WSUD Appointed Officials
General Manager, Michael R. Wilson
Water/Sewer Operations Manager, Brent Winters
Information Technology Manager, Michael Whitehead
Plant Manager, Randy Screws
District’s Attorney, Kenneth W. Bagwell
MCAG No. 2946 West Sound Utility District Management Discussion and Analysis
For the Year Ending December 31, 2016
Page 2
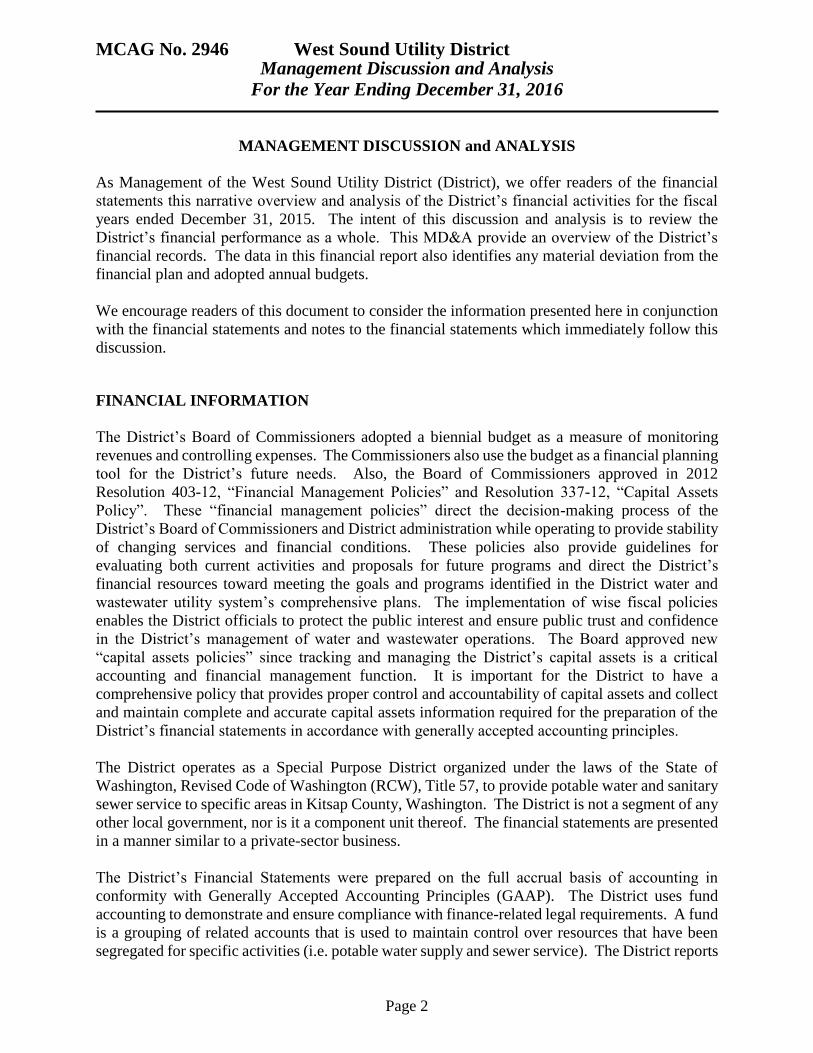
MANAGEMENT DISCUSSION and ANALYSIS
As Management of the West Sound Utility District (District), we offer readers of the financial
statements this narrative overview and analysis of the District’s financial activities for the fiscal
years ended December 31, 2015. The intent of this discussion and analysis is to review the
District’s financial performance as a whole. This MD&A provide an overview of the District’s
financial records. The data in this financial report also identifies any material deviation from the
financial plan and adopted annual budgets.
We encourage readers of this document to consider the information presented here in conjunction
with the financial statements and notes to the financial statements which immediately follow this
discussion.
FINANCIAL INFORMATION
The District’s Board of Commissioners adopted a biennial budget as a measure of monitoring
revenues and controlling expenses. The Commissioners also use the budget as a financial planning
tool for the District’s future needs. Also, the Board of Commissioners approved in 2012
Resolution 403-12, “Financial Management Policies” and Resolution 337-12, “Capital Assets
Policy”. These “financial management policies” direct the decision-making process of the
District’s Board of Commissioners and District administration while operating to provide stability
of changing services and financial conditions. These policies also provide guidelines for
evaluating both current activities and proposals for future programs and direct the District’s
financial resources toward meeting the goals and programs identified in the District water and
wastewater utility system’s comprehensive plans. The implementation of wise fiscal policies
enables the District officials to protect the public interest and ensure public trust and confidence
in the District’s management of water and wastewater operations. The Board approved new
“capital assets policies” since tracking and managing the District’s capital assets is a critical
accounting and financial management function. It is important for the District to have a
comprehensive policy that provides proper control and accountability of capital assets and collect
and maintain complete and accurate capital assets information required for the preparation of the
District’s financial statements in accordance with generally accepted accounting principles.
The District operates as a Special Purpose District organized under the laws of the State of
Washington, Revised Code of Washington (RCW), Title 57, to provide potable water and sanitary
sewer service to specific areas in Kitsap County, Washington. The District is not a segment of any
other local government, nor is it a component unit thereof. The financial statements are presented
in a manner similar to a private-sector business.
The District’s Financial Statements were prepared on the full accrual basis of accounting in
conformity with Generally Accepted Accounting Principles (GAAP). The District uses fund
accounting to demonstrate and ensure compliance with finance-related legal requirements. A fund
is a grouping of related accounts that is used to maintain control over resources that have been
segregated for specific activities (i.e. potable water supply and sewer service). The District reports
MCAG No. 2946 West Sound Utility District Management Discussion and Analysis
For the Year Ending December 31, 2016
Page 3
the activities of the water and sewer utilities as an Enterprise Fund, which is a type of proprietary
fund. Enterprise funds are used to report the same functions presented as business-type activities.
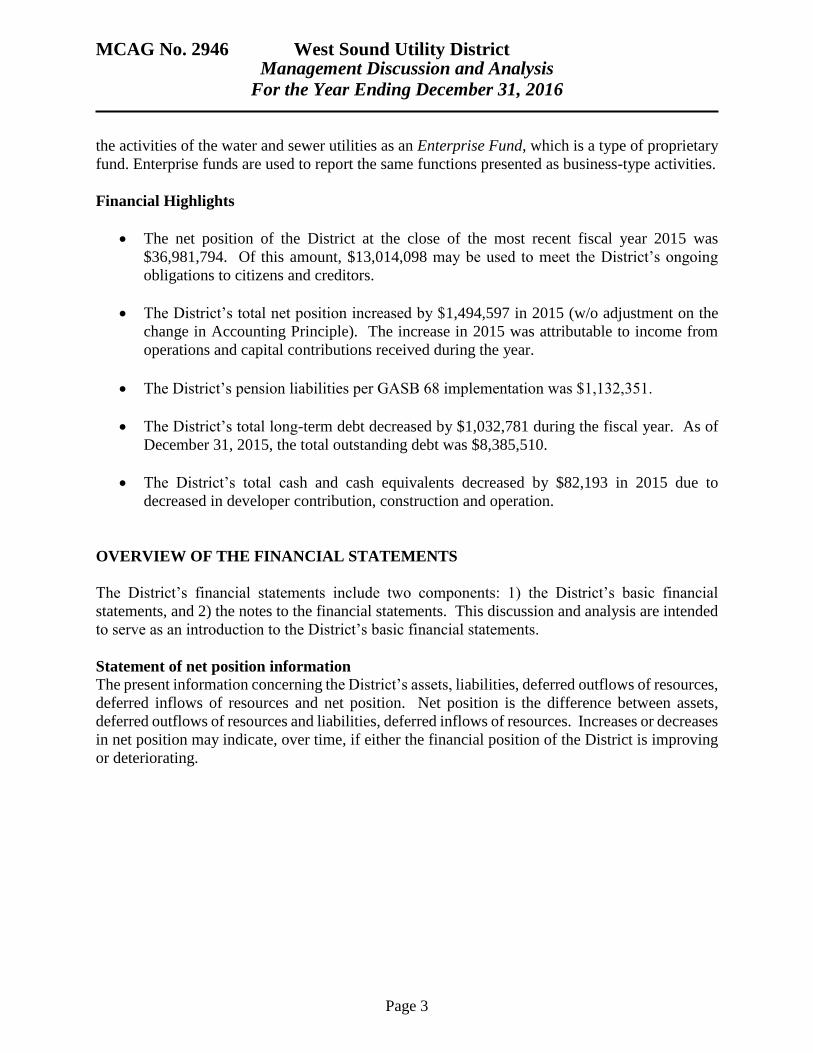
Financial Highlights
The net position of the District at the close of the most recent fiscal year 2015 was
$36,981,794. Of this amount, $13,014,098 may be used to meet the District’s ongoing
obligations to citizens and creditors.
The District’s total net position increased by $1,494,597 in 2015 (w/o adjustment on the
change in Accounting Principle). The increase in 2015 was attributable to income from
operations and capital contributions received during the year.
The District’s pension liabilities per GASB 68 implementation was $1,132,351.
The District’s total long-term debt decreased by $1,032,781 during the fiscal year. As of
December 31, 2015, the total outstanding debt was $8,385,510.
The District’s total cash and cash equivalents decreased by $82,193 in 2015 due to
decreased in developer contribution, construction and operation.
OVERVIEW OF THE FINANCIAL STATEMENTS
The District’s financial statements include two components: 1) the District’s basic financial
statements, and 2) the notes to the financial statements. This discussion and analysis are intended
to serve as an introduction to the District’s basic financial statements.
Statement of net position information
The present information concerning the District’s assets, liabilities, deferred outflows of resources,
deferred inflows of resources and net position. Net position is the difference between assets,
deferred outflows of resources and liabilities, deferred inflows of resources. Increases or decreases
in net position may indicate, over time, if either the financial position of the District is improving
or deteriorating.

MCAG No. 2946 West Sound Utility District Management Discussion and Analysis
For the Year Ending December 31, 2016
Page 4
The following condensed financial information provides an overview of the District’s financial
position for the fiscal year ended December 31, 2015.
The 2015 total net position was about $37 million. Net capital assets represent 66% of total assets.
As of December 31, 2015, the District had long-term liabilities of $8,893,317 million. Due to
implementation of GASB 68 Net Pension liabilities in 2015, $1,132,351 was added to the long-
term liabilities. The District’s investment in capital assets, less any related debt, was $22.9 million
as of December 31, 2015. This has increased over last year due to declining balance in debt service.
Restricted cash for debt service represents debt service reserve, FCF reserve, customer lien
satisfaction and developers’ deposits.
The overall financial position of the District has not significantly changed from the prior years.
There are no other restrictions, commitments or limitations that will significantly affect the
availability of fund resources. The District reports positive balances in all three categories of net
positions.
December 31, 2015 2014
Current and other assets 16,214,123 16,448,374
Capital assets, net 31,325,711 30,722,293
Total Assets $47,539,834 $47,170,667
Deferred Outflows of Resources
Deferred Outflows Related to Pensions 120,531 -
Other Liabilities 1,613,378 582,266
Long-term liabilities 8,893,317 9,867,792
Total Liabilities $10,506,695 $10,450,058
Deferred Inflows of Resources
Deferred Inflows Related to Pensions 171,311
Net Position:
Net Invested in capital assets, 22,940,200 21,304,001
Restricted assets 1,027,496 1,111,878
Unrestricted 13,014,662 14,304,730
Total Net Position $36,982,358 $36,720,609
Net Position
MCAG No. 2946 West Sound Utility District Management Discussion and Analysis
For the Year Ending December 31, 2016
Page 5
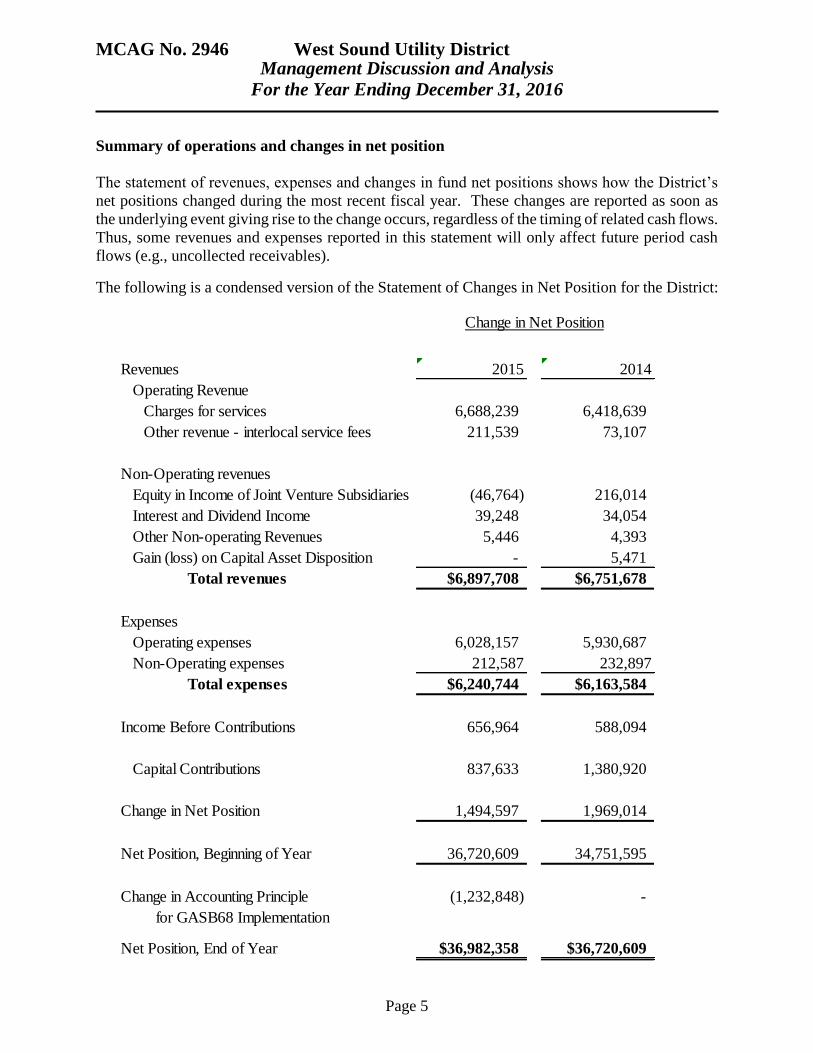
Summary of operations and changes in net position
The statement of revenues, expenses and changes in fund net positions shows how the District’s
net positions changed during the most recent fiscal year. These changes are reported as soon as
the underlying event giving rise to the change occurs, regardless of the timing of related cash flows.
Thus, some revenues and expenses reported in this statement will only affect future period cash
flows (e.g., uncollected receivables).
The following is a condensed version of the Statement of Changes in Net Position for the District:
Change in Net Position
Revenues 2015 2014
Operating Revenue
Charges for services 6,688,239 6,418,639
Other revenue - interlocal service fees 211,539 73,107
Non-Operating revenues
Equity in Income of Joint Venture Subsidiaries (46,764) 216,014
Interest and Dividend Income 39,248 34,054
Other Non-operating Revenues 5,446 4,393
Gain (loss) on Capital Asset Disposition - 5,471
Total revenues $6,897,708 $6,751,678
Expenses
Operating expenses 6,028,157 5,930,687
Non-Operating expenses 212,587 232,897
Total expenses $6,240,744 $6,163,584
Income Before Contributions 656,964 588,094
Capital Contributions 837,633 1,380,920
Change in Net Position 1,494,597 1,969,014
Net Position, Beginning of Year 36,720,609 34,751,595
Change in Accounting Principle (1,232,848) -
for GASB68 Implementation
Net Position, End of Year $36,982,358 $36,720,609
MCAG No. 2946 West Sound Utility District Management Discussion and Analysis
For the Year Ending December 31, 2016
Page 6
Total operating revenues for the District in 2015 was $6.9 million. There were rate increases for
both water and wastewater in 2015 and it reflected an increase in operating revenue.
The total contributions of 837,633 represent capital contributions from developers and a piece of
property, 2243 Karcher Rd. donated by the State of Washington Department of Enterprise Service
with a market value of $514,760.
Total operating expenses for 2015 was 6,028,156, an increase of 1.64%.
The notes to the District’s basic financial statements can be found on pages 13 - 32 of this report.
These notes provide additional information that is essential to a full understanding of the basic
financial statements.
CAPITAL ASSET AND DEBT ADMINISTRATION
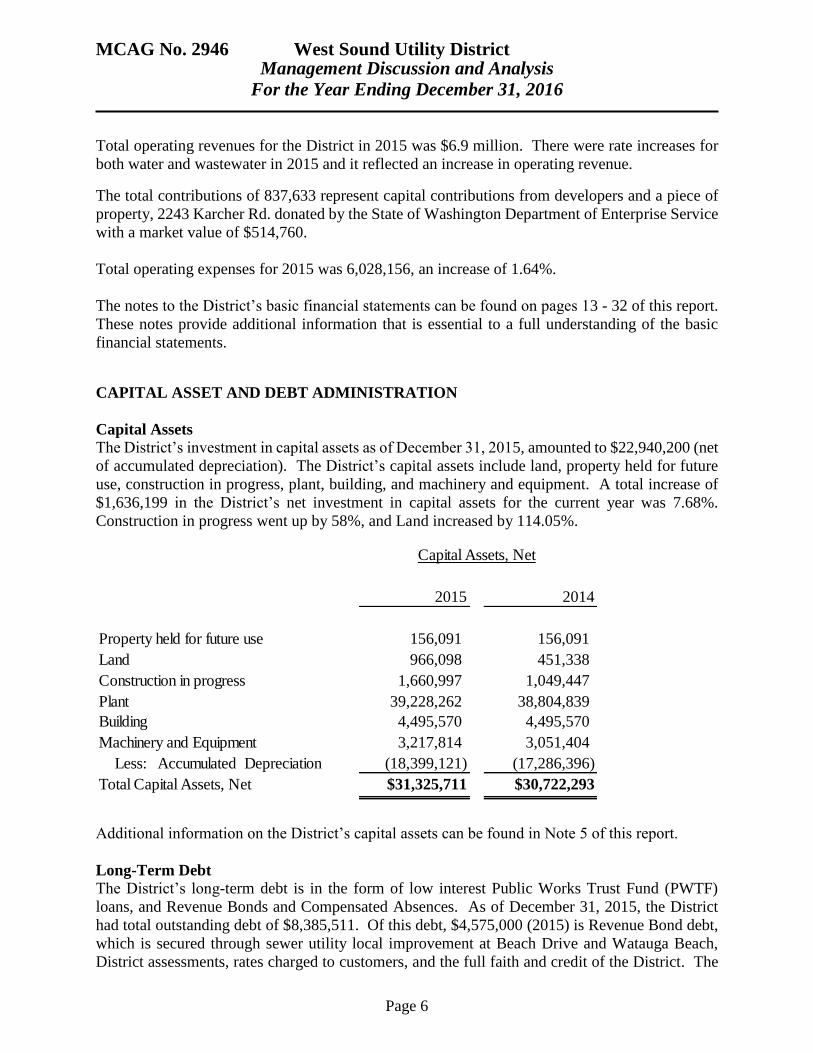
Capital Assets
The District’s investment in capital assets as of December 31, 2015, amounted to $22,940,200 (net
of accumulated depreciation). The District’s capital assets include land, property held for future
use, construction in progress, plant, building, and machinery and equipment. A total increase of
$1,636,199 in the District’s net investment in capital assets for the current year was 7.68%.
Construction in progress went up by 58%, and Land increased by 114.05%.
Additional information on the District’s capital assets can be found in Note 5 of this report.
Long-Term Debt
The District’s long-term debt is in the form of low interest Public Works Trust Fund (PWTF)
loans, and Revenue Bonds and Compensated Absences. As of December 31, 2015, the District
had total outstanding debt of $8,385,511. Of this debt, $4,575,000 (2015) is Revenue Bond debt,
which is secured through sewer utility local improvement at Beach Drive and Watauga Beach,
District assessments, rates charged to customers, and the full faith and credit of the District. The
Capital Assets, Net
2015 2014
Property held for future use 156,091 156,091
Land 966,098 451,338
Construction in progress 1,660,997 1,049,447
Plant 39,228,262 38,804,839
Building 4,495,570 4,495,570
Machinery and Equipment 3,217,814 3,051,404
Less: Accumulated Depreciation (18,399,121) (17,286,396)
Total Capital Assets, Net $31,325,711 $30,722,293
MCAG No. 2946 West Sound Utility District Management Discussion and Analysis
For the Year Ending December 31, 2016
Page 7
remaining debt of $3,810,511 consists of Public Works Trust Fund Loans, which are secured by
rates. Additionally, $485,333 is payable for accrued compensated absences at December 31, 2015
of this amount $408,237 is classified as long-term.
Additional information on the District’s long-term debt can be found in Note 6 of this report.
CASH FLOW
The District expects to see continued, but limited, growth within its service areas, over the next
few years, such that cash flow from operating activities should continue to meet the District’s
needs. In accordance with the District’s financial management policies, the District is responsible
for maintaining adequate fund balance (reserves) for each utility in order to provide sufficient cash
flows to meet operating and capital expenses, while also providing the financial ability to address
economic downturn and system emergencies. As a result, the District works to maintain fund
balances for each utility of no less than 15% (55 days) of total operating expenses to provide
sufficient cash flow to meet daily operating expenses and cover debt service payments.
FUTURE YEARS BUDGETARY IMPACTS
The District experienced limited growth in 2015 due to the community’s recovering economy.
There was an increase of 6.85% in water consumption in 2015. Hot weather during the summer
appears to have contributed to water consumed in 2015. During this economic recovery, the
District is continuing to refine its operational procedures and seek means to reduce operational
expenses and minimize the need for future debt financing. Furthermore, the District’s financial
management policies recognize the need to review utility rates annually to ensure sufficient
revenues and necessary adjustments are made to reflect inflation, construction needs, maintain
bonds covenants and avoid major periodical increases.
REQUESTS FOR INFORMATION
This financial report is designed to provide a general overview of the District’s finances for all
those with an interest in the financial health of the District’s water and wastewater utilities.
Questions concerning any of the information provided in this report or requests for additional
financial information should be addressed to the General Manager, West Sound Utility District,
2924 SE Lund Ave., Port Orchard, WA 98366.

MCAG No. 2946 West Sound Utility District Statement of Net Position As of December 31, 2016
Page 8
2015
ASSETS
Current Assets:
Cash, Cash Equivalents and Pooled Investments 6,004,811
Restricted Cash, Cash Equivalents and Investments 204,800
Accounts Receivable, net 747,132
Prepaid Assets 62,140
Total Current Assets $7,018,883
Noncurrent Assets:
Reserve Cash for Debt Service 822,696
Investment in JWWTF 8,372,544
Capital Assets Not Being Depreciated:
Property Held for Future Use 156,091
Land 966,098
Construction in Progress 1,660,997
Total capital, not being depreciated $2,783,186
Capital Assets Being Depreciated:
Plant 39,228,262
Building 4,495,570
Machinery and Equipment 3,217,814
Less Accumulated Depreciation (18,399,121)
$28,542,525
Total Capital Assets, net $31,325,711
Total Noncurrent Assets $40,520,951
TOTAL ASSETS $47,539,834
DEFERRED OUTFLOWS OF RESOURCES
Deferred Outlows Related to Pensions 120,531

MCAG No. 2946 West Sound Utility District Statement of Net Position As of December 31, 2016
Page 9
LIABILITIES
Current liabilities
Accounts payable 30,586
Debt interest payable 62,729
Deposits and other payables 410,186
Current Portion of Bonds Payable 530,000
Current Portion of loans payable to other governments 502,781
Current Portion of compensated absences 77,096
Total Current Liabilities $1,613,378
Noncurrent Liabilities:
Bonds payable, net 4,045,000
Loans payable to other governments, net 3,307,729
Accrued compensated absences, net 408,237
Net Pension Liabilities 1,132,351
Total Noncurrent liabilities $8,893,317
TOTAL LIABILITIES $10,506,695
DEFERRED INFLOWS OF RESOURCES
Deferred Inflows Related to Pensions $171,311
NET POSITION
Net investment in capital assets 22,940,200
Restricted 1,027,496
Unrestricted 13,014,662
TOTAL NET POSITION $36,982,358
*The accompanying notes are an integral part of this statement.

MCAG No. 2946 West Sound Utility District Statement of Revenues,
Expenses, and Changes in Fund Net Position For the Year Ending December 31, 2016
Page 10
2015OPERATING REVENUES:
Water Sales and Service Fees $2,971,844
Other Charges for Services-Water 103,802
Sewer Sales and Service Fees 3,530,463
Other Charges for Services-Sewer 82,129
Other Revenue: Interlocal Service Fees 211,539
Total Operating Revenue $6,899,777
OPERATING EXPENSES:
Operations:
General Operations 1,326,660
Cost of Energy 292,274
Contracted Processing and Operations 1,474,212
Maintenance 156,759
Administration:
General Administration 1,457,187
Depreciation and Amortization 1,112,725
Property, Excise and B&O Taxes 208,339
Total Operating Expenses $6,028,156
OPERATING INCOME $871,621
NONOPERATING REVENUES (EXPENSES):
Equity in Income of Joint Venture Subsidiaries (46,764)
Interest and Dividend Income 39,248
Interest Expense (212,587)
Other Nonoperating Revenues 5,446
Gain on Capital Asset Disposition -
Total Nonoperating Revenues (Expenses) (214,657)
$656,964
Capital Contributions-Water 708,598
Capital Contributions-Wastewater 129,035
Total Capital Contributions 837,633
CHANGE IN NET POSITION $1,494,597
TOTAL NET POSITION, January 1 $36,720,609
CHANGE IN ACCOUNTING PRINCIPLE ($1,232,848)for GASB 68 Implementation
TOTAL NET POSITION, December 31 $36,982,358
* The accompanying notes are an integral part of this statement.
INCOME BEFORE CONTRIBUTION

MCAG No. 2946 West Sound Utility District Statement of Cash Flows
For the Year Ending December 31, 2016
Page 11
Cash flows from operating activities: 2015
Receipts from customers $6,974,306
Payments to suppliers (3,010,237)
Payments to employees (1,959,767)
Net cash provided by operating activities 2,004,302
Cash flows from capital and related financing activities:
Principal paid on revenue bond and PWTF debt (1,032,781)
Proceeds from sale of fixed assets -
Acquisition and construction of capital assets (1,201,462)
Other Receipts 5,446
Interest paid on revenue bonds and PWTF debt (219,820)
Contributions from Developers 322,873
Net cash used by capital financing activities (2,125,743)
Cash flows from investing activities:
Interest and dividends on investments 39,248
Net cash provided by investing activities 39,248
Net (Decrease) in cash and cash equivalents (82,193)
Cash and cash equivalents at beginning of year: 7,114,500
Cash and cash equivalents at the end of year: $7,032,307
* The accompanying notes are an integral part of this statement.
MCAG No. 2946 West Sound Utility District Statement of Cash Flows
For the Year Ending December 31, 2016
Page 12
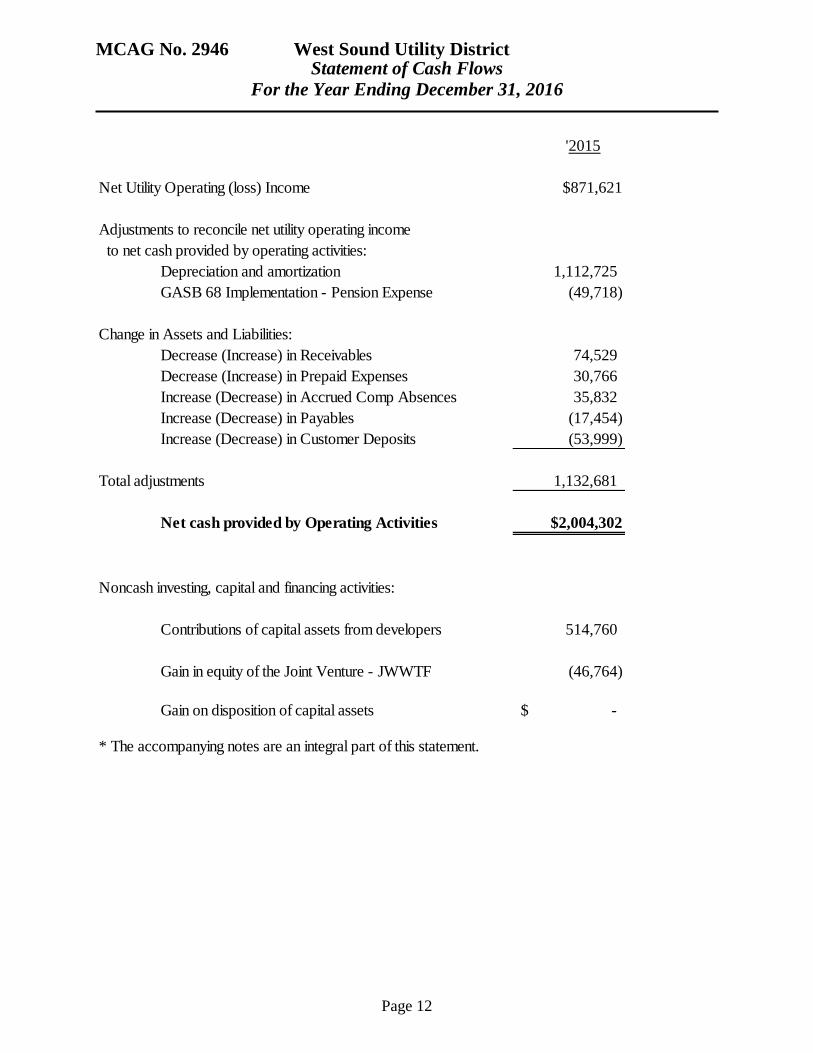
'2015
Net Utility Operating (loss) Income $871,621
Adjustments to reconcile net utility operating income
to net cash provided by operating activities:
Depreciation and amortization 1,112,725
GASB 68 Implementation - Pension Expense (49,718)
Change in Assets and Liabilities:
Decrease (Increase) in Receivables 74,529
Decrease (Increase) in Prepaid Expenses 30,766
Increase (Decrease) in Accrued Comp Absences 35,832
Increase (Decrease) in Payables (17,454)
Increase (Decrease) in Customer Deposits (53,999)
Total adjustments 1,132,681
Net cash provided by Operating Activities $2,004,302
Noncash investing, capital and financing activities:
Contributions of capital assets from developers 514,760
Gain in equity of the Joint Venture - JWWTF (46,764)
Gain on disposition of capital assets -$
* The accompanying notes are an integral part of this statement.
MCAG No. 2946 West Sound Utility District Notes to Financial Statements
For the Year Ending December 31, 2016
Page 13
NOTE 1 - SUMMARY OF SIGNIFICANT ACCOUNTING AND FINANCIAL POLICIES
The accounting policies of the District conform to generally accepted accounting principles
(GAAP) as applicable to proprietary funds of governments. The following is a summary of the
most significant policies (including identification of those policies which result in material
departures from the generally accepted accounting principles).
The following is a summary of the District’s most significant policies:
A. Reporting Entity
West Sound Utility District is a municipal corporation formed on November 27, 2007,
through a merger of Annapolis Water District and Karcher Creek Sewer District. The
District was governed in 2015 by an elected three- member Board of Commissioners. As
required by generally accepted accounting principles, management has considered all
potential component units in defining the reporting entity.
The District’s financial statements include the financial position and results of operations
of all enterprise operations which the District manages. (See Note 8). The financial
statements include, as well, the assets and liabilities of all funds for which the District has
a custodial responsibility.
B. Basis of Accounting and Presentation
The accounting records of the District are maintained in accordance with methods
prescribed by the State Auditor under the authority of Chapter 43.09 RCW. The District
uses the Uniform System of Accounts for Class B Utilities.
The District’s “proprietary funds” (“Enterprise Utilities” and “Internal Service” funds) are
accounted for using the full-accrual basis of accounting where revenues are recognized
when earned and expenses are recognized when incurred. Capital asset purchases are
capitalized and long-term liabilities are accounted for in the appropriate funds.
The District distinguishes between operating revenues and expenses from non-operating
items. Operating revenues and expenses result from providing services and producing and
delivering goods in connection with a proprietary fund’s principal ongoing operations. The
principal operating revenues of the District are charges to customers for water and sewer
usage fees and other services. Operating expenses for the District include the cost of sales
and services, administrative expenses, depreciation on capital assets, etc. All revenues and
expenses not meeting this definition are reported as non-operating revenues and expenses.
C. Financial Management Policies:
The Board of Commissioners has adopted comprehensive financial management policies
which are reviewed and updated during the District’s annual or biennial budget process.
The financial health and welfare of the District is highly dependent upon establishing and
maintaining sound, financial-planning objectives and strategies of implementation. As a
result, the implementation of these policies provides direction in the decision-making
process of the District’s Board of Commissioners and District administration while
MCAG No. 2946 West Sound Utility District Notes to Financial Statements
For the Year Ending December 31, 2016
Page 14
operating to provide stability of changing service and financial conditions. Such policies
enable District officials to protect the public interest and ensure trust and confidence in the
District’s management of water and wastewater operations and assets. The District’s
financial management policies include the following components: financial philosophies;
budget process; basis of accounting and budgeting; accounting financial reporting,
forecasting, information system integrity and auditing policies; operating budget policies:
revenue and expenditure policies; capital improvement policies; utility fund policies;
internal service fund policies; investment policies and cash management; and debt
management policies.
D. Cash and Cash Equivalents
For purposes of the statement of cash flows, the District considers all highly liquid
investments (including restricted assets) with a maturity of three months or less purchased
to be cash equivalents.
E. Capital Assets
See Note (5)
F. Investments
Investments are stated at fair value. Interest on debt securities is recognized in non-
operating revenues as earned. Changes in the fair value of investments are also included
in non-operating revenues (expenses). The average interest rate earned from these
investments was at .64%. Noncurrent assets consist of reserve cash, assets, and real estate
held for future use. It is displayed on the “Statement of Net Position” at historical cost.
G. Receivables
Customer accounts receivable consist of amounts owed from private individuals or
organizations for goods and services, including amounts owed for which billings have not
been prepared. The District files property liens after following prescribed procedures for
collections. As a result, there are no billed accounts which are considered not collectible.
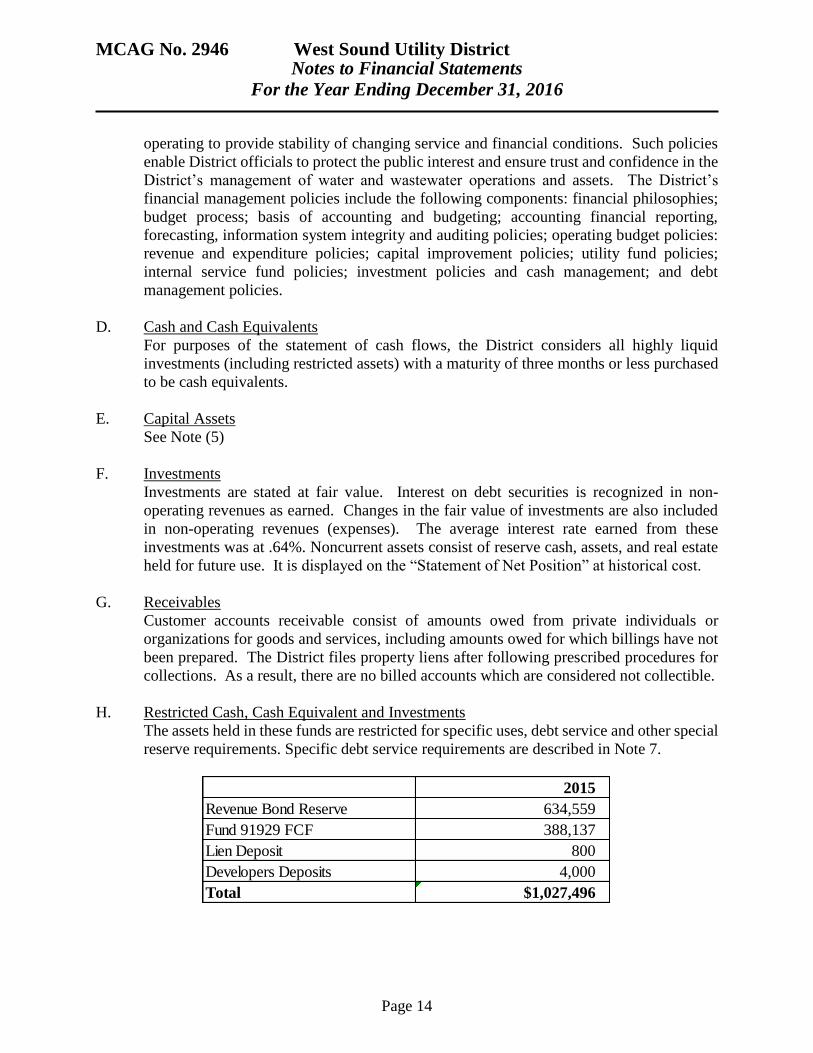
H. Restricted Cash, Cash Equivalent and Investments
The assets held in these funds are restricted for specific uses, debt service and other special
reserve requirements. Specific debt service requirements are described in Note 7.
2015
Revenue Bond Reserve 634,559
Fund 91929 FCF 388,137
Lien Deposit 800
Developers Deposits 4,000
Total $1,027,496
MCAG No. 2946 West Sound Utility District Notes to Financial Statements
For the Year Ending December 31, 2016
Page 15
I. Capital Assets and Depreciation
Major expenses of capital assets and major repairs that increase the useful lives are
capitalized. The District capitalizes purchases that meet this criterion when the individual
cost threshold exceeds $5,000, as set for in Resolution 337-12 “Capital Assets Policy”.
Maintenance, repairs and minor renewals are accounted for as expenses when incurred.
All capital assets are valued at historical cost or estimated cost. Estimated costs are
established where historical cost is not known. Donations by developers and customers
are recorded at the donor cost.
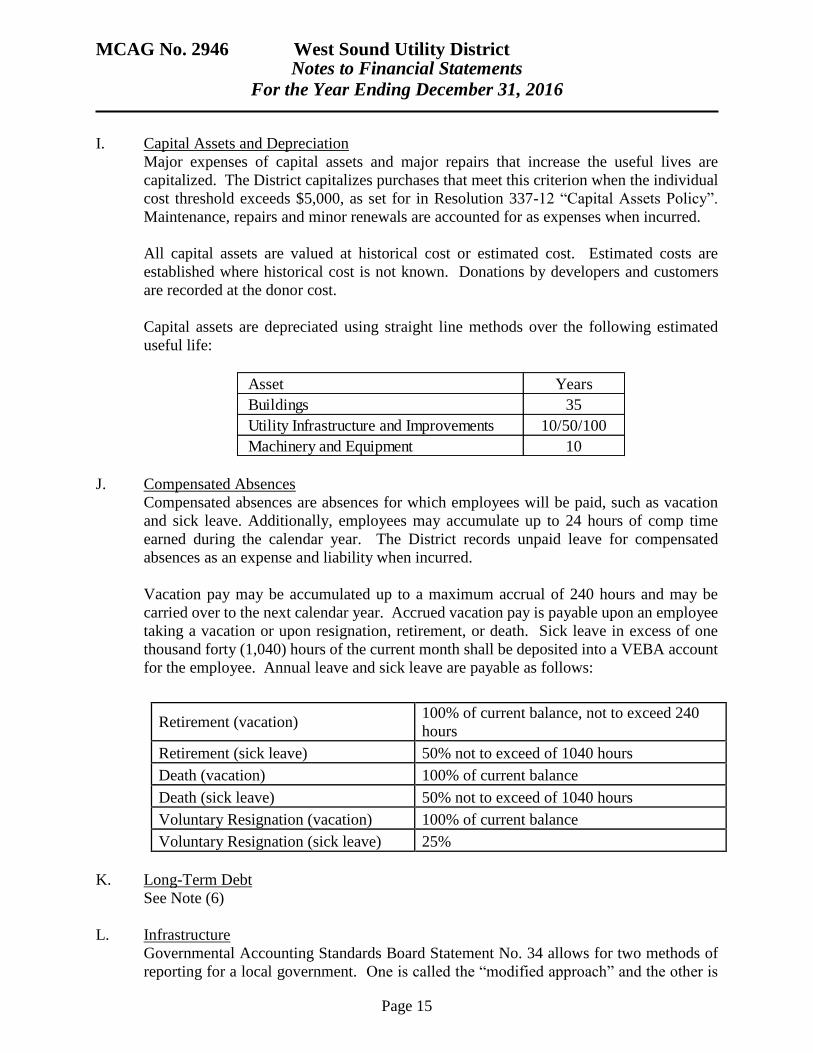
Capital assets are depreciated using straight line methods over the following estimated
useful life:
J. Compensated Absences
Compensated absences are absences for which employees will be paid, such as vacation
and sick leave. Additionally, employees may accumulate up to 24 hours of comp time
earned during the calendar year. The District records unpaid leave for compensated
absences as an expense and liability when incurred.
Vacation pay may be accumulated up to a maximum accrual of 240 hours and may be
carried over to the next calendar year. Accrued vacation pay is payable upon an employee
taking a vacation or upon resignation, retirement, or death. Sick leave in excess of one
thousand forty (1,040) hours of the current month shall be deposited into a VEBA account
for the employee. Annual leave and sick leave are payable as follows:
Retirement (vacation) 100% of current balance, not to exceed 240
hours
Retirement (sick leave) 50% not to exceed of 1040 hours
Death (vacation) 100% of current balance
Death (sick leave) 50% not to exceed of 1040 hours
Voluntary Resignation (vacation) 100% of current balance
Voluntary Resignation (sick leave) 25%
K. Long-Term Debt
See Note (6)
L. Infrastructure
Governmental Accounting Standards Board Statement No. 34 allows for two methods of
reporting for a local government. One is called the “modified approach” and the other is
Asset Years
Buildings 35
Utility Infrastructure and Improvements 10/50/100
Machinery and Equipment 10
MCAG No. 2946 West Sound Utility District Notes to Financial Statements
For the Year Ending December 31, 2016
Page 16
based upon “historical cost”. The District has always reported its infrastructure on a
historical cost basis with a corresponding offset as accumulated depreciation. The District
will continue to use “historical cost” as the basis of reporting its infrastructure and use
straight-line depreciation as the methods to depict the value of the asset being used over
time.
M. Pensions
For purposes of measuring the net pension liability, deferred outflows of resources and
deferred inflows of resources related to pensions, and pension expense, information about
the fiduciary net position of all the state sponsored pension plans and additions
to/deductions from those plans’ fiduciary net position have been determined on the same
basis as they are reported by the Washington State Department of Retirement Systems. For
this purpose, benefit payments (including refunds of employee contributions) are
recognized when due and payable in accordance with the benefit terms. Investments are
reported at fair value.
NOTE 2 – DEPOSITS AND INVESTMENTS
A. Deposits
Kitsap County is the Treasurer for the District’s funds. The District’s deposits with the
Kitsap County Treasurer are covered by Federal Depository Insurance (FDIC) or by
collateral held in a multiple financial institution collateral pool administered by the
Washington Public Deposit Protection Commission.
B. Investments
As required by state law, all investments of the District’s funds must be obligations of the
U.S Government, U.S. agency issues, obligations of the State of Washington, general
obligations of Washington State municipalities, the Kitsap County’s Investment Pool, or
certificates of deposit with Washington State banks and savings and loan institutions. All
temporary investments are stated at fair value.
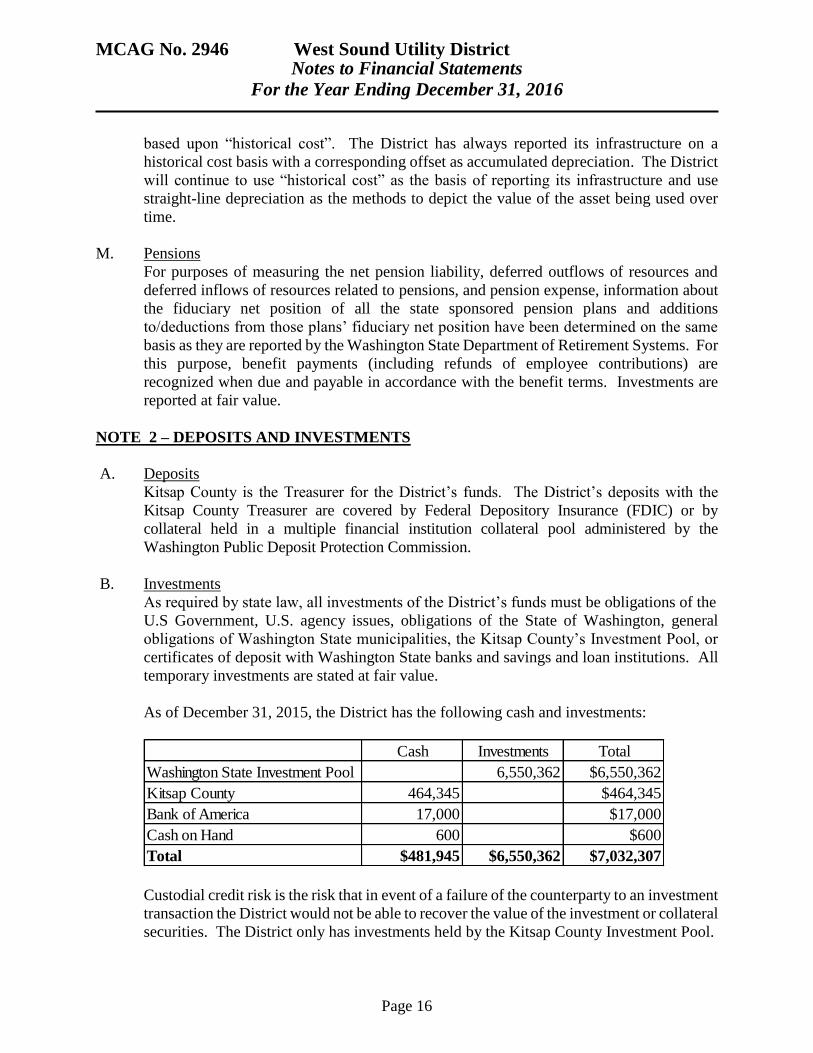
As of December 31, 2015, the District has the following cash and investments:
Custodial credit risk is the risk that in event of a failure of the counterparty to an investment
transaction the District would not be able to recover the value of the investment or collateral
securities. The District only has investments held by the Kitsap County Investment Pool.
Cash Investments Total
Washington State Investment Pool 6,550,362 $6,550,362
Kitsap County 464,345 $464,345
Bank of America 17,000 $17,000
Cash on Hand 600 $600
Total $481,945 $6,550,362 $7,032,307
MCAG No. 2946 West Sound Utility District Notes to Financial Statements
For the Year Ending December 31, 2016
Page 17
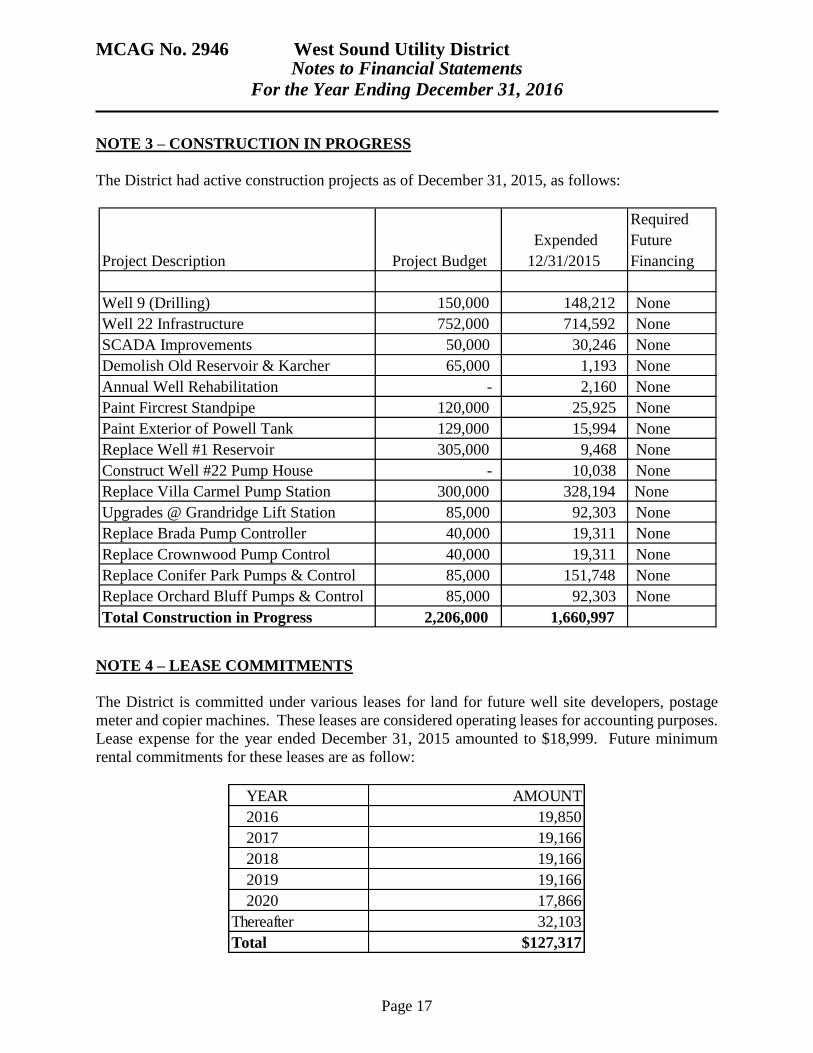
NOTE 3 – CONSTRUCTION IN PROGRESS
The District had active construction projects as of December 31, 2015, as follows:
NOTE 4 – LEASE COMMITMENTS
The District is committed under various leases for land for future well site developers, postage
meter and copier machines. These leases are considered operating leases for accounting purposes.
Lease expense for the year ended December 31, 2015 amounted to $18,999. Future minimum
rental commitments for these leases are as follow:
YEAR AMOUNT
2016 19,850
2017 19,166
2018 19,166
2019 19,166
2020 17,866
Thereafter 32,103
Total $127,317
Project Description Project Budget
Expended
12/31/2015
Required
Future
Financing
Well 9 (Drilling) 150,000 148,212 None
Well 22 Infrastructure 752,000 714,592 None
SCADA Improvements 50,000 30,246 None
Demolish Old Reservoir & Karcher 65,000 1,193 None
Annual Well Rehabilitation - 2,160 None
Paint Fircrest Standpipe 120,000 25,925 None
Paint Exterior of Powell Tank 129,000 15,994 None
Replace Well #1 Reservoir 305,000 9,468 None
Construct Well #22 Pump House - 10,038 None
Replace Villa Carmel Pump Station 300,000 328,194 None
Upgrades @ Grandridge Lift Station 85,000 92,303 None
Replace Brada Pump Controller 40,000 19,311 None
Replace Crownwood Pump Control 40,000 19,311 None
Replace Conifer Park Pumps & Control 85,000 151,748 None
Replace Orchard Bluff Pumps & Control 85,000 92,303 None
Total Construction in Progress 2,206,000 1,660,997

MCAG No. 2946 West Sound Utility District Notes to Financial Statements
For the Year Ending December 31, 2016
Page 18
NOTE 5 – CAPITAL ASSETS
Capital Assets activity for the year ended December 31, 2015, was as follows:
NOTE 6 – LONG-TERM DEBT AND LIABILITIES
A. Long-Term Debt
The District issues special revenue bonds and government loans to finance the purchase
and construction of capital assets.
Schedule 09 which accompanies this report on page 39 contains a list of outstanding debt
at December 31, 2015. The annual requirements to amortize all debts outstanding as of
December 31, 2015, including interest, are as follows:
Beginning
Balance
01/01/2015
Increases Decreases Transfers
Ending
Balance
12/31/2015
Capital Assets, not being depreciated:
Property held for future use 156,091 156,091
Land 451,338 514,760 966,098
Construction in progress 1,049,447 1,090,886 -61,437 -417,899 1,660,997
Total Capital Assets, not being Depreciated $1,656,876 $1,605,646 ($61,437) ($417,899) $2,783,186
Capital Assets, being Depreciated:
Buildings 4,495,570 4,495,570
Utility Infrastructure and Improvements 38,804,839 5,524 417,899 39,228,262
Machinery and Equipment 3,051,404 166,410 3,217,814
Total Capital Assets being Depreciated $46,351,813 $171,934 $0 $417,899 $46,941,646
Less Accumulated Depreciation for:
Buildings -1,469,232 -128,882 -1,598,114
Utility Infrastructure and Improvements -13,922,950 -804,994 -14,727,944
Machinery and Equipment -1,894,214 -178,849 -2,073,063
Total Accumulated Depreciation (17,286,396) (1,112,725) (18,399,121)
Total Capital Assets being Depreciated, net 29,065,417 (940,791) 417,899 28,542,525
Total Capital Assets, net $30,722,293 $664,855 ($61,437) $0 $31,325,711

MCAG No. 2946 West Sound Utility District Notes to Financial Statements
For the Year Ending December 31, 2016
Page 19
B. Change in Long Term Liabilities
During the year ended December 31, 2015 the following changes occurred in long-term
liabilities:
NOTE 7 – RESTRICTED CASH
The District’s statement of net position reports, $1,027,496, at December 31, 2015 of restricted for
revenue debt service, none of which are restricted by enabling legislation. These are restricted for
Revenue Bonds reserve requirement, FCF reserve, customer lien satisfaction and Developers
deposits.
NOTE 8 – INVESTMENT IN JOINT WASTEWATER TREATMENT FACILITY
In 1982, the District entered into an agreement with the City of Port Orchard to be included within
the boundaries of a utility local improvement district (ULID). The purpose of the ULID was to
fund the construction of a new Joint Wastewater Treatment Facility (JWWTF). Construction of
the joint facility was completed in 1985.
2016 1,032,781 198,968 1,231,749
2017 1,052,781 176,380 1,229,161
2018 1,062,781 151,511 1,214,292
2019 1,032,781 125,204 1,157,985
2020 918,748 100,644 1,019,392
2021-2025 2,319,685 286,115 2,605,800
2026-2030 949,574 60,202 1,009,776
2031-2031 16,380 41 16,421
Total $8,385,511 $1,099,065 $9,484,576
Principal Interest TotalYear Ending
December 31
Beginning Balance
1/1/2015Additions Reduction
Ending Balance
12/31/2015
Due within
One Year
Revenue Bonds 5,105,000 530,000 4,575,000 530,000
Government Loans 4,313,291 502,780 3,810,511 502,781
Net Pension Liabilities * 922,450 209,901 - 1,132,351 -
Compensated Absences 449,502 35,831 485,333 77,096
Total $10,790,243 $245,732 $1,032,780 $10,003,195 $1,109,877
Less Current Portion $1,109,877
Total Long-Term Liabilities, net $8,893,317
* Beginning balance was restated for implementation of GASB 68
MCAG No. 2946 West Sound Utility District Notes to Financial Statements
For the Year Ending December 31, 2016
Page 20
In 2002, the District and City continued the expansion plans of the Facility. The cost of this
expansion was $21.5 million. This project funding was approved for a $10 million Public Works
Trust Fund (PWTF) loan in 2002 and a $6.8 million PWTF loan in 2004. The City of Port Orchard
was the lead agency for the expansion project and funding, with the City being the borrowing
governmental entity on the PWTF loans. Funds from the JWWTF operating budget are transferred
to the City to pay for the two loans. The City transferred the related assets and liabilities to the
Facility upon completion of the project. The City and District have approved using a part of the
wastewater treatment capital fees collected by each entity to assist with the annual debt payments
on the PWTF loans. This cost sharing formula was 50/50%, and in 2015, each entity contributed
$200,000 from these capital fees.
The Joint Wastewater Treatment Facility is jointly owned by the City of Port Orchard and West
Sound Utility District, (formerly known as Karcher Creek Sewer District) each having a fifty
percent (50%) ownership interest in the JWWTF. In accordance with the generally accepted
accounting principles, the proportional shares of the Joint Venture’s results of operations are
presented as a single operating account on the City’s proprietary fund’s operating statements –
“Investment in JWWTF”. In 2015, the change in the District’s equity in the JWWTF was a
decreased of $46,764. The District’s equity interest in the JWWTF as of December 31, 2015, was
$8,372,544 (see JWWTF Financial Statements for further information).
In 1983, West Sound Utility District (known then as Karcher Creek Sewer District) and the City
of Port Orchard entered into an interlocal cooperative agreement giving the District operation and
management responsibilities for the JWWTF. In 2014, the District and City negotiated and
executed a new interlocal agreement which resulted in extending the responsibility of the District
in managing and operating the JWWTF, in addition to resolving issues pertaining to property and
asset ownership, liability and insurance.
The District accounts for its investment in the JWWTF on an equity method, whereby the District's
share of the treatment plant's income or losses, assets and liabilities, are reflected as increases or
decreases in its investment account balance.
The District’s Finance Department maintains separate accounting records for the operating and
maintenance expenses and revenues and prepares separate financial statements of the JWWTF.
The City of Port Orchard maintains all accounting records regarding the expansion project. The
District provides accounting and financial support services to the Facility, and accounting and
finance statements for the Facility can be obtained at the District office, 2924 SE Lund Ave., Port
Orchard, WA, or the District’s website at www.wsud.us.
The District does not anticipate that the joint venture will cause fiscal stress to the District in the
future.
NOTE 9 – PENSION PLANS
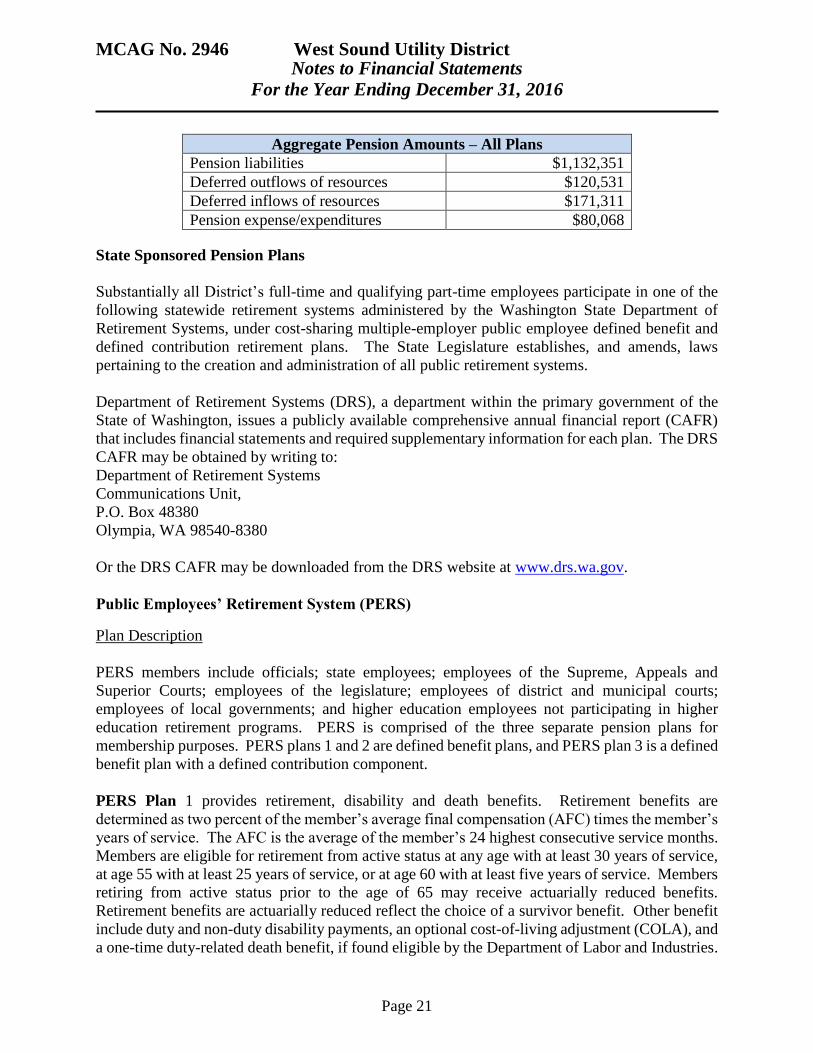
The following table represents the aggregate pension amounts for all plans subject to the
requirements of the GASB Statement 68, Accounting and Financial Reporting for Pensions for
the year 2015:
MCAG No. 2946 West Sound Utility District Notes to Financial Statements
For the Year Ending December 31, 2016
Page 21
Aggregate Pension Amounts – All Plans
Pension liabilities $1,132,351
Deferred outflows of resources $120,531
Deferred inflows of resources $171,311
Pension expense/expenditures $80,068
State Sponsored Pension Plans
Substantially all District’s full-time and qualifying part-time employees participate in one of the
following statewide retirement systems administered by the Washington State Department of
Retirement Systems, under cost-sharing multiple-employer public employee defined benefit and
defined contribution retirement plans. The State Legislature establishes, and amends, laws
pertaining to the creation and administration of all public retirement systems.
Department of Retirement Systems (DRS), a department within the primary government of the
State of Washington, issues a publicly available comprehensive annual financial report (CAFR)
that includes financial statements and required supplementary information for each plan. The DRS
CAFR may be obtained by writing to:
Department of Retirement Systems
Communications Unit,
P.O. Box 48380
Olympia, WA 98540-8380
Or the DRS CAFR may be downloaded from the DRS website at www.drs.wa.gov.
Public Employees’ Retirement System (PERS)
Plan Description
PERS members include officials; state employees; employees of the Supreme, Appeals and
Superior Courts; employees of the legislature; employees of district and municipal courts;
employees of local governments; and higher education employees not participating in higher
education retirement programs. PERS is comprised of the three separate pension plans for
membership purposes. PERS plans 1 and 2 are defined benefit plans, and PERS plan 3 is a defined
benefit plan with a defined contribution component.
PERS Plan 1 provides retirement, disability and death benefits. Retirement benefits are
determined as two percent of the member’s average final compensation (AFC) times the member’s
years of service. The AFC is the average of the member’s 24 highest consecutive service months.
Members are eligible for retirement from active status at any age with at least 30 years of service,
at age 55 with at least 25 years of service, or at age 60 with at least five years of service. Members
retiring from active status prior to the age of 65 may receive actuarially reduced benefits.
Retirement benefits are actuarially reduced reflect the choice of a survivor benefit. Other benefit
include duty and non-duty disability payments, an optional cost-of-living adjustment (COLA), and
a one-time duty-related death benefit, if found eligible by the Department of Labor and Industries.
MCAG No. 2946 West Sound Utility District Notes to Financial Statements
For the Year Ending December 31, 2016
Page 22
PERS 1 members were vested after the completion of five years of eligible service. The plan was
closed to new entrants on September 30, 1977.
Contributions
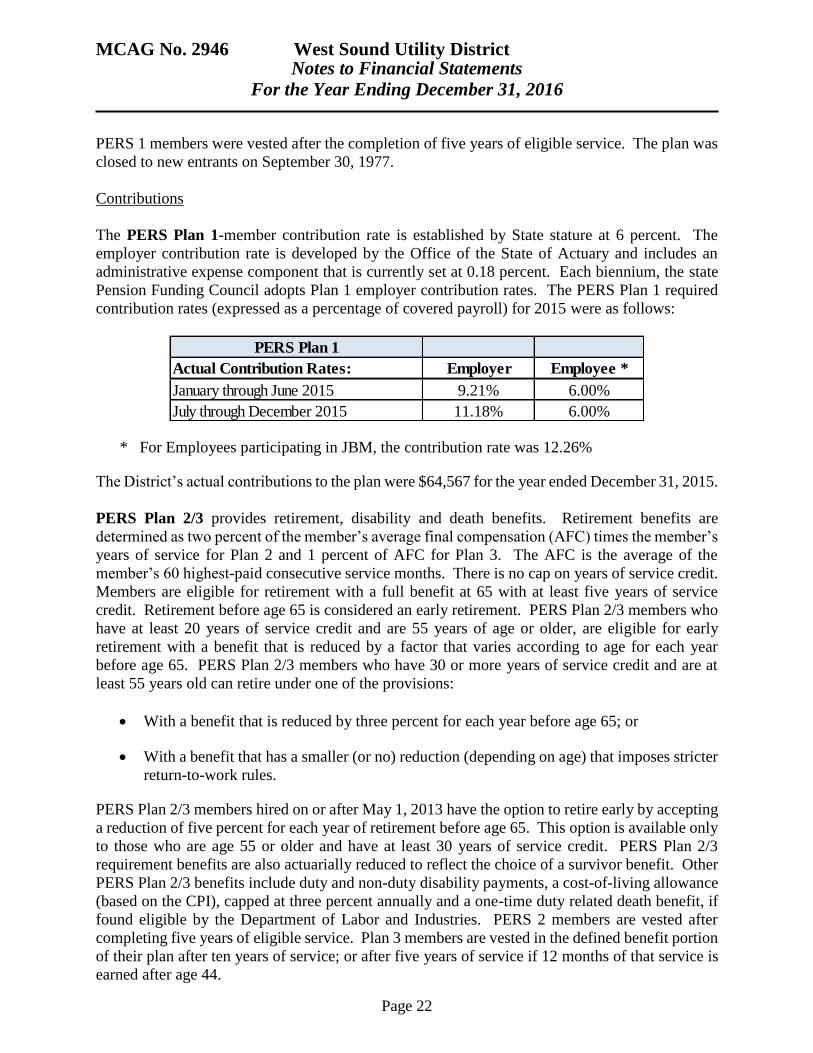
The PERS Plan 1-member contribution rate is established by State stature at 6 percent. The
employer contribution rate is developed by the Office of the State of Actuary and includes an
administrative expense component that is currently set at 0.18 percent. Each biennium, the state
Pension Funding Council adopts Plan 1 employer contribution rates. The PERS Plan 1 required
contribution rates (expressed as a percentage of covered payroll) for 2015 were as follows:
* For Employees participating in JBM, the contribution rate was 12.26%
The District’s actual contributions to the plan were $64,567 for the year ended December 31, 2015.
PERS Plan 2/3 provides retirement, disability and death benefits. Retirement benefits are
determined as two percent of the member’s average final compensation (AFC) times the member’s
years of service for Plan 2 and 1 percent of AFC for Plan 3. The AFC is the average of the
member’s 60 highest-paid consecutive service months. There is no cap on years of service credit.
Members are eligible for retirement with a full benefit at 65 with at least five years of service
credit. Retirement before age 65 is considered an early retirement. PERS Plan 2/3 members who
have at least 20 years of service credit and are 55 years of age or older, are eligible for early
retirement with a benefit that is reduced by a factor that varies according to age for each year
before age 65. PERS Plan 2/3 members who have 30 or more years of service credit and are at
least 55 years old can retire under one of the provisions:
With a benefit that is reduced by three percent for each year before age 65; or
With a benefit that has a smaller (or no) reduction (depending on age) that imposes stricter
return-to-work rules.
PERS Plan 2/3 members hired on or after May 1, 2013 have the option to retire early by accepting
a reduction of five percent for each year of retirement before age 65. This option is available only
to those who are age 55 or older and have at least 30 years of service credit. PERS Plan 2/3
requirement benefits are also actuarially reduced to reflect the choice of a survivor benefit. Other
PERS Plan 2/3 benefits include duty and non-duty disability payments, a cost-of-living allowance
(based on the CPI), capped at three percent annually and a one-time duty related death benefit, if
found eligible by the Department of Labor and Industries. PERS 2 members are vested after
completing five years of eligible service. Plan 3 members are vested in the defined benefit portion
of their plan after ten years of service; or after five years of service if 12 months of that service is
earned after age 44.
PERS Plan 1
Actual Contribution Rates: Employer Employee *
January through June 2015 9.21% 6.00%
July through December 2015 11.18% 6.00%
MCAG No. 2946 West Sound Utility District Notes to Financial Statements
For the Year Ending December 31, 2016
Page 23
PERS Plan 3 defined contribution benefits are totally dependent on employee contributions and
investment earnings on those contributions. PERS Plan 3 members choose their contribution rate
upon joining membership and have a chance to change rates upon changing employers. As
established by statute, Plan 3 required defined contribution rates are set at a minimum of 5 percent
and escalate to 15 percent with a choice of six options. Employers do not contribute to the defined
contribution benefits. PERS Plan 3 members are immediately vested in the defined contribution
portion of their plan.
Contributions
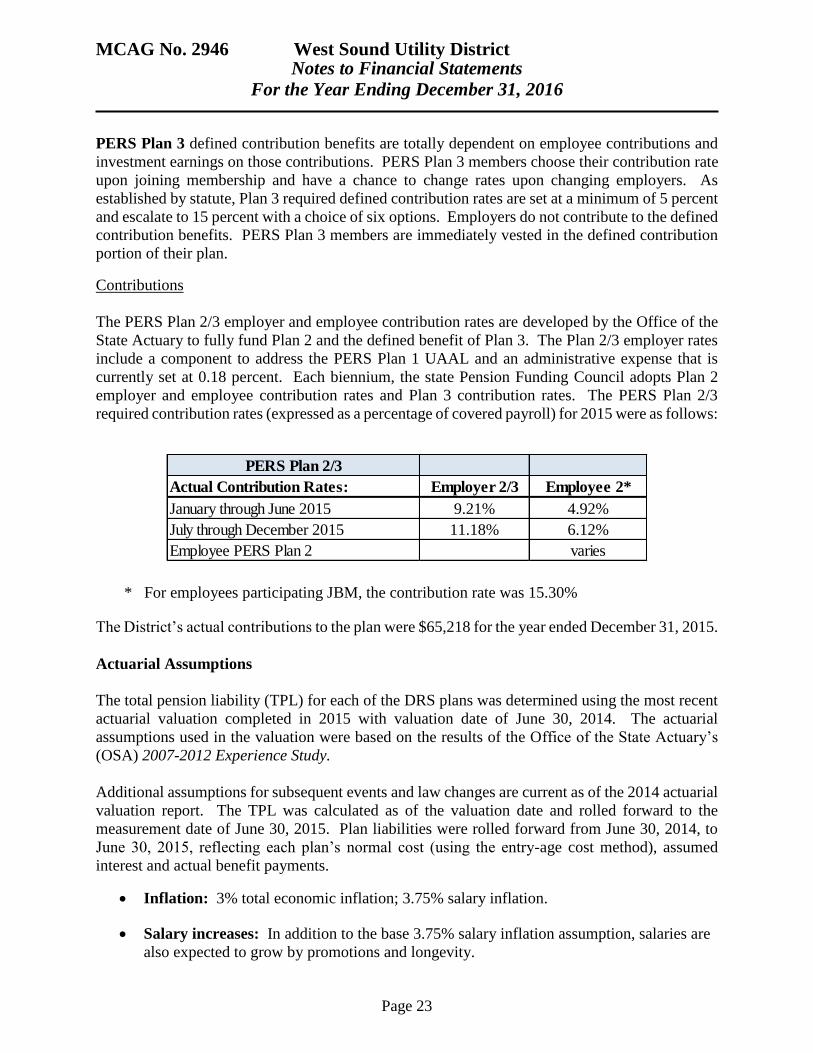
The PERS Plan 2/3 employer and employee contribution rates are developed by the Office of the
State Actuary to fully fund Plan 2 and the defined benefit of Plan 3. The Plan 2/3 employer rates
include a component to address the PERS Plan 1 UAAL and an administrative expense that is
currently set at 0.18 percent. Each biennium, the state Pension Funding Council adopts Plan 2
employer and employee contribution rates and Plan 3 contribution rates. The PERS Plan 2/3
required contribution rates (expressed as a percentage of covered payroll) for 2015 were as follows:
* For employees participating JBM, the contribution rate was 15.30%
The District’s actual contributions to the plan were $65,218 for the year ended December 31, 2015.
Actuarial Assumptions
The total pension liability (TPL) for each of the DRS plans was determined using the most recent
actuarial valuation completed in 2015 with valuation date of June 30, 2014. The actuarial
assumptions used in the valuation were based on the results of the Office of the State Actuary’s
(OSA) 2007-2012 Experience Study.
Additional assumptions for subsequent events and law changes are current as of the 2014 actuarial
valuation report. The TPL was calculated as of the valuation date and rolled forward to the
measurement date of June 30, 2015. Plan liabilities were rolled forward from June 30, 2014, to
June 30, 2015, reflecting each plan’s normal cost (using the entry-age cost method), assumed
interest and actual benefit payments.
Inflation: 3% total economic inflation; 3.75% salary inflation.
Salary increases: In addition to the base 3.75% salary inflation assumption, salaries are
also expected to grow by promotions and longevity.
PERS Plan 2/3
Actual Contribution Rates: Employer 2/3 Employee 2*
January through June 2015 9.21% 4.92%
July through December 2015 11.18% 6.12%
Employee PERS Plan 2 varies
MCAG No. 2946 West Sound Utility District Notes to Financial Statements
For the Year Ending December 31, 2016
Page 24
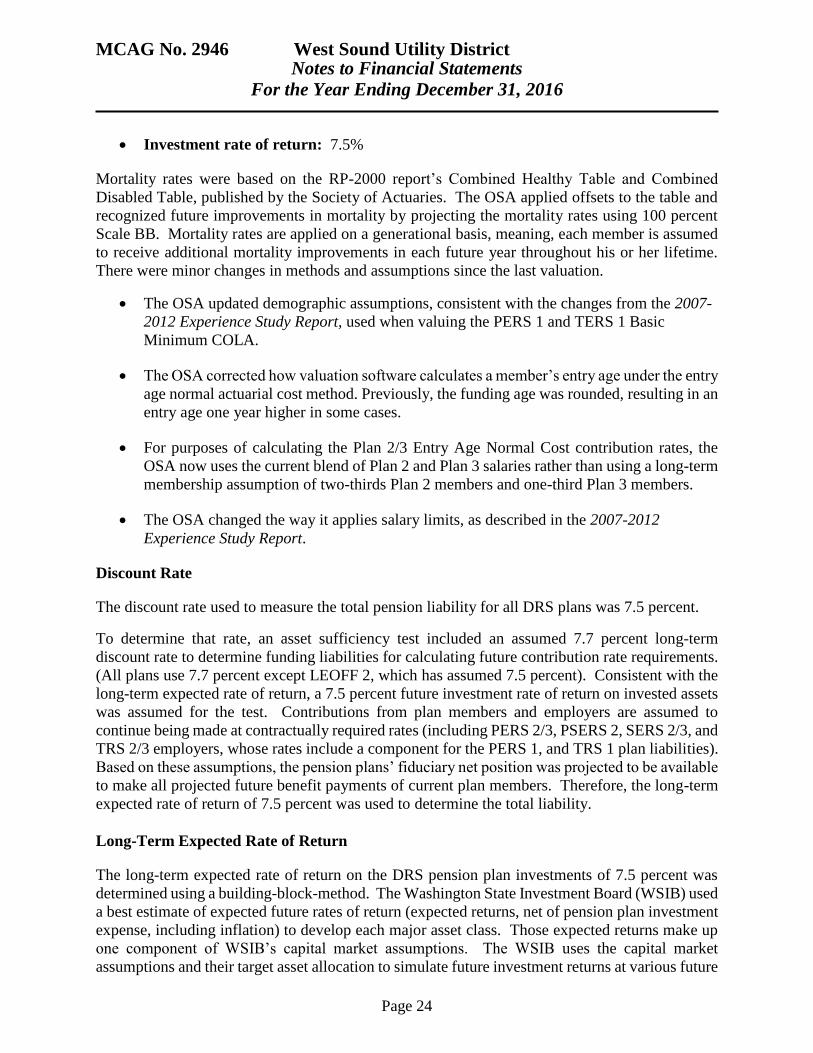
Investment rate of return: 7.5%
Mortality rates were based on the RP-2000 report’s Combined Healthy Table and Combined
Disabled Table, published by the Society of Actuaries. The OSA applied offsets to the table and
recognized future improvements in mortality by projecting the mortality rates using 100 percent
Scale BB. Mortality rates are applied on a generational basis, meaning, each member is assumed
to receive additional mortality improvements in each future year throughout his or her lifetime.
There were minor changes in methods and assumptions since the last valuation.
The OSA updated demographic assumptions, consistent with the changes from the 2007-
2012 Experience Study Report, used when valuing the PERS 1 and TERS 1 Basic
Minimum COLA.
The OSA corrected how valuation software calculates a member’s entry age under the entry
age normal actuarial cost method. Previously, the funding age was rounded, resulting in an
entry age one year higher in some cases.
For purposes of calculating the Plan 2/3 Entry Age Normal Cost contribution rates, the
OSA now uses the current blend of Plan 2 and Plan 3 salaries rather than using a long-term
membership assumption of two-thirds Plan 2 members and one-third Plan 3 members.
The OSA changed the way it applies salary limits, as described in the 2007-2012
Experience Study Report.
Discount Rate
The discount rate used to measure the total pension liability for all DRS plans was 7.5 percent.
To determine that rate, an asset sufficiency test included an assumed 7.7 percent long-term
discount rate to determine funding liabilities for calculating future contribution rate requirements.
(All plans use 7.7 percent except LEOFF 2, which has assumed 7.5 percent). Consistent with the
long-term expected rate of return, a 7.5 percent future investment rate of return on invested assets
was assumed for the test. Contributions from plan members and employers are assumed to
continue being made at contractually required rates (including PERS 2/3, PSERS 2, SERS 2/3, and
TRS 2/3 employers, whose rates include a component for the PERS 1, and TRS 1 plan liabilities).
Based on these assumptions, the pension plans’ fiduciary net position was projected to be available
to make all projected future benefit payments of current plan members. Therefore, the long-term
expected rate of return of 7.5 percent was used to determine the total liability.
Long-Term Expected Rate of Return
The long-term expected rate of return on the DRS pension plan investments of 7.5 percent was
determined using a building-block-method. The Washington State Investment Board (WSIB) used
a best estimate of expected future rates of return (expected returns, net of pension plan investment
expense, including inflation) to develop each major asset class. Those expected returns make up
one component of WSIB’s capital market assumptions. The WSIB uses the capital market
assumptions and their target asset allocation to simulate future investment returns at various future

MCAG No. 2946 West Sound Utility District Notes to Financial Statements
For the Year Ending December 31, 2016
Page 25
times. The long-term expected rate of return of 7.5 percent approximately equals to median of the
simulated investments over a 50-year time horizon
Estimated Rates of Return by Asset Class
Best estimates of arithmetic real rates of return for each major asset class included in the pension
plan’s target asset allocation as of June 30, 2015, are summarized in the table below. The inflation
component used to create the table is 2.2 percent and represents the WSIB’s most recent long-term
estimate of broad economic inflation.
Sensitivity of NPL
The table below presents the (city/county/district’s) proportionate share* of the net pension
liability calculated using the discounts rate of 7.5 percent, as well as what the
(city/county/district’s) proportionate share of the net pension would be if it were calculated using
a discount rate that is 1-percentage point lower (6.5 percent) or 1-percentage point higher (8.5
percent) than the current rate.
Pension Plan Fiduciary Net Position
Detailed information about the State’s pension plans’ fiduciary net position is available in the
separately issued DRS financial report.
1%
Decrease
(6.5%)
Current
Discount
Rate (7.5%)
1%
Increase
(8.5%)
PERS 1 $811,305 $666,363 $541,736
PERS 2/3 $1,362,572 $465,988 ($220,493)
Asset Class Target
Allocation
% Long-Term
Expected Real
Rate of Return
Arithmetic
Fixed Income 20% 1.70%
Tangible Assets 5% 4.40%
Real Estate 15% 5.80%
Global Equity 37% 6.60%
Private Equity 23% 9.60%
100%

MCAG No. 2946 West Sound Utility District Notes to Financial Statements
For the Year Ending December 31, 2016
Page 26
Pension Liabilities (Assets), Pension Expense, and Deferred Outflows of Resources and
Deferred Inflows of Resources Related to Pensions
At June 30, 2015, the District reported a total pension liability of $1,132,351 for its proportionate
share of the net pension liabilities as follows:
Liability (or Asset)
PERS 1 $666,363
PERS 2/3 $465,988
At June, the District’s propotionate share of the collective net pension liabilities was as follows:
Proportionate
Share 6/30/14
Proportionate
Share 6/30/15
Change in
Proportion
PERS 1 0.012934% 0.012739% -0.000195%
PERS 2/3 0.013402% 0.013042% -0.000360%
Employer contribution transmittals received and processed by the DRS for the fiscal year ended
June 30 are used as the basis for determining each employer’s proportionate share of the collective
pension amounts reported by the DRS in the Schedules of Employer and Nonemployer Allocations
for all plans except LEOFF 1.
The collective net pension liability (asset) was measured as of June 30, 2015, and the actuarial
valuation date on which the total pension liability (asset) is based was as of June 30, 2014, with
update procedures used to roll forward the total pension liability to the measurement date.
Pension Expense
For the year ended December 31, 2015, the District recognized pension expense as follows:
Pension Expense
PERS 1 $28,343
PERS 2/3 $51,725
TOTAL $80,068
Deferred Outflows of Resources and Deferred Inflows of Resources
At December 31, 2015, the District reported deferred outflows of resources and deferred inflows
of resources related to pensions from the following sources:

MCAG No. 2946 West Sound Utility District Notes to Financial Statements
For the Year Ending December 31, 2016
Page 27
PERS 1
Deferred
Outflows of
Resources
Deferred
Inflows of
Resources
Net difference between projected and
actual investment earnings on pension plan
investments
$36,457
Contributions subsequent to the
measurement date $35,218
TOTAL $35,218 $36,457
PERS 2/3
Deferred
Outflows of
Resources
Deferred
Inflows of
Resources
Differences between expected and actual
experience $48,404
Net difference between projected and actual
investment earnings on pension plan
investments
$124,397
Changes of assumptions $751
Changes in proportion and differences
between contributions and proportionate
share of contributions
$10,457
Contributions subsequent to the
measurement date $36,158
TOTAL $85,313 $134,854
Deferred outflows of resources related to pensions resulting from the District’s contributions
subsequent to the measurement date will be recognized as a reduction of the net pension liability
in the year ended December 31, 2016. Other amounts reported as deferred outflows and deferred
inflows of resources related to pensions were recognized in pension expenses as follows:
Year ended December 31: PERS 1 PERS 2/3
2016 $ (14,130) $ (37,182)
2017 $ (14,130) $ (37,182)
2018 $ (14,130) $ (37,182)
2019 $ 5,931 $ 25,848
Total $ (36,457) $ (85,698)
NOTE 10 – RISK MANAGEMENT
The District is a member of the Water and Sewer Risk Management Pool (Pool). Chapter 48.62
RCW authorizes the governing body of any one or more governmental entities to form together
into or join a pool or organization for the joint purchasing of insurance, and/or joint self-insuring,

MCAG No. 2946 West Sound Utility District Notes to Financial Statements
For the Year Ending December 31, 2016
Page 28
and/or joint hiring or contracting for risk management services to the same extent that they may
individually purchase insurance, self-insurance, or hire or contract for risk management services.
An agreement to form a pooling arrangement was made pursuant to the provisions of Chapter
39.34 RCW, the Interlocal Cooperation Act. The Pool was formed in November 1987 when water
and sewer districts in the State of Washington joined together by signing an Interlocal
Governmental Agreement to pool their self-insured losses and jointly purchase insurance and
administrative services. The Pool currently has 66 members. The Pool’s fiscal year is November
1 through October 31.
The Pool allows members to jointly purchase insurance coverage, establish a plan of self-insurance
coverage, and provide related services, such as risk management and loss prevention. The Pool
provides the following forms of group purchased insurance coverage for its members:
Property (including Building, Electronic Data Processing, Boiler and Machinery, and Mobile
Equipment); General Liability; Automotive Liability; Excess Liability, Crime; Public Officials
Liability; Identity Fraud Reimbursement Program: and bonds of various types. All coverages are
on an “occurrence” basis.
Members make an annual contribution to fund the Pool. The Pool purchases insurance policies
from unrelated underwriters as follows:
TYPE OF COVERAGE MEMBER
DEDUCTIBLE
SELF-INSURED
RETENTION
EXCESS
LIMITS
Property Loss:
Buildings and Contents $1,000 - $25,000
and See (C)
below
$25,000 $1,000,000,000
Flood See (A) below See (A) below $50,000,000
Earthquake See (B) below See (B) below $75,000,000
($50,000,000
shared by all
members and
$25,000,000
dedicated to
Alderwood)
Terrorism $1,000 - $25,000 $25,000
Primary layer
$100,000,000
Primary layer
Boiler & Machinery $1,000 - $350,000
depending on
object
$25,000 - $350,000
depending on
object
$100,000,000
Auto - Physical Damage $1,000-$25,000 $25,000 $10,000,000
Liability:
Commercial General
Liability
$1,000 - $25,000 $200,000 $10,000,000

MCAG No. 2946 West Sound Utility District Notes to Financial Statements
For the Year Ending December 31, 2016
Page 29
Auto Liability $1,000 - $25,000 $200,000 $10,000,000
Public Officials Errors
and Omissions
$1,000 - $25,000
$200,000
$10,000,000
Employment Practices $1,000 - $25,000 $200,000 $10,000,000
Other:
Public Officials Bonds Various N/A Various
Crime $1,000 - $25,000 $25,000 $2,000,000
Identity Fraud $0 $25,000 $0
A. $100,000 member deductibles, per occurrence, in Flood zones except Zones A&V;
$250,000 member deductible per occurrence, in Flood Zones A&V.
B. Member deductible for earthquakes is 5% subject to $100,000 minimum Earthquake
Shock. If the stated deductible is on a percentage basis, the deductible will apply per
occurrence on a per unit basis, as defined in the policy form, subject to the stated minimum.
C. Member deductible for Cyber liability is $100,000 and where applicable the dollar amount
of the business interruption loss during the policy’s required 8 hour waiting period.
D. In the past three years, the District did not have any settlements that exceeded the insurance
coverage.
Pool members are responsible for a deductible on each coverage and the Pool is responsible for
the remainder of the self-insured retention listed in the table above. The insurance carriers then
cover the loss to the maximum limit of the policy. Each member is responsible for the full
deductible applicable to the perils of earthquake and flood (the Pool is not responsible for any
deductible or self-insured retention for earthquake and flood claims). Each member is also
responsible for the full deductible applicable to the Cyber Liability, and that part of a Boiler and
Machinery deductible which exceeds $25,000.
Upon joining, the members contract to remain in the Pool for one full policy period. Following
completion of one full policy period, members must give six months’ notice before terminating
participation (e.g. to withdraw from the Pool by November 1, 2016, written notice must be in
possession of the Pool by April 30, 2016). The Interlocal Governmental Agreement is renewed
automatically each year. Even after termination of relationship with the Pool, a member is still
responsible for contributions to the Pool for any unresolved, unreported, and in process claims, for
the period that the District was a signatory to the Interlocal Governmental Agreement.
The Pool is fully funded by its member participants. Claims are filed by members with the Pool
who determines coverage and performs claims adjustment in consultation with Arcadia Claims
Services and Adjusters Northwest.
The Pool is governed by a Board of Directors, which is comprised of one designated representative
from each participating member. An Executive Committee is elected at the annual meeting, and
is responsible for overseeing the business affairs of the Pool and providing policy direction to the
Pool’s Executive Director.
MCAG No. 2946 West Sound Utility District
Notes to Financial Statements
For the Year Ending December 31, 2016
Page 30
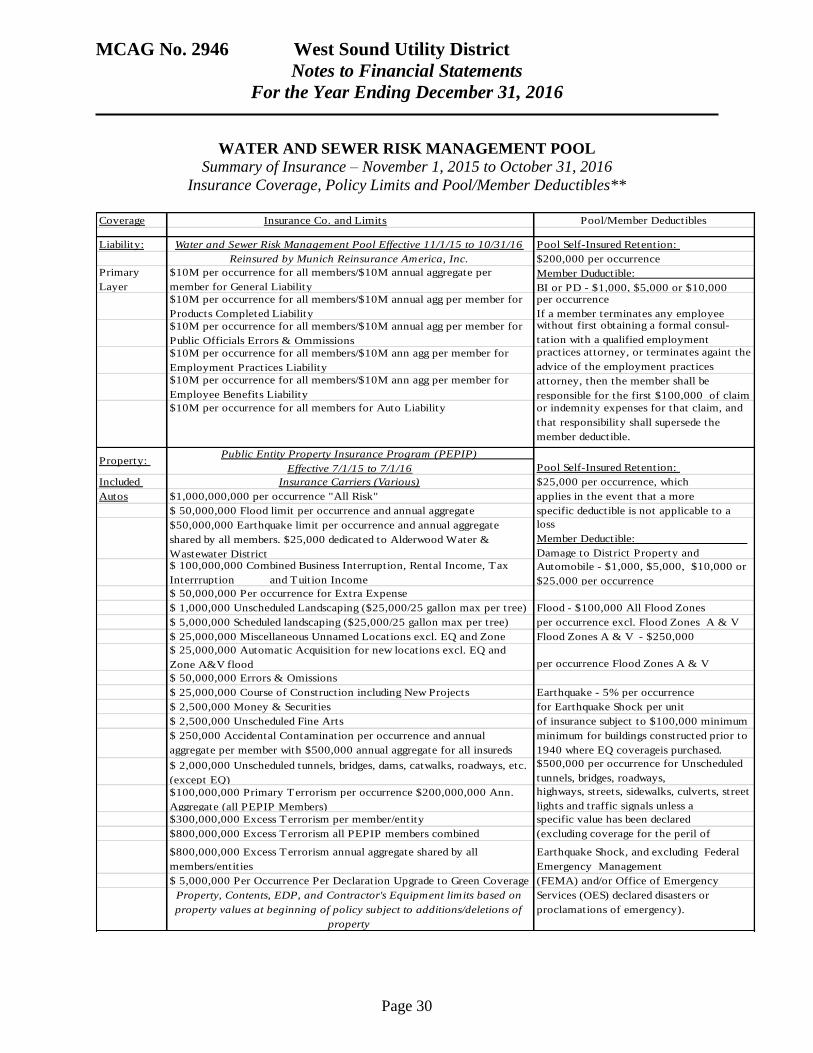
WATER AND SEWER RISK MANAGEMENT POOL
Summary of Insurance – November 1, 2015 to October 31, 2016
Insurance Coverage, Policy Limits and Pool/Member Deductibles**
Coverage Insurance Co. and Limits Pool/Member Deductibles
Liability: Water and Sewer Risk Management Pool Effective 11/1/15 to 10/31/16 Pool Self-Insured Retention:
Reinsured by Munich Reinsurance America, Inc. $200,000 per occurrence
Primary
Layer
$10M per occurrence for all members/$10M annual aggregate per
member for General Liability
Member Duductible:
BI or PD - $1,000, $5,000 or $10,000 $10M per occurrence for all members/$10M annual agg per member for
Products Completed Liability
per occurrence
If a member terminates any employee
$10M per occurrence for all members/$10M annual agg per member for
Public Officials Errors & Ommissions
without first obtaining a formal consul-
tation with a qualified employment
$10M per occurrence for all members/$10M ann agg per member for
Employment Practices Liability
practices attorney, or terminates againt the
advice of the employment practices
$10M per occurrence for all members/$10M ann agg per member for
Employee Benefits Liability
attorney, then the member shall be
responsible for the first $100,000 of claim
$10M per occurrence for all members for Auto Liability or indemnity expenses for that claim, and
that responsibility shall supersede the
member deductible.
Property: Public Entity Property Insurance Program (PEPIP)
Effective 7/1/15 to 7/1/16 Pool Self-Insured Retention:
Included Insurance Carriers (Various) $25,000 per occurrence, which
Autos $1,000,000,000 per occurrence "All Risk" applies in the event that a more
$ 50,000,000 Flood limit per occurrence and annual aggregate specific deductible is not applicable to a
$50,000,000 Earthquake limit per occurrence and annual aggregate
shared by all members. $25,000 dedicated to Alderwood Water &
Wastewater District
loss
Member Deductible:
Damage to District Property and
$ 100,000,000 Combined Business Interruption, Rental Income, Tax
Interrruption and Tuition Income
Automobile - $1,000, $5,000, $10,000 or
$25,000 per occurrence
$ 50,000,000 Per occurrence for Extra Expense
$ 1,000,000 Unscheduled Landscaping ($25,000/25 gallon max per tree) Flood - $100,000 All Flood Zones
$ 5,000,000 Scheduled landscaping ($25,000/25 gallon max per tree) per occurrence excl. Flood Zones A & V
$ 25,000,000 Miscellaneous Unnamed Locations excl. EQ and Zone Flood Zones A & V - $250,000
$ 25,000,000 Automatic Acquisition for new locations excl. EQ and
Zone A&V flood per occurrence Flood Zones A & V
$ 50,000,000 Errors & Omissions
$ 25,000,000 Course of Construction including New Projects Earthquake - 5% per occurrence
$ 2,500,000 Money & Securities for Earthquake Shock per unit
$ 2,500,000 Unscheduled Fine Arts of insurance subject to $100,000 minimum
$ 250,000 Accidental Contamination per occurrence and annual
aggregate per member with $500,000 annual aggregate for all insureds
per member declaration
minimum for buildings constructed prior to
1940 where EQ coverageis purchased.
$ 2,000,000 Unscheduled tunnels, bridges, dams, catwalks, roadways, etc.
(except EQ)
$500,000 per occurrence for Unscheduled
tunnels, bridges, roadways,
$100,000,000 Primary Terrorism per occurrence $200,000,000 Ann.
Aggregate (all PEPIP Members)
highways, streets, sidewalks, culverts, street
lights and traffic signals unless a
$300,000,000 Excess Terrorism per member/entity specific value has been declared
$800,000,000 Excess Terrorism all PEPIP members combined (excluding coverage for the peril of
$800,000,000 Excess Terrorism annual aggregate shared by all
members/entities
Earthquake Shock, and excluding Federal
Emergency Management
$ 5,000,000 Per Occurrence Per Declaration Upgrade to Green Coverage (FEMA) and/or Office of Emergency
Property, Contents, EDP, and Contractor's Equipment limits based on
property values at beginning of policy subject to additions/deletions of
property
Services (OES) declared disasters or
proclamations of emergency).

MCAG No. 2946 West Sound Utility District
Notes to Financial Statements
For the Year Ending December 31, 2016
Page 31
Pool Self-Insured Retention: N/A
$500,000 Privacy Noticfication Costs $100,000 per occurrence
$2,000,000 Penalties for Regulatory Defense and Penalities. PCI fines
and penalties and fines coverage added with siblimit of $100,000
$2,000,000 First Party Computer Security for Cyber Extortion Loss8 Hour waiting period for first party
$2,000,000 First Party Computer Security for Data Protection Loss and Business Income Interruption Claims
$25,000,000 Cyber Liability Annual Policy and Program Aggregate
Limit of Liability
Public Entity Property Insurance Program (PEPIP) Pool Self-Insured Retention:
Boiler & Effective 7/1/15 to 7/1/16 $25,000 per occurrence, which applies in
Machinery Insurance Carriers (Various) the event that a more specific deductible is
$100,000,000 Limits of Liability per occurrence not applicaable to a loss.
Included: Jurisdictional and Inspection
Included: per occurrence consequential damage perishable
goods/spoilage
Member Deductible:
$1,000, $5,000 or $10,000 per
$10,000,000 Expediting Expenses per occurrence
$10,000,000 electronic data processing media and data restoratin $50,000 for objects over 350 hp
$10,000,000 per occurrence hazardous $100,000 for objects over 500 hp
Included: per occurrence machine or apparatus used for $250,000 for objects over 750 hp
diagnosis, medication, surgical, therapeutic, dental or $350,000 for objects over 25,000 hp
purposes $10 per foot/$2,500 min. for Deep Water
$25,000,000 newly acquired locations. Values greater than $25,000,000 or power24 hr waiting period for Utility
generating facilit ies must be reported within 90 days and must have24 hr waiting period for BI except 30 day
prior underwriting approval prior to binding Revenue Bond
National Union Fire Insurance Company Effective 11/1/15 to 11/1/16 Pool Self-Insured Retention:
Crime:
$2,000,000 Employee Theft - Per Loss Coverage
$25,000 Employee Theft – Per Loss,
Forgery or Alteration
$2,000,000 Forgery or Alteration $5,000 Inside the Premises - Theft of
$250,000 Computer Fraud money & securities, robbery, safe
$250,000 Money Orders and Counterfeit Paper Currency burglary - other property, outside
$250,000 Funds Transfer Fraud the premises, computer fraud, money
$2,000,000 Credit Card Forgery orders and counterfeit paper currency
$25,000 Prior Theft or Dishonesty Member Deductible:
$75,000/100% Included expenses incurred to establish amount of $1,000, $5,000 or $10,000 per
St. Paul Travelers Bond Effective 11/1/15 to 10/31/16 Pool Self-Insured Retention: N/A
Identify $25,000 per person (family members of employees who are residents of
Reimburseme household, to include spouse, children under 25 years of age and Member Deductible: N/A
Program Lost Wages up to $1,000 per week - maximum of 5 weeks
Costs for notarizing fraud affidavits or similar documents
Costs for certified mail
Loan re-application fees
Charges for long distance telephone calls
Reasonable attorney fees incurred (with St. Paul Travelers' prior consent)
Illinois Union Insurance Company Effective 7/1/15 - 7/1/16 Pool Self-Insured Retention: N/A
Claims Made $1,000,000 per Pollution Condition
and Reported $1,000,000 WSRMP Annual Aggregate Member Self-Insured Retentions:
Pullution $75,000 per pollution condition
legal Liability Written notice to the carrier is required of any claim or pollution condition,$750,000 underground storage tank
within seven (7) days of discovery for pollution conditions requiring specific 8 day waiting period on business
immediate emergency response. income losses
$2000,000 per occurrence
Clash $800,000 annual aggregate
Coverage Clash coverage offsets the risk of the Pool paying multiple SIRs when
more than one member is involved in a loss.
Cyber
Liability
$2,000,000 Third Party Liability-annual aggregate limit of liability for
each insured/members for Information Security & Privacy Liability
(aggregate for all coverages combined, including claims expenses but
Member Deductible:
MCAG No. 2946 West Sound Utility District
Notes to Financial Statements
For the Year Ending December 31, 2016
Page 32
NOTE 11 – OTHER DISCLOSURES
Implementation of New Governmental Accounting Standards Board Pronouncements. The
District implemented GASB 68, Accounting and Financial Reporting for Pensions and GASB 71,
Pension Transition for Contributions Made Subsequent to the Measurement Date. These
statements establish standards for measuring and recognizing liabilities, deferred outflows of
resources, and deferred inflows of resources and expense/expenditures related to pensions. As a
result of implementing this standard, the District recognized an adjustment to beginning net
position of $1,232,848, presented as a change in accounting principles.
NOTE 12 – SUBSEQUENT EVENTS
In September of 2016 the District refunded the 2009 Revenue Bond. By refunding the 2009
Revenue Bond the District save interest rate from 4% to 1.649% with a Net PV Savings of
$183,175.

MCAG No. 2946 West Sound Utility District
Required Supplementary Information
Schedule of Proportional Share of Net Pension Liability
As of June 30, 2016
Page 33
2015 2014 2015 2014
Employer's proportion of the net pension liability
(Asset) 0.012739% 0.012934% 0.013042% 0.013402%
Employer's proportion share of the net pension
liability 666,363 651,550 465,988 270,899
Employer's covered employee payroll 134,344 94,411 1,157,058 1,158,854
Employer's proportionate share of the net pension
liability as a percentage of covered employee payroll 496.01% 690.12% 40.27% 23.38%
Plan fiduciary net position as a percentage of the
total pension liability 59.10% 61.19% 89.20% 93.29%
PERS 1 PERS 2/3

MCAG No. 2946 West Sound Utility District
Required Supplementary Information
Schedule of Employer Contributions
As of December 31, 2065
Page 34
MCAG No. 2946 West Sound Utility District
Notes to Required Supplemental Information – Pension
As of December 31, 2016
Page 35
Note 1: Information Provided
The District shared the Organization Identification Number under Washington State Department
of Retirement System with Joint Wastewater Treatment Facility (JWWTF). All pension data
including allocation percentage were recalculated according to the percentage of the District and
the Plant’s contributions.
The District implemented GASB 68 for the year ended December 31,2015, therefore there is no
data available for years prior to 2014.
Note 2: Significant Factors
There are no changes of benefit terms, significant changes in the employees covered under the
benefit terms or in the use of different assumptions
Note 3: Change in Contribution Rate
The employer contribution rates for both PERS 1 and PERS 2/3 plans increased from 9.21% to
11.18% for pay periods befinning July 2015.

MCAG No. 2946 West Sound Utility District
Schedule 01 – Revenue/Expenditures
For the Year End of December 31, 2016
Page 36
MCAG Fund # Fund Name BARS
Account
BARS Name Amount
2946 401 Operations 3081900 Restricted Net Position -
Beginning
$1,111,878
2946 401 Operations 3086000 Net Investment in Capital Assets -
Beginning
$21,304,001
2946 401 Operations 3088900 Unrestricted Net Position -
Beginning
$13,071,882
2946 401 Operations 3337000 Local Grants, Entitlements and
other Payments
$211,539
2946 401 Operations 3434000 Water Sales and Services $3,005,740
2946 401 Operations 3435000 Sewer/Reclaimed Water Sales &
Services
$3,530,463
2946 401 Operations 3590000 Non-Court Fines & Penalties $105,341
2946 401 Operations 3611000 Investment Interest $39,248
2946 401 Operations 3621000 Equipment and Vehicles Rentals
(Short-Term)
$5,446
2946 401 Operations 3625000 Space and Facilities Leases (Long
Term)
$63,147
2946 401 Operations 3670000 Contributions and Donations
from Nongovernmental Sources
$514,760
2946 401 Operations 3691000 Sale of Scrap and Junk $108
2946 401 Operations 3699200 Other $80,590
2946 401 Operations 3710000 Sewer Equity Income $47,328
2946 401 Operations 3790000 Water Capital Contributions from
Developers
$96,796
2946 401 Operations 3790000 Sewer Capital Contributions from
Developers
$128,927
2946 401 Operations 5013400 Depreciation/Depletion/Amort -
Water
$571,032
2946 401 Operations 5013500 Depreciation/Depletion/Amort -
Sewer
$541,693
2946 401 Operations 5340010 Water Utilities - Salaries $676,177
2946 401 Operations 5340020 Water Utilities - Benefits $251,694
2946 401 Operations 5340030 Water Utilities - Supplies $113,294
2946 401 Operations 5340040 Water Utilites - Services $650,041
2946 401 Operations 5340050 Water Utilities - Intergovenmental $27,151

MCAG No. 2946 West Sound Utility District
Schedule 01 – Revenue/Expenditures
For the Year End of December 31, 2016
Page 37
MCAG Fund # Fund Name BARS
Account
BARS Name Amount
2946 401 Operations 5350010 Sewer Utilities - Salaries $676,273
2946 401 Operations 5350020 Sewer Utilities - Benefits $242,072
2946 401 Operations 5350030 Sewer Utilities - Supplies $41,535
2946 401 Operations 5350040 Sewer Utilities - Services $270,374
2946 401 Operations 5350050 Sewer Utilities - Intergovernmental $1,560,316
2946 401 Operations 5380010 Combined Water/Sewer/Solid
Waste Utilities - Salaries
$84,655
2946 401 Operations 5380020 Combined Water/Sewer/Solid
Waste Utilities - Benefits
$16,704
2946 401 Operations 5380030 Combined Water/Sewer/Solid
Waste Utilities - Supplies
$818
2946 401 Operations 5380040 Combined Water/Sewer/Solid
Waste Utilities - Services
$177,203
2946 401 Operations 5913470 Redemption - Water Utilities $480,877
2946 401 Operations 5913570 Redemption - Sewer Utilities $551,904
2946 401 Operations 5923480 Interest and other Debt Service
Cost - Water
$124,720
2946 401 Operations 5923580 Interest and other Debt Service
Cost - Sewer
$87,867
2946 401 Operations 5943860 Capital Expenditures/Expenses -
Combined Water/Sewer/Solid
Waste Utilities
$115,537
2946 401 Operations 5081900 Restricted Net Position - Ending $1,027,496
2946 401 Operations 5086000 Net Investment in Capital Assets - $22,940,200
2946 401 Operations 5088900 Unrestricted Net Position - Ending $13,014,098
2946 401 Operations 8100000 Cash,Cash Equivalents and $7,032,307
2946 401 Operations 8200000 Other Current Assets $809,272
2946 401 Operations 8300000 Noncurrent Assets $36,697,690
2946 401 Operations 8400000 Deferred Outflows $121,662
2946 401 Operations 8500000 Current Liabilities $1,613,378
2946 401 Operations 8600000 Noncurrent Liabilities $8,893,317
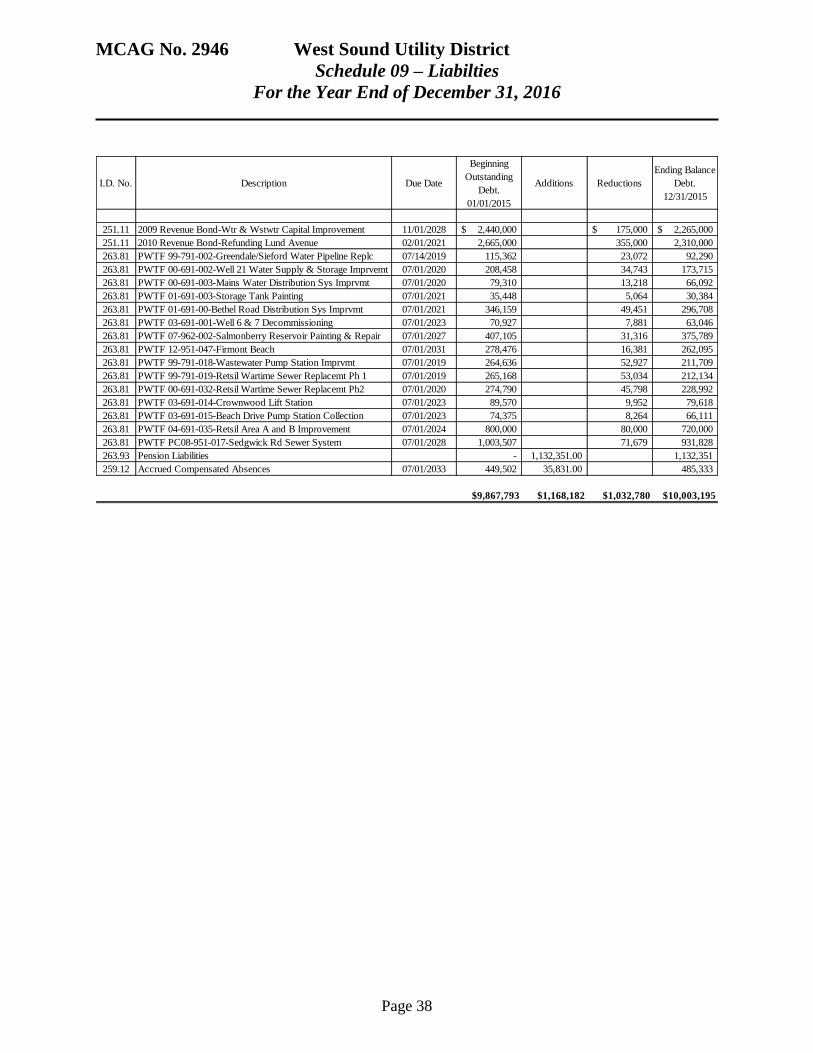
MCAG No. 2946 West Sound Utility District
Schedule 09 – Liabilties
For the Year End of December 31, 2016
Page 38
I.D. No. Description Due Date
Beginning
Outstanding
Debt.
01/01/2015
Additions Reductions
Ending Balance
Debt.
12/31/2015
251.11 2009 Revenue Bond-Wtr & Wstwtr Capital Improvement 11/01/2028 2,440,000$ 175,000$ 2,265,000$
251.11 2010 Revenue Bond-Refunding Lund Avenue 02/01/2021 2,665,000 355,000 2,310,000
263.81 PWTF 99-791-002-Greendale/Sieford Water Pipeline Replc 07/14/2019 115,362 23,072 92,290
263.81 PWTF 00-691-002-Well 21 Water Supply & Storage Imprvemt 07/01/2020 208,458 34,743 173,715
263.81 PWTF 00-691-003-Mains Water Distribution Sys Imprvmt 07/01/2020 79,310 13,218 66,092
263.81 PWTF 01-691-003-Storage Tank Painting 07/01/2021 35,448 5,064 30,384
263.81 PWTF 01-691-00-Bethel Road Distribution Sys Imprvmt 07/01/2021 346,159 49,451 296,708
263.81 PWTF 03-691-001-Well 6 & 7 Decommissioning 07/01/2023 70,927 7,881 63,046
263.81 PWTF 07-962-002-Salmonberry Reservoir Painting & Repair 07/01/2027 407,105 31,316 375,789
263.81 PWTF 12-951-047-Firmont Beach 07/01/2031 278,476 16,381 262,095
263.81 PWTF 99-791-018-Wastewater Pump Station Imprvmt 07/01/2019 264,636 52,927 211,709
263.81 PWTF 99-791-019-Retsil Wartime Sewer Replacemt Ph 1 07/01/2019 265,168 53,034 212,134
263.81 PWTF 00-691-032-Retsil Wartime Sewer Replacemt Ph2 07/01/2020 274,790 45,798 228,992
263.81 PWTF 03-691-014-Crownwood Lift Station 07/01/2023 89,570 9,952 79,618
263.81 PWTF 03-691-015-Beach Drive Pump Station Collection 07/01/2023 74,375 8,264 66,111
263.81 PWTF 04-691-035-Retsil Area A and B Improvement 07/01/2024 800,000 80,000 720,000
263.81 PWTF PC08-951-017-Sedgwick Rd Sewer System 07/01/2028 1,003,507 71,679 931,828
263.93 Pension Liabilities - 1,132,351.00 1,132,351
259.12 Accrued Compensated Absences 07/01/2033 449,502 35,831.00 485,333
$9,867,793 $1,168,182 $1,032,780 $10,003,195