annual results 2020 - dom security
TRANSCRIPT

Sfpi Group
Annual Results2020
Henri Morel, CEO
Damien Chauveinc, Deputy CEO
April 28th 2021

2
Presentation of 2020 resultsMode of operation
• You are going to attend the presentation of the 2020 results in its entirety
• You can ask your questions through the "chat" function
They will be answered at the end of the presentation
• The video of the presentation, as well as the slides, will be available at
the end of the day on the company's website - investors section.
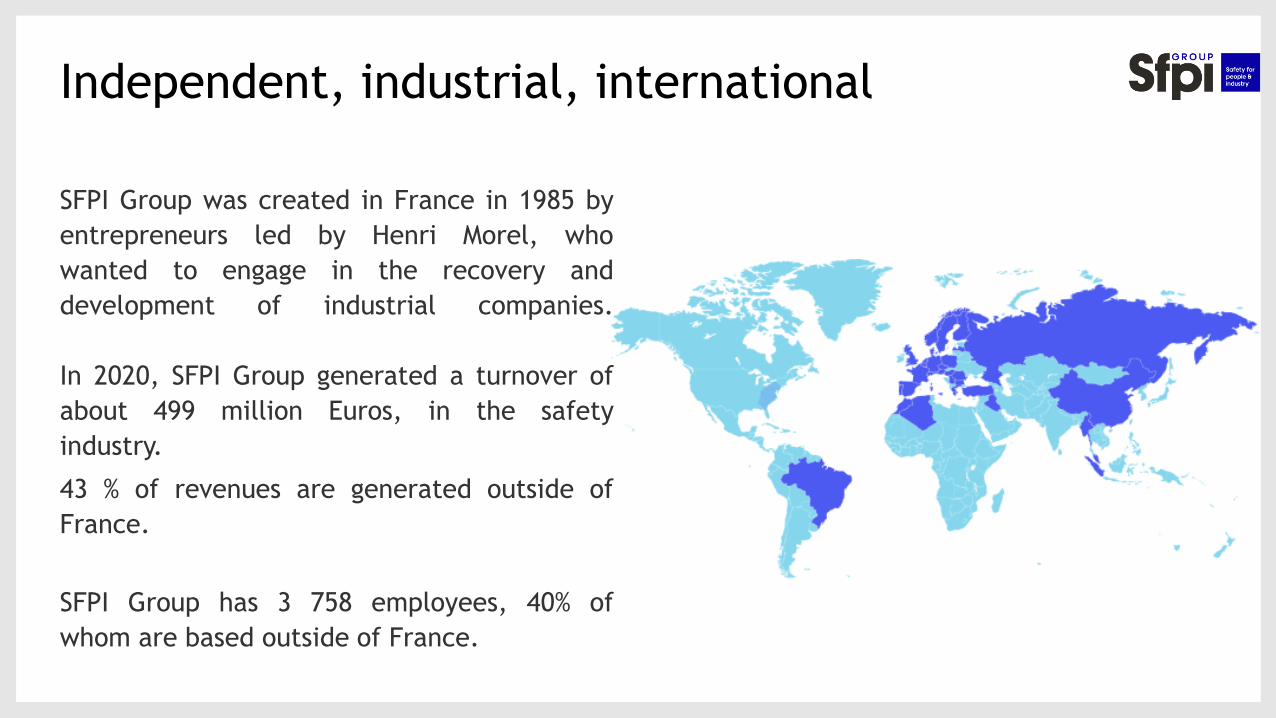
Independent, industrial, international
SFPI Group was created in France in 1985 by
entrepreneurs led by Henri Morel, who
wanted to engage in the recovery and
development of industrial companies.
In 2020, SFPI Group generated a turnover of
about 499 million Euros, in the safety
industry.
43 % of revenues are generated outside of
France.
SFPI Group has 3 758 employees, 40% of
whom are based outside of France.

Specialized in the safety industry for people, goods and environment
Windows, blinds,
awnings, shutters,
garage doors for
residential and non
residential buildings
MAC
345 M€
69 % of 2020 Group revenues
Locking and access
control equipment and
systems
DOM Security
Business Group « Construction »Security and comfort for buildings
Heat exchanger and
sterilization equipment
and systems
MMD
154 M€
31 % of 2020 Group revenues
Air treatment solutions for
the industry
NEU-JKF
Business Group « Industry »Air treatment and energy control

Key figures 2020

Key figures 2020
Sales 499 M€
Recurring operating income 29,0 M€
EBITDA 49,0 M€
Net Financial excess 65,0 M€
6

Consolidated 2020 revenues : 499 M€
Sales outside of
France : 217 M€
7
57%
33%
7%
Sales split per areas
France Europe ROW
Decrease in consolidated revenues of 64 million Euros (-11%)
287 276
227
272
H1 H2
Sales H1 & H2
2019 2020

The transformation plan: sustainable value for customers, employees and shareholders
To increase knowledge about customers,to spread customer culture at all levels, toimprove customer satisfaction.
Reinforce the manager role to improvetalents retention and anticipateemployees turnover.
To become a group more efficient fromthe environmental point of view.
To build common standards, tools andframes of references.
Commercial responsibility Managerial responsibility
Social and environmental responsibility Financial responsibility
8

Financials & Highlights 2020 DOM SECURITY
Highlights
M€ 2019 2020
Sales 198,5 178,5
Gross margin, as % of revenues 69,3% 69,3%
Recurring operating income 17,1 16,2
Operating income 13,3 14,4
1 667 employees CAPEX: 6,7 M€
9
Decrease in France, Italy and
Spain in the first half.
ROI at 9.1% of sales (+0.5pt)
• Despite the various periods of restrictions in Europe,
particularly in the last quarter, DOM Security maintained
its activity in H2.
• Reduced payroll, travel and marketing costs throughout
2020.
• Merger of the two entities MCM and UCEM in Spain under the
name DOM-MCM.
• 2M€ investment in a research center in Bordeaux for
Omnitech Security, "Omega Campus" dedicated to their
Cybersecurity, Software and IOT activities.
102,396,2
84,1
94,4
H1 H2
Sales H1 & H2
2019 2020

10
Access and locking solutions for Buildings
• Acceleration of our online sales with DOM eNET, our "b to b"
platform, active in Germany, France and the United Kingdom
- turnover of €4.2M in 2020.
• New design and features for our DOM ENiQ access control
offer dedicated to small and medium-sized companies
• Extension of the antimicrobial range for controlled lever
handles, electronic cylinders and panic bars.
• New DOM LOQ electronic locking system for office, workshop
and community lockers.
• Good progress of our European program for locksmiths DOM
Keystone with 70 members and 1,7M€ of turnover in 2020.
• Picard Serrures, 300 years of know-how, 300 years of
expertise, 300 years of French manufacturing.
DOM eNet
Omnitech Security
ENiQ GuardDOM LoQ
ENiQ App
DOM Keystone
300 ans
10

1111
Financials & Highlights 2020MAC
bHighlights
M€ 2019 2020
Sales 190,6 166,5
Gross margin, as % of revenues 53,9% 54,6%
Recurring operating income 4,4 3,2
Operating income (0,3) 4,3
1 164 employees CAPEX: 3,8 M€
1
1
Strong increase in H2
Savings on payroll and other expenses
Control of purchases
Control of discounts and promotions
• Closure of the Carros aluminum joinery plant in July 2020
• 1 State Guaranteed Loan at Franciaflex for €9 million, converted
into 5-year debt
• Recruitment of Dominique Defretin, new CEO of SIPA
• Investments:
o Painting capacity at France Fermetures (1.0 M€)
o Machines and relocation to concentrate activity on
2 sites at SIPA (1.3 M€)
o Investments following the move from Carros (0.3 M€)
101
89,6
71,7
94,8
H1 H2
Sales H1 & H2
2019 2020

1212
Joinery, blinds and closures
• Development of a new Solar Powered Roller Shutters
offer
• Rationalization of the offer :
o Launch of a project to standardize the wood shutter offer to
improve margins
o Homogenization of the Faber / Franciaflex vertical blinds
offer, consolidation of the production at FABER
• Digitalization of sales: 21% in 2020 vs. 14% in 2019
o Web store France Fermetures: 39.0% of total sales vs. 32.0%
in 2019 (new store in 2020)
o Franciaflex Web Store: 12.3% of total sales vs. 6.6% in 2019
o FABER Web Store: 5.3% of cumulative sales (store launch in
2020)
12

Financials & Highlights 2020 NEU-JKF
Highlights
M€ 2019 2020
Sales 117,2 101,1
Gross margin, as % of revenues 50,9% 51,0%
Recurring operating income 3,2 4,3
Operating income (7,0) 3,4
641 Employees CAPEX: 1,6 M€
13
Recovery of sales at the end of the summer
Perimeter effect -5.4 M€
Savings on payroll and expenses
• Equity accounting of Neu Railways from March 2020
• Investments in new laser cutting machines at NEU FEVI and NEU JKF
Malaysia, overhead crane in Poland
• 1 State Guaranteed Loan at NEU FEVI for €1.5 million, converted into
5-year debt
• Order intake in H2 2020 higher than H2 2019 thanks to the
recovery and the various recovery plans (including +63% in
England in cans and cartons)
• Excellent operational performance in the second half
despite installation difficulties
54,4
62,8
46,0
55,1
H1 H2
Sales H1 & H2
2019 2020

14
• Development of a range of air purifiers that filter
fine particles and viruses/bacteria
• Synergies :
o Acceleration of NEU equipment sales in Poland
via the JKF network: 550k€ of turnover
o Purchase of JKF equipment by NEU: 930k€ in 2020
Air treatment solutions for the industry

Financials & Highlights 2020MMD
Highlights
272 employees CAPEX: 1,5 M€
15
Decrease in Italy in the first half
Company mix (stable margin per company)
ROI at 10.3% of revenues
M€ 2019 2020
Sales 56,4 53,3
Gross margin, as % of revenues 54,6% 55,3%
Recurring operating income 5,5 5,5
Operating income 5,5 5,5
• The French factories continued their activities during the
first lockdown and delivered to customers
• Steriflow had a very good order intake
• Barriquand has suffered from the postponement of large projects
but has promising prospects for energy management projects:
hydrogen, biomass,...
28,9
27,5
25,2
27,8
H1 H2
Sales H1 & H2
2019 2020

Heat exchange and sterilization equipment and systems
New investments at Barriquand
• Welding robot for plates
• Tube twisting machine for shell and tube
exchangers
16

Sales split per Business Units
189 191
167
186
198
178
123117
101
52 56 53
2018 2019 2020
Sales MAC
Sales Dom Security
Sales NEU
Sales MMD
550563
499
17

Consolidated Financials
M€ 2019 % of sales 2020 % of sales
Sales 562,5 498,8
Gross Margin 330,4 58,7% 295,5 59,2%
Payroll expenses (186,1) 33,1% (168,4) 33,8%
Other operating costs (86,1) 15,3% (73,0) 14,6%
Taxes (5,5) (5,3)
Depreciation (22,1) 3,9% (20,2) 4,0%
Recurring operating income 30,6 5,4% 28,6 5,7%
Non-recurring cost and amortization (18,6) (1,6)
Operating income 12,0 2,1% 27,0 5,4%
Financial charges (0,5) 1,1
Corporate Income Tax (7,7) (10,5)
Consolidated Net Income 3,8 0,7% 17,7 3,5%
Group Share 3,8 17,6
including €1.7 million in interest
received on German tax
reassessment

Cash Flow Bridge (M€)
161.117,4 2,8
CAF WorkingCapital
Deviation
-14.8
IndustrialInvest.
3.3
Real estatetransfer
-1.2
Self-checking Borrowingsand other flows
CashDec 2020 (*)
CashDec 2019 (*)
116.936,7
+38%
19(*) Cash and cash equivalents less overdrafts

Simplified consolidated balance sheet December 31st 2020
Assets Liabilities Assets Liabilities
A solid financial base: net financial surplus of 64.7 million Euros at December 31st 2020
2019 2020
Tangible and intangible
145,7
Other non-current
Assets
28,5
Working capital70,6
Net financial excess
64,7
Non-current
Liabilities and
Provisions
93,7
Tangible and intangible
153,8 Equity
Group Share
199,6Other non-current
Assets
26,8
Working capital90,2
Net financial excess
29,0
Non-current
Liabilities and
Provisions
98,5
20
Non-controlling interest
1,7
Equity
Group Share
214,2
Non controlling interest
1,6

SFPI Group financial structure
2019 2020
Equity Group share 199,6 214,2
Long and short-term financial debt 87,9 96,4
Cash and equivalents 116,9 161,1
Net financial excess 29,0 64,7
Recurring operating income 30,6 28,6
EBITDA 52,7 48,8
21

Stock market mapping
• Number of shares : 99 317 902
• ISIN Code : FR0004155000
• Listing market : Compartiment Euronext B
Shareholders structure on 19/04/2021
• Free Float 31/12/2019 : 26,2 %
• Free Float 19/04/2021 : 24,7 %
62,2%
7,2%2,0%
3,6%
24,7%
Détention
Founding Directors
Crédit Mutuel Equity
BNP Paribas Development
Self-retention
Public
Others
Detention
22
• Dividend 2020 : proposal of €0.06 per share to
the shareholders meeting on June 18th 2021

2021 Perspectives
For fiscal year 2021, the Group expects annual revenues of
around 540 million Euros.
23

• Thank you for your attention
• We now answer your questions
24

• This document and the video presentation will be
available at the end of the day on the Group's website
- investors section
www.sfpi-group.com
25

Annexes
26

Indicators used
▪ The indicators "Operating income before non-recurring items" and "Net financial debt" comply
with recommendation 2013-03 of November 7, 2013 issued by the French Accounting Standards
Authority (Autorité des Normes Comptables), with the exception of net financial debt in which
IFRS 16 lease liabilities have been excluded.
▪
▪ The term "Net financial surplus" corresponds to a "Net financial debt" where the net cash is
greater than the gross financial debt.
▪ The gross margin is the difference between :
▪ sales revenue
▪ the valuation of work in progress and finished goods
▪ purchases consumed
▪ and external charges on business
27