annual review - wereldhave · communicatie, amstelveen design volta_ontwerpers, utrecht print...
TRANSCRIPT

ANNUAL REVIEW 2012 CONTENT 02 WELCOME / 03 2012 IN A
NUTSHELL / 04 MESSAGE FROM THE CEO / 14 CORE
MARKETS / 33 FINANCIALS 2012 / 45 PRIMARY
STATEMENTS OF THE ANNUAL ACCOUNTS 2012
STRATEGY UPDATE
Focus on shopping centres in North-West Europe and sustainable offices in Paris
SOCIAL MEDIA
Interactive shopping with new App
SUSTAINABILITY
Award for Shopping Nivelles!

Wereldhave annual review 2012
COLOPHON
Text
SPJ Financiële & Corporate
Communicatie, Amstelveen
Design
Volta_ontwerpers, Utrecht
drukkerij De Eendracht, Schiedam
Welcome
CONTENT
04 MESSAGE FROM THE CEO
10 REPORT FROM THE SUPERVISORY BOARD
09 STRATEGY UPDATE
14 CORE MARKET THE NETHERLANDS
16 CORE MARKET FINLAND
18 CORE MARKET BELGIUM
20 CORE MARKET PARIS
22 ORGANISATION AND EMPLOYEES
24 WERELDHAVE AND SOCIAL MEDIA
28 SUSTAINABILITY / NIVELLES
30 SHOPPING CENTRES DEVELOPMENT/ ITIS
33 FINANCIALS 2012
38 BREAKDOWN DIRECT AND INDIRECT RESULTS
39 EPRA BPR CHARTS AND TABLES 2012
45 PRIMARY STATEMENTS OF THE ANNUAL ACCOUNTS 2012
04 FOREWORD
14 CORE MARKETS
24 SOCIAL MEDIA
28 SUSTAINABILITY
02

2012 in a nutshell
WHO IS WERELDHAVE?
Wereldhave is a property investment company with a focus on shopping centres in North-West Europe and sustainable offices in Paris. In line with the retail structures in the core countries Belgium, the Netherlands and Finland, Wereldhave focuses on shopping centres that are top-of-mind in their catchment area. Wereldhave’s shopping centres offer consumers ‘convenient shopping’.
> WWW.WERELDHAVE.COM
NEW STRATEGYIn response to the changing environment for consumer-, retail-, real estate- and finance- markets Wereldhave decided to update her strategy. Wereldhave implements its strategy in three phases: Derisk, Regroup and Growth. More information about these phases on > PAGE 09
FINANCIAL CALENDAR 2013
25 MARCH 2013 Record date for General
Meeting of Shareholders
22 APRIL 2013 General Meeting of Shareholders
24 APRIL 2013 Ex-dividend listing
26 APRIL 2013 Dividend record date
29 APRIL 2013 Dividend made payable
3 MAY 2013 Trading update on the first quarter 2013
1 AUGUST 2013 Report on the first six months 2013
31 OCTOBER 2013 Trading update on the first nine
months 2013
MARCH 2014
Annual Report 2013
SECTORS
Read more about out core markets on > PAGE 14
KEY FIGURES 2012Amounts in €. Read more about the results on > PAGE 34
NIVELLES WINS SUSTAINABILITY AWARD
In 2012 shopping centre Nivelles won two awards! One was for sustainability. Read more about Nivelles on > PAGE 28
Retail
O�ces
Other
79%
18%
3%
2012 2011
Result -87.1m 63.0m
Direct result 93.8m 113.3m
Indirect result -180.9m -50.3m
Result per share -4.54 2.38
Direct result per share 3.91 4.93
31-12-2012 31-12-2011
Property investment portfolio 2,073.0m 2,830.2m
Equity 1,536.7m 1,714.0m
Net asset value per share 64.09 73.44
03

Wereldhave annual review 2012
“ We are aiming for greater entrepreneurship, active shopping centre manage-ment and transparency”
Message from the CEO04
MESSAGE FROM THE CEO DIRK ANBEEKThe year 2012 was a year of extremes for Wereldhave. Sluggish
performance in the USA and the UK led to substantial impairments
of the portfolio in July and a negative adjustment of the earnings
and dividend outlook for the full year. As a consequence, market
confidence in Wereldhave was seriously impacted.
A revised approach focusing on a strategy rejuvenation, improved balance sheet ratios and cost containment led to a partial recovery of
confidence in the second half of the year. There is still a long way to go, but the first steps have been taken.
Economic pressure
The economy was dominated by the crisis in many European countries in 2012. Governments were compelled to curtail their spending and increased their income by raising taxes. In addition, unemployment is rising and there is no prospect yet as to a structural recovery of the economic and financial markets. This is having a negative effect on consumer confidence. Corporate investments and consumer spending were pressured as a consequence.
The Dutch economy also had to deal with the effects of a number of long-term issues. Changes in tax policies relating to the deductibility of mortgage interest are creating uncertainty among homeowners and falling prices in the housing market. The office market is also still far from stable, due to surplus capacity exacerbated
by lower demand. The solid Dutch pension system is under pressure from poor returns on investments and rising costs. This has led to concerns about the index ation and levels of pension benefits. These uncertainties have caused both consumer confidence and consumer spending to fall further. The Dutch economy therefore performed worse than the neighbouring countries, including Finland and Belgium, in terms of consumer spending. This was due to the above average fall in consumer confidence in the Netherlands.
The property market situation differs significantly between countries as well as categories. The top end of the market, comprising high-quality shopping centres and office buildings, is still performing well. Properties in this segment are often held long-term and few proper-ties are traded. Less prime properties are not easy to sell under the current market conditions, not least because banks are reluctant to provide financing. The restructur-ing of the European banking sector is progressing slowly, putting the financing market to a standstill, contrary e.g. to the developments in the USA.
05

Wereldhave annual review 2012
The strong growth of e-commerce also affects the values of retail property. Internet sales often have a negative effect on consumer spending in shops. Retailers are forced to be more creative and inventive to maintain spending levels. Property owners will have to entice visitors to spend money in their shopping centres, unlike the past, where owning property mainly was mainly a business of collecting and indexing rent.
An eventful year
2012 was an eventful year for Wereldhave. In February, Wereldhave announced its intention to gradually sell the entire property portfolio in the USA and to focus on properties in Europe. As offers for the US property portfolio, the performance of the mixed-use development project in Eilan and operating performance at the UK shopping centres fell short of expectations, impairments of € 128 million for the US portfolio and of € 37 million for the UK shopping centres (particularly the shopping centre in Poole) were announced in July.
Because lower than expected proceeds from the US disposal would lead to lower scope for reinvestment and therefore lower future earnings capacity, the outlook for future dividends was likewise adjusted downwards. It was no longer possible to meet the target of a dividend of € 4.70 for 2012 and 2013, and a dividend range of € 3.20 to € 3.40 per share was given as a new guideline. Hans Pars, the Chairman of the Board of Management, stepped down in consultation with the Supervisory Board. The profit warning caused the share price to fall significantly.
Four priorities
A recovery of confidence in Wereldhave was essential and four specific measures were immediately announced when the results for the first half year were released on August 2, 2012.
First priority was a change in the exit strategy from the US. Instead of gradually disposing the US property portfolio, Wereldhave decided to sell the entire portfolio in one transaction or in large tranches, to be completed by the end of 2013 at the latest. The aim of this change in exit strategy was to speed up execution and to combine preferred with less sought after properties.
Second priority was the drafting of an action plan for the shopping centres in the UK. Third priority was set as the reduction of general costs and the fourth priority was the drafting of a new strategy, to be communicated during the first quarter of 2013. An open dialogue was held with stakeholders (including the providers of equity and debt, tenants and employees) to inform them about the steps that have been made towards the recovery of confidence in Wereldhave. Substantial progress was already achieved on all four action points in the fourth quarter.
The first priority was achieved with the disposal of the entire US portfolio, which was announced on 7 January 2013, sooner than expected. The US portfolio was sold to Lone Star Funds for $ 720 million and Wereldhave’s net proceeds, after deduction of all costs, are in excess of the book value at September 30, 2012. The disposal also triggers the release of a provision for deferred tax. The total proceeds of the disposal are approximately 5% above book value.
The second priority was met in October 2012 with an action plan for the UK shopping centres, targeting investments to change the downward trend, on a stand-alone basis or in joint ventures with other parties. On 11 February 2013 Wereldhave also announced its withdrawal from the UK. Of all strategic options for the UK, this proved to be the most viable one, also in view of the economic prospects. The disposal of the UK portfolio supports Wereldhave’s focus on four key markets and helps to gain critical mass in these markets.
The disposal of the UK portfolio was nearly completed in the first quarter of 2013. The proceeds of the transactions which were announced February 11, 2013, amount to £ 243 million, which is 4% below the book value at September 30, 2012. Approximately 70% of these disposals were completed in early February, whilst the remainder was completed on February 25 2013. Following these disposals, the UK portfolio only consists of a mixed retail and office development project in Richmond, an
“ Our focus is on the new strategy, better balance sheet ratios and cost containment”
Message from the CEO06
office building in London and a plot of land, valued at some £ 30 million in total. Their disposal will be started up as soon as the construction of the development pro-ject is completed, in the first quarter of 2013. Wereldhave anticipates to fully exit the UK before year-end 2013.
To realise the third priority, a cost cutting programme has been launched to reduce general costs. One of its consequences was a reduction of the number of employees at the head office in The Hague. The closure of the offices in the US and the UK will also reduce the cost base. The Board of Management is well aware of the fact that the decision to substantially reduce the number of employees has had a severe impact on the personal life of employees, but the measures were necessary for the future of Wereldhave.
Finally, a new strategy was outlined with the support of external advisers.
Strategy in three phases
The new strategy is intended to restore Wereldhave’s position as a solid property fund. A property investment company with a focus on convenient shopping with shopping centres in three markets (the Netherlands, Belgium and Finland) and sustainable offices in Paris, combined with balance sheet ratios that are among the most solid in the market. The focus is on improving operational effectiveness and creating value by portfolio optimisation and growth.
The strategy will be executed in three phases. The first phase is ‘Derisking’, i.e. reducing risks in the portfolio. This phase will already have been largely completed on publication of this report, with the disposal of both the US and UK portfolios and the associated reduction of the debt position. Phase two, which starts in 2013, is the ‘Regroup’ phase, the regrouping of activities. This phase focuses on creating a platform for future growth and making the organisation more agile. In addition there is scope for investments to improve and expand in the key markets. After the second phase, mid 2015, Wereldhave will unveil a new strategy, for phase 3, designated
‘Growth’. This phase focuses on growth in our key markets through innovation , expansion of existing shopping centres and the acquisition of properties.
Restoring confidence
The need to carry out a substantial impairment on the portfolio in July and to adjust the earnings and dividend outlook downwards was very painful for everyone concerned at Wereldhave, and had a significant impact on investors’ confidence in Wereldhave. Restoring that confidence was an important objective of the Board of Management in the second half of the year. Our focus on the four priorities, frequent and recurring consultation with investors and lenders and a vigorous and pro-active approach have enabled us to take cautious first steps towards regaining the market’s confidence. The swift and decisive handling of the disposal process for the US and UK portfolios certainly contributed to this, but a full recovery of confidence requires more than that. In phase 2 clear and transparent goals were set, which are both ambitious and realistic. By mid-2013, all focus will shift to operational excellence.
Wereldhave’s key objectives are solid capital ratios, a strong balance sheet and portfolio and a direct result that allows a dividend to be distributed in line with investors’ expectations. A clear improvement of the balance sheet ratios following the disposal of the US and UK portfolio, significantly reduced operational risks and a focus on regrouping and growth provides a sound basis.
Key elements in the new strategy are operational excel-lence in managing shopping centres and the controlled replenishment and roll-out of the development pipeline, targeted mainly at improving and expanding existing shopping centres in our portfolio. An important item is the successful completion of the Itis shopping centre in Helsinki. Another important part of the strategy is a good relationship with stakeholders, particularly with shareholders, lenders and tenants. Control and business culture
Wereldhave has announced a new board structure, with a CEO and CFO, who are supported by a management team. This new structure safeguards close cooperation in all processes, the involvement of all disciplines in decision making and operations as well as one common agenda for the entire group. The corporate culture will change as well.
Value growth is no longer possible without active management of the property in the portfolio.
07

Wereldhave annual review 2012
Wereldhave has been engaged in the property market since 1930 and has been listed since 1947. Over the years, Wereldhave has regularly adapted its investment policy in response to changing market conditions. The property market has changed irrevocably. Value growth is no longer possible without active management of the prop-erty portfolio. Changes in society that are having a major impact on the retail and property sectors and therefore on returns on investments require an adequate response. The surging growth of e-commerce, the scarcity of high-quality properties and urban population growth fed by an outflow of people from rural areas demand a different approach.
The corporate culture at Wereldhave must closely fit with these social changes. They call for greater entrepreneurial drive, active management of shopping centres in particular, greater transparency and better communication with key stakeholders, and results- driven, agile policies. The prime focus will be on generating rental growth through higher footfalls, better occupancy rates and higher spending in shopping centres. The relocation of the head office from The Hague to WTC Schiphol is part of the intended culture change process. Accommodating all disciplines on one large floor space will contribute to the organisation’s responsiveness and internal cooperation.
Outlook for 2013
A moderate improvement in market sentiment is expected in 2013, but the year will almost certainly be dominated by continuing economic challenges. The limited scope for financing, the continuing growth of e-commerce and the persistent pressure on consumer spending are expected to result in another difficult year for the retail and real estate sector.
2013 will be a year of transition for Wereldhave. The property sales in the US and UK will lead to a decrease in rental income. Development projects to be completed will only gradually start contributing to results from 2014 onwards. The direct result for 2013 will accordingly
depend to a large extent on the speed with which suitable new investments in our core markets can be made. Wereldhave does not provide a forecast for the direct result for 2013, but expects to maintain the dividend for 2013 at € 3.30 per share even if the direct result falls short.
With the fast execution of the 4 priorities (exit from the US, action plans for the UK shopping centres, reduction of general costs and a new strategy) we strongly believe that Wereldhave is well positioned to enter into the new phase to build a strong platform of assets and staff, to serve the retail markets in Finland, The Netherlands and Belgium and the office market in Paris.
Finally, we wish to express our gratitude to our investors, the providers of debt and tenants, who have continued to put their trust in us during the eventful year 2012. Also, the Board of Management wishes to thank all employees for their efforts, flexibility and support, which are the basis for recovery in 2013.
Dirk Anbeek, CEO
“ 2013 will be a year of transition for Wereldhave”
Message from the CEO08
Strategy update
Strategy UpdateIn response to the changing environment for
consumer-, retail-, real estate- and finance-markets
Wereldhave decided to focus on shopping centres in
North-West Europe and sustainable offices in Paris.
In line with the retail structures in the core countries Belgium, the Netherlands and Finland Wereldhave focuses on convenient shopping with shopping centres that are top-of-mind in catchment areas of at least 100,000 inhabitants within 10 minutes travel time. Wereldhave’s shopping centres offer consumers ‘convenient shopping’: 90% of shopping needs, strong (inter)national tenants, fully embedded food and beverage functions and easy accessibility. In addition, Wereldhave will remain active in the Paris office market with a focus on sustainable offices.
Wereldhave implements its strategy in three phases: Derisk, Regroup and Growth
DERISK (mid 2012 until mid-2013)
During the second half of 2012, Wereldhave focused on the sale of the US portfolio, the action plan for the UK, overhead reduction and the strategy update. The first phase will be completed by mid 2013. After completing this phase Wereldhave has a focused portfolio, a strong balance sheet and low general costs.
REGROUP (mid 2013-2015)
The second phase is aimed at strengthening and expanding Wereldhave’s position in the four core markets through: operational excellence, a controlled development pipeline, value maximisation of the Itis shopping centre, reinvesting in core markets and alignment with all stakeholders. Wereldhave’s activities in Spain are ‘on hold’.
GROWTH (from mid 2015)
After completion of phase II, expected mid-2015, Wereldhave will present a strategy plan for growth.
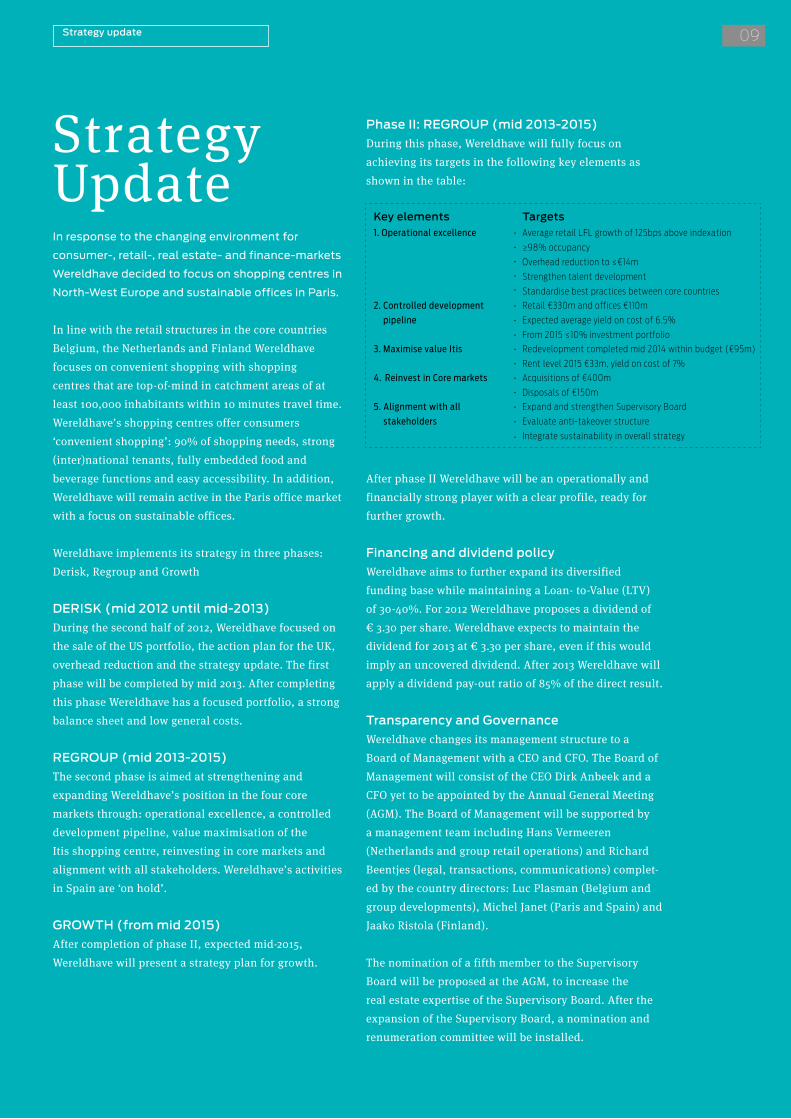
Phase II: REGROUP (mid 2013-2015)
During this phase, Wereldhave will fully focus on achieving its targets in the following key elements as shown in the table:
Key elements Targets1. Operational excellence • Average retail LFL growth of 125bps above indexation
≥98% occupancy
Overhead reduction to ≤€14m
Strengthen talent development
Standardise best practices between core countries
•
•
•
•
2. Controlled development
pipeline
•
•
•
Retail €330m and offices €110m
Expected average yield on cost of 6.5%
From 2015 ≤10% investment portfolio
3. Maximise value Itis • Redevelopment completed mid 2014 within budget (€95m)
Rent level 2015 €33m, yield on cost of 7%•
4. Reinvest in Core markets • Acquisitions of €400m
Disposals of €150m•
5. Alignment with all
stakeholders
•
•
Expand and strengthen Supervisory Board
Evaluate anti-takeover structure
Integrate sustainability in overall strategy•
After phase II Wereldhave will be an operationally and financially strong player with a clear profile, ready for further growth.
Financing and dividend policy
Wereldhave aims to further expand its diversified funding base while maintaining a Loan- to-Value (LTV) of 30-40%. For 2012 Wereldhave proposes a dividend of € 3.30 per share. Wereldhave expects to maintain the dividend for 2013 at € 3.30 per share, even if this would imply an uncovered dividend. After 2013 Wereldhave will apply a dividend pay-out ratio of 85% of the direct result.
Transparency and Governance
Wereldhave changes its management structure to a Board of Management with a CEO and CFO. The Board of Management will consist of the CEO Dirk Anbeek and a CFO yet to be appointed by the Annual General Meeting (AGM). The Board of Management will be supported by a management team including Hans Vermeeren (Netherlands and group retail operations) and Richard Beentjes (legal, transactions, communications) complet-ed by the country directors: Luc Plasman (Belgium and group developments), Michel Janet (Paris and Spain) and Jaako Ristola (Finland).
The nomination of a fifth member to the Supervisory Board will be proposed at the AGM, to increase the real estate expertise of the Supervisory Board. After the expansion of the Supervisory Board, a nomination and renumeration committee will be installed.
09

Wereldhave annual review 2012
REPORT FROM THE SUPERVISORY BOARDThe year 2012 was an eventful year
for Wereldhave. In the first part of
the year, Wereldhave announced a
strategic repositioning as part of
which it would be withdrawing from
the USA after a period of 34 years.
A timeframe of two to three years
was set for this withdrawal.
Report from the Supervisory Board10

REPORT FROM THE SUPERVISORY BOARDS
hortly after the General Meeting of Shareholders on 23 April 2012 it became clear that the results for the first quarter of 2012 were disappointing,
particularly in the UK and the USA. The Supervisory Board decided to continue monitoring developments closely and requested the Board of Management to provide interim information on operating performance. This detailed information showed that at an unchanged policy, the downtrend in the UK was even set to accelerate in the second quarter. The shopping centre in Poole was suffering particularly strongly from vacancies and the redevelopment plans for the centre had not progressed sufficiently to turn the down-trend.
Additionally, in the USA the take-up of leases for the development project Eilan in San Antonio was disappointing, start-up losses on this project were greater than anticipated and offers for the office building DiamondView in San Diego were substantially below expectations. Moreover, the overall operating result
for the US portfolio was below par, with an occupancy rate of some 70%. These developments gave rise to an adjustment of the property valuations for the entire US portfolio.
Further to those results Wereldhave issued a profit warning on 23 July 2012. The Chairman of the Board of Management, Hans Pars, stepped down in close consultation with the Supervisory Board. Shortly after, the departure of the country directors of the UK and the USA was announced.
Partly in response to questions from various share-holders on the governance structure, the Supervisory Board extensively considered Wereldhave’s governance in the past year. For many decades, Wereldhave had a Board of Management consisting of two directors with a geographically segmented division of responsibilities. Both directors were responsible for a number of countries and staff departments. The Supervisory Board
11

Wereldhave annual review 2012
decided to implement a board structure comprising a CEO and a CFO. This Board of Management is supported by a management team of five people. Within the managementteam Hans Vermeeren will be responsible for the Netherlands & Group Retail Operations, Richard Beentjes for Legal, Transactions and Communications, Luc Plasman for Wereldhave Belgium & Group Developments, Michel Janet for France and Spain and Jaakko Ristola for Finland.
This new structure safeguards close cooperation in all processes and the involvement of all disciplines in decision-making, operations and final results as well as one common agenda for the entire group.
The Supervisory Board appointed Dirk Anbeek as CEO with effect from 1 August 2012. Dirk Anbeek’s first term of office will expire in April 2013. The Supervisory Board is nominating him for reappointment, for a term of four years ending in April 2017.
The Supervisory Board proposes Pieter Roozenboom for appointment as CFO. The Netherlands Authority for the Financial Markets AFM has approved his appointment. He will be nominated at the General Meeting of Shareholders on 22 April 2013, but is expected to be able to commence his work on 1 June 2013 in connection with a period of notice at his current employer. Herman van Everdingen acted as temporary Managing Director during the period of vacancy for the position of CFO. The Supervisory Board recognises the benefits of diversity, including gender balance, within the Board
of Management and the Supervisory Board. At present, the Company does not comply with the Dutch Act on Management and Supervision, which aims at a representation of at least 30% of either gender in both boards. However, also in view of the limited size of the Board of Management, the Supervisory Board applies a broader definition of diversity and will continue to select members primarily on the basis of areas of expertise, experience, backgrounds and skills.
Meetings of the Supervisory Board
The Supervisory Board held fifteen meetings in 2012, more than twice as many as in preceding years. Five of those meetings were held without the Board of Management being present. The attendance rate was 95%.
Special topics in 2012 included the decision to withdraw from the USA, the profit warning, the composition of the Board of Management, the trend of general costs, the new strategy of Wereldhave and the associated cultural change within the company. Regular topics included the operating performance of the property portfolio, movements in results and equity, investments and disposals, the financing policy, currency and dividend policy and tax issues. The second half of 2012 in particular was dominated by recovery measures. The principal topics were the accelerated exit from the USA, the reassessment of the company’s presence in the UK and the containment of general costs. Those topics were discussed in constructive consultation with the Board of Management and led to the adoption of the new strategy on 8 February 2013.
Peter Essers (55)
Member of the Supervisory Board since 2005
Member Audit Committee since November 9, 2005
Reappointed in 2010
Retires by rotation in 2013
Fred Arp (59)
Member of the Supervisory Board since 2005
Chairman Audit Committee since 2005
Reappointed in 2008 and 2011
Retires by rotation in 2014
Report from the Supervisory Board12

The status of the protracted issue of the Belgian tax claim was again discussed regularly in 2012. The hearing of the appeal lodged by the Public Prosecutor has been postponed to 11 March 2013.
As in 2012, the Supervisory Board decided not to perform an internal audit for 2013 either. The system of annual country assessments by the Group Control department, the results of which are reported to the Board of Management and the Supervisory Board, is operating satisfactorily. The internal country review was combined in 2012 with a detailed briefing by the Compliance Officer on the business integrity principles and customer due diligence.
In principle, the Supervisory Board holds one meeting a year in one of the countries where Wereldhave is active, to visit the portfolio and to exchange views with the country managers and their senior officers. In 2012 however, the Supervisory Board decided to hold all meetings in the Netherlands, given the prevailing special circumstances.
The Supervisory Board assessed its own performance in 2012, partly in response to the disappointing results for the first six months. The Supervisory Board’s self- assessment was based on questionnaires completed in advance by its members. Use was also made of the information that was obtained at a meeting with institutional investors following the disappointing results for the first six months. In the wake of that meeting the Supervisory Board considered the question whether any members of the Supervisory Board needed
to step down. This did not lead to the resignation of any Supervisory Board members but did result in the decision to modify the profile for new members as well as the proposal to enlarge the Supervisory Board to five members. The Supervisory Board also decided to carry out another self-assessment early in 2013, for which purpose the Supervisory Board will this time call on external support.
Conclusion
The Supervisory Board wishes to thank Dirk Anbeek and Herman van Everdingen as well as all employees for their exceptional commitment. Over the past six months, Wereldhave has achieved major progress on the four priorities designated after the profit warning on 23 July 2012: the accelerated exit from the USA, an action plan for the UK portfolio, the containment of general costs and the announcement of a new strategy, whilst maintaining operating results in the remaining four countries. At the close of 2012, the Supervisory Board can report that these priorities have been virtually met and that the company is embarking on a new future with a new strategy and a significantly improved risk profile.
The Supervisory Board endorses the new strategy and firmly believes that Wereldhave has defined clear targets. The Supervisory Board believes that the focus on a portfolio in stable North-West European retail markets and the Parisian office market, a solid Loan-to-Value, improved governance, transparency with regard to stakeholders, the new corporate culture and greater entrepreneurial drive provide a sound basis for success in the years ahead.
Joop van Oosten (64)
Chairman since 2011
Member of the Supervisory Board since 2009
Reappointed in 2012 until 2016
Herman van Everdingen (57)
Director Catalyst Advisors
Member of the Supervisory Board since 2011
Retires by rotation in 2015
13

Wereldhave annual review 2012
Core Markets Wereldhave
OUR CORE MARKET: THE NETHERLANDSWereldhave focuses on medium-sized
shopping centres in the Netherlands
that are dominant in their catchment
area. All shopping centres will be
refurbished in the next few years
and some will also be expanded.
The value of Wereldhave’s retail property portfolio in the Netherlands at the end of 2012 was € 481.8 million, or 89.1% of the total portfolio in the
Netherlands. In the Netherlands, Wereldhave owns and manages shopping centres in Arnhem, Capelle aan den IJssel, Maassluis, Leiderdorp, Eindhoven, Etten-Leur, Purmerend and Roosendaal.
Difficult market conditions
Shopping centres in the Netherlands had to contend with difficult market conditions in 2012. This was due to the economic crisis, the decline in consumer confidence and growing competition from internet shopping. Uncertainties relating to matters including house prices, the deductibility of mortgage interest and pensions are causing consumers to rein in their spending and putting pressure on their purchasing power. The convenience of shopping via the internet means more people are staying at home. The market did not deteriorate for all sectors, however. Sales and profitability of food retailers remained stable
“The economic crisis and growing competition from the internet
have led to changes in our organisation. More than ever, active
management of shopping centres is essential to achieving
healthy returns. This has led to a change in our organisation.
Customer focus and marketing are now central to our operations.
Our knowledge base was strengthened by new employees with
ample experience in retail and marketing.”
“Additionally, Wereldhave has developed a clear vision for
responding to the changing market conditions. In the Netherlands,
we focus on medium-sized shopping centres that are dominant in
a catchment area that encompasses at least 100,000 inhabitants.
The shopping centres should be able to provide for 90% of
customers’ daily requirements. Convenience for consumers is key.”
“We have a clear vision of what a shopping centre should look
like. The range of shops should combine strong national and
international brands with robust local businesses. Visitors are
offered pretty and clean facilities and free internet throughout
the shopping centre and can use social media such as Facebook
and Twitter to be alerted to shops’ latest special offers. All of
Wereldhave’s shopping centres in the Netherlands must offer an
optimal mix of convenience and shopping enjoyment.“
Hans Vermeeren, Managing Director of Wereldhave Netherlands
“ OFFER CONVENIENCE
AND ENJOYMENT IN
ALL OUR SHOPPING
CENTRES”
THE NETHERLANDS
1 Arnhem
2 Purmerend
3 Leiderdorp
4 Eindhoven
5 Etten-Leur
6 Roosendaal
7 Capelle aan
den IJssel
8 Maassluis
14
2
3
4
5
78 1
6

or edged up. The non-food sector by contrast performed disappointingly to very poorly. Shops in the cheaper segment faced particularly severe competition from online retailers in 2012.
Portfolio improvements
Wereldhave took several major steps in 2012 in the field of social media. The websites of all shopping centres were overhauled, as part of which retailers were given access to social media channels they can use for marketing purposes. This allows retailers to make special offers via Facebook and Twitter, and was successful from the outset.
From 2013, Wereldhave will start improving the shopping centres in its portfolio. The coming two to three years will see investments of € 30 million in the renovation of all eight shopping centres. A start will also be made in 2013 on preparations for the planned expansions in Maassluis, Leiderdorp and Arnhem, in which another € 30 million will be invested. At the same time, Wereldhave continues to look for potential acquisitions of medium-sized shopping centres that are dominant in their region.
Outlook
The Dutch market is expected to continue to contract somewhat further in 2013 in terms of consumer confidence and sales. Wereldhave nonetheless sees potential for good shopping centres that set themselves apart by their customer focus and innovation. To provide an even better retail experience, Wereldhave
is aiming for increased service levels at shopping centres, with facilities including attractive cafés and restaurants, play zones for children and service areas. In addition, it is crucial to pursue an optimum mix of international, national and regional tenants.
Over the past few years, there has been more room again in the high street for good butchers and good fishmongers as well as high-quality cafés and restaurants. Wereldhave is responding to that trend. Convenience and shopping come together in Wereldhave’s shopping centres.
TOP 5 TENANTS(AS AT DECEMBER 31, 2012 BASED ON
THE CONTRACTED ANNUAL RENT IN 2013)
1. AHOLD
2. BLOKKER
3. EXCELLENT RETAIL BRANDS
4. HENNES & MAURITZ
5. HEMA
KEY PARAMETERS CORE RETAIL PERFORMANCE
2012 2011
Net rental income € 29.2m € 29.1m
Cap rate 6.3% 5.9%
Occupancy 97.1% 96.5%
Investment properties in operation € 481.8m € 491.7m
Investment properties under construction € 2.7m € 1.8m
Acquisitions € 3.0m € 3.9m
“ Offering an optimal mix of convenience and shopping enjoyment”
ARNHEM - Shopping centre Kronenburg
15
1.
2. 3.
4. 5.

Wereldhave annual review 2012
OUR CORE MARKET: FINLAND Wereldhave focuses on shopping centres
in Finland. The portfolio consists of the
Itis shopping centre, which is currently
being modernised and expanded to
further strengthen its market position.
Itis in Helsinki is a very large shopping centre which has been owned by Wereldhave since January 2002. It is currently undergoing modernisation, as part
of which a number of high-footfall sites are being relocated within the centre and the retail floor space is being expanded. The project will be completed in 2014. Wereldhave’s portfolio in Finland was valued at € 458.3 million at the end of 2012.
Market with growth prospects
The prospects for growth in the Finnish retail market are increasingly attracting interest from international retail chains and Wereldhave is benefiting from this development in securing attractive tenants for Itis.
As in other countries, growing internet sales are providing competition for shopping centres in Finland.
FINLAND
1 Helsinki
HELSINKI - Itis
Wereldhave nonetheless believes that both sales channels can comfortably co-exist alongside each other and is responding to this trend. For instance, pick-up points have been set up in various stores in Itis where consumers can collect the products they have ordered via the internet.
Investing to increase value
Wereldhave is currently investing significantly in the redevelopment of Itis to further increase the value of the shopping centre. Investments in modernisation and expansion will total € 95 million in the period 2011-2014.
“ An attractive range of stores combined with a very high level of service”
Core Markets Wereldhave16
1

Wereldhave started the modernisation of Itis in 2011. It is designed to increase its attractiveness, number of visitors, retail sales and ultimately also rents again. While the main focus in 2012 was on design and planning and the initial renovation phase, the major part of the redevelopment will take place in 2013.
Outlook
The number of visitors to Itis edged down in 2012, mainly due to the ongoing refurbishment. The number of visitors and sales are both expected to rise again in 2013. Building is scheduled to be completed by Christmas 2013, meaning 2013 will be a challenging year with construction ongoing in a shopping centre that is open for customers every day.
Its new allure, new stores and new brands will turn Itis into a state of the art shopping centre. Examples of new leading stores include the fashion chain New Yorker, the opticians Specsavers and the Scandinavian fashion chains Only, Carlins, Cubus and Bik Bok.
With 155 stores, Itis is one of the largest shopping centres in Northern Europe. After completion of the redevelopment it will offer consumers an attractive range of stores combined with a very high level of service.
“In 2012 we continued to adapt our organisation in Finland to
Wereldhave’s ambitions. This led to a restaffing of half of the
positions. Our new team is well-equipped to make a difference
in the years ahead. To increase the value of our portfolio and
continue to expand it.”
“With a value of approx. € 450 million and floor space of
85,000 m2 Itis is currently the largest asset in our portfolio.
In line with Wereldhave’s new strategy we are working hard
to optimise the value of this shopping centre by means of
comprehensive modernisation and expansion. This is aimed
at leading to rental income of € 33 million in 2015 and a
return of 7%.“
“To further consolidate our position in Finland we are also
looking at acquisitions where possible. We are targeting
shopping centres with floor space of 10,000-40,000 m²
valued in the range of € 50-150 million. In line with the
strategy, the focus is on shopping centres with an attractive
catchment area where the shopping centre has a top of mind
position among local residents.”
Jaakko Ristola, Managing Director of Wereldhave Finland
“ FURTHER GROWTH
BASED ON STRONG
ORGANISATION”
KEY PARAMETERS CORE RETAIL PERFORMANCE
2012 2011
Net rental income € 23.6m € 28,2m
Cap rate 6.1% 5.8%
Occupancy 98.5% 96.5%
Investment properties in operation € 458.3m € 456.5m
Investment properties under construction € 36.7m € 6.5m
Acquisitions - -
TOP 5 TENANTS(AS AT DECEMBER 31, 2012 BASED ON
THE CONTRACTED ANNUAL RENT IN 2013)
1. STOCKMANN
2. KESKO
3. HENNES & MAURITZ
4. NORDEA
5. TOKMANNI
17
1.
2. 3.
4. 5.

Wereldhave annual review 2012
OUR CORE MARKET: BELGIUMWereldhave Belgium focuses on
medium-sized shopping centres
that are dominant in their
catchment area. Wereldhave
Belgium is a listed company
in which Wereldhave holds an
interest of almost 70%.
Wereldhave’s portfolio in Belgium comprises shopping centres in Liège, Nivelles, Doornik, Genk and redevelopments in Genk,
Waterloo and Ghent. At the end of 2012, the shopping centre portfolio was valued at € 377.5 million, or 76% of the overall portfolio otherwise comprising offices in Antwerp, Brussels and Vilvoorde.
Stable market
The Belgian retail market held up well in 2012 com-pared to trends in the neighbouring countries of the Netherlands and France, in terms both of retail sales and property values. This stability is due to several factors. Wages and salaries are automatically indexed each year in Belgium and in addition levels of savings are high, which helped to maintain consumers’ purchasing power.
In addition to benefiting from stable consumer spending, the Belgian shopping centres were also less affected by competition from internet sales. The percentage of retail sales achieved by e-commerce is lower in Belgium than in its neighbouring countries.
Responding successfully to market
developments
In 2012 Wereldhave actively responded to market developments that offered opportunities in the retail
4
2
31
5
1 Liège
2 Nivelles
3 Tournai
4 Waterloo
5 Genk
BELGIUM
“The Belgian retail market held up well in 2012 due to stable
consumer spending. In addition, shopping centres were less
affected by competition from internet sales than in the
neighbouring countries of the Netherlands and France.
The stability of the retail market in Belgium is also attracting
growing interest among investors. In 2012, 36% of property
investments were made in the retail sector, up significantly
from 25% in the previous year. Wereldhave is very successful
in Belgium with the expansion and development of shopping
centres. In March, the expansion of the shopping centre in
Nivelles proved to be very successful immediately after its
completion. The shopping centre has become even more
attractive for local residents. They can not only do all their
shopping in the shopping centre but also meet each other
in a pleasant, modern environment.”
“We will continue the successful strategy of (re)developing
shopping centres in Belgium in the coming years. To expand
the portfolio, we are looking for acquisitions or projects that
we are able to develop in-house with our experienced team.
The focus is on shopping centres that are dominant in their
catchment area.”
Luc Plasman, Managing Director of Wereldhave Belgium
“ FOCUS ON SHOPPING
CENTRES THAT ARE
DOMINANT IN THEIR
CATCHMENT AREA”
Core Markets Wereldhave18

sector. In March, the expansion of the shopping centre in Nivelles became operational and in Genk the commercial portion of the complex ‘Stads- en Sint-Martinusplein’ and around 80% of the shopping centre ‘Shopping I’ were acquired from Redevco.
The size of the shopping centre in Nivelles was almost doubled by the expansion and thereby became even more attractive for the catchment area. Increasingly, consumers are looking for shopping centres where they can do all their shopping in a pleasant environment. The role of shopping centres as meeting places is growing accordingly.
Wereldhave will continue its successful strategy of (re)developing shopping centres in the coming years. In Genk, the Shopping I shopping centre is being renovated and expanded. The shopping centre in Doornik is also being expanded and a retail park is being built. In Gent Overpoort, Wereldhave is developing a complex of shops and 119 student rooms.
Outlook
Wereldhave Belgium is expecting a more difficult market in 2013 than in 2012. Although wages and salaries will be automatically indexed again this year, it remains to be seen what impact the austerity measures entailed by the economic conditions will have.
In addition to the planned expansions of the existing portfolio, Wereldhave is also looking at other options for expanding its shopping centre portfolio in the years ahead. This includes both possible acquisitions and new in-house developments.
TOP 5 TENANTS(AS AT DECEMBER 31, 2012 BASED ON
THE CONTRACTED ANNUAL RENT IN 2013)
1. C&A
2. HENNES & MAURITZ
3. CARREFOUR
4. DELHAIZE
5. EXCELLENT RETAIL BRANDS
KEY PARAMETERS CORE RETAIL PERFORMANCE
2012 2011
Net rental income € 23.1m € 16.0m
Cap rate 6.4% 6.3%
Occupancy 98.7% 99.9%
Investment properties in operation € 377.5m € 257.0m
Investment properties under construction € 55.2m € 74.4m
Acquisitions € 74.0m -
“ Shopping centres are increasingly becoming meeting places as well”
NIVELLES - Shopping centre Nivelles
1.
2. 3.
4. 5.
19

Wereldhave annual review 2012
OUR CORE MARKET: FRANCE In France, Wereldhave focuses
on sustainable offices in the
Greater Paris region. All offices
of Wereldhave in Paris are in
good, easily accessible locations
in the inner suburbs of Paris.
Wereldhave has two office buildings in Paris that are operational and two that are being developed. One of the latter, the office
building under development in Joinville, was sold in December 2012. This office building will be transferred to the new owner immediately after completion of the project in 2013. The value of the investment portfolio in Paris at the end of 2012 was € 174.7 million, while the development portfolio was valued at € 116.4 million.
FRANCE/PARIS
1 Paris and environs
PARIJS - UrbaGreen
Large and dynamic market
Wereldhave has been active in the Parisian office market - the largest in Europe after London - since 1978 and has always been successful there. This market’s size and the excellent public transport network mean that Paris is one of the most attractive markets in Europe. The market is diverse, in terms of both location and price, with rents of € 240 to € 800 per square metre.
The office market in Paris achieved moderate growth of 1.4% in 2012, while the vacancy rate was 6.8%. Tenants are looking mainly for efficient, renovated and new spaces, which is leading to the demolition or renovation of old office buildings and the launch of new develop-ment projects. Rents remained stable in 2012, but the incentives that owners were required to grant to tenants, such as rent-free periods, grew in size.
New opportunities
Wereldhave is continually considering new investment opportunities in the Paris office market, not just for development projects but also for existing buildings. The market in Paris is large and development projects are always on offer. But demand is likewise strong, driving up prices.
Core Markets Wereldhave20
1

Wereldhave sets a number of clear requirements for development projects in Paris. It is looking for projects with ample floor space (800-3,000 m2 per floor) that are located near major public transport interchanges. Every Wereldhave development project in Paris must obtain the breeam label ‘Excellent’ and offer clear advantages, for instance a location near a park or water.
Outlook
The office market in Paris is expected to remain stable in 2013, with a limited decrease in prices and higher incentives for tenants. Wereldhave is aiming to expand its portfolio in Paris in 2013 and is therefore carefully evaluating the opportunities in the office market. With its strong track record, the good reputation of the Wereldhave team in Paris and its solid financial position, Wereldhave can respond swiftly when suitable opportunities arise.
“Wereldhave has a strong track record in the Paris market and
is known in France as a solid, experienced investor in com-
mercial property. In the past ten years, we have successfully
developed or redeveloped five office buildings in Paris, of
which two have been sold with attractive returns of 66% and
29% respectively.”
“Following the sales, our portfolio will comprise three projects,
of which two are operational and one is under development.
This latter project, located on the Seine, is characteristic of our
strategy in Paris. The project is large, comprising floor space of
over 22,000 m², is easily accessible by public transport and has
direct access to the Boulevard Périphérique in Paris. And like
other Wereldhave projects it will be given the BREEAM label
‘Excellent’.”
“Our objective for the years ahead is to continue to operate
successfully in the Paris office market and to continue to
create shareholder value. To achieve this we will actively
look for attractive existing buildings as well as development
projects. For development projects, the challenge for us is to
achieve an initial return of at least 7.5%.”
Michel Janet, Managing Director of Wereldhave France
“ SUCCESSFUL IN
DEVELOPMENT
PROJECTS”
KEY PARAMETERS OFFICE PERFORMANCE
2012 2011
Net rental income € 9.4m € 9.1m
Cap rate 6.1% 5.8%
Occupancy 99.0% 99.1%
Investment properties in operation € 174.7m € 163.8m
Investment properties under construction € 116.4m € 3.5m
Acquisitions - -
“ Develop sustainable offices with an attractive and central location”
TOP 5 TENANTS(AS AT DECEMBER 31, 2012 BASED ON
THE CONTRACTED ANNUAL RENT IN 2013)
1. ÉLECTRICITÉ DE FRANCE
2. GROUPE CANAL+
3. KOHLER
4. REX-ROTARY
5. LAFI ENGINEERING
1.
2. 3.
4. 5.
21
Wereldhave annual review 2012
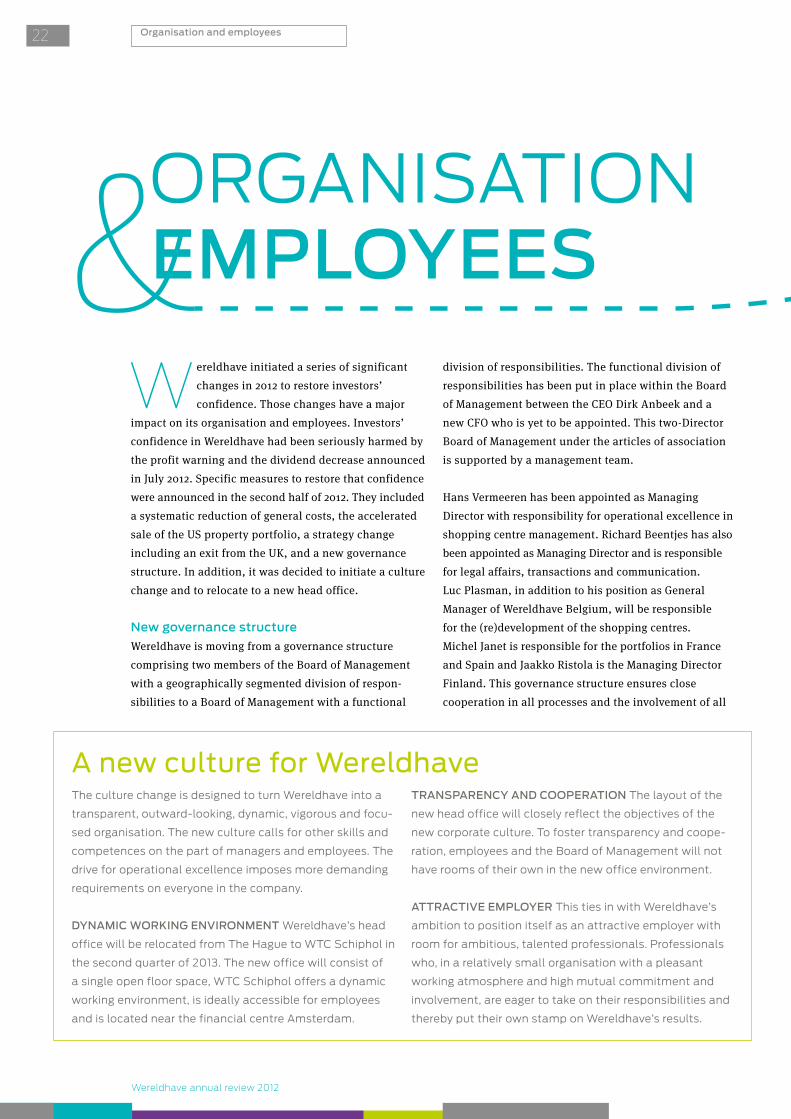
Wereldhave initiated a series of significant changes in 2012 to restore investors’ confidence. Those changes have a major
impact on its organisation and employees. Investors’ confidence in Wereldhave had been seriously harmed by the profit warning and the dividend decrease announced in July 2012. Specific measures to restore that confidence were announced in the second half of 2012. They included a systematic reduction of general costs, the accelerated sale of the US property portfolio, a strategy change including an exit from the UK, and a new governance structure. In addition, it was decided to initiate a culture change and to relocate to a new head office.
New governance structure
Wereldhave is moving from a governance structure comprising two members of the Board of Management with a geographically segmented division of respon-sibilities to a Board of Management with a functional
division of responsibilities. The functional division of responsibilities has been put in place within the Board of Management between the CEO Dirk Anbeek and a new CFO who is yet to be appointed. This two-Director Board of Management under the articles of association is supported by a management team.
Hans Vermeeren has been appointed as Managing Director with responsibility for operational excellence in shopping centre management. Richard Beentjes has also been appointed as Managing Director and is responsible for legal affairs, transactions and communication. Luc Plasman, in addition to his position as General Manager of Wereldhave Belgium, will be responsible for the (re)development of the shopping centres. Michel Janet is responsible for the portfolios in France and Spain and Jaakko Ristola is the Managing Director Finland. This governance structure ensures close cooperation in all processes and the involvement of all
The culture change is designed to turn Wereldhave into a
transparent, outward-looking, dynamic, vigorous and focu-
sed organisation. The new culture calls for other skills and
competences on the part of managers and employees. The
drive for operational excellence imposes more demanding
requirements on everyone in the company.
DYNAMIC WORKING ENVIRONMENT Wereldhave’s head
office will be relocated from The Hague to WTC Schiphol in
the second quarter of 2013. The new office will consist of
a single open floor space, WTC Schiphol offers a dynamic
working environment, is ideally accessible for employees
and is located near the financial centre Amsterdam.
TRANSPARENCY AND COOPERATION The layout of the
new head office will closely reflect the objectives of the
new corporate culture. To foster transparency and coope-
ration, employees and the Board of Management will not
have rooms of their own in the new office environment.
ATTRACTIVE EMPLOYER This ties in with Wereldhave’s
ambition to position itself as an attractive employer with
room for ambitious, talented professionals. Professionals
who, in a relatively small organisation with a pleasant
working atmosphere and high mutual commitment and
involvement, are eager to take on their responsibilities and
thereby put their own stamp on Wereldhave’s results.
Organisation and employees
ORGANISATIONEMPLOYEES
A new culture for Wereldhave
22

disciplines in the decision-making and results. It provides a clear functional profile for the members of the Board of Management. This mode of governance is closely aligned with the culture of hands-on cooperation.
Updated toolset
In line with the new corporate culture objectives, the HR department has developed a new toolset. First, employees at all levels will be offered a short-term incentive plan. New remuneration and appraisal systems are also set to be rolled out in 2013. This will be accompanied by investments in the quality of the organisation, for instance by a stronger management focus on employees’ development. Process design will be modified in line with the change in the organisation structure. As part of the drive for operational excellence, there will also be a clear commitment to improving the efficiency of core processes and developing and implementing standardised practices throughout the organisation, including the country organisations.
Employee development
During the year 2012, the number of employees at Wereldhave averaged 212 FTE, of which 153 in
operations abroad, compared to 213 and 158 respectively a year earlier. Within the total number of employees in 2012, 54% were female and 46% were male. The average age was 43 years and the average length of service was 9 years. Absenteeism due to illness was 1.7%, compared to 3.5% in 2011. Excluding the US and UK operations, the average number of employees in 2012 was 134 FTE.The organisation of the holding company and of Wereldhave Nederland was evaluated in 2012 in view of the need to achieve the company’s goals, to improve the effectiveness of the central organisation and to strengthen the country organisations. This led to the announcement, at the start of December, of the loss of several positions. Out of the total workforce of 62 employees (Holding company and Netherlands), 10 employees lost their jobs.
ORGANISATION
NUMBER OF EMPLOYEES
212 FTE MALE FEMALE
46% 54%
AVERAGE AGE
43 YEARS AVERAGE LENGTH OF SERVICE
9 YEARS
“ Culture change designed to lead to greater focus, transparency and cooperation”
Pete
r Hilz
/ H
olla
ndse
Hoo
gte
23

Wereldhave annual review 2012
&WERELDHAVEsocial media
Wereldhave is actively responding
to the growing popularity of
online shopping. Every one of
Wereldhave’s shopping centres
in the Netherlands is accessible
online and retailers are making
extensive use of social media
such as Facebook, Twitter,
Foursquare and Snipper.
WERELDHAVE FULLY COMMITTED TO SOCIAL MEDIA
Wereldhave & Social media24
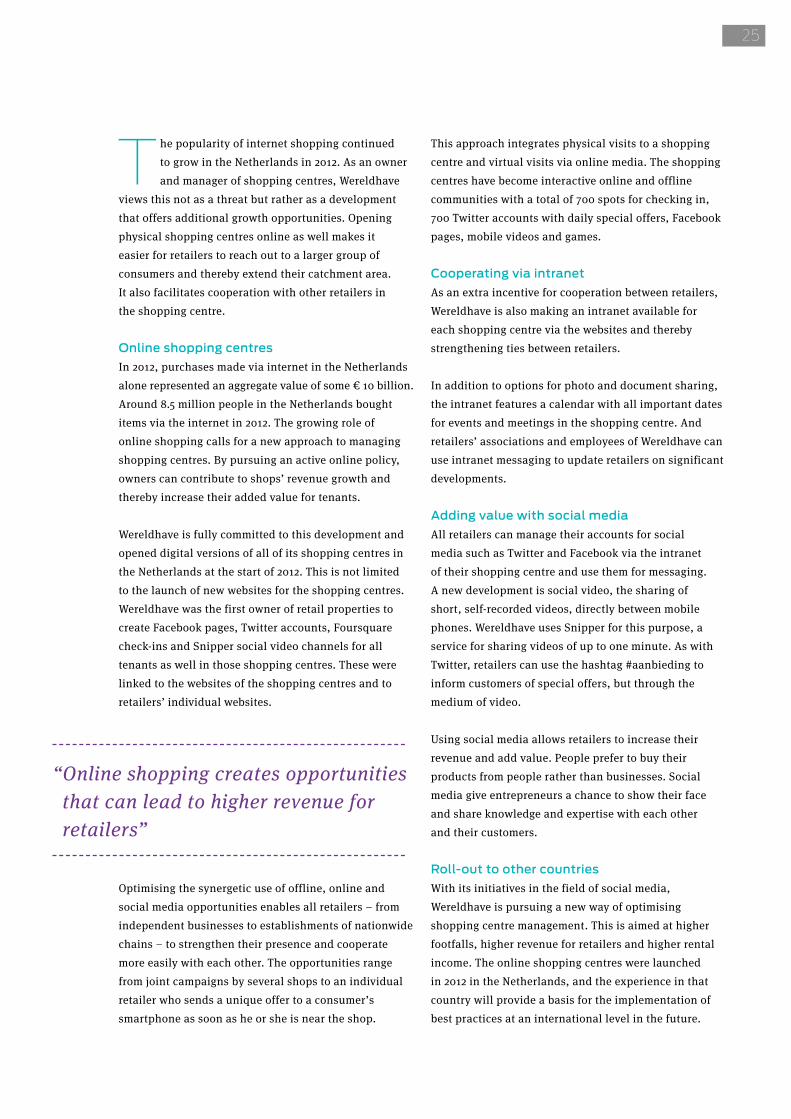
The popularity of internet shopping continued to grow in the Netherlands in 2012. As an owner and manager of shopping centres, Wereldhave
views this not as a threat but rather as a development that offers additional growth opportunities. Opening physical shopping centres online as well makes it easier for retailers to reach out to a larger group of consumers and thereby extend their catchment area. It also facilitates cooperation with other retailers in the shopping centre.
Online shopping centres
In 2012, purchases made via internet in the Netherlands alone represented an aggregate value of some € 10 billion. Around 8.5 million people in the Netherlands bought items via the internet in 2012. The growing role of online shopping calls for a new approach to managing shopping centres. By pursuing an active online policy, owners can contribute to shops’ revenue growth and thereby increase their added value for tenants.
Wereldhave is fully committed to this development and opened digital versions of all of its shopping centres in the Netherlands at the start of 2012. This is not limited to the launch of new websites for the shopping centres. Wereldhave was the first owner of retail properties to create Facebook pages, Twitter accounts, Foursquare check-ins and Snipper social video channels for all tenants as well in those shopping centres. These were linked to the websites of the shopping centres and to retailers’ individual websites.
Optimising the synergetic use of offline, online and social media opportunities enables all retailers – from independent businesses to establishments of nationwide chains – to strengthen their presence and cooperate more easily with each other. The opportunities range from joint campaigns by several shops to an individual retailer who sends a unique offer to a consumer’s smartphone as soon as he or she is near the shop.
This approach integrates physical visits to a shopping centre and virtual visits via online media. The shopping centres have become interactive online and offline communities with a total of 700 spots for checking in, 700 Twitter accounts with daily special offers, Facebook pages, mobile videos and games.
Cooperating via intranet
As an extra incentive for cooperation between retailers, Wereldhave is also making an intranet available for each shopping centre via the websites and thereby strengthening ties between retailers.
In addition to options for photo and document sharing, the intranet features a calendar with all important dates for events and meetings in the shopping centre. And retailers’ associations and employees of Wereldhave can use intranet messaging to update retailers on significant developments.
Adding value with social media
All retailers can manage their accounts for social media such as Twitter and Facebook via the intranet of their shopping centre and use them for messaging. A new development is social video, the sharing of short, self-recorded videos, directly between mobile phones. Wereldhave uses Snipper for this purpose, a service for sharing videos of up to one minute. As with Twitter, retailers can use the hashtag #aanbieding to inform customers of special offers, but through the medium of video.
Using social media allows retailers to increase their revenue and add value. People prefer to buy their products from people rather than businesses. Social media give entrepreneurs a chance to show their face and share knowledge and expertise with each other and their customers.
Roll-out to other countries
With its initiatives in the field of social media, Wereldhave is pursuing a new way of optimising shopping centre management. This is aimed at higher footfalls, higher revenue for retailers and higher rental income. The online shopping centres were launched in 2012 in the Netherlands, and the experience in that country will provide a basis for the implementation of best practices at an international level in the future.
“ Online shopping creates opportunities that can lead to higher revenue for retailers”
25

BERTUS BOS
“ Social media are now as much part of my work as filleting a fish”
Wereldhave & Social media26

Bertus Bos of De Spakenburgse Visspecialist in the Winkelhof shopping centre in Leiderdorp has been an active user of social media for several
years and is highly enthusiastic about the possibilities they offer. “It’s an extra channel for reaching out to your customers. And it really makes a big difference. You see those same customers coming to your shop.”
Bertus Bos is currently active on Twitter, Facebook and LinkedIn. “Social media are now as much part of my work as filleting a fish. Placing a message on Twitter or a photo on Facebook gives me a convenient opportunity to keep in touch with my customers and advertise my products. And not just that, it’s also free, although of course you do have to invest time and energy.”
De Spakenburgse Visspecialist has already acquired a measure of fame with its #visquiz (fish quiz) on Twitter. “Experimenting with social media a few years ago, I thought of the idea for the quiz. Once or twice a week, I ask a difficult question about fish on Twitter. The first to come up with the right answer can come to the shop to collect a prize, for instance a small batter-fried fish.
Usually they will also buy something else while they’re there, so I basically always recover my costs.”
Bertus Bos firmly believes that retailers should not just focus on social media to increase their revenue. “You really have to think like an entrepreneur and be open to new things. Which means not just singing the praises of your own products but also of those of other shops in the shopping centre. And not just sending out messages on products, but also messages about your thoughts and views and concerns, for instance. This is important in contacts with your customers.”
He is pleased with the new shopping centre app that Wereldhave introduced recently. It enables visitors of the Winkelhof shopping centre to be alerted to special offers and to receive information on products. “This is truly innovative. It gives businesses a chance to cooperate and that will benefit all of them.”
“ As an entrepreneur you must be open to new developments”
App for shopping centres
In 2012 Wereldhave launched the first of a total of seven
mobile shopping centre applications (apps) for its shopping
centres. The Winkelhof shopping centre in Leiderdorp was the
first to deploy it. The app enables customers to be informed
of new special offers and to leaf through folders. But it also
makes it possible for them to obtain more information on
products in the shops themselves. This is done by means
of an augmented reality service, which appears when the
smartphone is pointed at a product.
All Wereldhave shopping centres in the Netherlands
will be equipped with their own app in 2013.
Wereldhave en social media
All retailers have their own account on Twitter where they can post messages about special offers. These accounts are integrated with the shopping centre websites.
All shopping centres have their own website as well as their own Facebook page. These pages are kept up to date centrally.
27
Wereldhave annual review 2012
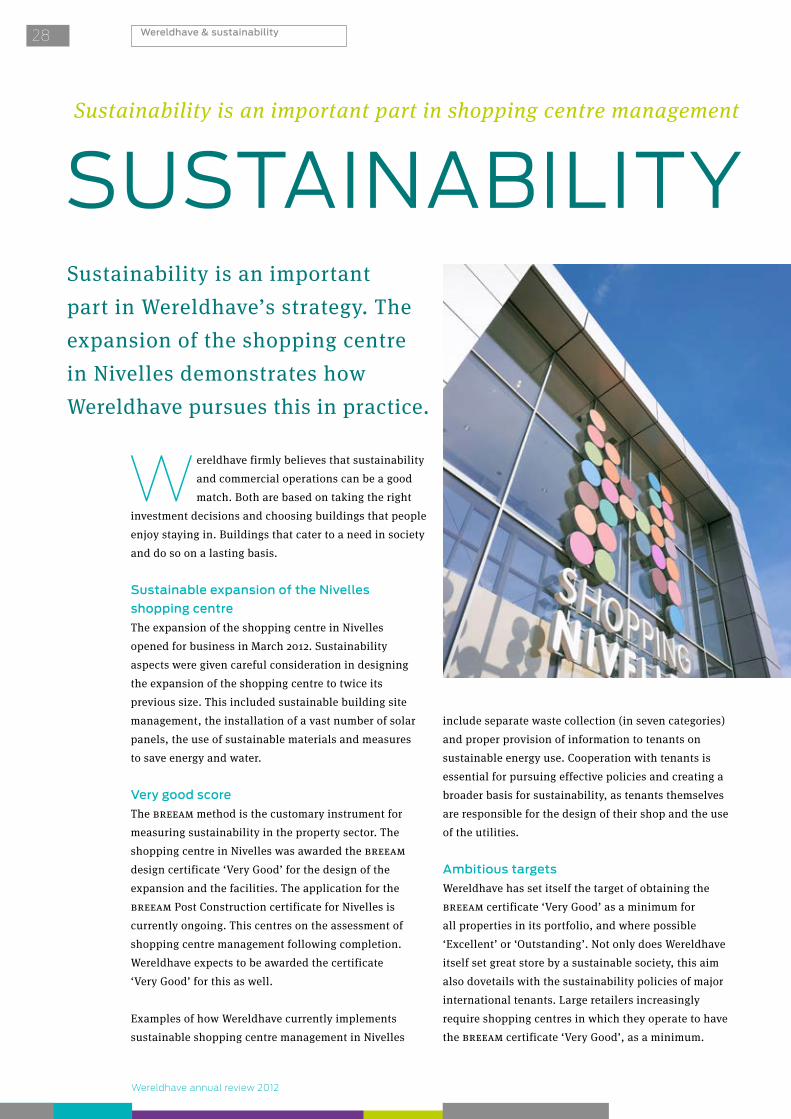
Sustainability is an important part in Wereldhave’s strategy. The expansion of the shopping centre in Nivelles demonstrates how Wereldhave pursues this in practice.
Wereldhave firmly believes that sustainability and commercial operations can be a good match. Both are based on taking the right
investment decisions and choosing buildings that people enjoy staying in. Buildings that cater to a need in society and do so on a lasting basis.
Sustainable expansion of the Nivelles
shopping centre
The expansion of the shopping centre in Nivelles opened for business in March 2012. Sustainability aspects were given careful consideration in designing the expansion of the shopping centre to twice its previous size. This included sustainable building site management, the installation of a vast number of solar panels, the use of sustainable materials and measures to save energy and water.
Very good score
The breeam method is the customary instrument for measuring sustainability in the property sector. The shopping centre in Nivelles was awarded the breeam design certificate ‘Very Good’ for the design of the expansion and the facilities. The application for the breeam Post Construction certificate for Nivelles is currently ongoing. This centres on the assessment of shopping centre management following completion. Wereldhave expects to be awarded the certificate ‘Very Good’ for this as well.
Examples of how Wereldhave currently implements sustainable shopping centre management in Nivelles
include separate waste collection (in seven categories) and proper provision of information to tenants on sustainable energy use. Cooperation with tenants is essential for pursuing effective policies and creating a broader basis for sustainability, as tenants themselves are responsible for the design of their shop and the use of the utilities.
Ambitious targets
Wereldhave has set itself the target of obtaining the breeam certificate ‘Very Good’ as a minimum for all properties in its portfolio, and where possible ‘Excellent’ or ‘Outstanding’. Not only does Wereldhave itself set great store by a sustainable society, this aim also dovetails with the sustainability policies of major international tenants. Large retailers increasingly require shopping centres in which they operate to have the breeam certificate ‘Very Good’, as a minimum.
SUSTAINABILITYSustainability is an important part in shopping centre management
Wereldhave & sustainability28

SHOPPING AWARD 2012Shopping Centre Nivelles received the Shopping
Award 2012 of the Belgian-Luxembourg Council
for Shopping Centres. Besides the general prize,
Nivelles also won the prize in the category of
sustainability.
The shopping centre received the awards for the
balance between architecture, integration of old
and new and sustainability. “Nivelles provides a
total experience, a modern and inviting place for
its customers,” according to the jury report.
WINNERSHOPPING
AWARDS
SUSTAINABILITY
AWARD 2012
WINNERSHOPPING
AWARDS
“Sustainability is a real challenge for shopping centres because
the buildings use huge amounts of energy for lighting, heating
and cooling. Accordingly, the potential improvements that can
be achieved by sustainable building are enormous. Wereldhave
recognises those opportunities and stated from the outset
that it wanted to integrate sustainability in the design of the
expansion of the shopping centre in Nivelles. With the aim of
obtaining the BREEAM certificate ‘Very Good‘.”
“Sustainability is a recurrent theme that appears in many
aspects of our design for the expansion. This includes our de-
cision to use sustainable, re-usable building materials, and the
optimisation of the building’s insulation. Power is generated
using several thousands of square metres of solar panels on
the roof and the white membrane used for roofing prevents
overheating of the building and improves the effectiveness of
the solar panels. Four rainwater tanks of 20,000 litres each
provide water for the sanitation facilities.”
“A charging point for electric cars has been installed in the car
park. And at each entrance, visitors can see how much power is
generated by the solar panels. These are just some of the ways
in which we have embodied the sustainability of the shopping
centre for everyone to see.”
Cédric van Haeren, architect of the expansion of the Nivelles shopping centre
“ SUSTAINABLE BUILDING OFFERS ENORMOUS OPPORTUNITIES”
SUSTAINABILITY IS MEASURABLEBREEAM is an assessment method
to determine the sustainability
performance of real estate. It sets a
standard for sustainable buildings and
then indicates the level of performance
of the examined building, aiming to
analyze and improve the sustainability
of real estate.
29
Wereldhave annual review 2012
Shopping centre development
SHOPPING CENTRE
DEVELOPMENT / ITIS
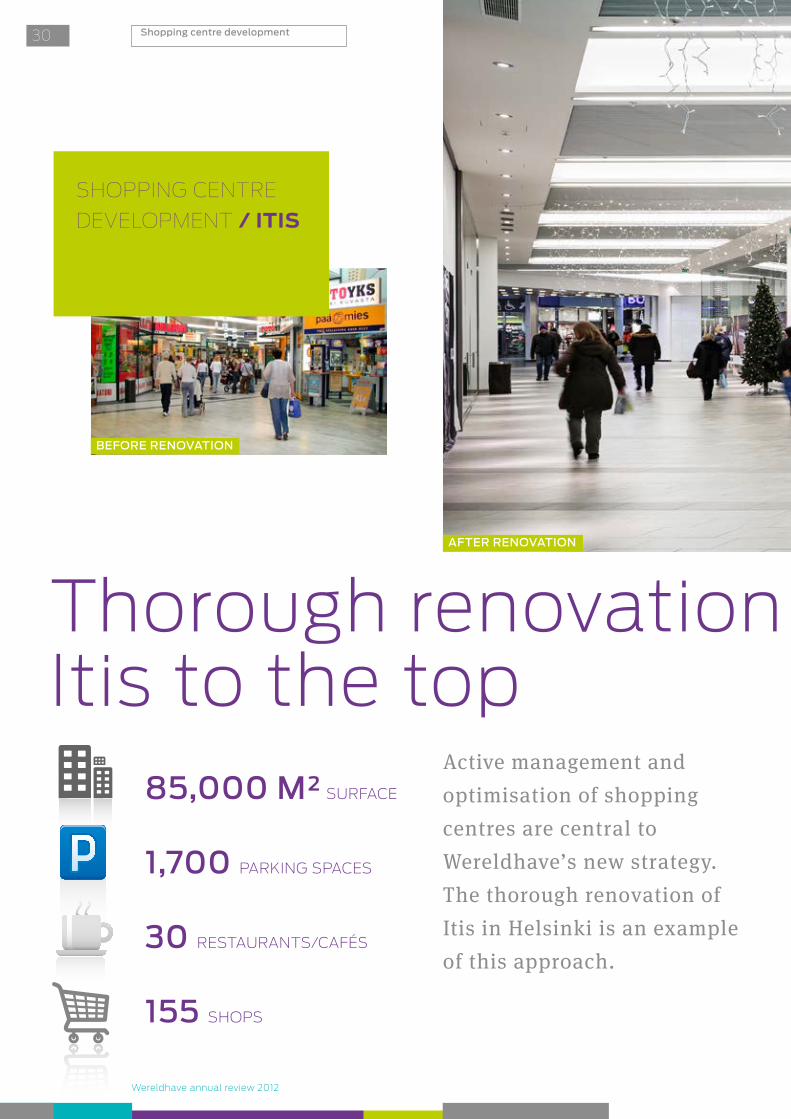
Active management and optimisation of shopping centres are central to Wereldhave’s new strategy. The thorough renovation of Itis in Helsinki is an example of this approach.
Thorough renovation returns Itis to the top
85,000 M² SURFACE
1,700 PARKING SPACES
30 RESTAURANTS/CAFÉS
155 SHOPS
BEFORE RENOVATION
AFTER RENOVATION
30

Thorough renovation returns Itis to the top
With 85,000 square metres of net lettable floor space, Itis is not only the largest shopping centre in Wereldhave’s portfolio
but also in the northern European countries. Itis is located in the south-east of Helsinki, on the motorway and an interchange of metro lines and bus routes. In addition to 220 shops it accommodates three supermarkets.The catchment area comprises 250,000 inhabitants, and their number is growing by some 10,000 annually as the city continues to grow. Expansion in various locations will increase the lettable floor space by 11,500 m2 by mid-2014.
Renewed vigour
Wereldhave has owned Itis since 2002. The shopping centre was performing well, tenants paid their rent on time and vacancy levels were very low. Wereldhave
“A light and warm environment that makes for a more pleasant stay.
That is the guiding motto for the renovation of Itis. The idea is to
give the shopping centre a welcoming atmosphere that makes it a
more pleasant spot in which to spend your time, especially when it’s
dark outside.”
“To give the design a contemporaneous feel the floors are in lighter
colours, and dark and sombre wall fabrics are being replaced by
attractive bright colours. Ample use was made of wood, to create a
more welcoming, warm environment. New lighting contributes to a
new feeling of intimacy. Kiosks have been placed in the 20-metre
wide Bulevardi of the shopping centre that enhance its appeal. A
larger number of cafés and restaurants and more seating areas offer
visitors more opportunities to pause for quick coffee or a snack or meal.”
“The arrival of Stockmann makes the Piazza more glamorous. The
former site of the department store in the Bulevardi will make way
for various new international retailers. The 80-metre front will
become more varied – and more attractive – as a result. International
brands have been sought to increase the quality of the range of
shops. Same-sector shops will be clustered and the number of units
will be reduced from 220 to approx. 185. New Yorker will open its first
shop in Finland in March 2013, in Itis.”
“Retailers and visitors have welcomed the changes. The number of
visitors is high, despite the ongoing construction work. The initial
results are proving that the new approach is working.”
Norbert van Gisbergen, manager building & construction at Wereldhave “ LIGHTER, WARMER
AND MORE COFFEE”
31

Wereldhave annual review 2012
nonetheless decided in 2011 to renovate and reconfigure Itis. The shopping centre was ageing, there was a need for more high-end shops and the number of visitors was slightly edging down due to competition from shopping centres nearby. In sum, there was a clear need for renewed vigour.
The shopping centre consists of three parts: the first is the Pasaasi (1984); the central, largest part is the Bulevardi (1994) and the third is the most recently developed phase, the Piazza (2001). The first stage of the plan was to reconfigure and renovate the passage from the Pasaasi to the Bulevardi. Ageing shops were replaced by a wide range of new, attractive fashion shops that attract more young, well-off customers and families. Part of the underground car park and the associated entrances were also renovated at the same time.
The most challenging part of the project is the re -development of the Piazza. This high building consists of two floors for retailing and five floors for parking and accommodated around 25 shops before the renovation. To increase the shopping centre’s attractiveness these shops will be replaced by a single large shop, the Stockmann department store, which is currently located in the middle of the centre. The relocation of Stockmann will make the Piazza more attractive and also increase net lettable floor space by around 5,000 m2 by extending the shopping experience across three floors.
Ambitious targets
The reconfiguration and renovation of Itis perfectly match Wereldhave’s strategy of creating value through active shopping centre management. The investment of € 95 million is aimed at achieving a return of 7%.
Stockmann will open its doors at its new location in the Piazza in the first week of November 2013 and the entire project is expected to be completed in the summer of 2014. Itis should then once more attract more than 18 million visitors annually, as it normally did only a few years ago.
Shopping centre development
“ Aging shops were replaced by attractive fashion shops”
32

FINANCIALS 2012
Wereldhave annual review 2012
Financials 201234
Direct result
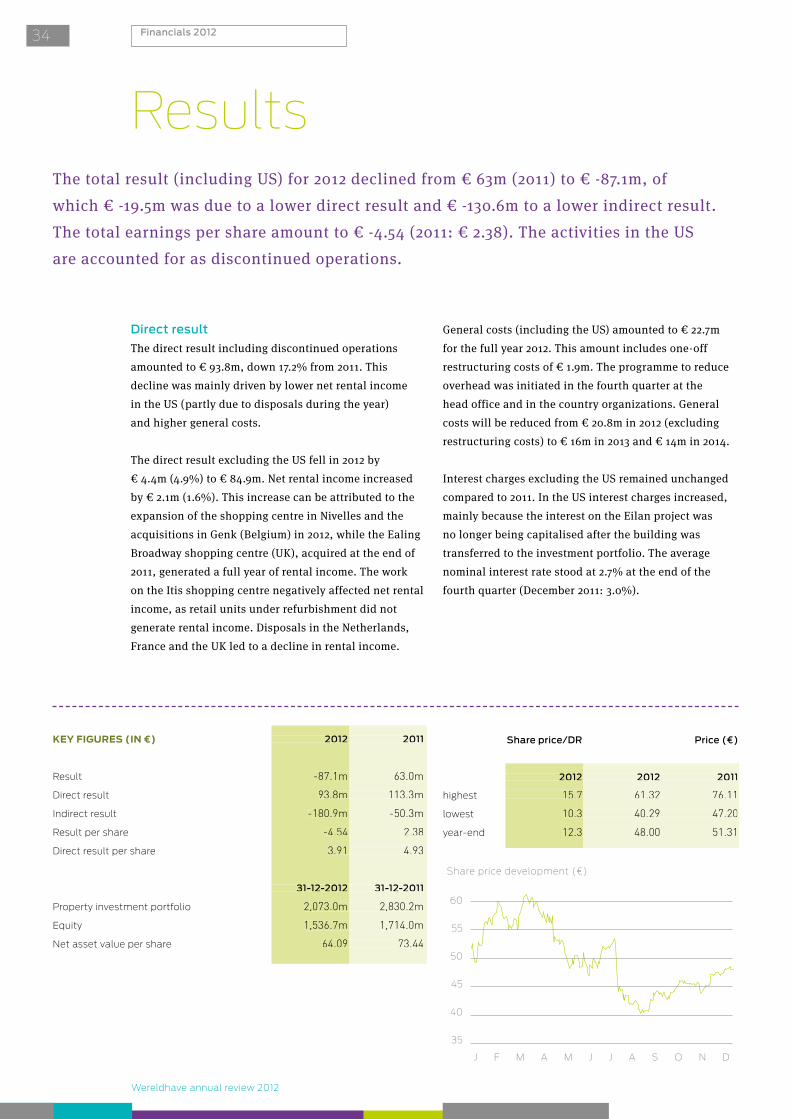
The direct result including discontinued operations amounted to € 93.8m, down 17.2% from 2011. This decline was mainly driven by lower net rental income in the US (partly due to disposals during the year) and higher general costs.
The direct result excluding the US fell in 2012 by € 4.4m (4.9%) to € 84.9m. Net rental income increased by € 2.1m (1.6%). This increase can be attributed to the expansion of the shopping centre in Nivelles and the acquisitions in Genk (Belgium) in 2012, while the Ealing Broadway shopping centre (UK), acquired at the end of 2011, generated a full year of rental income. The work on the Itis shopping centre negatively affected net rental income, as retail units under refurbishment did not generate rental income. Disposals in the Netherlands, France and the UK led to a decline in rental income.
General costs (including the US) amounted to € 22.7m for the full year 2012. This amount includes one-off restructuring costs of € 1.9m. The programme to reduce overhead was initiated in the fourth quarter at the head office and in the country organizations. General costs will be reduced from € 20.8m in 2012 (excluding restructuring costs) to € 16m in 2013 and € 14m in 2014.
Interest charges excluding the US remained unchanged compared to 2011. In the US interest charges increased, mainly because the interest on the Eilan project was no longer being capitalised after the building was transferred to the investment portfolio. The average nominal interest rate stood at 2.7% at the end of the fourth quarter (December 2011: 3.0%).
The total result (including US) for 2012 declined from € 63m (2011) to € -87.1m, of which € -19.5m was due to a lower direct result and € -130.6m to a lower indirect result. The total earnings per share amount to € -4.54 (2011: € 2.38). The activities in the US are accounted for as discontinued operations.
Results
Wereldhave annual report 2012
6.3 RESULTS
Result
The total result (including US) for 2012 declined from € 63m (2011) to € -87.1m, of which € -19.5m was due to a lower direct result and € -130.6m to a lower indirect result. The total earnings per share amount to € -4.54 (2011: € 2.38). The activities in the US are accounted for as discontinued operations.
Direct result
The direct result including discontinued operations amounted to € 93.8m, down 17.2% from 2011. This decline was mainly driven by lower net rental income in the US (partly due to disposals during the year) and higher general costs.
The direct result excluding the US fell in 2012 by € 4.4m (4.9%) to € 84.9m. Net rental income increased by € 2.1m (1.6%). This increase can be attributed to the expansion of the shopping centre in Nivelles and the acquisitions in Genk (Belgium) in 2012, while the Ealing Broadway shopping centre (UK), acquired at the end of 2011, generated a full year of rental income. The work on the Itis shopping centre negatively affected net rental income, as retail units under refurbishment did not generate rental income. Disposals in the Netherlands, France and the UK led to a decline in rental income.
General costs (including the US) amounted to € 22.7m for the full year 2012. This amount includes one-off restructuring costs of € 1.9m. The programme to reduce overhead was initiated in the fourth quarter at the head office and in the country organizations. General costs
will be reduced from € 20.8m in 2012 (excluding restructuring costs) to € 16m in 2013 and € 14m in 2014.Interest charges excluding the US remained unchanged compared to 2011. In the US interest charges increased, mainly because the interest on the Eilan project was no longer being capitalised after the building was transferred to the investment portfolio. The average nominal interest rate stood at 2.7% at the end of the fourth quarter (December 2011: 3.0%).
Indirect result
The indirect result including the US remained stable in the fourth quarter. For full year 2012, indirect result came out at € -180.9m. The indirect result for 2011 amounted to € -50.3m. Write-downs at mid 2012, on the UK shopping centres and the US portfolio, negatively impacted the indirect result. The costs of the US exit are included in the 2012 results. The cost of closing the UK office is estimated at £ 1.5m with a payback period of less than one year.
In the fourth quarter, negative revaluations were incurred in the Netherlands and Spain. The Dutch shopping centres were written down by € 15.9m as a result of the economic headwind for retailers and the increased supply of retail space. Furthermore, the two office and two logistic properties in the Netherlands were impaired by € 12m to € 44m. This negative revaluation reflects the virtual standstill in the investment market for offices and commercial property in the Netherlands. The negative revaluation in Spain is attributable to the slow progress in letting of the Planetocio shopping centre and logistics business complex Rivas (re-valued by € -19m to € 36m).
KEY FIGURES (IN €) 2012 2011
Result -87.1m 63.0m
Direct result 93.8m 113.3m
Indirect result -180.9m -50.3m
Result per share -4.54 2.38
Direct result per share 3.91 4.93
31-12-2012 31-12-2011
Property investment portfolio 2,073.0m 2,830.2m
Equity 1,536.7m 1,714.0m
Net asset value per share 64.09 73.44
2012 2011
-87.1m 63.0m
93.8m 113.3m
-180.9m -50.3m
-4.54 2.38
3.91 4.93
31-12-2012 31-12-2011
2,073.0m 2,830.2m
1,536.7m 1,714.0m
64.09 73.44
2012 2011
-87.1m 63.0m
93.8m 113.3m
-180.9m -50.3m
-4.54 2.38
3.91 4.93
31-12-2012 31-12-2011
2,073.0m 2,830.2m
1,536.7m 1,714.0m
64.09 73.44
2013 2014 2015 2016 2017 2018 2019 2020 >202120212012
100
80
60
40
20
0
Share price 2008-2012 (€)
J F M A M J J A S O N D
65
60
55
50
45
40
35
Share price development (€)
20092008 20112010 2012
Net asset value and share price at December 31 (€)
Distribution of investment properties
by sector at year-end 2012
Net Asset Value Share price
100
80
60
40
20
Lease expiries (as a % of contracted rent at December 31, 2012)
Retail O�ces Other
25
20
15
10
5
20092008 20112010 2012
29%
38%
18%
9%
3%
Total€1.3bn
Retail
O�ces
Other
79%
84
63
74
67
75 73 73
51
64
48
18%
3%
24
213.0167_11Annual Report 2012 108P kopie.indd 24 11-03-13 12:16
The negative revaluations in the Netherlands and Spain were offset by a positive revaluation on the Joinville Office development project in France and the positive result on disposal in the US. Excluding the US portfolio, the cap rate of the portfolio was 6.51% at year-end 2012.
In 2012, a total of ten properties and two plots of land were sold for a total sum of € 332.3m. The result on disposal amounted to € 7.9m, 2.4% above book value.
Lower taxes on capital gains due to negative revaluations and the release of a provision for deferred taxes had a positive impact of € 26.1m on the indirect result.
6.4 EQUITY
Share price/DR Price (€)
2012 2012 2011
highest 15.7 61.32 76.11
lowest 10.3 40.29 47.20
year-end 12.3 48.00 51.31
31-12-2012 Covenant
LTV 44% ≤60%
Solvency ratio 54% ≥40%
ICR 4.6x ≥2x
Secured 4.6% ≤40%
Ambitions
• Optimise debt profile in H1 2013
• Maintain and further exploit diversified
funding base
• LTV 30-40% on the medium term
2012 2012 2011
15.7 61.32 76.11
10.3 40.29 47.20
12.3 48.00 51.31
31-12-2012 Covenant
LTV 44% ≤60%
Solvency ratio 54% ≥40%
ICR 4.6x ≥2x
Secured 4.6% ≤40%
2012 2012 2011
15.7 61.32 76.11
10.3 40.29 47.20
12.3 48.00 51.31
31-12-2012 Covenant
LTV 44% ≤60%
Solvency ratio 54% ≥40%
ICR 4.6x ≥2x
Secured 4.6% ≤40%
31-12-2012 Covenant
LTV 44% ≤60%
Solvency ratio 54% ≥40%
ICR 4.6x ≥2x
Secured 4.6% ≤40%
31-12-2012 Covenant
LTV 44% ≤60%
Solvency ratio 54% ≥40%
ICR 4.6x ≥2x
Secured 4.6% ≤40%
DEBt pRoFILE
At year-end 2012, equity including minority interests amounted to
€ 1,537m (31 December 2011: € 1,714m). The decrease of € 177m
is the result of the dividend payment (€ 102m), the direct result
(€ 85m), a negative indirect result (€ -183m), provisions in the
amount of € -2m and an increase of the minority interest by
€ 25m. This increase is the result of the acquisition of the
shopping centre in Genk, Belgium, in April 2012 in exchange for
new shares by Wereldhave Belgium.
Revolving credit facilities
USPP
Convertible bond
Convertible bond
Debenture
Net asset value per share including accrued earnings as at 31 December 2012 amounted to € 64.09 (31 December 2011: € 73.44). As at 31 December 2012, the LTV amounted to 44% (31 December 2011: 41%). The number of ordinary shares in issue remained unchanged at 21,679,608.
Share ownership is spread among institutional and private investors, both in the Netherlands and abroad. As at December 31, 2012, Wereldhave had no shareholders with an interest of more than 5%. The free float of the ordinary shares is 100%.
Debt
Interest bearing debt as at year-end amounted to € 1,288.8m, 51% of which at variable interest rates. The average nominal interest rate at year-end stood at 2.7%.
Wereldhave has a balanced and well spread debt port fo lio, consisting of multiple funding sources, such as loan agreements with banks, the US Private Placement (senior unsecured notes) of $ 300m, a € 230m convertible bond 2009-2014 with a conversion price
2013 2014 2015 2016 2017 2018 2019 2020 >202120212012
100
80
60
40
20
0
Share price 2008-2012 (€)
J F M A M J J A S O N D
65
60
55
50
45
40
35
Share price development (€)
20092008 20112010 2012
Net asset value and share price at December 31 (€)
Distribution of investment properties
by sector at year-end 2012
Net Asset Value Share price
100
80
60
40
20
Lease expiries (as a % of contracted rent at December 31, 2012)
Retail O�ces Other
25
20
15
10
5
20092008 20112010 2012
29%
38%
18%
9%
3%
Total€1.3bn
Retail
O�ces
Other
79%
84
63
74
67
75 73 73
51
64
48
18%
3%
25
213.0167_11Annual Report 2012 108P kopie.indd 25 11-03-13 12:16
Wereldhave annual report 2012
6.3 RESULTS
Result
The total result (including US) for 2012 declined from € 63m (2011) to € -87.1m, of which € -19.5m was due to a lower direct result and € -130.6m to a lower indirect result. The total earnings per share amount to € -4.54 (2011: € 2.38). The activities in the US are accounted for as discontinued operations.
Direct result
The direct result including discontinued operations amounted to € 93.8m, down 17.2% from 2011. This decline was mainly driven by lower net rental income in the US (partly due to disposals during the year) and higher general costs.
The direct result excluding the US fell in 2012 by € 4.4m (4.9%) to € 84.9m. Net rental income increased by € 2.1m (1.6%). This increase can be attributed to the expansion of the shopping centre in Nivelles and the acquisitions in Genk (Belgium) in 2012, while the Ealing Broadway shopping centre (UK), acquired at the end of 2011, generated a full year of rental income. The work on the Itis shopping centre negatively affected net rental income, as retail units under refurbishment did not generate rental income. Disposals in the Netherlands, France and the UK led to a decline in rental income.
General costs (including the US) amounted to € 22.7m for the full year 2012. This amount includes one-off restructuring costs of € 1.9m. The programme to reduce overhead was initiated in the fourth quarter at the head office and in the country organizations. General costs
will be reduced from € 20.8m in 2012 (excluding restructuring costs) to € 16m in 2013 and € 14m in 2014.Interest charges excluding the US remained unchanged compared to 2011. In the US interest charges increased, mainly because the interest on the Eilan project was no longer being capitalised after the building was transferred to the investment portfolio. The average nominal interest rate stood at 2.7% at the end of the fourth quarter (December 2011: 3.0%).
Indirect result
The indirect result including the US remained stable in the fourth quarter. For full year 2012, indirect result came out at € -180.9m. The indirect result for 2011 amounted to € -50.3m. Write-downs at mid 2012, on the UK shopping centres and the US portfolio, negatively impacted the indirect result. The costs of the US exit are included in the 2012 results. The cost of closing the UK office is estimated at £ 1.5m with a payback period of less than one year.
In the fourth quarter, negative revaluations were incurred in the Netherlands and Spain. The Dutch shopping centres were written down by € 15.9m as a result of the economic headwind for retailers and the increased supply of retail space. Furthermore, the two office and two logistic properties in the Netherlands were impaired by € 12m to € 44m. This negative revaluation reflects the virtual standstill in the investment market for offices and commercial property in the Netherlands. The negative revaluation in Spain is attributable to the slow progress in letting of the Planetocio shopping centre and logistics business complex Rivas (re-valued by € -19m to € 36m).
KEY FIGURES (IN €) 2012 2011
Result -87.1m 63.0m
Direct result 93.8m 113.3m
Indirect result -180.9m -50.3m
Result per share -4.54 2.38
Direct result per share 3.91 4.93
31-12-2012 31-12-2011
Property investment portfolio 2,073.0m 2,830.2m
Equity 1,536.7m 1,714.0m
Net asset value per share 64.09 73.44
2012 2011
-87.1m 63.0m
93.8m 113.3m
-180.9m -50.3m
-4.54 2.38
3.91 4.93
31-12-2012 31-12-2011
2,073.0m 2,830.2m
1,536.7m 1,714.0m
64.09 73.44
2012 2011
-87.1m 63.0m
93.8m 113.3m
-180.9m -50.3m
-4.54 2.38
3.91 4.93
31-12-2012 31-12-2011
2,073.0m 2,830.2m
1,536.7m 1,714.0m
64.09 73.44
2013 2014 2015 2016 2017 2018 2019 2020 >202120212012
100
80
60
40
20
0
Share price 2008-2012 (€)
J F M A M J J A S O N D
65
60
55
50
45
40
35
Share price development (€)
20092008 20112010 2012
Net asset value and share price at December 31 (€)
Distribution of investment properties
by sector at year-end 2012
Net Asset Value Share price
100
80
60
40
20
Lease expiries (as a % of contracted rent at December 31, 2012)
Retail O�ces Other
25
20
15
10
5
20092008 20112010 2012
29%
38%
18%
9%
3%
Total€1.3bn
Retail
O�ces
Other
79%
84
63
74
67
75 73 73
51
64
48
18%
3%
24
213.0167_11Annual Report 2012 108P kopie.indd 24 11-03-13 12:16

35
Net asset value per share including accrued earnings as at 31 December 2012 amounted to € 64.09 (31 December 2011: € 73.44). As at 31 December 2012, the LTV amounted to 44% (31 December 2011: 41%). The number of ordinary shares in issue remained unchanged at 21,679,608.
Share ownership is spread among institutional and private investors, both in the Netherlands and abroad. As at December 31, 2012, Wereldhave had no share-holders with an interest of more than 5%. The free float of the ordinary shares is 100%.
Debt
Interest bearing debt as at year-end amounted to € 1,288.8m, 51% of which at variable interest rates. The average nominal interest rate at year-end stood at 2.7%.
Wereldhave has a balanced and well spread debt portfolio, consisting of multiple funding sources, such as loan agreements with banks, the US Private Placement (senior unsecured notes) of $ 300m, a € 230m convertible bond 2009-2014 with a conversion price of € 72.18 and finally a € 230m
At year-end 2012, equity including minority interests amounted to € 1,537m (31 December 2011: € 1,714m). The decrease of € 177m is the result of the dividend payment (€ 102m), the direct result (€ 85m), a negative indirect result (€ -183m), provisions in the amount of € -2m and an increase of the minority interest by € 25m. This increase is the result of the acquisition of the shopping centre in Genk, Belgium, in April 2012 in exchange for new shares by Wereldhave Belgium.
EquityThe negative revaluations in the Netherlands and Spain were offset by a positive revaluation on the Joinville Office development project in France and the positive result on disposal in the US. Excluding the US portfolio, the cap rate of the portfolio was 6.51% at year-end 2012.
In 2012, a total of ten properties and two plots of land were sold for a total sum of € 332.3m. The result on disposal amounted to € 7.9m, 2.4% above book value.
Lower taxes on capital gains due to negative revaluations and the release of a provision for deferred taxes had a positive impact of € 26.1m on the indirect result.
6.4 EQUITY
Share price/DR Price (€)
2012 2012 2011
highest 15.7 61.32 76.11
lowest 10.3 40.29 47.20
year-end 12.3 48.00 51.31
31-12-2012 Covenant
LTV 44% ≤60%
Solvency ratio 54% ≥40%
ICR 4.6x ≥2x
Secured 4.6% ≤40%
Ambitions
• Optimise debt profile in H1 2013
• Maintain and further exploit diversified
funding base
• LTV 30-40% on the medium term
2012 2012 2011
15.7 61.32 76.11
10.3 40.29 47.20
12.3 48.00 51.31
31-12-2012 Covenant
LTV 44% ≤60%
Solvency ratio 54% ≥40%
ICR 4.6x ≥2x
Secured 4.6% ≤40%
2012 2012 2011
15.7 61.32 76.11
10.3 40.29 47.20
12.3 48.00 51.31
31-12-2012 Covenant
LTV 44% ≤60%
Solvency ratio 54% ≥40%
ICR 4.6x ≥2x
Secured 4.6% ≤40%
31-12-2012 Covenant
LTV 44% ≤60%
Solvency ratio 54% ≥40%
ICR 4.6x ≥2x
Secured 4.6% ≤40%
31-12-2012 Covenant
LTV 44% ≤60%
Solvency ratio 54% ≥40%
ICR 4.6x ≥2x
Secured 4.6% ≤40%
DEBt pRoFILE
At year-end 2012, equity including minority interests amounted to
€ 1,537m (31 December 2011: € 1,714m). The decrease of € 177m
is the result of the dividend payment (€ 102m), the direct result
(€ 85m), a negative indirect result (€ -183m), provisions in the
amount of € -2m and an increase of the minority interest by
€ 25m. This increase is the result of the acquisition of the
shopping centre in Genk, Belgium, in April 2012 in exchange for
new shares by Wereldhave Belgium.
Revolving credit facilities
USPP
Convertible bond
Convertible bond
Debenture
Net asset value per share including accrued earnings as at 31 December 2012 amounted to € 64.09 (31 December 2011: € 73.44). As at 31 December 2012, the LTV amounted to 44% (31 December 2011: 41%). The number of ordinary shares in issue remained unchanged at 21,679,608.
Share ownership is spread among institutional and private investors, both in the Netherlands and abroad. As at December 31, 2012, Wereldhave had no shareholders with an interest of more than 5%. The free float of the ordinary shares is 100%.
Debt
Interest bearing debt as at year-end amounted to € 1,288.8m, 51% of which at variable interest rates. The average nominal interest rate at year-end stood at 2.7%.
Wereldhave has a balanced and well spread debt port fo lio, consisting of multiple funding sources, such as loan agreements with banks, the US Private Placement (senior unsecured notes) of $ 300m, a € 230m convertible bond 2009-2014 with a conversion price
2013 2014 2015 2016 2017 2018 2019 2020 >202120212012
100
80
60
40
20
0
Share price 2008-2012 (€)
J F M A M J J A S O N D
65
60
55
50
45
40
35
Share price development (€)
20092008 20112010 2012
Net asset value and share price at December 31 (€)
Distribution of investment properties
by sector at year-end 2012
Net Asset Value Share price
100
80
60
40
20
Lease expiries (as a % of contracted rent at December 31, 2012)
Retail O�ces Other
25
20
15
10
5
20092008 20112010 2012
29%
38%
18%
9%
3%
Total€1.3bn
Retail
O�ces
Other
79%
84
63
74
67
75 73 73
51
64
48
18%
3%
25
213.0167_11Annual Report 2012 108P kopie.indd 25 11-03-13 12:16
The negative revaluations in the Netherlands and Spain were offset by a positive revaluation on the Joinville Office development project in France and the positive result on disposal in the US. Excluding the US portfolio, the cap rate of the portfolio was 6.51% at year-end 2012.
In 2012, a total of ten properties and two plots of land were sold for a total sum of € 332.3m. The result on disposal amounted to € 7.9m, 2.4% above book value.
Lower taxes on capital gains due to negative revaluations and the release of a provision for deferred taxes had a positive impact of € 26.1m on the indirect result.
6.4 EQUITY
Share price/DR Price (€)
2012 2012 2011
highest 15.7 61.32 76.11
lowest 10.3 40.29 47.20
year-end 12.3 48.00 51.31
31-12-2012 Covenant
LTV 44% ≤60%
Solvency ratio 54% ≥40%
ICR 4.6x ≥2x
Secured 4.6% ≤40%
Ambitions
• Optimise debt profile in H1 2013
• Maintain and further exploit diversified
funding base
• LTV 30-40% on the medium term
2012 2012 2011
15.7 61.32 76.11
10.3 40.29 47.20
12.3 48.00 51.31
31-12-2012 Covenant
LTV 44% ≤60%
Solvency ratio 54% ≥40%
ICR 4.6x ≥2x
Secured 4.6% ≤40%
2012 2012 2011
15.7 61.32 76.11
10.3 40.29 47.20
12.3 48.00 51.31
31-12-2012 Covenant
LTV 44% ≤60%
Solvency ratio 54% ≥40%
ICR 4.6x ≥2x
Secured 4.6% ≤40%
31-12-2012 Covenant
LTV 44% ≤60%
Solvency ratio 54% ≥40%
ICR 4.6x ≥2x
Secured 4.6% ≤40%
31-12-2012 Covenant
LTV 44% ≤60%
Solvency ratio 54% ≥40%
ICR 4.6x ≥2x
Secured 4.6% ≤40%
DEBt pRoFILE
At year-end 2012, equity including minority interests amounted to
€ 1,537m (31 December 2011: € 1,714m). The decrease of € 177m
is the result of the dividend payment (€ 102m), the direct result
(€ 85m), a negative indirect result (€ -183m), provisions in the
amount of € -2m and an increase of the minority interest by
€ 25m. This increase is the result of the acquisition of the
shopping centre in Genk, Belgium, in April 2012 in exchange for
new shares by Wereldhave Belgium.
Revolving credit facilities
USPP
Convertible bond
Convertible bond
Debenture
Net asset value per share including accrued earnings as at 31 December 2012 amounted to € 64.09 (31 December 2011: € 73.44). As at 31 December 2012, the LTV amounted to 44% (31 December 2011: 41%). The number of ordinary shares in issue remained unchanged at 21,679,608.
Share ownership is spread among institutional and private investors, both in the Netherlands and abroad. As at December 31, 2012, Wereldhave had no shareholders with an interest of more than 5%. The free float of the ordinary shares is 100%.
Debt
Interest bearing debt as at year-end amounted to € 1,288.8m, 51% of which at variable interest rates. The average nominal interest rate at year-end stood at 2.7%.
Wereldhave has a balanced and well spread debt port fo lio, consisting of multiple funding sources, such as loan agreements with banks, the US Private Placement (senior unsecured notes) of $ 300m, a € 230m convertible bond 2009-2014 with a conversion price
2013 2014 2015 2016 2017 2018 2019 2020 >202120212012
100
80
60
40
20
0
Share price 2008-2012 (€)
J F M A M J J A S O N D
65
60
55
50
45
40
35
Share price development (€)
20092008 20112010 2012
Net asset value and share price at December 31 (€)
Distribution of investment properties
by sector at year-end 2012
Net Asset Value Share price
100
80
60
40
20
Lease expiries (as a % of contracted rent at December 31, 2012)
Retail O�ces Other
25
20
15
10
5
20092008 20112010 2012
29%
38%
18%
9%
3%
Total€1.3bn
Retail
O�ces
Other
79%
84
63
74
67
75 73 73
51
64
48
18%
3%
25
213.0167_11Annual Report 2012 108P kopie.indd 25 11-03-13 12:16

Wereldhave annual review 2012
Financials 201236
convertible bond 2010-2015 with a conversion price of € 81.10. No bonds had been converted into Wereldhave shares as at 31 December 2012.
Wereldhave has a lot of headroom within its financial covenant. The covenants require that the LTV should not exceed 60%. Whilst at 31 December 2012 the LTV stood at 44% and will drop to below 20% after the disposal of the UK and the US portfolios. The covenants also require a solvency ratio of more than 40%. With a solvency ratio of 54% Wereldhave is well above.
Currency
As at year-end 2012 the USD exposure was hedged for 45% (2011: 54%) and the GBP exposure was hedged for 54% (2011: 58%). Forward exchange options and debt in local currency were applied in 2011 to hedge the USD and GBP positions. The net positive effect of exchange rate diffe-rences on equity amounted to € 0.4m (2011: € 13.6m).
These hedge ratios represent the economic currency risk on the value of the property portfolio in the respective currencies. The guideline for hedging exposure in the property portfolio to USD and GBP is a hedge ratio of 50%. Deviations from this targeted level are permitted within a hedging margin of 40% - 70%. Results in USD and GBP, other than through interest expenses in these currencies, are not hedged separately.
Derivatives
Wereldhave employs currency swaps and currency options, and also uses financial instruments to manage its interest expenses. These financial instruments are combined to limit the exchange rate sensitivity of the net asset value per share and the interest rate sensitivity of the earnings per share. The use of financial instruments like interest rate and currency swaps accordingly serves the interest rate and currency policies referred to above. Derivatives will only be used in combination with the underlying loan portfolio.
Wereldhave annual report 2012
of € 72.18 and finally a € 230m convertible bond 2010-2015 with a conversion price of € 81.10. No bonds have been converted into Wereldhave shares as at 31 December 2012. Wereldhave has a lot of headroom within its financial covenant. The covenants require that the LTV should not exceed 60%. Whilst at 31 December 2012 the LTV stood at 44% and will drop to below 20% after the disposal of the UK and the US portfolios. The covenants also require a solvency ratio of more than 40%. With a solvency ratio of 54% Wereldhave is well above. Reference is made to the table of debt profile (page 25).
Currency
As at year-end 2012 the USD exposure was hedged for 45% (2011: 54%) and the GBP exposure was hedged for 54% (2011: 58%). Forward exchange options and debt in local currency were applied in 2011 to hedge the USD and GBP positions. The net positive effect of exchange rate differences on equity amounted to € 0.4m (2011: € 13.6m).
These hedge ratios represent the economic currency risk on the value of the property portfolio in the respective currencies. The guideline for hedging exposure in the property portfolio to USD and GBP is a hedge ratio of 50%. Deviations from this targeted level are permitted within a hedging margin of 40%-70%. Results in USD and GBP, other than through interest expenses in these currencies, are not hedged separately.
Derivatives
Wereldhave employs currency swaps and currency options, and also uses financial instruments to manage its interest expenses. These financial instruments are combined to limit the exchange rate sensitivity of the net asset value per share and the interest rate sensitivity of the earnings per share. The use of financial instruments like interest rate and currency swaps accordingly serves the interest rate and currency policies referred to above. Derivatives will only be used in combination with the underlying loan portfolio.
Maturity spread interest bearing debt (as a %)
2-5 year1-2 year<1 year 5 year
100
80
60
40
20
0
Movement net asset value per ordinary
share ranking for dividend (x € 1) 2012 2011
Net asset value before distribution of profit as at 01/01 73.44 75.12
less: dividend previous year 4.70 4.70
68.74 70.42
Direct result 3.91 4.93
Indirect result -8.45 -2.55
Movements in equity -0.11 0.64
Net asset value before distribution of profit as at 31/12 64.09 73.44
less: proposed dividend: 3.30 4.70
Net asset value after distribution of profit as at 31/12 60.79 68.74
share ranking for dividend (x € 1) 2012 2011
73.44 75.12
4.70 4.70
68.74 70.42
3.91 4.93
-8.45 -2.55
-0.11 0.64
64.09 73.44
3.30 4.70
60.79 68.74
share ranking for dividend (x € 1) 2012 2011
73.44 75.12
4.70 4.70
68.74 70.42
3.91 4.93
-8.45 -2.55
-0.11 0.64
64.09 73.44
3.30 4.70
60.79 68.74
26
213.0167_11Annual Report 2012 108P kopie.indd 26 11-03-13 12:16

37
Property acquisitions were made in Belgium, with Stadsplein and Shopping 1 in Genk, and two smaller acquisitions in the Netherlands, to improve the development opportunities of the Kronenburg shopping centre in Arnhem. Mainly due to the disposal of non core properties, the share of shopping centres in the portfolio rose from 54% to 79%.
As at December 31, 2012, EPRA occupancy stood at 89.2% (2011: 91.4%).
The investment portfolio was re-valued negatively by 6.2%. There were positive revaluations in Belgium, Finland and France for a total of € 36.6m and negative revaluations in the Netherlands, the UK and the USA for a total of € 229.8m. Especially in the UK and the USA the portfolio was impaired, which occurred at the H1 results. At year-end 2012, the value of the development portfolio amounted to € 240m; the value of the investment portfolio stood at € 2,073m.
Composition of the PortfolioDuring 2012 Wereldhave sold investment properties in the Netherlands, Belgium, France, Spain, the United Kingdom and the United States for a net total of € 331.5m.
As at December 31, 2012, EPRA occupancy stood at 89.2% (2011: 91.4%). The investment portfolio was re-valued negatively by 6.2%. There were positive revaluations in Belgium, Finland and France for a total of € 36.6m and negative revaluations in the Netherlands, the UK and the USA for a total of € 229.8m. Especially in the UK and the USA the portfolio was impaired, which occurred at the H1 results. At year-end 2012, the value of the development portfolio amounted to € 240m; the value of the investment portfolio stood at € 2,073m.
During 2012 Wereldhave sold investment properties
in the Netherlands, Belgium, France, Spain, the United
Kingdom and the United States for a net total of
€ 331.5m. Property acquisitions were made in Belgium,
with Stadsplein and Shopping 1 in Genk, and two
smaller acquisitions in the Netherlands, to improve
the development opportunities of the Kronenburg
shopping centre in Arnhem. Mainly due to the disposal
of non core properties, the share of shopping centres
in the portfolio rose from 54% to 79%.
Maturity spread interest bearing debt (as a %)
2-5 year1-2 year<1 year 5 year
100
80
60
40
20
0
Investment portfolio distribution (as a %)
2008 2009 2010 2011 2012
Offices 45 45 41 41 18
Retail 46 46 52 54 79
Other 9 9 7 5 3
Investment portfolio geographical distribution (as a %)
2008 2009 2010 2011 2012
Belgium 14 16 14 14 24
Finland 22 21 18 18 22
France 7 7 6 6 8
Netherlands 15 16 22 21 26
Spain 7 6 5 5 5
UK 8 9 10 11 15
USA 27 25 25 25 -
Net rental income per country (as a %)
2008 2009 2010 2011 2012
Belgium 15.4 16.8 14.7 19.1 24.3
Finland 19.9 20.1 18.4 21.9 18.0
France 7.6 2.1 5.2 9.5 8.0
Netherlands 16.3 18.0 23.8 29.6 26.8
Spain 7.0 6.8 5.4 5.9 5.3
UK 13.3 11.7 10.1 14.0 17.6
USA 20.5 24.5 22.4 - -
Total 100 100 100 100 100
Net sales proceeds of investment properties (x € 1m)
(against year end rates)
2008 2009 2010 2011 2012
Belgium - - - 2.7 11.7
Finland - - - 47.2 -
France - - - - 17.0
Netherlands - - 6.5 62.4 0.7
Spain - - - - 15.4
UK 6.2 2.7 38.3 82.9 80.0
USA - - - 23.8 206.7
Total 6.2 2.7 44.8 219.0 331.5
Net purchases of investment properties (x € 1m)
(against year end rates)
2008 2009 2010 2011 2012
Belgium - 5.6 11.1 - 74.0
Finland - - - - -
France - - - - -
Netherlands - - 265.0 3.9 3.0
Spain - - - - -
UK - - 98.8 199.0 -
USA 117.7 - - - -
Total 117.7 5.6 374.9 202.9 77.0
2008 2009 2010 2011 2012
45 45 41 41 18
46 46 52 54 79
9 9 7 5 3
2008 2009 2010 2011 2012
14 16 14 14 24
22 21 18 18 22
7 7 6 6 8
15 16 22 21 26
7 6 5 5 5
8 9 10 11 15
27 25 25 25 -
2008 2009 2010 2011 2012
- - - 2.7 11.7
- - - 47.2 -
- - - - 17.0
- - 6.5 62.4 0.7
- - - - 15.4
6.2 2.7 38.3 82.9 80.0
- - - 23.8 206.7
6.2 2.7 44.8 219.0 331.5
2008 2009 2010 2011 2012
15.4 16.8 14.7 19.1 24.3
19.9 20.1 18.4 21.9 18.0
7.6 2.1 5.2 9.5 8.0
16.3 18.0 23.8 29.6 26.8
7.0 6.8 5.4 5.9 5.3
13.3 11.7 10.1 14.0 17.6
20.5 24.5 22.4 - -
100 100 100 100 100
2008 2009 2010 2011 2012
- 5.6 11.1 - 74.0
- - - - -
- - - - -
- - 265.0 3.9 3.0
- - - - -
- - 98.8 199.0 -
117.7 - - - -
117.7 5.6 374.9 202.9 77.0
2008 2009 2010 2011 2012
45 45 41 41 18
46 46 52 54 79
9 9 7 5 3
2008 2009 2010 2011 2012
14 16 14 14 24
22 21 18 18 22
7 7 6 6 8
15 16 22 21 26
7 6 5 5 5
8 9 10 11 15
27 25 25 25 -
2008 2009 2010 2011 2012
- - - 2.7 11.7
- - - 47.2 -
- - - - 17.0
- - 6.5 62.4 0.7
- - - - 15.4
6.2 2.7 38.3 82.9 80.0
- - - 23.8 206.7
6.2 2.7 44.8 219.0 331.5
2008 2009 2010 2011 2012
15.4 16.8 14.7 19.1 24.3
19.9 20.1 18.4 21.9 18.0
7.6 2.1 5.2 9.5 8.0
16.3 18.0 23.8 29.6 26.8
7.0 6.8 5.4 5.9 5.3
13.3 11.7 10.1 14.0 17.6
20.5 24.5 22.4 - -
100 100 100 100 100
2008 2009 2010 2011 2012
- 5.6 11.1 - 74.0
- - - - -
- - - - -
- - 265.0 3.9 3.0
- - - - -
- - 98.8 199.0 -
117.7 - - - -
117.7 5.6 374.9 202.9 77.0
6.5 COMPOSITION OF THE PORTFOLIO
27
213.0167_11Annual Report 2012 108P kopie.indd 27 11-03-13 12:16

Wereldhave annual review 2012
Financials 201238
RESULTS BROKEN DOWN INTO DIRECT AND INDIRECT RESULT
Wereldhave annual report 2012
DIRECT AND INDIRECT RESULT FOR 2012
(amounts x € 1,000)
2012 2011
direct result indirect result direct result indirect result
Gross rental income 147,574 143,453
Service costs charged 32,325 30,547
Total revenues 179,899 174,000
Service costs paid -35,788 -33,555
Property expenses -13,300 -11,788
-49,088 -45,343
Net rental income 130,811 128,657
Valuation results -78,559 17,478
Results on disposals 8,941 -672
General costs -21,004 -14,013
Other income and expense 1,578 -3,559 1,770 17
Operational result 111,385 -73,177 116,414 16,823
Interest charges -26,251 -4,054 -26,433 -4,415
Interest income 362 464
Net interest -25,889 -4,054 -25,969 -4,415
Other financial income and expense 1,197 -3,717
Result before tax 85,496 -76,034 90,445 8,691
Taxes on result -550 26,094 -1,151 13,189
Result from continuing operations 84,946 -49,940 89,294 21,880
Result from discontinued operations 8,867 -130,967 24,045 -72,234
Result 93,813 -180,907 113,339 -50,354
Profit attributable to:
Shareholders 84,851 -183,290 106,333 -55,037
Non-controlling interest 8,962 2,383 7,006 4,683
Result 93,813 -180,907 113,339 -50,354
Earnings per share from continuing
operations (x € 1) 3.50 -2.41 3.82 0.79
Earnings per share from discontinued
operations (x € 1) 0.41 -6.04 1.11 -3.34
Earnings per share (x € 1) 3.91 -8.45 4.93 -2.55
Direct and indirect result
Wereldhave presents results as direct and indirect results, enabling a better understanding of results. The direct result consists of net rental income, general costs, other gains and losses (other than exchange rate differences), financial income and expense (other than the interest addition to the real value of the conversion rights of convertible bonds, premiums paid on repurchased interest bearing debt and actuarial gains and losses on employee benefit plans) and tax charges on direct result. The indirect result consists of valuation results, exchange rate differences that are accounted for under other financial income and expense, the real value of the conversion rights on convertible bonds, the movement in deferred tax liabilities and actuarial gains and losses on employee benefit plans. The direct result per share is identical to the EPRA result per share.
7. RESULTS BROKEN DOWN INTO DIRECT AND INDIRECT RESULT 38
213.0167_11Annual Report 2012 108P kopie.indd 38 11-03-13 12:16
(amounts x € 1,000)

39
EPRA TABLES
INVESTMENT PROPERTY - RENTAL DATA
(x € 1,000)
Gross rental Net rental Lettable Annual Estimated EPRA
income income space (m²) contract rent rental value vacancy rate
for the period for the period period end period end period end period end
Belgium 33,407 31,752 171,548 34,234 37,261 6.3%
Finland 24,709 23,565 94,546 23,176 29,047 1.5%
France 10,939 10,501 30,600 11,767 11,372 1.0%
Spain 8,604 6,896 78,816 7,112 8,765 22.3%
Netherlands 40,701 35,002 213,628 41,011 42,386 3.9%
United Kingdom 29,214 23,095 93,660 23,090 25,703 3.1%
Total portfolio 147,574 130,811 682,798 140,390 154,534 4.8%
Including USA the total EPRA vacancy rate amounts to 10.8%.
INVESTMENT PROPERTY - VALUATION DATA
(x € 1,000)
Market value of Valuation movement Change
property (€m) in the year (€m) in %
Belgium 501.0 8.1 1.6%
Finland 458.6 1.1 0.2%
France 185.9 8.0 4.5%
Spain 98.2 -30.4 -23.6%
Netherlands 541.5 -37.0 -6.4%
United Kingdom 302.6 -47.1 -13.5%
United States n.a. -70.5 n.a.
Total portfolio 2,087.8 -167.8 -7.4%
IFRS Adjustments -14.8 -4.2
2,073.0 -172.0 -7.7%
INVESTMENT PROPERTY - LEASE DATA
(x € 1,000)
Average lease length Annual rent of leases expiring in *
to break to expiry year 1 year 2 year 3-5
Belgium 2.6 6.6 6,734 8,652 15,389
Finland 4.3 4.5 5,452 1,605 8,153
France 5.4 5.5 165 206 2,598
Spain 2.2 5.0 2,585 550 3,198
Netherlands 2.7 3.1 5,076 7,921 16,746
United Kingdom 7.6 8.8 4,373 2,155 7,925
Total portfolio 4.0 5.6 24,385 21,089 54,009
* Excluding leases without end date
8. EPRA TABLES 39
213.0167_11Annual Report 2012 108P kopie.indd 39 11-03-13 12:16
(x € 1,000)
(x € 1,000)
(x € 1,000)

Wereldhave annual review 2012
Financials 201240
Wereldhave annual report 2012
INVESTMENT PROPERTY - LIKE-FOR-LIKE NET RENTAL INCOME
(x € 1,000)
NET RENTAL INCOME 2012
Properties owned Acquisitions Disposals Development Other / Total net
throughout properties Currency rental
the 2 years differences income
Belgium 24,813 3,501 792 2,704 -58 31,752
Finland 23,551 14 23,565
France 9,448 1,053 10,501
Spain 5,878 913 105 6,896
Netherlands 34,639 280 14 69 35,002
United Kingdom 8,015 11,334 3,598 148 23,095
United States 20,169 3,060 -3,086 20,143
Total portfolio 126,513 15,115 9,444 -382 264 150,954
net like-for-like rental growth 0.0%
NET RENTAL INCOME 2011
Properties owned Acquisitions Disposals Development Other / Total net
throughout properties Currency rental
the 2 years differences income
Belgium 23,738 110 175 550 24,573
Finland 22,367 2,920 3,199 -265 28,221
France 9,238 3,061 -129 12,170
Spain 6,355 968 256 7,579
Netherlands 33,620 211 3,137 1,153 38,121
United Kingdom 8,341 577 9,419 -344 17,993
United States 22,863 11,688 -1,722 32,829
Total portfolio 126,522 788 31,303 3,374 -501 161,486
Calculation EPRA ‘triple NAV’ per share 31-12-2012 31-12-2011
Shareholders’ equity per share 64.09 73.44
Effect of conversion 2.17 -0.01
Adjustments for fair value of derivatives -0.98 -0.94
Adjustments for deferred taxes 3.05 3.98
Adjustment goodwill -0.07 -0.07
EPRA net asset value per share 68.26 76.40
Fair value of derivatives 0.98 0.94
Fair value of interest bearing debt -1.34 0.30
Fair value of deferred tax -1.82 -2.39
EPRA ‘triple NAV’ per share 66.08 75.25
40
213.0167_11Annual Report 2012 108P kopie.indd 40 11-03-13 12:16
(x € 1,000)

41
INVESTMENT PROPERTIES AS AT 31 DECEMBER
location retail office other parking year of year of annual rent
spaces acquisition construction 2013
or renovation
m² m² m² number (x € 1m)
n.l.a. n.l.a. n.l.a.
Belgium *)
RETAIL PORTFOLIO
Genk
Sint Martinusplein 15,400 600 2012 2008 3.4
Liege
Quai des Vennes 1 30,252 2,200 1994 1994 11.1
Nivelles
Chaussée de Mons 18 28,600 1,300 1984 2012 8.2
Tournai
Boulevard Walter de Marvis 22 15,540 1,260 1988 1996 3.0
Waterloo
Chaussée de Bruxelles 193-195 3,347 95 2010 1967 0.9
93,139 26.6
OTHER PROPERTIES
Brussels
Boulevard Bischoffsheim 1-8 12,666 150 1988 2002 2.5
Medialaan 28, Vilvoorde 13,018 305 1998 2002 1.7
Medialaan 30, Vilvoorde 5,650 178 1999 2001 0.8
Medialaan 32, Vilvoorde 4,027 123 1999 2001 0.5
Jan Olieslagerlaan 3,077 82 1999 1999 0.3
Antwerp
Roderveldlaan 3-4-5, Berchem 17,011 316 1999 2001 2.0
Berchemstadionstraat 76-78, Berchem 11,400 217 1999 2002 1.4
Roderveldlaan 1-2, Berchem 11,560 238 1999 2001 1.4
93,139 78,409 37.2
Finland
RETAIL PORTFOLIO
Helsinki
Itis 85,009 9,537 1,700 2002 2012 29.0
85,009 9,537 29.0
France
OFFICE PORTFOLIO
Paris and environs
45-49 Rue Kléber, Levallois-Perret 19,679 351 1999 1999 8.8
Avenue Jules Rimet, Saint-Denis 10,921 124 1999 2001 2.6
30,600 11.4
9. INVESTMENT PROPERTIES AS AT 31 DECEMBER 2012 41
213.0167_11Annual Report 2012 108P kopie.indd 41 11-03-13 12:16

Wereldhave annual review 2012
Financials 201242
Wereldhave annual report 2012
location retail office other parking year of year of annual rent
spaces acquisition construction 2013
or renovation
m² m² m² number (x € 1m)
n.l.a. n.l.a. n.l.a.
Netherlands
RETAIL PORTFOLIO
Arnhem
Shopping Centre Kronenburg
(leasehold until 2110) 31,752 1,000 1988 1985 9.1
Kronenburgsingel 505/515 2,506 2011 1985 0.3
Purmerend
Shopping Centre Eggert 19,381 375 2010 1992 5.8
Leiderdorp
Shopping Centre Winkelhof 17,857 830 1993 1999 4.3
Eindhoven
Shopping Centre Woensel 10,145 2010 2006 3.2
Etten-Leur
Shopping Centre Etten-Leur 22,146 1991 1995 4.0
Roosendaal
Shopping Centre De Roselaar 12,736 2010 1996 3.5
Capelle a/d IJssel
Shopping Centre De Koperwiek 9,103 60 app. 2010 1995 2.9
Maassluis
Shopping Centre Koningshoek 14,638 2010 1973 3.2
Geldrop
Heuvel 62-89A and
Achter de Kerk 1, 3, 5 and 15 4,537 30 app. 1978 1996 1.1
144,801 37.4
OTHER PROPERTIES
The Hague
Laan van Ypenburg 20-160 47,179 155 1996 1993 2.9
Moerdijk
Middenweg 6 8,779 126 1997 1988 1.0
Alphen aan den Rijn
R. Wallenbergplein 21-37 6,177 108 1999 2002 0.5
Delft
Delftechpark 2,050 0.3
Valkenburg ZH
Voorschoterweg 45-47 4,642 0.3
144,801 8,227 60,600 42.4
90 app.
42
213.0167_11Annual Report 2012 108P kopie.indd 42 11-03-13 12:16
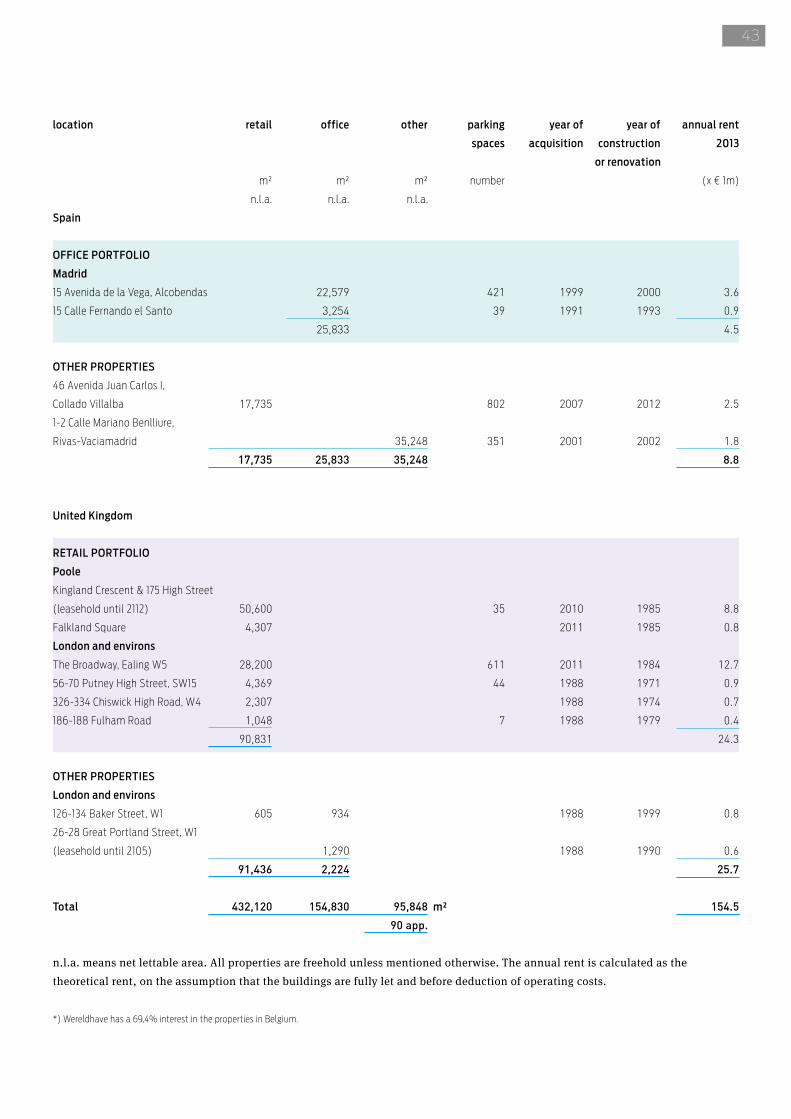
43
location retail office other parking year of year of annual rent
spaces acquisition construction 2013
or renovation
m² m² m² number (x € 1m)
n.l.a. n.l.a. n.l.a.
Spain
OFFICE PORTFOLIO
Madrid
15 Avenida de la Vega, Alcobendas 22,579 421 1999 2000 3.6
15 Calle Fernando el Santo 3,254 39 1991 1993 0.9
25,833 4.5
OTHER PROPERTIES
46 Avenida Juan Carlos I,
Collado Villalba 17,735 802 2007 2012 2.5
1-2 Calle Mariano Benlliure,
Rivas-Vaciamadrid 35,248 351 2001 2002 1.8
17,735 25,833 35,248 8.8
United Kingdom
RETAIL PORTFOLIO
Poole
Kingland Crescent & 175 High Street
(leasehold until 2112) 50,600 35 2010 1985 8.8
Falkland Square 4,307 2011 1985 0.8
London and environs
The Broadway, Ealing W5 28,200 611 2011 1984 12.7
56-70 Putney High Street, SW15 4,369 44 1988 1971 0.9
326-334 Chiswick High Road, W4 2,307 1988 1974 0.7
186-188 Fulham Road 1,048 7 1988 1979 0.4
90,831 24.3
OTHER PROPERTIES
London and environs
126-134 Baker Street, W1 605 934 1988 1999 0.8
26-28 Great Portland Street, W1
(leasehold until 2105) 1,290 1988 1990 0.6
91,436 2,224 25.7
Total 432,120 154,830 95,848 m² 154.5
90 app.
n.l.a. means net lettable area. All properties are freehold unless mentioned otherwise. The annual rent is calculated as the theoretical rent, on the assumption that the buildings are fully let and before deduction of operating costs.
*) Wereldhave has a 69,4% interest in the properties in Belgium.
43
213.0167_11Annual Report 2012 108P kopie.indd 43 11-03-13 12:16

Wereldhave annual review 2012
Financials 201244
Wereldhave annual report 2012
Independent valuers
Catella Property Group, Helsinki
CBRE, Amsterdam
Cushman & Wakefield, Amsterdam, Brussels
Jones Lang LaSalle, Paris, Madrid, London
Troostwijk-Roux Expertises cvba, Antwerp
SUMMARY OF INVESTMENT PROPERTIES
The following is a summary of the open market value of the Group’s investment properties at December 31, 2012. Foreign currencies have been converted at rates of exchange ruling at December 31, 2012. The annual rent is shown on the assumption that the buildings are fully let and before deduction of property expenses.
(amounts x € 1m) retail offices other total
market annual market annual market annual market annual
value rent value rent value rent value rent
Belgium 377.5 26.6 122.3 10.6 - - 499.8 37.2
Finland 458.3 29.0 - - - - 458.3 29.0
France - - 174.7 11.4 - - 174.7 11.4
Netherlands 498.6 37.4 5.6 0.8 36.5 4.2 540.7 42.4
Spain 16.7 2.5 61.9 4.5 18.8 1.8 97.4 8.8
United Kingdom 280.6 24.3 8.8 0.6 12.7 0.8 302.1 25.7
Total 1,631.7 119.8 373.3 27.9 68.0 6.8 2,073.0 154.5
SUMMARY OF REVALUATIONS OF THE INVESTMENT PROPERTIES
This summary shows the revaluation in 2012 of investment properties by country and sector. The revaluations have been converted at average exchange rates.
value at 31-12-2012 revaluation in 2012 as a % of the value before revaluation
(x € 1m) retail offices other total
Belgium 499.8 7.9 4.3 -5.9 - 1.6
Finland 458.3 1.1 0.2 - - 0.2
France 174.7 8.3 - 5.0 - 5.0
Netherlands 540.7 -36.8 -3.8 -54.4 -22.7 -6.4
Spain 97.4 -30.7 -56.1 -2.8 -28.5 -23.9
United Kingdom 302.1 -47.0 -15.2 36.5 8.4 -13.4
United States - -74.8 -0.5 -16.4 -0.5 -12.7
Total 2,073.0 -172.0 -4.6 -9.2 -8.4 -6.2
44
213.0167_11Annual Report 2012 108P kopie.indd 44 11-03-13 12:16
(amounts x € 1m)
(x € 1m)

PRIMARY STATEMENTS OF THE ANNUAL ACCOUNTS 2012

Wereldhave annual review 2012
Primary statements of the annual accounts 201246
CONSOLIDATED BALANCE SHEET AT DECEMBER 31, 2012
Wereldhave annual report 2012
CONSOLIDATED BALANCE SHEET AT DECEMBER 31, 2012
(amounts x € 1.000)
Notes December 31, 2012 December 31, 2011
ASSETS
Non-current assets
Investment properties in operation 2,073,027 2,830,169
Investment properties under construction 240,044 227,932
Investment properties 5 2,313,071 3,058,101
Property and equipment 6 4,450 6,720
Intangible assets 7 3,993 6,753
Financial assets 8 47,702 42,375
Deferred tax assets 9 3,129 5,200
Other non current assets 10 17,908 47,291
77,182 108,339
2,390,253 3,166,440
Current assets
Trade and other receivables 11 26,126 26,947
Tax receivables 12 5 140
Cash and cash equivalents 13 44,406 24,400
70,537 51,487
Assets held for sale 14 543,166 -
613,703 51,487
3,003,956 3,217,927
EQUITY AND LIABILITIES
Equity
Share capital 15 216,796 216,796
Share premium 16 767,315 767,315
Reserves 17-20 405,436 607,803
1,389,547 1,591,914
Non-controlling interest 147,187 122,060
1,536,734 1,713,974
Long-term liabilities
Interest bearing liabilities 21 1,213,778 1,224,088
Deferred tax liabilities 22 87,492 115,835
Financial liabilities 26 - 555
Other long-term liabilities 23 3,721 4,650
1,304,991 1,345,128
Short term liabilities
Trade payables 9,371 12,656
Tax payable 24 599 924
Interest bearing liabilities 21 75,000 64,965
Other short term liabilities 25 77,261 80,280
162,231 158,825
3,003,956 3,217,927
48
213.0167_11Annual Report 2012 108P kopie.indd 48 11-03-13 12:16
(amounts x € 1,000)

47
CONSOLIDATED INCOME STATEMENT FOR 2012
(amounts x € 1.000)
Notes 2012 2011
Gross rental income 28 147,574 143,453
Service costs charged 30,031 30,547
Total revenues 177,605 174,000
Service costs paid -33,494 -33,555
Property expenses 29 -13,300 -11,788
-46,794 -45,343
Net rental income 130,811 128,657
Valuation results 30 -78,559 17,478
Results on disposals 31 8,941 -672
General costs 32 -21,004 -14,013
Other income and expense 33 -1,981 1,787
Operational result 38,208 133,237
Interest charges -30,305 -30,848
Interest income 362 464
Net interest 34 -29,943 -30,384
Other financial income and expense 35 1,197 -3,717
Result before tax 9,462 99,136
Taxes on result 36 25,544 12,038
Result from continuing operations 35,006 111,174
Result from discontinued operations 37 -122,100 -48,189
Result -87,094 62,985
Profit attributable to:
Shareholders -98,439 51,296
Non-controlling interest 11,345 11,689
Result -87,094 62,985
Basic and diluted earnings per share
from continuing operations (x € 1) 39 1.09 4.61
Basic and diluted earnings per share
from discontinued operations (x € 1) 39 -5.63 -2.23
Basic earnings per share (x € 1) 39 -4.54 2.38
Diluted earnings per share (x € 1) 39 -4.54 2.38
CONSOLIDATED INCOME STATEMENT FOR 2012 49
213.0167_11Annual Report 2012 108P kopie.indd 49 11-03-13 12:16
(amounts x € 1,000)
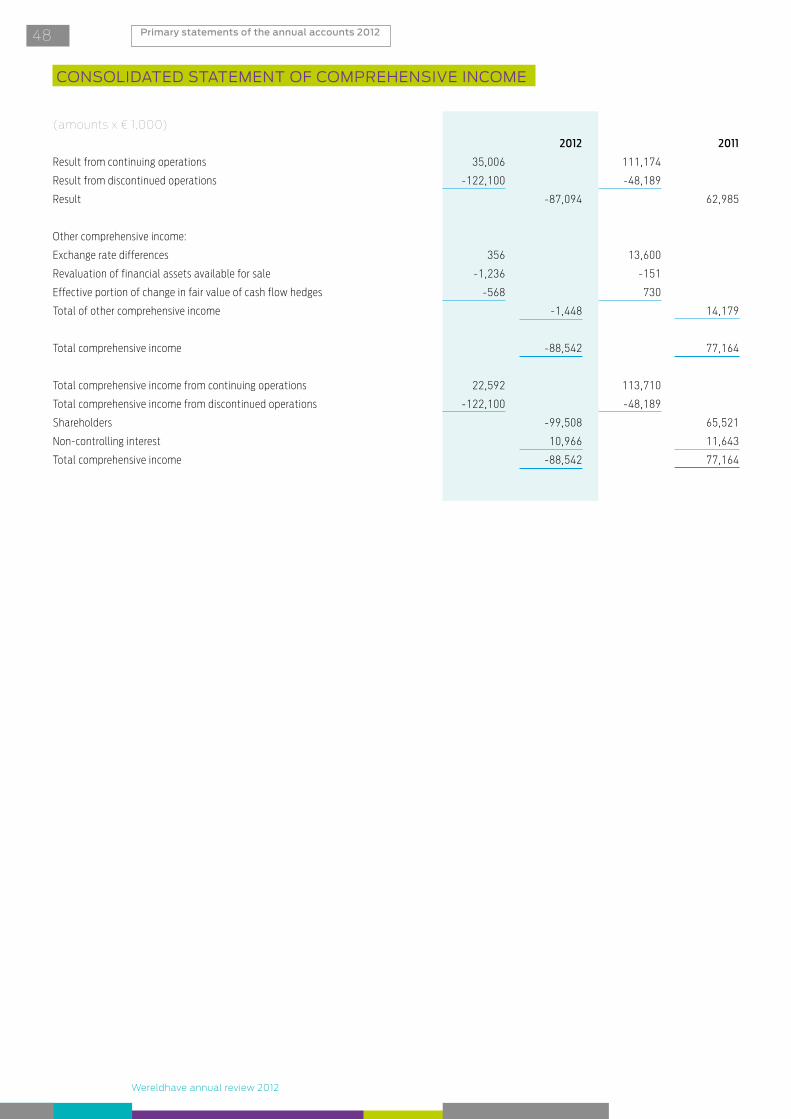
Wereldhave annual review 2012
Primary statements of the annual accounts 201248
CONSOLIDATED STATEMENT OF COMPREHENSIVE INCOME
Wereldhave annual report 2012
(amounts x € 1.000)
2012 2011
Result from continuing operations 35,006 111,174
Result from discontinued operations -122,100 -48,189
Result -87,094 62,985
Other comprehensive income:
Exchange rate differences 356 13,600
Revaluation of financial assets available for sale -1,236 -151
Effective portion of change in fair value of cash flow hedges -568 730
Total of other comprehensive income -1,448 14,179
Total comprehensive income -88,542 77,164
Total comprehensive income from continuing operations 22,592 113,710
Total comprehensive income from discontinued operations -122,100 -48,189
Shareholders -99,508 65,521
Non-controlling interest 10,966 11,643
Total comprehensive income -88,542 77,164
CONSOLIDATED STATEMENT OF COMPREHENSIVE INCOME50
213.0167_11Annual Report 2012 108P kopie.indd 50 11-03-13 12:16
(amounts x € 1,000)

49
CONSOLIDATED STATEMENT OF MOVEMENTS IN EQUITYCONSOLIDATED STATEMENT OF MOVEMENTS IN EQUITY
(amounts x € 1.000)
Attributable to shareholders
Share Share General Revaluation Hedge Reserve for Total Non- Total
capital premium reserve reserve reserve exchange attributable controlling
rate to share- interests
differences holders
Balance at January 1, 2011 214,485 777,728 656,639 1,456 - -39,077 1,611,231 116,832 1,728,063
Comprehensive income
Result 2011 - - 51,296 - - - 51,296 11,689 62,985
Exchange rate differences - - - - - 13,600 13,600 - 13,600
Revaluation of financial assets
available for sale - - - -105 - - -105 -46 -151
Effective portion of change in fair
value of cash flow hedges - - - - 730 - 730 - 730
Total of comprehensive income - - 51,296 -105 730 13,600 65,521 11,643 77,164
Transactions with shareholders
Equity component convertible bond - -8,102 8,102 - - - - - -
Purchase shares for remuneration - - -299 - - - -299 - -299
Stockdividend 2010 2,311 -2,311 - - - - - - -
Dividend 2010 - - -84,539 - - - -84,539 -6,415 -90,954
Balance at December 31, 2011 216,796 767,315 631,199 1,351 730 -25,477 1,591,914 122,060 1,713,974
Balance at January 1, 2012 216,796 767,315 631,199 1,351 730 -25,477 1,591,914 122,060 1,713,974
Comprehensive income
Result 2012 - - -98,439 - - - -98,439 11,345 -87,094
Exchange rate differences - - - - - 356 356 - 356
Revaluation of financial assets
available for sale - - - -857 - - -857 -379 -1,236
Effective portion of change in fair
value of cash flow hedges - - - - -568 - -568 - -568
Total of comprehensive income - - -98,439 -857 -568 356 -99,508 10,966 -88,542
Transactions with shareholders
Release shares for remuneration - - 299 - - - 299 - 299
Purchase (extension) share capital 38 - - -1,264 - - - -1,264 20,706 19,442
Dividend 2011 - - -101,894 - - - -101,894 -6,545 -108,439
Balance at December 31, 2012 216,796 767,315 429,901 494 162 -25,121 1,389,547 147,187 1,536,734
51
213.0167_11Annual Report 2012 108P kopie.indd 51 11-03-13 12:16
(amounts x € 1,000)

Wereldhave annual review 2012
Primary statements of the annual accounts 201250
CONSOLIDATED CASH FLOW STATEMENT FOR 2012
Wereldhave annual report 2012
(amounts x € 1.000)
Notes 2012 2011
Operating activities
Result -87,094 62,985
Adjustments:
Valuation results 30-37 197,033 51,331
Net interest charge 34-37 39,280 37,048
Other financial income and expense 35 -1,197 3,717
Results on disposals -7,896 4,097
Deferred taxes -26,094 -14,131
Other non cash movements 1,389 1,011
202,515 83,073
115,421 146,058
Movements in working capital -7,046 11,335
Cash flow from company activities 108,375 157,393
Interest paid -38,666 -33,305
Interest received 155 860
Income tax paid -700 -2,247
-39,211 -34,692
Cash flow from operating activities 69,164 122,701
Investment activities
Proceeds from disposals direct investment properties 332,403 168,589
Proceeds from disposals indirect investment properties - 48,824
Investments in investment property 5-38 -208,414 -340,538
Investments in equipment 197 -881
Investments in financial assets -5,209 4,712
Investments in intangible assets -606 -973
Investments in other long-term assets -4,353 -3,793
Cash settlement forward transactions -610 -8,181
Cash flow from investment activities 113,408 -132,241
Financing activities
New loans interest bearing debts 21 575,290 586,630
Repayment interest bearing debts 21 -581,521 -508,467
Transactions with shareholders 38 -47,769 -
Repayment other long-term liabilities -806 -624
Other movements in reserves 299 -299
Dividend paid -108,439 -90,954
Cash flow from financing activities -162,946 -13,714
Increase / Decrease (-) cash and bank 19,626 -23,254
Cash and bank balances at January 1 13 24,400 32,096
Foreign exchange differences 380 15,558
Cash and bank balances at December 31 13 44,406 24,400
CONSOLIDATED CASH FLOW STATEMENT FOR 201252
213.0167_11Annual Report 2012 108P kopie.indd 52 11-03-13 12:16
(amounts x € 1,000)
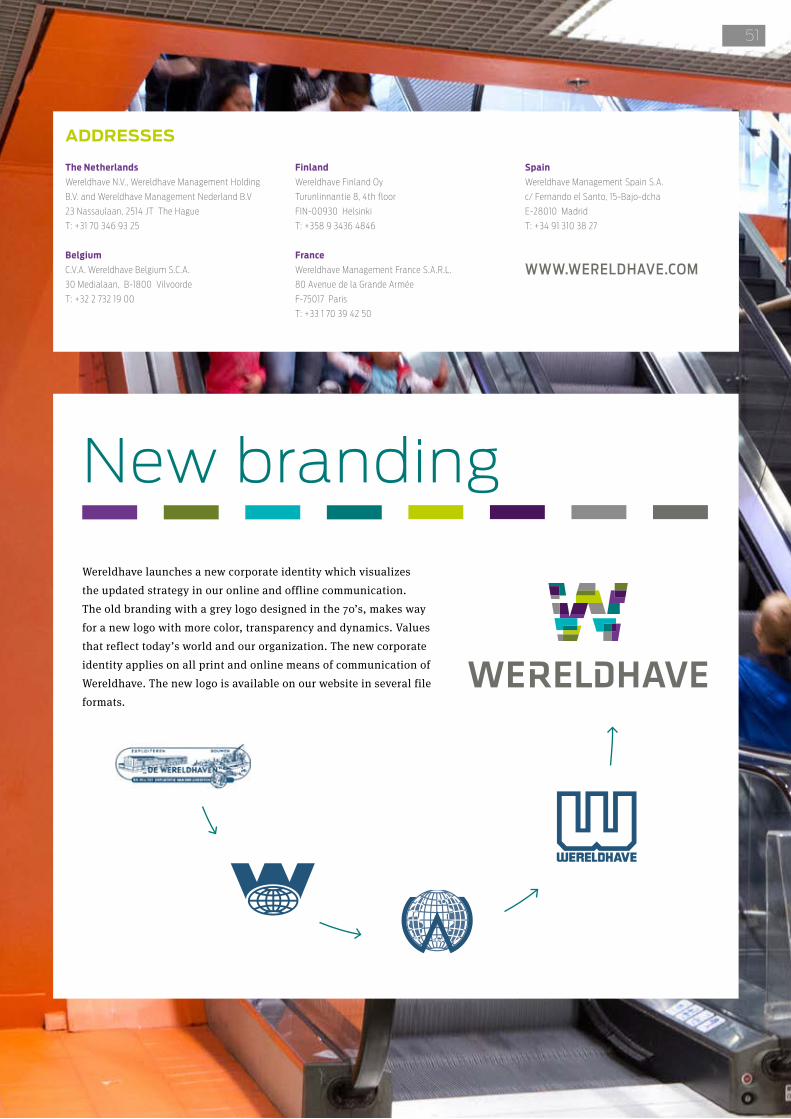
Wereldhave launches a new corporate identity which visualizes the updated strategy in our online and offline communication. The old branding with a grey logo designed in the 70’s, makes way for a new logo with more color, transparency and dynamics. Values that reflect today’s world and our organization. The new corporate identity applies on all print and online means of communication of Wereldhave. The new logo is available on our website in several file formats.
ADDRESSES
The Netherlands
Wereldhave N.V., Wereldhave Management Holding
B.V. and Wereldhave Management Nederland B.V
23 Nassaulaan, 2514 JT The Hague
T: +31 70 346 93 25
Belgium
C.V.A. Wereldhave Belgium S.C.A.
30 Medialaan, B-1800 Vilvoorde
T: +32 2 732 19 00
Finland
Wereldhave Finland Oy
Turunlinnantie 8, 4th floor
FIN-00930 Helsinki
T: +358 9 3436 4846
France
Wereldhave Management France S.A.R.L.
80 Avenue de la Grande Armée
F-75017 Paris
T: +33 1 70 39 42 50
Spain
Wereldhave Management Spain S.A.
c/ Fernando el Santo, 15-Bajo-dcha
E-28010 Madrid
T: +34 91 310 38 27
WWW.WERELDHAVE.COM
New branding
51
