influenza and diabetes; immunological and … · robert jacob anthonius diepersloot geboren te...
TRANSCRIPT

INFLUENZA AND DIABETES; IMMUNOLOGICAL AND
EPIDEMIOLOGICAL ASPECTS


INFLUENZA AND DIABETES; IMMUNOLOGICAL AND
EPIDEMIOLOGICAL ASPECTS INFLUENZA AND DIABETES;
IMMUNOLOGISCHE EN EPIDEMIOLOGISCHE ASPECTEN
PROEFSCHRIFT
Ter verkrijging van de graad van doctor aan de Erasmus Universiteit Rotterdam.
Op gezag van de rector magnificus
Pro£ Dr. CJ. Rijnvos en volgens het besluit van het
College van dekanen.
De openbare verdediging zal plaatsvinden op woensdag 20 december 1989 om 15.45 uur
door
ROBERT JACOB ANTHONIUS DIEPERSLOOT
geboren te Inanwatan
DRUKKERIJ ELINKWIJK BV- UTRECHT
PROMOTIECOMMISSIE
PROMOTORES : PROF. DR. N. MASUREL PROF. DR. D.W. ERKELENS
OVERIGE LEDEN: PROF. DR]. HUISMAN PROF. DR. S.WJ. LAMBERTS

Men hoejt niet te hopen om te ondernemen Noch te slagen om te volharden

Contents
Chapter 1:
Chapter2:
Chapter 3:
Chapter4:
Chapter 5:
Chapter6:
Chapter7:
Summary
Samenvatting
Woord van dank
Curriculum Vitae
General Introduction
Influenza infection and diabetes mellitus: arev1ew
Effect of epidemic influenza on ketoacidosis, pneumonia and death in diabetes mellitus. A hospital register survey of 197 6-1979 in The Netherlands.
Humoral immune response and delayed type hypersensivity to influenza vaccine in patients with diabetes mellitus.
Cytotoxic T -cell response to influenza A subunit vaccine in patients with type 1 diabetes mellitus.
No evidence for the enhanced production of insulin auto-antibodies after confrontation with common viral antigens in insulin dependent diabetes mellitus.
General discussion and conclusions.
Contents
9
19
31
45
59
71
83
89
93
97
98

Contents
Appendix paper: Humoral immune response after influenza vaccination with booster in patients with type 1 diabetes mellitus. 99

9 Chapter 1
Chapter 1
General introduction

General introduction 10
HISTORY
The written history of influenza dates back from the 5th century BC when Hippocrates described the abrupt onset of fever, cough and myalgias that lasted only a few days, but afflicted a large part of the population and often caused a persistant weakness in many individuals (1 ). The clinical syndrome and epidemiological behaviour of influenza have not changed since. These constant features have enabled historians to trace influenza epidemics throughout the ages. In the sixteenth century the term "influenza" was introduced by the Italians to indicate that a disease with such a sudden onset almost certainly was influenced by the stars or special climatic circumstances. From 1 700 on circa 20 influenza pandemics haven been described. The most devastating of these pandemics occurred in 1918-1919. In three "waves", even throughout the heat of the summer, influenza rampaged over all continents taking a toll of over 20 million human lifes (2). The infectious nature of influenza was not appreciated untill the nineteenth century. It was Richard Pfeiffer who, during the 1889 pandemic, thought to have found the causative agent in the throats of influenza patients (3 ). Though this bacterium, even by now sometimes named as the "Pfeiffer bacillus" eventually was not to be the cause of influenza infection it still wears its name as a remembrance: Haemophilus influenzae. The evidence that influenza was a virus and not a bacterium came from Richard Shope who, in 1930, was able to transmit influenza in pigs by secretions that were first passed through bacterial filters ( 4). Three years later, in1933, Wilson Smith an English investigator who suffered from influenza used his own filtered throat washings to infect ferrets. By the time he had recovered, the ferrets had become ill with all symptoms of a serious respiratory infection; influenza (5). Ferrets are still used as an animal model in influenza research, in particular for the production of type specific antisera.

11 Chapter I
THE VIRUS AND ITS EPIDEMIOLOGY
The influenza viruses belong to the family of orthomyxoviridae which contains three different viral genera: influenza A, B and C. Influenza type A and B give rise to the same clinical symptoms, influenza C is only involved in minor infections of the upper respiratory tract. Type B viruses have so far only been isolated from man. Influenza A causes infections in a wide range of animals (horses, pigs; birds, seals etc.). Influenza type C that since 1944 was known to cause upper respiratory infections in man, has recently been isolated from pigs ( 6). Influenza viruses measure about 110 nm. The surface of the virus is covered with two types of spikes formed by the haemagglutinin and neuraminidase proteins. The genetic material is made up of 8 distinct single stranded RNA segments. This segmentation of the genome is in part responsible for the distinctive epidemiologic features of the influenza viruses. Antigenic changes of the haemagglutinin and neuraminidase molecules continually take place in influenza A viruses and to a lesser extent in the type B group. Influenza C appears to be antigenically stable. Antigenic variations appear in several ways. In the first place minor changes in the haemagglutinin component occur on a year-to-year basis. This phenomenon is called antigenic "drift" and is induced by the immunity in the population build up by previous infections. It enables the influenza virus to circumvent this immunity and to maintain its offensive power. The possibilities of antigenic drift to elude the human immune response are limited. Therefore, after a period of approximately 8-15 years the haemagglutinin molecule is substituted for a completely new one. This replacement is known as the antigenic shift. Such an antigenic shift will lead to a major epidemic with high morbidity and mortality as the greatest part of the population has no protective antibodies to the new virus ( 1 ). Once in 30-40 years the antigenic shift will include the neuraminidase component as well. The then emerging virus has no resemblance with the preceding virus at all and will cause an epidemic that afflicts all continents. In this century two influenza pandemics occurred (7). The first one, the 1918-1919 pandemic, became known as the "spanish flu" and caused more deaths than the just ended world war I. The second one , the "asian flu", occurred in 1957. In The Netherlands it

General introduction 12
emerged in mid-summer, most probably introduced by repatriates from Indonesia and spread rapidly throughout the country (8).
Serological investigations on sera obtained from individuals born 70-80 years before 1957 and 1968 (Hongkong flu, H3N2) revealed that these in their youth had been primed by indentical influenza A virushaemagglutinins (9). These findings implicate that there is a recycling of a limited number of influenza A viruses and that the cycle is completed in a life time. If this hypothesis holds true the corning pandemic will be caused by an influenza A virus strain that is identical to the 1918-1919 virus: HswN1 (1 0). The patient groups that are at highest risk during influenza epidemics have changed remarkably over the last six decades. In the earlier reports diphteria, poliomyelitis and rheumatic heart disease are mentioned as underlying diseases with a high influenza morbidity and mortality (11,12). In addition, the most frightened complication of influenza infection, secondary staphylococcal pneumonia was linked to antecedent staphyloccal skin infection ( 13,14 ). In recent years influenza morbidity and mortality statistics are dominated by chronic respiratory and cardiovascular diseases (15,16). Actually, there are only two risk factors that seem to be constant over a long period of time; high age and diabetes mellitus. It is the relation between the latter condition and influenza that is the subject of this thesis.
IMMUNE RESPONSE
Though influenza infection will induce antibody production against several internal and external antigens it is generally assumed that antibodies against the haemagglutinin (HA) component are the most effective in conferring protection against subsequent infection. Antibodies that are directed against HA can be detected in the haemagglutination inhibition (HI) assay. These antibodies prevent virus from attaching to the cell surfaces and most probably are neutralizing antibodies in vivo ( l). In. an experimental animal model the transfer of haemagglutination

13 Chapter I
inhibiting (HI) antibodies have been demonstrated to protect mice from infection after subsequent confrontation with live influenza A virus ( 1 7).
From vaccination studies in human volunteers it can be concluded that HI antibody titres over 100 are associated with protection against infection ( 18). Even HI antibody levels that are considerably lower than 100 will partly protect against infection or will alleviate symptoms if infection does occur (19). Antibodies directed against the neuraminidase ·(NA) antigen have been shown to reduce the amount of virus released from infected cells by crosslinking budding viruses (20,21). Neuraminidase inhibiting (NI) antibodies are less protective then HI antibodies, but they may add to their beneficial effect by aborting the infectious process in an early stage (22,23). No protective effect has been demonstrated for antibodies against internal proteins, nucleoprotein (NP) and matrixprotein (M) of the influenza virus (24). Humoral immunity may be instrumental in preventing infection, it will not effect recovery from illness if infection has taken place (25). For the eventual recovery from influenza a cellular immune response mediated by Natural Killer (NK) cells and cytotoxic T -lymphocytes is necessary. NK cells that appear early in influenza infection are by themselves not able to clear the virus but they may limit the replication and spread of the virus during the build-up of the cytoxic T -cell response. The cytotoxic T -cells will eradicate all cells which are infected by the influenza virus. Thus, these cells will not only clear the virus but, in the process, will add to the damage of infected host tissue (1,25). In contrast with HI and NI antibodies, cytoxic T -cells do not distinguish between different influenza strains and have a cross-reactivity for all influenza A subtypes (26). Because of this cross-reactivity it is worth trying to induce a cytotoxic T -cell response by vaccination. Research by both McMichael et al and Ennis et al have shown that routinely used influenza vaccines are able to elicit such a response (27,28). It remains to be elucidated to which extent the cytotoxic T -cell response contributes to the protective effect on influenza vaccination. We will present the results of a .study on the cytotoxic T -cell response to

General introduction 14
influenza A subunit vaccine in patients with type 1 diabetes mellitus in chapter 5.
VACCINATION AND PROTECTION
Inactivated influenza vaccines have been used since the 1940's. For the production of these vaccines embryonated hen's eggs are inoculated with the influenza virus. The virus will then rapidly propagate in the allantoic fluid. This fluid is harvested, inactivated with formalin and purified. Such inactivated "whole virus" vaccines have been shown safe and to reduce attack rates with 70 to 80% (18,29). Usually only minor side effects are reported. These side effects are restricted to local tenderness and swelling at the side of injection. Mild systemic symptoms as a slight temperature rise are observed in 1 to 2% of vaccinated individuals. In 1946 it was observed that the influenza vaccines used untill then suddenly lacked protective effect. This phenomenon was caused by the appearence of a new virus. The prevalent HON1 virus was replaced by the HlNl subtype virus. This event confronted virologists with the necessity to predict the antigenic make-up of the influenza virus of the coming influenza season. To meet this problem, the WHO has build a worldwide network of influenza centres that meticulously register the epidemiological behaviour of the influenza virus in their region. To date there are 101 national and two international (London, UK and Atlanta, USA) influenza centres. In The Netherlands the national WHO-influenza centre is located in Rotterdam. It cooperates with virological laboratories throughout the country, the Chief Inspector of Public Health and some 50 general practitioners that register all influenza-like illnesses. All relevant data are reported to the WHO in Geneva and new viral isolates are send to the international influenza centres in London and Atlanta (30). To further reduce the side effects of the whole virus vaccines, vaccines treated with ether or tri-n-butyl phosphate have been developed; split-virus vaccines. Sub-unit vaccines contain only the external components of the virus (haemagglutinin and neuraminidase).

15 Chapter I
These vaccines induce fewer side effects and produce in a sub-type period protection rates similar to the whole virus vaccines, at least in adults. In children without prior exposure to the antigen these vaccines may be less immunogenic (31 ).
Since sub-unit vaccines lack the internal components of the virus they probably are less efficiacous in boosting a cytotoxic T -cell response. This problem will be discussed extensively in chapter 5. As will be demonstrated in chapter 4 one of the major set-backs of vaccination is the relatively low protection rate in some major risk groups, patients with type 1 diabetes mellitus among others. Because of the immunosuppressed state that makes them a population at risk, their antibody production after vaccination is impaired (32-34). Efforts to booster the humoral immune response in these patients as in patients with diabetes mellitus (appendix paper) are disappointing in most instances. Patients that remain unprotected after vaccination can be protected during an eventual influenza type A epidemic by administering amantadine hydrochloride 200 mg daily (35). Amantadine has been shown to inhibit viral replication in an early stage, possibly by interference with the uncoating of the viral genome (36,37). It is not effective against influenza type B (35). In a 100-200 mg daily dose it has been shown to provide 80% protection against influenza illness (38,39).

General introduction 16
References
Van Voris LP, YoungJF, BernsteinJM, Graham WC, Anderson EL, Gorse GJ, Belshe (1984). Influenza viruses. In: Medical Virology ed. Belshe RB. PSG Publishing Comp. Lit_tleton USA pp 271-275.
2 Douglas RG, Betts RF( 1985). In: Principles and practice of infectious diseases ed. Mandell GL, Douglas RG andBennettJE. Toronto, John Wiley and sons, p 846.
3 Pfeiffer R (1893). Die aetiologie der influenza. Zeitschrift £Hygiene u. InfectKrankh. Bd XIII.
4 Shope RE ( 1931 ). Swine influenza III. Filtration experiments and etiology. J. Exp. Med. 54:373.
5 Smith W, Andrews CH, Laidlow PP (1933). A virus obtained from influenza patients. Lancet 2:66.
6 Guo Y,Jin F, Wang M (1982). Influenza C virus isolated from pigs in China. Kexue Tongbae 27:1118-1121.
7 Masurel N ( 1983 ). Orthomyxoviridae. In Medische Virologic ed. Wilterdink JB. Bohn, Scheltema en Holkema, Utrecht pp 105-122.
8 Mulder J, Masurel N (1960). The epidemiology of pandemic A2 influenza in The Netherlands, 1957-1958. Bull. of the WHO 22:399-407.
9 Masurel N, Marine WM (1973). Recycling of Asian and Hongkong influenza A virus haemagglutinin in man. Am. J. Epidemiol. 97:44-48.
10 Mulder J, Masdrel N (1958). Pre-epidemic antibody against 1957 strain of Asiatic influenza in serum of older people living in The Netherlands. Lancet 2:810-812.
11 Stocks P (1935). The effect of influenza epidemics on the certified causes of death. Lancet 2:386-395.
12 Polak MF (1959). Influenza mortality in the autumn of 1957. Ned. Tijdschr. Geneesk. 103:1098-1109.
13 Mulder J ( 1952). Influenza in: Advances in internal medicine Chicago. 14 Goslings WRO, MulderJ, DjajadiningratJ, Masurel N (1959). Staphylococcal
pneumonia in influenza. In relation to antecedent staphylococcal skin infection. Lancet 2:428-430.
15 Barker WH, Mullooly JP (1982). Pneumonia and influenza deaths during epidemics. Arch. Intern. Med. 142:85-89.
16 HousworthJ, Langmuir AD (1974). Excess mortality from epidemic influenza 1957-1966. Am. J. Epidcmiol. 100:40-48.
1 7 Fayekas de St. Groth S, Donelly M ( 19 50). Studies in experimental immunology of influenza IV. Protective value of active immunization. J. Exp. Biol. Med. Sci. 28:61.

17 Chapter I
18 Masurel N, Laufer J (1984). A one year study of trivalent influenza vaccines in primed and unprimed volunteers; immunogenicity, clinical reactions and protection. J. Hyg. (Lond) 92:263-27 6.
19 Hobson P, Curry RL, Beare AS (1972). The role of serum haemagglutinationinhibiting antibody in protection against challenge infection with influenza A2 and B viruses.]. Hyg. Camb. 70:767-777.
20 Schulman JL, Khakpour M, Kilbourne ED (1968). Protective effects of hemagglutinin and neuraminidase antigens of influenza virus: Distinctiveness of hemagglutinin antigen of Hong Kong-68 virus. J. Virol. 2:778.
21 Kilbourne ED ( 1978). Influenza as a problem in immunology. J. Immunol. 120:1447-1452.
22 Murphy BR, Kasel JA, Chanock RM (1972). Association of serum antineuraminidase antibody with resistance to influenza in man. N. Eng. J. Med. 286:1329-1332.
23 Schulman JL, Khakpour M, Kilbourne ED (1968). Protective effects of hemagglutinin and neuraminidase antigens of influenza virus. Distinctiveness ofhemagglutinin antigen of Hong Kong-68 virus.]. Virol. 2:778-782.
24 Virelizier JL ( 197 5). Host defense against influenza virus:the role of antihemagglutinin antibody. J. Immunol. 115:434-437.
25 Ennis A (1982). Some newly recognized aspects of resistance against and recovery from influenza. Arch. Virol. 73:207-217.
26 Zweerink HJ, Courtneidge SA, Skehel ], Crumpton MJ, Askonas BA ( 1977). Cytotoxic T -cells kill influenza virus infected cells but do not distinguish between serologically distinct A viruses. Nature 267:354-356.
27 Ennis FA, RookAH, Yi- Hua Q, Schild GC, Riley D, PrattR, Potter CW (1981). HLA-restricted virus specific cytotoxic T lymphocyte responses to live and inactivated influenza viruses. Lancet 2:887-891.
28 McMichael AJ, Gotch F, Cullen Ph, Askonas BA, Webster RG (1981). The human cytotoxic T cell response to influenza A vaccination. Clin. Exp. Immunol. 43:276-284.
29 Eickhoff TC ( 1971 ). Immunization against influenza; rationale and recommendations. J. In£ Dis. 123:446-454.
30 Masurel N ( 1981 ). Influenza: epidemiologie en preventie. Pharmaceutisch Weekblad 116:93-100.
31 Gross PA, Ennis FA (1977). Influenza vaccine:split-product versus whole virus types how do they differ? N. Engl. J. Med. 296:56 7-568.
32 Versluis DJ, Beyer WEP, Masurel N, Wenting GJ, Weimar W (1986). Impairment of the immune response to influenza vaccination in renal transplant recipients by cyclosporine A, but not by azathioprine. Transplantation 42:376-379.
33 Ortbals DW, Liebhaber H, Presant LA, Van Amburg A, Lee JY (1987).
General introduction 18
Influenza immunisation of adult patients with malignant diseases. Ann. Intern. Med. 552-557.
34 Beyer WEP, Diepersloot RJA, Masurel N, Simoons ML, Weimar W (1987). Double failure of influenza vaccination in a heart transplant patient. Transplantation 43:319.
35 Nicholson KG (1984). Antiviral therapy. Lancet 2:617-621. 36 Oxford JS, Galbraith A (1980). Antiviral activity of amantadine. A review of
laboratory and clinical data. Pharmacal Ther. 11:181-262. 37 Kato N, Eggers HJ (1969). Inhibition of uncoating of fowl plague virus by 1-
amantadine hydrochloride. Virology 37:632-636. 38 Sears SD, Clements ML (1987). Protective efficacy oflow-dose amantadine in
adults challenged with mild-type influenza A virus. Antirnicrob. Agents Chemother. 31:1470-1473.
39 Payler DK, Pardham PA (1984). Influenza A prophylaxis with amantadine in a boarding school. Lancet 1:502-504

19 Chapter 2
Chapter 2
Influenza infection and diabetes mellitus: a . revtew
Influenza infection in patients with diabetes mellitus.
Rob JA. Diepersloot ( 1 ), Karel P. Bouter (2), Joost B.L. Hoekstra (2).
1. Department of Virology, Erasmus University, Rotterdam, The Netherlands.
2. Department of Internal Medicine, Diakonessen Hospital, Utrecht, The Netherlands. Accepted for publication in Diabetes Care in a revised form.

Influenza infection 20
ABSTRACT
Epidemiologic data on influenza pneumonia and mortality, results of clinical studies and the outcome of influenza vaccination trials are reviewed. All excess mortality studies that specify for underlying disease list diabetes as one of the major risk factors. During influenza epidemics death rates among patients with diabetes mellitus may increase with 5-15%. Diabetes mellitus is also mentioned as a risk factor in most clinical studies making up 3 to 14% of the patients studied. Even in recent studies diabetes mellitus is only preceded as a risk factor by cardiovascular disease and chronic pulmonary disorders. Patients with diabetes mellitus are probably more prone to the complication of secondary staphylococcal pneumonia, because of an increased carrier rate and an impaired immune response to this organism. Abdominal complaints were noted in several patients and may precede diabetic ketoacidosis by several days. Though influenza vaccination may be disappointing in individual patients, it is concluded that annual vaccination still is of utmost importance.
Key words: Diabetes mellitus, influenza, excess mortality, pneumonia.
INTRODUCTION
In 1935 Leonard Thompson, the first patient in the world to receive insulin, died in an oxygen tent at age 27. The cause of death was a staphylococcal pneumonia complicating a respiratory infection, most likely influenza (1,2). Influenza, a viral agent discovered only two years prior to the death of Leonard Thompson, has since been incriminated as a cause of considerable morbidity and mortality in patients with diabetes mellitus. The actual risk for the individual patient, however, is still debated and some physicians argue that there is no need for annual vaccination (3). In this survey, epidemiologic data on influenza pneumonia and mortality, results of clinical studies and the outcome of influenza vaccination trials are presented.

21 Chapter 2
METHODS
English-language papers mentioned in the monthly "Influenza Bibliography" of the Medical Research Council and the WHO World Influenza Centre, published by the Medical Research Council Library, National Institute for Medical Research, Mill Hill, United Kingdom, the databases of the Medical Faculty of the Erasmus University Rotterdam and the Medline database were searched for (the combination o~ the key words: Influenza, pneumonia, staphylococcal pneumonia, excess mortality and vaccination. Earlier literature was searched by using the relevant references of the literature found in the databases.
Excess mortality studies
Since the original study ofWilliam Farr on the London influenza epidemic of 1847 (4), excess mortality figures have been the main tool to express the impact of influenza epidemics on public health. Not all studies express excess mortality by selected specified underlying disease (5,6). The studies that do however, all list diabetes as one of the major risk factors (7-12). Polak, describing the 1957 epidemic in the Netherlands, ranks diabetes among other high risk conditions as asthma, Parkinsons disease, tuberculosis, multiple sclerosis, scoliosis and cardiac valvular lesions(7). Eickhof et al., studying the same epidemic in the USA. found an increased risk of death for patients suffering from cirrhosis, tuberculosis, rheumatic heart disease, asthma, chronic nephritis and diabetes (8). Housworth and Langmuir concluded that during the 1957-1966 period (covering 7 influenza epidemics) excess mortality from tuberculosis, asthma and chronic rheumatic heart disease was significant during intense influenza A epidemics but was either insignificant or barely significant during mild influenza B epidemics. Arteriosclerotic heart disease was the only subclassification which showed significant excess during all epidemic periods. Excess deaths from diabetes were significant in six of the seven epidemics including the influenza B epidemic of 1962. From the figures in this study, it can be calculated that death rates in patients with diabetes mellitus

Influenza infection 22
increased by approximately 5-12% during epidemic periods (9). A similar increase in death rates (5-15%) among patients with diabetes mellitus in epidemic years was noted by Stocks reporting on influenza mortality from 1921-1931; an era in which insulin was just discovered ( 11 ). More accurate calculations on absolute and relative risks are presented by Barker and Mullooly in their study on influenza deaths during the 1969 and 1973 influenza A (H3N2) epidemic in Oregon, USA. Relative risks in persons over 45 years of age ranged from 39 for patients with one high risk condition (including diabetes) to 200 for patients with two or more high risk conditions. Estimated death rates ranged from two deaths per 100.000 among persons aged 45 to 64 years without chronic disease to 797 deaths per 100.000 in persons older than 65 years with two or more high risk conditions. The highest estimated rates involved persons with cardiovascular disease in combination with either diabetes or chronic pulmonary disease ( 1 0 ). Figures on diabetes as the only risk factor were not given. Cameron et al. calculated a considerably lower relative mortality risk of2.0 (range 0.4- 14.8) for patients with diabetes mellitus in South Australia during 1969-1981 (12). Their figures were based on death certificate data which may lead to underestimation of actual mortality risks by ascribing mortality to other causes, particular cardiovascular. diseases (13,14).
Clinical studies
The results of clinical studies are presented in table 1. Only studies with detailed information on the underlying disease are included. Patients with diabetes mellitus were reported in all but one publications, making up 3 to 14% of the patients studied. Diabetes mellitus is not mentioned as one of the underlying diseases in the study by Winterbauer et al (19). This may be explained by the small size (n~11) of the patient group studied and the fact that only patients with viral pneumonia not complicated by secondary bacterial infection were included. The clinical and pathological findings of the patients presented in the reported studies fit well within the classification originally described by Hers et al. (24) and Louria et al. (25). They defined four basic clinical syndromes: 1 influenza virus alone, causing moderately severe tracheitis and/ or bronchiolitis or 2 a fulminating, usually fatal viral pneumonia, 3

23 Chapter 2
Table 1 The outcome of clinical studies on influenza infections
patients number diabetic (%) year of refno. patients publication
Pneumonia 24 2 (8) 1942 15 Pneumonia 91 4 (4,5) 1959 16 Pneumonia 79 8 (1 0) 1971 17 Pneumonia 108 15 (14) 1971 18 Pneumonia 11 0 (0) 1977 19 Influenza deaths 22 2 (9) 1950 20 Influenza deaths 46 2 (4) 1957 21 Influenza deaths 32 2 (6) 1959 22 Influenza deaths 33 (3) 1959 23 Influenza deaths 38 (3) 1981 13
bacterial pneumonia which might either coexist with acute influenzal infection or 4 present as a postinfluenzal complication. Lethal viral pneumonia is especially noticed in patients with rheumatic heart disease and patients with mitral stenosis (7,17,19-22). Martin et al., however, report a case of lethal viral pneumonia in a 44 year old patient with diabetes mellitus (22). Further clinical information on diabetic patients is scarce. Stuart-Harris reports diabetic coma in one and secondary staphylococcal infection in an other diabetic patient. Both patients were over sixty years of age (20). The second patient with diabetes mellitus mentioned by Martinet al. (aged 30 years) had post-influenza nonstaphylococcal pneumonia (22). Diabetic ketoacidosis is reported in one of seven fatal cases by Schwarzmann et al. (18). Staphylococcus aureus is reported as the main cause of secondary bacterial infection in 5 studies (15,20-23), Streptococcus pneumoniae in three studies (16-18). Schwarzmann et al. noted a sharp increase of staphylococcal pneumonia during the influenza epidemic as compared to a non epidemic period. Remarkably, in the same study, they reported a similar percentage of diabetes as underlying disease in an epidemic (14%) and a non-epidemic (15%) period.

Influenza infection 24
Though the underlying high risk conditions may vary over years (rheumatic heart disease and poliomyelitis mentioned in earlier studies and pregnancy only during major epidemics) diabetes is reported in all studies with remarkable consistency. In recent studies cardiovascular disease is without doubt the most important risk factor, encountered in 20 - 40% of cases with influenza associated pneumonia, followed by chronic pulmonary disorder ( 1 0-25%) and diabetes ranking third (3-14%) (13,17,18).
Staphylococcus aureus
Secondary bacterial bronchopneumonia is one of the major complications in influenza infection (15,20-23). Hers and co-workers demonstrated that influenza virus can disrupt the respiratory epithelium extending to the alveoli, in this manner giving a free access of the invading staphylococci to alveoli and lungtissue (26-29). Several authors have reported antecedent staphylococcal skin lesions in patients with influenza and secondary staphylococcal pneumonia (28,30,31 ). Goslings et al. could correlate 55% of 57 cases of secondary staphylococcal pneumonia to preceding staphyloocccal skin infection in the patient or close relatives by phage typing. Overt lesions were the most common; furunculosis in the majority of the cases and further folliculitis, pyodermia and infected skin wounds (32).
Staphylococcal skin infections are frequently reported in patients with diabetes mellitus, especially in poorly controlled patients and patients with foot ulcers (33). Phagocytosis and intracellular killing ofS. aureus have been demonstrated to be decreased in patients with diabetes mellitus (34-36). Though decreased phagocytosis and intra-cellular killing seem to be related to poor metabolic control, Casey et al. found an impaired response of lymphocytes to S. aureus in both poorly and well controlled diabetic patients (37).

25 Chapter 2
Diabetic ketoacidosis
The incidence of ketoacidosis increases during winter months and is considered to be associated with respiratory infection (38,39). In addition to the patients mentioned above, ketoacidosis during influenza infection has been reported by several authors (40-42). Watkins et al. studying diabetic ketocacidosis during an influenza epidemic reported 29 cases over an eight week period. This was an exceptionally large number of cases since the annual number of patients admitted to their hospital with ketoacidosis each year was fewer than fourty; less than 1% of the 5000 patients with diabetes mellitis in the region. In six patients diagnosis of diabetes was first made on admission. Death rate in this group of29 patients was high; seven patients, approximately 25%, died. Aside from dehydration and ketoacidosis hypokalaemia was the most striking symptom on admission, leading to the death of three patients (42). Though abdominal symptoms in adults are virtually non-existent during influenza infection Watkins reports several patients with complaints of abdominal pain, nausea, anorexia and vomiting leading to dehydration in the days prior to admission (42). Rothbarth et al. describe the same symptoms in a 36-year old insulin dependent diabetic, and Leonard Thompson also suffered from anorexia, nausea and vomiting in the days preceding hospitalization ( 40,2). It cannot be excluded that the ketoacidotic state was at least partially responsible for the nausea and vomiting in these patients but the clinical course as described by the authors cited, suggests that nausea and vomiting occurred at the onset of influenza or soon thereafter, preceding symptoms of ketoacidosis with several days. Moreover, abdominal complaints as the only symptoms of serologically proven influenza infection are described in a patient with type 1 diabetes by Orchard et al (43).
Influenza vaccination
Antibody response to influenza vaccination in patients with diabetes mellitus has been found to be comparable to the response in control subjects in some studies ( 44,45) but an impaired humoral immune response was reported in two other studies ( 46,4 7).
Influenza infection 26
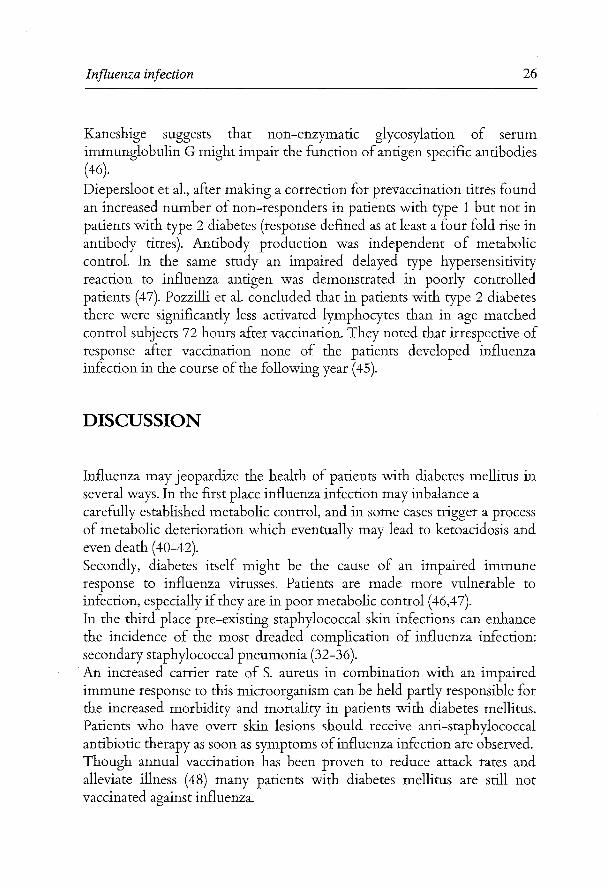
Kaneshige suggests that non-enzymatic glycosylation of serum immunglobulin G might impair the function of antigen specific antibodies (46).
Diepersloot et al., after making a correction for prevaccination titres found an increased number of non-responders in patients with type 1 but not in patients with type 2 diabetes (response defined as at least a four fold rise in antibody titres). Antibody production was independent of metabolic control. In the same study an impaired delayed type hypersensitivity reaction to influenza antigen was demonstrated in poorly controlled patients ( 4 7). Pozzilli et al. concluded that in patients with type 2 diabetes there were significantly less activated lymphocytes than in age matched control subjects 72 hours after vaccination. They noted that irrespective of response after vaccination none of the patients developed influenza infection in the course of the following year ( 45).
DISCUSSION
Influenza may jeopardize the health of patients with diabetes mellitus in several ways. In the first place influenza infection may inbalance a carefully established metabolic control, and in some cases trigger a process of metabolic deterioration which eventually may lead to ketoacidosis and even death (40-42). Secondly, diabetes itself might be the cause of an impaired immune response to influenza virusses. Patients are made more vulnerable to infection, especially if they are in poor metabolic control ( 46,4 7). In the third place pre-existing staphylococcal skin infections can enhance the incidence of the most dreaded complication of influenza infection: secondary staphylococcal pneumonia (32-36).
· An increased carrier rate of S. aureus in combination with an impaired immune response to this microorganism can be held partly responsible for the increased morbidity and mortality in patients with diabetes mellitus. Patients who have overt skin lesions should receive anti-staphylococcal antibiotic therapy as soon as symptoms of influenza infection are observed. Though annual vaccination has been proven to reduce attack rates and alleviate illness (48) many patients with diabetes mellitus are still not vaccinated against influenza.

27 Chapter 2
Physicians who deny the need for annual vaccination argue that the excess mortality from influenza in patients with diabetes mellitus dates back from earlier days when patients were not very well controlled. From their point of view there is no need for mass vaccination of patients who are nowadays mostly well controlled. In our opinion there is no reason for such optimism. In both clinical studies and studies on excess mortality diabetes mellitus is a remarkably constant risk factor over a long time. Though it is difficult to calculate reliable figures on relative risks and rates of excess mortality there is sound evidence to assume that in epidemic periods mortality in patients with diabetes mellitus increases by 5-15% (9,11). If one considers the enormous effort that is made to attain satisfying metabolic control and to fight the secondary complications of diabetes a single injection once a year to protect against influenza is not overdone. Aside from annual vaccination of all patients with diabetes mellitus (both type 1 and type 2) we propose that in patients with additional risk factors the response to vaccination be monitored with standard sero-logical methods (haemagglutination inhibition or single radial haemolysis). Patients that remain unprotected after vaccination should receive amantadine 200 mg a day during an eventual epidemic, which may protect against type A but not type B infection (49).
ACKNOWLEDGEMENT
We wish to thank professor N. Masurel and professor D.W. Erkelens for their critical remarks, mrs. R. van Moorsel for preparation of the manuscript and Beecham Nederland for conducting the literature search in the Medline database.

Influenza infection 28
References
1 Bliss M ( 1982). The discovery of insulin. Paul Harris Publishing, Edinburgh pp 242-243.
2 Burrow GN, Hazlett BE, Philips MJ ( 1982). A case of diabetes mellitus. N. Eng.J. Med. 306:340-343.
3 Sabin AB ( 1977). Mortality from pneumonia and risk conditions during influenza epidemics. ].A.M.A. 237:2823-2828.
4 Farr WIn: Vital statistics, London. Office of the sanitary institute 1885 p. 330-333
5 Dauer CC, Serfling RE ( 1961 ). Mortality from influenza. Am. Rev. Resp. Dis. 83:15-26.
6 Glezen WP, Payne AA, Snij der DN, Downs TD ( 1982). Mortality and influenza. J. In£ Dis. 146:313-321.
7 Polak MF (1959). Influenza mortality in the autumn of 1957. Ned. Tijdschr. Geneesk. 103:1098-1109.
8 Eickhoff ThC, Sherman JL, Serfling RE ( 1961 ). Observations on excess mortality associated with epidemic influenza. ].A.M.A. 176:776-782.
9 HousworthJ, Langmuir AD (1974). Excess mortality from epidemic influenza 1957-1966. Am.J. Epidemiol100:40-48.
10 Barker WH, Mullooly JP (1982). Pneumonia and influenza deaths during epidemics. Arch. Intern. Med. 142:85-89.
11 Stocks P (1935). The effect of influenza epidemics on the certified causes of death. Lancet 2:386-395.
12 Cameron AS, Roder DM, Esterman AJ, Moore BW. Mortality from influenza and allied infections in South-Australia during 1968-1981.
13 Barker WH, Mullooly JP (1981 ). Underestimation of the role of pneumonia and influenza in causing excess mortality. Am. J. Public Health 71:643-645.
14 Perotta DM, Decker M, Glezen WP (1985). Acute respiratory disease hospitalisations as a measure of impact of epidemic influenza. Am. J. Epidemiol 122:468-476.
15 Finland M, Peterson 0, Strauss E (1942). Staphylococcal pneumonia occuring during an epidemic of influenza. Arch. Intern. Med. 70:183-205.
16 PetersdorfRG, Fusco], Harter DH, Albrink WS (1959). Pulmonary infections complicating Asian Influenza. Arch. Intern. Med. 103:262-272.
17 Bisno AL, Griffin JP, VanEpps KA, Niell HB, Rytel MW (1971). Pneumonia and Hong Kong influenza: a prospective study of the 1968-1969 epidemic. Am. J Medical Sciences 261:251-263.
18 Schwarzmann S, Adler JL, Sullivan RJ, Marine WM( 1971 ). Bacterial pneumonia during the Hong Kong influenza epidemic of 1968-1969. Arch. Intern. Med. 127:1037-1041.
29 Chapter 2
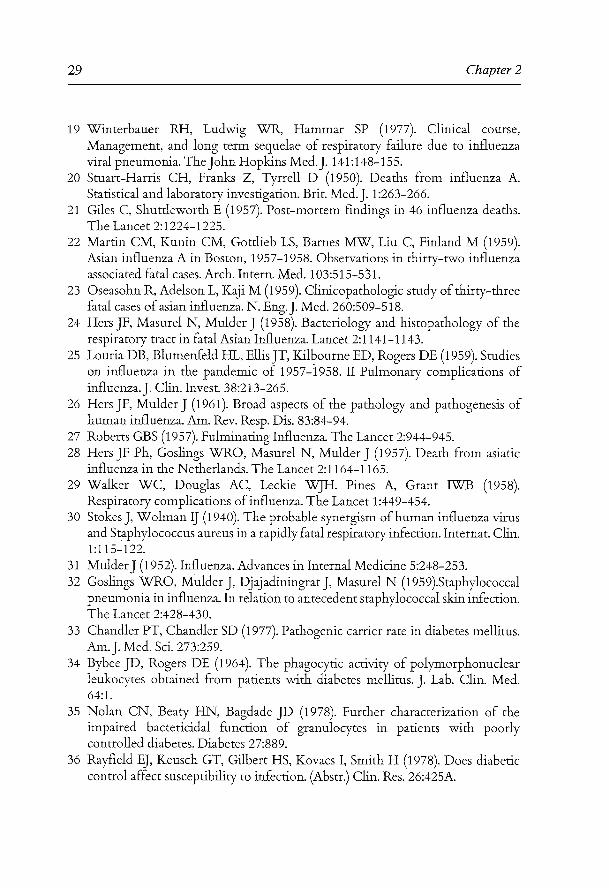
19 Winter bauer RH, Ludwig WR, Hammar SP ( 1977). Clinical course, Management, and long term sequelae of respiratory failure due to influenza viral pneumonia. The John Hopkins Med.J. 141:148-155.
20 Stuart-Harris CH, Franks Z, Tyrrell D (1950). Deaths from influenza A. Statistical and laboratory investigation. Brit. Med. J. 1:263-266.
21 Giles C, Shuttleworth E (1957). Post-mortem findings in 46 influenza deaths. The Lancet 2:1224-1225.
22 Martin CM, Kunin CM, Gottlieb LS, Barnes MW, Liu C, Finland M (1959). Asian influenza A in Boston, 1957-1958. Observations in thirty-two influenza associated fatal cases. Arch. Intern. Med. 103:515-531.
23 Oseasohn R, Adelson L, Kaji M (1959). Clinicopathologic study of thirty-three fatal cases of asian influenza. N. Eng. J. Med. 260:509-518.
24 Hers JF, Masurel N, Mulder J (1958). Bacteriology and histopathology of the respiratory tract in fatal Asian Influenza. Lancet 2:1141-1143.
25 Louria DB, Blumenfeld HL, Ellis JT, Kilbourne ED, Rogers DE (1959). Studies on influenza in the pandemic of 1957-i 958. II Pulmonary complications of influenza.]. Clin. Invest. 38:213-265.
26 Hers JF, Mulder J (1961). Broad aspects of the pathology and pathogenesis of human influenza. Am. Rev. Resp. Dis. 83:84-94.
27 Roberts GBS (1957). Fulminating Influenza. The Lancet 2:944-945. 28 Hers JF Ph, Goslings WRO, Masurel N, Mulder J (1957). Death from asiatic
influenza in the Netherlands. The Lancet 2:1164-1165. 29 Walker WC, Douglas AC, Leckie WJH Pines A, Grant IWB (1958).
Respiratory complications of influenza. The Lancet 1:449-454. 30 Stokes], Wolman IJ (1940). The probable synergism ofhuman influenza virus
and S~aphylococcus aureus in a rapidly fatal respiratory infection. Internat. Clin. 1:115-122.
31 Mulder J (1952). Influenza. Advances in Internal Medicine 5:248-253. 32 Goslings WRO, Mulder J, Djajadiningrat J, Masurel N (1959).Staphylococcal
pneumonia in influenza. In relation to antecedent staphylococcal skin infection. The Lancet 2:428-430.
33 Chandler PT, Chandler SD (1977). Pathogenic carrier rate in diabetes mellitus. Am.]. Med. Sci. 273:259.
34 Bybee JD, Rogers DE (1964). The phagocytic activity of polymorphonuclear leukocytes obtained from patients with diabetes mellitus. ]. Lab. Clin. Med. 64:1.
35 Nolan CN, Beaty HN, Bagdade JD (1978). Further characterization of the impaired bactericidal function of granulocytes in patients with poorly controlled diabetes. Diabetes 27:889.
36 Rayfield FJ, Keusch GT, Gilbert HS, Kovacs I, Smith H (1978). Does diabetic control affect susceptibility to infection. (Abstr.) Clin. Res. 26:425A.

Influenza infection 30
37 Casey JL, Heeter BJ, Klyshevich KA (1977).Impaired response oflymphocytes of diabetic patients to antigen of Staphylococcus aureus.J. In£ Dis.136:495-496.
38 Fitzgerald MG, O'Sullivan DJ, Malins JM ( 1961 ). Fatal diabetic ketosis. British Med.J. 1:247-250.
39 Sheldon J, Pyke DA. In Clinical Diabetes ed. W.G. Oakley, DA. Pyke, K.W. Taylor, Oxford, Blackwell Scientific p. 420 1968
40 Rothbarth PhH, Beyer WEP, Masurel N (1983). Influenza: Prevention is better than cure. Ned. Tijdschr. Geneesk. 127:1753-1754.
41 Tahen KT (1970). The influenza epidemic. British Med.J. 1:429-430. 42 Watkins PJ, Soler NG, Fitzgerald MG, MalingJM ( 1970). Diabetic Ketoacidosis
during the influenza epidemic. British Med. J. 4:89-91.
43 Orchard TJ, Becker DJ, Atchison RW, LaPorte RE, Wagener, Rabin BS, Kuller LH, Drash AL (1983). The development of type 1, (insulindependent) diabetes mellitus: two contrasting presentations. Diabetologia 25:89-92.
44 Feery BJ, Hartman LJ, Hampson A W, Proietto J (1983). Influenza immunization in adults with diabetes mellitus. Diabetes Care 6:475-478.
45 Pozzilli, Gale W AM, Visalli N, Baroni M, Crovari P, Frighi V, Cavallo MG, Andreani D ( 1986). The immune response to influenza vaccination in diabetic patients. Diabetologia 29:850-854.
46 Kaneshige H (1987). Nonenzymatic glycosylation of serum IgG and its effect on antibody activity in patients with diabetes mellitus. Diabetes 36:822-828.
47 Diepersloot RJA, Bouter KP, Beyer WEP, Hoekstra JBL, Masurel N (1987). Humoral immune respons and delayed type hypersensitivity to influenza vaccine in patients with diabetes mellitus. Diabetologia 30:397-401.
48 Eickhoff TC ( 1971 ). Immunisation against influenza: rationale and recommendations. J. Infect. Dis. 123:446-454.
49 Monto AS, Gunn RA, Bandyk MG, King CL (1979). Prevention of Russian influenza by amantadine J.A.MA. 241:1003-1007.

31 Chapter3
Chapter 3
Effect of epidemic influenza on ketoacidosis, pneumonia and death in diabetes mellitus
A Hospital Register Survey of 19 7 6-19 79 in The Netherlands
KP Bouter (1), IgA Diepersloot (2), LKJ van Romunde (3), R Uitslager (3), N Masurel (2),JBL Hoekstra (4) and DW Erkelens (1).
1. Department oflnternal Medicine, University Hospital Utrecht. 2. W.H.O. Influenza Centre, Erasmus University Rotterdam. 3. Dutch centre for health care information. 4. Department of Internal Medicine, Diakonessen Hospital Utrecht, The
Netherlands.
Submitted for publication.

Epidemic influenza 32
3.1 Introduction
In the past studies on excess mortality due to influenza infection have highlighted diabetes as one of the major risk factors. These studies indicated that diabetes is a very constant risk factor over several decades and that during more intense epidemics death rates among patients with diabetes mellitus increased by 5-15% ( 1-4 ). In recent studies attention has been drawn to cardiovascular and respiratory diseases as the two most important causes for influenza death (5-7). Consequently, the U.S. Immunisation Advisory Committee has attributed patients with diabetes mellitus to the moderate medical risk group, and mentioned them between brackets, while classifying cardiovascular and respiratory disease as "greatest" medical risk (8). This, and the apparent paucity of data on influenza infections in patients with diabetes mellitus may reinforce the notion of some diabetologists that influenza associated morbidity and mortality is something of the past and that it was due to relatively bad control. We addressed the question of impact of epidemic influenza on diabetic ketoacidosis, pneumonia and death by surveying the cumulative Dutch hospital records for the first three months of 1976-1979. These years were chosen since a well defined influenza epidemic occurred during week 2-13 in 1978 and during week 9-17 in 1976, while in 1977 and 1979 no such epidemic was observed.
3.2 Methods
3.2.1 Influenza registration
Information on the weekly incidence of influenza like illnesses was obtained from the Continuous Morbidity Registration (C.M.R.) in The Netherlands. The C.M.R. was founded in 1970 by the Dutch Institute for General Practice and the Dutch Health Organisation. It registrates morbidity due to many illnesses like mononucleosis infectiosa, measles, myocardial infarction and for instance influenza. The registration method is based on data collected by 60 general practitioners randomly distributed throughout the country.

33 Chapter 3
They provide the primary health care for 160.000 individuals, approximately 1.2 percent of the total Dutch population representing all regions and grades of urbanization (9). Data were collected on the number of patients with an influenza like illness per 10.000 inhabitants during the first 13 weeks of 1976, 1977, 1978 and 1979.
3.2.2 Registration ofhospital admissions
Data on hospitalizations were obtained from the Dutch National Medical Registration. This registration system collects discharge records of approximately 95% of all hospitalizations in short-stay hospitals in The Netherlands. The records provide data on primary and secondary diagnosis according to the International Classification of Diseases (8th revision, Clinical Modification). Data of all records are stored on magnetic tape and are ready for computerized analysis. The data for this study were collected at weekly intervals during week 1-13 of 1976, 1977, 1978 and 1979. The record of a hospitalized patient was included if diabetes mellitus appeared as the primary or secondary diagnosis in the discharge summary (code 250). To determine relative risks for hospitalization because of influenza cq pneumonia, patients with duodenal ulcer (code 532) recorded as primary or secondary diagnosis in the discharge summary were included as a control population. This was done in order to correct for the possibility that patients with diabetes mellitus are hospitalized for diabetes per se and that therefore diseases such as influenza are overestimated, the so-called Berkson-bias (1 0). A patient was considered having influenza during hospitalization when the admission code or the discharge letter stated "influenza".
3.2.3 Statistical analysis
Relative risks were calculated using the data of the Statistical Program for Social Sciences (SPSS). Adjustments were made for age and sex. The relative risk, which is the ratio of the two observed cumulative incidences of the diagnosis under study in the disease and control patient

Epidemic influenza 34
groups, is calculated according to the following formula:
Diagnosis i
total group of diabetes mellitus RRi=-----------
Diagnosis i
total group of ulcus duodeni
where RRi stands for relative risk for influenza in diabetes and R for risk of influenza in the control population. Relative risks are presented as absolute figures without confidence intervals since the data were not collected from a random sample but from the entire population. · Differences in quantative measures were tested for significance by the chisquare test. Chi-square analysis was interpreted using standard tables of the distribution of the chi-square statistic.
3.3 Results
3.3.1 Influenza infections
An increase in the number of influenza infections was observed in 1976, 1977 and 1978. No substantial rise in the number of influenza like illnesses was recorded in 1979 (figure 1 ). The influenza epidemic in 1976 started in week 6 and reached its peak six weeks later when 68 patients with influenza infections per 10.000 inhabitants were reported. The epidemic ended in week 17. This epidemic was caused by an A/Victoria/3/7 5 (H3N2) like influenza strain, which was prevalent in The Netherlands at that time. In 1977 the number of influenza like illnesses reported to the C.M.R. started to rise in week 5 and gradually rose to ca. 40 per 10.000 inhabitants in week 9 and 10.

35 Chapter 3
Influenza
hospitalizations influenza
c:::J ~ - ~ '76 '77 '78 '79 '7Cl '77 '78 '79
15 125
"' ....::.:: ..... t:: <ll (':! <ll
100 ..... ~ .....
----..0
"' (':!
t:: ...c .s: 10 .5 ..... (':!
75 0
N 0 ..... 0 "; 0 ..... ....... ·a. ----(':!
"' N 0 50 t:: ...c <ll ;..; 5 ~- :I <ll t:;:::
..0 .5 E 25 ;..;
:I <ll t:: ..0 E :I t::
0 0 0 2 4 6 8 10 12
weeks
Figure 1 In this figure the number of patients with diabetes mellitus who were hospitalized during week 1-13 in the four years of the study period is shown. During these years an influenza epidemic appeared in week 5-9 of 1978 and week 9-17 of 197 6. An elevation of reported influenza infections is also noted in 1977. The relation between the numbers of hospitalization for influenza and the number of patients with influenza during week 5-9 of 1978 is clear. In 1976 during week 9-13 there is an increase number ofhospitalizations just before the epidemic period.

Epidemic influenza 36
The 1978 epidemic was caused by a completely new influenza A virus; N USSR/92/77 (H1N1 ). Similar influenza A subtypes had been observed previously from 1946 till 1957. The new pandemic of 1978 affected children and adolescents in particular. Most individuals born before 1946 were at least partly protected by antibodies induced by previous infections. As shown in figure 1 the 1978 epidemic in The Netherlands was most intense during weeks 5-9, with a peak incidence of 107 resp. 100 influenza like illnesses per 10.000 inhabitants reported in week 6 and week 7.In the absence of accepted standard definitions we arbitrarily choose for the purpose of this study to define an influenza epidemic as a period in which the number of influenza like illnesses reported to the C.M.R. rose above the number of 50 per 10.000 inhabitants. According to this definition there were two epidemic periods in the study period; 1976 (week 6-16) and 1978 (week 2-13).
3.3.2 Relative risks
Relative risks for patients with diabetes mellitus to be hospitalized were calculated for influenza or pneumonia as primary diagnosis and for the risk to die during hospitalization. Relative risks for hospitalization (table 1) because of influenza infection was 1.1. and 1.0 for the two non-epidemic years 1977 and 1979 respectively. In the years in which influenza was epidemic, 1976 and 1978, patients with
Table 1 Relative risks for patients with diabetes mellitus to be hospitalized with influenza, with pneumonia or to die during hospitalization. Influenza epidemics occurred in 197 6 and 1978. The relative risk is calculated for patients with diabetes versus patients with duodenal ulcer (for further explanation see text).
Year Influenza Pneumonia Death
1976 5.7 25.6 42.4 1977 1.1 20.3 30.9 1978 6.2 25.6 91.8 1979 1.0 15.8 31.8

37 Chapter 3
diabetes mellitus were far more likely to be hospitalized with influenza infection (relative risk 5.7 and 6.2). Patients with diabetes mellitus had a considerably increased risk to be hospitalized for pneumonia. The highest relative risk was noted in epidemic years (1976,1978): 25.6. The difference was even more pronounced for death during hospitalization. The relative risk for patients with diabetes mellitus rose from 30.9 in 1977 to a staggering 91.8 in 1978. Since no adequate control population is available for patients who are hospitalized for diabetic acidosis, relative risks were calculated for 1978 as the year with the most intense epidemic, in comparison with the other years in this study period. In comparison with the year 1976 the relative risk appeared to be 15.9. For the years 1977 and 1979 the relative risks were calculated to be 13.2 resp. 17.1.
3.3.3 Absolute risks
The number of patients with diabetes mellitus who were hospitalized during week 5-9 in the four years of the study period, because of influenza,
Table 2 In this table the number of patients with diabetes mellitus who where hospitalized or died during hospitalization in weeks 5-9 of 1976-1979 because of influenza, pneumonia or diabetic acidosis is shown.
Year
1976 1977 1978 1979
Influenza epidemics occurred during 1976 and 1978. Note the more severe clinical course in the epidemic years as indicated by the higher relative mortality from pneumonia and acidosis.
Influenza Pneumonia Acidosis Hospitalized: died (%) Hospitalized: died (%) Hospitalized: died (%)
2:0 83:20 (24.1)* 96 : 24 (25)** 6:0 46: 6(13.0) 96: 11 (11.5)
30 : 1 (3.3) 139 : 37 (26.6)* 152: 39 (25.7)** 2:0 57: 9 (15.8) 91:18 (17.8)
* different from non-epidemic years, P<0.05 ** different from non-epidemic years, P<O.O 1

Epidemic influenza 38
Pneumonia
c=J '76 ~'77 -'78 ~'79
50
~ Q)
40 Q)
~ "' :: 0 .... .... 30 ~
.!:: "'; .... ....
Q... 20 "' 0 ...= lo< Q)
1 10 ::
~ i l ::
~ [ 0
0 2 4 6 8 10 12
weeks
Figure 2 In this figure the number of patients with diabetes mellitus who were hospitalized during the first 13 weeks of the four years of study period is shown. The number ofhospitalization for pneumonia were highest during the two epidemic years ( 197 6 and 1978).
pneumonia and/ or diabetic acidosis are presented in table 2. Cumulative data on the first 13 weeks are presented in figure 1-3. As to be expected the number of hospitalizations for influenza infection during week 5-9 were highest in 1978. For pneumonia and diabetic acidosis the number of hospitalizations are almost equal for the years 1977 and 1979 despite the increase in influenza infections reported to the C.M.R. in 1977. In 1978 the number of hospitalizations for pneumonia is more than twice

39 Chapter 3
Diabetic Acidosis or Coma
[=:J '76 ~'77 -'78 W//d '79
50
~ Ill Ill 40 ~ '-
"' ;::: 0 ..... ....
30 ~ N ..... -~ .... ..... ;:l.;
"' 20 0 ...c::
;..., Ill
,.0
E 10 :I
= I 0 "" 0 2 4 6 8 10 12
weeks
Figure 3 In this figure de number of patients with diabetes who were hospitalized during the first 13 weeks of the four years of the study period is shown. The number of hospitalization for ketoacidosis seems to increase in 1978 during week 5-9 in which influenza is epidemic.
that in 1977 and 1979 and for diabetic acidosis the number of hospitalizations increases with 50% in comparison with the other three years (table 2). Remarkably the percentage ofhospitalization for both pneumonia and diabetic acidosis which had a lethal outcome was substantially higher in epidemic (1976 and 1978) than in non-epidemic years (1977 and 1979). During the two epidemic years together, 25,7% of the patients hospitalized for pneumonia died, while in the non-epidemic years 14,6% of the hospitalizations ended in death (p<O.OS).

Epidemic influenza 40
Differences in mortality due to diabetic acidosis are similar; 25,4% in epidemic and 14,7% in non-epidemic years (p<0.05, percentages calculated as geometric mean for 1976 + 1978 resp. 1977 + 1979). The mortality for all patients (irrespective of underlying condition) hospitalized because of pneumonia was 12.1, 11.4, 10.6 and 10.0% for the four consecutive years. During the study period there were approximately 180.000 patients with diabetes mellitus in The Netherlands, 40.000 of them suffering from insulin dependent diabetes mellitus (IDDM) (11 ). From these figures it can be calculated that one out of every 1300 patients with diabetes mellitus was hospitalized because of pneumonia during the 1978 epidemic (week 5-9). Diabetic acidosis is almost exclusively restricted to patients with IDDM. It can therefore be estimated that 1 of every 260 patients with IDDM was hospitalized for acidosis and that 1 out of 1000 patients with IDDM died during hospitalization.
3.4 Discussion
From the results presented in this study it can be concluded that during epidemic years patients with diabetes mellitus are about 6 times more likely to be hospitalized with a diagnosis of influenza than age- and sex-matched controls. Although this seems to be convincing evidence that there actually is an increased risk for influenza associated morbidity, these pure data by themselves do not seem alarming. It is the influence that influenza has on relative risks for hospitalization because of pneumonia and on the overall mortality that makes it clear how dangerous influenza is in patients with diabetes mellitus. The relative risk to die during hospitalization, already high in non-epidemic years, rises to over 90 in 1978, when a new influenza A virus emerges. These figures may be astonishing but are in perfect agreement with the results presented by Barker and Mullooly (6). They estimated relative risks of pneumonia and influenza associated mortality in persons older than 45 years when one underlying condition and two underlying conditions were present to be 39 and 202 times that for persons without underlying disease respectively. In previous studies on bacterial pneumonia it has been demonstrated that patients with diabetes mellitus fared less well than those without underlying

41 Chapter 3
chronic disease (11-13). This increased mortality from bacterial pneumonia may be due to metabolic dysregulation and to an impaired immune response to bacterial pathogens, in particular a decreased intracellular killing activity of polymorphonuclear leukocytes ( 14, 15). During influenza epidemics patients with diabetes mellitus will be even more endangered, not only because of the apparent impaired immune response to the influenza virus ( 16) but even more by staphylococcal pneumonia. Patients with diabetes mellitus are known to have an increased rate of S.aureus skin infection ( 1 7), which has been demonstrated in the past to be a major risk factor for the development of secondary staphylococcal pneumonia (18). This may at least partially explain why in patients with diabetes mellitus a significant increase in mortality from pneumonia was observed during the epidemic years (14.6% for non-epidemic vs. 25% for epidemic years, p<0.05). The incidence of diabetic acidosis increases during winter months and has been associated with respiratory infection (19,20). A well documented influenza associated epidemic of diabetic ketoacidosis has been described by Watkins et al in 1970 (21). They mentioned that the death rate in this epidemic was extremely high; 7 out of 29 patients, approximately 25%, died. This is the same mortality rate that is recorded during epidemic years in our study. Mortality was significantly higher than in the non-epidemic years (14.7%). To our knowledge this is the first study in which an increase in relative mortality due to pneumonia and diabetic acidosis during epidemic influenza has been statistically documented in patients with diabetes mellitus. As the main conclusion it can be stated that influenza associated risks in patients with diabetes mellitus are indeed very high. We suggest that in official recommendations for influenza vaccination patients with diabetes mellitus, as is common practice for patients with cardiovascular and chronic pulmonary diseases, be mentioned as a separate risk group. The objective to vaccinate at least 80% of patients within the highest risk group should be extended to patients with diabetes mellitus.

Epidemic influenza 42
3.5 Acknowledgements
This study was funded by a grant from Duphar Nederland (Amsterdam, The Netherlands). We wish to thank Drs. F. Nauta for his advice, Mr. R.P. V erkooyen for his assistance in making the figures and Mrs. R. van Moorsel for preparation of the manuscript.

43 Chapter 3
References
1. Polak MF Influenza mortality in de herfst van 1957. N.T.v.G. 103:1098-1109, 1959.
2. Stocks P. The effect of influenza epidemics on the certified causes of death. Lancet 2:386-395, 1935.
3. Eickhoff ThC, Sherman JL, Serfing RE. Observations on excess mortality associated with epidemic influenza. ].A.M.A. 176:776-782, 1961. .
4. Housworth J, Langmuir AD. Excess mortality from epidemic influenza 1957-1966. AmJEpidemioL 100:40-48, 1974
5. Alling DW, Blackwelder WC, Stuart-Harris CH. A study of excess mortality during influenza epidemics in the United States, 1968-197 6. AmJ EpidemioL 113:30-43, 1981.
6. Barker WH, Mullooly JP. Pneumonia and influenza deaths during epidemics. Arch.Intern.Med. 142:85-89, 1982.
7. Glezen WP, Decker M, Perrotta DM. Survey of underlying conditions of persons hospitalized with acute respiratory disease during influenza epidemics in Houston, 1978-1981. Am.Rev.Resp.Dis. 136:550-555, 1987.
8. Centers for Disease ControL Prevention and control of influenza. Recol1111lendations of the Il1111lunisation Advisory Committee. Ann.lntern.Med 1987.
9. Dutch institute for General Practice. Continous Morbidity Registration. Boijinga BV, Apeldoorn 1978-1979.
10. Limitations of the application of fourfold table analysis to hospital data. Biometrics Bull 2:4 7-53, 1946.
11. Dutch Diabetic Associaton. Inquiry (not published) 1980.
12. Austrian R, Gold J Pneumococcal bacteremia with especial reference to bacteremic pneumococcal pneumonia. Ann.Intern.Med. 60:759-761, 1974.
13. Mufson MA, Kruss DM, WasifRF, Metzger WI. Capsular types and outcome ofbacteremic pneumococcal disease in the antibiotic era. Arch.Intern.Med. 134:505-508, 197 4.
14. Rayfield EJ, Ault NJ, Keusch GT. Infection and diabetes: The case for glucose controL AmJ.Med. 74:439-450, 1982.

Epidemic influenza 44
15. Nolan CM, Beaty HN, Bagdade JD. Further characterization of the impaired bactericidal function of granulocytes in patients with poorly controlled diabetes. Diabetes 27:889-894, 1978.
16. Diepersloot RJA, Bouter KP, Hoekstra JBL, Masurel N. Humoral immune response and delayed type hypersensitivity to influenza vaccine in patients with diabetes mellitus. Diabetologia 30-397-401, 1987.
17. Chandler PT, Chandler SD. Pathogenic carrier rate in diabetes mellitus. AmJ.Med.Sc. 273:259-265, 1977.
18. Gosling WRO, Mulder J, Djajadiningrat J, Masurel N. Staphylococcal pneumonia in influenza. Relation to antecedent staphylococcal skin infection. Lancet 2:428-430, 1959.
19. Fitzgerald MG, 0 Sullivan DJ, MalingJM. Fatal diabetic keto-acidosis. Br.MedJ. 1:247-250, 1961.
20. Sheldon J, Pyke DA. In: Clinical Diabetes. Oakley WG, Pyke DA, Taylor KW. Blackwell Scientific Publishers Oxford, UK. p420 1968.
21. Watkins PJ, Soler NG, Fitzgerald MG, Maling JM. Diabetic Ketoacidosis during the influenza epidemic 1970. Br.MedJ 4:89-91, 1970.

45 Chapter4
Chapter 4
Humoral immune response and delayed type hypersensitivity to influenza vaccine in patients with diabetes mellitus
IqA Diepersloot (1), KP Bouter (2), WEP Beyer (l),JBL Hoekstra (2) and N. Masurel (1).
1. Department of Virology and WHO Influenza Centre, University Hospital Dijkzigt, Rotterdam.
2. Department of Internal Medicine, Diakonessen Hospital, Utrecht, The Netherlands.
Published in Diabetologia 1987; 30:397-400.
Influenza vaccination 46
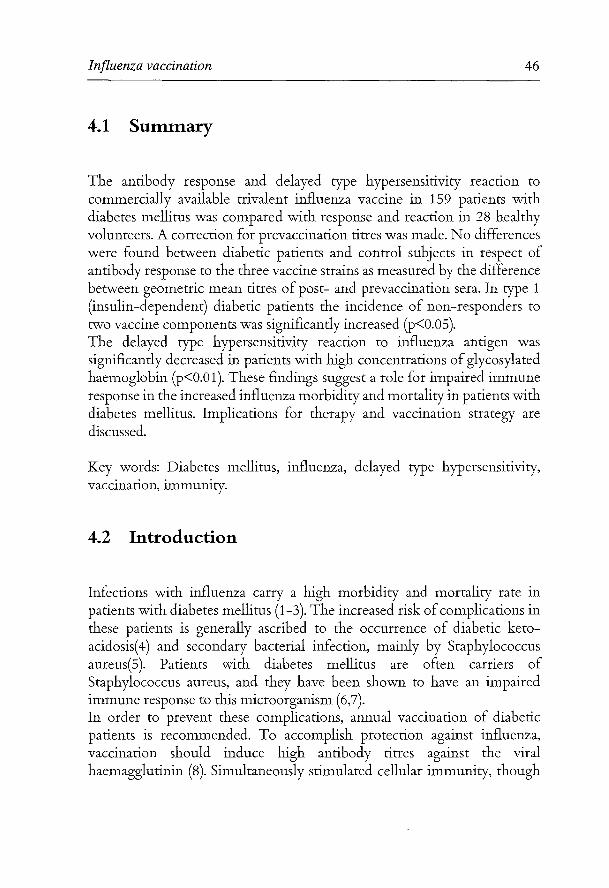
4.1 Summary
The antibody response and delayed type hypersensitivity reaction to commercially available trivalent influenza vaccine in 159 patients with diabetes mellitus was compared with response and reaction in 28 healthy volunteers. A correction for prevaccination titres was made. No differences were found between diabetic patients and control subjects in respect of antibody response to the three vaccine strains as measured by the difference between geometric mean titres of post- and prevaccination sera. In type 1 (insulin-dependent) diabetic patients the incidence of non-responders to two vaccine components was significantly increased (p<O.OS). The delayed type hypersensitivity reaction to influenza antigen was significantly decreased in patients with high concentrations of glycosylated haemoglobin (p<O.O 1 ). These findings suggest a role for impaired immune response in the increased influenza morbidity and mortality in patients with diabetes mellitus. Implications for therapy and vaccination strategy are discussed.
Key words: Diabetes mellitus, influenza, delayed type hypersensitivity, vaccination, immunity.
4.2 Introduction
Infections with influenza carry a high morbidity and mortality rate in patients with diabetes mellitus (1-3). The increased risk of complications in these patients is generally ascribed to the occurrence of diabetic ketoacidosis( 4) and secondary bacterial infection, mainly by Staphylococcus aureus(S). Patients vvith diabetes mellitus are often carriers of Staphylococcus aureus, and they have been shown to have an impaired immune response to this microorganism (6,7). In order to prevent these complications, annual vaccination of diabetic patients is recommended. To accomplish protection against influenza, vaccination should induce high antibody titres against the viral haemagglutinin (8). Simultaneously stimulated cellular immunity, though

47 Chapter4
not protective, might contribute to the recovery from infections with influenza viruses (9). Poor antibody response to influenza vaccination has been demonstrated in various risk groups, such as renal transplant patients (10), patients with malignant diseases (11,12) and in the aged (13). In order to evaluate the immune response to influenza antigen in both type 1 and type 2 diabetic patients we studied the antibody production and delayed type hypersensitivity reaction after vaccination with a trivalent influenza vaccine.
4.3 Subjects and methods
4.3.1 Subjects
Patients studied were attending the outpatient clinic of the Department of Internal Medicine of the Diakonessen Hospital, Utrecht, The Netherlands. Patients were considered to be type 1 if there had been documented ketoacidosis and/ or abrupt onset of symptoms requiring insulin therapy at age < 40 years and type 2 if there had been protracted treatment with diet or oral therapy at age> 40 years. The study population consisted of 27 patients with type 1 diabetes mellitus, 18 men and 9 women (mean age 39.3 ±13.6 years, mean duration of disease 16.5 ± 14.0 years) and 120 patients with type 2 diabetes mellitus, 51 men and 69 women (mean age 65.3 ± 10.0 years, mean duration of disease 10.3 ±7.1 years). Among 12 patients, 5 men and 7 women (mean age 61.9 ±7.4 years) the type of diabetes was unknown. In type 1 diabetic patients, 5 had known cardiovascular complications, 3 were treated for retinopathy, and 1 had marked neuropathy. Among type 2 patients 37% had an overweight of more than 10%, and 25% had major cardiovascular complications. Retinopathy was diagnosed in 16% and neuropathy in 13% of type 2 diabetic patients. Control subjects were 28 healthyvolunteers,13 men and 15 women (mean age 50.8 ± 17.0 years). Participants were excluded if they were allergic to egg protein or when febrile on the day of vaccination. Written consent was obtained from all participants and approval for the study was obtained from the Ethical Committee of the University Hospital Dijkzigt.

Influenza vaccination 48
4.3.2 Vaccine: dosage and administration
Trivalent purified whole virus influenza vaccine (Duphar-Nederland, Amsterdam, The Netherlands) containing 10 [tg haemagglutinin (HA) N Philippines/2/82 (H3N2), 10 [tg HANChile/1/83 (H1N1) and 15 g HAB/ USSR/1 00/83 was administered in 0.5 ml doses intramuscularly in the upper arm. To induce a delayed type hypersensitivity reaction, an 0.1 ml dose of the same vaccine (diluted 1:1 with phosphate buffered saline) was inoculated into the skin of the volar aspect of the forearm.
4.3.3 Laboratory investigations and calculations
Blood samples were obtained prior to administration of vaccine and again 14 days later. Sera were separated immediately after blood collection and clotting and stored at -20 degrees C until titration. Influenza strains were propagated in embryonated hen's eggs. Because of the low avidity of the influenza B virus, infectious egg fluids of this strain were treated with aether according to Berlin et al. (14) and the watery phase was used in the serologic tests. Serum haemagglutination inhibition (HI) titres were determined twice by standard methods ( 15) simultaneously in pre- and post vaccination sera. Titres were expressed as reciprocals of the dilution showing 50% haemagglutination inhibition with 3 haemagglutination units of the antigen. From the results of the two determinations per serum and per antigen, the geometric means were used for further calculations. Negative titres (<9) were arbitrarily regarded as 5. With the method used, protection against influenza is thought to be associated with an HI titre of 100 for influenza A (8). No protection threshold is known for aether-treated influenza B strains. For this study an HI titre of 1 00 was assumed to be protective. Among patients and control subjects, those with prevaccination titres above 100 were excluded separately for each antigen. The serologic response upon vaccination was expressed using the following criteria:
- the response rate (i.e. the proportion of subjects with a 4-fold or greater titre increase after vaccination);

49 Chapter4
- the protection rate (i.e. the proportion of subjects exceeding the threshold titre of 100 after vaccination);
- the mean fold increase (i.e. the difference between the logarithmated geometric mean titres of post- and prevaccination sera).
4.3.4 Glycosylated haemoglobin
The percentage of glycosylated haemoglobin (HbA1c) on the day of vaccination was determined by a commercially available column test (Bio Rad Laboratories, Richmond, Cali£, USA). In short: a small quantity of whole blood is mixed with a haemolysis reagent. An aliquot of the haemolysate is then applied to a weakly acidic cation exchange resin in a disposable column. The HbA1a and HbAl b fractions are first eluted by adding a buffer. The HbAl c fraction is then eluted separately by adding a second dilution/developing reagent. The relative percentage concentration ofHbA1c is determined spectrophotometrically.
Delayed type hypersensitivity reaction (DTHR)
DTHR was read after 24 hours. Quantification of the test was achieved by calculating the area of induration as the product of two diameters at right angles. Diameters were measured as described previously by Sokal ( 1 7).
4.3.5 Statistical analysis
Data are presented as mean± SD. Differences in qualitative measures were tested for significance by the chi-square test, and in quantitative measures by the Wilcoxon rank test.

Influenza vaccination 50
4.4 Results
4.4.1 Seroresponse
The outcome of the serologic determinations was calculated for type of diabetes mellitus and for the therapeutic regimen. Results are presented for the three vaccine strains separately in Tables 1-3. Although patients with type 1 diabetes and those with type 2 diabetes treated with a diet only tended to have lower antibody responses after vaccination as compared to control subjects, differences in mean fold increase were not statistically significant. The established protection rate was high for the H3N2 strain (Table 1), reaching 90% in control subjects and 85% in patients. Protection rates for the other two vaccine components, however, were considerably lower: 66 and 64% for H1N1 and 50 and 57% for the influenza B strain (control subjects and patients, respectively) (table 2,3). Differences were not statistically significant. In comparison with control subjects, the incidence of patients showing a 4-fold or greater titre rise was substantially lower in type 1 diabetes for the H3N2 and influenza B vaccine components ( 100 vs 78% and 80 vs 44%, respectively, p<O.OS). A significantly lower incidence of patients with a 4-fold or greater titre increase to the influenza B strain was also shown for patients treated with insulin, a major part of whom had type 1 diabetes (46 vs 80% in control subjects, p<0.01).
For patients treated with a diet only, the incidence of patients with a 4-fold or greater titre increase was significantly lower for the H3N2 component (78 vs 100% in control subjects, p<O.OS). There was no correlation between antibody production or response rate and the concentration ofHbA1c.
4.4.2 Delayed type hypersensitivity reaction (DTHR)
In order to establish a correlation between the DTHR and the metabolic state, all 159 patients were divided into two groups according to the concentration of glycosylated haemoglobin: HbA1c% 4-6.5 (within normal limits), and> 6.5.

51 Chapter4
The largest induration was demonstrated in control subjects: 360mm (246). In patients with HbA1 c values within normal limits (HbA1 c % < 6.5) the DTHR was similar to that in control subjects. In comparison with control subjects, the DTHR in patients with an HbA1c % > 6.5 was significantly decreased (p<O.O 1 ). Results are shown in figure 1.
4.5 Discussion
From a previous study it was concluded that patients with well controlled diabetes mellitus respond normally to influenza immunization. The population studied, however, was small and prevaccination titres were considerably higher in control subjects, for which no correction was made (18). In the present study a correction was included for prevaccination titres and it is shown that at least in patients with type 1 diabetes, there is an increased incidence of non-responders to two of the three vaccine components. Humoral immune response to influenza vaccination has been shown to be impaired in the elderly (13), however, as controls subjects (mean age 50.8 ± 17.0 years) are older than type 1 diabetic patients (mean age 34.3 ± 13.6 years), age cannot be held responsible for the increased incidence of non-responders among type 1 patients. Antibody formation against the influenza antigen is a T -cell dependent phenomenon. In experimental animals the humoral immune response is impaired if the helper effect ofT -cells is lacking (19). In patients with type 1 diabetes T -cell depletion has recently been demonstrated (20). This may explain the increased incidence of non-responders to influenza antigen, while antibody response to pneumococcal polysaccharide, which may proceed independent from T -cell help, is not decreased ( 21 ). The number of patients unable to acquire a protective antibody level against the influenza B and H1N1 vaccine components is substantial. This is an important outcome, considering the high incidence of other risk factors, such as cardiovascular diseases, especially in elder diabetic patients. Barker and Mullooly ( 1) showed that influenza mortality is highest in patients who have cardiovascular disease in combination with either diabetes or chronic pulmonary disease. Therefore, a booster immunization after at least four weeks seems to be advisable in patients with diabetes mellitus. However,

Influenza vaccination 52
results ofbooster vaccination in other risk groups are disappointing (1 0, 22). Decreased DTHR to candida in diabetic patients has been demonstrated previously (23). In the same study no decreased DTHR was found for a viral antigen (mumps). Mahmoud et al. (24) showed that decreased cellular hypersensitivity in diabetic mice could be restored with insulin treatment. Our :findings of a decreased DTHR in patients with high HbAl c values and not in patients with HbAl c values within normal limits suggest that optimal regulation might restore the DTHR in humans. The function ofT -cells which mediate the DTHR in influenza infections is not clear. In mice these cells were found in the lungs after infection with an influenza A virus, the concentration of cells being correlated with the amount of virus administered (25). For recovery from the infection, however, the cytotoxic T -cell and natural killer cell are probably more im.portant (9). Until now it was assumed that the main risks of influenza infection in patients with diabetes mellitus lie in the occurrence ofketoacidosis (4) and secondary bacterial infection (5). From this study it can be concluded that impaired immune response to the influenza virus itself may contribute to increased morbidity and mortality.
4.6 Acknowledgments
This study was funded by a grant from Duphar-Nederland (Amsterdam, The Netherlands). We wish to thank Mr. R. van Beek and Mr. H. van Driel for technical assist~nce, Pro£Dr. D.W. Erkelens for comments and Mrs. R.S. Engels-Bakker for preparation of the manuscript.

53 Chapter4
1000
--- 800 "' E E .._ ct! 600 (!) .., ct!
* ;::: 0
.J-00 ...... "'"' ct!
• .., ::
""C:I ;::: ?.00 ....,
0 fll Control Group I Group II
Figure 1 Mean area of induration after inoculation of influenza vaccine in healthy control subjects and in patients with diabetes mellitus. Patients were arbitrarily divided into two groups according to the percentage ofHbAlc: group I, 4-6.5% (n~35); group II,< 6.5% (n+ 159). *different from control subjects p>o.Ol.

Table 1 Serologic response to the H3N2 vaccine component in control subjects and in patients with diabetes mellitus.
Control subjects Diabetic patients
Oral Total Type 1 Type 2 therapy Diet Insulin
n~28 n~159 n~27 n~120 n~57 n~2o n~8o
Number of subjects with 8 49 9 36 17 2 29 prevaccination titre> 100
Mean% HbAlc (± SD) 5.0(±0.4) 7.7(± 1.5) 7.9(±1.5) 7.7(±1.5) 7.8(± 1.3) 6.8(± 1.1) 8.1(± 1.5)
Subjects studied 20 110 18 84 40 18 31
Mean fold increase(± SD) 1.55(±0.74) 1.53(±0.79) 1.38(±0.72) 1.56(±0.79) 1.63(±0.74) 1.33(±0.82) 1.53(±0.81)
%of subjects with post- 90 85 94' 83 85 77 88 vaccination titre > 100
% of subjects with 100 86 78* 87 88 78* 87 4-fold or greater titre mcrease
Data of 12 patients whose type of diabetes was unknown and of 2 patients with both insulin and oral therapy are not shown.
* Different from controls, P<0.05.
I~ ~ :::: (I>
~ :;:::, "<:: :;:::, (") (") s· :;:::, ..... cs· ;:s
VI .j::..

Table 2 Serologic response to the HlNl vaccine component in control subjects and in patients with diabetes mellitus.
Control subjects Diabetic patients
Oral Total Type 1 Type2 therapy Diet Insulin
n~28 n~I59 n~27 n~I20 n~57 n~20 n~8o
Number of subjects with 4 14 4 8 6 1 7 prevaccination titre > 100
Mean% HbAlc (± SD) 5.0(±0.5) 7.7(±1.5) 7.5(± 1.6) 7.8(± 1.5) 7.9(±1.4) 6.6(± 1.1) 8.1(± 1.6)
Subjects studied 24 145 23 112 51 19 73
Mean fold increase(± SD) 1.04(±0.61) 1.04(±0.68) 1.07(±0.67) 1.04(±0.68) 1.17(±0.61) 0.79(±0.62) 1.00(±0.63)
% of subjects with post- 66 64 73 62 70 47 64 vaccination titre > 100
% of subjects with 67 65 70 67 69 58 58 4-fold or greater titre increase
Data of 12 patients whose type of diabetes was unknown and of 2 patients with both insulin and oral therapy are not shown.
V\ V\
9 {j &' ~
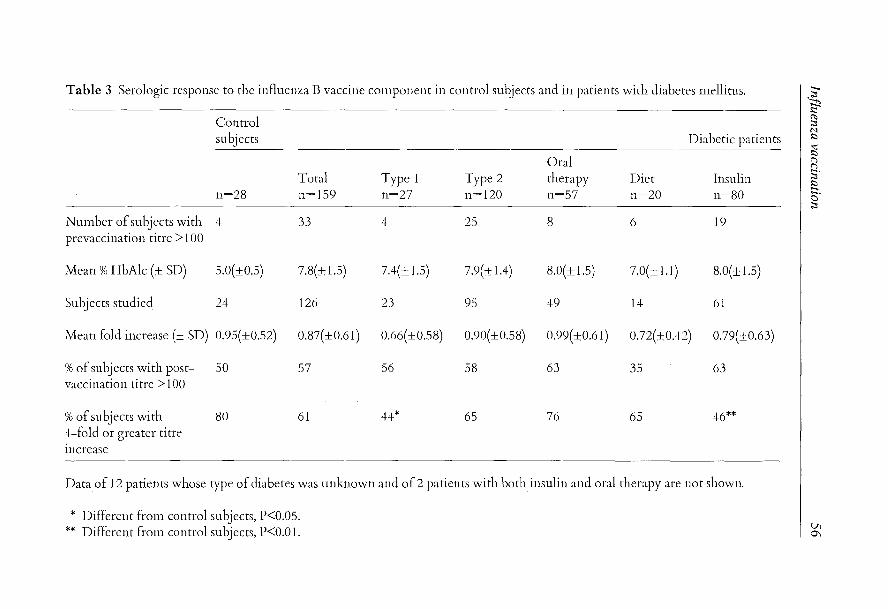
Table 3 Serologic response to the influenza B vaccine cmnponent in control subjects and in patients with diabetes mdlitus.
Control subjects Diabetic patients
Oral Total Type 1 Type 2 therapy Diet Insulin
n~2s n~l59 n~27 n~l20 n~57 n~20 n~so
Nmnber of subjects with 4 33 4 25 8 6 19 prevaccination titre> 100
Mean% HbAlc (± SD) 5.0(±0.5) 7.8(± 1.5) 7.4(± 1.5) 7.9(± 1.4) 8.0(±1.5) 7.0(± 1.1) 8.0(± 1.5)
Subjects studied 24 126 23 95 49 14 61
Mean fold increase (± SD) 0.95(±0.52) 0.87(±0.61) 0.66(±0.58) 0.90(±0.58) 0.99(±0.61) 0.72(±0.42) 0.79(±0.63)
%of subjects with post- 50 57 56 58 63 35 63 vaccination titre > 1 00
%of subjects with 80 61 44* 65 76 65 46** 4-fold or greater titre Increase
Data of 12 patients whose type of diabetes was unknown and of 2 patients with both insulin and oral therapy are not shown.
* Different from control subjects, P<0.05. ** Different from control subjects, P<O.O 1.
IS< ';:b
:;::: (I) :::1 M $::>
..,: $::> ("') ("') s· $::> :::1-. 0 :::1
Vl 0\

57 Chapter4
References
1. Barker WH, Mullooly JP. Pneumonia and influenza deaths during epidemics. Arch.Int.Med. 142:85-89, 1982.
2. Housworth J, Langmuir A. Excess mortality from epidemic influenza 1957-1966. AmJ.Epidem. 100:40-47, 1974.
3. Watkins PJ, Soler NG, Fitzgerald MG, Malins JM. Diabetic ketoacidosis during the influenza epidemic. Br.MedJ 4:89-91, 1970.
4. Eickhoff TC, Sherman JL, Serfling RE. Observations on excess mortality associated with epidemic influenza. J.Am.Med.Ass.176:776-782, 1961.
5. Khurana RC, Younger D, Ryan JR. Characteristics of pneumonia in diabetics. Clin.Res. 21:629, 1973.
6. Casey JL, Heeter BJ, Klyshevich KA. Impaired response of lymphocytes of diabetic subjects to antigen of Staphylococcus aureus. J.InfDis. 136:495-496, 1977.
7. Rayfield EJ, Ault MJ, Keusch GT, Brothers MJ, Nechemias C, Smith H. Infection and diabetes: the case for glucose control. AmJ.Med. 72:439-450,1982.
8. Masurel N, Laufer J. A one-year study of trivalent influenza vaccines in primed and unprimed volunteers; immunogenicity, clinical reactions and protection. J.Hyg. 92:263-276, 1984.
9. Ennis A. Some newly recognized aspects of resistance against and recovery from influenza. Arch.Virol. 73:207-217, 1982.
10. Versluis DJ, Beyer WEP, Masurel N, W enting GJ, Weimar W. Impairment of the immune response to influenza vaccination in renal transplant recipients by cyclosporine A, but not by azathioprine. Transplantation 42:376-379, 1986.
11. Ortbals DW, Liebhaber H, Presant CA, Van Amburg A, Lee JY. Influenza immunisation of adult patients with malignant diseases. Ann.Int.Med. 87:552-557, 1977.
12. Gross PA, Lee H, Wolff JA, Hall CB, Minnefore AB, Lazicki ME. Influenza immunization in immunosuppressed children. J.Pediat 92:30-35, 1978.
13. Phair J, Kaufman CA, Bjornson A, Adams L, Linneman C. Failure to respond to influenza vaccine in the aged; correlation with B-cell number and function. J.Lab.Clin.Med 92:822-828, 1978.

Influenza vaccination 58
14. Berlin BS, McQueen JL, Min useE, Davenport FM. A method for increasing the sensitivity of the haemagglutination inhibition test with equine influenza virus. Virology 21:665-666, 1963.
15. Masurel N, Ophof P, DeJong P. Antibody response to immunization with influenza NUSSR/77 (H1N1) virus in young individuals primed or unprimed for NNew Jersey/76 (H1N1) virus. J.Hyg. 87:201-209, 1981.
16. Van der Logt JTM, Van Loon AM, Van der V een J. Hemadsorption immunosorbent technique for determination of rubella immunoglobulin M antibody. J.Clin.Microbiol. 13:410-415, 1981.
17. Sokal JE. Measurement of delayed skin test responses. New EngJ.Med. 293:501-502, 1975.
18. Feery BJ, Hartman LJ, Hampson AW, Proietto J. Influenza immunisation in adults with diabetes mellitus. Diabetes Care 6:4 7 5-4 78, 1983.
19. Virelizier JL, Postlethwaite R Schild GC, Allison AC. Antibody responses to antigenic determinants of influenza virus hemagglutinin. I. Thymus dependence of antibody formation and thymus independence of immunological memory. J.Exp.Med. 140:1559-1570, 1974.
20. Quinion-Debrie MC, Debray-Sachs M, Dardenne M, Chernichow P, Assan R, Bach JF. Anti-islet cellular and humoral immunity, T -cell subsets, and thymic function in type 1 diabetes. Diabetes 34:373-379, 1985.
21. Lederman MM, Schifman G, Rodman HM. Pneumococcal immunization in adult diabetics. Diabetes 30:119-121,1981.
22. Versluis DJ, Beyer WEP, Masurel N, Weimar W. Influenza vaccination in dialysis and transplant patients. Antiv.Res. suppl. 1:289-292, 1985.
23. Plouffe JE, Silva J, Fekety R, Allen JL. Cell mediated immunity in diabetes mellitus. J.Inflmmun. 21:425-429, 1978.
24. Mahmoud AAF, Rodman HM, Mandel MA, Warren KS. Induced and spontaneous diabetes mellitus and suppression of cell-mediated immunologic responses. J.Clin.lnvest. 57:362-367, 1976.
25. Leung KN, Ada GL. Cells mediating delayed type hypersensitivity in the lungs of mice infected with an influenza A virus. ScandJ.Immunol. 12:393-400, 1980.

59 Chapter 5
Chapter 5
Cytotoxic T-cell response to influenza A subunit vaccine in patients with type I diabetes mellitus
Robert J.A. Diepersloot (1), Karel P. Bouter (2), Ruud van Beek (1), Cees]. Lucas ( 3 ), Nic Masurel ( 1) and Dirk W. Erkel ens ( 4 ).
1 Department of Virology, Erasmus University, Rotterdam, The Netherlands
2 Department of Internal Medicine, Diakonessen Hospital Utrecht, The Netherlands
3 Central Laboratory of the Netherlands Red Cross Blood Transfusion Service, Amsterdam, The Netherlands
4 Department of Internal Medicine, University Hospital Utrecht, The Netherlands
Published in The Netherlands Journal of Medicine 1989;35:68-75.

Subunit vaccine 60
SUMMARY
The cytotoxic T -cell and humoral immune response to a commercially available influenza A-H1N1 subunit vaccine in 14 patients with type 1 diabetes mellitus was compared with the response in 13 healthy volunteers. Cytotoxic T -cell response to vaccination was poor in both patients and controls. At a calculated 50:1 effector-target cell ratio, however, significantly more controls than patients showed an increase of over 5% cytotoxic T -cell mediated lysis after vaccination (p<0.05). In patients the cytotoxic T -cell response decreased with higher percentages of glycosylated haemoglobin (regression coefficient of- 0 with p<0.05). No significant difference was found between diabetic patients and control subjects with respect to antibody response after vaccination. It is suggested that sub-unit vaccine is inferior to inactivated whole virus vaccine in high risk patients.
Key words: influenza, vaccine, cytotoxic T -cell response, diabetes mellitus
INTRODUCTION
Infections with influenza viruses are common and have been shown to be potentially dangerous in patients with diabetes mellitus (1-4). As a preventive measure in these patients, annual vaccination against influenza has been generally accepted. Its preventive effect is thought to be associated with the production of antibodies specifically directed against viral membrane proteines. However, humoral immunity acquired after vaccination is often disappointing for various reasons: it may be shortlasting, and antibodies induced by the vaccine strains may be evaded by a newly emerging influenza mutant. Moreover, in type 1 diabetic patients the humoral immune response to influenza vaccine may be impaired (5). Ennis et al. ( 1981) demonstrated that inactivated influenza A subunit vaccine can boost cytotoxic T -cell immunity. Thus, enhanced cytotoxic Tcell immunity, which has cross-reactivity for all influenza A subtypes, may add to the protection obtained after vaccination and even be effective in case of emergence of new virus strains or subtypes ( 6).

61 Chapter 5
In this study, we investigated the cytotoxic T -cell response after vaccination with an influenza A-H1N1 subunit vaccine in patients with type 1 diabetes mellitus and compared the results with the outcome in healthy volunteers.
MATERIALS AND METHODS
The study population consisted of 14 patients with type 1 diabetes mellitus, 10 men and 4 women (mean age 28.2 ± 5.4 years, mean duration of disease 5.3 years, range 1-19 years). All patients studied were attending the outpatient clinic of the Department of Internal Medicine of the Diakonessen Hospital, Utrecht, The Netherlands and were considered to be type 1 because of documented keto..,acidosis and/or abrupt onset of symptoms requiring insulin therapy at age <40 years. Control subjects were 13 healthy volunteers, 3 men and 10 women (mean age 26.5 ± 4.0 years). Subjects were excluded if they were allergic to egg protein or when febrile on the day of vaccination. Written consent was obtained from all participants and approval for the study was obtained from the Ethical Committee of the Diakonessen Hospital.
Vaccine: dosage and administration
A monovalent purified subunit influenza vaccine (Duphar- Nederland, Amsterdam, The Netherlands), containing 15 ug haemagglutinin AI Taiwan/ 1/86 (H1N1), was administered in 0.5 ml doses intramuscularly in the upper arm. Blood samples were taken prior to vaccination and again 14 days later.
Cytotoxic assay
Cytotoxic T -cell response was measured as described previously (7). Peripheral mononuclear cells were prepared from 50 ml heparinized venous blood by centrifugation over a Ficoll-Paque gradient. The buffy coat
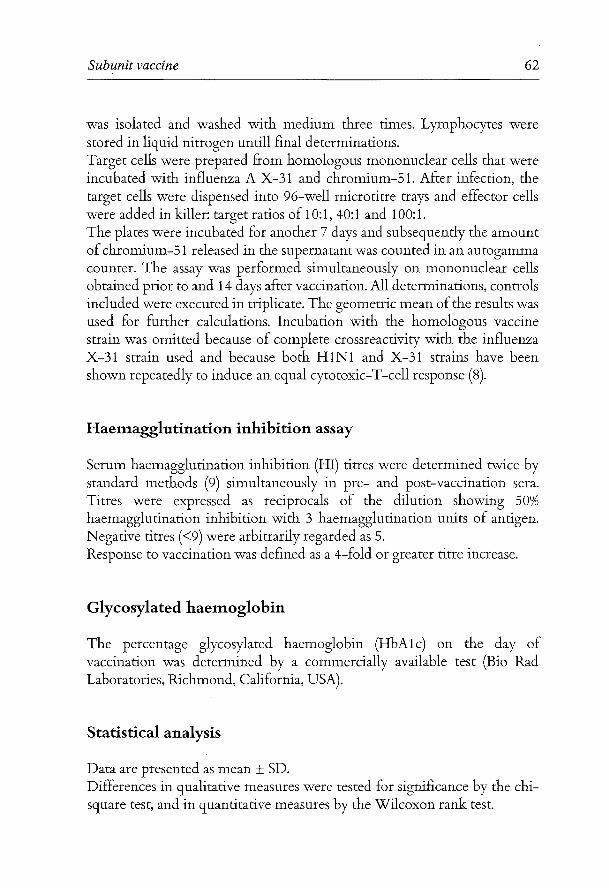
Subunit vaccine 62
was isolated and washed with medium three times. Lymphocytes were stored in liquid nitrogen untill final determinations. Target cells were prepared from homologous mononuclear cells that were incubated with influenza A X-31 and chromium-51. After infection, the target cells were dispensed into 96-well microtitre trays and effector cells were added in killer: target ratios of 1 0:1, 40:1 and 1 00:1. The plates were incubated for another 7 days and subsequently the amount of chromium-51 released in the supernatant was counted in an autogamma counter. The assay was performed simultaneously on mononuclear cells obtained prior to and 14 days after vaccination. All determinations, controls included were executed in triplicate. The geometric mean of the results was used for further calculations. Incubation with the homologous vaccine strain was omitted because of complete crossreactivity with the influenza X-31 strain used and because both HlNl and X-31 strains have been shown repeatedly to induce an equal cytotoxic-T -cell response (8).
Haemagglutination inhibition assay
Serum haemagglutination inhibition (HI) titres were determined twice by standard methods (9) simultaneously in pre- and post-vaccination sera. Titres were expressed as reciprocals of the dilution showing 50% haemagglutination inhibition with 3 haemagglutination units of antigen. Negative titres (<9) were arbitrarily regarded as 5. Response to vaccination was defined as a 4-fold or greater titre increase.
Glycosylated haemoglobin
The percentage glycosylated haemoglobin (HbAlc) on the day of vaccination was determined by a commercially available test (Bio Rad Laboratories, Richmond, California, USA).
Statistical analysis
Data are presented as mean ± SD. Differences in qualitative measures were tested for significance by the chisquare test, and in quantitative measures by the Wilcoxon rank test.

63 Chapter 5
RESULTS
Antibody response
Prior to vaccination there were no detectable HI antibodies to the influenza A/Singapore/6/86 (H1N1) strain in any of the participants. Antibody levels after vaccination were somewhat lower in patients (logarithmated geometric mean titre 1.96 ± 0.73) than in controls (2.13 ± 0.66), though not statistically significant. Four patients and one control subject did not respond to vaccination (logarithmated geometric mean titre > 1.3 after vaccination) (Table 1 ). No correlation could be established between the percentage of the HbAlc and post-vaccination HI titres.
Cytotoxic T -cell response
Figures of the percentage ofT -cell mediated lysis at killer- 1 target (K:T) cell ratios of 1 0:1, 40:1 and 1 00:1 prior to and after vaccination were used to determine the percentage oflysis at a 50:1 ratio by linear regression. Results are shown in Table 1. The cytotoxic T -cell response prior to vaccination tended to be higher in patients than in controls. The value of the CTLresponse prior to vaccination, however, did not influence the response to vaccination, as is shown in Fig. 1. In patients the cytotoxic T -cell response prior to and 14 days after vaccination was similar in most cases. A marked increase was shown in only two patients; in three other patients the CTL response decreased sharply. Although also among controls there were some individuals with decreasing T -cell mediated lysis after vaccination, the response tended to be slightly better than in patients. Considering the absence of accepted standards, a comparison between the outcome in patients and controls remains questionable. At the calculated 50:1 effector:target cell ratio, however, significantly more controls than patients were shown to have an increase of over 5% CTL-mediated lysis after vaccination (7 vs. 2, p < 0.05). Remarkably, the two patients with a considerable rise in T -cell mediated

Table 1 Results of CTL response at a calculated 50:1 effector: target cell ratio prior to and postvaccination and haemagglutination inhibition titre after vaccination in controls and patients
Controls Patients
Age Sex %lysis Increase Post- Age Sex %lysis Increase Post- HbA1c
(yr) oflysis vaccination (yr) oflysis vaccination titre titre
21 F -1.8 5.2 0.70 25 F 0.2 - 3.2 2.43 9.5 32 F 0.8 5.9 2.16 26 F 5.0 1.4 2.71 8.9 22 F 9.5 -10.8 2.43 33 M 9.8 7.8 1.04 7.7 28 M 9.9 7.2 3.06 34 M 15.0 8.1 2.43 7.2 27 F 14.8 9.8 1.68 29 M 17.0 0.7 0.70 7.9 23 F 21.2 5.7 2.16 21 F 17.7 - 0.7 2.13 9.4 22 M 21.2 10.1 2.74 35 M 20.9 - 1.0 2.43 8.4 28 F 25.4 - 0.2 2.74 29 M 27.0 1.7 2.18 9.1 24 F 27.3 -10.8 3.04 24 M 28.7 2.8 1.18 7.1 27 M 28.5 - 6.1 1.88 25 F 36.2 - 0.6 2.46 10.1 33 F 35.5 24.0 2.43 33 M 44.2 -22.5 2.74 10.2 22 F 37.6 -20.6 1.53 36 M 49.2 3.7 0.70 6.6 22 F 37.9 2.4 2.43 19 M 50.3 -13.3 2.36 10.4
26 M 53.7 -29.7 2.01 8.9
I~ ;::s ...... .... ~
lfS (')
s· (1:>
0\ .j::>.

65
%increase 30
20
10
Ai::J..
o. -10
-20
-30
tt:..i A A
• 10'
A
Chapter 5
%CTL
A • prior to vaccination
30 •4o 50 A
A • A •
• Figure 1. Increase in CTL response after vaccination versus T -cell mediated lysis
prior to vaccination at a calculated 50:1 effector:target cell ratio for patients ( • ) and controls (L. ).
%increase
10
0
-10
-20
• • •• 7
-30 •
%HbA lc
• •
Figure 2. Increase in percentage T -cell mediated lysis after vaccination versus percentage HBA1c in 14 patients with type 1 diabetes mellitus (regression coefficient f= 0 with p < 0.05).

Subunit vaccine 66
lysis belonged to the patients with the lowest concentration of glycosylated haemoglobin. The percentages HBA1c is these two patients were 7.2 and 7.7, respectively, versus 8.9, 10.2 and 10.4 for the patients with a decrease in the enresponse, the mean percentage for all patients being 8.7 ± 1.2. As is shown in Fig. 2, the CTL-response in patients decreased with higher percentages of glycosylated haemoglobin (regression coefficient --F 0 with p < 0.05).
DISCUSSION
High levels of HI antibodies induced by vaccination have been demonstrated to protect against subsequent influenza infections (9-1 0). In addition, other host factors, in particular cytotoxic T -lymphocytes may contribute to this protection. Studies on influenza infection in mice made clear that cytotoxic T -lymphocytes played a major role in the recovery from influenza viral pneumonia ( 11-12). Transfer of influenza specific T -cells protected mice against challenge with lethal doses of influenza virus (13). In contrast with HI antibodies, cytotoxic T -cells cannot distinguish between different influenza strains and show a cross- reactivity for all influenza (A) subtypes (14). Some individuals in both the patient and the control population had considerable cytotoxic T -cell immunity prior to vaccination. This is the most likely due to natural infection in preceding years. Cytotoxic T -cell response boosted by vaccination is relatively short lasting ( 6). Even after natural infection there appears to be a rapid decline in measurable cytotoxic T -cell immunity after 5 years ( 15). Considering the ever changing genetic make-up of the influenza virus, boostering the cytotoxic T -cell response would be an attractive conception. Ennis et aL ( 1981) showed that both live and inactivated (subunit) influenza vaccines were able to induce a cytotoxic T-cell response (6). In our study, for the patients as a group no increase in CTL- response after vaccination could be demonstrated, and even in the controls the observed response was poor. Although in contradiction with the results of Ennis et al. ( 1981 )( 6), this outcome fits very well with the results of both McMichael et aL (1981)(8)

67 Chapter 5
and Webster and Askonas (1980)(16) who concluded that killed whole virus was effective in boostering the CTL-response, but subunit vaccine was not. This difference in response might be due to the fact that CTL-response is for the greater part elicited by internal virus proteins which are present in whole virus vaccines, but virtually absent in sub-unit vaccines (17,18). In addition, for the patients with type 1 diabetes mellitus, impaired cellular immunity may be partially responsible for the complete unresponsiveness to the vaccination (5, 19). As has been shown previously poor metabolic control can suppress cellular immunity in these patients (5,20). In some individuals we found a decrease in cytotoxic T -cell responses after vaccination. The same phenomenon was observed by McMichael et al., (1981)(8). It could be speculated that a decline in response is caused by temporary suppression ofT -cell immunity by viral antigens as is common in natural infection. In our opinion it is due to mere change as it is only noted in patients vaccinated with a subunit vaccine. Cytotoxic T -cell immunity not only has a complete cross-reactivity for influenza A, is has also been shown to play a part in recovery from influenza infection in man. Therefore, it could be argued that especially in high risk patients, such as diabetics, inactivated whole virus vaccines should be preferred to subunit vaccines.
ACKNOWLEDGEMENTS
This study was financially supported by the Eli-Lilly Company. The influenza vaccine was kindly provided by Duphar-Nederland and the HbA1 c column test by Bio Rad. The authors wish to thank Dr. W .E.P .Beyer for stimulating discussion, Mrs. J.M.P. den Ronden-de Jong and Pammy Treep- van Leeuwen (CLB) for technical assistance and Mrs. R.S.EngelsBakker for preparation of the manuscript.

Subunit vaccine 68
References
1 Barker WH, and Mullooly JP (1982). Pneumonia and influenza deaths during epidemics. Arch. Int. Med. 142,85-89.
2 EickhoffTC, Sherman JL, Serfling RE ( 1961 ). Observations on excess mortality associated with epidemic influenza.]. Am. Med. Ass. 176, 776-782.
3 Housworth J, Langmuir A (1974). Excess mortality from epidemic influenza 1957-1966. Am.]. Epidemiol. 100, 40-47.
4 Polak MF (1959). Influenza mortality in the autumn of 1957. Ned. Tijdschr. Geneeskd. 103, 1098-1109.
5 Diepersloot RJA, Bouter KP, Beyer WEP, Hoekstra JBL, Masurel N (1987). Humoral immune response and delayed type hypersensitivity to influenza vaccine in patients with diabetes mellitus. Diabetologia 30, 397-401.
6 Ennis FA, RookAH, Yi-Hua Q, Schild GC, RileyD, PrattR, Potter CW (1981). HLA-restricted virus specific cytotoxic T lymphocyte responses to live and inactivated influenza viruses. Lancet II, 887-891.
7 Braakman E, Treep-van Leeuwen P, Roosnek EE, Lucas CJ ( 1986). The role of IL2 and T4+ cells in the generation of human influenza virus specific CTL activity. Cell. Immunol. 100,462-473.
8 McMichael AJ, Gotch F, Cullen Ph, Askonas BA, Webster RG (1981). The human cytotoxic T cell response to influenza A vaccination. Clin. Exp. Immunol. 43, 276-284.
9 Masurel N, OphofP, DeJong P (1981). Antioody response to immunization with influenza A/USSR/77 (H1N1) virus in young individuals primed or unprimed for NNew Jersey/76 (H1N1) virus.]. Hyg. 10,201-209.
10 Masurel N, Laufer J ( 1984 ). A one-year study of trivalent influenza vaccines in primed and unprimed volunteers; immunogenicity, clinical reactions and protection.]. Hyg. 92,263-276.
11 Ennis FA, Wells MA, Butchko GM, Albrecht P (1978). Evidence that cytotoxic T cells are part of the host's response to influenza pneumonia.]. Exp. Med. 148, 1241-1249.
12 Yap KL, Ada GL ( 1978). Cytotoxic T cells in the lungs of mice infected with an influenza A virus. Scand.]. Immunol. 7, 73-80.
13 Yap KL, Ada GL, McKenzie IFC (1978). Transfer of specific T lymphocytes protects mice inoculated with influenza viruses. Nature 273, 238-239.
14 Zweerink HJ, Courtneidge SA, Skehel], Crumpton MJ, Askonas BA (1977). Cytotoxic T cells kill influenza virus infected cells but do not distinguish between serologically distinct A viruses. Nature 267, 354-356.
15 McMichael AJ, Gotch FM, Noble GR, Beare PAS (1983). Cytotoxic T-cell immunity to influenza. N. Engl.]. Med. 309, 13-17.

69 Chapter 5
16 Webster RG, Askonas BA ( 1980). Cross-protection and cross-reactive cytotoxic T cells induced by influenza virus vaccines in mice. Eur. J. Immunol. 10, 396-401.
17 Kees U, Krammer PH (1984). Most influenza A virus-specific memory cytotoxic T lymphocytes react with antigenic epitopes associated with internal virus determinants.]. Exp. Med. 159, 365-377.
18 McMichael AJ, Michie CA, Gotch FM, Smith GL, Moss B (1986). Recognition of influenza A virus nucleoprotein by human cytotoxic T lymphocytes. J. Gen. Virol. 67, 719-726.
19 Quinion-Debrie MC, Debray-Sachs M, Dardenne M, Chernichow P, Assan R. and Bach JF ( 1985). Anti-islet cellular and humoral immunity, T -cell subsets and thymic function in type 1 diabetes. Diabetes 34, 373-379.
20 Casey JL, Heeter BJ, Klyshevich KH ( 1977). Impaired response of lymphocytes of diabetic subjects to antigen of Staphylococcus aureus. J. In£ Dis. 136, 495-496.

Subunit vaccine 70

71 Chapter6
Chapter 6
No evidence for the enhanced production of insulin auto-antibodies after confrontation with common viral antigens in insulin dependent diabetes mellitus.
RJA. Diepersloot (1 ), K.P. Bouter (2), GJ Bruining (3), J.L. Molenaar (4), J.B.L. Hoekstra (2), N. Masurel (1 ), D.W. Erkelens (5).
1 Department of Virology and WHO Influenza Centre, University Hospital Dijkzigt, Rotterdam.
2 Department oflnternal Medicine, Diakonessen Hospital Utrecht. 3 Department of Paediatrics, Sophia Children's Hospital/University
Hospital Dijkzigt Rotterdam. 4 Department of Clinical Immunology, Stichting Samenwerking Delftse
Ziekenhuizen, Delft. 5 Department oflnternal Medicine, University Hospital Utrecht.

Insulin auto-antibodies 72
SUMMARY
The production of insulin auto-antibodies (IAA) was studied after common viral infections in 12 children with type I diabetes mellitus and in their 18 healthy siblings. In addition the production of IAA was measured after influenza vaccination with booster in 39 patients with type 1 diabetes mellitus and 39 healthy controls. In 7 of the 12 diabetic children 13 viral infections were serologically confirmed. Among the siblings 14 periods of infection were noted in 9 individuals. A significant rise in IAA antibody titre was demonstrated in patients twice (IgG both times) and in siblings 11 times (IgM 5x, IgG 6x, difference significant, p <0.05). In only three cases the rise in antibody titres occurred 6-12 weeks after documented infection. There was a significant inverse correlation with age in both patients (r= 0.89, p <0.0001) and siblings (r= 0.67, p <0.001) for IgM IAA. After influenza vaccination a significant increase in IAA was noted twice; IgM IAA in a patient with diabetes and IgG IAA in a healthy volunteer. A fourfold decrease in IgG IAA was demonstrated in one diabetic patient. From these results it is concluded that insulin auto-antibody formation is not a direct sequela of viral infection or vaccination.
Key words: Diabetes mellitus, insulin auto-antibodies, viral infection, influenza.
INTRODUCTION
Research over the last 1 0 years has yielded evidence that insulin dependent diabetes mellitus (IDDM) is a chronic auto-immune disease (1 ). Markers may be present years before the clinical onset of the disease (2,3). Islet cell cytoplasmatic auto-antibodies (ICA) in particular are considered to be serological markers of the ongoing destruction of the islets of Langer hans (4,5). Insulin auto-antibodies (IAA), reported for the first time in 197 4 in a patient with reactive hyperglycaemia ( 6) also have been associated with the clinical onset of diabetes (7,8).

73 Chapter 6
The combination of ICA and IAA predicts insulinopenia and subsequent IDDM more reliably than the presence of either antibody does alone (9). Recendy, a high incidence ofiAA was reported in children after acute viral infections (mumps, rubella, chickenpox or measles) (10). It was suggested that IAA in the immunoglobulin M class are elecited by a carrier-hapten immune mechanism. We studied the occurrence of IAA after common viral infections in children with IDDM and in their healthy siblings, subsequently in adults with IDDM and healthy controls after influenza vaccination with booster, to see wether enhancement ofiAA would be a feature particular to IDDM. If so, rises in IAA might be expected to alter the pharmacokinetics of administered insulin, the requirements of which are usually higher during (febrile) viral infections.
SUBJECTS AND METHODS
I. IDDM children and their healthy siblings
The children studied were attending the outpatient clinic of the Department of Paediatrics of the Sophia Children's Hospital Rotterdam. The study population consisted of 12 children with IDDM, 6 girls and 6 boys, mean age 11.7 ± 2.8 years and all available 18 non-diabetic siblings, 3 girls and 15 boys, mean age 13.6 ± 3.7 years. Written consent was obtained from all participants over 12 years old after approval for the study was granted by the Ethical Committee of the Sophia Children's Hospital. Prior to the study islet cell antibodies as well as HbA1 was determined once in all healthy siblings to exclude a pre-clinical diabetic state. Blood samples for serological determinations and urine samples for the measurement of C-peptide were obtained once every 5 to 7 weeks during one year ( 1983-1984 ). Sera were separated immediately after blood collection and clotting and stored at -20°C untill titration. Serum samples were screened for the presence of hepatitis B surface antigen (HBsAg) and anti-HBsAg by an enzyme-linked immunosorbent assay (Abbott Laboratories). Subsequendy antibodies against Rubella virus were
Insulin auto-antibodies 74
determined by haemolysis in gel. The reaction according to Paul and Bunnell was used for the detection of recent EBV infection. Respiratory viral infections (influenza A and B, parainfluenza 1,2 and 3, adenovirus, respiratory syncitial virus, mumps and measles), herpes virus infections (herpes simplex, varicella zoster, cytomegalovirus) and in addition, indications for infections with Mycoplasma pneumoniae, Chlamydia psittacosis and Coxiella burnetii were sought by a complement fixation assay ( CF A) using standard laboratory methods. The CF A was considered positive in case of an at least fourfold rise in antibody titre.
II. Influenza vaccination with booster in adults.
The s_tudy population consisted of 39 patients with IDDM, 19 men and 20 women, mean age 28.1 ± 6.7 years, range 17-39 years. All patients studied were attending the outpatient clinic of the Department of Internal Medicine of the University Hospital, Utrecht, The Netherlands. Control subjects were 39 healthy volunteers, 9 men and 30 women, mean age 22.7 ± 4.7 years, range 17-39 years. Exclusion criteria for vaccination were allergy to egg protein or elevated temperature on the day, of vaccination. Written consent was obtained from all participants, and approval for the study was obtained from the Ethical Committee of the University Hospital Utrecht. All subjects received an intramuscular injection of 0,5 rnl commercially available trivalent whole virus vaccine (Influvac, Duphar, Amsterdam, The Netherlands). A booster vaccination with the same vaccine was performed four weeks later. Blood samples were drawn from all participants at day 0, 28 and 56. Sera were separated immediately after blood collection and clotting and stored at -20°C untill titration. Serum haemagglutination inhibition titres were determined twice by standard methods ( 11) simultaneously in pre- and postvaccination sera. The concentration of glycosylated haemoglobin (HbA1c) was determined once on the day of vaccination.

75 Chapter6
IAA
All serum samples obtained from the 12 IDDM children, their 18 siblings, and from the 39 adult IDDM patients and the 39 healthy controls were screened for the presence of insulin auto-antibodies of both IgG and IgM classes by an enzyme-linked immunosorbent assay: Greiner gamma sterilized microtiter plates were coated with Human insulin (Lilly) 0.125 IU/ml in 0.05M Na-carbonate buffer, pH 9.6 and 100 ul per well. This was incubated overnight at 37oC. The plates were washed 6 times with PBS containing 0.05% Tween 20. Test sera were diluted 1:20 and 1:80, a positive control serum was titrated in double dilutions from 1:20 to 1:2560 and negative controls were diluted 1:20. Dilutions were made in 0.133M phosphate buffer pH 7.2 containing o.3M NaCl, 0.5% gelatin and 0.5% Tween 20. 100 ul of the diluted sera were incubated at 3TC for 1 hour. The plates were then washed 6 times with PBS containing 0.05% Tween 20. 100 ul horse radish peroxidase conjugated Goat antiglobulines against Human IgG- and Human IgM (diluted in the buffer that was also used to dilute the serum samples) was then added to each well and incubated at 3TC for 1 hour. After a further washcycle fresly prepaired OPD-HC11 ug/ ml in PBS containing H 20 2, 100 ul per well was added and incubated in the dark for 1 0-20 min at room temperature until the standard positive reactions reached an OD 492 nm reading of aproximately 0.25. The reactions were stopped with 100 ul1M H 2S04•
The plates were read on the Titertek Multiscan. Sera were scored positive if the extinction exceded 2 standard deviations above negative control mean values at a dilution of 1:20. An increase of IAA was considered to be significant if there was at least a fourfold rise in antibody titre or in case of seroconvers10n. The assay scored no false positives in several International Diabetes Workshop serum exchange programs. Duplicate assays are reproducible within one doubling dilution.

Insulin auto-antibodies 76
RESULTS
I. IDDM children and their healthy siblings.
13 Viral infections were serologically confirmed in 7 patients with IDDM during one year. In five children no infection could be demonstrated. Among the 18 siblings 14 periods of infection were documented in 9 individuals, while in the remaining siblings no infection was documented (differences not statistically significant). Most infections appeared to be common respiratory viral infections. Influenza and RS virus infections were most prevalent in winter months, the Parainfluenza virus infections all occurred during late summer. In addition to the viral infections, infections with Coxiella Burnetii (once) and Mycoplasma pneumoniae (twice) were noted (table 1).
Table 1 Infections observed in 12IDDM children and 18 healthy siblings. In a one year follow up 13 infections in 12 IDDM children and 14 infections in 18 siblings were serologically demonstrated. A significant increase in IAA was noted 6-12 weeks after two Influenza B (IgG 1x, IgM 2x) and one M. Pneumoniae infection (IgG only).
Infection IDDM children Siblings (n~18) (n~12) [IAA response]
Influenza A 0 InfluenzaB 2 5 [IgM 2x, IgG 1x] Parainfluenza 7 2 Respiratory Syncytialvirus 3 Adenovirus 0 M. pneumoniae 1 Coxiella burnetii 0 Herpes simplex 0 Measles 0
Total 13 14 [Igm 2x, IgG 2x]

77 Chapter 6
320
<ll 160 ......, .. ;... ..... ·.;::
~ 80 • • ... ....... • 4-< 0 -~ u 0 40 ... ... • • ;..; p.. ...... u
~ 20 • • • • • • •
0 6 8 10 12 14 16 18 20
Age (yr)
Figure L Correlation between age and the reciprocal of IgM lAA titres in 12 children with diabetes mellitus (r~0.89, p <0.0001) and in their 18 healthy siblings (r~0.67, p <0.001). T patients, o children
A rise in IAA antibody titre was demonstrated in two patients (IgG) and in siblings 11 times; IgM 5x and IgG 6x (difference statistically significant p <0.05). In three cases the rise in antibody titre took place 6-12 weeks after serologically documented infection. A rise of IAA in both the IgM- and IgG-class was noted once after an Influenza B infection. No significant rise in IAA antibody titre was noted in the remaining 24 documented infections. Seven from twelve IDDM children had detectable IAA IgG antibody levels throughout the study while from only one sibling all serum samples tested were positive. For IgM IAA antibodies there was a significant inverse correlation with age in all subjects (r~ 0.85, p <0.0001). The regression coefficient was higher in IDD children (r~0.89, p <0.0001) than in siblings (r~0.67, p <0.001) (fig. 1).
No correlation could be established between the occurrence of viral infections or rise in IAA and the concentration of urinary C-peptide.

Insulin auto-antibodies 78
In patients who had detectable levels of urinary C-peptide, the amount of C-peptide excreted gradually decreased during the one year follow up period, as expected.
IT. Influenza vaccination with booster in adults
The results of the humoral immune response after influenza vaccination have been published elsewhere (12). From these results it was concluded that in comparison with the control population the protection rate was significantly lower in patients with diabetes mellitus and that antibody production was independent from metabolic control (table 2). IAA of the IgG class were detected in 15 patients. Among the control individuals only 4 were found positive (difference significant p <0.0 1 ). IgM IAA antibodies were detected in 14 patients and 17 controls (p >0.05). In this study group no significant correlation with age could be demonstrated. A significant increase in IAA was observed twice; IgM-IAA in a patient and IgG-IAA in a control subject. In addition a fourfold decrease in IgG IAA was demonstrated in another patient
Table 2 Protection rate against three influenza strains after influenza vaccination in control subjects and in patients with IDDM.
Vaccine components
A-H3N2 A-HlNl B
Control subjects
39/39(100%) 36/39( 92%) 37/39( 95%)
* Different from controls (P<0.05)
Patients
37/39(95%) 28/39(72%)* 30/39(77%)*

79 Chapter6
DISCUSSION
Ninety years ago Harris suggested a causal relationship between viral infections and type 1 diabetes ( 13 ). Since then many reports have linked the onset of diabetes with preceding viral infections, mumps and rubella infections in particular ( 14-1 5). Recently Bodansky et al presented a hypothesis that at least in part could clarify the underlying mechanism by which viral infections trigger the process that ultimately leads to diabetes mellitus. They reported a high incidence of IgM IAA after common viral infections. They postulated that IgM IAA are elicited by a carrier-hapten immune mechanism and that the switch to IgG-IAA might be the relevant factor in the pathogenetic rol of viral infections ( 1 0 ). In childhood viral infections are frequently observed. In our study of 30 children 27 common viral infections were demonstrated by serological methods. A significant rise in IAA was observed after only three infections (influenzaB twice, Mycoplasma pneumoniae once). As we could demonstrate a significant spontaneous increase in IAA 13 times we believe that a rise in IAA is a rather common event in childhood. Therefore we assume that a rise in IAA after viral infections can be explained by chance. This assumption is strengthened by the finding of a strong inverse correlation beween IgM-IAA and age. A similar inverse correlation between age and IgM has been reported previously, outside the context of viral infections ( 10, 16). A rise in IAA was significantly more often demonstrated in siblings then in IDD children. This is probably due to the daily administration of exogeneous insulin. In our study on the IAA formation after influenza vaccination we found a significant increase in IAA in only 2 of78 individuals tested. These findings are reminiscent to the absence of ICA after mumps vaccination (17) and suggest once more that a challenge with viral antigens will not induce autoantibodies by itself Such a phenomenon has only been conclusively demonstrated for Mycoplasma pneumoniae infections (18). Several authors have reported a reproduceble seasonal incidence ofketosisprone diabetes in children and have suggested that it may support the viral theory of the aetiology of type 1 diabetes mellitus ( 19-21 ). However, it is

Insulin auto-antibodies 80
now widely excepted that type 1 diabetes is preceded by a long prodomal pre-diabetic period (1-3) which is in contradiction with a seasonal incidence. This apparent contradiction may be explained by the acute disturbance of an already compromised metabolic equilibrium by viral infections. Influenza epidemics in particular have been associated with an increased incidence of recent onset type 1 diabetes mellitus (21,22). In conclusion, exposure to common viral antigens does not increase IAA in diabetic children, neither does vaccination in adults. IAA levels are known to be higher in children compared to IDD patients with onset at later ages (10,16). In as much IAA would change the pharmacokinetics of administered insulin, such changes are not to be expected to occur systematically in the course of common viral infections.
ACKNOWLEDGEMENTS
This study was funded by the Child Health and Well being Fund, Amsterdam, de Putter Foundation, and by Novo Industries, Amsterdam, The Netherlands. We thank mrs. C.E. de Beaufort and mrs. J J. de Visser for collecting all blood samples of the children, rnr. W AM. van Beers for technical assistance and mrs. R. van Moorsel for preparation of the manuscript.

81 Chapter6
References
1 Eisenbarth GS (1986). Type 1 diabetes mellitus: a chronic auto-immune disease. N.Engl.J. med. 314:1360-1368.
2 Botazzo GF, Florin-Christensen A, Doniach D ( 197 4 ). Islet cell antibodies in diabetes mellitus with auto-immune polyendocrine deficiencies. Lancet 2:1279-1283.
3 Betterle C, Tesari P, Fodale R, Tiengo A. A three years immunological and metabolic follow-up in 18 ICA-positive subjects In: Pinchera A, Doniach D, Fenza GF, Bascieri L (eds)(1980). Auto-immune aspects of endocrine disorders. Academic press, London pp 295-298.
4 Botazzo GF, Dean BM, Gorsuch AN, Cudworth AG, Doniach D (1980). Complement fixing islet cell antibodies in type 1 diabetes: possible monitors of active B-ta cell damage. Lancet 1:668-672.
5 Srikanta S, Ganda OP, Eisenbarth GS, Soeldner JS (1983). Islet cell antibodies and beta cell function in monozygotic triplets initially discordant for type 1 diabetes mellitus. N. Engl. J. Med. 322-325.
6 Hirata Y, Ishiza H, Ouchi N (1974). Insulin auto-immunity in a case of spontaneous hypo glycaemia. J. Jap. Diab. Soc 13:312-320.
7 Wilkin TJ, Nicholson S (1984). Auto-antibodies against human insulin. Br. Med. J. 288-349-352.
8 Palmer JP, Asplin CM, Clemons P, Lyen K, Tatpat 0, Raghu PK, Paquet TL (1983). Insulin antibodies in insulin-dependent diabetics before insulin treatment. Science 222:1337-1339.
9 Macharen NK, Rossini AA, Eisenbarth GS ( 1988). International research symposium immunology of diabetes. Diabetes 37: 662-665.
10 Bodansky HJ, Grant PJ, Dean BM, McNally J. Botazzo GF, Hambling MH, Wales JK (1986). Islet cell antibodies and insulin auto-antibodies in association with common viral infections. Lancet 2:1351-1353.
11 Masurel N, OphofP, DeJong] (1981). Antibody response to immunization with influenza NUSSR/77 (H1N1) virus in young individuals primed or unprimed for A/New Jersey/76 (H1N1) virus.]. Hyg. 87:201-209.
12 Bouter KP, Diepersloot IgA, Beyer WEP, Hoekstra JBL, Van Bruggen R, Erkelens DW, Masurel N (1989). Humoral immune response after influenza vaccination with booster in patients with type 1 diabetes mellitus. J. Drug. Res. TJO 14:50-53.
13 Harris HF ( 1899). A case of diabetes mellitus quickly following mumps. Boston Med. and Surg.J. 140-465.
14 Ratzmann KP, Strese J, WittS, Berling H, Michaelis D (1984). Mumps infection and insulin dependent diabetes mellitus. Diabetes Care 7:170-173.

Insulin auto-antibodies 82
15 Rubinstein P, Waker ME, Fedna B, Witt ME, Cooper LZ, Ginsberg-Rellner F (1982). The HLA-system in congenital rubella patients with and without diabetes. Diabetes 31:1088-1091.
16 Vardi P, Ziegler G, Mathews, JH, Dib S, Keller RJ, Ricker AT, Wolsdorf JI, Herskowitz RD, Radizadeh A, Eisenbarth GS, Soeldner JS (1988). Concentration of Insulin Auto-antibodies at onset of type 1 diabetes. Inverse log-linear correlation with age. Diabetes Care 11:736-738.
17 Vaandrager GJ, Molenaar JI, Bruining GJ, Plantinga AD, Ruiterberg EJ (1986). Islet cell antibodies, mumps infection and mumps vaccination. Diabetologia 29:406.
18 Hodson ME, Taylor P ( 1987). Auto-antibodies in infections of the respiratory tract with Mycoplasma pneumoniae or influenza virus A. Eur. J Respir. Dis. 71:86-92.
19 Gamble DR, Taylor KW (1969). Seasonal incidence of diabetes mellitus. Br. Med. J Ill:631-633.
20 Christy M, Green A, Christan B, Kromann H, Nerup J (1979). Epidemiologic studies of insulin dependent diabetes mellitus. Diabetes Care 2:127-130.
21 Helgason T,Jonasson MR (1981). Evidence for a food additive as a cause of ketosis-prone diabetes. Lancet 2:716-720.
22 Watkins PJ, Soler NG, Fitzgerald MG, MalingJM (1970). Diabetic ketoacidosis during the influenza epidemic. Brit. Med. J 4:89-91.

83 Chapter 7
Chapter 7
General discussion and conclusions

General discussion 84
This general discussion will be restricted to the main topics and some questions that have not been touched upon since the most controversial issues have been extensively dealt with in the discussion part of each individual chapter. In chapter 2 and 3 it has been documented that diabetes mellitus is a very constant risk factor over a period of several decades. Even in recent years new genera of antibiotics and other products of modern medical technology cannot prevent that mortality in diabetic patients hospitalized for pneumonia and acidosis rises to circa 25% in periods of epidemic influenza. There may be several explanations for the remarkable consistency of diabetes mellitus as a risk factor in influenza infection. First, the clinical picture of diabetes itself has changed. Insulin therapy and the close monitoring of metabolic control have enabled patients to live an almost normal live and what is more important to live considerably longer. This longevity by its nature confers new health hazards. Chronic cardiovascular disease, renal impairment and the diabetic foot are not only serious problems in day to day care but are all independent risk factors in influenza infection. Second, an impaired immune respons to the influenza virus itself probably contributes to increased morbidity and mortality as is discussed in chapters 4 and 5. This impaired immune response may in part be due to poor metabolic control. However as long as insulin therapy and dietary measures are dependent on the cooperation of the individual patient the hope for decisive improvement in this field should be met with scepticism. For the other part there is sound evidence to suggest that in wel controlled patients decreased antibody production against influenza antigens is not influenced by metabolic regulation in type 1 diabetes mellitus. What for the future? Though improvements in the medical care of diabetic patients may favourably influence influenza morbidity, new hazards will be introduced. Cyclosporin therapy and the transplantation of pancreatic tissue will lead to an immunosuppressed state that makes patients more vulnerable in the case of influenza infection. Actually, it must be born in mind that since the last major influenza epidemic of 1968 medical science has created a complete new risk group of patients who are immunosuppressed for various reasons. From the results of the study presented in chapter 4 one could easily have the false impression that there is nothing wrong with the humoral immune response in patients with type 2 diabetes mellitus. There is indeed no
85 Chapter 7
significant difference in antibody production and protection rate in comparison with the control population. Still, the protection rate that is achieved for the influenza A HlNl and influenza B components is insufficient. This poor response may be explained by the high age of the population studied. Other investigators have reported similar disappointing results in the aged ( 1 ). This poor outcome is the more disturbing since several risk factors tend to accumulate in these patients. Barker and Mullooly have demonstrated that accumulation of risk factors increases relative mortality risks exponentially (2). For some physicians, diabetologists in particular, the conclusions from this thesis may seem to be contradictionary. At one side patients with diabetes mellitus have an increased influenza morbidity, at the other side protection achieved by vaccination is not always sufficient. So, what to do? In my opinion there is only one answer: annual vaccination. Actually, there are no alternatives at this moment. Vaccination will still confer protection in 50-70% of vaccinated individuals. Moreover one should not forget that even if infection does occur vaccination may still alleviate illness (3,4). One should vaccinate all patients with diabetes mellitus, including patients who are well controlled because 1. optimal metabolic control will not prevent infection, 2. the immune response to influenza may be impaired even in well controlled diabetic patients, 3. influenza infection can disturb the metabolic equilibrium. There are some additional recommendations. In the first place, in patients with a known poor antibody response one should prefer inactivated whole virus vaccines to subunit vaccines. In the second place, in patients with risk factors besides diabetes the response to influenza vaccination should be monitored with simple standard serological methods, such as HI or single radial haemolysis (SRH). If patients remain unprotected they should receive amantadine 200 mg daily during an eventual later influenza A epidemic. For now this strategy should suffice but for the future we urgently need more immunogenic vaccines and effective antiviral agents.

General discussion 86
Conclusions:
- Diabetes mellitus has been a remarkable constant risk factor in influenza infection over the last 60 years.
- During influenza epidemics death rates among patients with diabetes mellitus increase with 5-15%.
- The relative risk for patients with diabetes mellitus to be hospitalized with a diagnosis of influenza infection measures approximately 6.0 in epidemic periods.
Mortality from diabetic acidosis 1s significantly increased during influenza epidemics.
- The humoral immune response to influenza vaccine in patients with type 1 diabetes mellitus is impaired independently of metabolic controL
- Delayed type hypersensitivity reaction to influenza antigens is decreased in poorly controlled patients with diabetes mellitus.
- The cytotoxic T -cell response after influenza A sub-unit vaccination decreases with higher percentages of glycosylated haemoglobin.
- Subunit vaccines are insufficient in boostering cytotoxic T -cell response.
- There is no evidence for the production of insulin auto-antibodies after confrontation with common viral antigens, influenza among others.
- The level of insulin auto-antibodies of the IgM class has a very strong inverse correlation with age.

87 Chapter 7
References
Phair J, Kaufman CA, Bjornson A, Adams L, Linneman C (1978). Failure to respond to influenza vaccine in the aged; correllation with B-cell number and function. J Clin. Med. 92:822-828.
2 Barker WH, Mullooly JP (1982).Pneumonia and influenza deaths during epidemics. Arch.Intern.Med. 142:85-89.
3 Foy HM, Cooney MK, Allan ID ( 1981 )- Influenza B virus vaccines in children and adults. Adverse reactions, immune response and observations in the field. J In£ Dis. 143:700-706.
4 Hobson P, Curry RL, Beare AS (1972). The role of serum haemagglutinationinhibiting antibody in protection against challenge infection with influenza A2 andB viruses.]- Hyg. Camb. 70:767-777.

General discussion 88

89 Summary
Summary
In chapter I (General introduction) a short survey is given on the history of influenza infection, it's epidemiology and the immune response induced by natural infection and vaccination. Hippocrates in the 5th century B.C. for the first time described influenza infection. The disease was named influenza by the Italians in the sixteenth century to indicate that a disease with such a sudden onset almost certainly was influenced by the stars or special climatic circumstances. There are three types of influenza viruses; A, B and C. Influenza type A and B give rise to the same clinical symptoms, influenza C is only involved in minor infections of the upper respiratory tract. In type A viruses minor antigenic changes occur on a year-to-year basis. This phenomenon is called antigenic drift and enables the influenza virus to circumvent the immunity that is build up in a population by succeeding infections. Once in every 8-15 years there appears a new influenza A virus which will cause a major epidemic. In this century two pandemics were observed; in 1918-1919 and 1957. The 1918-1919 pandemic, known as the Spanish flu took 20 million lives world wide, more than the just ended world war I. Antigenic challenge with influenza virus will elicit both a humoral and a cellular immune response. The humoral immune response, in particular the formation of haemagglutination inhibiting antibodies is important in conferring protection against a new infection, while the cellular immune response mediated mainly by cytotoxic T -cells is decisive in recovery from infection. It has been demonstrated that influenza vaccination wil protect against infection if HI antibody levels over 1 00 are achieved. However, immune response after influenza vaccination is still disappointing in several risk groups, patients with diabetes mellitus among others.
In chapter 2 epidemiologic data on influenza pneumonia and mortality results of clinical studies and the outcome of nfluenza vaccination trials are reviewed. All excess mortality studies that specify for underlying disease list diabetes as one of the major risk factors. During influenza epidemics death rates among patients with diabetes mellitus may increase with 5-15%.

Summary 90
Diabetes mellitus is also mentioned as a risk factor in most clinical studies making up 3 to 14% of the patients studied. Even in recent studies diabetes mellitus is only preceded as a risk factor by cardiovascular disease and chronic pulmonary disorders. Patients with diabetes mellitus are probably more prone to the complication of secondary staphylococcal pneumonia, because of an increased carrier rate and an impaired immune response to this organism. Abdominal complaints were noted in several patients and may precede diabetic ketoacidosis by several days.
In chapter 3 the influence of epidemic influenza on hospitalizations because of influenza, pneumonia and diabetic acidosis was investigated. Patients with duodenal ulcer were used as a control population. Relative risk for hospitalization because of influenza infection was calculated to be 5.7 resp. 6.2 for the epidemic years 197 6 and 1978. The relative risk to die during hospitalization rose from 30.9 in 1977 to 91.8 in 1978. The number of hospitalizations for ketoacidosis was 50% higher in 1978 than in the other three years studied. During the epidemic years 25.7% of patients hospitalized for pneumonia died, while this percentage was 14.6% in the non-epidemic years (p <0.05). Differences in mortality due to diabetic acidosis were similar 25.4% in epidemic and 14.7% in non-epidemic years (p <0.01). During the 1978 epidemic one out of every 1300 patients with diabetes mellitus was hospitalized because of pneumonia. It is estimated that 1 of every 260 patients with IDDM was hospitalized for diabetic acidosis.
In chapter 4 the antibody response and delayed type hypersensitivity reaction to a trivalent influenza vaccine in 159 patients with diabetes mellitus was compared with response and reaction in 28 healthy volunteers. A correction for prevaccination titres was made. No differences were found between diabetic patients and control subjects with respect to the antibody response to the three vaccine strains as measured by the difference between geometric mean titres of post- and prevaccination sera. In type 1 (insulin-dependent) diabetic patients the incidence of nonresponders to two vaccine components was significantly decreased in patients with high concentrations of glycosylated haemoglobin (p <0.0 1 ).

91 Summary
In chapter 5 the cytotoxic T -cell response to an influenza A- H1N1 subunit vaccine in 14 patients with type 1 diabetes mellitus was compared with the response in 13 healthy volunteers. Cytotoxic T -cell response to vaccination was poor in both patients and controls. At a calculated 50:1 effector-target cell ration, however, significandy more controls than patients showed an increase of over 5% cytotoxic T -cell mediated lysis after vaccination (p <0.05). In patients the cytotoxic T -cell response decreased with higher percentages of glycosylated heamoglobin (regression coefficient =P 0 with p <0.05). No significant difference was found between diabetic patients and control subject with respect to antibody response after vaccination.
In chapter 6 the production of insulin auto-antibodies (IAA) was studied after common viral infections in 12 children with type 1 diabetes mellitus and in their 18 healthy siblings. In addition the production of IAA was measured after influenza vaccination with booster in 39 patients with type 1 diabetes mellitus and 39 healthy controls. In 7 of 12 diabetic children 13 viral infections were serologically confirmed. Among the siblings 14 periods of infection were noted in 9 individuals. A significant rise in IAA titre was demonstrated in patients twice (IgG both times) and in siblings 11 times (IgM 5 x, IgG 6 x). In only three cases the rise in antibody titres occured 6-12 weeks after documented infection. For IgM IAA there was a significant inverse correllation with age in both patients (r~0.89, p <0.0001) and siblings (r=0.67, p <0.001). After influenza vaccination a significant increase in IAA was noted twice; IgM IAA in a patient with diabetes and IgG in a healthy volunteer. A fourfold decrease in IgG IAA was demonstrated in one diabetic patient. From these results it is concluded that insulin auto-antibody formation is not a direct sequela of viral infection or vaccination.

Summary 92

93 Samenvatting
Samenvatting
In hoofdstuk 1 (algemene inleiding) wordt een kort overzicht gegeven van historische gegevens met betrekking tot influenza, de epidemiologie en de immuniteit die opgebouwd wordt na infectie en vaccinatie. Hippocrates beschreef in de Se eeuw voor Christus voor het eerst de klassieke symptomen van de influenza-infectie. De ziekte kreeg de naam influenza van de Italianen in de 16e eeuw. Zij wilden hiermee aangeven dat een ziekte die zo plotseling begon (in-fluere ~ binnenvallen) vrijwel zeker werd veroorzaakt door de stand van de sterren of bijzondere klimatologische omstandigheden. Het influenza virus kent drie typen; A, B en C. Influenza A en B veroorzaken een identiek ziektebeeld, influenza C geeft slechts aanleiding tot relatief onschuldige bovenste luchtweginfecties. Influenza A ondergaat jaarlijks kleine antigene veranderingen. Dit verschijnsel wordt antigene drift genoemd en stelt het influenza virus in staat om de in de gemeenschap opgebouwde afweer te omzeilen. Elke 8 a 12 jaar verschijnt er een nieuw influenza A virus wat aanleiding geeft tot een epidemie van grote omvang. In deze eeuw werden twee pandemieen waargenomen; in 1918-1919 en in 19 57. De pandemie van 1918-1919 werd bekend als de Spaanse griep en eiste 20 miljoen doden, meer dan de voorafgaande wereldoorlog I. Contact met het influenza virus zal aanleiding zijn tot zowel een humorale als een cellulaire immuunrespons. De humorale immuunrespons, in het bijzonder de produktie ven haemagglutinatie remmende (HAR) antilichamen, is van belang bij het verwerven van bescherming tegen nieuwe infecties. De cellulaire afweer daarentegen is met name van belang bij het herstel van een infectie. Het staat vast dat influenza-vaccinatie in hoge mate beschermt indien HAR-titers worden bereikt van boven de 100. Helaas laat de antilichaamproduktie na vaccinatie bij sommige risico populaties zoals patienten met diabetes mellitus nog steeds te wensen over.
Hoofdstuk 2 is een literatuuroverzicht van epidemiologische studies met betrekking tot influenza, pneumonie en mortaliteit, uitkomsten van klinisch onderzoek, en de resultaten van influenza vaccinatie trials. Alle onderzoekingen naar de oversterfte tijdens influenza-epidemieen, die

Samenvatting 94
een onderverdeling maken naar onderliggende aandoeningen, vermelden diabetes als een van de belangrijkste risicofactoren. Gedurende influenzaepidernieen neemt de sterfte onder patienten met diabetes mellitus toe met 5 a 10%. Ook in de meeste klinische studies wordt diabetes mellitus als risicofactor genoemd bij 3-14% van de beschreven patienten. Zelfs in de meest recente onderzoeken wordt diabetes mellitus als risicofactor slechts voorafgegaan door cardiovasculaire en chronische luchtwegaandoeningen. Patienten met diabetes mellitus lopen waarschijnlijk een grotere kans op een stafylococcen-pneumonie als secundaire complicatie aangezien zij vaak drager zijn van deze bacterie en omdat hun a:S.veer tegen de stafylococ verrninderd is. Bij verschillende patienten met diabetes mellitus wordt melding gemaakt van buikkl~chten die enige dagen voorafgaan aan het optreden van een keto-acidose.
In hoofdstuk 3 worden de resultaten gepresenteerd van onderzoek naar de invloed van influenza-epidernieen op het aantal ziekenhuisopnames wegens influenza, pneumonie en diabetische acidose. Patienten met een ulcus duodeni fungeerden als controle-populatie. Het relatieve risico om opgenomen te worden met een influenza-infectie bedroeg 5.7 respectievelijk 6.2 voor de epidemische jaren 1976 en 1978. Het relatieve risico voor overlijden tijdens ziekenhuisopname steeg van 30.9 in 1977 tot 91.8 in 1978. Het aantal ziekenhuisopnames wegens keto-acidose was in 1978 SO% hoger dan in de overige 3 onderzochte jaren. In de twee epidemische jaren (1976 en 1978) overleed 25.7% van alle patienten die werden opgenomen met een pneumonie, in de niet-epidernische jaren bedroeg dit percentage 14.6% (significant verschil p <0.05). Het verschil in sterfte ten gevolge van diabetische acidose was in dezelfde orde van grootte; 25.4% in epidernische en 14.7% in niet-epidernische jaren (p <0.01). Gedurende de epidernie van 1978 werd 1 op 1.300 patienten met diabetes mellitus in het ziekenhuis opgenomen met de diagnose longontsteking. Geschat werd dat van de patienten met een insuline afhankelijke diabetes 1 op de 260 werd opgenomen in een toestand van diabetische acidose.
In hoofdstuk 4 wordt de antilichaamproduktie en vertraagd type

95 Samenvatting
overgevoeligheidsreactie bij 15 patienten met diabetes mellitus tegen een trivalent influenza-vaccin vergeleken met de response bij 28 gezonde vrijwilligers. Er werd gecorrigeerd voor hoge prevaccinatie titers. Er werd geen verschil tussen patienten en vrijwilligers gevonden in de hoogte van de antilichaamproduktie uitgedrukt als het verschil in het geometrisch gerniddelde van de antilichaamtiters in post- en prevaccinatie sera. Bij patienten met een type 1 (insuline afhankelijke) diabetes mellitus was een statistisch significant grater aantal non-responders ten opzichte van 2 van de drie vaccin componenten (p <0.05). De vertraagd type overgevoeligheidsreactie tegen influenza antigeen was verrninderd bij patienten met een hoge concentratie geglycosyleerd haemoglobine (p <0.01).
In hoofdstuk 5 wordt de cytotoxische T -eel respons bij 14 patienten met een type 1 diabetes na vaccinatie met een influenza A-H1N 1 subunit vaccin vergeleken met de respons bij 13 gezonde vrijwilligers. Bij zowel patienten als controles bleek de respons tegen te vallen. Bij een berekende 50:1 ratio van effector en target-cellen bleken echter meer con troles dan patienten een stijging van 5% van de cytotoxische T -eel reactie te vertonen na vaccinatie (p <0.05). In de patientengroep daalde de cytotoxische T -eel res pons bij toename van het percentage geglycosyleerd haemoglobine (regressie coefficient~ 0 met p <0.05). Met betrekking tot de humorale respons werden geen verschillen gevonden tussen patienten en controlegroep.
In hoofdstuk 6 worden de resultaten gepresenteerd van onderzoek naar de produktie van insuline-autoantilichamen (IAA) na virale infecties bij 12 kinderen met een type 1 diabetes mellitus en hun 18 broertjes en zusjes. Tevens werd onderzoek gedaan naar de produktie van IAA bij 39 patienten met type 1 diabetes mellitus en bij 39 gezonde vrijwilligers na influenzavaccinatie met booster. Bij 7 van de 12 diabetische kinderen werden serologisch 13 virale infecties vastgesteld. Negen van de 18 broertjes en zusjes maakten in totaal14 infecties door. Een significante titetstijging van IAA werd 2 maal gezien in de patintengroep (beide keren IgG) en 11 maal bij de broertjes en zusjes (IgM 5x, IgG 6x). In slechts drie gevallen vond de titerstijging plaats in een periode van 6-12
Samenvatting 96
weken na een serologisch aangetoonde infectie. De hoogte van de IgM IAA titer was negatief gecorrelleerd met de leeftijd bij zowel de patien~es (r=89, p <0.0001) als bij de broer~es en zusjes (r=67, p <0.001). Bij de onderzochte volwassenen werd na influenza-vaccinatie tweemaal een significante stijging van de IAA titer waargenomen; een IgM stijging bij een patient met diabetes mellitus en een lgG stijging bij een gezonde vrijwilliger. Een viervoudige daling van IgG IAA werd vastgesteld bij een patient met diabetes mellitus. Op basis van deze uitkomsten wordt gecondudeerd dat de produktie van IAA geen direct gevolg is van antigene stimulatie door vaccinatie of viraal infect.

97 W oord van dank
Woord van dank
Het verrichten van promotie-onderzoek en het schrijven van een proefschrift is slechts mogelijk met de niet aflatende steun van velen. Het afzonderlijk vermelden van elke individuele bijdrage leidt onherroepelijk tot een foutieve volgorde en omissies. Daarom aan eenieder die het hier gepresenteerde heeft mogelijk gemaakt: mijndank. De publikatie van dit boekje werd mede mogelijk gemaakt door Duphar Nederland en Merck Sharp & Dohme.

Curriculum vitae 98
Curriculum vitae
De auteur van dit proefschrift werd in 1954 geboren te Inanwatan, gelegen op Irian J aya, het voormalig N ederlands Nieuw-Guinea. Hij bezocht het Pieter Caland lyceum te Rotterdam en later het Herman Jordan lyceum (methode Montessori) te Zeist, waar hij in 1971 het Gymnasium-B diploma behaalde. Na een periode met enigszins wisselende beroepsuitoefening werd in september 1973 aangevangen met de opleiding psychiatrische verpleegkunde in het Christelijk Sanatorium te Zeist. Diplomering als Bverpleegkundige geschiedde noodgedwongen in een andere instelling, het Willem Arntz Huis te Utrecht in 1977. Inmiddels was reeds gestart met de studie Rechten aan de Rijks Universiteit Utrecht. Deze studie werd vooralsnog na het behalen van het kandidaats beeindigd daar een jaar eerder een begin was gemaakt met de studie Geneeskunde aan dezelfde universiteit. Het artsexamen werd gedaan in 1984. Na een korte periode te hebben gefunctioneerd als afdelingsarts in het Willem Arntz Huis werd nog in 1984 aangevangen met de opleiding tot medisch microbioloog (viroloog) in het academisch ziekenhuis Dijkzigt te Rotterdam (opleiders pro£ dr. N. Masurel en pro£ dr. M.F. Michel). Gedurende zijn specialisatie werd een begin gemaakt met het onderzoek dat tot dit proefschrift zou leiden. Na registratie als medisch microbioloog is hij als arts-microbioloog verbonden aan het Streeklaboratorium voor de Volksgezondheid, Stichting P.A.M.M., te Eindhoven.

99 Appendix
Appendix
Humoral immune response after influenza vaccination with booster in patients with type 1 diabetes mellitus
KP Bouter (1), IqA Diepersloot (2), WEP Beyer (2),JBL Hoekstra (1), R van Bruggen (1), DW Erkelens (3) and N Masurel (2).
1. Department oflnternal Medicine, Diakonessen Hospital, Utrecht. 2. Department ofVirology, University Hospital Dijkzigt, Rotterdam. 3. Department of Internal Medicine, University Hospital, Utrecht, The
Netherlands.
Published in Journal for Drugtherapy and Research: 2:50-53, 1989.

Appendix 100
Summary
The antibody response after single and after booster vaccination with a commercially available trivalent influenza vaccine in 39 patients with type 1 diabetes mellitus was compared with that in 39 healthy volunteers. Irrespective of pre-vaccination status, the protection rate against two vaccine strains (influenza A-H1N1 and influenza B) was significantly lower in patients than in controls (influenza A-H1N1: 72% vs. 92%, P<0.05; influenza B: 77% vs. 95%, P< 0.05). If a correction for prevaccination titres was made, the levels of seroresponse in patients became even more unfavourable for these two vaccine components. Moreover, the protection rate for the A-H3N2 vaccine strain became significantly lower in patients as compared to control subjects (85% vs. 100%, P< 0.05). After a second correction (history of previous influenza vaccinations), patients still showed an unfavourable seroresponse to the A-H3N2 and AH1N1 components. The booster vaccination had benefits only for the influenzaB strain, but not for the A-H1N1 strain. High concentrations of Hb1Ac did not impair antibody production. Implications for vaccination strategy are discussed.
Key words: influenza vaccination, diabetes mellitus,humoral 1mmune response.
Introduction
Excess mortality from epidemic influenza in patients with diabetes mellitus has been extensively documented ( 1-4 ). Houseworth and Langmuir ( 1) noted a significant increase in deaths from diabetes during six of seven influenza epidemics studied. Underlying cardiac disease further augments the mortality risk (2). As a consequence, annual vaccination of diabetic patients using vaccines composed according to the recommendations of the World Health Organization has now been widely accepted. In a previous study on the effect of influenza vaccination in patients with

101 Appendix
diabetes mellitus it was concluded that the humoral immune response after vaccination was impaired in type 1 but not in type 2 diabetic patients. Moreover, the number of patients remaining unprotected after a single vaccination was substantial (5). Therefore, in this study we evaluated the effect of a booster immunization after four weeks in patients with type 1 diabetes mellitus.
Subjects and methods
Subjects
Patients studied were attending the outpatient clinic of the Department of Internal Medicine of the University Hospital, Utrecht, The Netherlands. Patients were considered to be type 1 if there had been documented ketoacidosis, abrupt onset of symptoms requiring insulin therapy at age < 40 years, and no increase of C-peptide after stimulation with glucagon. If there were still some doubts, a HLA typing was done or Islet cell antibodies were measured. In total 39 patients with type 1 diabetes were studied, 19 men and 20 women, mean age 28.1 ± 6.7 years, range 17-39 years, mean duration of illness 9.6 ± 8.1 years, fasting mean C-peptide 0.083 ± 0.10 nmol/1, after stimulation with glucagon (1 mg) mean C-peptide 0.094 ± 0.10 nmol/1, mean HbA1c 8.3%, range 5.4-14.9%. Retinopathy was diagnosed in 30.7%, nefropathy in 2.5% and neuropathy in 38.4% of the patients. 22 patients had been previously vaccinated against influenza, at least one year before. The other subjects had never before received an influenza immunization. Control subjects were 39 healthy volunteers, 9 men and 30 women, mean age 22.7 ± 4.2 years, range 17-39 years, mean HbA1c 4.8%, range 3.8-5.7%. One of them had been previously vaccinated. Exclusion criteria for vaccination were allergy to egg protein or elevated temperature on the day of vaccination. Written consent was obtained from all participants, and approval for the study was obtained from the Ethical Committee of the University Hospital, Utrecht.

Appendix 102
Vaccine: dosage and administration
On day 0, each subject received an intramuscular llljection of 0.5 ml commercially available inactivated whole virus vaccine (Influvac, Duphar, Amsterdam, The Netherlands) containing 10 f,lg haemagglutinin (HA) of N Mississippi/1/85 (H3N2) virus, 10 !lg HA of NChile/1/83 (H1N1) virus and 15 f,lg HA ofB/ Ann Arbor/1/86 virus. A booster vaccination with the same vaccine was performed four weeks later (day 28).
Laboratory investigations and calculations
Blood samples were obtained on day 0, 28, and 56. Sera were separated immediately after blood collection and clotting and stored at -20 oc until titration. Influenza strains were propagated in embryonated hen's eggs. Because of the low avidity of the influenza B virus, infectious egg fluids of this strain were treated with aether according to Berlin et al (7) and the watery phase was used in the serologic tests. Serum haemagglutination inhibition (HI) titres were determined twice by standard methods (8) simultaneously in pre- and post vaccination sera. Titres were expressed as reciprocals of the dilution showing 50% haemagglutinination inhibition with three haemagglutination units of the antigen. From the results of the two determinations per serum and per antigen, the geometric means were used for further calculations. Negative titres (< 9) were arbitrarily regarded as 5. With the method used, protection against influenza is thought to be associated with an HI titre of 100 for influenza A (9). No protection threshold is known for aether-treated influenza B strains. For this study an HI titre of 200 was assumed to be protective ( 10 ). The serologic response upon vaccination was expressed using the following criteria: 1) the mean-fold increase (MFI) (i.e. the difference between the logarithmated geometric mean titres of post- and prevaccination sera); 2) the response rate (i.e. the proportion of subjects with a 4-fold or greater titre increase after vaccination); 3) the protection rate (i.e. the proportion of subjects exceeding the threshold titre of 100 or 200 after vaccination).

103 Appendix
Glycosylated haemoglobin
The percentage of glycosylated haemoglobin (HbAlc) on the day of vaccination was determined by a commercially available column test (Bio Rad Laboratories, Richmond, Cali£, USA). In short, a small quantity of whole blood is mixed with a haemolysis reagent. An aliquot of the haemolysate is then applied to a weakly acidic cation exchange resin in a disposable column. The HbA1a and HBA1 b fractions are first eluted by adding a buffer. The HbA1c fraction is then eluted separately by adding a second dilution/developing reagent. The relative
percentage concentration of HbA1 c is determined spectrophotometrically ( 11 ).
Statistical analysis
Quantitative measures are presented as mean ± SD. Differences in qualitative measures were tested for significance by the chi-square test, and in quantitative measures by the Wilcoxon rank test.
Results
The overall protection rates after a single vaccination for all subjects, regardless of their prevaccination titres, are shown in Table 1. The
Table 1 Overall protection rate against three influenza strains after single vaccination in control subjects and in patients with diabetes mellitus.
Vaccine Control subjects Patients components
A-H3N2 39/39(100%) 37/39(95%) A-HlNl 36/39( 92%) 28/39(72%)* B 37/39( 95%) 30/39(77%)*
* Different from controls (P<0.05)

Appendix 104
protection rates are lower in patients for all vaccine components, the differences being significant on the 5%-level for the H1N1 and the influenza B component (P< 0.05). In Tables 2-4, separately for the three vaccine strains, patients and control subjects are subdivided according to their protection state prior to vaccination. Subjects with pre vaccination titres > 100 (influenza A) or > 200 (influenza B) were excluded from subsequent calculations. Since 22 patients had been previously vaccinated, they were further subdivided according to history of previous vaccination. In the control group the data of the only participant who had been previously vaccinated are not included. For the A-H3N2 vaccine component (Table 2) all 22 previously vaccinated patients still had prevaccination titres > 100 and they were subsequently excluded. The established seroresponse was high in control subjects ( 100% and 96% for protection and response rates, respectively) and only slightly lower in patients (protection rate 85%, P < 0.05). Great differences, however, were revealed for the A-H1N1 strain (Table 3) and the B strain (Table 4): while response and protection rates in control subjects reached values between 80 and 92%, patients showed a significantly impaired response (rates 45-59%) and a much lower overall MFL A history of vaccination one or more years prior to the actual vaccination was especially associated with a very low seroresponse (rates 18-45%). If these subjects were excluded, the seroresponse still remained slightly impaired, in part significantly (protection rate to A-H1N1 component 91% vs. 69%, P < 0.05, for control subjects and patients, respectively). The protective effect of the booster vaccination (Table 5) was not measurable for the H3N2 strain as only 2 subjects had postvaccination titres < 100 after single vaccination. Only one of 11 patients not protected against the H1 N1 component after the first vaccination, reached a titre> 100 after the second vaccination. For the influenza B strain the booster vaccination was more favourable: 5 out of 9 patients reached the protective threshold after a second vaccination. There was no correlation between the measures of seroresponse and concentration of HbA1c. Table 6 shows similar MFI-values of the three strains for two classes ofHbA1c-values (normal:< 6.5%; elevated:> 6.5%) in control subjects and patients with a prevaccination titre< 100 and< 200 for influenza A and influenza B respectively, who had not been previously vaccinated.

Table 2 Serologic response to the H3N2 vaccine component in control subjects and in patients with diabetes mellitus
Subjects with pre-vaccination titres > 100
Subjects studied
Overall MFI (± SD)
Response rate (n, %)
Protection rate (n, %)
* Different frmn controls (P<0.05).
Controls not previously vaccinated
n~38
10
28
1. 75(±0.62)
27(96%)
28(100%)
All patients
n~39
26
13
1.62(±0.85)
11 (85%)
11(85%)*
Patients Patients previously not previously vaccinated vaccinated
n~22 n~17
22 4
0 13
1.62(±0.85)
11 (85%)
11(85%)*
....... 0 v.
'~ <'I> ;::s ~ ~·

Table 3 Serologic response to the H1N1 vaccine component in control subjects and in patients with diabetes mellitus
Subjects with pre-vaccination titres > 100
Subjects studied
Overall MFI (± SD)
Response rate (n, %)
Protection rate (n, %)
* Different from controls (P<0.05) ** Different from controls (P<O.O 1)
*** Different from controls (P<O.OO 1)
Controls not previously vaccinated
n~38
5
33
1.37(±0.84)
27(82%)
30(91%)
All patients
n~39
14
25
0.88(±0.83)*
12(48%)
14(56%)***
Patients previously vaccinated
n~22
13
9
0.4(±0.28)**
2(22%)*
3(33%)**
Patients not previously vaccinated
n~17
16
1.15(±0.91)
10(62%)
11(69%)*
~ :g ~ ~
1-' 0 0\

Table 4 Serologic response to the influenza B vaccine component in control subjects and in patients with diabetes mellitus·
Subjects with pre-vaccination titres > 100
Subjects studied
Overall MFI (± SD)
Response rate (n, %)
Protection rate (n, %)
* Different from controls (P<0.05) ** Different from controls (P<O.O 1)
*** Different from controls (P<O.OO 1)
Controls not previously vaccinated
n~38
13
25
1.18(±0.58)
20(80%)
23(92%)
All patients
n~39
17
22
0.69(±0.63)*
10(45%)***
13(59%)*
Patients Patients previously not previously vaccinated vaccinated
n~22 n~17 --
11 6
11 11
0.35(±0.30)** 1.03(±0.70)
2(18%)** 8(73%)
5(45%)* 8(73%)
,.... 0 --..)
~ :g ~ ~

Appendix 108
Table 5 Effect of booster vaccination in control subjects and in patients with diabetes mellitus.
Vaccine components Control subjects Patients
A-H3N2 -1- 0/2 A-H1N1 0/3 1/11 B 0/2 5/9
Subjects protected after second vaccination/subjects unprotected after first vaccination
Table 6 MFI values (± SD) of three vaccine components for normal and elevated HbA1 c levels in unprotected and previously unvaccinated subjects (numbers of subjects between brackets)
Mean fold increase HbAlc A-H3N2 A-H1N1 B
<6.5% 1.69±0.67(30) 1.40±0.85(36) 1.09±0.62(26)
>6.5% 1.75±0.80(11) 1.33±0.95(13) 1.14±0.68(1 0)
Discussion
The overall protection rates of 39 patients with diabetes type 1 (Table 1)
showed a diminished antibody response against two of the three vaccine components, if compared to 39 healthy control subjects within the same age range. Different factors may contribute to this finding:
1) Prevaccination antibody titres strongly influence the humoral immune response after influenza vaccination. Therefore, titre > 100 for influenza A and> 200 for influenza B led to exclusion in Tables 2 to 4.

109 Appendix
2) Vaccination in previous years had a marked effect on the outcome of the serologic determinations. This might be partly due to a selection bias: participants who were non-responders after last year's vaccination will be disproportionally represented in the results after excluding for high prevaccination titres. Hoskins et al. (12) found a decreasing protection with time in a survey on the effect of influenza vaccination covering a 6-year period, and wondered whether annual revaccination confers any long-term advantage. The phenomenon of a possibly decreasing antibody production in persons regularly vaccinated is a matter of concern and needs further investigation.
3) Perhaps the pathological proces that is responsible for the development of type 1 diabetes, also contributes to the diminished immune response after vaccination. In accordance to this hypothesis after correction for 1) and 2), the immune response of patients appears lower than that of controls. This is in accordance with an earlier study in which we concluded that the humoral response after influenza vaccination was impaired in type 1 but not . in type 2 diabetic patients (5). Pozzilli et al. ( 13) experienced similar results in their study on the protection against hepatitis B virus following vaccination in patients with type 1 diabetes. An explanation may be the well-established depression ofT -cell function in type 1 diabetes ( 14 ). Antibody formation against influenza antigens is a T -cell dependent process ( 15). Another possible seroresponseimpairing pathway in diabetes mellitus patients involving high levels of glycosylated haemoglobulin is not evident. In an earlier study it was shown that the concentration ofHbA1 c in diabetes mellitus patients was associated with an impairment of the delayed type hypersensitivity but not ofhumoral response (5). This latter finding has been confirmed in the present study. A booster effect was present for the B strain, but absent for A-H1Nl. Similarly disappointing results in boostering influenza vaccination have been described for other risk groups (16,17). It can therefore be concluded that boostering influenza vaccination in patients with type 1 diabetes mellitus is not advisable. For patients with risk factors besides diabetes, we suggest that the response to influenza vaccine be monitored with simple standard serological methods, such as HI or single radial haemolysis (SRH) ( 18). If patients remain unprotected, they should receive amantadine during an eventual later epidemic elevation, which may prevent or alleviate

Appendix 110
influenza type A but not type B infection (19).At dosages of200 mg per day, amantadine is generally well-tolerated. In children and in patients with impaired renal function the dosage regimen should be adjusted accordingly (20).
Acknowledgements
This study was financially supported by a grant from the Dutch Prevention Fund. The influenza vaccine was kindly provided by Duphar-Nederland, Amsterdam. We wish to thank dr. J. Huisman for organisatorial assistance, mrs. J. den Ronden-de Jong for technical assistance and mrs. R.S. EngelsBakker for preparation of the manuscript.

111 Appendix
References
1. Houseworth J, Langmuir AD. Excess mortality from epidemic influenza, 1957-1966. AmJ.Epidemiol. 100:40-47, 1974.
2. Barker WH, Mullooly P. Pneumonia and influenza deaths during epidemics. Arch.Intern.Med. 142: 85-89, 1982.
3. Eickhoff TC, Sherman JL, Serfling RE. Observations on excess mortality asssociated with epidemic influenza. J.A.M.A 176:776-782, 1961.
4. Polak MP. Influenza mortality in de herfst van 1957. N.T.v.G. 103:1098-1109, 1959.
5. Diepersloot RJA, Bouter KP, Beyer WEP, Hoekstra JBL, Masurel N. Humoral immune response and delayed type hypersensitivity to influenza vaccine in patients with diabetes mellitus. Diabetologia 30:397-401, 1987.
6. World Healh Organization. Recommended composition of influenza virus vaccines for use in the 1986-1987 season. Influenza activity, October 1985 -February 1986. WHO Wkly. Epid.Rec. 61:61-68, 1986.
7. Berlin BS, McQueen JL, Min useE, Davenport FM. A method for increasing the sensitivity of the haemagglutination inhibition test with equine influenza virus. Virology 21:665-666, 1963.
8. Masurel N, Ophof P, DeJong P. Antibody response to immunization with influenza NUSSR/77 (HlNl) virus in young individuals primed or unprimed for NNew Jersey/76 (H1N1) virus. J.Hyg. 87:201-209, 1981.
9. Masurel N, Laufer J. A one-year study of trivalent influenza vaccines in primed and unprimed volunteers; immunogenicity, clinical reactions and protection. J.Hyg. 92:263-276, 1984.
10. Beyer WEP, Teunissen MWE, Diepersloot RJA, Masurel N. Immunogenicity and reactogenicity of two doses of a trivalent influenza split vaccine. An open, randomized study in healthy, unprotected, adult volunteers. J.Drug.Ther.Res. 11:369-37 4, 1986.
11. Compagnucci P, Cartechini MG, BolliG, DeFeo P, Santeusanio F, Brunetti P. The importance of determining irreversibly glycosylated haemoglobin in diabetics. Diabetes 30:607-612, 1981.
12. Hoskins TW, Davies JR, Smith AJ, Miller CL, Allchin A. Assessment of inactivated influenza A vaccine after three outbreaks of influenza A at Christ's Hospital. Lancet I:33-35, 1979.

Appendix 112
13. Pozzilli P, Arduini P, Visalli N, Sutherland J, Pezzella M, GalliC, Corradini SG, Biasio L, Gale EAM, Andreani D. Reduced protection against hepatitis B virus following vaccination in patients with type 1 (insulind-dependent) diabetes. Diabetologia 30:817-819, 1987.
14. Quinion-Debrie MC, Debray-Sachs M, Dardenne M, Chernichow P, Assan R, Bach JF. Anti-islet cellular and humoral immunity, T -cell subsets, and thymic function in type 1 diabetes. Diabetes 34:373-379, 1985.
15. Virelizier JL, Postlethwaite R, Schild GC, Allison AC. Antibody response to antigenic determinants of influenza virus haemagglutinin. I. Thymus dependence of antibody formation and thymus independence of immunological memory. J.Exp.Med. 140:1559-1570, 1974.
16. Versluis DJ, Beyer WEP, Masurel N, Wenting GJ, Weimar W. Impairment of the immune response to influenza vaccination in renal transplant recipients by cyclosporine, but not azathioprine. Transplantation 42:376-379, 1986.
17. Versluis DJ, Beyer WEP, Masurel N, Weimar W. Influenza vaccination in dialysis and transplant patients. Antiviral.Res. suppl. 1:289-292, 1985.
18. Oxford JS, Yetts R Schild GC. Quantitation and analysis of specificity of postimmunization antibodies to influenza B viruses using single radial haemolysis. J.Hyg. 88:325-333, 1982.
19. Monto AS, Gunn RA, Bandyk MG, King CL. Prevention ofRussian influenza by amantadine. JA.MA. 241:1003-1007,1979.
20. Ruben FL. New concepts in the control of influenza. Compreh Ther. 13:9-1, 1987.