annual student data report - optometry · averages and totals for those tables. about the asco...
TRANSCRIPT

ANNUAL STUDENT
DATA REPORT
Academic Year 2016-2017
May 2017 www.optometriceducation.org updated June, 2017

ABOUT THE ASCO ANNUAL STUDENT DATA REPORT
The ASCO Annual Student Data Report is developed from data provided by ASCO member schools and colleges of optometry in the 50 states and Puerto Rico. Due to unavailable data during the data collection period, some reporting tables are incomplete, which may affect the accuracy of averages and totals for those tables. If you have questions regarding content, please contact Joanne Zuckerman, Manager, Data Services and Special Projects, via e-mail at [email protected].

2016-2017 ASCO Annual Student Data Report
Table of Contents
i. List of ASCO Member Schools
ii. School Abbreviations
iii. Highlights of Student Data Report
iv. Data Trends
a. Enrollment by Gender, 2007-2017
b. Proportion of Female Students, 2007-2017
c. Race/Ethnicity of Students, Numbers, 2007-2017
d. Race/Ethnicity of Students, Percentages, 2007-2017
e. Race/Ethnicity of Graduates, Numbers, 2006-2016
f. Race/Ethnicity of Graduates, Percentages, 2006-2016
g. Reasons for Students Leaving the OD Program, 2006-2016
h. Average Direct Expenses, 2007-2017
O.D. Program Enrollment
1.1 Full-Time Enrollment by Gender and Year, AY 2016-2017
1.2 Number and Percentage of Full-Time Students by Gender and Year, AY 2016-2017
1.3 Number and Percentage of Full-Time Students by Race/Ethnicity and Year – Summary, AY 2016-2017
1.4 Classification of Total Full-Time Students by Gender and Race/Ethnicity, AY 2016-2017
1.5 Percentage of Total Full-Time Students by Gender and Race/Ethnicity, AY 2016-2017

1.6 Classification of Full-Time, First-Year Students by Gender and Race/Ethnicity, AY 2016-2017
1.7 Percentage of Full-Time, First-Year Students by Gender and Race/Ethnicity, AY 2016-2017
1.8 Classification of Full-Time, Second-Year Students by Gender and Race/Ethnicity, AY 2016-2017
1.9 Percentage of Full-Time, Second-Year Students by Gender and Race/Ethnicity, AY 2016-2017 1.10 Classification of Full-Time, Third-Year Students by Gender and Race/Ethnicity, AY 2016-2017
1.11 Percentage of Full-Time, Third-Year Students by Gender and Race/Ethnicity, AY 2016-2017
1.12 Classification of Full-Time, Fourth-Year Students by Gender and Race/Ethnicity, AY 2016-2017
1.13 Percentage of Full-Time, Fourth-Year Students by Gender and Race/Ethnicity, AY 2016-2017
1.14 Part-Time Enrollment by Gender and Year, AY 2016-2017
1.15 Classification of Total Part-Time Students by Gender and Race/Ethnicity, AY 2016-2017 1.16 Total Enrollment in Programs Leading to the O.D. Degree (includes full-time, part-time and special programs), AY 2016-2017
1.17 Resident/Non-Resident Status, AY 2016-2017 1.18 Permanent Residence of All Students Enrolled (includes part-time students), AY 2016-2017
1.19 Permanent Residence of First-Year Students Enrolled (includes part-time students), AY 2016-2017 1.20 Permanent Residence of Students from Other Countries, AY 2016-2017
1.21 Previous Education of First-Time, First-Year, Full-Time Students, AY 2016-2017 1.22 Applications for Transfer, Professional O.D. Programs, AY 2016-2017
1.23 Admission and Enrollment of Graduates of Foreign Schools to Advanced Standing, AY 2016-2017

Graduates and Special Programs, Professional O.D. Program
2.1 Graduates Receiving the O.D. Degree through Regular and Special O.D. Programs, Comparison of 2015 and 2016
2.2 Classification of Graduates by Gender, Regular and Special Programs, AY 2015-2016
2.3 Classification and Percentages of Graduates by Race/Ethnicity, Regular and Special Programs, AY 2015-2016
2.4 O.D. Degrees Awarded to Graduates of Foreign Schools Upon Completion of a Special Program, AY 2015-2016
2.5 Alternate Programs for the O.D. Degree, AY 2016-2017
2.6 Total Enrollment in Special Programs, AY 2016-2017
2.7 Reasons for Students Leaving the Professional O.D. Program, By School and By Year, AY 2015-2016
2.8 National Board Exam, Requirement and Pass Rates
Financial Aid/Student Expenses in Professional O.D. Program
3.1 Percentage of Students Receiving Financial Aid, and Average Financial Aid Awards, Includes Gift Aid and Self-Help Monies (e.g. loans) Comparison of AY 2014-2015 and AY 2015-2016
3.2 Grants and/or Scholarship Received in the Professional O.D. Program, AY 2015-2016
3.3 State Contract Agreements and Federal Work Study Received in the Professional O.D. Program, AY 2015-2016
3.4 Loans Received in the Professional O.D. Program, AY 2015-2016
3.5 Tuition, AY 2016-2017
3.6 Fees and the Cost of Books and Instruments, AY 2016-2017
3.7 Average Direct Expenses, AY 2016-2017
3.8 Average Living Expenses, AY 2016-2017

3.9 Percentage of Student Expenses Covered by Different Financial Aid Sources, AY 2015-2016
3.10 Optometric Educational Indebtedness of Graduates, AY 2015-2016
3.11 Undergraduate Indebtedness of First-Year Students, AY 2015-2016
3.12 Number of Students Enrolled Under State Contract Agreements, By State, AY 2016-2017
3.13 Number of Students Enrolled Under State Contracts, Contract Amounts and Student Support By State, AY 2016-2017
3.14 Dollar Amount of State Contracts, By State, AY 2016-2017
(updated June 2017)

Annual Student Data Report 2016-2017 i Association of Schools and Colleges of Optometry www.optometriceducation.org
ASCO’s member schools and colleges:
Chicago College of Optometry* Midwestern University 555 31st Street Downers Grove, Illinois 60515 https://www.midwestern.edu
Illinois College of Optometry 3241 South Michigan Avenue Chicago, Illinois 60616 http://www.ico.edu
Indiana University School of Optometry 800 East Atwater Avenue Bloomington, Indiana 47405 http://www.optometry.iu.edu
Inter American University of Puerto Rico School of Optometry 500 John Will Harris Road Bayamon, Puerto Rico 00957 http://www.optonet.inter.edu
MCPHS University School of Optometry 10 Lincoln Square Worcester, MA 01608 https://www.mcphs.edu/academics/school-of-optometry/optometry
Michigan College of Optometry at Ferris State University 1124 S. State Street, Room 236 Big Rapids, Michigan 49307-2256 http://www.ferris.edu/mco
Midwestern University – Arizona College of Optometry 19555 N. 59th Avenue Glendale, Arizona 85308 https://www.midwestern.edu/programs-and-admission/az-optometry.html
New England College of Optometry 424 Beacon Street Boston, Massachusetts 02115 http://www.neco.edu
Northeastern State University Oklahoma College of Optometry 1001 North Grand Avenue Tahlequah, Oklahoma 74464 http://optometry.nsuok.edu/
Nova Southeastern University College of Optometry Health Professions Division 3200 S. University Drive Ft. Lauderdale, Florida 33328 http://optometry.nova.edu
The Ohio State University College of Optometry 338 West 10th Avenue Columbus, Ohio 43210-1280 http://optometry.osu.edu
Pacific University College of Optometry 2043 College Way Forest Grove, Oregon 97116 http://www.pacificu.edu/optometry/
Salus University Pennsylvania College of Optometry Elkins Park Campus 8360 Old York Road Elkins Park, Pennsylvania 19027-1598 http://www.salus.edu/optometry
Southern California College of Optometry at Marshall B. Ketchum University 2575 Yorba Linda Boulevard Fullerton, California 92831 http://www.ketchum.edu/index.php/admissions/od
Southern College of Optometry 1245 Madison Avenue Memphis, Tennessee 38104 http://www.sco.edu
State University of New York State College of Optometry 33 West 42nd Street New York, New York 10036-8003 http://www.sunyopt.edu
University of Alabama at Birmingham School of Optometry 1716 University Boulevard Birmingham, Alabama 35294-0010 http://www.uab.edu/optometry
University of California - Berkeley School of Optometry 397 Minor Hall Berkeley, California 94720-2020 http://optometry.berkeley.edu
University of Missouri at St. Louis College of Optometry 1 University Boulevard St. Louis, Missouri 63121-4499 http://www.umsl.edu/divisions/optometry
University of Houston College of Optometry 4901 Calhoun Road Houston, Texas 77204-2020 http://www.opt.uh.edu
University of the Incarnate Word Rosenberg School of Optometry 9725 Datapoint Drive San Antonio, Texas 78229 http://www.uiw.edu/optometry/
University of Pikeville Kentucky College of Optometry 147 Sycamore Street Pikeville, Kentucky 41501 http://www.upike.edu/KYCO
Western University of Health Sciences College of Optometry 309 East Second Street Pomona, California 91766-1854 http://www.westernu.edu/optometry
*New school. Not included in 2016-2017 Student Data Report

Annual Student Data Report 2016-2017 ii Association of Schools and Colleges of Optometry www.optometriceducation.org
School Abbreviations used in ASCO Data Reports
AZCOPT Midwestern University - Arizona College of Optometry CCO* Chicago College of Optometry, Midwestern University IAUPR Inter American University of Puerto Rico, School of Optometry ICO Illinois College of Optometry IUSO Indiana University, School of Optometry KYCO University of Pikeville, Kentucky College of Optometry MCO Michigan College of Optometry at Ferris State University MCPHS MCPHS University, School of Optometry NECO New England College of Optometry NOVA Nova Southeastern University, College of Optometry NSUOCO Northeastern State University - Oklahoma College of Optometry OSU The Ohio State University, College of Optometry PUCO Pacific University, College of Optometry Salus/PCO Salus University Pennsylvania College of Optometry SCCOMBKU Southern California College of Optometry at Marshall B. Ketchum University SCO Southern College of Optometry SUNY State University of New York, State College of Optometry UABSO University of Alabama at Birmingham, School of Optometry UCB University of California - Berkeley, School of Optometry UHCO University of Houston, College of Optometry UIWRSO University of the Incarnate Word, Rosenberg School of Optometry UMSL University of Missouri at St. Louis, College of Optometry WUCO Western University of Health Sciences, College of Optometry *New school. Not included in 2016-2017 Student Data Report.

Annual Student Data Report 2016-2017 Association of Schools and Colleges of Optometry www.optometriceducation.org
2016-2017 Annual Student Data Report Highlights
Enrollment
• The total number of full-time students in the 22 regular professional O.D. programs enrolling students during academic year 2016-2017 in the 50 states and Puerto Rico is 7024, an increase of 1.8% over last year (21 programs), and an increase of 11.7% since 2011-2012 (20 programs). The number of full-time first-year regular students increased by 5.2% over last year and increased by 14.3% over the past five years. The percentage of female full-time students in the full-time professional O.D. programs rose to 68.2%, from 67.1% last year; five years ago the percentage was 64.3%. Only one school reported more full-time male students than female students in 2016-2017. (tables 1.1 and 1.2) There were an additional 114 students enrolled in part-time, alternate and special programs leading to the O.D. degree. (table 1.16)
• This is the second year that a new category for race/ethnicity was used in the survey: two or more races. This should be
taken into account when comparing this year’s percentages to previous years’. The percentage of Black or African American full-time students increased from 2.7% last year to 2.8% this year; five years ago the percentage was 3.0%. The percentage of full-time Hispanic or Latino students rose from 5.6% to 6.2%; five years ago the percentage was 4.4%. The percentage of full-time Asian students increased from 28.0% to 29.7%; five years ago the percentage was 29.2%. The percentage of White students decreased from 54.2% to 52.2%; five years ago the percentage was 56.3%. The percentage of students classified as two or more races decreased from 2.2% last year to 2.1% this year. (table 1.3)
• There are 12 part-time students enrolled in the professional O.D. program; last year there were twenty. Five years ago there
were 5 part-time students. (table 1.14)
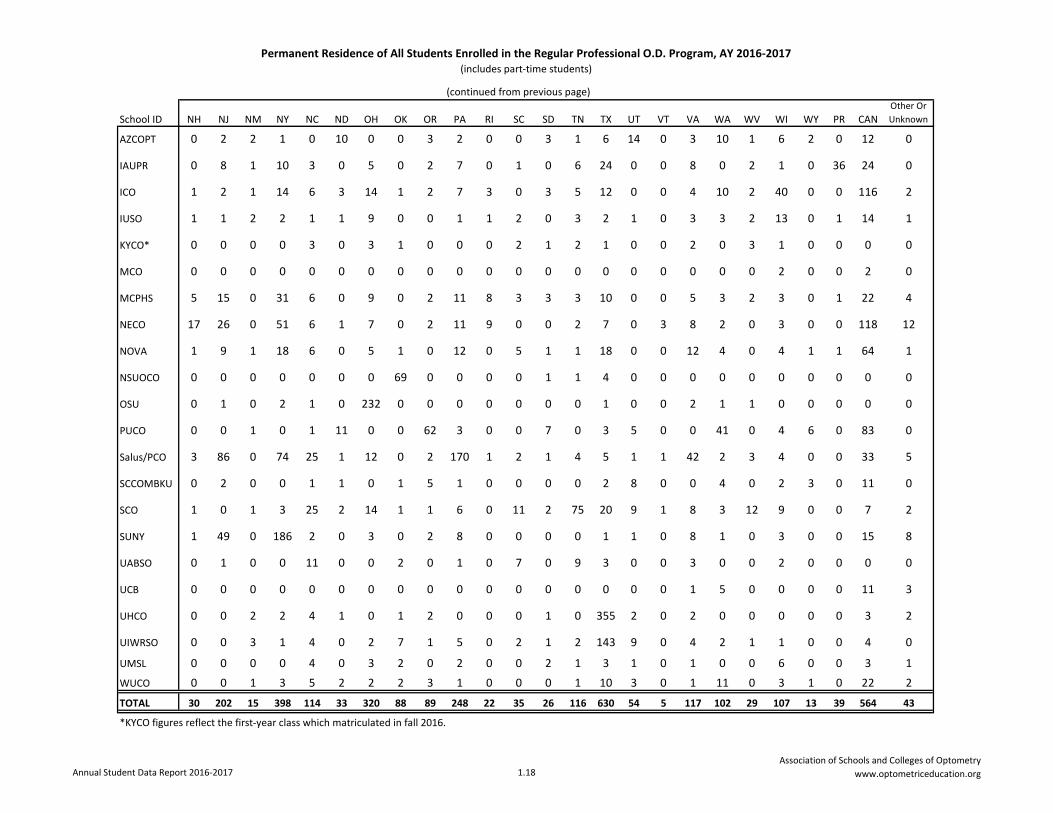
• In 2016-2017, full-time and part-time students come from every state in the U.S., from Puerto Rico and Canada, and from 20+ foreign countries. More students reside in California than any other state, with the next largest group coming from Texas, followed by Canada. (tables 1.18 and 1.20)
iii.

Annual Student Data Report 2016-2017 Association of Schools and Colleges of Optometry www.optometriceducation.org
Graduates
• The total number of graduates at the schools and colleges of optometry, both regular and special programs, increased 7.0% from 2015 (1557) to 2016 (1666). There has been a 25.1% increase in graduates from regular and special programs since 2011 when there were 1332. (table 2.1)
• The number of graduates receiving the O.D. degree through only the regular O.D. program increased 6.9% from 2015 (1532)
to 2016 (1637). Graduates from regular O.D. programs have increased 25.2% since 2011, when there were 1308. (table 2.1)
• In 2016, 65.5% of graduates of the professional O.D. programs, both regular and special programs, were female, down very slightly from 65.6% the previous year. In 2011, 63.6% of graduates were female. In 2016, there were more female graduates than male graduates at 20 out of the 21 schools with a graduating class. (table 2.2)
• This is the second year that a new category for race/ethnicity was used in the survey: two or more races. This should be
taken into account when comparing this year’s percentages to previous years’. The percentage of Black or African American graduates of regular and special programs decreased from 3.5% in 2015 to 2.9% in 2016; in 2011 it was 2.6%. The percentage of Hispanic graduates increased from 4.6% to 6.2%; in 2011 it was 4.9%. The percentage of Asian graduates decreased from 29.5% to 27.4%; in 2011 it was 26.1%. The percentage of White graduates increased from 54.8% to 56.2%; in 2011 it was 58.3%. The percentage of graduates classified as two or more races remained the same, at 1.7% for both 2015 and 2016. (table 2.3)
Financial Aid/Student Expenses
• In 2015-2016, at least four-fifths of all students at 17 out of 21 optometry schools received financial aid. At 6 of these 21 schools, 90% or more of students received financial aid. Average awards for residents ranged from $33,230 to $54,298, and for non-residents from $38,450 to $71,795. (table 3.1)
• In 2016-2017, the average tuition for a first-year resident student enrolled in the professional O.D. program was $24,650 at a
public school and $35,606 at a private school. The average cost for all direct expenses (tuition, fees, books and instruments) for a first-year resident student was $30,614 for a public school and $40,417 for a private school. First-year non-residents paid an average $42,461 for tuition and $48,426 for all direct expenses at a public school, and $37,099 for tuition and $41,910 for all direct expenses at a private school. (tables 3.5 and 3.7)
iii (cont.)

Student Data Trends

Annual Student Data Report 2016-2017 iv.a.Association of Schools and Colleges of Optometry
www.optometriceducation.org
2007-08 2008-09 2009-10 2010-11 2011-12 2012-13 2013-14 2014-15 2015-16 2016-17
Male 1967 1975 2102 2185 2243 2324 2310 2301 2267 2237
Female 3589 3620 3730 3875 4046 4231 4366 4496 4633 4787
Total 5556 5595 5832 6060 6289 6555 6676 6797 6900 7024
Enrollment by Gender, Full-Time Doctor of Optometry Students by Year, 2007-2017U.S. Schools and Colleges of Optometry Including Puerto Rico
(Regular Programs)
0
1000
2000
3000
4000
5000
6000
7000
8000N
umbe
r of S
tude
nts
Year
Female
Male

Annual Student Data Report 2016-2017 iv.b.Association of Schools and Colleges of Optometry
www.optometriceducation.org
2007-08 2008-09 2009-10 2010-11 2011-12 2012-13 2013-14 2014-15 2015-16 2016-17
Female 64.6% 64.7% 64.0% 63.9% 64.3% 64.5% 65.4% 66.1% 67.1% 68.2%Male 35.4% 35.3% 36.0% 36.1% 35.7% 35.5% 34.6% 33.9% 32.9% 31.8%
Proportion of Female Full-Time Doctor of Optometry Students by Year, 2007-2017U.S. Schools and Colleges of Optometry Including Puerto Rico
(Regular Programs)
61.0%
62.0%
63.0%
64.0%
65.0%
66.0%
67.0%
68.0%
69.0%
PerC
enta
ge o
f Tot
al S
tude
nts
Year
Female

Annual Student Data Report 2016-2017 iv.c.Association of Schools and Colleges of Optometry
www.optometriceducation.org
White AsianOther or Unknown
Hisp or Latino
Black or Af Am
Am Ind or Alask Nat
Nat Haw or Other
Pac Isl
Two or More
Races* Total Enrollment2007-08 3349 1380 364 255 172 19 17 55562008-09 3313 1465 370 249 169 20 9 55952009-10 3339 1601 437 258 165 24 8 58322010-11 3421 1708 464 274 164 25 4 60602011-12 3538 1834 417 274 189 24 13 62892012-13 3672 1925 416 292 195 35 20 65552013-14 3729 1926 448 302 204 37 30 66762014-15 3790 1976 401 350 209 41 30 67972015-16 3737 1931 460 383 183 40 15 151 69002016-17 3664 2088 438 436 195 41 13 149 7024
*not collected until 2015-16
Race/Ethnicity of Full-Time Doctor of Optometry Students, 2007-2017U.S. Schools and Colleges of Optometry Including Puerto Rico
(Regular Programs)
0
500
1000
1500
2000
2500
3000
3500
4000
Num
ber o
f Stu
dent
s
Year
White
Asian
Other or Unknown
Hisp or Latino
Black or Af Am
Am Ind or Alask Nat
Nat Haw or Other Pac Isl
Two or More Races*

Annual Student Data Report 2016-2017 iv.d.Association of Schools and Colleges of Optometry
www.optometriceducation.org
White AsianOther or Unknown
Hisp or Latino
Black or Af Am
Am Ind or Alask Nat
Nat Haw or Other
Pac Isl
Two or More
Races*2007-08 60.3% 24.8% 6.6% 4.6% 3.1% 0.3% 0.3%2008-09 59.2% 26.2% 6.6% 4.5% 3.0% 0.4% 0.2%2009-10 57.3% 27.5% 7.5% 4.4% 2.8% 0.4% 0.1%2010-11 56.5% 28.2% 7.7% 4.5% 2.7% 0.4% 0.1%2011-12 56.3% 29.2% 6.6% 4.4% 3.0% 0.4% 0.2%2012-13 56.0% 29.4% 6.3% 4.5% 3.0% 0.5% 0.3%2013-14 55.9% 28.8% 6.7% 4.5% 3.1% 0.6% 0.4%2014-15 55.8% 29.1% 5.9% 5.1% 3.1% 0.6% 0.4%2015-16 54.2% 28.0% 6.7% 5.6% 2.7% 0.6% 0.2% 2.2%2016-17 52.2% 29.7% 6.2% 6.2% 2.8% 0.6% 0.2% 2.1% *not collected until 2015-16
Race/Ethnicity of Full-Time Doctor of Optometry Students, 2007-2017U.S. Schools and Colleges of Optometry Including Puerto Rico
(Regular Programs)
0%
10%
20%
30%
40%
50%
60%
70%
80%
90%
100%
PerC
enta
ge o
f Tot
al S
tude
nts
Year
Two or More Races*
Nat Haw or Other Pac Isl
Am Ind or Alask Nat
Black or Af Am
Hisp or Latino
Other or Unknown
Asian
White

Annual Student Data Report 2016-2017 iv.e.Association of Schools and Colleges of Optometry
www.optometriceducation.org
White AsianOther or Unknown
Hisp or Latino
Black or Af Am
Am Ind or Alask Nat
Nat Haw or Other
Pac Isl
Two or More
Races* Total Graduates2006-07 802 327 59 72 44 12 5 13212007-08 837 305 83 64 46 2 5 13422008-09 858 312 80 67 36 3 1 13572009-10 801 365 88 55 37 8 2 13562010-11 777 348 97 65 34 10 1 13322011-12 805 391 100 61 41 4 2 14042012-13 883 458 97 82 40 4 3 15672013-14 880 472 111 53 37 13 3 15692014-15 853 459 79 72 55 6 7 26 15572015-16 937 457 76 104 49 10 5 28 1666
*first collected for 2014-15 graduates
Race/Ethnicity of Graduates of Regular and Special OD Programs, 2006-2016U.S. Schools and Colleges of Optometry Including Puerto Rico
0100200300400500600700800900
1000
Num
ber o
f Gra
duat
es
Year
White
Asian
Other or Unknown
Hisp or Latino
Black or Af Am
Am Ind or Alask Nat
Nat Haw or Other Pac Isl
Two or More Races*

Annual Student Data Report 2016-2017 iv.f.Association of Schools and Colleges of Optometry
www.optometriceducation.org
White AsianOther or Unknown
Hisp or Latino
Black or Af Am
Am Ind or Alask Nat
Nat Haw or Other
Pac Isl
Two or More
Races*2006-07 60.7% 24.8% 4.5% 5.5% 3.3% 0.9% 0.4%2007-08 62.4% 22.7% 6.2% 4.8% 3.4% 0.1% 0.4%2008-09 63.2% 23.0% 5.9% 4.9% 2.7% 0.2% 0.1%2009-10 59.1% 26.9% 6.5% 4.1% 2.7% 0.6% 0.1%2010-11 58.3% 26.1% 7.3% 4.9% 2.6% 0.8% 0.1%2011-12 57.3% 27.8% 7.1% 4.3% 2.9% 0.3% 0.1%2012-13 56.3% 29.2% 6.2% 5.2% 2.6% 0.3% 0.2%2013-14 56.1% 30.1% 7.1% 3.4% 2.4% 0.8% 0.2%2014-15 54.8% 29.5% 5.1% 4.6% 3.5% 0.4% 0.4% 1.7%2015-16 56.2% 27.4% 4.6% 6.2% 2.9% 0.6% 0.3% 1.7% *first collected for 2014-15 grads
Race/Ethnicity of Graduates of Regular and Special OD Programs, 2006-2016U.S. Schools and Colleges of Optometry Including Puerto Rico
0%
10%
20%
30%
40%
50%
60%
70%
80%
90%
100%
Perc
enta
ge o
f Tot
al G
radu
ates
Year
Two or More Races*
Nat Haw or Other Pac Isl
Am Ind or Alask Nat
Black or Af Am
Hisp or Latino
Other or Unknown
Asian
White

Annual Student Data Report 2016-2017 iv.g.Association of Schools and Colleges of Optometry
www.optometriceducation.org
Of Students Leaving, % Leaving for the Following Reasons:
YearAcade-
mic Financial Illness PersonalDiscipli-
nary OtherTotal # Leaving
% of Total Student Body
17 schools 2006-07 63% 0% 14% 21% 0% 2% 87 1.6%17 schools 2007-08 62% 1% 4% 26% 0% 7% 99 1.8%17 schools 2008-09 56% 1% 2% 34% 1% 5% 85 1.5%20 schools 2009-10 55% 0% 8% 36% 0% 2% 66 1.1%20 schools 2010-11 54% 0% 9% 28% 6% 3% 65 1.1%20 schools 2011-12 54% 0% 5% 34% 4% 2% 93 1.5%21 schools 2012-13 47% 0% 7% 43% 0% 3% 74 1.1%21 schools 2013-14 63% 2% 8% 24% 1% 1% 84 1.3%21 schools 2014-15 61% 1% 2% 31% 2% 3% 95 1.4%21 schools 2015-16 67% 2% 3% 21% 3% 3% 149 2.2%
Reasons for Students Leaving the Professional OD Program, 2006-2016U.S. Schools and Colleges of Optometry Including Puerto Rico
0%10%20%30%40%50%60%70%80%90%
100%Pe
rcen
tage
of T
otal
Lea
ving
Year
Other
Disciplinary
Personal
Illness
Financial
Academic

Annual Student Data Report 2016-2017 iv.h.Association of Schools and Colleges of Optometry
www.optometriceducation.org
2007-08 2008-09 2009-10 2010-11 2011-12 2012-13 2013-14 2014-15 2015-16 2016-17
Resident (In-State Tuition)
$21,168 $21,275 $22,115 $23,773 $25,204 $24,972 $27,070 $28,400 $29,332 $29,728
Non-Resident $34,935 $35,805 $35,796 $38,649 $40,575 $39,711 $41,759 $44,422 $47,365 $47,663
Resident (In-State Tuition)
$27,343 $28,355 $30,436 $31,662 $31,891 $33,954 $35,255 $36,337 $37,701 $38,606
Non-Resident $29,389 $30,438 $32,089 $32,868 $33,259 $34,991 $36,420 $37,623 $39,161 $40,229
Average Direct Expenses, Public and Private Institutions, 2007-2017U.S. Schools and Colleges of Optometry Including Puerto Rico
(Tuition + Fee + Books + Instruments = Direct Expenses)
Public
Private
$0
$10,000
$20,000
$30,000
$40,000
$50,000
$60,000Do
llar A
mou
nt, D
irect
Exp
ense
s
Year
PublicResident
Public Non-Resident
PrivateResident
Private Non-Resident

Enrollment in the Professional O.D. Program

Full-Time Enrollment in the Professional O.D. Program by Gender and Year, AY 2016-2017(Does not include students enrolled in alternate or special O.D. programs - see table 1.16)
Annual Student Data Report 2016-2017 1.1Association of Schools and Colleges of Optometry
www.optometriceducation.org
Total Total Total
School IDRegu-
larRe-
peatTran- sfer
Dismis- sed/Vol- untarily
Disconti- nued Total Reg Rep Tran
Dis/ Volun Dscnt Total 1st Yr Reg Rep Tran
Dis/ Volun Dscnt Total Reg Rep Tran
Dis/ Volun Dscnt Total 2nd Yr Reg Rep Tran
Dis/ Volun Dscnt Total Reg Rep Tran
Dis/ Volun Dscnt Total 3rd Yr
AZCOPT 25 1 0 0 26 29 1 0 0 30 56 33 0 0 0 33 22 0 0 0 22 55 33 1 0 0 34 24 0 0 0 24 58
IAUPR 22 0 0 0 22 38 0 0 0 38 60 19 1 0 0 20 34 2 0 0 36 56 9 1 0 0 10 40 4 0 0 44 54
ICO 44 0 0 0 44 122 8 0 0 130 174 37 0 0 0 37 122 0 0 0 122 159 48 0 0 0 48 107 0 0 0 107 155
IUSO 19 3 0 0 22 55 3 0 0 58 80 25 1 0 0 26 46 1 0 0 47 73 22 2 0 0 24 44 2 0 0 46 70
KYCO 27 0 0 0 27 38 0 0 0 38 65 0 0 0 0 0 0 0 0 0 0 0 0 0 0 0 0 0 0 0 0 0 0
MCO 13 0 0 0 13 25 0 0 0 25 38 16 0 0 0 16 20 0 1 0 21 37 24 0 0 0 24 14 0 0 0 14 38
MCPHS 20 0 0 0 20 51 0 0 0 51 71 27 0 0 0 27 42 0 0 0 42 69 15 0 0 0 15 42 0 0 0 42 57
NECO 33 0 0 1 34 111 3 0 0 114 148 36 1 0 0 37 74 0 0 0 74 111 31 0 0 0 31 86 0 0 0 86 117
NOVA 26 1 0 0 27 78 1 0 0 79 106 26 0 0 1 27 70 0 0 1 71 98 30 0 0 0 30 67 0 0 0 67 97
NSUOCO 14 0 0 0 14 14 0 0 0 14 28 15 0 0 0 15 13 0 0 0 13 28 10 0 0 0 10 17 0 0 0 17 27
OSU 28 0 0 0 28 37 1 0 0 38 66 15 0 0 0 15 51 1 0 0 52 67 21 0 0 0 21 46 1 0 0 47 68
PUCO 30 0 0 0 30 63 3 0 0 66 96 34 0 0 0 34 51 2 0 0 53 87 34 0 0 0 34 51 1 0 0 52 86
Salus/PCO 49 3 0 0 52 101 3 0 1 105 157 43 2 0 1 46 103 1 0 1 105 151 40 1 0 1 42 106 1 0 0 107 149
SCCOMBKU 24 0 0 0 24 76 0 0 0 76 100 27 0 0 0 27 71 0 0 0 71 98 20 0 0 0 20 81 0 0 0 81 101
SCO 51 0 0 0 51 85 0 0 0 85 136 36 0 0 0 36 95 0 0 0 95 131 50 0 0 0 50 83 0 0 0 83 133
SUNY 23 0 0 0 23 76 1 0 0 77 100 24 1 0 0 25 73 1 0 0 74 99 26 0 0 0 26 68 0 0 0 68 94
UABSO 15 0 0 0 15 35 0 0 0 35 50 17 3 0 0 20 31 1 0 0 32 52 17 0 0 0 17 27 0 0 0 27 44
UCB 15 0 0 0 15 55 2 0 1 58 73 8 0 0 0 8 59 2 0 0 61 69 14 0 0 0 14 50 0 0 0 50 64
UHCO 31 1 0 0 32 72 2 0 0 74 106 36 4 0 0 40 65 3 0 0 68 108 31 5 0 0 36 63 5 0 0 68 104
UIWRSO 11 0 0 0 11 56 2 0 0 58 69 24 1 0 0 25 42 1 0 0 43 68 24 0 0 0 24 39 0 0 0 39 63
UMSL 17 0 0 0 17 28 0 0 0 28 45 15 0 0 0 15 27 0 0 0 27 42 19 0 0 0 19 20 0 0 0 20 39
WUCO 22 0 0 0 22 66 1 0 0 67 89 19 0 0 0 19 63 5 0 0 68 87 16 3 0 0 19 42 3 0 0 45 64
Total 559 9 0 1 569 1311 31 0 2 1344 1913 532 14 0 2 548 1174 20 1 2 1197 1745 534 13 0 1 548 1117 17 0 0 1134 1682(continued on following page)
Regular - Students who are currently enrolled in each class leading to the O.D. degree and taking a full-time course load. Repeat - Students who were previously enrolled as a regular student and did not advance to the next class. For example, a student in a second year of attendance but who is repeating enough first-year courses to be considered part of the first-year class is a repeat student. Repeat students are taking a sufficient number of credit hours to be considered a full-time student. A repeat student is not a student who was suspended and, after re-application, admitted again as a regular student. Transfer - Students who have enrolled after first attending another institution of optometry and leaving in good academic standing. Dismissed/Voluntarily Discontinued (Transfer After Dismissed/Voluntarily Discontinued) - Students who have enrolled after first attending another optometry institution where they were dismissed or left because of academic and/or disciplinary reasons.
First Year Second Year Third YearMale Female Male Female Male Female

Full-Time Enrollment in the Professional O.D. Program by Gender and Year, AY 2016-2017(Does not include students enrolled in alternate or special O.D. programs - see table 1.16)
Annual Student Data Report 2016-2017 1.1Association of Schools and Colleges of Optometry
www.optometriceducation.org
Total Total Total Total
School ID Reg Rep Tran
Dis/ Volun Dscnt Total Reg Rep Tran
Dis/ Volun Dscnt Total 4th Yr Reg Rep Tran
Dis/ Volun Dscnt Male Reg Rep Tran
Dis/ Volun Dscnt Female Regular Repeat Transfer
Dismissed/ Voluntarily
Discontinued Students
AZCOPT 21 0 0 0 21 24 0 0 0 24 45 112 2 0 0 114 99 1 0 0 100 211 3 0 0 214
IAUPR 18 2 0 0 20 35 6 0 0 41 61 68 4 0 0 72 147 12 0 0 159 215 16 0 0 231
ICO 47 0 0 0 47 108 0 0 0 108 155 176 0 0 0 176 459 8 0 0 467 635 8 0 0 643
IUSO 26 5 1 0 32 41 1 0 0 42 74 92 11 1 0 104 186 7 0 0 193 278 18 1 0 297
KYCO 0 0 0 0 0 0 0 0 0 0 0 27 0 0 0 27 38 0 0 0 38 65 0 0 0 65
MCO 13 0 0 0 13 22 0 0 0 22 35 66 0 0 0 66 81 0 1 0 82 147 0 1 0 148
MCPHS 20 0 0 0 20 42 0 0 0 42 62 82 0 0 0 82 177 0 0 0 177 259 0 0 0 259
NECO 42 0 1 0 43 87 1 1 0 89 132 142 1 1 1 145 358 4 1 0 363 500 5 2 1 508
NOVA 30 0 0 0 30 66 0 0 0 66 96 112 1 0 1 114 281 1 0 1 283 393 2 0 2 397
NSUOCO 13 0 0 0 13 16 0 0 0 16 29 52 0 0 0 52 60 0 0 0 60 112 0 0 0 112
OSU 19 0 0 0 19 37 1 0 0 38 57 83 0 0 0 83 171 4 0 0 175 254 4 0 0 258
PUCO 28 2 0 0 30 60 1 0 0 61 91 126 2 0 0 128 225 7 0 0 232 351 9 0 0 360
Salus/PCO 42 0 0 0 42 101 0 0 0 101 143 174 6 0 2 182 411 5 0 2 418 585 11 0 4 600
SCCOMBKU 31 0 0 0 31 67 0 0 0 67 98 102 0 0 0 102 295 0 0 0 295 397 0 0 0 397
SCO 60 0 0 0 60 69 0 0 0 69 129 197 0 0 0 197 332 0 0 0 332 529 0 0 0 529
SUNY 21 0 0 0 21 67 0 0 0 67 88 94 1 0 0 95 284 2 0 0 286 378 3 0 0 381
UABSO 9 0 0 0 9 27 0 0 0 27 36 58 3 0 0 61 120 1 0 0 121 178 4 0 0 182
UCB 14 0 0 0 14 44 0 0 0 44 58 51 0 0 0 51 208 4 0 1 213 259 4 0 1 264
UHCO 36 2 0 0 38 58 2 0 0 60 98 134 12 0 0 146 258 12 0 0 270 392 24 0 0 416
UIWRSO 29 0 0 0 29 35 0 0 0 35 64 88 1 0 0 89 172 3 0 0 175 260 4 0 0 264
UMSL 16 0 0 0 16 26 0 0 0 26 42 67 0 0 0 67 101 0 0 0 101 168 0 0 0 168
WUCO 22 2 0 0 24 58 9 0 0 67 91 79 5 0 0 84 229 18 0 0 247 308 23 0 0 331
Total 557 13 2 0 572 1090 21 1 0 1112 1684 2182 49 2 4 2237 4692 89 2 4 4787 6874 138 4 8 7024
Regular - Students who are currently enrolled in each class leading to the O.D. degree and taking a full-time course load. Repeat - Students who were previously enrolled as a regular student and did not advance to the next class. For example, a student in a second year of attendance but who is repeating enough first-year courses to be considered part of the first-year class is a repeat student. Repeat students are taking a sufficient number of credit hours to be considered a full-time student. A repeat student is not a student who was suspended and, after re-application, admitted again as a regular student. Transfer - Students who have enrolled after first attending another institution of optometry and leaving in good academic standing. Dismissed/Voluntarily Discontinued (Transfer After Dismissed/Voluntarily Discontinued) - Students who have enrolled after first attending another optometry institution where they were dismissed or left because of academic and/or disciplinary reasons.
Fourth Year Total By Gender Grand TotalMale Female Male Female

Number and Percentage of Full-Time Students in the Professional O.D. Program by Gender and Year, AY 2016-2017(Does not include students enrolled in alternate or special O.D. programs - see table 1.16)
Annual Student Data Report 2016-2017 1.2Association of Schools and Colleges of Optometry
www.optometriceducation.org
School ID M F M F M F M F M FAZCOPT 46.4% 53.6% 60.0% 40.0% 58.6% 41.4% 46.7% 53.3% 53.3% 46.7%
26 30 33 22 34 24 21 24 114 100IAUPR 36.7% 63.3% 35.7% 64.3% 18.5% 81.5% 32.8% 67.2% 31.2% 68.8%
22 38 20 36 10 44 20 41 72 159ICO 25.3% 74.7% 23.3% 76.7% 31.0% 69.0% 30.3% 69.7% 27.4% 72.6%
44 130 37 122 48 107 47 108 176 467IUSO 27.5% 72.5% 35.6% 64.4% 34.3% 65.7% 43.2% 56.8% 35.0% 65.0%
22 58 26 47 24 46 32 42 104 193KYCO 41.5% 58.5% 41.5% 58.5%
27 38 0 0 0 0 0 0 27 38MCO 34.2% 65.8% 43.2% 56.8% 63.2% 36.8% 37.1% 62.9% 44.6% 55.4%
13 25 16 21 24 14 13 22 66 82MCPHS 28.2% 71.8% 39.1% 60.9% 26.3% 73.7% 32.3% 67.7% 31.7% 68.3%
20 51 27 42 15 42 20 42 82 177NECO 23.0% 77.0% 33.3% 66.7% 26.5% 73.5% 32.6% 67.4% 28.5% 71.5%
34 114 37 74 31 86 43 89 145 363NOVA 25.5% 74.5% 27.6% 72.4% 30.9% 69.1% 31.3% 68.8% 28.7% 71.3%
27 79 27 71 30 67 30 66 114 283NSUOCO 50.0% 50.0% 53.6% 46.4% 37.0% 63.0% 44.8% 55.2% 46.4% 53.6%
14 14 15 13 10 17 13 16 52 60OSU 42.4% 57.6% 22.4% 77.6% 30.9% 69.1% 33.3% 66.7% 32.2% 67.8%
28 38 15 52 21 47 19 38 83 175PUCO 31.3% 68.8% 39.1% 60.9% 39.5% 60.5% 33.0% 67.0% 35.6% 64.4%
30 66 34 53 34 52 30 61 128 232Salus/PCO 33.1% 66.9% 30.5% 69.5% 28.2% 71.8% 29.4% 70.6% 30.3% 69.7%
52 105 46 105 42 107 42 101 182 418SCCOMBKU 24.0% 76.0% 27.6% 72.4% 19.8% 80.2% 31.6% 68.4% 25.7% 74.3%
24 76 27 71 20 81 31 67 102 295SCO 37.5% 62.5% 27.5% 72.5% 37.6% 62.4% 46.5% 53.5% 37.2% 62.8%
51 85 36 95 50 83 60 69 197 332SUNY 23.0% 77.0% 25.3% 74.7% 27.7% 72.3% 23.9% 76.1% 24.9% 75.1%
23 77 25 74 26 68 21 67 95 286UABSO 30.0% 70.0% 38.5% 61.5% 38.6% 61.4% 25.0% 75.0% 33.5% 66.5%
15 35 20 32 17 27 9 27 61 121UCB 20.5% 79.5% 11.6% 88.4% 21.9% 78.1% 24.1% 75.9% 19.3% 80.7%
15 58 8 61 14 50 14 44 51 213UHCO 30.2% 69.8% 37.0% 63.0% 34.6% 65.4% 38.8% 61.2% 35.1% 64.9%
32 74 40 68 36 68 38 60 146 270UIWRSO 15.9% 84.1% % 63.2% 38.1% 61.9% 45.3% 54.7% 33.7% 66.3%
11 58 25 43 24 39 29 35 89 175UMSL 37.8% 62.2% 35.7% 64.3% 48.7% 51.3% 38.1% 61.9% 39.9% 60.1%
17 28 15 27 19 20 16 26 67 101WUCO 24.7% 75.3% 21.8% 78.2% 29.7% 70.3% 26.4% 73.6% 25.4% 74.6%
22 67 19 68 19 45 24 67 84 24729.7% 70.3% 31.4% 68.6% 32.6% 67.4% 34.0% 66.0% 31.8% 68.2%
Total 569 1344 548 1197 548 1134 572 1112 2237 4787
TotalFirst Year Second Year Third Year Fourth Year

Number and Percentage of Full-Time Students Enrolled in Professional O.D. Programs by Race/Ethnicity and Year -- Summary
AY 2016-2017*
Annual Student Data Report 2016-2017 1.3Association of Schools and Colleges of Optometry
www.optometriceducation.org
Number % 1st Year Number % 2nd Year Number % 3rd Year Number % 4th Year Number % All Students
Black or Male 12 0.6% 10 0.6% 13 0.8% 13 0.8% 48 0.7%
African Female 46 2.4% 22 1.3% 44 2.6% 35 2.1% 147 2.1%
American Total 58 3.0% 32 1.8% 57 3.4% 48 2.9% 195 2.8%
Hispanic Male 31 1.6% 43 2.5% 29 1.7% 33 2.0% 136 1.9%
or Female 108 5.6% 71 4.1% 62 3.7% 59 3.5% 300 4.3%
Latino Total 139 7.3% 114 6.5% 91 5.4% 92 5.5% 436 6.2%American
Indian or Male 4 0.2% 5 0.3% 2 0.1% 3 0.2% 14 0.2%
Alaska Female 4 0.2% 4 0.2% 11 0.7% 8 0.5% 27 0.4%
Native Total 8 0.4% 9 0.5% 13 0.8% 11 0.7% 41 0.6%
Asian Male 153 8.0% 111 6.4% 125 7.4% 124 7.4% 513 7.3%
Female 447 23.4% 400 22.9% 382 22.7% 346 20.5% 1575 22.4%
Total 600 31.4% 511 29.3% 507 30.1% 470 27.9% 2088 29.7%Native
Hawaiian or Male 1 0.1% 1 0.1% 2 0.1% 0 0.0% 4 0.1%
Other Paci- Female 1 0.1% 3 0.2% 1 0.1% 4 0.2% 9 0.1%
fic Islander Total 2 0.1% 4 0.2% 3 0.2% 4 0.2% 13 0.2%
White Male 324 16.9% 325 18.6% 349 20.7% 362 21.5% 1360 19.4%
Female 607 31.7% 583 33.4% 541 32.2% 573 34.0% 2304 32.8%
Total 931 48.7% 908 52.0% 890 52.9% 935 55.5% 3664 52.2%
Two or Male 13 0.7% 7 0.4% 10 0.6% 12 0.7% 42 0.6%
More Female 33 1.7% 21 1.2% 23 1.4% 30 1.8% 107 1.5%
Races Total 46 2.4% 28 1.6% 33 2.0% 42 2.5% 149 2.1%
Unknown** Male 31 1.6% 46 2.6% 18 1.1% 25 1.5% 120 1.7%
Female 98 5.1% 93 5.3% 70 4.2% 57 3.4% 318 4.5%
Total 129 6.7% 139 8.0% 88 5.2% 82 4.9% 438 6.2%
Total 1913 1745 1682 1684 7024
* KYCO figures reflect the first-year class which matriculated in fall 2016.
** Pacific University College of Optometry classifies all international students as "unknown" for race/ethnicity.
(Does not include students enrolled in alternate or special O.D. programs - see table 1.16)TotalFirst Year Second Year Third Year Fourth Year

Classification of Total Full-Time Students by School in the Professional O.D. Programs by Gender and Race/Ethnicity, AY 2016-2017
Annual Student Data Report 2016-2017 1.4 Association of Schools and Colleges of Optometry
www.optometriceducation.org
AZCOPT IAUPR ICO IUSO KYCO* MCO MCPHS NECO NOVA NSUOCO OSU PUCO Salus/ SCCO SCO SUNY UABSO UCB UHCO UIWRSO UMSL WUCO TotalPCO MBKU
Black or Male 0 1 1 1 0 1 1 2 9 1 4 1 8 0 3 2 2 2 1 3 1 4 48
African Female 0 11 10 6 2 0 4 4 23 2 6 0 27 4 12 5 7 4 3 6 4 7 147
American Total 0 12 11 7 2 1 5 6 32 3 10 1 35 4 15 7 9 6 4 9 5 11 195
Hispanic Male 5 18 9 4 0 4 2 7 12 3 3 5 6 6 4 4 0 4 14 17 1 8 136
or Latino Female 9 45 9 7 1 1 13 5 46 2 5 10 8 13 2 12 5 12 30 33 1 31 300
Total 14 63 18 11 1 5 15 12 58 5 8 15 14 19 6 16 5 16 44 50 2 39 436American
Indian or Male 0 1 0 0 0 0 0 0 1 9 1 1 0 0 0 0 0 0 0 1 0 0 14
Alaska Female 1 0 1 1 0 0 1 0 7 10 0 0 0 0 0 0 2 1 0 2 1 0 27
Native Total 1 1 1 1 0 0 1 0 8 19 1 1 0 0 0 0 2 1 0 3 1 0 41
Asian Male 17 27 66 7 0 2 18 27 22 3 8 17 52 49 18 34 10 25 59 18 4 30 513
Female 19 69 192 22 1 0 53 94 77 6 13 58 169 174 34 111 19 158 123 66 9 108 1575
Total 36 96 258 29 1 2 71 121 99 9 21 75 221 223 52 145 29 183 182 84 13 138 2088Native
Hawaiian or Male 2 0 0 0 0 0 0 0 0 0 0 1 0 0 0 0 0 0 1 0 0 0 4
Other Paci- Female 0 0 1 0 0 0 0 0 1 0 0 2 1 1 0 1 0 0 0 2 0 0 9
fic Islander Total 2 0 1 0 0 0 0 0 1 0 0 3 1 1 0 1 0 0 1 2 0 0 13
White Male 83 24 95 86 26 47 50 79 68 36 67 78 114 41 163 46 47 19 54 49 58 30 1360
Female 66 34 243 144 29 53 82 147 123 40 142 93 212 84 265 126 85 34 95 63 83 61 2304
Total 149 58 338 230 55 100 132 226 191 76 209 171 326 125 428 172 132 53 149 112 141 91 3664
Two or Male 5 0 5 0 1 0 0 2 0 0 0 2 0 6 5 5 0 0 0 0 0 11 42
More Female 3 0 11 0 5 2 0 10 0 0 0 3 0 18 12 12 1 1 0 0 0 29 107
Races Total 8 0 16 0 6 2 0 12 0 0 0 5 0 24 17 17 1 1 0 0 0 40 149
Unknown** Male 2 1 0 6 0 12 11 28 2 0 0 23 2 0 4 4 2 1 17 1 3 1 120
Female 2 0 0 13 0 26 24 103 6 0 9 66 1 1 7 19 2 3 19 3 3 11 318
Total 4 1 0 19 0 38 35 131 8 0 9 89 3 1 11 23 4 4 36 4 6 12 438Grand
Total 214 231 643 297 65 148 259 508 397 112 258 360 600 397 529 381 182 264 416 264 168 331 7024
* KYCO figures reflect the first-year class which matriculated in fall 2016.
**PUCO classifies all international students as "unknown" for race/ethnicity.
(Does not include students enrolled in alternate or special O.D. programs - see table 1.16)

Percentage of Total Full-Time Students by School in the Professional O.D. Programs by Gender and Race/Ethnicity, AY 2016-2017
Annual Student Data Report 2016-2017 1.5Association of Schools and Colleges of Optometry
www.optometriceducation.org
AZCOPT IAUPR ICO IUSO KYCO* MCO MCPHS NECO NOVA NSUOCO OSU PUCO Salus/ SCCO SCO SUNY UABSO UCB UHCO UIWRSO UMSL WUCO ALLPCO MBKU SCHOOLS
Black or Male 0.0% 0.4% 0.2% 0.3% 0.0% 0.7% 0.4% 0.4% 2.3% 0.9% 1.6% 0.3% 1.3% 0.0% 0.6% 0.5% 1.1% 0.8% 0.2% 1.1% 0.6% 1.2% 0.7%
African Female 0.0% 4.8% 1.6% 2.0% 3.1% 0.0% 2.7% 0.8% 5.8% 1.8% 2.3% 0.0% 4.5% 1.0% 2.3% 1.3% 3.8% 1.5% 0.7% 2.3% 2.4% 2.1% 2.1%
American Total 0.0% 5.2% 1.7% 2.4% 3.1% 0.7% 1.9% 1.2% 8.1% 2.7% 3.9% 0.3% 5.8% 1.0% 2.8% 1.8% 4.9% 2.3% 1.0% 3.4% 3.0% 3.3% 2.8%
Hispanic Male 2.3% 7.8% 1.4% 1.3% 0.0% 2.7% 0.8% 1.4% 3.0% 2.7% 1.2% 1.4% 1.0% 1.5% 0.8% 1.0% 0.0% 1.5% 3.4% 6.4% 0.6% 2.4% 1.9%
or Latino Female 4.2% 19.5% 1.4% 2.4% 1.5% 0.7% 5.0% 1.0% 11.6% 1.8% 1.9% 2.8% 1.3% 3.3% 0.4% 3.1% 2.7% 4.5% 7.2% 12.5% 0.6% 9.4% 4.3%
Total 6.5% 27.3% 2.8% 3.7% 1.5% 3.4% 5.8% 2.4% 14.6% 4.5% 3.1% 4.2% 2.3% 4.8% 1.1% 4.2% 2.7% 6.1% 10.6% 18.9% 1.2% 11.8% 6.2%American
Indian or Male 0.0% 0.4% 0.0% 0.0% 0.0% 0.0% 0.0% 0.0% 0.3% 8.0% 0.4% 0.3% 0.0% 0.0% 0.0% 0.0% 0.0% 0.0% 0.0% 0.4% 0.0% 0.0% 0.2%
Alaska Female 0.5% 0.0% 0.2% 0.3% 0.0% 0.0% 0.4% 0.0% 1.8% 8.9% 0.0% 0.0% 0.0% 0.0% 0.0% 0.0% 1.1% 0.4% 0.0% 0.8% 0.6% 0.0% 0.4%
Native Total 0.5% 0.4% 0.2% 0.3% 0.0% 0.0% 0.4% 0.0% 2.0% 17.0% 0.4% 0.3% 0.0% 0.0% 0.0% 0.0% 1.1% 0.4% 0.0% 1.1% 0.6% 0.0% 0.6%
Asian Male 7.9% 11.7% 10.3% 2.4% 0.0% 1.4% 6.9% 5.3% 5.5% 2.7% 3.1% 4.7% 8.7% 12.3% 3.4% 8.9% 5.5% 9.5% 14.2% 6.8% 2.4% 9.1% 7.3%
Female 8.9% 29.9% 29.9% 7.4% 1.5% 0.0% 20.5% 18.5% 19.4% 5.4% 5.0% 16.1% 28.2% 43.8% 6.4% 29.1% 10.4% 59.8% 29.6% 25.0% 5.4% 32.6% 22.4%
Total 16.8% 41.6% 40.1% 9.8% 1.5% 1.4% 27.4% 23.8% 24.9% 8.0% 8.1% 20.8% 36.8% 56.2% 9.8% 38.1% 15.9% 69.3% 43.8% 31.8% 7.7% 41.7% 29.7%Native
Hawaiian or Male 0.9% 0.0% 0.0% 0.0% 0.0% 0.0% 0.0% 0.0% 0.0% 0.0% 0.0% 0.3% 0.0% 0.0% 0.0% 0.0% 0.0% 0.0% 0.2% 0.0% 0.0% 0.0% 0.1%
Other Paci- Female 0.0% 0.0% 0.2% 0.0% 0.0% 0.0% 0.0% 0.0% 0.3% 0.0% 0.0% 0.6% 0.2% 0.3% 0.0% 0.3% 0.0% 0.0% 0.0% 0.8% 0.0% 0.0% 0.1%
fic Islander Total 0.9% 0.0% 0.2% 0.0% 0.0% 0.0% 0.0% 0.0% 0.3% 0.0% 0.0% 0.8% 0.2% 0.3% 0.0% 0.3% 0.0% 0.0% 0.2% 0.8% 0.0% 0.0% 0.2%
White Male 38.8% 10.4% 14.8% 29.0% 40.0% 31.8% 19.3% 15.6% 17.1% 32.1% 26.0% 21.7% 19.0% 10.3% 30.8% 12.1% 25.8% 7.2% 13.0% 18.6% 34.5% 9.1% 19.4%
Female 30.8% 14.7% 37.8% 48.5% 44.6% 35.8% 31.7% 28.9% 31.0% 35.7% 55.0% 25.8% 35.3% 21.2% 50.1% 33.1% 46.7% 12.9% 22.8% 23.9% 49.4% 18.4% 32.8%
Total 69.6% 25.1% 52.6% 77.4% 84.6% 67.6% 51.0% 44.5% 48.1% 67.9% 81.0% 47.5% 54.3% 31.5% 80.9% 45.1% 72.5% 20.1% 35.8% 42.4% 83.9% 27.5% 52.2%
Two or Male 2.3% 0.0% 0.8% 0.0% 1.5% 0.0% 0.0% 0.4% 0.0% 0.0% 0.0% 0.6% 0.0% 1.5% 0.9% 1.3% 0.0% 0.0% 0.0% 0.0% 0.0% 3.3% 0.6%
More Female 1.4% 0.0% 1.7% 0.0% 7.7% 1.4% 0.0% 2.0% 0.0% 0.0% 0.0% 0.8% 0.0% 4.5% 2.3% 3.1% 0.5% 0.4% 0.0% 0.0% 0.0% 8.8% 1.5%
Races Total 3.7% 0.0% 2.5% 0.0% 9.2% 1.4% 0.0% 2.4% 0.0% 0.0% 0.0% 1.4% 0.0% 6.0% 3.2% 4.5% 0.5% 0.4% 0.0% 0.0% 0.0% 12.1% 2.1%
Unknown** Male 0.9% 0.4% 0.0% 2.0% 0.0% 8.1% 4.2% 5.5% 0.5% 0.0% 0.0% 6.4% 0.3% 0.0% 0.8% 1.0% 1.1% 0.4% 4.1% 0.4% 1.8% 0.3% 1.7%
Female 0.9% 0.0% 0.0% 4.4% 0.0% 17.6% 9.3% 20.3% 1.5% 0.0% 3.5% 18.3% 0.2% 0.3% 1.3% 5.0% 1.1% 1.1% 4.6% 1.1% 1.8% 3.3% 4.5%
Total 1.9% 0.4% 0.0% 6.4% 0.0% 25.7% 13.5% 25.8% 2.0% 0.0% 3.5% 24.7% 0.5% 0.3% 2.1% 6.0% 2.2% 1.5% 8.7% 1.5% 3.6% 3.6% 6.2%
* KYCO figures reflect the first-year class which matriculated in fall 2016.
**PUCO classifies all international students as "unknown" for race/ethnicity.
(Does not include students enrolled in alternate or special O.D. programs - see table 1.16)

Classification of Full-Time, First-Year Students by School in the Professional O.D. Programs by Gender and Race/Ethnicity, AY 2016-2017
Annual Student Data Report 2016-2017 1.6 Association of Schools and Colleges of Optometry
www.optometriceducation.org
AZCOPT IAUPR ICO IUSO KYCO MCO MCPHS NECO NOVA NSUOCO OSU PUCO Salus/ SCCO SCO SUNY UABSO UCB UHCO UIWRSO UMSL WUCO TotalPCO MBKU
Black or Male 0 1 0 0 0 0 0 0 2 0 3 0 2 0 2 0 0 1 1 0 0 0 12
African Female 0 1 6 3 2 0 1 0 8 1 2 0 6 2 4 1 0 3 1 3 0 2 46
American Total 0 2 6 3 2 0 1 0 10 1 5 0 8 2 6 1 0 4 2 3 0 2 58
Hispanic Male 2 8 1 0 0 0 0 0 5 0 0 2 1 0 1 3 0 0 4 2 1 1 31
or Latino Female 3 16 2 3 1 0 4 4 12 1 3 5 4 8 0 3 3 3 10 12 0 11 108
Total 5 24 3 3 1 0 4 4 17 1 3 7 5 8 1 6 3 3 14 14 1 12 139American
Indian or Male 0 0 0 0 0 0 0 0 0 3 0 0 0 0 0 0 0 0 0 1 0 0 4
Alaska Female 0 0 1 0 0 0 0 0 1 1 0 0 0 0 0 0 0 0 0 1 0 0 4
Native Total 0 0 1 0 0 0 0 0 1 4 0 0 0 0 0 0 0 0 0 2 0 0 8
Asian Male 6 10 20 3 0 2 4 8 6 2 3 2 18 13 7 10 4 8 17 2 1 7 153
Female 6 14 54 9 1 0 17 34 23 3 2 18 46 38 11 30 7 44 38 19 4 29 447
Total 12 24 74 12 1 2 21 42 29 5 5 20 64 51 18 40 11 52 55 21 5 36 600Native
Hawaiian or Male 1 0 0 0 0 0 0 0 0 0 0 0 0 0 0 0 0 0 0 0 0 0 1
Other Paci- Female 0 0 0 0 0 0 0 0 0 0 0 0 0 0 0 0 0 0 0 1 0 0 1
fic Islander Total 1 0 0 0 0 0 0 0 0 0 0 0 0 0 0 0 0 0 0 1 0 0 2
White Male 15 3 22 17 26 7 13 20 12 9 22 18 30 9 39 10 11 6 6 6 15 8 324
Female 21 7 64 39 29 12 21 36 29 8 30 25 48 24 65 40 24 5 23 19 24 14 607
Total 36 10 86 56 55 19 34 56 41 17 52 43 78 33 104 50 35 11 29 25 39 22 931
Two or Male 2 0 1 0 1 0 0 0 0 0 0 1 0 2 0 0 0 0 0 0 0 6 13
More Female 0 0 3 0 5 0 0 4 0 0 0 2 0 3 4 2 0 1 0 0 0 9 33
Races Total 2 0 4 0 6 0 0 4 0 0 0 3 0 5 4 2 0 1 0 0 0 15 46
Unknown* Male 0 0 0 2 0 4 3 6 2 0 0 7 1 0 2 0 0 0 4 0 0 0 31
Female 0 0 0 4 0 13 8 36 6 0 1 16 1 1 1 1 1 2 2 3 0 2 98
Total 0 0 0 6 0 17 11 42 8 0 1 23 2 1 3 1 1 2 6 3 0 2 129Grand
Total 56 60 174 80 65 38 71 148 106 28 66 96 157 100 136 100 50 73 106 69 45 89 1913
*PUCO classifies all international students as "unknown" for race/ethnicity.
(Does not include students enrolled in alternate or special O.D. programs - see table 1.16)

Percentage of Full-Time, First-Year Students by School in the Professional O.D. Programs by Gender and Race/Ethnicity, AY 2016-2017
Annual Student Data Report 2016-2017 1.7Association of Schools and Colleges of Optometry
www.optometriceducation.org
AZCOPT IAUPR ICO IUSO KYCO MCO MCPHS NECO NOVA NSUOCO OSU PUCO Salus/ SCCO SCO SUNY UABSO UCB UHCO UIWRSO UMSL WUCO ALLPCO MBKU SCHOOLS
Black or Male 0.0% 1.7% 0.0% 0.0% 0.0% 0.0% 0.0% 0.0% 1.9% 0.0% 4.5% 0.0% 1.3% 0.0% 1.5% 0.0% 0.0% 1.4% 0.9% 0.0% 0.0% 0.0% 0.6%
African Female 0.0% 1.7% 3.4% 3.8% 3.1% 0.0% 1.4% 0.0% 7.5% 3.6% 3.0% 0.0% 3.8% 2.0% 2.9% 1.0% 0.0% 4.1% 0.9% 4.3% 0.0% 2.2% 2.4%
American Total 0.0% 3.3% 3.4% 3.8% 3.1% 0.0% 1.4% 0.0% 9.4% 3.6% 7.6% 0.0% 5.1% 2.0% 4.4% 1.0% 0.0% 5.5% 1.9% 4.3% 0.0% 2.2% 3.0%
Hispanic Male 3.6% 13.3% 0.6% 0.0% 0.0% 0.0% 0.0% 0.0% 4.7% 0.0% 0.0% 2.1% 0.6% 0.0% 0.7% 3.0% 0.0% 0.0% 3.8% 2.9% 2.2% 1.1% 1.6%
or Latino Female 5.4% 26.7% 1.1% 3.8% 1.5% 0.0% 5.6% 2.7% 11.3% 3.6% 4.5% 5.2% 2.5% 8.0% 0.0% 3.0% 6.0% 4.1% 9.4% 17.4% 0.0% 12.4% 5.6%
Total 8.9% 40.0% 1.7% 3.8% 1.5% 0.0% 5.6% 2.7% 16.0% 3.6% 4.5% 7.3% 3.2% 8.0% 0.7% 6.0% 6.0% 4.1% 13.2% 20.3% 2.2% 13.5% 7.3%American
Indian or Male 0.0% 0.0% 0.0% 0.0% 0.0% 0.0% 0.0% 0.0% 0.0% 10.7% 0.0% 0.0% 0.0% 0.0% 0.0% 0.0% 0.0% 0.0% 0.0% 1.4% 0.0% 0.0% 0.2%
Alaska Female 0.0% 0.0% 0.6% 0.0% 0.0% 0.0% 0.0% 0.0% 0.9% 3.6% 0.0% 0.0% 0.0% 0.0% 0.0% 0.0% 0.0% 0.0% 0.0% 1.4% 0.0% 0.0% 0.2%
Native Total 0.0% 0.0% 0.6% 0.0% 0.0% 0.0% 0.0% 0.0% 0.9% 14.3% 0.0% 0.0% 0.0% 0.0% 0.0% 0.0% 0.0% 0.0% 0.0% 2.9% 0.0% 0.0% 0.4%
Asian Male 10.7% 16.7% 11.5% 3.8% 0.0% 5.3% 5.6% 5.4% 5.7% 7.1% 4.5% 2.1% 11.5% 13.0% 5.1% 10.0% 8.0% 11.0% 16.0% 2.9% 2.2% 7.9% 8.0%
Female 10.7% 23.3% 31.0% 11.3% 1.5% 0.0% 23.9% 23.0% 21.7% 10.7% 3.0% 18.8% 29.3% 38.0% 8.1% 30.0% 14.0% 60.3% 35.8% 27.5% 8.9% 32.6% 23.4%
Total 21.4% 40.0% 42.5% 15.0% 1.5% 5.3% 29.6% 28.4% 27.4% 17.9% 7.6% 20.8% 40.8% 51.0% 13.2% 40.0% 22.0% 71.2% 51.9% 30.4% 11.1% 40.4% 31.4%Native
Hawaiian or Male 1.8% 0.0% 0.0% 0.0% 0.0% 0.0% 0.0% 0.0% 0.0% 0.0% 0.0% 0.0% 0.0% 0.0% 0.0% 0.0% 0.0% 0.0% 0.0% 0.0% 0.0% 0.0% 0.1%
Other Paci- Female 0.0% 0.0% 0.0% 0.0% 0.0% 0.0% 0.0% 0.0% 0.0% 0.0% 0.0% 0.0% 0.0% 0.0% 0.0% 0.0% 0.0% 0.0% 0.0% 1.4% 0.0% 0.0% 0.1%
fic Islander Total 1.8% 0.0% 0.0% 0.0% 0.0% 0.0% 0.0% 0.0% 0.0% 0.0% 0.0% 0.0% 0.0% 0.0% 0.0% 0.0% 0.0% 0.0% 0.0% 1.4% 0.0% 0.0% 0.1%
White Male 26.8% 5.0% 12.6% 21.3% 40.0% 18.4% 18.3% 13.5% 11.3% 32.1% 33.3% 18.8% 19.1% 9.0% 28.7% 10.0% 22.0% 8.2% 5.7% 8.7% 33.3% 9.0% 16.9%
Female 37.5% 11.7% 36.8% 48.8% 44.6% 31.6% 29.6% 24.3% 27.4% 28.6% 45.5% 26.0% 30.6% 24.0% 47.8% 40.0% 48.0% 6.8% 21.7% 27.5% 53.3% 15.7% 31.7%
Total 64.3% 16.7% 49.4% 70.0% 84.6% 50.0% 47.9% 37.8% 38.7% 60.7% 78.8% 44.8% 49.7% 33.0% 76.5% 50.0% 70.0% 15.1% 27.4% 36.2% 86.7% 24.7% 48.7%
Two or Male 3.6% 0.0% 0.6% 0.0% 1.5% 0.0% 0.0% 0.0% 0.0% 0.0% 0.0% 1.0% 0.0% 2.0% 0.0% 0.0% 0.0% 0.0% 0.0% 0.0% 0.0% 6.7% 0.7%
More Female 0.0% 0.0% 1.7% 0.0% 7.7% 0.0% 0.0% 2.7% 0.0% 0.0% 0.0% 2.1% 0.0% 3.0% 2.9% 2.0% 0.0% 1.4% 0.0% 0.0% 0.0% 10.1% 1.7%
Races Total 3.6% 0.0% 2.3% 0.0% 9.2% 0.0% 0.0% 2.7% 0.0% 0.0% 0.0% 3.1% 0.0% 5.0% 2.9% 2.0% 0.0% 1.4% 0.0% 0.0% 0.0% 16.9% 2.4%
Unknown* Male 0.0% 0.0% 0.0% 2.5% 0.0% 10.5% 4.2% 4.1% 1.9% 0.0% 0.0% 7.3% 0.6% 0.0% 1.5% 0.0% 0.0% 0.0% 3.8% 0.0% 0.0% 0.0% 1.6%
Female 0.0% 0.0% 0.0% 5.0% 0.0% 34.2% 11.3% 24.3% 5.7% 0.0% 1.5% 16.7% 0.6% 1.0% 0.7% 1.0% 2.0% 2.7% 1.9% 4.3% 0.0% 2.2% 5.1%
Total 0.0% 0.0% 0.0% 7.5% 0.0% 44.7% 15.5% 28.4% 7.5% 0.0% 1.5% 24.0% 1.3% 1.0% 2.2% 1.0% 2.0% 2.7% 5.7% 4.3% 0.0% 2.2% 6.7%
*PUCO classifies all international students as "unknown" for race/ethnicity.
(Does not include students enrolled in alternate or special O.D. programs - see table 1.16)

Classification of Full-Time, Second-Year Students by School in the Professional O.D. Programs by Gender and Race/Ethnicity, AY 2016-2017*
Annual Student Data Report 2016-2017 1.8 Association of Schools and Colleges of Optometry
www.optometriceducation.org
AZCOPT IAUPR ICO IUSO MCO MCPHS NECO NOVA NSUOCO OSU PUCO Salus/ SCCO SCO SUNY UABSO UCB UHCO UIWRSO UMSL WUCO TotalPCO MBKU
Black or Male 0 0 1 1 0 0 1 0 0 1 0 1 0 0 0 1 0 0 2 1 1 10
African Female 0 1 0 3 0 0 1 3 1 1 0 3 2 2 2 2 0 0 1 0 0 22
American Total 0 1 1 4 0 0 2 3 1 2 0 4 2 2 2 3 0 0 3 1 1 32
Hispanic Male 0 4 1 3 0 0 1 5 1 1 3 4 4 0 0 0 2 4 6 0 4 43
or Latino Female 2 9 4 0 0 4 0 17 1 0 2 2 0 1 2 2 4 6 8 0 7 71
Total 2 13 5 3 0 4 1 22 2 1 5 6 4 1 2 2 6 10 14 0 11 114American
Indian or Male 0 0 0 0 0 0 0 1 2 1 1 0 0 0 0 0 0 0 0 0 0 5
Alaska Female 0 0 0 0 0 0 0 1 2 0 0 0 0 0 0 1 0 0 0 0 0 4
Native Total 0 0 0 0 0 0 0 2 4 1 1 0 0 0 0 1 0 0 0 0 0 9
Asian Male 3 8 16 1 0 7 10 2 1 0 5 14 9 4 6 1 3 12 6 0 3 111
Female 5 17 39 8 0 13 17 22 0 5 13 46 44 5 35 5 45 29 19 2 31 400
Total 8 25 55 9 0 20 27 24 1 5 18 60 53 9 41 6 48 41 25 2 34 511Native
Hawaiian or Male 1 0 0 0 0 0 0 0 0 0 0 0 0 0 0 0 0 0 0 0 0 1
Other Paci- Female 0 0 0 0 0 0 0 0 0 0 1 0 1 0 1 0 0 0 0 0 0 3
fic Islander Total 1 0 0 0 0 0 0 0 0 0 1 0 1 0 1 0 0 0 0 0 0 4
White Male 29 8 18 18 8 15 18 19 11 12 15 27 13 31 14 16 3 17 11 12 10 325
Female 13 9 77 34 8 21 34 28 9 43 22 54 20 78 25 20 12 18 15 25 18 583
Total 42 17 95 52 16 36 52 47 20 55 37 81 33 109 39 36 15 35 26 37 28 908
Two or Male 0 0 1 0 0 0 0 0 0 0 1 0 1 1 3 0 0 0 0 0 0 7
More Female 1 0 2 0 0 0 1 0 0 0 1 0 4 5 1 1 0 0 0 0 5 21
Races Total 1 0 3 0 0 0 1 0 0 0 2 0 5 6 4 1 0 0 0 0 5 28
Unknown** Male 0 0 0 3 8 5 7 0 0 0 9 0 0 0 2 2 0 7 0 2 1 46
Female 1 0 0 2 13 4 21 0 0 3 14 0 0 4 8 1 0 15 0 0 7 93
Total 1 0 0 5 21 9 28 0 0 3 23 0 0 4 10 3 0 22 0 2 8 139Grand
Total 55 56 159 73 37 69 111 98 28 67 87 151 98 131 99 52 69 108 68 42 87 1745
* KYCO is not included in this table because its first class matriculated in fall 2016 and so there is no second-year class during academic year 2016-2017.
**PUCO classifies all international students as "unknown" for race/ethnicity.
(Does not include students enrolled in alternate or special O.D. programs - see table 1.16)

Percentage of Full-Time, Second-Year Students by School in the Professional O.D. Programs by Gender and Race/Ethnicity, AY 2016-2017*
Annual Student Data Report 2016-2017 1.9Association of Schools and Colleges of Optometry
www.optometriceducation.org
AZCOPT IAUPR ICO IUSO MCO MCPHS NECO NOVA NSUOCO OSU PUCO Salus/ SCCO SCO SUNY UABSO UCB UHCO UIWRSO UMSL WUCO ALLPCO MBKU SCHOOLS
Black or Male 0.0% 0.0% 0.6% 1.4% 0.0% 0.0% 0.9% 0.0% 0.0% 1.5% 0.0% 0.7% 0.0% 0.0% 0.0% 1.9% 0.0% 0.0% 2.9% 2.4% 1.1% 0.6%
African Female 0.0% 1.8% 0.0% 4.1% 0.0% 0.0% 0.9% 3.1% 3.6% 1.5% 0.0% 2.0% 2.0% 1.5% 2.0% 3.8% 0.0% 0.0% 1.5% 0.0% 0.0% 1.3%
American Total 0.0% 1.8% 0.6% 5.5% 0.0% 0.0% 1.8% 3.1% 3.6% 3.0% 0.0% 2.6% 2.0% 1.5% 2.0% 5.8% 0.0% 0.0% 4.4% 2.4% 1.1% 1.8%
Hispanic Male 0.0% 7.1% 0.6% 4.1% 0.0% 0.0% 0.9% 5.1% 3.6% 1.5% 3.4% 2.6% 4.1% 0.0% 0.0% 0.0% 2.9% 3.7% 8.8% 0.0% 4.6% 2.5%
or Latino Female 3.6% 16.1% 2.5% 0.0% 0.0% 5.8% 0.0% 17.3% 3.6% 0.0% 2.3% 1.3% 0.0% 0.8% 2.0% 3.8% 5.8% 5.6% 11.8% 0.0% 8.0% 4.1%
Total 3.6% 23.2% 3.1% 4.1% 0.0% 5.8% 0.9% 22.4% 7.1% 1.5% 5.7% 4.0% 4.1% 0.8% 2.0% 3.8% 8.7% 9.3% 20.6% 0.0% 12.6% 6.5%American
Indian or Male 0.0% 0.0% 0.0% 0.0% 0.0% 0.0% 0.0% 1.0% 7.1% 1.5% 1.1% 0.0% 0.0% 0.0% 0.0% 0.0% 0.0% 0.0% 0.0% 0.0% 0.0% 0.3%
Alaska Female 0.0% 0.0% 0.0% 0.0% 0.0% 0.0% 0.0% 1.0% 7.1% 0.0% 0.0% 0.0% 0.0% 0.0% 0.0% 1.9% 0.0% 0.0% 0.0% 0.0% 0.0% 0.2%
Native Total 0.0% 0.0% 0.0% 0.0% 0.0% 0.0% 0.0% 2.0% 14.3% 1.5% 1.1% 0.0% 0.0% 0.0% 0.0% 1.9% 0.0% 0.0% 0.0% 0.0% 0.0% 0.5%
Asian Male 5.5% 14.3% 10.1% 1.4% 0.0% 10.1% 9.0% 2.0% 3.6% 0.0% 5.7% 9.3% 9.2% 3.1% 6.1% 1.9% 4.3% 11.1% 8.8% 0.0% 3.4% 6.4%
Female 9.1% 30.4% 24.5% 11.0% 0.0% 18.8% 15.3% 22.4% 0.0% 7.5% 14.9% 30.5% 44.9% 3.8% 35.4% 9.6% 65.2% 26.9% 27.9% 4.8% 35.6% 22.9%
Total 14.5% 44.6% 34.6% 12.3% 0.0% 29.0% 24.3% 24.5% 3.6% 7.5% 20.7% 39.7% 54.1% 6.9% 41.4% 11.5% 69.6% 38.0% 36.8% 4.8% 39.1% 29.3%Native
Hawaiian or Male 1.8% 0.0% 0.0% 0.0% 0.0% 0.0% 0.0% 0.0% 0.0% 0.0% 0.0% 0.0% 0.0% 0.0% 0.0% 0.0% 0.0% 0.0% 0.0% 0.0% 0.0% 0.1%
Other Paci- Female 0.0% 0.0% 0.0% 0.0% 0.0% 0.0% 0.0% 0.0% 0.0% 0.0% 1.1% 0.0% 1.0% 0.0% 1.0% 0.0% 0.0% 0.0% 0.0% 0.0% 0.0% 0.2%
fic Islander Total 1.8% 0.0% 0.0% 0.0% 0.0% 0.0% 0.0% 0.0% 0.0% 0.0% 1.1% 0.0% 1.0% 0.0% 1.0% 0.0% 0.0% 0.0% 0.0% 0.0% 0.0% 0.2%
White Male 52.7% 14.3% 11.3% 24.7% 21.6% 21.7% 16.2% 19.4% 39.3% 17.9% 17.2% 17.9% 13.3% 23.7% 14.1% 30.8% 4.3% 15.7% 16.2% 28.6% 11.5% 18.6%
Female 23.6% 16.1% 48.4% 46.6% 21.6% 30.4% 30.6% 28.6% 32.1% 64.2% 25.3% 35.8% 20.4% 59.5% 25.3% 38.5% 17.4% 16.7% 22.1% 59.5% 20.7% 33.4%
Total 76.4% 30.4% 59.7% 71.2% 43.2% 52.2% 46.8% 48.0% 71.4% 82.1% 42.5% 53.6% 33.7% 83.2% 39.4% 69.2% 21.7% 32.4% 38.2% 88.1% 32.2% 52.0%
Two or Male 0.0% 0.0% 0.6% 0.0% 0.0% 0.0% 0.0% 0.0% 0.0% 0.0% 1.1% 0.0% 1.0% 0.8% 3.0% 0.0% 0.0% 0.0% 0.0% 0.0% 0.0% 0.4%
More Female 1.8% 0.0% 1.3% 0.0% 0.0% 0.0% 0.9% 0.0% 0.0% 0.0% 1.1% 0.0% 4.1% 3.8% 1.0% 1.9% 0.0% 0.0% 0.0% 0.0% 5.7% 1.2%
Races Total 1.8% 0.0% 1.9% 0.0% 0.0% 0.0% 0.9% 0.0% 0.0% 0.0% 2.3% 0.0% 5.1% 4.6% 4.0% 1.9% 0.0% 0.0% 0.0% 0.0% 5.7% 1.6%
Male 0.0% 0.0% 0.0% 4.1% 21.6% 7.2% 6.3% 0.0% 0.0% 0.0% 10.3% 0.0% 0.0% 0.0% 2.0% 3.8% 0.0% 6.5% 0.0% 4.8% 1.1% 2.6%
Unknown** Female 0.0% 0.0% 0.0% 2.7% 35.1% 5.8% 18.9% 0.0% 0.0% 4.5% 16.1% 0.0% 0.0% 3.1% 8.1% 1.9% 0.0% 13.9% 0.0% 0.0% 8.0% 5.3%
Total 1.8% 0.0% 0.0% 6.8% 56.8% 13.0% 25.2% 0.0% 0.0% 4.5% 26.4% 0.0% 0.0% 3.1% 10.1% 5.8% 0.0% 20.4% 0.0% 4.8% 9.2% 8.0%
* KYCO is not included in this table because its first class matriculated in fall 2016 and so there is no second-year class during academic year 2016-2017.
**PUCO classifies all international students as "unknown" for race/ethnicity.
(Does not include students enrolled in alternate or special O.D. programs - see table 1.16)

Classification of Full-Time, Third-Year Students by School in the Professional O.D. Programs by Gender and Race/Ethnicity, AY 2016-2017*
Annual Student Data Report 2016-2017 1.10 Association of Schools and Colleges of Optometry
www.optometriceducation.org
AZCOPT IAUPR ICO IUSO MCO MCPHS NECO NOVA NSUOCO OSU PUCO Salus/ SCCO SCO SUNY UABSO UCB UHCO UIWRSO UMSL WUCO TotalPCO MBKU
Black or Male 0 0 0 0 1 1 0 4 1 0 0 2 0 0 1 1 1 0 0 0 1 13
African Female 0 7 2 0 0 1 2 6 0 2 0 9 0 3 1 2 1 1 2 2 3 44
American Total 0 7 2 0 1 2 2 10 1 2 0 11 0 3 2 3 2 1 2 2 4 57
Hispanic Male 3 3 3 0 1 1 2 1 1 0 0 1 0 2 1 0 1 4 5 0 0 29
or Latino Female 2 11 1 4 1 3 1 7 0 1 1 2 2 0 2 0 4 7 6 0 7 62
Total 5 14 4 4 2 4 3 8 1 1 1 3 2 2 3 0 5 11 11 0 7 91American
Indian or Male 0 0 0 0 0 0 0 0 2 0 0 0 0 0 0 0 0 0 0 0 0 2
Alaska Female 0 0 0 0 0 1 0 3 4 0 0 0 0 0 0 1 1 0 1 0 0 11
Native Total 0 0 0 0 0 1 0 3 6 0 0 0 0 0 0 1 1 0 1 0 0 13
Asian Male 7 3 16 1 0 1 4 10 0 4 7 10 12 6 11 2 6 10 5 2 8 125
Female 3 19 52 3 0 10 23 17 3 3 14 46 57 11 18 4 34 32 13 3 17 382
Total 10 22 68 4 0 11 27 27 3 7 21 56 69 17 29 6 40 42 18 5 25 507Native
Hawaiian or Male 0 0 0 0 0 0 0 0 0 0 1 0 0 0 0 0 0 1 0 0 0 2
Other Paci- Female 0 0 0 0 0 0 0 0 0 0 1 0 0 0 0 0 0 0 0 0 0 1
fic Islander Total 0 0 0 0 0 0 0 0 0 0 2 0 0 0 0 0 0 1 0 0 0 3
White Male 20 4 28 22 22 12 20 15 6 17 23 28 7 40 11 14 6 16 14 17 7 349
Female 18 7 49 36 13 20 35 34 10 37 17 50 17 67 34 20 9 26 17 13 12 541
Total 38 11 77 58 35 32 55 49 16 54 40 78 24 107 45 34 15 42 31 30 19 890
Two or Male 2 0 1 0 0 0 1 0 0 0 0 0 1 1 1 0 0 0 0 0 3 10
More Female 0 0 3 0 0 0 1 0 0 0 0 0 5 0 8 0 0 0 0 0 6 23
Races Total 2 0 4 0 0 0 2 0 0 0 0 0 6 1 9 0 0 0 0 0 9 33
Unknown** Male 2 0 0 1 0 0 4 0 0 0 3 1 0 1 1 0 0 5 0 0 0 18
Female 1 0 0 3 0 7 24 0 0 4 19 0 0 2 5 0 1 2 0 2 0 70
Total 3 0 0 4 0 7 28 0 0 4 22 1 0 3 6 0 1 7 0 2 0 88Grand
Total 58 54 155 70 38 57 117 97 27 68 86 149 101 133 94 44 64 104 63 39 64 1682
* KYCO is not included in this table because its first class matriculated in fall 2016 and so there is no third-year class during academic year 2016-2017.
**PUCO classifies all international students as "unknown" for race/ethnicity.
(Does not include students enrolled in alternate or special O.D. programs - see table 1.16)

Percentage of Full-Time, Third-Year Students by School in the Professional O.D. Programs by Gender and Race/Ethnicity, AY 2016-2017
Annual Student Data Report 2016-2017 1.11Association of Schools and Colleges of Optometry
www.optometriceducation.org
AZCOPT IAUPR ICO IUSO MCO MCPHS NECO NOVA NSUOCO OSU PUCO Salus/ SCCO SCO SUNY UABSO UCB UHCO UIWRSO UMSL WUCO ALLPCO MBKU SCHOOLS
Black or Male 0.0% 0.0% 0.0% 0.0% 2.6% 1.8% 0.0% 4.1% 3.7% 0.0% 0.0% 1.3% 0.0% 0.0% 1.1% 2.3% 1.6% 0.0% 0.0% 0.0% 1.6% 0.8%
African Female 0.0% 13.0% 1.3% 0.0% 0.0% 1.8% 1.7% 6.2% 0.0% 2.9% 0.0% 6.0% 0.0% 2.3% 1.1% 4.5% 1.6% 1.0% 3.2% 5.1% 4.7% 2.6%
American Total 0.0% 13.0% 1.3% 0.0% 2.6% 3.5% 1.7% 10.3% 3.7% 2.9% 0.0% 7.4% 0.0% 2.3% 2.1% 6.8% 3.1% 1.0% 3.2% 5.1% 6.3% 3.4%
Hispanic Male 5.2% 5.6% 1.9% 0.0% 2.6% 1.8% 1.7% 1.0% 3.7% 0.0% 0.0% 0.7% 0.0% 1.5% 1.1% 0.0% 1.6% 3.8% 7.9% 0.0% 0.0% 1.7%
or Latino Female 3.4% 20.4% 0.6% 5.7% 2.6% 5.3% 0.9% 7.2% 0.0% 1.5% 1.2% 1.3% 2.0% 0.0% 2.1% 0.0% 6.3% 6.7% 9.5% 0.0% 10.9% 3.7%
Total 8.6% 25.9% 2.6% 5.7% 5.3% 7.0% 2.6% 8.2% 3.7% 1.5% 1.2% 2.0% 2.0% 1.5% 3.2% 0.0% 7.8% 10.6% 17.5% 0.0% 10.9% 5.4%American
Indian or Male 0.0% 0.0% 0.0% 0.0% 0.0% 0.0% 0.0% 0.0% 7.4% 0.0% 0.0% 0.0% 0.0% 0.0% 0.0% 0.0% 0.0% 0.0% 0.0% 0.0% 0.0% 0.1%
Alaska Female 0.0% 0.0% 0.0% 0.0% 0.0% 1.8% 0.0% 3.1% 14.8% 0.0% 0.0% 0.0% 0.0% 0.0% 0.0% 2.3% 1.6% 0.0% 1.6% 0.0% 0.0% 0.7%
Native Total 0.0% 0.0% 0.0% 0.0% 0.0% 1.8% 0.0% 3.1% 22.2% 0.0% 0.0% 0.0% 0.0% 0.0% 0.0% 2.3% 1.6% 0.0% 1.6% 0.0% 0.0% 0.8%
Asian Male 12.1% 5.6% 10.3% 1.4% 0.0% 1.8% 3.4% 10.3% 0.0% 5.9% 8.1% 6.7% 11.9% 4.5% 11.7% 4.5% 9.4% 9.6% 7.9% 5.1% 12.5% 7.4%
Female 5.2% 35.2% 33.5% 4.3% 0.0% 17.5% 19.7% 17.5% 11.1% 4.4% 16.3% 30.9% 56.4% 8.3% 19.1% 9.1% 53.1% 30.8% 20.6% 7.7% 26.6% 22.7%
Total 17.2% 40.7% 43.9% 5.7% 0.0% 19.3% 23.1% 27.8% 11.1% 10.3% 24.4% 37.6% 68.3% 12.8% 30.9% 13.6% 62.5% 40.4% 28.6% 12.8% 39.1% 30.1%Native
Hawaiian or Male 0.0% 0.0% 0.0% 0.0% 0.0% 0.0% 0.0% 0.0% 0.0% 0.0% 1.2% 0.0% 0.0% 0.0% 0.0% 0.0% 0.0% 1.0% 0.0% 0.0% 0.0% 0.1%
Other Paci- Female 0.0% 0.0% 0.0% 0.0% 0.0% 0.0% 0.0% 0.0% 0.0% 0.0% 1.2% 0.0% 0.0% 0.0% 0.0% 0.0% 0.0% 0.0% 0.0% 0.0% 0.0% 0.1%
fic Islander Total 0.0% 0.0% 0.0% 0.0% 0.0% 0.0% 0.0% 0.0% 0.0% 0.0% 2.3% 0.0% 0.0% 0.0% 0.0% 0.0% 0.0% 1.0% 0.0% 0.0% 0.0% 0.2%
White Male 34.5% 7.4% 18.1% 31.4% 57.9% 21.1% 17.1% 15.5% 22.2% 25.0% 26.7% 18.8% 6.9% 30.1% 11.7% 31.8% 9.4% 15.4% 22.2% 43.6% 10.9% 20.7%
Female 31.0% 13.0% 31.6% 51.4% 34.2% 35.1% 29.9% 35.1% 37.0% 54.4% 19.8% 33.6% 16.8% 50.4% 36.2% 45.5% 14.1% 25.0% 27.0% 33.3% 18.8% 32.2%
Total 65.5% 20.4% 49.7% 82.9% 92.1% 56.1% 47.0% 50.5% 59.3% 79.4% 46.5% 52.3% 23.8% 80.5% 47.9% 77.3% 23.4% 40.4% 49.2% 76.9% 29.7% 52.9%
Two or Male 3.4% 0.0% 0.6% 0.0% 0.0% 0.0% 0.9% 0.0% 0.0% 0.0% 0.0% 0.0% 1.0% 0.8% 1.1% 0.0% 0.0% 0.0% 0.0% 0.0% 4.7% 0.6%
More Female 0.0% 0.0% 1.9% 0.0% 0.0% 0.0% 0.9% 0.0% 0.0% 0.0% 0.0% 0.0% 5.0% 0.0% 8.5% 0.0% 0.0% 0.0% 0.0% 0.0% 9.4% 1.4%
Races Total 3.4% 0.0% 2.6% 0.0% 0.0% 0.0% 1.7% 0.0% 0.0% 0.0% 0.0% 0.0% 5.9% 0.8% 9.6% 0.0% 0.0% 0.0% 0.0% 0.0% 14.1% 2.0%
Male 0.0% 0.0% 0.0% 1.4% 0.0% 0.0% 3.4% 0.0% 0.0% 0.0% 3.5% 0.7% 0.0% 0.8% 1.1% 0.0% 0.0% 4.8% 0.0% 0.0% 0.0% 1.1%
Unknown** Female 3.4% 0.0% 0.0% 4.3% 0.0% 12.3% 20.5% 0.0% 0.0% 5.9% 22.1% 0.0% 0.0% 1.5% 5.3% 0.0% 1.6% 1.9% 0.0% 5.1% 0.0% 4.2%
Total 1.7% 0.0% 0.0% 5.7% 0.0% 12.3% 23.9% 0.0% 0.0% 5.9% 25.6% 0.7% 0.0% 2.3% 6.4% 0.0% 1.6% 6.7% 0.0% 5.1% 0.0% 5.2%
* KYCO is not included in this table because its first class matriculated in fall 2016 and so there is no third-year class during academic year 2016-2017.
**PUCO classifies all international students as "unknown" for race/ethnicity.
(Does not include students enrolled in alternate or special O.D. programs - see table 1.16)

Classification of Full-Time, Fourth-Year Students by School in the Professional O.D. Programs by Gender and Race/Ethnicity, AY 2016-2017*
Annual Student Data Report 2016-2017 1.12 Association of Schools and Colleges of Optometry
www.optometriceducation.org
AZCOPT IAUPR ICO IUSO MCO MCPHS NECO NOVA NSUOCO OSU PUCO Salus/ SCCO SCO SUNY UABSO UCB UHCO UIWRSO UMSL WUCO TotalPCO MBKU
Black or Male 0 0 0 0 0 0 1 3 0 0 1 3 0 1 1 0 0 0 1 0 2 13
African Female 0 2 2 0 0 2 1 6 0 1 0 9 0 3 1 3 0 1 0 2 2 35
American Total 0 2 2 0 0 2 2 9 0 1 1 12 0 4 2 3 0 1 1 2 4 48
Hispanic Male 0 3 4 1 3 1 4 1 1 2 0 0 2 1 0 0 1 2 4 0 3 33
or Latino Female 2 9 2 0 0 2 0 10 0 1 2 0 3 1 5 0 1 7 7 1 6 59
Total 2 12 6 1 3 3 4 11 1 3 2 0 5 2 5 0 2 9 11 1 9 92American
Indian or Male 0 1 0 0 0 0 0 0 2 0 0 0 0 0 0 0 0 0 0 0 0 3
Alaska Female 1 0 0 1 0 0 0 2 3 0 0 0 0 0 0 0 0 0 0 1 0 8
Native Total 1 1 0 1 0 0 0 2 5 0 0 0 0 0 0 0 0 0 0 1 0 11
Asian Male 1 6 14 2 0 6 5 4 0 1 3 10 15 1 7 3 8 20 5 1 12 124
Female 5 19 47 2 0 13 20 15 0 3 13 31 35 7 28 3 35 24 15 0 31 346
Total 6 25 61 4 0 19 25 19 0 4 16 41 50 8 35 6 43 44 20 1 43 470Native
Hawaiian or Male 0 0 0 0 0 0 0 0 0 0 0 0 0 0 0 0 0 0 0 0 0 0
Other Paci- Female 0 0 1 0 0 0 0 1 0 0 0 1 0 0 0 0 0 0 1 0 0 4
fic Islander Total 0 0 1 0 0 0 0 1 0 0 0 1 0 0 0 0 0 0 1 0 0 4
White Male 19 9 27 29 10 10 21 22 10 16 22 29 12 53 11 6 4 15 18 14 5 362
Female 14 11 53 35 20 20 42 32 13 32 29 60 23 55 27 21 8 28 12 21 17 573
Total 33 20 80 64 30 30 63 54 23 48 51 89 35 108 38 27 12 43 30 35 22 935
Two or Male 1 0 2 0 0 0 1 0 0 0 0 0 2 3 1 0 0 0 0 0 2 12
More Female 2 0 3 0 2 0 4 0 0 0 0 0 6 3 1 0 0 0 0 0 9 30
Races Total 3 0 5 0 2 0 5 0 0 0 0 0 8 6 2 0 0 0 0 0 11 42
Unknown** Male 0 1 0 0 0 3 11 0 0 0 4 0 0 1 1 0 1 1 1 1 0 25
Female 0 0 0 4 0 5 22 0 0 1 17 0 0 0 5 0 0 0 0 1 2 57
Total 0 1 0 4 0 8 33 0 0 1 21 0 0 1 6 0 1 1 1 2 2 82Grand
Total 45 61 155 74 35 62 132 96 29 57 91 143 98 129 88 36 58 98 64 42 91 1684
* KYCO is not included in this table because its first class matriculated in fall 2016 and so there is no fourth-year class during academic year 2016-2017.
**PUCO classifies all international students as "unknown" for race/ethnicity.
(Does not include students enrolled in alternate or special O.D. programs - see table 1.16)

Percentage of Full-Time, Fourth-Year Students by School in the Professional O.D. Programs by Gender and Race/Ethnicity, AY 2016-2017*
Annual Student Data Report 2016-2017 1.13Association of Schools and Colleges of Optometry
www.optometriceducation.org
AZCOPT IAUPR ICO IUSO MCO MCPHS NECO NOVA NSUOCO OSU PUCO Salus/ SCCO SCO SUNY UABSO UCB UHCO UIWRSO UMSL WUCO ALLPCO MBKU SCHOOLS
Black or Male 0.0% 0.0% 0.0% 0.0% 0.0% 0.0% 0.8% 3.1% 0.0% 0.0% 1.1% 2.1% 0.0% 0.8% 1.1% 0.0% 0.0% 0.0% 1.6% 0.0% 2.2% 0.8%
African Female 0.0% 3.3% 1.3% 0.0% 0.0% 3.2% 0.8% 6.3% 0.0% 1.8% 0.0% 6.3% 0.0% 2.3% 1.1% 8.3% 0.0% 1.0% 0.0% 4.8% 2.2% 2.1%
American Total 0.0% 3.3% 1.3% 0.0% 0.0% 3.2% 1.5% 9.4% 0.0% 1.8% 1.1% 8.4% 0.0% 3.1% 2.3% 8.3% 0.0% 1.0% 1.6% 4.8% 4.4% 2.9%
Hispanic Male 0.0% 4.9% 2.6% 1.4% 8.6% 1.6% 3.0% 1.0% 3.4% 3.5% 0.0% 0.0% 2.0% 0.8% 0.0% 0.0% 1.7% 2.0% 6.3% 0.0% 3.3% 2.0%
or Latino Female 4.4% 14.8% 1.3% 0.0% 0.0% 3.2% 0.0% 10.4% 0.0% 1.8% 2.2% 0.0% 3.1% 0.8% 5.7% 0.0% 1.7% 7.1% 10.9% 2.4% 6.6% 3.5%
Total 4.4% 19.7% 3.9% 1.4% 8.6% 4.8% 3.0% 11.5% 3.4% 5.3% 2.2% 0.0% 5.1% 1.6% 5.7% 0.0% 3.4% 9.2% 17.2% 2.4% 9.9% 5.5%American
Indian or Male 0.0% 1.6% 0.0% 0.0% 0.0% 0.0% 0.0% 0.0% 6.9% 0.0% 0.0% 0.0% 0.0% 0.0% 0.0% 0.0% 0.0% 0.0% 0.0% 0.0% 0.0% 0.2%
Alaska Female 2.2% 0.0% 0.0% 1.4% 0.0% 0.0% 0.0% 2.1% 10.3% 0.0% 0.0% 0.0% 0.0% 0.0% 0.0% 0.0% 0.0% 0.0% 0.0% 2.4% 0.0% 0.5%
Native Total 2.2% 1.6% 0.0% 1.4% 0.0% 0.0% 0.0% 2.1% 17.2% 0.0% 0.0% 0.0% 0.0% 0.0% 0.0% 0.0% 0.0% 0.0% 0.0% 2.4% 0.0% 0.7%
Asian Male 2.2% 9.8% 9.0% 2.7% 0.0% 9.7% 3.8% 4.2% 0.0% 1.8% 3.3% 7.0% 15.3% 0.8% 8.0% 8.3% 13.8% 20.4% 7.8% 2.4% 13.2% 7.4%
Female 11.1% 31.1% 30.3% 2.7% 0.0% 21.0% 15.2% 15.6% 0.0% 5.3% 14.3% 21.7% 35.7% 5.4% 31.8% 8.3% 60.3% 24.5% 23.4% 0.0% 34.1% 20.5%
Total 13.3% 41.0% 39.4% 5.4% 0.0% 30.6% 18.9% 19.8% 0.0% 7.0% 17.6% 28.7% 51.0% 6.2% 39.8% 16.7% 74.1% 44.9% 31.3% 2.4% 47.3% 27.9%Native
Hawaiian or Male 0.0% 0.0% 0.0% 0.0% 0.0% 0.0% 0.0% 0.0% 0.0% 0.0% 0.0% 0.0% 0.0% 0.0% 0.0% 0.0% 0.0% 0.0% 0.0% 0.0% 0.0% 0.0%
Other Paci- Female 0.0% 0.0% 0.6% 0.0% 0.0% 0.0% 0.0% 1.0% 0.0% 0.0% 0.0% 0.7% 0.0% 0.0% 0.0% 0.0% 0.0% 0.0% 1.6% 0.0% 0.0% 0.2%
fic Islander Total 0.0% 0.0% 0.6% 0.0% 0.0% 0.0% 0.0% 1.0% 0.0% 0.0% 0.0% 0.7% 0.0% 0.0% 0.0% 0.0% 0.0% 0.0% 1.6% 0.0% 0.0% 0.2%
White Male 42.2% 14.8% 17.4% 39.2% 28.6% 16.1% 15.9% 22.9% 34.5% 28.1% 24.2% 20.3% 12.2% 41.1% 12.5% 16.7% 6.9% 15.3% 28.1% 33.3% 5.5% 21.5%
Female 31.1% 18.0% 34.2% 47.3% 57.1% 32.3% 31.8% 33.3% 44.8% 56.1% 31.9% 42.0% 23.5% 42.6% 30.7% 58.3% 13.8% 28.6% 18.8% 50.0% 18.7% 34.0%
Total 73.3% 32.8% 51.6% 86.5% 85.7% 48.4% 47.7% 56.3% 79.3% 84.2% 56.0% 62.2% 35.7% 83.7% 43.2% 75.0% 20.7% 43.9% 46.9% 83.3% 24.2% 55.5%
Two or Male 2.2% 0.0% 1.3% 0.0% 0.0% 0.0% 0.8% 0.0% 0.0% 0.0% 0.0% 0.0% 2.0% 2.3% 1.1% 0.0% 0.0% 0.0% 0.0% 0.0% 2.2% 0.7%
More Female 4.4% 0.0% 1.9% 0.0% 5.7% 0.0% 3.0% 0.0% 0.0% 0.0% 0.0% 0.0% 6.1% 2.3% 1.1% 0.0% 0.0% 0.0% 0.0% 0.0% 9.9% 1.8%
Races Total 6.7% 0.0% 3.2% 0.0% 5.7% 0.0% 3.8% 0.0% 0.0% 0.0% 0.0% 0.0% 8.2% 4.7% 2.3% 0.0% 0.0% 0.0% 0.0% 0.0% 12.1% 2.5%
Male 0.0% 1.6% 0.0% 0.0% 0.0% 4.8% 8.3% 0.0% 0.0% 0.0% 4.4% 0.0% 0.0% 0.8% 1.1% 0.0% 1.7% 1.0% 1.6% 2.4% 0.0% 1.5%
Unknown** Female 0.0% 0.0% 0.0% 5.4% 0.0% 8.1% 16.7% 0.0% 0.0% 1.8% 18.7% 0.0% 0.0% 0.0% 5.7% 0.0% 0.0% 0.0% 0.0% 2.4% 2.2% 3.4%
Total 0.0% 1.6% 0.0% 5.4% 0.0% 12.9% 25.0% 0.0% 0.0% 1.8% 23.1% 0.0% 0.0% 0.8% 6.8% 0.0% 1.7% 1.0% 1.6% 4.8% 2.2% 4.9%
* KYCO is not included in this table because its first class matriculated in fall 2016 and so there is no fourth-year class during academic year 2016-2017.
**PUCO classifies all international students as "unknown" for race/ethnicity.
(Does not include students enrolled in alternate or special O.D. programs - see table 1.16)

Part-Time Enrollment in the Professional O.D. Program by Gender and Year, AY 2016-2017
Annual Student Data Report 2016-2017 1.14Association of Schools and Colleges of Optometry
www.optometriceducation.org
GRAND
School ID Male Female Male Female Male Female Male Female Male Female TOTAL
AZCOPT 0 0 0 0 0 0 0 0 0 0 0
IAUPR 0 0 0 0 0 0 0 0 0 0 0
ICO 0 0 0 0 0 0 0 0 0 0 0
IUSO 0 0 0 0 0 0 0 0 0 0 0
KYCO* 0 0 0 0 0 0 0 0 0 0 0
MCO 0 0 0 0 0 0 0 0 0 0 0
MCPHS 1 3 0 0 0 0 0 0 1 3 4
NECO 0 0 0 0 0 0 0 0 0 0 0
NOVA 0 0 0 0 0 0 0 0 0 0 0
NSUOCO 0 0 0 0 0 0 0 0 0 0 0
OSU 0 0 0 0 0 0 0 0 0 0 0
PUCO 0 0 0 0 0 0 0 0 0 0 0
Salus/PCO 0 1 0 1 1 2 0 0 1 4 5
SCCOMBKU 0 0 0 0 0 0 0 0 0 0 0
SCO 0 0 2 0 0 0 0 0 2 0 2
SUNY 0 0 1 0 0 0 0 0 1 0 1
UABSO 0 0 0 0 0 0 0 0 0 0 0
UCB 0 0 0 0 0 0 0 0 0 0 0
UHCO 0 0 0 0 0 0 0 0 0 0 0
UIWRSO 0 0 0 0 0 0 0 0 0 0 0
UMSL 0 0 0 0 0 0 0 0 0 0 0
WUCO 0 0 0 0 0 0 0 0 0 0 0
Total 1 4 3 1 1 2 0 0 5 7 12
*KYCO's first class matriculated in fall 2016.
(Does not include students enrolled in alternate or special O.D. programs - see table 1.16)
TOTAL1st Year 2nd Year 3rd Year 4th Year

Classification of Total Part-Time Students by School in the Professional O.D. Programs by Gender and Race/Ethnicity, AY 2016-2017
Annual Student Data Report 2016-2017 1.15 Association of Schools and Colleges of Optometry
www.optometriceducation.org
AZCOPT IAUPR ICO IUSO KYCO* MCO MCPHS NECO NOVA NSUOCO OSU PUCO Salus/ SCCO SCO SUNY UABSO UCB UHCO UIWRSO UMSL WUCO TotalPCO MBKU
Black or Male 0 0 0 0 0 0 0 0 0 0 0 0 0 0 0 0 0 0 0 0 0 0 0
African Female 0 0 0 0 0 0 1 0 0 0 0 0 0 0 0 0 0 0 0 0 0 0 1
American Total 0 0 0 0 0 0 1 0 0 0 0 0 0 0 0 0 0 0 0 0 0 0 1
Hispanic Male 0 0 0 0 0 0 0 0 0 0 0 0 0 0 0 0 0 0 0 0 0 0 0
or Latino Female 0 0 0 0 0 0 0 0 0 0 0 0 0 0 0 0 0 0 0 0 0 0 0
Total 0 0 0 0 0 0 0 0 0 0 0 0 0 0 0 0 0 0 0 0 0 0 0American
Indian or Male 0 0 0 0 0 0 0 0 0 0 0 0 0 0 0 0 0 0 0 0 0 0 0
Alaska Female 0 0 0 0 0 0 0 0 0 0 0 0 0 0 0 0 0 0 0 0 0 0 0
Native Total 0 0 0 0 0 0 0 0 0 0 0 0 0 0 0 0 0 0 0 0 0 0 0
Asian Male 0 0 0 0 0 0 1 0 0 0 0 0 1 0 0 1 0 0 0 0 0 0 3
Female 0 0 0 0 0 0 2 0 0 0 0 0 0 0 0 0 0 0 0 0 0 0 2
Total 0 0 0 0 0 0 3 0 0 0 0 0 1 0 0 1 0 0 0 0 0 0 5Native
Hawaiian or Male 0 0 0 0 0 0 0 0 0 0 0 0 0 0 0 0 0 0 0 0 0 0 0
Other Paci- Female 0 0 0 0 0 0 0 0 0 0 0 0 0 0 0 0 0 0 0 0 0 0 0
fic Islander Total 0 0 0 0 0 0 0 0 0 0 0 0 0 0 0 0 0 0 0 0 0 0 0
White Male 0 0 0 0 0 0 0 0 0 0 0 0 0 0 2 0 0 0 0 0 0 0 2
Female 0 0 0 0 0 0 0 0 0 0 0 0 4 0 0 0 0 0 0 0 0 0 4
Total 0 0 0 0 0 0 0 0 0 0 0 0 4 0 2 0 0 0 0 0 0 0 6
Two or Male 0 0 0 0 0 0 0 0 0 0 0 0 0 0 0 0 0 0 0 0 0 0 0
More Female 0 0 0 0 0 0 0 0 0 0 0 0 0 0 0 0 0 0 0 0 0 0 0
Races Total 0 0 0 0 0 0 0 0 0 0 0 0 0 0 0 0 0 0 0 0 0 0 0
Unknown** Male 0 0 0 0 0 0 0 0 0 0 0 0 0 0 0 0 0 0 0 0 0 0 0
Female 0 0 0 0 0 0 0 0 0 0 0 0 0 0 0 0 0 0 0 0 0 0 0
Total 0 0 0 0 0 0 0 0 0 0 0 0 0 0 0 0 0 0 0 0 0 0 0Grand
Total 0 0 0 0 0 0 4 0 0 0 0 0 5 0 2 1 0 0 0 0 0 0 12
* KYCO's first class matriculated in fall 2016.** PUCO classifies all international students as "unknown" for race/ethnicity.
(Does not include students enrolled in alternate or special O.D. programs - see table 1.16)

Total Enrollment in Programs Leading to the O.D. Degree, AY 2016-2017(Includes full-time, part-time, alternate and special programs)
Annual Student Data Report 2016-2017 1.16Association of Schools and Colleges of Optometry
www.optometriceducation.org
Special/Alternate Programs for the OD Degree Grand
School ID Full-Time Part-Time Total Total
(see table 1.1) (see table 1.14) (see tables 2.5 and 2.6)
AZCOPT 214 0 214 0 214
IAUPR 231 0 231 0 231
ICO 643 0 643 0 643
IUSO 297 0 297 17 314
KYCO* 65 0 65 0 65
MCO 148 0 148 0 148
MCPHS 259 4 263 0 263
NECO 508 0 508 25 533
NOVA 397 0 397 35 432
NSUOCO 112 0 112 0 112
OSU 258 0 258 0 258
PUCO 360 0 360 0 360
Salus/PCO 600 5 605 37 642
SCCOMBKU 397 0 397 0 397
SCO 529 2 531 0 531
SUNY 381 1 382 0 382
UABSO 182 0 182 0 182
UCB 264 0 264 0 264
UHCO 416 0 416 0 416
UIWRSO 264 0 264 0 264
UMSL 168 0 168 0 168
WUCO 331 0 331 0 331
Total 7024 12 7036 114 7150
*KYCO's first class matriculated in fall 2016.
Regular Programs for the OD Degree

Resident/Non-Resident Status, AY 2016-2017
Annual Student Data Report 2016-2017 1.17Association of Schools and Colleges of Optometry
www.optometriceducation.org
School ID
Does the school differentiate between resident (in-state) and non-resident students for tuition purposes?
If the school differentiates between resident (in-state) and non-resident students for tuition purposes, can a student change his or her status after enrollment? Explanation:
AZCOPT No
IAUPR No
ICO No
IUSO Yes Yes The Office of the Registrar is the gate keeper for change of residency in regard to tuition paying purposes. It is not automatic.
KYCO No
MCO Yes No
MCPHS No
NECO No
NOVA Yes No
NSUOCO Yes No
OSU Yes Yes Students may establish residency per Ohio Board of Regents guidelines usually after one year of attendance.
PUCO No
Salus/PCO No
SCCOMBKU No
SCOYes No
We do not have in-state and out-of-state tuition since we are a private institution. Instead, we have regional and non-regional tuition. Regional tuition is paid by students whose home states provide tuition assistance; the amount varies by state. Students not receiving tuition assistance from their home states pay non-regional tuition.
SUNY Yes Yes After providing proof of living in New York State for one year, they are eligible to apply for in-state residency.
UABSO Yes Yes UCB Yes Yes After the first year of the program, we will assist non-resident students who wish to become in-state residents.
UHCO Yes Yes
UIWRSO No
UMSL Yes No
WUCO No

Permanent Residence of All Students Enrolled in the Regular Professional O.D. Program, AY 2016-2017(includes part-time students)
Annual Student Data Report 2016-2017 1.18Association of Schools and Colleges of Optometry
www.optometriceducation.org
SCHOOL ID AL AK AZ AR CA CO CT DE DC FL GA HI ID IL IN IA KS KY LA ME MD MA MI MN MS MO MT NE NV
AZCOPT 0 0 41 0 31 10 0 0 0 3 0 0 18 4 1 5 1 0 0 1 1 0 4 5 0 1 2 6 2
IAUPR 0 0 6 1 36 0 1 0 0 23 3 1 0 5 4 0 2 0 0 0 2 1 2 1 2 0 2 1 0
ICO 2 1 9 0 51 3 3 0 0 14 3 1 3 172 25 16 5 2 1 1 5 2 39 23 1 8 1 3 1
IUSO 0 0 1 0 3 0 2 0 0 2 2 0 1 17 131 7 3 17 1 1 1 0 18 9 0 6 0 11 0
KYCO* 2 0 0 0 0 2 0 0 0 2 2 0 1 2 3 2 0 22 1 0 3 0 2 0 0 0 0 2 0
MCO 0 0 0 0 0 0 0 0 0 1 0 0 0 0 1 0 0 0 0 0 0 0 142 0 0 0 0 0 0
MCPHS 2 1 3 0 19 3 9 0 0 9 1 0 1 6 3 2 2 1 2 4 3 31 11 1 0 2 0 0 1
NECO 1 0 0 0 35 3 23 3 0 16 0 1 1 11 1 4 1 0 1 11 7 95 6 3 0 0 0 0 0
NOVA 2 0 0 2 15 2 2 3 0 177 5 1 0 2 3 0 0 1 2 0 6 1 6 2 0 0 0 0 0
NSUOCO 0 0 0 7 0 1 0 0 0 0 0 0 0 0 0 1 18 0 1 0 0 0 0 1 0 3 0 5 0
OSU 1 0 0 0 1 0 0 0 1 3 1 0 0 1 3 1 0 0 0 0 0 0 2 3 0 0 0 0 0
PUCO 0 1 7 0 33 12 1 0 0 0 0 11 14 3 2 3 4 0 0 1 0 0 3 18 0 0 7 2 11
Salus/PCO 2 0 2 1 19 3 7 10 0 19 11 0 2 8 1 1 0 2 1 2 22 5 6 2 1 0 1 0 0
SCCOMBKU 0 0 10 1 294 6 0 0 0 3 0 11 4 0 0 1 5 0 0 0 1 1 0 5 0 1 1 0 12
SCO 8 0 1 27 7 1 0 0 0 22 34 0 7 18 4 21 24 23 27 0 5 1 7 10 35 18 0 16 2
SUNY 0 0 1 0 33 1 12 2 0 11 3 0 0 2 2 0 1 0 1 2 11 5 3 3 0 0 0 0 1
UABSO 71 0 0 3 0 0 0 0 0 14 21 0 1 0 0 1 0 15 7 0 1 1 0 0 8 0 0 0 0
UCB 0 0 1 0 238 1 0 0 0 0 0 1 0 0 0 0 0 0 0 0 0 0 2 1 0 0 0 0 0
UHCO 0 0 1 1 3 1 0 0 0 6 2 0 0 3 1 4 3 2 4 0 0 0 0 0 2 1 1 4 0
UIWRSO 2 0 0 4 12 0 0 0 0 5 4 0 4 3 1 3 8 0 9 0 3 1 3 1 2 3 1 3 0
UMSL 2 0 0 1 7 1 0 0 0 0 2 0 2 19 1 11 7 1 1 0 0 0 1 3 1 78 0 0 1
WUCO 2 0 5 2 206 3 1 0 0 6 2 5 2 5 0 0 1 0 0 1 0 0 3 8 0 0 0 0 6
TOTAL 97 3 88 50 1043 53 61 18 1 336 96 32 61 281 187 83 85 86 59 24 71 144 260 99 52 121 16 53 37*KYCO figures reflect the first-year class which matriculated in fall 2016. (continued on following page)
Permanent Residence of All Students Enrolled in the Regular Professional O.D. Program, AY 2016-2017(includes part-time students)
Annual Student Data Report 2016-2017 1.18Association of Schools and Colleges of Optometry
www.optometriceducation.org
(continued from previous page)
School ID NH NJ NM NY NC ND OH OK OR PA RI SC SD TN TX UT VT VA WA WV WI WY PR CANOther Or Unknown
AZCOPT 0 2 2 1 0 10 0 0 3 2 0 0 3 1 6 14 0 3 10 1 6 2 0 12 0
IAUPR 0 8 1 10 3 0 5 0 2 7 0 1 0 6 24 0 0 8 0 2 1 0 36 24 0
ICO 1 2 1 14 6 3 14 1 2 7 3 0 3 5 12 0 0 4 10 2 40 0 0 116 2
IUSO 1 1 2 2 1 1 9 0 0 1 1 2 0 3 2 1 0 3 3 2 13 0 1 14 1
KYCO* 0 0 0 0 3 0 3 1 0 0 0 2 1 2 1 0 0 2 0 3 1 0 0 0 0
MCO 0 0 0 0 0 0 0 0 0 0 0 0 0 0 0 0 0 0 0 0 2 0 0 2 0
MCPHS 5 15 0 31 6 0 9 0 2 11 8 3 3 3 10 0 0 5 3 2 3 0 1 22 4
NECO 17 26 0 51 6 1 7 0 2 11 9 0 0 2 7 0 3 8 2 0 3 0 0 118 12
NOVA 1 9 1 18 6 0 5 1 0 12 0 5 1 1 18 0 0 12 4 0 4 1 1 64 1
NSUOCO 0 0 0 0 0 0 0 69 0 0 0 0 1 1 4 0 0 0 0 0 0 0 0 0 0
OSU 0 1 0 2 1 0 232 0 0 0 0 0 0 0 1 0 0 2 1 1 0 0 0 0 0
PUCO 0 0 1 0 1 11 0 0 62 3 0 0 7 0 3 5 0 0 41 0 4 6 0 83 0
Salus/PCO 3 86 0 74 25 1 12 0 2 170 1 2 1 4 5 1 1 42 2 3 4 0 0 33 5
SCCOMBKU 0 2 0 0 1 1 0 1 5 1 0 0 0 0 2 8 0 0 4 0 2 3 0 11 0
SCO 1 0 1 3 25 2 14 1 1 6 0 11 2 75 20 9 1 8 3 12 9 0 0 7 2
SUNY 1 49 0 186 2 0 3 0 2 8 0 0 0 0 1 1 0 8 1 0 3 0 0 15 8
UABSO 0 1 0 0 11 0 0 2 0 1 0 7 0 9 3 0 0 3 0 0 2 0 0 0 0
UCB 0 0 0 0 0 0 0 0 0 0 0 0 0 0 0 0 0 1 5 0 0 0 0 11 3
UHCO 0 0 2 2 4 1 0 1 2 0 0 0 1 0 355 2 0 2 0 0 0 0 0 3 2
UIWRSO 0 0 3 1 4 0 2 7 1 5 0 2 1 2 143 9 0 4 2 1 1 0 0 4 0
UMSL 0 0 0 0 4 0 3 2 0 2 0 0 2 1 3 1 0 1 0 0 6 0 0 3 1WUCO 0 0 1 3 5 2 2 2 3 1 0 0 0 1 10 3 0 1 11 0 3 1 0 22 2
TOTAL 30 202 15 398 114 33 320 88 89 248 22 35 26 116 630 54 5 117 102 29 107 13 39 564 43
*KYCO figures reflect the first-year class which matriculated in fall 2016.

Permanent Residence of First-Year Students Enrolled in the Regular Professional O.D. Program, AY 2016-2017(includes part-time students)
Annual Student Data Report 2016-2017 1.19Association of Schools and Colleges of Optometry
www.optometriceducation.org
School ID AL AK AZ AR CA CO CT DE DC FL GA HI ID IL IN IA KS KY LA ME MD MA MI MN MS MO MT NE NV
AZCOPT 0 0 12 0 9 3 0 0 0 1 0 0 3 0 0 0 0 0 0 1 0 0 2 0 0 0 1 1 1
IAUPR 0 0 2 0 11 0 0 0 0 6 0 0 0 1 1 0 2 0 0 0 0 0 2 0 1 0 0 0 0
ICO 1 0 4 0 18 0 1 0 0 5 0 0 0 51 5 5 1 1 0 1 1 1 8 4 1 1 1 1 0
IUSO 0 0 0 0 2 0 0 0 0 0 1 0 0 2 36 1 1 2 0 0 1 0 5 4 0 0 0 2 0
KYCO 2 0 0 0 0 2 0 0 0 2 2 0 1 2 3 2 0 22 1 0 3 0 2 0 0 0 0 2 0
MCO 0 0 0 0 0 0 0 0 0 0 0 0 0 0 0 0 0 0 0 0 0 0 37 0 0 0 0 0 0
MCPHS 1 0 0 0 7 2 4 0 0 5 0 0 1 1 0 0 1 0 0 0 1 7 3 0 0 1 0 0 0
NECO 0 0 0 0 13 1 4 0 0 9 0 0 0 6 0 0 0 0 0 4 0 22 4 0 0 0 0 0 0
NOVA 0 0 0 0 3 1 0 2 0 59 2 1 0 0 0 0 0 1 0 0 2 1 1 0 0 0 0 0 0
NSUOCO 0 0 0 3 0 0 0 0 0 0 0 0 0 0 0 0 5 0 0 0 0 0 0 0 0 0 0 1 0
OSU 0 0 0 0 1 0 0 0 1 3 1 0 0 1 3 1 0 0 0 0 0 0 2 3 0 0 0 0 0
PUCO 0 0 3 0 8 0 0 0 0 0 0 3 4 1 0 2 1 0 0 0 0 0 3 3 0 0 1 0 4
Salus/PCO 0 0 1 0 3 0 1 2 0 3 3 0 2 4 1 0 0 0 0 2 7 1 2 0 1 0 0 0 0
SCCOMBKU 0 0 2 0 75 3 0 0 0 0 0 2 3 0 0 1 0 0 0 0 0 1 0 0 0 0 1 0 1
SCO 2 0 0 7 1 0 0 0 0 8 9 0 1 6 1 7 9 6 12 0 1 0 3 0 6 4 0 7 0
SUNY 0 0 1 0 6 1 4 1 0 3 2 0 0 1 2 0 1 0 1 0 4 0 1 1 0 0 0 0 0
UABSO 20 0 0 1 0 0 0 0 0 8 6 0 0 0 0 0 0 2 2 0 0 1 0 0 3 0 0 0 0
UCB 0 0 1 0 57 1 0 0 0 0 0 1 0 0 0 0 0 0 0 0 0 0 2 1 0 0 0 0 0
UHCO 0 0 0 0 3 1 0 0 0 2 0 0 0 2 1 2 0 1 2 0 0 0 0 0 1 0 0 1 0
UIWRSO 0 0 0 1 1 0 0 0 0 2 2 0 0 1 0 0 4 0 3 0 0 0 1 0 2 0 0 2 0
UMSL 1 0 0 0 2 0 0 0 0 0 0 0 0 7 1 4 2 0 0 0 0 0 0 0 1 21 0 0 0
WUCO 2 0 0 1 49 1 1 0 0 1 1 0 0 3 0 0 1 0 0 0 0 0 1 3 0 0 0 0 4
TOTAL 29 0 26 13 269 16 15 5 1 117 29 7 15 89 54 25 28 35 21 8 20 34 79 19 16 27 4 17 10
(continued on following page)

Permanent Residence of First-Year Students Enrolled in the Regular Professional O.D. Program, AY 2016-2017(includes part-time students)
Annual Student Data Report 2016-2017 1.19Association of Schools and Colleges of Optometry
www.optometriceducation.org
(continued from previous page)
School ID NH NJ NM NY NC ND OH OK OR PA RI SC SD TN TX UT VT VA WA WV WI WY PR CANOther or Unknown
AZCOPT 0 2 0 0 0 3 0 0 0 1 0 0 1 1 2 1 0 2 3 1 3 0 0 2 0
IAUPR 0 1 0 4 0 0 0 0 0 4 0 1 0 1 6 0 0 1 0 0 1 0 12 3 0
ICO 1 1 1 6 1 2 5 0 0 2 0 0 1 2 5 0 0 0 4 2 9 0 0 20 1
IUSO 0 0 1 1 1 0 5 0 0 0 1 1 0 2 0 0 0 1 2 1 3 0 1 3 0
KYCO 0 0 0 0 3 0 3 1 0 0 0 2 1 2 1 0 0 2 0 3 1 0 0 0 0
MCO 0 0 0 0 0 0 0 0 0 0 0 0 0 0 0 0 0 0 0 0 1 0 0 0 0
MCPHS 1 5 0 9 0 0 2 0 1 6 5 1 0 1 3 0 0 1 0 1 0 0 0 3 2
NECO 3 7 0 16 1 0 4 0 0 2 2 0 0 0 3 0 1 2 2 0 1 0 0 36 5
NOVA 1 2 0 4 0 0 1 1 0 3 0 2 0 1 2 0 0 2 0 0 1 0 0 12 1
NSUOCO 0 0 0 0 0 0 0 18 0 0 0 0 0 0 1 0 0 0 0 0 0 0 0 0 0
OSU 0 1 0 2 1 0 42 0 0 0 0 0 0 0 1 0 0 1 1 1 0 0 0 0 0
PUCO 0 0 0 0 0 2 0 0 18 2 0 0 2 0 1 2 0 0 13 0 1 0 0 22 0
Salus/PCO 1 29 0 20 7 0 4 0 0 36 0 0 0 1 3 0 0 6 0 1 1 0 0 15 1
SCCOMBKU 0 1 0 0 1 0 0 0 0 0 0 0 0 0 1 2 0 0 1 0 1 2 0 2 0
SCO 1 0 0 0 5 0 2 0 1 2 0 1 0 19 6 3 0 1 2 2 0 0 0 1 0
SUNY 1 17 0 46 0 0 1 0 0 1 0 0 0 0 0 0 0 2 0 0 1 0 0 2 0
UABSO 0 0 0 0 2 0 0 0 0 0 0 2 0 2 0 0 0 0 0 0 1 0 0 0 0
UCB 0 0 0 0 0 0 0 0 0 0 0 0 0 0 0 0 0 1 5 0 0 0 0 3 1
UHCO 0 0 1 1 3 0 0 1 1 0 0 0 0 0 79 1 0 2 0 0 0 0 0 1 0
UIWRSO 0 0 0 1 0 0 1 3 0 2 0 0 0 0 39 1 0 2 1 0 0 0 0 0 0
UMSL 0 0 0 0 1 0 2 0 0 0 0 0 0 0 1 0 0 0 0 0 1 0 0 0 1
WUCO 0 0 1 1 1 0 0 0 0 1 0 0 0 1 3 2 0 1 2 0 1 0 0 7 0
TOTAL 9 66 4 111 27 7 72 24 21 62 8 10 5 33 157 12 1 27 36 12 27 2 13 132 12

Permanent Residence of Students from Other Countries Enrolled in the Regular Professional O.D. Program, AY 2016-2017(see "Other" columns in reports 1.18 and 1.19)
Annual Student Data Report 2016-2017 1.20Association of Schools and Colleges of Optometry
www.optometriceducation.org
School ID Country # 1st Year # All Students By Country # 1st Year # All StudentsAZCOPT 0 0 Bahamas, The 0 1IAUPR 0 0 Bolivia 1 1ICO China 1 1 Brazil 0 1
Indonesia 0 1 Chile 0 1IUSO South Korea 0 1 China 3 14KYCO 0 0 Ecuador 1 1MCO 0 0 France 1 1MCPHS Bolivia 1 1 India 0 1
China 0 1 Indonesia 0 1Ecuador 1 1 Iran 0 1South Korea 0 1 Jamaica 1 1
NECO Brazil 0 1 Nepal 0 1China 1 5 Nigeria 0 1India 0 1 Singapore 0 1Jamaica 1 1 South Africa 1 1Nepal 0 1 South Korea 1 7South Africa 1 1 Taiwan 0 2Unknown 2 2 Turkmenistan 1 1
NOVA France 1 1 United Kingdom 0 1NSUOCO 0 0 Vietnam 0 2OSU 0 0 Unknown 2 2PUCO 0 0 Total 12 43Salus/PCO Chile 0 1
Singapore 0 1South Korea 1 3
SCCOMBKU 0 0SCO Bahamas, The 0 1
Vietnam 0 1SUNY China 0 4
South Korea 0 1Taiwan 0 2United Kingdom 0 1
UABSO 0 0UCB China 1 2
Iran 0 1UHCO China 0 1
Vietnam 0 1UIWRSO 0 0UMSL Turkmenistan 1 1WUCO Nigeria 0 1
South Korea 0 1Total 12 43

Previous Education of First-Time, First-Year, Full-Time Students in the Regular Professional O.D. Program, AY 2016-2017*
Annual Student Data Report 2016-2017 1.21 Association of Schools and Colleges of Optometry
www.optometriceducation.org
60-89 sem hrs 90-119 sem hrs 120+ sem hrs Doctorate Degree TOTAL
School ID 90-134 qtr hrs 135-179 qtr hrs 180+ qtr hrs # % of total # % of total # % of total
AZCOPT 0 0 0 54 100.0% 0 0.0% 0 0.0% 54
IAUPR 0 1 1 57 95.0% 1 1.7% 0 0.0% 60
ICO 0 4 1 154 92.8% 7 4.2% 0 0.0% 166
IUSO 0 5 0 68 91.9% 1 1.4% 0 0.0% 74
KYCO 0 4 3 56 86.2% 2 3.1% 0 0.0% 65
MCO 0 8 0 30 78.9% 0 0.0% 0 0.0% 38
MCPHS 0 7 0 64 90.1% 0 0.0% 0 0.0% 71
NECO 0 4 2 134 92.4% 3 2.1% 2 1.4% 145
NOVA 0 7 0 95 91.3% 2 1.9% 0 0.0% 104
NSUOCO 0 1 0 26 92.9% 1 3.6% 0 0.0% 28
OSU 0 6 0 59 90.8% 0 0.0% 0 0.0% 65
PUCO 0 6 0 86 92.5% 1 1.1% 0 0.0% 93
Salus/PCO 0 9 0 136 90.1% 6 4.0% 0 0.0% 151
SCCOMBKU 0 0 0 97 97.0% 3 3.0% 0 0.0% 100
SCO 1 0 0 133 97.8% 2 1.5% 0 0.0% 136
SUNY 2 11 1 84 84.8% 1 1.0% 0 0.0% 99
UABSO 0 1 0 49 98.0% 0 0.0% 0 0.0% 50
UCB 0 0 0 71 100.0% 0 0.0% 0 0.0% 71
UHCO 0 0 0 103 100.0% 0 0.0% 0 0.0% 103
UIWRSO 0 1 2 61 91.0% 3 4.5% 0 0.0% 67
UMSL 0 2 0 43 95.6% 0 0.0% 0 0.0% 45
WUCO 0 0 4 83 94.3% 1 1.1% 0 0.0% 88
Total 3 77 14 1743 93.1% 34 1.8% 2 0.1% 1873
*Does not include repeat students.
[-------------------------no degree-------------------------]
Bachelor's Degree Master's Degree
[----------------no higher than----------------]

Applications for Transfer, Professional O.D. Programs, AY 2016-2017
Annual Student Data Report 2016-2017 1.22Association of Schools and Colleges of Optometry
www.optometriceducation.org
School ID
Do you accept applications for transfer from
students who have been dismissed from
other programs? Excludes graduates of foreign schools.
If yes, do you only consider them to start
in your first year program or do you do individual placement?
Explanation
AZCOPT Yes
AZCOPT may elect to accept transfer students from other U.S. accredited schools of optometry who are currently enrolled, are in good academic standing, and provide acceptable reason(s) for seeking transfer. Typically, students will transfer at the beginning of the second year of the curriculum. Students requesting transfers must meet the College's general requirements for admission. They must also submit the following: -A letter to the Director of Admissions outlining the reasons for requesting transfer and explaining any difficulties encountered at the previous institutions -Course syllabi for all optometry coursework for which advanced standing credit is requested -Official scores from the Optometric Admissions Test (OAT) -Official transcripts from all schools attended - undergraduate, graduate, and professional -A letter from the dean of the college in which the student is enrolled that describes -current academic status and terms of withdrawal or dismissal -Additional documents or letters of recommendation as determined necessary by the Dir of Admissions or Dean Following receipt of these materials, a decision by the Dean is made regarding whether or not the student merits an on-campus interview. If the student receives an invitation, he/she interviews with an appropriate interview team. The interview team then makes an admissions recommendation to the Dean, who is responsible for approving both the student's admissions status and class standing. The transfer application must be received sufficiently early to allow for processing of the application, interview, and relocation of the student prior to the start of the next academic term.
No
IAUPR Yes Students applying for transfer from another institution must be in good standing and will be required a minimum of two years of full time enrollment at our school.
No
(continued on next page)
Do you accept applications for transfer from students currently in good standing in another optometric institution? (A transfer student is a student who has enrolled after first attending another institution of optometry and leaving in good academic standing.) Excludes graduates of foreign schools.

Applications for Transfer, Professional O.D. Programs, AY 2016-2017
Annual Student Data Report 2016-2017 1.22Association of Schools and Colleges of Optometry
www.optometriceducation.org
School ID
Do you accept applications for transfer from
students who have been dismissed from
other programs? Excludes graduates of foreign schools.
If yes, do you only consider them to start
in your first year program or do you do individual placement?
ExplanationDo you accept applications for transfer from students currently in good standing in another optometric institution? (A transfer student is a student who has enrolled after first attending another institution of optometry and leaving in good academic standing.) Excludes graduates of foreign schools.
(continued from previous page)
ICO Yes
Transfer requests are considered on a case by case basis. The student must provide a letter from the Dean or similar administrator of their current program indicating that they are aware of the student's intention to transfer.
Yes Individual Placement
A thorough review of the student's prior academic record will take place only after the student has accepted to the program and has secured their position. This review may result in advanced placement.
IUSO Yes We will review applications possibly waive some courses, but they will complete 4 years at the IUSO.
No
KYCO No No
MCO Yes Transfer student admission is on a case by case basis and the availability of a seat at MCO.
Yes Individual Placement Transfer student admission is on a case by case basis and the availability of a seat at MCO.
MCPHS Yes
Beginning with applications for fall 2017 matriculation, MCPHS University School of Optometry accepts applications from transfer students currently in good academic and disciplinary standing at another optometric institution. Students must state a compelling reason for the transfer and present a letter from the Dean of their current program confirming good standing and acknowledging the transfer request. Placement within the program is contingent upon satisfactory completion of courses equivalent to those at MCPHS School of Optometry. MCPHS University School of Optometry does not accept applications for transfer from students who have been dismissed from another program.
No
NECO Yes
When openings in classes permit, the College will review applications for transfer from students who are currently enrolled in other accredited schools or colleges of optometry. Acceptance is contingent upon satisfactory completion of courses equivalent to those at NECO. Students requesting transfer must provide a personal statement with supporting documentation demonstrating a compelling need to transfer in order to complete their optometric education. The dean at the applicant's optometry school is required to provide official acknowledgment of the student's request for transfer and certification of good academic standing.
Yes Individual Placement
(continued on next page)

Applications for Transfer, Professional O.D. Programs, AY 2016-2017
Annual Student Data Report 2016-2017 1.22Association of Schools and Colleges of Optometry
www.optometriceducation.org
School ID
Do you accept applications for transfer from
students who have been dismissed from
other programs? Excludes graduates of foreign schools.
If yes, do you only consider them to start
in your first year program or do you do individual placement?
ExplanationDo you accept applications for transfer from students currently in good standing in another optometric institution? (A transfer student is a student who has enrolled after first attending another institution of optometry and leaving in good academic standing.) Excludes graduates of foreign schools.
(continued from previous page)
NOVA Yes Nova evaluates each potential transfer student individually to determine what level the student will be placed in the professional program.
Yes Individual Placement
NSUOCO No No
OSU No No
PUCO Yes All applicants must apply through the standard application process listed on our website. Yes Only First Year
Salus/PCO* Yes Adhere to ASCO guidelines. Credentials are evaluated to determine placement in the program. No
SCCOMBKU Yes Must be in good academic and disciplinary standing and have a compelling reason. No
SCO Yes
Each transfer student follows the same application procedures as a "regular" applicant. His/her application is reviewed by the Office of Academic Affairs to determine if any coursework will be accepted for transfer.
No
SUNY Yes SUNY Optometry evaluates the credentials of potential transfer students to determine if, and at what level the student will be placed in the professional OD program.
No
UABSO Yes On an individual basis. Yes Only First Year Although highly unlikely to be accepted, applications will be considered on an individual basis.
UCB Yes They must apply to us through OptomCAS. No
UHCO Yes The applicant must have completed at least one full year of optometry school prior to his/her application for transfer.
No
UIWRSO No No UMSL Yes Based on individual situations. No
WUCO Yes
To be eligible for admission with advanced standing as a transfer student, applicants must be currently enrolled in an accredited United States (US) or Canadian Optometry school, and in good academic and professional standing.
No

Admission and Enrollment of Graduates of Foreign Schools to Advanced Standing in the Professional O.D. Program, AY 2016-2017
Annual Student Data Report 2016-2017 1.23Association of Schools and Colleges of Optometry
www.optometriceducation.org
School ID Type of School Country Credit Awarded
Salus/PCO
Medical China
Medical Nigeria
The following schools have a policy that admits graduates of foreign schools to advanced standing. For graduates of foreign schools enrolled during 2016-2017:
SUNY

Graduates and Special Programs, Professional O.D. Program

Graduates Receiving the O.D. Degree through Regular and Special O.D. Programs Comparison of 2015 and 2016
Annual Student Data Report 2016-2017 2.1Association of Schools and Colleges of Optometry
www.optometriceducation.org
2015 2015 2016 2016 % Change % Change
School ID Regular Total (Regular Regular Total (Regular Regular Total (Regular
Plus Special) Plus Special) Plus Special)
AZCOPT 44 44 49 49 11.4% 11.4%
IAUPR 41 41 36 36 -12.2% -12.2%
ICO 154 154 149 149 -3.2% -3.2%
IUSO 71 71 73 73 2.8% 2.8%
MCO 38 38 34 34 -10.5% -10.5%
MCPHS* --- --- 59 59 --- ---
NECO 110 123 106 123 -3.6% 0.0%
NOVA 87 98 97 106 11.5% 8.2%
NSUOCO 28 28 28 28 0.0% 0.0%
OSU 64 64 56 56 -12.5% -12.5%
PUCO 86 86 88 88 2.3% 2.3%
Salus/PCO 141 141 157 159 11.3% 12.8%
SCCOMBKU 96 96 96 96 0.0% 0.0%
SCO 130 130 128 128 -1.5% -1.5%
SUNY 74 74 78 78 5.4% 5.4%
UABSO 40 40 48 48 20.0% 20.0%
UCB 60 61 61 61 1.7% 0.0%
UHCO 94 94 101 101 7.4% 7.4%
UIWRSO 60 60 64 64 6.7% 6.7%
UMSL 41 41 46 46 12.2% 12.2%
WUCO 73 73 84 84 15.1% 15.1%
Total 1532 1557 1638 1666 6.9% 7.0%
KYCO is not included because its first class matriculated in fall 2016.*MCPHS first graduating class in 2016.

Classification of Graduates of Professional O.D. Program by Gender, AY 2015-2016Regular and Special Programs
Annual Student Data Report 2016-2017 2.2Association of Schools and Colleges of Optometry
www.optometriceducation.org
Total
School ID # % # %
AZCOPT 30 61.2% 19 38.8% 49
IAUPR 14 38.9% 22 61.1% 36
ICO 39 26.2% 110 73.8% 149
IUSO 32 43.8% 41 56.2% 73
MCO 12 35.3% 22 64.7% 34
MCPHS 21 35.6% 38 64.4% 59
NECO 36 29.3% 87 70.7% 123
NOVA 36 34.0% 70 66.0% 106
NSUOCO 10 35.7% 18 64.3% 28
OSU 23 41.1% 33 58.9% 56
PUCO 35 39.8% 53 60.2% 88
Salus/PCO 55 34.6% 104 65.4% 159
SCCOMBKU 24 25.0% 72 75.0% 96
SCO 55 43.0% 73 57.0% 128
SUNY 22 28.2% 56 71.8% 78
UABSO 13 27.1% 35 72.9% 48
UCB 12 19.7% 49 80.3% 61
UHCO 31 30.7% 70 69.3% 101
UIWRSO 26 40.6% 38 59.4% 64
UMSL 19 41.3% 27 58.7% 46
WUCO 29 34.5% 55 65.5% 84
Total 574 34.5% 1092 65.5% 1666
KYCO is not included because its first class matriculated in fall 2016.
Male Female

Classification and Percentages of Graduates of the Professional O.D. Program by Race/Ethnicity, AY 2015-2016Regular and Special Programs
Annual Student Data Report 2016-2017 2.3Association of Schools and Colleges of Optometry
www.optometriceducation.org
# % # % # % # % # % # % # % # % # % # % # %
Black or Male 0 0.0% 4 11.1% 0 0.0% 0 0.0% 0 0.0% 0 0.0% 0 0.0% 2 1.9% 0 0.0% 0 0.0% 0 0.0%
African Female 0 0.0% 1 2.8% 2 1.3% 1 1.4% 0 0.0% 2 3.4% 0 0.0% 5 4.7% 0 0.0% 0 0.0% 1 1.1%
American Total 0 0.0% 5 13.9% 2 1.3% 1 1.4% 0 0.0% 2 3.4% 0 0.0% 7 6.6% 0 0.0% 0 0.0% 1 1.1%
Hispanic Male 2 4.1% 3 8.3% 3 2.0% 2 2.7% 2 5.9% 0 0.0% 2 1.6% 5 4.7% 1 3.6% 1 1.8% 2 2.3%
or Latino Female 1 2.0% 2 5.6% 2 1.3% 1 1.4% 1 2.9% 3 5.1% 4 3.3% 9 8.5% 1 3.6% 0 0.0% 2 2.3%
Total 3 6.1% 5 13.9% 5 3.4% 3 4.1% 3 8.8% 3 5.1% 6 4.9% 14 13.2% 2 7.1% 1 1.8% 4 4.5%American
Indian or Male 0 0.0% 0 0.0% 0 0.0% 0 0.0% 0 0.0% 0 0.0% 0 0.0% 0 0.0% 0 0.0% 0 0.0% 1 1.1%
Alaska Female 0 0.0% 0 0.0% 0 0.0% 0 0.0% 0 0.0% 0 0.0% 0 0.0% 2 1.9% 3 10.7% 0 0.0% 1 1.1%
Native Total 0 0.0% 0 0.0% 0 0.0% 0 0.0% 0 0.0% 0 0.0% 0 0.0% 2 1.9% 3 10.7% 0 0.0% 2 2.3%
Asian Male 0 0.0% 4 11.1% 10 6.7% 0 0.0% 1 2.9% 4 6.8% 6 4.9% 8 7.5% 1 3.6% 1 1.8% 3 3.4%
Female 8 16.3% 11 30.6% 46 30.9% 4 5.5% 2 5.9% 8 13.6% 20 16.3% 18 17.0% 2 7.1% 4 7.1% 13 14.8%
Total 8 16.3% 15 41.7% 56 37.6% 4 5.5% 3 8.8% 12 20.3% 26 21.1% 26 24.5% 3 10.7% 5 8.9% 16 18.2%Native
Hawaiian or Male 0 0.0% 0 0.0% 0 0.0% 0 0.0% 0 0.0% 0 0.0% 0 0.0% 1 0.9% 0 0.0% 0 0.0% 0 0.0%
Other Pacific Female 0 0.0% 0 0.0% 0 0.0% 0 0.0% 0 0.0% 0 0.0% 0 0.0% 0 0.0% 0 0.0% 0 0.0% 0 0.0%
Islander Total 0 0.0% 0 0.0% 0 0.0% 0 0.0% 0 0.0% 0 0.0% 0 0.0% 1 0.9% 0 0.0% 0 0.0% 0 0.0%
Male 28 57.1% 2 5.6% 24 16.1% 30 41.1% 9 26.5% 14 23.7% 16 13.0% 19 17.9% 8 28.6% 20 35.7% 20 22.7%
White Female 9 18.4% 8 22.2% 59 39.6% 35 47.9% 19 55.9% 21 35.6% 39 31.7% 34 32.1% 12 42.9% 27 48.2% 24 27.3%
Total 37 75.5% 10 27.8% 83 55.7% 65 89.0% 28 82.4% 35 59.3% 55 44.7% 53 50.0% 20 71.4% 47 83.9% 44 50.0%
Two or Male 0 0.0% 1 2.8% 2 1.3% 0 0.0% 0 0.0% 0 0.0% 1 0.8% 0 0.0% 0 0.0% 0 0.0% 0 0.0%
More Female 1 2.0% 0 0.0% 1 0.7% 0 0.0% 0 0.0% 0 0.0% 1 0.8% 0 0.0% 0 0.0% 0 0.0% 0 0.0%
Races Total 1 2.0% 1 2.8% 3 2.0% 0 0.0% 0 0.0% 0 0.0% 2 1.6% 0 0.0% 0 0.0% 0 0.0% 0 0.0%
Male 0 0.0% 0 0.0% 0 0.0% 0 0.0% 0 0.0% 3 5.1% 11 8.9% 1 0.9% 0 0.0% 1 1.8% 9 10.2%
Unknown Female 0 0.0% 0 0.0% 0 0.0% 0 0.0% 0 0.0% 4 6.8% 23 18.7% 2 1.9% 0 0.0% 2 3.6% 12 13.6%
Total 0 0.0% 0 0.0% 0 0.0% 0 0.0% 0 0.0% 7 11.9% 34 27.6% 3 2.8% 0 0.0% 3 5.4% 21 23.9%
Grand
Total 49 36 149 73 34 59 123 106 28 56 88
KYCO is not included because its first class matriculated in fall 2016.(continued on next page)
MCPHSAZCOPT IAUPR ICO IUSO MCO NECO NOVA NSUOCO OSU PUCO

Classification and Percentages of Graduates of the Professional O.D. Program by Race/Ethnicity, AY 2015-2016Regular and Special Programs
Annual Student Data Report 2016-2017 2.3Association of Schools and Colleges of Optometry
www.optometriceducation.org
(continued from previous page)
# % # % # % # % # % # % # % # % # % # % # %
Black or Male 4 2.5% 0 0.0% 1 0.8% 0 0.0% 1 2.1% 0 0.0% 0 0.0% 2 3.1% 0 0.0% 0 0.0% 14 0.8%
African Female 5 3.1% 0 0.0% 5 3.9% 2 2.6% 2 4.2% 2 3.3% 4 4.0% 0 0.0% 0 0.0% 3 3.6% 35 2.1%
American Total 9 5.7% 0 0.0% 6 4.7% 2 2.6% 3 6.3% 2 3.3% 4 4.0% 2 3.1% 0 0.0% 3 3.6% 49 2.9%
Hispanic Male 2 1.3% 1 1.0% 0 0.0% 0 0.0% 0 0.0% 1 1.6% 6 5.9% 1 1.6% 0 0.0% 5 6.0% 39 2.3%
or Latino Female 3 1.9% 6 6.3% 0 0.0% 1 1.3% 0 0.0% 3 4.9% 14 13.9% 5 7.8% 1 2.2% 6 7.1% 65 3.9%
Total 5 3.1% 7 7.3% 0 0.0% 1 1.3% 0 0.0% 4 6.6% 20 19.8% 6 9.4% 1 2.2% 11 13.1% 104 6.2%American
Indian or Male 0 0.0% 1 1.0% 0 0.0% 0 0.0% 0 0.0% 0 0.0% 0 0.0% 0 0.0% 0 0.0% 0 0.0% 2 0.1%
Alaska Female 0 0.0% 0 0.0% 0 0.0% 0 0.0% 1 2.1% 0 0.0% 0 0.0% 0 0.0% 0 0.0% 1 1.2% 8 0.5%
Native Total 0 0.0% 1 1.0% 0 0.0% 0 0.0% 1 2.1% 0 0.0% 0 0.0% 0 0.0% 0 0.0% 1 1.2% 10 0.6%
Male 12 7.5% 8 8.3% 2 1.6% 12 15.4% 2 4.2% 11 18.0% 8 7.9% 10 15.6% 2 4.3% 13 15.5% 118 7.1%
Asian Female 30 18.9% 36 37.5% 9 7.0% 19 24.4% 6 12.5% 38 62.3% 18 17.8% 18 28.1% 2 4.3% 27 32.1% 339 20.3%
Total 42 26.4% 44 45.8% 11 8.6% 31 39.7% 8 16.7% 49 80.3% 26 25.7% 28 43.8% 4 8.7% 40 47.6% 457 27.4%Native
Hawaiian or Male 0 0.0% 0 0.0% 0 0.0% 0 0.0% 1 2.1% 0 0.0% 0 0.0% 0 0.0% 0 0.0% 0 0.0% 2 0.1%
Other Pacific Female 0 0.0% 3 3.1% 0 0.0% 0 0.0% 0 0.0% 0 0.0% 0 0.0% 0 0.0% 0 0.0% 0 0.0% 3 0.2%
Islander Total 0 0.0% 3 3.1% 0 0.0% 0 0.0% 1 2.1% 0 0.0% 0 0.0% 0 0.0% 0 0.0% 0 0.0% 5 0.3%
Male 37 23.3% 14 14.6% 48 37.5% 8 10.3% 8 16.7% 0 0.0% 17 16.8% 13 20.3% 16 34.8% 8 9.5% 359 21.5%
White Female 66 41.5% 23 24.0% 56 43.8% 32 41.0% 26 54.2% 6 9.8% 34 33.7% 14 21.9% 22 47.8% 12 14.3% 578 34.7%
Total 103 64.8% 37 38.5% 104 81.3% 40 51.3% 34 70.8% 6 9.8% 51 50.5% 27 42.2% 38 82.6% 20 23.8% 937 56.2%
Two or Male 0 0.0% 0 0.0% 4 3.1% 0 0.0% 0 0.0% 0 0.0% 0 0.0% 0 0.0% 0 0.0% 3 3.6% 11 0.7%
More Female 0 0.0% 4 4.2% 3 2.3% 1 1.3% 0 0.0% 0 0.0% 0 0.0% 0 0.0% 0 0.0% 6 7.1% 17 1.0%
Races Total 0 0.0% 4 4.2% 7 5.5% 1 1.3% 0 0.0% 0 0.0% 0 0.0% 0 0.0% 0 0.0% 9 10.7% 28 1.7%
Male 0 0.0% 0 0.0% 0 0.0% 2 6.0% 1 2.1% 0 0.0% 0 0.0% 0 0.0% 1 2.2% 0 0.0% 29 1.7%
Unknown Female 0 0.0% 0 0.0% 0 0.0% 1 1.3% 0 0.0% 0 0.0% 0 0.0% 1 1.6% 2 4.3% 0 0.0% 47 2.8%
Total 0 0.0% 0 0.0% 0 0.0% 3 3.8% 1 2.1% 0 0.0% 0 0.0% 1 1.6% 3 6.5% 0 0.0% 76 4.6%
Grand
Total 159 96 128 78 48 61 101 64 46 84 1666
KYCO is not included because its first class matriculated in fall 2016.
SUNY WUCOUIWRSOUHCOUCBUABSO TOTALUMSLSCCOMBKUSalus/PCO SCO

O.D. Degrees Awarded to Graduates of Foreign Schools Upon Completion of a Special Program, AY 2015-2016
Annual Student Data Report 2016-2017 2.4Association of Schools and Colleges of Optometry
www.optometriceducation.org
Degree Awarded Credit AwardedSchool ID Type of Foreign School Country at Foreign School By Optometry SchoolAZCOPT No IAUPR No ICO No IUSO No KYCO No MCO No MCPHS No NECO Yes University United Kingdom B.S. 58
University United Kingdom B.S. 58University United Kingdom B.S. 58Institute India B.S. 58Institute India B.S. 58
University United Kingdom B.S. 58University United Kingdom B.S. 58
College Israel M.S. 58NOVA Yes Medical China M.D. 45NSUOCO No OSU No PUCO No Salus/PCO Yes University China B.S. 67
University China M.S. 72SCCOMBKU No SCO No SUNY No UABSO No UCB No UHCO No UIWRSO No UMSL No WUCO No
Yes = 3Total No = 19
Does the school award an O.D. degree
to graduates of foreign schools uponcompletion of a special program?

Alternate and Special Programs for the O.D. Degree, AY 2016-2017
Annual Student Data Report 2016-2017 2.5Association of Schools and Colleges of Optometry
www.optometriceducation.org
School ID Descriptions of all special or alternative programs leading to the OD degree:
IUSOFor the first time in the fall of 2016 the IUSO admitted a co-hort of 17 students that will complete the OD degree through an extended curriculum of five years.
NECO
Complete descriptions of all programs can be found at the College's website: www.neco.edu
AODP-Accelerated Optometry Degree Program is a twenty-seven month program for scientists and physicians who hold a doctoral degree (PhD or MD).
MS/OD China-A joint degree program providing those completing the program with two degrees: the master of science degree from Wenzhou Medical University and then the doctor of optometry degree from New England College of Optometry.
ASIP-Advanced Standing International Program is a two year program for graduates of foreign optometry programs. Previous optometric education is taken into account and the core curriculum may be appropriately modified to insure that the competencies of the doctor of optometry requirements have been met.
NOVA
The College of Optometry has an extended program leading to the doctor of optometry degree. This five year extended program is designed for individuals who are returning to school after an absence, are changing professional fields, or who require a lighter course load because of family or other obligations. Students in the extended program take courses with the traditional students but with a reduced course load.
Special Programs for graduates of foreign schools-Foreign Optometrists/Medical Doctor’s may make formal application, complete the prerequisites, complete TOEFL and OAT exams and submit three letters of evaluation. If accepted and matriculated into the full four year Doctor of Optometry Program, candidates may then request advanced standing and are considered on a case-by-case basis. Generally, advanced standing students take anywhere from 3 - 4 years to complete the OD degree.
Advanced Placement Doctor of Optometry Program-The Advanced Placement-Doctor of Optometry degree (APOD) program offers an additional pathway to the OD degree specifically for interested and qualified international practitioners. Eligible applicants will be given a customized course of study that is designed based upon the applicant’s previous educational and clinical experience as well as their career goals. Candidates must hold an International degree in a relevant health care field, beyond that of a 3 or 4 year BSc degree. Eligible applicants include: MSc, MD, PhD, etc.
Alternate/Special Program-Accelerated Scholars Program – The Scholars Program is an opportunity for highly motivated and well-qualified applicants to earn a Doctor of Optometry degree designed specifically with them in mind. This program provides students the opportunity to complete all of the same traditional program and optometry degree requirements in an accredited 36-month, year-round, campus-based program.
Descriptions and requirements for each program can be found on the website: www.salus.edu
Salus/PCO

Total Enrollment in Special Programs, AY 2016-2017
Annual Student Data Report 2016-2017 2.6Association of Schools and Colleges of Optometry
www.optometriceducation.org
Total Enrollment in All Special Programs
School ID
AZCOPT 0IAUPR 0ICO 0IUSO 17KYCO 0MCO 0MCPHS 0NECO 25NOVA 35NSUOCO 0OSU 0PUCO 0Salus/PCO 37SCCOMBKU 0SCO 0SUNY 0UABSO 0UCB 0UHCO 0RSO 0UMSL 0WUCO 0Total 114
(Students reported in this table are enrolled in programs described in table 2.5. They are not counted in the OD Enrollment section of the Student Data Report, except in table 1.16.)

Reasons for Students Leaving the Professional O.D. Program, by School and by Year, AY 2015-2016
Annual Student Data Report 2016-2017 2.7Association of Schools and Colleges of Optometry
www.optometriceducation.org
GRAND TOTAL
School ID 1st 2nd 3rd 4th 1st 2nd 3rd 4th 1st 2nd 3rd 4th 1st 2nd 3rd 4th 1st 2nd 3rd 4th 1st 2nd 3rd 4th 1st 2nd 3rd 4th
AZCOPT 1 0 0 0 0 0 0 0 0 0 0 0 0 0 0 0 0 0 0 0 0 0 0 0 1 0 0 0 1 0.5%
IAUPR 7 2 0 0 0 0 0 0 0 0 0 0 0 0 0 0 0 0 0 0 0 0 0 0 7 2 0 0 9 3.9%
ICO 18 4 4 0 0 0 0 0 0 0 0 0 5 1 2 0 0 0 1 1 0 0 0 0 23 5 7 1 36 5.6%
IUSO 7 1 0 0 0 0 0 0 2 0 0 0 0 0 0 0 1 0 0 0 0 0 0 0 10 1 0 0 11 3.7%
MCO 2 0 0 0 0 0 0 0 0 2 0 0 0 1 0 0 0 0 0 0 0 0 0 0 2 3 0 0 5 3.4%
MCPHS 2 2 0 0 1 1 0 0 0 0 0 0 2 1 0 0 0 0 0 0 3 2 0 0 8 6 0 0 14 5.4%
NECO 4 5 0 0 0 0 0 0 0 0 0 0 2 2 0 0 0 0 0 0 0 0 0 0 6 7 0 0 13 2.7%
NOVA 5 2 0 0 1 0 0 0 0 0 0 0 1 1 0 0 0 0 0 0 0 0 0 0 7 3 0 0 10 2.5%
NSUOCO 0 0 0 0 0 0 0 0 0 0 0 0 0 0 0 0 0 0 0 0 0 0 0 0 0 0 0 0 0 0.0%
OSU 1 1 0 0 0 0 0 0 0 0 0 0 0 1 0 0 0 0 0 0 0 0 0 0 1 2 0 0 3 1.2%
PUCO 1 1 0 0 0 0 0 0 0 0 0 0 0 0 0 0 1 0 0 0 0 0 0 0 2 1 0 0 3 0.8%
Salus/PCO 0 3 0 0 0 0 0 0 0 0 0 0 2 0 0 0 0 0 1 0 0 0 0 0 2 3 1 0 6 1.0%
SCCOMBKU 4 2 7 0 0 0 0 0 0 0 0 0 0 1 0 0 0 0 0 0 0 0 0 0 4 3 7 0 14 3.5%
SCO 2 1 0 0 0 0 0 0 0 0 0 0 1 1 0 0 0 0 0 0 0 0 0 0 3 2 0 0 5 0.9%
SUNY 2 1 0 0 0 0 0 0 0 0 0 0 0 0 0 0 0 0 0 0 0 0 0 0 2 1 0 0 3 0.8%
UABSO 1 0 0 0 0 0 0 0 0 0 0 0 1 1 0 0 0 0 0 0 0 0 0 0 2 1 0 0 3 1.7%
UCB 0 1 0 0 0 0 0 0 0 0 0 0 1 0 0 0 0 0 0 0 0 0 0 0 1 1 0 0 2 0.8%
UHCO 0 1 0 0 0 0 0 0 0 0 0 0 1 0 0 0 0 0 0 0 0 0 0 0 1 1 0 0 2 0.5%
UIWRSO 0 0 0 0 0 0 0 0 0 0 0 0 1 0 0 0 0 0 0 0 0 0 0 0 1 0 0 0 1 0.4%
UMSL 0 0 0 0 0 0 0 0 0 0 0 0 1 0 2 0 0 0 0 0 0 0 0 0 1 0 2 0 3 1.7%
WUCO 0 2 1 2 0 0 0 0 0 0 0 0 0 0 0 0 0 0 0 0 0 0 0 0 0 2 1 2 5 1.5%
Total 57 29 12 2 2 1 0 0 2 2 0 0 18 10 4 0 2 0 2 1 3 2 0 0 84 44 18 3 149 2.2%
% Dismissed/
Withdrew 3.1% 1.7% 0.7% 0.1% 0.1% 0.1% 0.0% 0.0% 0.1% 0.1% 0.0% 0.0% 1.0% 0.6% 0.2% 0.0% 0.1% 0.0% 0.1% 0.1% 0.2% 0.1% 0.0% 0.0% 4.6% 2.6% 1.1% 0.2%
KYCO is not included because its first class matriculated in fall 2016.
Disciplinary Other TOTALAcademic Financial Illness Personal

National Board Exam
Annual Student Data Report 2016-2017 2.8Association of Schools and Colleges of Optometry
www.optometriceducation.org
School ID For Year: Part I Part II Part III
AZCOPT Yes 2016 92.5% NR NR
IAUPR Yes 2016 33.3% 46.2% 47.6%
ICO No 2015-16 77.0% 90.0% 89.0%
IUSO No 2016 85.3% 97.2% 82.9%
KYCO Yes --- --- --- ---
MCO Yes 2015 76.3% 100.0% 62.2%
MCPHS No 2016 57.0% 89.0% 63.0%
NECO No 2015 82.6% 88.3% 89.5%
NOVA Yes 2015 81.1% 86.1% 79.2%
NSUOCO Yes 2016 82.8% 96.3% 81.5%
OSU No 2016 91.0% 96.0% 91.0%
PUCO No 2015 94.1% 95.4% 88.6%
Salus/PCO No 2016 68.6% 82.7% 86.8%
SCCOMBKU Yes 2015 77.0% 94.0% 88.0%
SCO Yes 2015 89.0% 93.0% 92.0%
SUNY No 2016 91.0% 91.0% 84.0%
UABSO Yes 2014 92.7% 97.3% 78.7%
UCB No 2015 87.0% 100.0% 94.0%
UHCO No 2015 81.0% 93.0% 87.0%
UIWRSO No 2015 83.3% 90.0% 91.4%
UMSL Yes 2016 80.0% 91.0% 89.0%WUCO No NR NR NR NR
Total Yes = 10No = 12
KYCO's first class matriculated in fall 2016.NR = Data Not Reported
Are students required to take the National
Board exam? Passage Rate, First-Time Test-Takers

Financial Aid/Student Expenses in the Professional O.D. Program

Percentage of Students in the Professional O.D. Program Receiving Financial Aid, and Average Financial Aid AwardsIncludes Gift Aid and Self-Help Monies (e.g. loans)
Annual Student Data Report 2016-2017 3.1Association of Schools and Colleges of Optometry
www.optometriceducation.org
2014-2015 2015-2016
% of Students Average Award Average Award % of Students Average Award Average AwardSchool ID Receiving Financial Aid Resident Non-Resident Receiving Financial Aid Resident Non-Resident
AZCOPT 83.7% $55,578 $55,578 91.5% $54,298 $54,298
IAUPR 90.9% $52,000 $52,000 74.7% $46,500 $46,500
ICO 79.6% $50,689 $50,689 78.7% $44,787 $44,787
IUSO 81.3% $33,573 $42,286 79.4% $35,670 $43,366
MCO 85.2% $33,250 $32,735 89.0% $33,230 $38,450
MCPHS* 93.5% $45,474 $45,474 93.8% $49,386 $49,386
NECO** 82.1% $47,670 $47,670 86.4% $45,989 $45,989
NOVA 81.0% $45,866 $50,228 88.1% $49,273 $50,031
NSUOCO 81.4% $32,358 $40,500 84.1% $35,690 $40,500
OSU 96.5% $41,379 $69,626 97.2% $43,601 $71,795
PUCO 81.2% $46,644 $46,644 78.4% $47,338 $47,338
Salus/PCO 84.0% $52,955 $52,955 87.3% $50,642 $50,642
SCCOMBKU 78.2% $40,004 $40,004 80.7% $45,469 $45,469
SCO 90.1% $35,310 $43,562 84.7% $34,713 $44,004
SUNY 93.0% $45,459 $61,899 89.3% $47,759 $64,878
UABSO 100.0% $34,882 $58,169 89.5% $36,187 $59,946
UCB 95.7% $50,539 $50,867 100.0% $45,214 $52,116
UHCO 88.4% $40,500 $43,000 85.4% $40,500 $43,000
UIWRSO 90.8% $48,443 $48,443 90.5% $48,732 $48,732
UMSL 97.2% $29,825 $44,870 97.1% $33,727 $44,781
WUCO 86.5% $53,211 $53,211 80.7% $53,435 $53,435
*For MCPHS, the above figures do not include private, GPlus loans or outside SIS.**For NECO, the number of students receiving aid and the average aid package is based on US citizens and permanent residents only.

Grants and/or Scholarships Received in the Professional O.D. Program, AY 2015-2016
Annual Student Data Report 2016-2017 3.2Association of Schools and Colleges of Optometry
www.optometriceducation.org
Average Amt. Average Amt. Average Amt.School ID # Receiving % Receiving Per Student # Receiving % Receiving Per Student # Receiving % Receiving Per Student
AZCOPT 0 0.0% $0 2 0.9% $3,070 15 7.1% $6,306IAUPR 0 0.0% $0 20 8.6% $2,355 2 0.9% $2,000ICO 33 5.1% $3,737 97 15.0% $4,982 1 0.2% $19,444IUSO 9 3.0% $3,889 39 13.0% $6,280 0 0.0% $0MCO 0 0.0% $0 11 7.5% $3,720 43 29.5% $2,540MCPHS 0 0.0% $0 14 5.4% $6,223 6 2.3% $4,648NECO 0 0.0% $0 95 19.6% $5,762 2 0.4% $66,200NOVA 0 0.0% $0 45 11.4% $9,506 16 4.1% $10,877NSUOCO 0 0.0% $0 43 38.1% $493 9 8.0% $16,241OSU 3 1.2% $4,788 220 88.7% $4,148 18 7.3% $11,407PUCO 5 1.4% $3,000 56 15.3% $2,410 15 4.1% $16,817Salus/PCO 0 0.0% $0 107 16.8% $4,603 36 5.6% $4,986SCCOMBKU 28 7.0% $943 169 42.4% $1,842 15 3.8% $14,446SCO 1 0.2% $2,000 114 21.5% $5,412 122 23.0% $8,077SUNY 0 0.0% $0 125 34.3% $4,838 8 2.2% $1,750UABSO 0 0.0% $0 91 50.3% $4,215 42 23.2% $11,722UCB 0 0.0% $0 254 100.0% $5,977 4 1.6% $2,710UHCO 0 0.0% $0 149 36.9% $2,258 4 1.0% $30,000UIWRSO 0 0.0% $0 97 37.0% $2,613 82 31.3% $4,408UMSL 4 2.3% $8,713 127 73.4% $5,783 65 37.6% $2,641WUCO 0 0.0% $0 7 2.1% $3,857 17 5.0% $2,626Total 83 1.2% $3,023 1882 27.1% $4,374 522 7.5% $7,207
*Includes state scholarships, Scholarships for Disadvantaged Students and the Armed Forces Health Professions Scholarship.
All Other Grants/Scholarships*Earmarked for Minorities
Other Optometry School/Institutional Grants/Scholarships
Optometry School/Institutional Funds
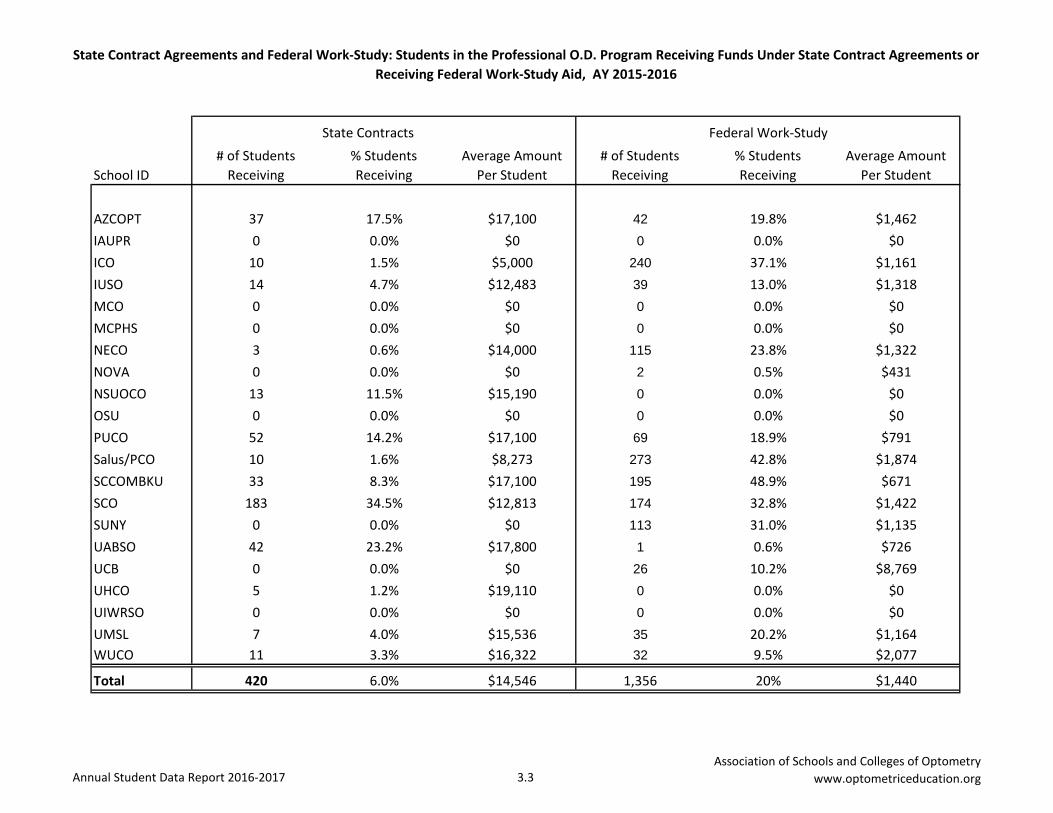
State Contract Agreements and Federal Work-Study: Students in the Professional O.D. Program Receiving Funds Under State Contract Agreements or Receiving Federal Work-Study Aid, AY 2015-2016
Annual Student Data Report 2016-2017 3.3Association of Schools and Colleges of Optometry
www.optometriceducation.org
State Contracts Federal Work-Study
School ID# of Students
Receiving% Students Receiving
Average Amount Per Student
# of Students Receiving
% Students Receiving
Average Amount Per Student
AZCOPT 37 17.5% $17,100 42 19.8% $1,462IAUPR 0 0.0% $0 0 0.0% $0ICO 10 1.5% $5,000 240 37.1% $1,161IUSO 14 4.7% $12,483 39 13.0% $1,318MCO 0 0.0% $0 0 0.0% $0MCPHS 0 0.0% $0 0 0.0% $0NECO 3 0.6% $14,000 115 23.8% $1,322NOVA 0 0.0% $0 2 0.5% $431NSUOCO 13 11.5% $15,190 0 0.0% $0OSU 0 0.0% $0 0 0.0% $0PUCO 52 14.2% $17,100 69 18.9% $791Salus/PCO 10 1.6% $8,273 273 42.8% $1,874SCCOMBKU 33 8.3% $17,100 195 48.9% $671SCO 183 34.5% $12,813 174 32.8% $1,422SUNY 0 0.0% $0 113 31.0% $1,135UABSO 42 23.2% $17,800 1 0.6% $726UCB 0 0.0% $0 26 10.2% $8,769UHCO 5 1.2% $19,110 0 0.0% $0UIWRSO 0 0.0% $0 0 0.0% $0UMSL 7 4.0% $15,536 35 20.2% $1,164WUCO 11 3.3% $16,322 32 9.5% $2,077
Total 420 6.0% $14,546 1,356 20% $1,440

Loan Types: Percentage of Students in the Professional O.D. Program Receiving Loan Assistance, and Average Dollar Amount Per StudentAY 2015-2016
Annual Student Data Report 2016-2017 3.4Association of Schools and Colleges of Optometry
www.optometriceducation.org
School ID# StudentsReceiving
% StudentsReceiving
Avg Amountper Student
# StudentsReceiving
% StudentsReceiving
Avg Amountper Student
# StudentsReceiving
% StudentsReceiving
Avg Amountper Student
AZCOPT 161 75.9% $40,357 4 1.9% $4,000 123 58.0% $17,436IAUPR 172 73.8% $40,500 0 0.0% $0 120 51.5% $6,700ICO 457 70.6% $29,877 211 32.6% $2,271 359 55.5% $8,854IUSO 235 78.1% $32,255 133 44.2% $4,953 63 20.9% $10,577MCO 119 81.5% $19,830 0 0.0% $0 82 56.2% $19,850MCPHS 216 83.7% $41,415 0 0.0% $0 118 45.7% $15,692NECO 312 64.5% $40,416 293 60.5% $3,372 109 22.5% $11,903NOVA 326 82.5% $45,303 0 0.0% $0 97 24.6% $16,678NSUOCO 80 70.8% $35,600 5 4.4% $4,000 27 23.9% $12,063OSU 221 89.1% $39,042 0 0.0% $0 91 36.7% $10,082PUCO 222 60.8% $39,877 0 0.0% $0 110 30.1% $13,800Salus/PCO 523 82.0% $42,775 509 79.8% $3,080 214 33.5% $13,804SCCOMBKU 360 90.2% $35,524 335 84.0% $2,210 108 27.1% $17,107SCO 438 82.6% $36,306 331 62.5% $4,118 60 11.3% $6,663SUNY 294 80.8% $29,256 250 68.7% $1,445 99 27.2% $10,272UABSO 152 84.0% $36,393 1 0.6% $4,853 36 19.9% $17,037UCB 141 55.5% $32,318 26 10.2% $3,581 37 14.6% $11,723UHCO 332 82.2% $35,000 0 0.0% $0 25 6.2% $5,000UIWRSO 215 82.1% $38,980 0 0.0% $0 153 58.4% $17,478UMSL 147 85.0% $34,213 0 0.0% $0 23 13.3% $9,027WUCO 252 74.8% $42,736 0 0.0% $0 170 50.4% $17,153Total 5375 77.4% $37,072 2,098 30.2% $2,999 2,224 32.0% $13,101*Formerly "Federal Direct or Federal Family Ed Loans" Graduate students are now ineligible for subsidized Federal Direct loans.**Formerly "Federal GP Plus"(continued on next page)
Federal Direct LoanUnsubsidized*
Federal Graduate Plus**Federal Perkins

Loan Types: Percentage of Students in the Professional O.D. Program Receiving Loan Assistance, and Average Dollar Amount Per StudentAY 2015-2016
Annual Student Data Report 2016-2017 3.4Association of Schools and Colleges of Optometry
www.optometriceducation.org
(continued from previous page)
School ID# Students Receiving
% Receiving
Avg $/ Student
# Students Receiving
% Receiving
Avg $/ Student
# Students
% Receiving
Avg $/ Student
# Students
% Receiving
Avg $/ Student
AZCOPT 0 0.0% $0 0 0.0% $0 9 4.2% $13,465 3 1.4% $12,913IAUPR 3 1.3% $4,000 0 0.0% $0 14 6.0% $20,000 0 0.0% $0ICO 136 21.0% $3,083 0 0.0% $0 0 0.0% $0 0 0.0% $0IUSO 110 36.5% $2,917 0 0.0% $0 0 0.0% $0 0 0.0% $0MCO 20 13.7% $4,750 0 0.0% $0 0 0.0% $0 6 4.1% $17,080MCPHS 0 0.0% $0 0 0.0% $0 0 0.0% $0 14 5.4% $15,542NECO 85 17.6% $2,855 39 8.1% $1,538 58 12.0% $4,241 37 7.6% $20,991NOVA 0 0.0% $0 0 0.0% $0 0 0.0% $0 7 1.8% $16,610NSUOCO 0 0.0% $0 0 0.0% $0 0 0.0% $0 0 0.0% $0OSU 55 22.2% $4,918 0 0.0% $0 0 0.0% $0 0 0.0% $0PUCO 17 4.7% $9,706 0 0.0% $0 0 0.0% $0 4 1.1% $27,200Salus/PCO 247 38.7% $3,159 0 0.0% $0 0 0.0% 21 3.3% $16,014SCCOMBKU 95 23.8% $5,771 11 2.8% $4,600 70 17.5% $5,048 21 5.3% $14,084SCO 232 43.8% $2,517 0 0.0% $0 0 0.0% $0 39 7.4% $9,462SUNY 63 17.3% $4,032 0 0.0% $0 0 0.0% $0 10 2.7% $16,624UABSO 0 0.0% $0 1 0.6% $30,000 2 1.1% $5,000 1 0.6% $16,000UCB 48 18.9% $5,400 0 0.0% $0 0 0.0% $0 1 0.4% $56,464UHCO 3 0.7% $25,000 0 0.0% $0 0 0.0% $0 25 6.2% $7,500UIWRSO 0 0.0% $0 0 0.0% $0 0 0.0% $0 4 1.5% $13,390UMSL 11 6.4% $6,840 0 0.0% $0 0 0.0% $0 4 2.3% $7,613WUCO 0 0.0% $0 0 0.0% $0 0 0.0% $0 9 2.7% $34,944Total 1125 16.2% $3,646 51 0.7% $2,757 153 2.2% $6,605 206 3.0% $15,468*Formerly "Federal Direct or Federal Family Ed Loans" Graduate students are now ineligible for subsidized Federal Direct loans.**Formerly "Federal GP Plus"
Institutional Loans Other LoansHHS Health ProfessionsStudent
HHS Loans for DisadvantagedStudents

Tuition Expenses for Students Enrolled in the Professional O.D. Program, AY 2016-2017*
Annual Student Data Report 2016-2017 3.5Association of Schools and Colleges of Optometry
www.optometriceducation.org
School ID Resident Non-Resident Resident Non-Resident Resident Non-Resident Resident Non-ResidentPublic SchoolsIUSO $25,178 $37,714 $25,178 $37,714 $25,178 $37,714 $25,178 $37,714MCO $24,272 $36,408 $24,928 $37,392 $34,112 $51,168 $28,864 $43,296NSUOCO $16,680 $33,360 $22,339 $44,678 $22,339 $44,678 $16,680 $33,360OSU** $25,896 $46,952 $25,896 $25,896 $34,152 $34,152 $34,152 $34,152SUNY** $27,300 $48,680 $27,300 $48,680 $27,300 $48,680 $27,300 $48,680UABSO*** $26,115 $54,012 $26,115 $54,012 $26,115 $54,012 $17,410 $36,008UCB** $28,478 $40,723 $28,478 --- $28,478 --- $28,478 ---UHCO $23,160 $43,480 $23,623 $44,350 $24,095 $45,237 $24,577 $46,141UMSL**** $24,770 $40,821 $30,512 $50,576 $30,512 $50,576 $24,770 $40,821Average $24,650 $42,461 $26,041 $42,912 $28,031 $45,777 $25,268 $40,022
Private SchoolsAZCOPT $38,262 $38,262 $38,262 $38,262 $38,262 $38,262 $38,262 $38,262IAUPR $26,750 $26,750 $26,500 $26,500 $26,250 $26,250 $26,000 $26,000ICO $39,180 $39,180 $39,180 $39,180 $51,750 $51,750 $40,025 $40,025KYCO***** $38,450 $38,450 --- --- --- --- --- ---MCPHS $40,275 $40,275 $40,275 $40,275 $40,275 $40,275 $40,275 $40,275NECO $40,037 $40,037 $40,037 $40,037 $40,037 $40,037 $40,037 $40,037NOVA $30,802 $34,605 $30,802 $34,605 $30,802 $34,605 $30,802 $34,605PUCO****** $38,520 $38,520 $51,809 $51,809 $35,648 $35,648 $28,890 $28,890Salus/PCO $38,940 $38,940 $38,940 $38,940 $38,940 $38,940 $38,940 $38,940SCCOMBKU $39,650 $39,650 $39,650 $39,650 $39,650 $39,650 $39,650 $39,650SCO $19,104 $34,704 $19,104 $34,704 $19,104 $34,704 $19,104 $34,704UIWRSO $35,600 $35,600 $35,600 $35,600 $35,600 $35,600 $35,600 $35,600WUCO $37,310 $37,310 $37,310 $37,310 $37,310 $37,310 $37,310 $37,310Average $35,606 $37,099 $36,456 $38,073 $36,136 $37,753 $34,575 $36,192
***Most UABSO non-resident students qualify for a merit scholarship decreasing non-resident tuition significantly.**** Second and third year tuition includes summer sessions.***** KYCO does not have second, third or fourth year tuition listed because its first class matriculated in fall 2016.
******Pacific University is a private institution and does not have non-resident tuition rates. All students in the same year pay the same tuition and fees.
**Almost all out-of-state students convert to in-state before the second year. Non-U.S. citizens may not convert to in-state. For UCB, a flat Educational Fee (tuition) is assessed across all 4 years of the OD program.
First Year Second Year Third Year Fourth Year
*These are the tuition and fees figures that are reported directly to ASCO, but are subject to change. Applicants are strongly encouraged to speak to each institution they are applying to about available scholarship and financial aid opportunities.

Fees and the Cost of Books and Instruments for Students Enrolled in the Professional O.D. Program, AY 2016-2017*
Annual Student Data Report 2016-2017 3.6Association of Schools and Colleges of Optometry
www.optometriceducation.org
School ID 1st Year 2nd Year 3rd Year 4th Year 1st Year 2nd Year 3rd Year 4th YearPublic SchoolsIUSO $1,660 $1,781 $1,781 $0 $3,828 $3,108 $1,456 $2,610MCO $162 $162 $243 $373 $3,416 $4,792 $2,458 $1,875NSUOCO $1,767 $2,593 $2,314 $1,192 $6,377 $7,074 $3,135 $670OSU $2,102 $2,102 $2,785 $2,785 $4,790 $1,988 $479 $0SUNY $608 $533 $533 $533 $3,900 $3,500 $1,000 $1,000UABSO $842 $842 $842 $842 $9,004 $1,261 $841 $0UCB*** $2,400 $2,400 $2,400 $2,400 $6,342 $1,502 $868 $802UHCO $982 $982 $982 $982 $2,500 $2,000 $1,000 $0UMSL**** $0 $0 $0 $0 $3,000 $4,200 $600 $0Average $1,169 $1,266 $1,320 $1,012 $4,795 $3,269 $1,315 $773
Private SchoolsAZCOPT $6,706 $2,743 $628 $628 $1,794 $1,335 $852 $150IAUPR $1,268 $1,420 $1,288 $1,288 $6,818 $6,652 $1,570 $599ICO $170 $170 $170 $170 $3,370 $4,731 $73 $0KYCO***** $0 --- --- --- $0 --- --- ---MCPHS $1,070 $960 $960 $920 $5,166 $5,016 $1,866 $1,244NECO $760 $500 $500 $350 $3,050 $1,945 $210 $0NOVA $798 $1,197 $1,197 $846 $3,134 $3,450 $1,452 $676PUCO $42 $42 $42 $42 $5,679 $3,421 $971 $0Salus/PCO $790 $970 $905 $1,095 $4,000 $5,000 $500 $100SCCOMBKU $150 $150 $150 $300 $3,751 $5,890 $969 $0SCO $445 $270 $205 $305 $3,793 $4,932 $525 $0UIWRSO $1,245 $1,040 $625 $50 $3,350 $4,420 $500 $0WUCO $40 $40 $40 $40 $5,156 $7,883 $510 $169Average $1,037 $792 $559 $503 $3,774 $4,556 $833 $245
**Fees include those fees that are charged by the school to all students, such as student association, graduation, lab and technology fees. NBEO fees are not included here.*** UCB assesses a Professional Degree Fee, in addition to traditional fees, for OD students. The Student Health Insurance Plan (SHIP) is not included in the fee amount.**** For UMSL, traditional fees have been bundled by the university into tuition and are no longer calculated separately. ***** KYCO does not have second, third or fourth year figures listed because its first class matriculated in fall 2016.
Fees** Books and Instruments
*The fees and expenses figures used in this table are reported directly to ASCO, but are subject to change. Applicants are strongly encouraged to speak to each institution they areapplying to about available scholarship and financial aid opportunities.

Average Direct Expenses of a Student Enrolled in the Professional O.D. Program, AY 2016-2017*(Tuition + Fees + Books + Instruments = Direct Expenses)
Annual Student Data Report 2016-2017 3.7Association of Schools and Colleges of Optometry
www.optometriceducation.org
School ID 1st Year 2nd Year 3rd Year 4th Year 1st Year 2nd Year 3rd Year 4th YearPublic SchoolsIUSO $30,666 $30,067 $28,415 $27,788 $43,202 $42,603 $40,951 $40,324MCO $27,850 $29,882 $36,813 $31,112 $39,986 $42,346 $53,869 $45,544NSUOCO $24,824 $32,006 $27,788 $18,542 $41,504 $54,345 $50,127 $35,222OSU** $32,788 $29,986 $37,416 $36,937 $53,844 ---- ---- ----SUNY** $31,808 $31,333 $28,833 $28,833 $53,188 $52,713 $50,213 $50,213UABSO*** $35,961 $28,218 $27,798 $18,252 $63,858 $56,115 $55,695 $36,850UCB** $37,220 $32,380 $31,746 $31,680 $49,465 ---- ---- ----UHCO $26,642 $26,605 $26,077 $25,559 $46,962 $47,332 $47,219 $47,123UMSL**** $27,770 $34,712 $31,112 $24,770 $43,821 $54,776 $51,176 $40,821Average $30,614 $30,577 $30,666 $27,053 $48,426 $50,033 $49,893 $42,300
Private SchoolsAZCOPT $46,762 $42,340 $39,742 $39,040 $46,762 $42,340 $39,742 $39,040IAUPR $34,836 $34,572 $29,108 $27,887 $34,836 $34,572 $29,108 $27,887ICO $42,720 $44,081 $51,993 $40,195 $42,720 $44,081 $51,993 $40,195KYCO***** $38,450 --- --- --- $38,450 --- --- ---MCPHS $46,511 $46,251 $43,101 ---- $46,511 $46,251 $43,101 ----NECO $43,847 $42,482 $40,747 $40,387 $43,847 $42,482 $40,747 $40,387NOVA $34,734 $35,449 $33,451 $32,324 $38,537 $39,252 $37,254 $36,127PUCO****** $44,241 $55,272 $36,661 $28,932 $44,241 $55,272 $36,661 $28,932Salus/PCO $43,730 $44,910 $40,345 $40,135 $43,730 $44,910 $40,345 $40,135SCCOMBKU $43,551 $45,690 $40,769 $39,950 $43,551 $45,690 $40,769 $39,950SCO $23,342 $24,306 $19,834 $19,409 $38,942 $39,906 $35,434 $35,009UIWRSO $40,195 $41,060 $36,725 $35,650 $40,195 $41,060 $36,725 $35,650WUCO $42,506 $45,233 $37,860 $37,519 $42,506 $45,233 $37,860 $37,519Average $40,417 $41,804 $37,528 $34,675 $41,910 $43,421 $39,145 $36,439
**Almost all out-of-state students convert to in-state before the second year. Non-U.S. citizens may not convert to in-state.***Most UABSO non-resident students qualify for a merit scholarship decreasing non-resident tuition significantly.**** Second and third year tuition includes summer sessions.***** KYCO does not have second, third or fourth year figures listed because its first class matriculated in fall 2016.
Resident Non-Resident
*The tuition and fees figures used in this table are reported directly to ASCO, but are subject to change. Applicants are strongly encouragedto speak to each institution they are applying to about available scholarship and financial aid opportunities.
******Pacific University is a private institution and does not have non-resident tuition rates. All students in the same year pay the same tuition and fees.

Average Living Expenses of a Student Enrolled in the Professional O.D. Program, AY 2016-2017
Annual Student Data Report 2016-2017 3.8Association of Schools and Colleges of Optometry
www.optometriceducation.org
Rent & Health Trans- Rent & Health Trans-School ID Food Insurance portation Misc.* Food Insurance portation Misc.*Public SchoolsIUSO $12,466 $223 $2,958 $4,078 $16,621 $297 $3,944 $5,437MCO $8,128 $0 $992 $916 $11,176 $0 $1,364 $1,260NSUOCO $6,378 $0 $3,214 $3,306 $7,795 $0 $4,228 $4,041OSU $12,214 $0 $2,660 $2,501 $17,098 $0 $3,728 $3,530SUNY $15,375 $0 $2,275 $3,138 $20,502 $0 $3,060 $4,184UABSO $11,682 $2,340 $2,736 $2,400 $15,576 $2,340 $3,306 $3,200UCB $20,128 $4,146 $3,146 $1,580 $26,837 $4,146 $4,195 $2,106UHCO $14,750 $1,200 $2,800 $5,500 $18,500 $1,500 $3,500 $6,875UMSL $6,500 $1,200 $1,500 $1,350 $8,200 $1,600 $2,000 $2,100Average $11,958 $1,012 $2,476 $2,752 $15,812 $1,098 $3,258 $3,637
Private SchoolsAZCOPT $9,414 $2,940 $2,509 $3,776 $12,552 $3,494 $6,258 $5,018IAUPR $12,982 $0 $1,222 $2,398 $17,309 $0 $1,629 $3,197ICO $13,898 $1,590 $2,661 $0 $18,532 $2,120 $3,548 $0KYCO $9,145 $525 $4,257 $2,400 $12,194 $700 $5,676 $2,400MCPHS $11,198 $2,288 $782 $1,882 $16,797 $2,288 $1,173 $2,823NECO $13,680 $1,565 $720 $4,680 $18,240 $1,565 $1,640 $6,240NOVA $15,394 $1,998 $1,827 $1,530 $19,586 $1,998 $2,437 $2,040PUCO $13,050 $2,364 $1,125 $1,125 $17,400 $2,364 $1,500 $1,500Salus/PCO $12,555 $2,420 $1,815 $1,210 $16,770 $3,210 $2,420 $1,600SCCOMBKU $9,000 $0 $2,250 $4,050 $12,000 $0 $3,600 $6,000SCO $8,100 $0 $1,575 $3,600 $10,800 $0 $2,100 $4,800UIWRSO $8,700 $915 $1,700 $2,250 $11,600 $915 $2,800 $4,800WUCO --- --- --- --- $20,643 $3,465 $5,900 $0Average $11,426 $1,384 $1,870 $2,408 $15,725 $1,701 $3,129 $3,109* Includes all other living expenses such as utilities, personal expenses, etc.
Nine Month Budget Twelve Month Budget

Percentage of Student Expenses in the Professional O.D. Program Covered by Different Financial Aid Sources, AY 2015-2016*
Annual Student Data Report 2016-2017 3.9Association of Schools and Colleges of Optometry
www.optometriceducation.org
Grants and/or Federal State
School ID Scholarships Loans Work-Study Contracts
AZCOPT 1.0% 92.0% 1.0% 6.0%
IAUPR 0.0% 80.0% 0.0% 0.0%
ICO 1.7% 56.0% 0.7% 0.0%
IUSO 1.0% 72.0% 0.0% 3.0%
MCO 3.0% 84.0% 0.0% 0.0%
MCPHS 5.6% 66.0% 0.0% 0.0%
NECO 2.0% 68.0% 0.0% 0.0%
NOVA 11.4% 75.8% 0.5% 0.0%
NSUOCO 5.0% 90.0% 0.0% 5.0%
OSU 5.0% 67.0% 0.0% 0.0%
PUCO 4.0% 69.0% 1.0% 26.0%
Salus/PCO 2.5% 95.3% 1.9% 0.3%
SCCOMBKU 5.0% 71.0% 1.0% 2.0%
SCO 6.0% 92.0% 1.0% 1.0%
SUNY 6.0% 93.0% 1.0% 0.0%
UABSO 14.0% 71.0% 1.0% 11.0%
UCB 10.0% 33.0% 2.0% 0.0%
UHCO 4.0% 95.0% 0.0% 1.0%
UIWRSO 8.8% 79.3% 0.0% 0.0%
UMSL 12.0% 63.0% 0.0% 1.0%
WUCO 0.4% 78.6% 0.4% 1.0%
*Percentages are based on amounts that are actually accepted by students.

Optometric Educational Indebtedness of Graduates of the Professional O.D. Program, AY 2015-2016*(Includes graduate and professional school debt. Does not include undergraduate debt)
Annual Student Data Report 2016-2017 3.10Association of Schools and Colleges of Optometry
www.opometricteducation.org
Number of Percentage of Average Indebtedness Average IndebtednessSchool ID Students with Debt Students with Debt of Students with Debt of All Students*
AZCOPT 42 85.7% $237,156 $199,197
IAUPR 30 83.3% $162,000 $135,000
ICO 107 71.8% $192,804 $139,392
IUSO NA NA NA NA
MCO 28 82.4% $132,850 $119,994
MCPHS 52 88.1% $166,409 $146,665
NECO** 71 67.0% $174,249 $158,611
NOVA 81 83.5% $194,613 $153,045
NSUOCO 19 67.9% $128,918 $84,463
OSU 51 91.1% $176,737 $164,113
PUCO 55 62.5% $166,049 $108,722
Salus/PCO 129 81.1% $195,862 $167,326
SCCOMBKU 79 82.3% $161,007 $132,496
SCO 121 94.5% $139,612 $134,071
SUNY 62 79.5% $134,026 $102,588
UABSO 44 91.7% $145,180 $145,180
UCB 57 93.4% $103,125 $90,222
UHCO 85 84.2% $153,334 $138,000
UIWRSO NA NA NA NA
UMSL 46 100.0% $146,998 $143,870
WUCO 62 73.8% $204,689 $173,845
TOTAL 1221 74.5% $167,482 $129,892
*Includes all graduates, with or without debt.** Includes US citizens and permanent residents only.NA = Not Available
updated June 2017

Undergraduate Indebtedness of First-Year Students in the Professional O.D. Program, AY 2015-2016
Annual Student Data Report 2016-2017 3.11Association of Schools and Colleges of Optometry
www.optometriceducation.org
Number of Percentage of Average Indebtedness Average IndebtednessSchool ID Students with Debt Students with Debt of Students with Debt of All Students*
AZCOPT NA NA NA NA
IAUPR 29 46.0% $14,500 NA
ICO 68 37.4% $22,516 $10,193
IUSO NA NA NA NA
MCO 19 50.0% $25,200 $11,400
MCPHS 42 56.8% $26,013 $16,067
NECO** 52 44.4% $21,637 $14,760
NOVA 60 57.1% $25,108 $12,767
NSUOCO 12 42.9% $13,501 $5,786
OSU 37 56.1% $18,696 $10,808
PUCO 43 45.7% $19,662 $8,716
Salus/PCO NA NA NA NA
SCCOMBKU 35 35.0% $20,216 $7,295
SCO 50 36.8% $20,471 $7,526
SUNY 44 44.0% $22,752 $14,752
UABSO 43 84.3% $43,568 $36,734
UCB 40 57.1% $10,580 $5,425
UHCO 70 68.6% $20,000 $10,000
UIWRSO NA NA NA NA
UMSL 20 45.5% $15,945 $7,248
WUCO NA NA NA NA
TOTAL 664 48.5% $21,990 $10,992
*Includes all first-year students, with or without debt.
**Includes only those students who applied for federal student financial aid.
NA = Not Available

Number of Students in Professional O.D. Program Enrolled under State Contract Agreements, By State, AY 2016-2017
Annual Student Data Report 2016-2017 3.12Association of Schools and Colleges of Optometry
www.optometriceducation.org
School ID AL AK AZ AR CA CO CT DE DC FL GA HI ID IL IN IA KS KY LA ME MD MA MI MN MS MO
AZCOPT 0 0 39 0 0 0 0 0 0 0 0 0 0 0 0 0 0 0 0 0 0 0 0 0 0 0
ICO 0 0 0 0 0 0 0 0 0 0 0 0 0 10 0 0 0 0 0 0 0 0 0 0 0 0
IUSO 0 0 0 0 0 0 0 0 0 0 0 0 0 0 0 0 0 10 0 0 0 0 0 0 0 0
KYCO 0 0 0 0 0 0 0 0 0 0 0 0 0 0 0 0 0 3 0 0 0 0 0 0 0 0
NECO 0 0 0 0 0 0 0 0 0 0 0 0 0 0 0 0 0 0 0 0 0 0 0 0 0 0
NSUOCO 0 0 0 5 0 1 0 0 0 0 0 0 0 0 0 0 5 0 1 0 0 0 0 0 0 0
PUCO 0 1 2 0 0 8 0 0 0 0 0 9 0 0 0 0 0 0 0 0 0 0 0 0 0 0
Salus/PCO 0 0 0 0 0 2 0 4 0 0 0 0 0 0 0 0 0 0 0 0 0 0 0 0 0 0
SCCOMBKU 0 0 4 0 0 5 0 0 0 0 0 2 0 0 0 0 0 0 0 0 0 0 0 0 0 0
SCO 0 0 0 20 0 0 0 0 0 0 24 0 0 0 0 0 7 19 23 0 0 0 0 0 29 0
UABSO 0 0 0 0 0 0 0 0 0 0 10 0 0 0 0 0 0 11 7 0 0 0 0 0 8 0
UHCO 0 0 0 0 0 0 0 0 0 0 0 0 0 0 0 0 0 0 3 0 0 0 0 0 0 0
UMSL 0 0 0 0 0 0 0 0 0 0 0 0 0 0 0 0 7 0 0 0 0 0 0 0 0 0
WUCO 0 0 4 0 0 2 0 0 0 0 0 1 0 0 0 0 0 0 0 0 0 0 0 0 0 0
Total 0 1 49 25 0 18 0 4 0 0 34 12 0 10 0 0 19 43 34 0 0 0 0 0 37 0
School ID MT NE NV NH NJ NM NY NC ND OH OK OR PA RI SC SD TN TX UT VT VA WA WV WI WY Other
AZCOPT 0 0 0 0 0 0 0 0 0 0 0 0 0 0 0 0 0 0 0 0 0 0 0 0 0 0
ICO 0 0 0 0 0 0 0 0 0 0 0 0 0 0 0 0 0 0 0 0 0 0 0 0 0 0
IUSO 0 0 0 0 0 0 0 0 0 0 0 0 0 0 0 0 0 0 0 0 0 0 2 0 0 0
KYCO 0 0 0 0 0 0 0 0 0 0 0 0 0 0 0 0 0 0 0 0 0 0 0 0 0 0
NECO 0 0 0 0 0 0 0 3 0 0 0 0 0 0 0 0 0 0 0 0 0 0 0 0 0 0
NSUOCO 0 0 0 0 0 0 0 0 0 0 0 0 0 0 0 0 0 0 0 0 0 0 0 0 0 0
PUCO 4 0 1 0 0 0 0 0 9 0 0 0 0 0 0 0 0 0 5 0 0 0 0 0 7 0
Salus/PCO 0 0 0 0 0 0 0 0 0 0 0 0 0 0 0 0 0 0 0 0 3 0 3 0 0 0
SCCOMBKU 0 0 2 0 0 0 0 0 1 0 0 0 0 0 0 0 0 0 8 0 0 0 0 0 2 0
SCO 0 0 0 0 0 0 0 0 0 0 0 0 0 0 10 0 40 0 0 0 0 0 11 0 0 0
UABSO 0 0 0 0 0 0 0 0 0 0 0 0 0 0 6 0 0 0 0 0 0 0 0 0 0 0
UHCO 0 0 0 0 0 0 0 0 0 0 0 0 0 0 0 0 0 0 0 0 0 0 0 0 0 0
UMSL 0 0 0 0 0 0 0 0 0 0 0 0 0 0 0 0 0 0 0 0 0 0 0 0 0 0
WUCO 0 0 0 0 0 0 0 0 1 0 0 0 0 0 0 0 0 0 0 0 0 0 0 0 1 0
Total 4 0 3 0 0 0 0 3 11 0 0 0 0 0 16 0 40 0 13 0 3 0 16 0 10 0
Schools having no contracts for AY 2016-2017 are not listed.

Number of Students in the Professional O.D. Program Enrolled Under State Contract Agreements; Contract Amounts and Student Support Levels by StateAY 2016-2017
Annual Student Data Report 2016-2017 3.13Association of Schools and Colleges of Optometry
www.optometriceducation.org
# Students Enrolled Under State Contract Amount of Amount Applied to Agreements or School ID State # Students Contract Student Tuition WICHE Type Programs (per student) (per student)
AZCOPT AZ 39 $17,100 $17,100School ID First Year Total ICO IL 10 $5,000 $5,000AZCOPT 8 39 IUSO KY 10 $12,536 $12,536IAUPR 0 0 WV 2 $11,805 $11,805ICO 2 10 KYCO KY 3 $16,700 $16,700IUSO 2 12 NECO NC 3 $14,000 $14,000KYCO 3 3 NSUOCO AR 5 $17,800 $17,352MCO 0 0 CO 1 $17,425 $16,680MCPHS 0 0 KS 5 $13,502 $13,502NECO 0 3 LA 1 $17,800 $17,800NOVA 0 0 PUCO AK 1 $17,425 $17,425NSUOCO 3 12 AZ 2 $17,425 $17,425OSU 0 0 CO 8 $17,425 $17,425PUCO 6 46 HI 9 $17,425 $17,425Salus/PCO 2 12 MT 4 $17,425 $17,425SCCOMBKU 6 24 NV 1 $17,425 $17,425SCO 39 183 ND 9 $17,425 $17,425SUNY 0 0 UT 5 $17,425 $17,425UABSO 12 42 WY 7 $17,425 $17,425UCB 0 0 Salus/PCO CO 2 $17,100 $17,100UHCO 1 3 DE 4 $4,000 $4,000UIWRSO 0 0 VA 3 $5,000 $5,000UMSL 3 7 WV 3 $11,805 $11,805WUCO 0 9 SCCOMBKU AZ 4 $17,100 $17,100
CO 5 $17,100 $17,100Total 87 405 HI 2 $17,100 $17,100
ND 1 $17,100 $17,100NV 2 $17,100 $17,100UT 8 $17,100 $17,100WY 2 $17,100 $17,100
(countinued on next page)
Contract Amounts and Student Support Levels

Number of Students in the Professional O.D. Program Enrolled Under State Contract Agreements; Contract Amounts and Student Support Levels by StateAY 2016-2017
Annual Student Data Report 2016-2017 3.13Association of Schools and Colleges of Optometry
www.optometriceducation.org
(continued from previous page)Contract Amounts and Student Support Levels
AmountAmount of Applied to
State # Students Contract Student TuitionSchool ID (per student) (per student)
SCO AR 20 $17,800 $15,600GA 24 $17,800 $15,600KS 7 $6,500 $5,200KY 19 $16,700 $15,600LA 23 $17,800 $15,600MS 29 $16,700 $15,600SC 10 $17,800 $15,600TN 40 $10,462 $10,462WV 11 $11,805 $11,805
UABSO GA 10 $17,800 $17,800KY 11 $17,800 $17,800LA 7 $17,800 $17,800MS 8 $17,800 $17,800SC 6 $17,800 $17,800
UHCO LA 3 $19,110 $19,110UMSL KS 7 $15,536 $15,536WUCO AZ 4 $17,425 $17,425
CO 2 $17,425 $17,425HI 1 $17,425 $17,425ND 1 $17,425 $17,425WY 1 $17,425 $17,425

Dollar Amount of State Contracts, By State*, AY 2016-2017
Annual Student Data Report 2016-2017 3.14Association of Schools and Colleges of Optometry
www.optometriceducation.org
School ID AK AZ AR CO DE FL GA HI ID IL IA KS KY LA MD MS
AZCOPT $17,100
ICO $5,000
IUSO $12,536
KYCO $16,700
NECO
NSUOCO $17,800 $17,425 $13,502 $17,800
PUCO $17,425 $17,425 $17,425 $17,425
Salus/PCO $17,100 $4,000
SCCOMBKU $17,100 $17,100 $17,100
SCO $17,800 $17,800 $6,500 $16,700 $17,800 $17,800
UABSO $17,800 $17,800 $17,800 $17,800
UHCO $19,110
UMSL $15,536
WUCO $17,425 $17,425 $17,425
School ID MT NE NV NM NC ND OR PA SC TN UT VA WA WV WY
AZCOPT
ICO
IUSO $11,805
NECO $14,000
NSUOCO
PUCO $17,425 $17,425 $17,425 $17,425 $17,425
Salus/PCO $5,000 $11,805
SCCOMBKU $17,100 $17,100 $17,100 $17,100
SCO $17,800 $10,462 $11,805
UABSO $17,800
UHCO
UMSL
WUCO $17,425 $17,425
* States and schools having no contracts for AY 2016-2017 are not listed.