anomaly detection in smart metering infrastructure with
TRANSCRIPT

Research ArticleAnomaly Detection in Smart Metering Infrastructure withthe Use of Time Series Analysis
Tomasz Andrysiak Aukasz Saganowski and Piotr Kiedrowski
Institute of Telecommunications Faculty of Telecommunications and Electrical EngineeringUniversity of Technology and Life Sciences (UTP) Ul Kaliskiego 7 85-789 Bydgoszcz Poland
Correspondence should be addressed to Tomasz Andrysiak andrysutpedupl
Received 10 March 2017 Revised 31 May 2017 Accepted 13 June 2017 Published 18 July 2017
Academic Editor Jose R Villar
Copyright copy 2017 Tomasz Andrysiak et al This is an open access article distributed under the Creative Commons AttributionLicense which permits unrestricted use distribution and reproduction in any medium provided the original work is properlycited
The article presents solutions to anomaly detection in network traffic for critical smartmetering infrastructure realized with the useof radio sensory networkThe structure of the examined smart meter network and the key security aspects which have influence onthe correct performance of an advanced metering infrastructure (possibility of passive and active cyberattacks) are described Aneffective and quick anomaly detectionmethod is proposedAt its initial stage Cookrsquos distancewas used for detection and eliminationof outlier observations So prepared data was used to estimate standard statistical models based on exponential smoothingthat is Brownrsquos Holtrsquos and Wintersrsquo models To estimate possible fluctuations in forecasts of the implemented models properlyparameterized Bollinger Bands was used Next statistical relations between the estimated traffic model and its real variability wereexamined to detect abnormal behavior which could indicate a cyberattack attempt An update procedure of standard models incase there were significant real network traffic fluctuations was also proposed The choice of optimal parameter values of statisticalmodels was realized as forecast errorminimizationThe results confirmed efficiency of the presentedmethod and accuracy of choiceof the proper statistical model for the analyzed time series
1 Introduction
SmartMetering Communications Networks (SMCN) are oneof the most important parts of the Smart Grid system [1]With smartmetering not only the remote automatic electric-ity metersrsquo reading but also the customerrsquos switching onoffis possible The reading process can be done very often forexample every 15 minutes per every meter Frequent readingallows for more accurate energy consumption forecastingbecause of having large statistic material based on individualelectricity consumption profiles (the more accurate we fore-cast the more money we save)
Smart Metering Communications Network consists oflast-mile networks access networks and a backbone net-work Both backbone and access networks are realized usingtypical methods that is using IP network as a backbone andmostly GPRS technology to access it It should be noted thatthese typical solutions are not the only ones There can beother very original solutions for example the one describedin [2] Last-mile smart metering networks use PLC (Power
Line Communications) RF (radio frequency) or a hybrid ofthese technologies In this article like in [3] the RF tech-nology is considered Using RF technology based on short-range devices makes the last-mile smart metering networksimilar to WSN (wireless sensor network) Moreover theyalso use the multihop technique to expand communicationrange The value of bit rates used in these networks which isbetween a few to a few hundred of kbits is probably the lastsimilarity of these networks There are two main differencesbetweenWSNs and last-mile smartmetering communicationnetworks namely energy issues and memory deficit In last-mile smart metering communication network dedicated forautomatic electricity meter reading energy issues do notexist which is opposite to WSNs [4] The result of the firstdiversity is the difference in the applied routing protocolsIn WSNs routing protocols are oriented on the balancedinvolvement of intermediary nodes in the process of datatransferring while in smart metering they are orientedon reliability of data distribution and acquisition Memorydeficit in communication nodes of the smart meters is caused
HindawiJournal of SensorsVolume 2017 Article ID 8782131 15 pageshttpsdoiorg10115520178782131
2 Journal of Sensors
Metering server
IP network
Smart meter
Trac concentratorTrac concentrator
Trac concentrator
Trac concentrator
Last-mile network Last-mile network
Last-mile network
Last-mile network
APN access pointname server
Figure 1 Smart metering critical infrastructure management system an overview
by using it mostly to implement sophisticated encryptionalgorithms because smartmetering systems being part of theSmart Grid (which is classified as the critical infrastructure)must meet high security requirements The result of thismemory deficit forces other approaches to solve typicalproblems of the networkmaintenance One of such problemsis anomaly detection in last-mile network It is impossible toimplement even simplest anomaly detection algorithms eventhough there is a sparememory because this sparememory isreserved for the future for newmore sophisticated encryptionalgorithms Independent from the memory insufficiency thesecond reason of difficulties with anomaly detection in smartmeters is that the throughput of the last-mile network istoo small to report detected anomalies in the right timeMoreover most of the anomalies would also be detectedby the neighbouring nodes which multiplexes data trafficin the network In smart metering the last-mile networksoperate at nearly maximum traffic load The typical numberof smart meters in a single last-mile network is around 250Every smart meter must be read out every 15min and it takesa few seconds (from 1 sec to 4 sec typically) There is onlya small margin of bandwidth to support the maintenanceand management or to enable the reading process duringdegraded propagation conditionsThe above reasons inducedus to carry out detection of anomalies in the data traffic con-centrator The data traffic concentrator (TC) is a thick nodesimilar to the sink in WSNs The construction of it is mostlybased on the single-board computers which have enoughRAM and ROM memory and also have a fast processor Thedata traffic concentrator is connected to both last-mile andaccess networks It is easy to update when there is access tonetwork database of anomalies or the detection methods
Bearing in mind the above we have chosen to detectnetwork anomalies by means of exponential smoothing ofstatistical models and outliers detection The purpose of theproposed operations is to examine differences between realnetwork traffic parameters and the same trafficrsquos estimatedstatistical models A two-stage anomaly detection methodwas used for the process mentioned above Its first partconsisted in seeking and elimination of any outliers in trafficparameters of the advanced metering infrastructure (AMI)This step was based on Cookrsquos distance which is a simple andefficient method Consequently in the second part of theprocess the data which remained served as a base for creationof statistical models by means of exponential smoothing Inresult the operation showed differences in the tested AMIparameters
In our solution three types of anomalies were tested (i)energy theft by bypassing electricity meter and energymetersshielding (ii) electromagnetic distortion caused by RadioFrequency Interferences (RFI) and conducted interferencesthrough power mains and (iii) interference of communica-tion caused by coordinated attacks
General overview of Smart Grid advanced metering in-frastructure (AMI) is presented in Figure 1 A last-mile net-work consists of AMI network realized by means of wirelesssensor network (WSN) Power meters have built-in wirelesssensors working in industrial scientific and medical (ISM)bands Traffic from power meters is received by a trafficconcentrator which plays a role of communication gatewaybetween a WSN network and other communication linksrealized by for example IP network General Packet RadioService (GPRS) or Long-Term Evolution (LTE) Every traf-fic concentrator communicates through access point name
Journal of Sensors 3
(APN) server (see Figure 1) which represents a link realizedby packet communication network In higher energy opera-tor the level application installed on the metering server isresponsible for maintenance and billings
The article is organized as follows after IntroductionSection 2 describes communication scheme used in the last-mile test-bed network Next Section 3 presents related workon existing anomaly detection systems for Smart MeteringCommunicationsNetwork Section 4 discusses the categoriesand nature of AMI security questions Section 5 presentsthe structure and functioning of the research system InSection 6 the real-life experimental setup as well as experi-mental results is presented Finally Section 7 concludes ourwork
2 Communication Scheme Used inthe Last-Mile Test-Bed Network
Communication scheme used in the examined last-milenetwork was designed by one of the coauthors in 2010and published in 2011 in [5] as EGQF (Energy GreedyQuasi-Flooding) protocolThis paper presents only necessaryinformation about the scheme for better understanding ofthe methods of anomaly detection The EGQF protocol isindependent from communication media types and may beused in networks using RF PLC or even RFPLC [6] hybridtechnologies It uses the multihop technique for an extendingtransmission range and also the multipath technique toimprove reliability of data transfer The architecture of thepresented network is very simple because it can operatehaving only two types of nodes a traffic concentrator andelectricity meters The traffic is forced and coordinated bythe traffic concentrator At the same time only one electricitymeter is queried All the other nodes which are not queriedat the moment can act as transfer nodes relaying packets toor from the destination node Due to the lack of memoryterminals do not know the network topology and even do notknow the addresses of neighbouring nodes
The EGQF protocol uses a reduced set of packet typesthat is command packets response packets andACKCancelpackets Command packets in most cases are used by thetraffic concentrator for querying the electricity meter Theresponse from the electricity meter is transported over theresponse packet The ACKCancel packet is a packet whichacts as the ACK for the destination node and as the readingprocess canceller for the other nodesTheACKCancel packetcan be sent only by the traffic concentrator to confirm thereception of the response and to put out the flooding ofremaining response copies The relaying process in nodeswhich are neither destination nor source nodes dependson transmitting the copy of the packet after random timein the condition of a not detected carrier The differencebetween the typical flooding protocol and the EGQF protocolis that using a typical flooding protocol nodes sends a copyof packet always once during the transferring process whilewhen using the EGQF protocol copies are sent as often asneeded for example once twice or not at all The decisionwhether a copy of the packet should be sent is made whenthe transfer discriminator (TD) value of a packet is greater
than the previous stored one Initial (or set at the end ofthe process) transfer discriminator value is zero The transferdiscriminator consists of two fields organized in the followingorder the packet type code and the time to live (TTL)counter The TTL occupied the least three significant bits ofthe control field of the packet while the packet type codeoccupied two more significant bits in the same field so thatthe transfer process of command packet is always canceledafter receiving a response packet It is the same with responsepacket transfer after receiving ACKCancel
These two cases show us a situation when the copy is notsent which is different with regard to the typical floodingprotocol This solution reduces the risk of collision Usingthe same solution it is possible to send the copy of the samepacket typemore than once Such situation occurs when aftersending the copy of the packet the same packet is received butwith smaller value of TTLThis situation does not occur veryoften (ie when a packet with a greater number of hops cameearlier than a packet with a smaller number of hops) and itincreases reliability [6 7]
Only the response and command packets can havepayload field Payload field is encrypted by the applicationlayer whereas the rest like overhead is transmitted in openunencrypted mode So it is impossible to change readouts(attack the application layer) but it is possible to generateextra traffic by the extra node which has the same addressas the existing in last-mile smart meter Such an attack onconfidentiality causes deterioration in network performanceand can even make the real smart meter unreachable forexample by sending copies of the response packets with smallvalue of TTL
3 Related Work
In most cases anomaly detection in LV network dependson energy theft detection The oldest method depends onfinding irregularities from the customer billing centre [8]This centralized method does not allow reacting quicklybecause of having historical long-term consumption recordsTherefore in [8] the new decentralized method based onshort periods customersrsquo consumption profiles is proposedIn [9] the authors used a variety of sophisticated techniquesalso for theft detection There are a lot of works which focuson communication security by means of encryption or keydistribution for example [10 11]
This work focuses on anomaly detection in last-mile RFSmart Grid communication network which is not only theresult of the energy theft but also the result of deliberatemali-cious customersrsquo behavior or simply unconscious disturbingactions coming from other systems There is a similar work[12] in which anomaly detection is realized neither in thecentral point nor in electricitymeters but in a simple wayTheproposedmethods of anomaly detection presented in [12] aremostly dedicated for thefts detectingwhilewe focused on anyanomaly detection in communication
Anomalies in communication may be caused by variousfactors for example a human or independent of humanactivity and unintentional or intentional actions such astheft for instance There are quite a lot of works dedicated
4 Journal of Sensors
to anomaly detection in communication networks also inSmart Grid communications systems [13ndash16] including thelast-mile area of their communication networks Howeverin these works the authors focus on anomaly detectionin an IP network where also for smart metering last-milenetwork the data is carried over IP if PLC PRIME or G3interface was implemented [17] We used RF technology forlast-mile network where IP technology implementation wasnot possible because it would lengthen the radio frames andmake the radio transmission unreliable
In literature most anomaly detection systems are focusedon anomalies in power distribution systems such as transmis-sion line outages unusual power consumption and momen-tary and sustained outages [18] In our work we proposedanomalyattack detection system in last-mile RF Smart Gridnetwork (not in IP network) We proposed the two-stepmethod of anomaly detection dedicated for last-mile RF com-munication network consisting of nodes which are based onshort-distance devices with the memory deficit and reducedprotocol stack that is one protocol both for the data link layerand for the network layer
4 Security in Smart MeteringCommunications Network
Ensuring security and protection of data collected by thesmart metering systems is an exceptionally essential elementof the SMCN solutions It is obvious that data gatheredby smart meters say much about private aspects of therecipientsrsquo lives Moreover having additional informationsuch as sequences of readings types of devices or the numberof inmates it is easy to create a precise profile of daily livingactivities of the observed recipients which in consequencemay lead to serious abuses [19 20]
The threats coming from the recipients themselves whohave the smart metering infrastructure are not a less impor-tant security problemThe recipients can perform destructiveactivities on AMI which consist in disturbing data saved inthe meter reconfiguration of settings and parameters of thecounter disruption of data transmission or replacement ofthe internal counterrsquos software so that it conveys understatedvalues of consumed energy [9 12 21]
However what appears to be a more serious problem isprotection against cyberattacks [22] A large-scale applicationof smart metering creates new entering possibilities for anunauthorized use by information systems Joining of smartmeters with information networks of energy companiesenergy sellers and companies managing distributed gen-eration is essential for proper functioning of smart powernetworks Thus every meter becomes a potential enteringpoint for a cyberattack [23] Protection of smart networksagainst such attacks seems to be a more complex task andmuch more difficult to solve in comparison with ensuringsecurity to data collected by smart meters or prevention fromthe usersrsquo abuses
Cyberattacks onto the SMCN security may be dividedinto two elementary groups passive and active attacks Thepassive ones are all the attempts of an unauthorized accessto data or the SMCN infrastructure in which the attacker
does not use emission of signals which may disturb or evendisenable correct work of the system Active attacks on theother hand are all the attempts of an unauthorized accessby the attacker to data or the SMCN systemrsquos infrastructurewith the use of emission of any signals or activities that canbe detected [24ndash26]
While performing a passive attack onto the SMCN theattacker disguises their presence and tries to obtain access tothe transmitted data by passive monitoring of the networkFor protection against such incidents different cryptographicmechanisms are often used Another passive form of attackonto the SMCN is activities aiming at obtaining an analysisof the traffic within the network In this case the attackerrsquosintention is not acknowledging the content of transmitteddata packets but is gaining knowledge about topology ofthe wireless sensor network Due to the above collectinginformation on the basis of traffic analysis in the SMCN givesthe intruder knowledge about the networkrsquos critical nodeswhich ensure its proper work [25]
Contrary to the above presented passive methods ofattack onto the SMCN by using active attack forms theintruder directly or indirectly influences the content of thesent data andor the networkrsquos operational capabilities [26]Attacks of this kind are easier to detect in comparison to thepassive ones because they have direct impact onto the SMCNperformance quality An effect of an active attack may be forexample degradation of services or in extreme cases lack ofaccess to particular services or even a complete loss of controlover the SMCN network
Active attacks can be divided into three groups [25 26] (i)physical attacks destruction of a node a node manipulationand electromagnetic pulse (EMP) (ii) attacks onto integrityconfidentiality or privacy of data (including unauthorizedaccess to data) (iii) attacks on services (Denial of Service(DoS) or Distributed Denial of Service (DDoS)) and attacksdirected at each SMCN network layer
The physical attacks are direct destructive operations thataim to physically destroy or damage the AMI infrastructureA similar role can be performed by attacks using short-term high-energy electromagnetic pulse (EPM) or high pulsedistortion in the supply network [27 28]
The attacks directed at integrity or confidentiality of dataare exceptionally dangerous because they enable the attackerto gain an unauthorized access to the AMI and to datatransmitted by it One of possible forms of such activity is theSybil attack It consists in compromising the networkrsquos legalnode and the takeover of its identifier together with access tothe AMI infrastructure [29]
Another type of attacks is a Wormhole attack [30] Inthis case the attacker creates additional links and transmitspackets to an unauthorized node in WSN network This typeof attack may have serious impact on routing process andcan be an introduction to other more serious attacks such asldquoman into the middlerdquo attack Overall network performancecan also be downgraded because of inefficient resourceutilization
The DoSDDoS attacks in the SMCN lead to an overloadof the attacked nodes and thereby they disenable acquiringdata from the attacked nodes or they preclude using the
Journal of Sensors 5
services offered by the attacked network Attacks of this kindare usually realized by introducing network traffic which isbigger than it is possible to service They can have differentcharacters for example they may appear in the physical layerand take the form of jamming and in the data link layer theymay flood the network with packets simultaneously leadingto data colliding and necessity to retransmit it Appearanceof the DoS attack in a network layer on the other hand mayconsist in sending packets in the wrong direction [24 31]
To protect against the above-mentioned threats in par-ticular different kinds of active and passive attacks it isnecessary to ensure a high level of security to the SMCNinfrastructure by application of the following rules concern-ing sending information and the used functionalities [32 33]
Confidentiality Data sent by means of the chosen commu-nication standard and in particular sensitive data shouldbe inaccessible to outsiders It means that no person fromoutside can obtain access permissions of the consumer or ser-vice supplier and that the information recipients themselvesdo not have access to the sensitive data allowing performingunauthorized profiling for example do not have access toinformation about performance of particular devices but onlyto aggregated power consumption
Integrity This requirement must ensure that the receivedmessage has not been changed during transmission In caseof last-mile networks integrity has impact on proper andnot delayed data transmission Change in the informationcontent as a result of interference or a hackerrsquos attack couldcause rupture in communication and activation of the wrongdevice
Authorization This operation is used for identification ofdevices and nodes and verification of the source or originof the data in the network Authorization is essential at thelevel of administrative task realization in the network Whatis exceptionally important is proper authorization of numer-ators of the AMI and particular networkrsquos devices because itconditions correct performance of the system as a whole
Accessibility This concerns access to the network even incases of attacks and possible damage to the devices The in-frastructure should be designed in such a way that its re-sources for example computational capabilities and mem-ory would enable full functionality with maximum processinvolvement of its elements
Time Sensitivity Every sent piece of information offsetby a particular fixed time window may become uselessThe network must retain the ability to communicate withcertain time delays In case of home metering infrastructuretime sensitivity is connected to response time that is timecounted from the service claim to proper receiverrsquos responseAssurance of appropriate response time conditions properrealization of the claimed service
The problem of advancedmetering infrastructurersquos digitalsecurity is a complex and difficult task to realize in prac-tice It requires designing and introducing high efficiency
mechanisms of safety and security in order to provide con-fidentiality and integrity of data preventing abuse causedby recipients as well as detection and neutralization ofattacks One of the possible solutions to so-stated issue isimplementation of abnormal behavior detection system forparticular SMCN parameters which points at a possibility ofa given abuse appearance
The above-mentioned solution is the main focus of thepresent paper
5 Methodology of Anomaly Detection SystemThe Proposed Solution
In order to ensure appropriate level of security to criticalinfrastructures such as Smart Metering CommunicationsNetworks in particularAMI last-mile network it is necessaryto monitor and control those infrastructures simultaneouslyOnly this type of activities enables detecting and minimizingthe results of different kinds of abuses coming from the inside(unauthorized andor destructive actions of the recipient) aswell as the outside (attacks realized by cybercriminals) of theprotected infrastructure [19]
The most often implemented solutions realizing so-stated aim are the IDSIPS systems (Intrusion Detection Sys-temIntrusion Prevention System) that is mechanisms ofdetection (IDS) and preventing intrusions (IPS) operating inreal time [34] In the hierarchy of critical infrastructure theyshould be placed just after security elements such as firewallsIDS systems are used for monitoring threats and incidentsof safety violation and for informing about their occurrenceThe IPS systems on the other hand additionally take actionsto prevent an attack minimize its effects or actively respondto security violation Thus the mentioned solutions allowfor an increase in the level of protection of the AMI infras-tructure by means of strengthening communication controlbetween its different elements
The IDS systems may be classified as belonging to one oftwo groups using different techniques of threat identificationThe first one is based on detection of known attacks bymeansof defined specific (for them) features called signatures Thesecond on the other hand is based on an idea of monitoringthe systemrsquos normal operation in order to detect anomalieswhich may proclaim an intrusion [34 35]
The basic advantage of methods based on anomaly detec-tion is the ability to recognize unknown attacks (abuses)These methods use knowledge of not how a particular attacklooks like but of what does not correspond to definednorms of the network traffic Therefore the IDSIPS systemsfounded on the use of anomalies are more efficient and effec-tive than systems using signatures in the process of detectingunknown new types of attacks (abuses) [36]
Bearing in mind the above for the purpose of thisresearch paper we decided to detect anomalies by means ofperforming an analysis of deviations from the real AMI last-mile traffic parameters with regard to the estimated statisticalmodels (Figure 2) In our method detecting anomalies isperformed in two steps In the first stage three exponentialsmoothing models are formed as a basis for the AMInetwork traffic parameters For this reason prior to creating
6 Journal of Sensors
Smart meter
Trac concentrator
Trac concentrator
Last-mile network
Last-mile network
APN access pointname server
ADS model parameters calculation
ADS for smart metering network
Remove outliervalues from AMItrac features
Calculation of exponentialsmooth models
Calculation ofBollinger Bands
ADS database ofexponential smoothmodels together withBollinger Bands
Online anomaly detection steps
AMI tracfeatures selection
AMI tracfeatures calculation
Comparision of online calculatedAMI network features to reference model
Anomalydetectionreport
Figure 2 General overview of the proposed anomalyattack detection method for AMI smart metering network
the models features of the network traffic are chosen andcalculated by means of outliers detection and their exclusionNext the exponential smoothing models of parameters areestimated (on the basis of features of the analyzed AMInetwork traffic) In consequence we obtain statistical modelswhich serve as a basis for anomaly detection method In thesecond stage anomaly detection systems choose and estimateappropriate features of the network traffic after which theycompare the differences between the real network traffic andthe calculated statistical models to perform AMI networkparameters assessment
In Figure 2 we can see a block scheme of the pro-posed anomaly detection method Traffic from AMI last-mile network is captured by means of APN gateway Theproposed method is divided into two main steps First stepconsists of calculation of model reference parameters (theelimination procedure of outliersrsquo observations is realizedat this stage) from extracted AMI network traffic featuresModels for AMI network traffic features can be updatedwhenthe model is not up to date because of different reasons forexample network architecture changes Model parametersare calculated based on three different exponential smoothingmodels and Bollinger Bands calculation (see Sections 52 and53) Reference models are used for comparing online theextracted AMI network traffic features in the second stepof the proposed method When calculated online values ofAMI network exceed parameters stored in the ADS referencemodel The database anomaly report is detected for a giventraffic feature (more explanation is presented in Section 6)
51 Outliers Detection and Elimination Cookrsquos DistanceDue to the nature of the Smart Metering CommunicationsNetworksrsquo infrastructure (which is similar in many ways toWSN) there is a real threat of significant fluctuations ofthe analyzed traffic parameters in a network that is highlikelihood of occurrence of outliers Origin of the mentionedfluctuations may vary for example radio wave propaga-tion (environmental source) changes to the infrastructure(technical source) hardware damage an aftermath of anetwork attack and intended deceit of users Construction
of a statistical model on a set of such data may lead tomany unfavorable consequences It is then highly likely thatinference predication and decision-making process basedon such a model will be burdened with big errors andthe created model will not reflect the main mechanismsregulating behavior of the analyzed phenomenon Thereforeevaluation of influence of particular observations onto thefinal result should be an essential element of initial dataanalysis It would allow detecting outliers and eliminatingthem from the data set
In our approach identification of outliers in the analyzedSMCN traffic parameters is performed by means of a methodusing Cookrsquos Distance [37] The essence of this method isestimation of the distance which states the level of datamatching for two models (i) a complete model whichincludes all observations from the learning set and (ii) amodel built on a set of data from which one 119894 observationwas omitted
119863119894 = sum119899119895=1 (119895 minus 119895(119894))2
119898 sdotMSE (1)
where 119895 is the forecasted value of 119909 variable for observationsnumber 119895 in the complete model that is built on the wholelearning set 119895(119894) is the forecasted value of 119909 variable forobservations number 119895 in the model built on the set 119884119895(119894)where 119894 is number of observations that were temporarilydeactivated MSE is the mean-model error and 119898 is thenumber of parameters used in the analyzed model
For Cookrsquos distance 119863119894 threshold value above whichthe given observation should be treated as an outlier incompliance with criterion (1) 1 is accepted or alternatively
4119899 minus 119898 minus 2 (2)
where 119899 is the number of observations in the learning set
52 The Exponential Smoothing Models for Estimation of AMITraffic Features Value The exponential smoothing methods
Journal of Sensors 7
are a wide range of statistical models with different assump-tions and complexity levels which emerge from a commonidea of creating forecasts by means of weighted movingaverages The common denominator of those methods isassigning (exponentially) weight decreasing with distancein time to past observations in the process of setting newforecast of a future observation [38]
It is easy to notice that exponential smoothingmodels arebased on a sensible assumption that the future value dependson not only the last observed value but also their whole seriesof the past values At the same time the influence of old values(previous) is smaller than the influence of the new values [39]
Great practical importance of exponential smoothingmodels is based on the fact that they are suitable for forecastconstruction not only in conditions of stabilized developmentof phenomena to our interest but also when this develop-ment is irregular characterized by trendrsquos fluctuations Inthese models solid analytic trends are not accepted To thecontrary it is assumed that for every period assessmentof the trendrsquos level and possible periodical fluctuations arebuilt as some average from these kinds of evaluations madein previous periods [38 40] Among many representationsknown in literature in this paper the following modelswill be used Davies and Brown [41] Holtrsquos linear [42] andWintersrsquo [43] models It is due to a different representationof the compositional models of the analyzed time series andwillingness to determine possibly the best model for thepresented method of anomaly detection
521 BrownrsquosModel A simplemodel of exponential smooth-ing otherwise called Brownrsquos model [41] is one of themethods most often used in case of a time series withfixed or very weak trend when the series does not showdevelopmental trend and fluctuations of its values resultfrom random factorsThis method consists in smoothing thetime series of the forecasted variable by means of weightedmoving average however the weights are defined accordingto exponential rule
This model can be described by means of the followingrecurrent formula
1198651 = 1199091 (3)
119865119905 = 120572119865119905minus1 + (1 minus 120572) 119865119905minus1 (4)
where 1199091 1199092 119909119899 are values of the forecasted series 119865119905 isthe value of the forecast in time 119905 and 120572 is a parameter ofthe model so-called smoothing constant with the value of120572 isin [0 1]
The conclusion from (4) is that the value of forecast intime 119905 depends in recurrent manner on the value of the timeseries and forecasts for times 119905 minus 1 119905 minus 2 1 As the value offorecast 1198651 necessary for construction of the model we mostoften accept the initial value of the variable forecasted in thetime series that is 1199091 or arithmetic average of few first valuesof the variable 119909 from the time series
The value of coefficient 120572 influences the degree of a timeseries smoothing so if 120572 asymp 1 then the constructed forecastwill highly count the ex post errors of the previous forecasts
However in the opposite case when 120572 asymp 0 the built forecastwill employ those errors to a small extent Brown assumedthat the parameter 120572 should equal 2(119899 + 1) where 119899 is thenumber of observations [44]
Because the size of coefficient 120572 has impact on the qualityof the predictive model and the size of forecastsrsquo errors it isimpossible to point arbitrarily the best value of that coefficientfor every data Therefore this problem can be defined as anoptimization task that is we are looking for such an forwhich
119904 () = min120572isin[01]
119904 (120572) (5)
where 119904(120572)denotes an objective function which characterizesthe standard forecast error
The often used objective function is
119904 (120572) = 1119899119899sum119905=1
1003816100381610038161003816119865119905 minus 1199091199051003816100381610038161003816 (6)
which describes mean absolute forecast error Its form isessential because minimization of the objective function(5) is minimization of the sum of absolute deviations Thisproblem is easy to check for computationally simpler linearprogramming problem
522 Holtrsquos Linear Model For smoothing and forecastinga time series in which developmental model and trend ofrandom fluctuations may be present Holtrsquos model [42] ismost often used It is described by means of two parameters120572 and 120573 and it then takes the following form
1198651 = 11990911198781 = 1199091 minus 1199090119865119905 = 1205721199091 + (1 minus 120572) (119865119905minus1 + 119878119905minus1) 119878119905 = 120573 (119865119905 minus 119865119905minus1) + (1 minus 120573) 119878119905minus1
(7)
where 1199091 1199092 119909119899 are the values of the forecasted series119865119905 is the smoothed value of the time series 119878119905 describes thesmoothed trendrsquos growth value in the moment of time tvariables 120572 and 120573 are the modelrsquos parameters and 119905 indexesthe consecutive time moments
The values of119865119905 and 119878119905 are calculated in recurrentmannerThe forecasts of the future time seriesrsquo values however aredetermined in the following way
119909lowast119899+119896minus1 = 119865119899minus1 + 119896 sdot 119878119899minus1 119896 = 1 2 3 (8)
Holtrsquos modelrsquos parameters 120572 and 120573 are chosen in sucha way that they minimize possible errors of the expiredforecasts For this reason specific values of these parametersare taken and determined in compliance with dependency(8) with the assumption that 119899 = 119905 and 119896 = 1 are the expiredforecasts
119909lowast119905 = 119865119905minus1 + 119878119905minus1 (9)
8 Journal of Sensors
for time moments 119905 where 119905 = 2 3 119899 minus 1 on the basisof series values from the previous period 1199091 1199092 119909119905minus1These forecasts can be compared to factual values of the series119909119905The obtained differences are errors of the expired forecastswhich are given by a model for the taken parameters 120572 and120573 As a measurement of the methodrsquos quality the average oferrors of the expired forecasts should be acknowledged Itmay be a linear average
1198691 = 1119899 minus 2119899minus1sum119905=2
lceil119865119905minus1 + 119878119905minus1 minus 119909119905rceil (10)
or root mean square
1198692 = radic 1119899 minus 2119899minus1sum119905=2
(119865119905minus1 + 119878119905minus1 minus 119909119905)2 (11)
Finally it is necessary to choose from all possible 120572 and120573 parameter values such data that provides the lowest errorvalue 1198691 or 1198692 By doing so optimal parameters values anda measure of the forecast error are determined for the takenmodel It is commonly accepted that 120572 isin [0 1] and 120573 isin [0 1]523 Wintersrsquo Model Wintersrsquo model is a generalized Holtrsquosmodel form It is used for forecasting and smoothing atime series in which a seasonal component developmenttrend and random fluctuations may occur There are twomost often used types of Wintersrsquo model (i) multiplicativemodel when the level of seasonal fluctuations around thetrend increases or decreases (more precisely when the relativelevel of seasonal fluctuations is approximately constant) and(ii) additive model when the level of seasonal fluctuationsaround a weak trend or a constant level does not changethat is when the absolute level of seasonal fluctuations isapproximately constant For the purpose of the presentedsolution only the additive model will be described and used
Wintersrsquo [43] model is described by means of threeparameters 120572 120573 and 120574 representing respectively thesmoothing constant for the trendrsquos level the change in thetrendrsquos level and seasonal fluctuations For so-describedparameters it then takes the following form
119865119905minus1 = 120572 (119909119905minus1 minus 119862119905minus1minus119903) + (1 minus 120572) (119865119905minus2 + 119878119905minus2) 119878119905minus1 = 120573 (119865119905minus1 minus 119865119905minus2) + (1 minus 120573) 119878119905minus2119862119905minus1 = 120574 (119909119905minus1 minus 119865119905minus1) + (1 minus 120574)119862119905minus1minus119903
(12)
where 1199091 1199092 119909119899minus1 are values of the forecasted series 119865119905minus1is the smoothed value of the forecast variable in moment 119905minus1after elimination of the seasonal values 119878119905minus1 describes withevaluation the increment trend in the moment of time 119905 minus 1119862119905minus1 is evaluation of the seasonal index in the moment 119905minus1 119903is the length of the seasonal cycle (the number of phases in thecycle where 1 le 119903 le 119899) variables 120572 120573 and 120574 are the modelrsquosparameters with values from the range [0 1] and 119905 is an indexof the following moments of time
The forecast 119909lowast119905 in the moment of time 119905 is given by thefollowing dependency
119909lowast119905 = 119865119899 + 119878119899 (119905 minus 119899) + 119862119905minus119903 119905 gt 119899 (13)
Parameters 120572 120573 and 120574 are chosen similarly as in Holtrsquosmodel minimizing the mean square error of the expiredforecasts or values close to 1 are chosenwhen the componentsof the time series change quickly or values close to 0 arechosen when the seriesrsquo components do not show quickchanges
As values of 1198651 1198781 and1198621 we take respectively the valuefrom the time series corresponding to the first phase of thesecond cycle (or the average value from the first cycle) thedifference of the average values from the second and firstcycles and the quotient value of the variable in the first cyclein relation to the average value in the first cycle
53 Estimation of the Forecast Variability Bollinger BandsBollinger Bands is a tool of technical analysis invented byBollinger at the beginning of the 80s of the 20th century[45] It was created on the basis of observation of financialinstruments volatility It is composed of three elements (i)the middle band (core) which is 119899 periodic moving average(ii) the upper band being 119896 times of 119899 periodic standarddeviation above the middle band and (iii) the bottomband being 119896 times of 119899 periodic standard deviation belowthe middle band The main idea of this tool is the rulethat when data variability is low (their standard deviationdecreases) then the bands shrink However in case the datavariability increases the bands expand Thus this tool showsdynamics of data variability It usually defaults to the valuesof parameters 119896 = 2 and 119899 = 20 [46] Such approach is basedon the assumption that in data of normal distribution thearea of two standard deviation widths includes 95 percent ofall observations
In the presented solution we used Bollinger Bands toestimate forecasts variability of the exploited statistical mod-els As the middle band (the core) we adopted the valuesof statistical modelsrsquo forecasts 119896 was the double standarddeviation and 119899 = 15 (due to the 15-minute analysis win-dows) Figure 3 presents an exemplary PPM signal andBollinger Bands created on its base (for Holtrsquos model)
54TheCondition ofModelrsquos Parameters Update It is possiblethat data in the analyzed time series will fluctuate due to thenature of the AMI network traffic parameters The reasonsfor such a phenomenon are to be found in possible changesof the AMI network infrastructure (ageing of devices andreplacementwith newothermodels) or emergence of perma-nent obstacles which have significant impact on the trans-mitted radio signal These factors should cause adapting ofthe proposed anomaly detection method to the changingconditions (which are not an aftermath of any abuses) One ofthe possible solutions to so-stated problem can be an updateprocedure of the reference statistical models realized on newdata sets which contain the subject fluctuations
The condition for creation of a new reference modelshould be detection of a significant and possibly permanentstatistical variability in the analyzed data set (elements of atime series) Assuming a close-to-normal data distributionwe can deduce that in the range of width of six standarddeviations there is over 99 percent of data Thus if we define
Journal of Sensors 9
0 100 200 300 40030
40
50
60
70
Forecast from Holtrsquos method together with Bollinger Bands
Time (min)
Pack
ets p
er m
inut
e
Holtrsquos linear trendDown Bollinger BandUpper Bollinger Band
Figure 3 Exemplary Bollinger Bands for packets perminute (PPM)network feature
the average on the basis of the forecast set of the givenexponential smoothing model and the standard deviationis estimated for the real values of the analyzed data then agreat degree of not fulfilling the above stated condition mayproclaim that the statistical nature of the analyzed data haschanged
Due to the above the following condition can be for-mulated If it is not satisfied the reference model should beupdated
119909119894 isin (120583 minus 3120590 120583 minus 3120590) 119894 = 1 2 119899 (14)
where 1199091 1199092 119909119899 is a time series limited by 119899-elementsanalysis window 120583 is the average calculated on the forecastsof the given reference model in the analysis window and 120590 isthe variance of the tested time series elements in relation tosuch an average
In result of conducting many experiments in the pre-sented solution we adopted the size of analysis window 119899 =15 and an assumption that only not satisfying condition (14)in over 30 of analysis windows in a time period of a weekcauses an effect in the form of reference model update
6 Experimental Installation and Results
Figure 2 presents general overview of the proposed anomalydetection method Traffic from 70 power meters distributedacross eight buildings is captured by APN gateway throughan IP link The proposed method is divided into two mainssteps calculation of ADS model parameters and onlineanomaly detection In both steps we have to extract AMItraffic features proposed in Table 1 After that we calculateinitial reference models for every traffic feature Models arecalculated for a period of one week and time is dividedinto 15 minutesrsquo analysis windows Every traffic feature isorganized as one-dimensional time series First substep inmodel parameters calculating removes outlier values (seeSection 51) from every traffic feature in order to remove
Table 1 AMI network traffic features captured from sensor networkgateway
Network feature AMI network traffic feature description
NF1RSSI received signal strength indication for AMI
power meter [dBm]NF2 LQI link quality indicator value (values 0ndash127)NF3 PER packet error rate per minute []NF4 PPM number of packets per minuteNF5 TTL packet time to live value
suspicious values from the model calculation After that wecalculate exponential smooth models with the use of threeexponential smooth models Brown Winters and Holt (seeSection 52)
In the next step we compute Bollinger Bands (seeSection 53) for achieving network traffic features variabilityintervals In the end we save models parameters togetherwith associated Bollinger bands to database of referencemodels In the second step of the proposed method wecompare values of online extracted AMI network features toreference models stored in the ADS database ADS modelgives us variability intervalvariability canal for a given trafficfeature When the online calculated AMI traffic featuresvalues do not exceed interval set by the reference model weassume that there is no anomalyattack for a given trafficfeature When network traffic exceeds values set by thereferencemodel an anomaly detection report is generated fora given traffic feature
The method proposed so far would not be resistant toAMI network changes like increasing number of sensorsor topology changes In these cases the reference modelswill not be updated and the number of FP indicators wouldincrease in time That is why we propose a trigger conditionwhich is responsible for initiation of model parametersrecalculation (see (14)) When the proposed condition is notsatisfied in 30 of 15 minutesrsquo analysis windows (30 ofanalysis windows in a period of one week) we recalculatetraffic profiles for a period of one week (network traffic valuesare always stored for a period of oneweekwhich iswhywe canalways recalculate traffic profiles when condition from (14)is not satisfied) New ADS network profiles are always activesince the beginning of a new week
61 Experimental Setup and Results In this section weshowed experiments and results obtained in real-world testof the AMI powermeter networkWe proposed four differentscenarios that trigger anomalyattack in our test networkWeproved that the proposed anomalyattack detection methodcan be useful in detection of unwanted situations in the AMImeasurement network
The anomaly detection method presented in the articlewas evaluated bymeans of real-world installation of AMI net-workTheAMI network trafficwas captured from installationplaced in our university building [47]The network consistedof 70 sensor nodes installed within energy power meters (seeFigure 4) Sensors were installed on four floors (see Figure 6)
10 Journal of Sensors
Table 2 DR [] and FP [] for anomaliesattacks performed on AMI network with Scenario 1
Feature Holt Winters Brown DescriptionDR [] FP [] DR [] FP [] DR [] FP []
NF1 9240 880 9020 980 8810 1040 Significant impact on NF1 in Scenario 1NF2 9600 560 9410 750 9020 980 Significant impact on NF2 in Scenario 1NF3 9100 940 8840 1130 8630 1270 mdashNF4 8140 920 8910 1110 8620 1260 mdashNF5 7220 1020 7010 1260 6820 1280 mdash
Figure 4 Opened power meter with signed WSN communicationradio module
Figure 5 Cluster of electricity power meters in building 23
located in eight separate buildings In Figure 5 we can seea cluster of electricity meters installed in building 23 (seeFigure 6) A traffic concentrator was placed on the secondfloor Traffic from the AMI network was captured from IPconnection of the traffic concentrator signed by red octagonlocated in building number 24 (see Figure 6) In the next stepwe extract five traffic featuresNF1ndashNF5 (Table 1) where everytraffic feature is represented by one-dimensional time seriesvalues
We used these traffic features for anomalyattack detec-tion by means of the proposed statistical algorithm
First two features describe the quality of the radio linkNF1 RSSI [dBm] (higher value stands for better signalrsquosstrength) and NF2 LQI value (values change from 0 to 127lower values indicate higher link quality) LQI characterizesstrength and quality of the received packet (in other wordshow easily the received signal can be demodulated) contraryto RSSI which gives us information about the receivedsignal strength (it is not the measure of ability to decodesignal) where radio frequency power can originate fromarbitrary source such as Gaussian Frequency Shift Keying(GFSK) other ISM systemsWi-Fi Bluetooth or background
radiation NF3 andNF4 features give us two values in a periodof one minute packet error rate (PER) per minute (numberof corrupted packets received by concentrator)(number ofall packets received by the concentrator) in time interval (inour case it was oneminute) and PPM number of packets perminute NF5 carries information about TTL value of packetsreceived by a traffic concentrator The proposed anomalydetection method was designed especially for data link andnetwork layers Because of security restrictions we do nothave access to the application layer payload Application layerdata is in our case available only for the energy supplierWe focused on detection of anomaliesattacks in layer 2and layer 3 because there are not many anomaly detectionsolutions that work in last-mile AMI network Additionallypredictable amounts of traffic made it a great candidate foranomaly detection and we use this feature Traffic is actuallysmall taking into account computing power of the trafficconcentrator processor but it is also large enough not toimplement anomaly detection in smart meter
We created different anomaly and attack scenarios foranomaly detection in the AMI network and we selected fourof them to evaluate the proposed method
Scenario 1 Radio Frequency Interferences (RFI) and con-ducted interferences through power mains and Electromag-netic Interferences (EMI)
Scenario 2 Existence of natural and human-made obstacles
Scenario 3 Power meter intentional damages
Scenario 4 Coordinated attacks on power meter AMI net-work
Scenarios used for anomalyattack detection have variousimpacts on AMI network traffic features proposed in Table 1In Scenario 1 we consider distortions caused by for exampledifferent radio ISM systems and conducted EMI distortionscarried by physical power line A conducted EMI distortionmay come from devices connected to power mains likeelectric engines switching power supply welding machinesor any industrial environment Parts of conducted EMIdistortions are presented in IEC standard 61000-4-4 [48] Wesimulated some distortions that belong to both groups
Distortions from Scenario 1 have biggest impact onnetwork features NF1 (RSSI) and NF2 (LQI) Detection rateand false positive partial results for Scenario 1 are presentedin Table 2
Journal of Sensors 11
25
23
22
24
27
21
31
26
Smart meter on the ground floorSmart meter on the rst floorSmart meter on the second floor
Smart meter on the third floorTrac concentrator on the second floor
Figure 6 Physical layout of power meters of AMI network in the university building [5]
Table 3 DR [] and FP [] for anomaliesattacks performed on AMI network with Scenario 2
Feature Holt Winters Brown DescriptionDR [] FP [] DR [] FP [] DR [] FP []
NF1 8820 820 8610 1010 8320 1180 Significant impact on NF1 in Scenario 2NF2 9240 520 9030 730 8750 940 Significant impact on NF2 in Scenario 2NF3 8220 960 8020 1120 7640 1240 mdashNF4 8020 1010 7810 1210 7630 1260 mdashNF5 8560 1220 8240 1260 7940 1280 mdash
An attack according to Scenario 1 is easy to carry out forexample by using amateur shortwave radio set to the samefrequency as the working channel modulation type doesnot matter The best results in attacking give the transmitterlocalized close to the traffic concentrator or a cluster ofelectricity power meters
Scenario 2 was simulated by locating groups of powermeter sensors on different floors and distant buildings (seeFigure 6) Temporarily placed obstacles like a big truckcan also have an impact on WSN network transmissionLocalization and distance between the AMI power metersensors have impact on every capturednetwork traffic featurePartial results for Scenario 2 can be observed in Table 3
The easiest way to carry out the attack according toScenario 2 is grounding the concentrator antenna or slightlyunscrewing it In our experiments we achieved this effectby reducing transmitting power and increasing the receiverrsquossensitivity simultaneously
Intentional damage from Scenario 3 is caused by powermeter users who want to avoiddelay paying electricity billsor want to bypass power meter or disturb AMI networkoperation Electromagnetic metallic shielding and bypassingof power meter are exemplary methods for disturbing ofthe AMI sensor operation Partial results for this scenarioare presented in Table 4 Intentional damage can be seenespecially for NF3 where PER for a given power meterincreases
In our experiments we simply turned smart meters offfrommains or remotely changed the radio channel frequencyjust to make communication impossible In real situationinstead of power meter intentional damaging the easiestway to achieve the same effect is forcing the fuse protection(before input connector) to act
Scenario 4 takes into account coordinated attacksanom-alies performed on power meters Smart Grid infrastructureWe simulate WSN flooding attack [49] and after that weadd some intermediate sensor in order to perform additionallinks (Wormhole-type attack [30])This type of attackanom-aly has the biggest impact on NF4 PPM (number of packetsper minute) and NF5 TTL (packet time to live) valueSubsequent partial result can be seen in Table 5 In thisscenario traffic features (NF1ndashNF3) did not give us usableinformation for anomalies detection so they can be omittedin this case
Attacks according to Scenario 2 were emulated by uswith the use of smart meter service terminal which is amobile specific kind of the traffic concentratorWe sent fromservice terminal to all power meters a ldquoset date amp timerdquocommand in broadcast flooding mode every 5 seconds
Attacks described in Scenarios 1ndash3 require physical ac-cess for example in case of EMI distortions conductedthrough power mains or enough proximity to a selected partof physical infrastructure and in case of EMI distortions con-ducted through radio Power meter shielding also requires
12 Journal of Sensors
Table 4 DR [] and FP [] for anomaliesattacks performed on the AMI network with Scenario 3
Feature Holt Winters Brown DescriptionDR [] FP [] DR [] FP [] DR [] FP []
NF1 8640 860 8410 1030 8070 1260 mdashNF2 8840 840 8520 980 8310 1170 Significant impact on NF2 in Scenario 3NF3 9050 640 8720 880 8560 1090 Significant impact on NF3 in Scenario 3NF4 8230 1150 7950 1240 7640 1280 mdashNF5 8620 1240 8340 1250 8080 1280 mdash
Table 5 DR [] and FP [] for anomaliesattacks performed on AMI network with Scenario 4
Feature Holt Winters Brown DescriptionDR [] FP [] DR [] FP [] DR [] FP []
NF1 mdash mdash mdash mdash mdash mdash Insignificantnegligible for Scenario 4NF2 mdash mdash mdash mdash mdash mdash Insignificantnegligible for Scenario 4NF3 mdash mdash mdash mdash mdash mdash Insignificantnegligible for Scenario 4NF4 9240 650 9020 860 8710 1040 mdashNF5 9050 760 8730 980 8550 1170 mdash
physical access to power meter In case of Scenario 4 forexample flooding attacks on last-mile network can be per-formed remotely by a GPRSIP gateway
The anomaly detectionmethod based on network profileshas a weakness coming from the fact that profiles are agingThis can cause an increase in the false positive (FP) valuesTo alleviate this effect we propose in Section 54 a conditionthat triggers recalculation ofWSNnetwork profilesHoweverthere can still be situations when temporary detection ratesand false positive values can be a little bit worse between theprofilesrsquo update processes These situations may appear whenwe rapidly change the network structure for example byadding entire streets with large number of new powermetersThe proposed trigger will indicate the need to recalculate newprofiles but it will happen with a programmed delay
In order to decrease effectiveness of the proposedanomaly detection solution the attacker needs knowledgeabout anomaly detection algorithms used for profiles calcu-lation when the system recalculates profiles and what kindsof traffic features are extracted from the network traffic Theattacker armed with such knowledge can temporarily dis-turb AMI network operation between recalculations of newprofiles If the attacker has information about traffic featuresused by anomaly detection algorithm he can perform anattack that would not have an impact on the proposed trafficfeatures
Taking into account all four scenarios the overall per-formance of the proposed anomalyattack method for fiveAMI network features is presented in Table 6Most simulatedattacks and anomalieswere detected In case ofDR [] valueschange from 6820 to 9226 while FP varies between 640and 1280 The best results for three simulated scenarios(Scenarios 1ndash3) were obtained for features NF1 and NF2For these scenarios features NF1 and NF2 were the mostuniversal For Scenario 4 NF4 and NF5 features fit better tothe characteristic of simulated anomalous events From thethree evaluatedmodels we achieved the best results for Holtrsquos
Table 6 Overall DR [] and FP [] for anomaliesattacks per-formed on AMI Smart Grid network
Feature Holt Winters BrownDR [] FP [] DR [] FP [] DR [] FP []
NF1 8900 853 8680 1007 8400 1160NF2 9226 640 8987 820 8693 1030NF3 8790 847 8527 1043 8277 1200NF4 8407 932 8423 1105 8150 1210NF5 8362 1060 8080 1188 7848 1253
exponential smoothing model where not only exponentialsmoothing but also forecasting for time series with trend ispossible
Anomaly detection prediction based on Holtrsquos expo-nential smoothing model gives us DR [] values within8362ndash9226 interval and FP [] values changing from 640to 1060 We were able to detect all performed anoma-liesattacks described in the proposed scenarios taking intoaccount all extracted traffic features (it was not possible todetect all anomaliesattacks by means of one traffic feature)In literature there are many various anomaly detectionmethods using different algorithms [36 50 51] applied toWSN networks On the basis of literature analysis we canstate that in general for WSN anomaly detection solutionsFP [] values are generally less than 10 [36 50 51] Takinginto accountHoltrsquos exponential smoothingmodel we achieveFP values changing from 640 to 1060 so we can state thatthis interval is acceptable for anomaly detection class securitysystems
7 Conclusions
Providing an adequate security and protection level of datasourced by intelligent measuring systems is currently anintensively examined and developed question for the worldrsquos
Journal of Sensors 13
leading seats of learning It is obvious that the AMI networksdue to their nature are exposed to a significant number ofthreats originating from both outside and inside of theirown infrastructure Data collected recurrently by intelligentmeters contain much information about private aspects ofrecipientsrsquo lives which may be used for realization of seriousabuse Other but not less important problems of securitywithin the AMI infrastructure are dangers coming fromthe recipients themselves In some cases they may performactionswhich are destructive for theAMI Such activitiesmayconsist in disturbing data saved in the meter or hamperingtheir transmission However the key security problem isproviding an adequate level of protection against externalabuse that is safety from cyberattacks In this case everyelement of the SMCN infrastructure AMI in particular maybecome a potential attack point
Growing level of complexity globalization of range anddynamically increasing number and nature of new attacksimpose a change in approach towards realization of networksecurity systems Currently most often implemented mech-anisms are the methods of detection and classification ofabnormal behaviors reflected in the analyzed network trafficparameters An advantage of such solutions is protectionagainst attacks unknown so far often directed towardsdefined resources of critical infrastructures or simply beingthe so-called zero-day exploits Anomaly detection systemsin those cases may play the key role Their task is thendetection (for the purposes of automatic response) of nottypical behaviors in the network traffic which constitutesymptoms of diverse abuse originating both inside andoutside the secured infrastructure
The article presents an effective solution to the problemof anomaly detection in the network traffic for the criticalmeasurement infrastructure The structure of the AMI net-work built for the purpose of the experiment is presentedand described Crucial security problems which have adirect impact on proper operation of the advanced measure-ment infrastructure are discussed A two-stage method wasproposed for anomaly detection in the examined sensorynetwork traffic represented by proper time series In thefirst stage any possible outlying observations in the analyzedtime series were detected and eliminated The purpose ofsuch operation was to prepare correct data for creation ofstandard statistical models based on exponential smoothingEstimation of possible fluctuations of modelsrsquo forecasts wasrealized by means of suitably parameterized Bollinger BandsAn update procedure was also proposed for the standardmodels in case serious fluctuations appear in the real networktraffic The second stage consisted in examining statisticalrelations between the standard traffic model and its realvariability in order to detect abnormal behavior which couldsignify an attempt of some abuse for example a networkattack
In the article we proposed a method for anomalyattackdetection in data link and network layers We did not analyzeapplication layer because in our case the application layerpayload is only available for energy supplier We focusedon layer 2 and layer 3 because there are not many anomalydetection solutions in this area
The proposed method of anomaly detection was evalu-ated with the use of real AMI network which consists of70 power meter nodes located in eight distant buildingsAfter network traffic features extraction we checked threedifferent statistical models based on exponential smoothingtogether with Bollinger Bands On the basis of four practicalscenarios we can conclude that the most promising resultswere achieved for Holtrsquos exponential smoothing model Theproposedmodel fits to the characteristic of the network trafficfeatures extracted from the AMI network In case of Holtrsquosmodel not only is exponential smoothing possible but alsowe can forecast time series with trend We also propose asolution for aging reference models We propose a condition(see (14)) for triggering recalculation of model parameters
For future work we are planning to examine usabilityof statistical models for anomaly detection in AMI powermeter network using Power Line Communication (PLC)module instead of radio communication In the next step wewould like to propose anomaly detection solution for hybridAMI power meter network using at the same time radiocommunication and PLC communication modules
Conflicts of Interest
The authors declare that there are no conflicts of interestregarding the publication of this paper
Acknowledgments
This research was supported by the National Centre forResearch and Development and by the National Fund forEnvironmental Protection and Water Management underthe realized GEKON program (Project no 214093) and itwas also supported by the Polish Ministry of Science andHigh Education and Apator SA Company under Contract04409CZR6-62009
References
[1] S Finster and I Baumgart ldquoPrivacy-aware smart metering asurveyrdquo IEEE Communications Surveys and Tutorials vol 17 no2 pp 1088ndash1101 2015
[2] B E Bilgin S Baktir andV C Gungor ldquoCollecting smartmeterdata via public transportation busesrdquo IET Intelligent TransportSystems vol 10 no 8 pp 515ndash523 2016
[3] P Kulkarni S Gormus Z Fan and B Motz ldquoA mesh-radio-based solution for smart metering networksrdquo IEEE Communi-cations Magazine vol 50 no 7 pp 86ndash95 2012
[4] J N Al-Karaki andA E Kamal ldquoRouting techniques inwirelesssensor networks a surveyrdquo IEEEWireless Communications vol11 no 6 pp 6ndash28 2004
[5] P Kiedrowski B Dubalski T Marciniak T Riaz and J Gutier-rez ldquoEnergy greedy protocol suite for smart grid communica-tion systems based on short range devicesrdquo in Image Processingand Communications Challenges 3 vol 102 of Advances inIntelligent and Soft Computing pp 493ndash502 Springer BerlinGermany 2011
[6] P Kiedrowski ldquoTowardmore efficient andmore secure last milesmart metering and smart lighting communication systems
14 Journal of Sensors
with the use of plcrf hybrid technologyrdquo International Journalof Distributed Sensor Networks vol 2015 Article ID 675926 9pages 2015
[7] P Kiedrowski ldquoErrors nature of the narrowband plc transmis-sion in smart lighting LV networkrdquo International Journal ofDistributed Sensor Networks vol 2016 Article ID 9592679 9pages 2016
[8] C Liao C-W Ten and S Hu ldquoStrategic FRTU deploymentconsidering cybersecurity in secondary distribution networkrdquoIEEE Transactions on Smart Grid vol 4 no 3 pp 1264ndash12742013
[9] S Amin G A Schwartz A A Cardenas and S S SastryldquoGame-theoretic models of electricity theft detection in smartutility networks providing new capabilities with advancedmetering infrastructurerdquo IEEEControl Systems vol 35 no 1 pp66ndash81 2015
[10] X D Wang and P Yi ldquoSecurity framework for wireless com-munications in smart distribution gridrdquo IEEE Transactions onSmart Grid vol 2 no 4 pp 809ndash818 2011
[11] J-L Tsai and N-W Lo ldquoSecure anonymous key distributionscheme for smart gridrdquo IEEE Transactions on Smart Grid vol 7no 2 pp 906ndash914 2016
[12] A K Marnerides P Smith A Schaeffer-Filho and A MautheldquoPower consumption profiling using energy time-frequencydistributions in smart gridsrdquo IEEE Communications Letters vol19 no 1 pp 46ndash49 2015
[13] Y Guo C-W Ten S Hu and W W Weaver ldquoPreventive main-tenance for advanced metering infrastructure against malwarepropagationrdquo IEEE Transactions on Smart Grid vol 7 no 3 pp1314ndash1328 2016
[14] R Berthier D I Urbina A A Cardenas et al ldquoOn the prac-ticality of detecting anomalies with encrypted traffic in AMIrdquoin Proceedings of the 2014 IEEE International Conference onSmart Grid Communications SmartGridComm 2014 pp 890ndash895 Venice Italy November 2014
[15] A-H Mohsenian-Rad and A Leon-Garcia ldquoDistributed inter-net-based load altering attacks against smart power gridsrdquo IEEETransactions on Smart Grid vol 2 no 4 pp 667ndash674 2011
[16] A Giani E Bitar M Garcia MMcQueen P Khargonekar andK Poolla ldquoSmart grid data integrity attacksrdquo IEEE Transactionson Smart Grid vol 4 no 3 pp 1244ndash1253 2013
[17] ITU-T Recommendation G9904 (102012) Narrowband or-thogonal frequency division multiplexing power line commu-nication transceivers for PRIME networks 2013
[18] R Moghaddass and J Wang ldquoA hierarchical framework forsmart grid anomaly detection using large-scale smart meterdatardquo IEEE Transactions on Smart Grid vol PP no 99 pp 1ndash11 2017
[19] V Aravinthan V Namboodiri S Sunku and W Jewell ldquoWire-less AMI application and security for controlled home areanetworksrdquo in Proceedings of the 2011 IEEE PES General MeetingThe Electrification of Transportation and the Grid of the FutureDetroit Mi USA July 2011
[20] TrilliantWhite PapersTheHomeArea Network ArchitecturalConsiderations for Rapid Innovation pp 1ndash7 2010
[21] M Balakrishnan Security in Smart Meters Document numberSEC s MTMTRWP REV0 Free scale Semiconductor ArizonaAriz USA 2012
[22] B J Murrill E C Liu and RMThompson ldquoSmart meter dataPrivacy and cybersecurityrdquo Smart Meters and the Smart GridPrivacy and Cybersecurity Considerations pp 1ndash45 2012
[23] V Navda A Bohra S Ganguly and D Rubenstein ldquoUsingchannel hopping to increase 80211 resilience to jammingattacksrdquo in Proceedings of the 26th IEEE International Confer-ence on Computer Communications (INFOCOMrsquo07) pp 2526ndash2530 Barcelona Spain May 2007
[24] J Liu Y Xiao S LiW Liang and C L P Chen ldquoCyber securityand privacy issues in smart gridsrdquo IEEE CommunicationsSurveys and Tutorials vol 14 no 4 pp 981ndash997 2012
[25] E Cayirci and C Rong Security in Wireless Ad Hoc and SensorNetworks John Wiley and Sons Ltd 2009
[26] H K D Sarma and A Kar Security Threats in Wireless SensorNetworks Elsevier October 2006
[27] M Tyndall R Marshall E K Armstrong and C MarshmanldquoPotential EMC implementation problems of smart meteringdisplay and communicationsrdquo in Proceedings of the 2011 2ndIEEE PES International Conference and Exhibition on InnovativeSmart Grid Technologies ISGT Europe 2011 Manchester UKDecember 2011
[28] R Smolenski Conducted Electromagnetic Interference (EMI) inSmart Grids Springer London UK 2012
[29] A V Pramo M Abdul Azeem and O M Prakash ldquoDetectingthe sybil attack in wireless sensor networkrdquo InternationalJournal of Computers amp Technology vol 3 no 1 2012
[30] S Ji T Chen and S Zhong ldquoWormhole attack detection algo-rithms in wireless network coding systemsrdquo IEEE Transactionson Mobile Computing vol 14 no 3 pp 660ndash674 2015
[31] A D Wood and J A Stankovic ldquoDenial of service in sensornetworksrdquo Computer vol 35 no 10 pp 54ndash62 2002
[32] K Billewicz Smart Metering Inteligentny System PomiarowyWydawnictwo Naukowe PWN 2011
[33] A Lee and T Brewer ldquoGuidelines for smart grid cyber security1 smart grid cyber security strategy architecture and high-levelrequirementsrdquo NISTIR 7628 2010
[34] M Esposito C Mazzariello F Oliviero S P Romano and CSansone ldquoEvaluating pattern recognition techniques in intru-sion detection systemsrdquo in Proceedings of the 5th Interna-tional Workshop on Pattern Recognition in Information Systems(PRISrsquo05) in Conjunction with ICEIS 2005 pp 144ndash153 May2005
[35] V Chandola A Banerjee and V Kumar ldquoAnomaly detection asurveyrdquo ACM Computing Surveys vol 41 no 3 article 15 2009
[36] M Xie S Han B Tian and S Parvin ldquoAnomaly detection inwireless sensor networks a surveyrdquo Journal of Network andComputer Applications vol 34 no 4 pp 1302ndash1325 2011
[37] R D Cook ldquoDetection of influential observation in linearregressionrdquo Technometrics A Journal of Statistics for the Phys-ical Chemical and Engineering Sciences vol 19 no 1 pp 15ndash181977
[38] E S Gardner Jr ldquoExponential smoothing the state of the art-part IIrdquo International Journal of Forecasting vol 22 no 4 pp637ndash666 2006
[39] E S Gardner ldquoExponential smoothing The state of the artrdquoJournal of Forecasting vol 4 no 1 pp 1ndash28 1985
[40] C C Pegels ldquoExponential forecasting some new variationsrdquoManagement Science vol 12 pp 311ndash315 1969
[41] O L Davies and R G Brown ldquoStatistical forecasting for inven-tory controlrdquo Journal of the Royal Statistical Society Series A(General) vol 123 no 3 p 348 1960
[42] C C Holt Forecasting Seasonals and Trends by Exponen-tially Weighted Moving Averages ONR Memorandum vol 52
Journal of Sensors 15
Carnegie Institute of Technology Available from the Engineer-ing Library University of Texas at Austin Pittsburgh PA USA1957
[43] P R Winters ldquoForecasting sales by exponentially weightedmoving averagesrdquo Management Science Journal of the InstituteofManagement Science Application andTheory Series vol 6 pp324ndash342 1960
[44] R G Brown Smoothing Forecasting and Prediction of DiscreteTime Series Prentice-Hall Englewood Cliffs NJ USA 1963
[45] J Bollinger Bollinger on Bollinger Bands McGraw Hill 2002[46] S Vervoort ldquoSmoothing the bollinger bandsrdquo Technical Analy-
sis of Stocks amp Commodities vol 28 no 6 pp 40ndash44 2010[47] UTP University of Science and Technology in Bydgoszcz Po-
land httpwyszukajutpeduplmapa[48] IEC 61000-4-4 httpwwwiecchemcbasic_emcbasic_emc_
immunityhtm[49] Y Guo C-W Ten S Hu and W W Weaver ldquoModeling dis-
tributed denial of service attack in advanced metering infras-tructurerdquo inProceedings of the 2015 IEEEPower and Energy Soci-ety Innovative Smart Grid Technologies Conference (ISGTrsquo15)February 2015
[50] P Cheng and M Zhu ldquoLightweight anomaly detection forwireless sensor networksrdquo International Journal of DistributedSensor Networks vol 2015 Article ID 653232 2015
[51] V Garcia-Font C Garrigues and H Rifa-Pous ldquoA comparativestudy of anomaly detection techniques for smart city wirelesssensor networksrdquo Sensors (Switzerland) vol 16 no 6 article868 2016
RoboticsJournal of
Hindawi Publishing Corporationhttpwwwhindawicom Volume 2014
Hindawi Publishing Corporationhttpwwwhindawicom Volume 2014
Active and Passive Electronic Components
Control Scienceand Engineering
Journal of
Hindawi Publishing Corporationhttpwwwhindawicom Volume 2014
International Journal of
RotatingMachinery
Hindawi Publishing Corporationhttpwwwhindawicom Volume 2014
Hindawi Publishing Corporation httpwwwhindawicom
Journal of
Volume 201
Submit your manuscripts athttpswwwhindawicom
VLSI Design
Hindawi Publishing Corporationhttpwwwhindawicom Volume 201
Hindawi Publishing Corporationhttpwwwhindawicom Volume 2014
Shock and Vibration
Hindawi Publishing Corporationhttpwwwhindawicom Volume 2014
Civil EngineeringAdvances in
Acoustics and VibrationAdvances in
Hindawi Publishing Corporationhttpwwwhindawicom Volume 2014
Hindawi Publishing Corporationhttpwwwhindawicom Volume 2014
Electrical and Computer Engineering
Journal of
Advances inOptoElectronics
Hindawi Publishing Corporation httpwwwhindawicom
Volume 2014
The Scientific World JournalHindawi Publishing Corporation httpwwwhindawicom Volume 2014
SensorsJournal of
Hindawi Publishing Corporationhttpwwwhindawicom Volume 2014
Modelling amp Simulation in EngineeringHindawi Publishing Corporation httpwwwhindawicom Volume 2014
Hindawi Publishing Corporationhttpwwwhindawicom Volume 2014
Chemical EngineeringInternational Journal of Antennas and
Propagation
International Journal of
Hindawi Publishing Corporationhttpwwwhindawicom Volume 2014
Hindawi Publishing Corporationhttpwwwhindawicom Volume 2014
Navigation and Observation
International Journal of
Hindawi Publishing Corporationhttpwwwhindawicom Volume 2014
DistributedSensor Networks
International Journal of
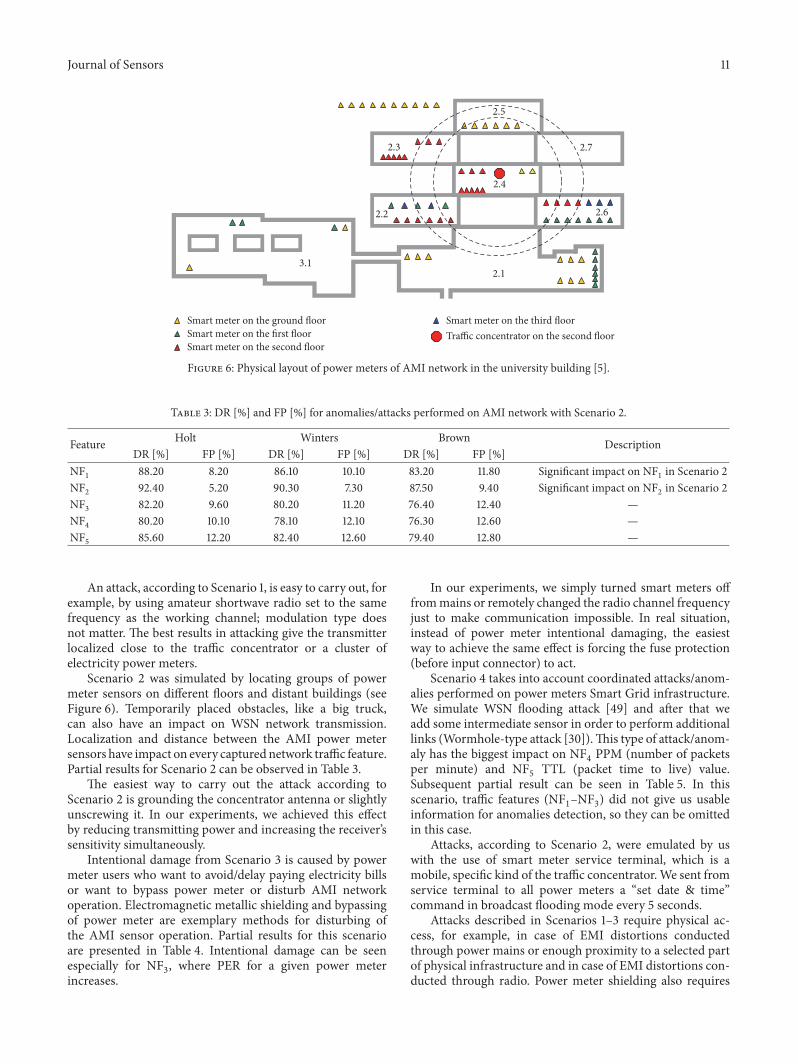