science of anomaly detection - v4 updated for htm for it · the#science#of#anomaly#detection!! !...
TRANSCRIPT
White Paper
The Science of Anomaly Detection
How HTM Enables Anomaly Detection in Streaming Data
The Science of Anomaly Detection
Page 1
Executive Summary Hierarchical Temporal Memory (HTM) is a biologically inspired machine intelligence technology that mimics the architecture and processes of the neocortex. In this white paper we first give an overview of HTM as applied to anomaly detection, and then discuss the advantages of an HTM approach:
Easy to use No separate training or manual intervention required.
Scalable Individual models are automatically built for any number of inputs.
Flexible Continuous online learning allows the application to learn new patterns without manual intervention.
Universal The neocortex uses the same learning principles for vision, hearing, touch, movement, language and planning. HTM algorithms are neocortical algorithms and can similarly be used in many different applications.
We describe some examples of anomalies that HTM for IT, an application that Numenta has developed for IT analytics, has detected in real world streaming data. Then, we compare its performance to the likely performance of other classes of anomaly detection. We finish with the introduction of several HTM-based applications, also developed by Numenta, which can identify anomalies in streaming data.
The Science of Anomaly Detection
Page 2
Advances in Anomaly Detection The ability to detect anomalies in real time can be incredibly valuable. Imagine being able to:
-‐ notice early warning signs of failure in a large turbine. -‐ see slight variations in a heartbeat indicating disease. -‐ find significant anomalies in stock market data. -‐ identify changes in employee behavior that signal a security breach. -‐ detect departure from a typical path that provides early warning signs of kidnapping.
Anomalies are not always bad or indicative of a failure, either. For example, detecting a subtle change in consumer buying habits could provide an opportunity to discover a new trend. In today’s world where the amount of data being collected is exploding, the opportunity for detecting anomalies is exploding along with it. However, accurately detecting anomalies can be very difficult. First, what qualifies as an anomaly is constantly changing. Systems evolve over time as software is updated or as behaviors change. Therefore, effective anomaly detection requires a system to learn continuously. Second, to detect anomalies early one can’t wait for a metric to be obviously out of bounds. Early detection requires the ability to detect subtle changes in patterns that are not obvious or easily detected. Furthermore, because anomalies by their nature are unexpected, an effective detection system must be able to determine whether new events are anomalous without relying on preprogrammed thresholds. At Numenta we have taken a fresh approach to this problem and have created what we believe is the world’s most powerful anomaly detection technology. This approach is derived from our understanding of the neocortex, which is itself a powerful prediction and anomaly detection system. Our suite of applications takes advantage of this understanding to drive state-of-the-art breakthroughs in two dimensions: 1) how we utilize the processes of the brain to model data, and 2) how we detect anomalies based on that model. This paper will describe these advances by illustrating how Numenta’s applications can detect anomalies in different types of streaming data.
a·nom·a·ly Something that deviates from what is standard, normal, or expected.
The Science of Anomaly Detection
Page 3
Anomaly Detection in Streaming Data
Early anomaly detection in streaming data can be extremely valuable in many domains, such as IT security, finance, vehicle tracking, health care, energy grid monitoring, e-commerce – essentially in any application where there are sensors that produce important data changing over time. HTM-based applications offer significant improvements over existing methods of anomaly detection for streaming data:
Easy to use HTM-based methods don’t require training data or a separate training step. Automatic model building and learning eliminates the need to manually define and maintain models and data sets. This vastly reduces the time and effort for the user.
Scalable Unique models are automatically built for each metric being monitored. Flexible Continual learning enables the application to continually update its model to recognize new or
changed behavior of each metric, without manual intervention. Universal The same HTM learning algorithms work in many different domains where streaming data
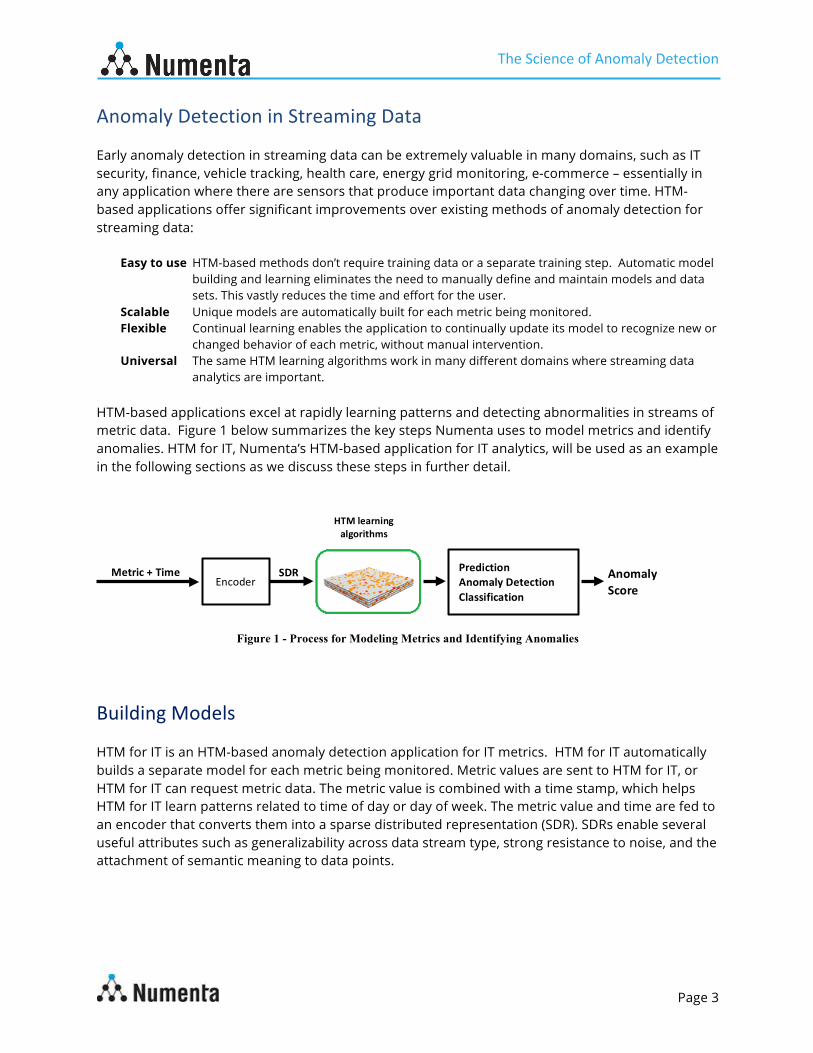
analytics are important. HTM-based applications excel at rapidly learning patterns and detecting abnormalities in streams of metric data. Figure 1 below summarizes the key steps Numenta uses to model metrics and identify anomalies. HTM for IT, Numenta’s HTM-based application for IT analytics, will be used as an example in the following sections as we discuss these steps in further detail.
Figure 1 - Process for Modeling Metrics and Identifying Anomalies
Building Models
HTM for IT is an HTM-based anomaly detection application for IT metrics. HTM for IT automatically builds a separate model for each metric being monitored. Metric values are sent to HTM for IT, or HTM for IT can request metric data. The metric value is combined with a time stamp, which helps HTM for IT learn patterns related to time of day or day of week. The metric value and time are fed to an encoder that converts them into a sparse distributed representation (SDR). SDRs enable several useful attributes such as generalizability across data stream type, strong resistance to noise, and the attachment of semantic meaning to data points.
SDR Metric + Time Encoder
Prediction Anomaly Detection Classification
Anomaly Score
HTM learning algorithms
The Science of Anomaly Detection
Page 4
Next, a sequence of SDRs is fed into the HTM learning algorithms. These algorithms, in essence a simulation of a small slice of the neocortex, are responsible for learning temporal sequences in the server metric data streams. Temporal sequences are like melodies; they are patterns over time. The HTM learning algorithms learn the temporal patterns they see in the data; they learn continuously, so new patterns replace old patterns in the same way you remember recent events better than old events. And if a new pattern is different but similar to previously learned patterns, the HTM learning algorithms will make an appropriate prediction in the same way you make predictions when hearing a new melody for the first time.
Prediction and Anomaly Detection Just as your brain tries to predict the next note in a melody, the HTM learning algorithms in HTM for IT constantly predict what is likely to happen next in the metric data stream. These sophisticated algorithms often predict multiple things at once and gives a likelihood score for each prediction. When each new metric data point arrives, the HTM learning algorithms compare their prediction to the new input to see if the prediction is correct or not. The result is not a simple “yes or no”. Every prediction plus new data point delivers an error that is a scalar value. However, an error in the prediction of a metric at a single point in time is usually insufficient to detect an anomaly because almost all data streams have some unpredictability, or noise, to them. Even the best model might be able to correctly predict the next value only 80% of the time. If we reported every incorrect prediction as an anomaly, there would be too many false positives. Consequently, HTM for IT’s next step is critical to reducing false positives. It creates a running average of the error score (say over the past hour) and then compares the current running average error to a distribution of what the average error has been over the past few weeks. In this way HTM for IT can determine with precision how likely the current running average error score is. If HTM for IT could speak, it would say, “There is an X% chance that the recent metric values would occur based on the past three weeks of temporal patterns that I found in the data”. (It is analogous to you listening to a musician for several days. You learn the kind of music she plays, how many mistakes she makes, and how much she improvises. As you listen to her continue to play you will detect if her style changes, if the type of music she plays changes or if she starts making more errors. These changes cannot be detected by thresholds.) We convert this analysis to an anomaly score that HTM for IT displays. The anomaly score represents the probability that the recent metric input would occur based on the predictability of the metric over the past few weeks of data.
More information on SDRs and the HTM learning algorithms can be found on Numenta’s website or through NuPIC, Numenta’s open source project that contains descriptions and implementations of the algorithms used in our applications.

The Science of Anomaly Detection
Page 5
Examples of Anomalies Detected by HTM for IT Following are several real world examples of unusual behavior that HTM for IT can detect in server metric data, starting with obvious anomalies and progressing towards more subtle anomalies. Let’s start by explaining how to read the HTM for IT screenshots shown below. The three tabs near the top, in blue, indicate whether you are looking at anomaly scores over a few hours, a day, or a week. Below the tabs, in white, is a graph of the anomaly score over time for the server (in the first screen shot, this is a server named “Wallboard”). The bottom graph, in gray, is the anomaly score over time for one metric associated with the server (in the first case, CPU Utilization). The middle graph, blue on black, is the actual metric data over time (i.e. not the anomaly score, but the actual CPU utilization data).
Figure 2 - Anomalies alerted due to a step change
In the above example HTM for IT flagged two anomalous events: when the metric value jumped high and then when it went low again a few days later. It is fairly obvious why HTM for IT flagged these changes and most people would agree that these are the two most unusual points in the data. An important note is that since HTM for IT is continually learning, it stops reporting an anomaly after the new pattern persists. In other words, after seeing this pattern a few times, HTM for IT learns the pattern as the new normal, and will not flag this condition as anomalous in the future. In this case, the changes in server “Wallboard” were caused by new software pushed to the server.
The Science of Anomaly Detection
Page 6
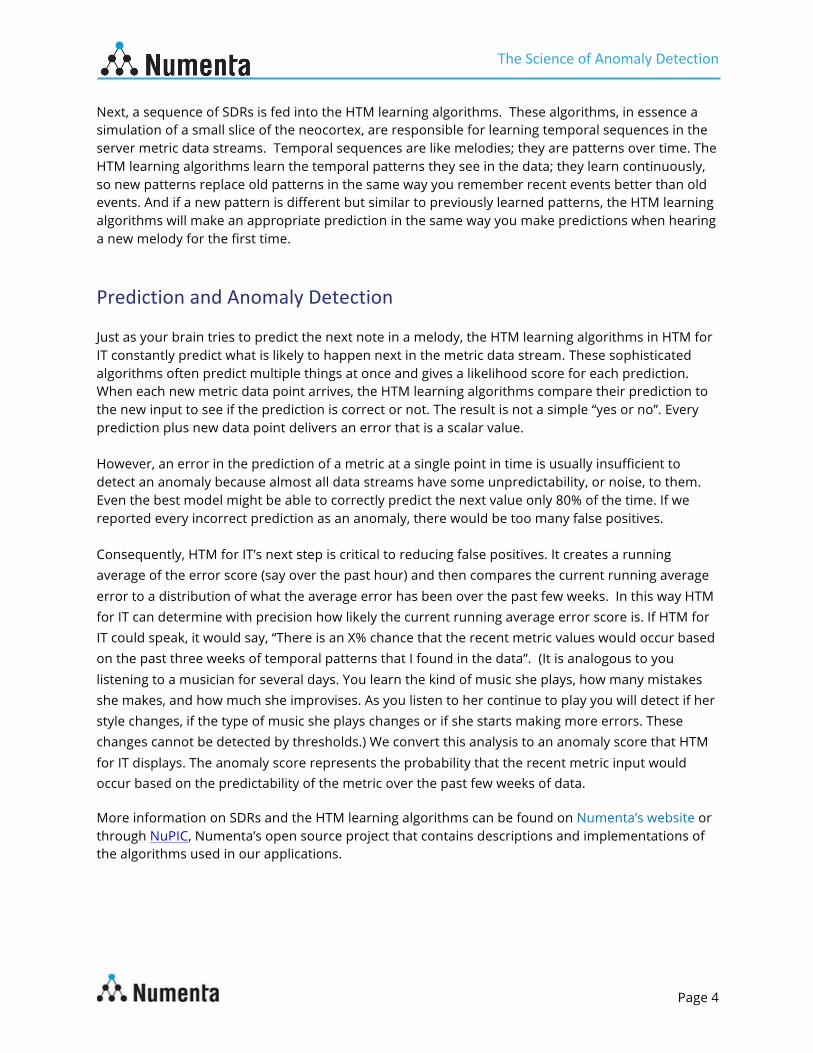
Figure 3 – Anomaly identified within a regularly fluctuating data stream
Above is a more subtle example where it might not be immediately obvious why HTM for IT flagged an anomaly. The left image shows a week’s worth of data. Notice that HTM for IT didn’t flag the two spikes in the middle graph because HTM for IT has seen spikes in this metric before and does not consider them unusual. But why did HTM for IT flag a different point in the data? You can see the answer in the screen on the right, which shows a day’s worth of data for the same anomaly, rather than the week’s worth of data shown on the left. In the day view you can see that this metric normally behaves in a highly regular pattern. It is so regular that HTM for IT picks out the one point where a slight, but noticeable, change occurred. In a signal that is highly predictable, even a small change is statistically significant. In this case, we knew the server was a temporary test server and decided it wasn’t worth investigating further. If a subtle change like this is not interesting to you, then you might consider it a false positive. On the other hand, to someone else this could be the needle in the haystack, an important but subtle change that is difficult to find. Notice however that HTM for IT flagged only one anomaly in over eight days. This is the only anomalous event in over a week. HTM for IT will never bombard you with anomalies it will only report the most anomalous points, which by definition occur rarely.
test03.numenta.com test03.numenta.com
The Science of Anomaly Detection
Page 7
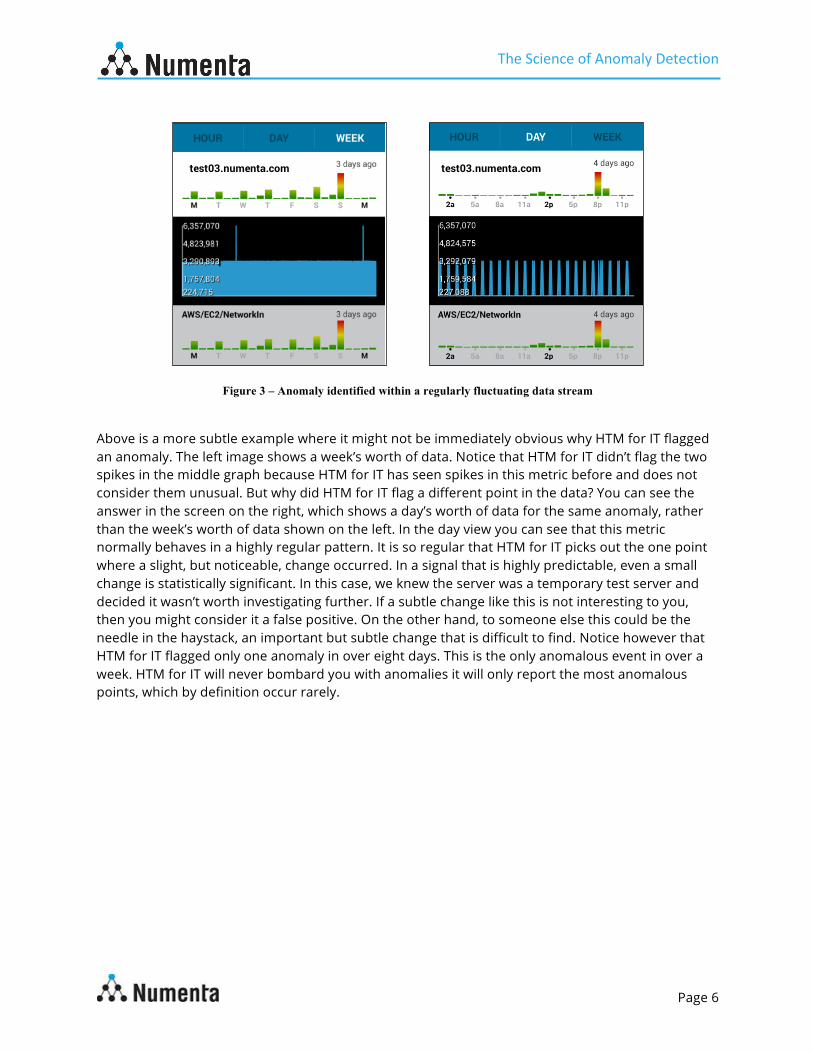
Figure 4 - Anomalous pattern detected within a noisy data stream
Above is an example that shows a metric that has a lot of noise. It is not very predictable. There are many spikes in the data and they don’t occur in any regular pattern. However, HTM for IT detects when the data becomes even less predictable, where the unpredictable spikes occur more frequently. This example illustrates that HTM for IT can find anomalies in even highly unpredictable, noisy environments. The running average error methodology described earlier allows HTM for IT to make this kind of analysis. In this case the anomaly was caused by a software error that injected an inefficiency in an application. HTM for IT helped identify the problem, and it was fixed a day later.
The Science of Anomaly Detection
Page 8
Figure 5 - Anomaly detected that human monitoring likely would have missed
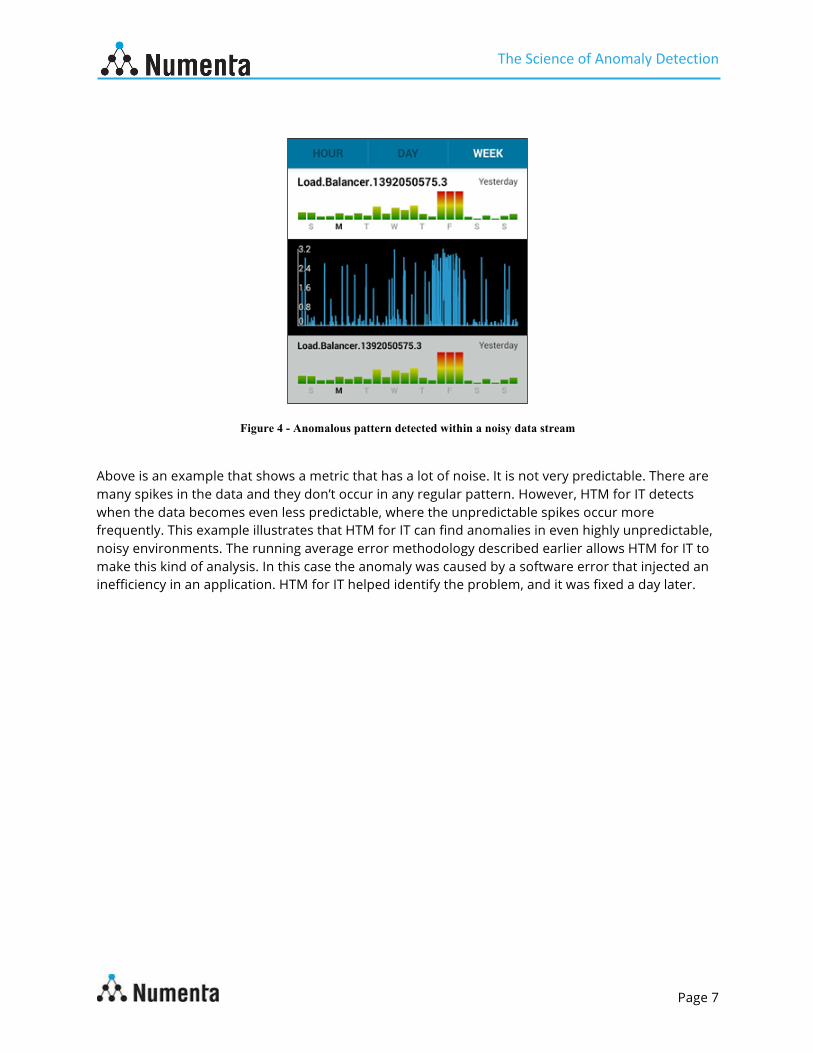
Figure 5 represents an anomaly that is difficult for a human to see in the raw data stream, but that HTM for IT was able to detect. The two images on the left show two anomalies flagged by HTM for IT, one for the metric labeled “CPUUtilization” and the other for the metric labeled “DiskWriteBytes”. In both cases when you examine the underlying raw metric data, it is not obvious why HTM for IT flagged an anomaly. The metric data shows no large changes, no big spikes, and no increase in noise. You might think these are false positives, and that HTM for IT made a mistake. The image on the right displays the impacted server along with its multiple metrics. It shows that the two anomalies occurred on the same server at the same time. Because HTM for IT builds independent models for each metric, these two models, CPUUtilization and DiskWriteBytes, do not know about each other. Yet both models independently determined there was unusual behavior in this server. HTM for IT does not detect many anomalies and therefore this co-occurrence virtually guarantees that something truly unusual did happen on March 11, 2014, around noon. Upon investigation, the root cause of the anomaly was found. This server, “rpmbuild”, is part of an automated build system that starts programmatically when any engineer on the project makes a code push. Around noon on March 11, an engineer had manually initiated a series of build tasks, something that is almost never done. In summary, HTM for IT detected when a human started a build task that normally is started programmatically. HTM for IT detected this unusual behavior in two metrics, independently at the same time, where a human cannot see the change in either metric. In this particular case it turned out that a manual interaction with the server was ok. But in other cases it would be considered a serious breach, something that an IT manager would want to know about. It could indicate a security intrusion or perhaps an employee who might unwittingly cause a serious problem.
rpmbuild.numenta.com rpmbuild.numenta.com rpmbuild.numenta.com
The Science of Anomaly Detection
Page 9
Comparison to Alternative Anomaly Detection Methods Anomaly detection is a broad field; numerous anomaly detection methods are used in many different domains. This section is not meant to be an exhaustive discussion of all these domains and methods (though there are some good comprehensive surveys available1). Instead, the following discussion is largely confined to methods that are applicable to streaming data, and in particular IT analytics. The "no free lunch" theorem2 postulates that when averaged over all possible problems, no algorithm will perform better than all others; in other words, algorithms must be optimized for a particular problem or domain to work “better”. This property, in large part, explains why there are so many anomaly detection methods – no one method works well in all possible domains. But even in one domain, it is impossible to build a perfect anomaly detection system, and it is impossible for any system to consistently point out only the anomalies you care about and avoid the ones you don’t. However, HTM for IT has made advances in anomaly detection for IT streaming data that promises better performance than has been possible before. HTM theory also shows us that the superior performance of HTM for IT can be duplicated in other domains using the same underlying algorithms. Categorization of Anomaly Detection Methods Supervised vs. Unsupervised
Anomaly detection methods can operate in either supervised or unsupervised modes. Supervised modes require a set of training data that has been labeled, so that the anomaly detector can compare this data “truth” to incoming data in order to determine anomalies. Unsupervised modes (which HTM-based methods operate in) do not require a labeled training set, and anomaly detection techniques in this mode are much more flexible and easy to use, since they don’t require upfront human intervention and training. Anomaly detection methods that run in supervised mode include rule-based methods, and model-based approaches such as replicator neural networks, Bayesian or unsupervised support vector machines.
Point vs. Statistical Many anomaly detection methods are designed to detect simple “point” anomalies (an individual data instance that is anomalous relative to the rest of the data points). As the data becomes more complex and less predictable it is important that anomalies are based on the data’s context, whether that context is spatial, temporal, or semantic. HTM-based methods automatically adjust based on how predictable the data stream is; they can detect point anomalies in highly regular data but will use as much context as needed to guarantee the data is anomalous in noisy data.
1 Chandola, V.; Banerjee A.; Kumar, V., “Anomaly Detection: A Survey” in ACM Computing Surveys, Sept. 2009 or Chandola, V.; 2 Ho, Y.C. & Pepyne, D.L. (2002), “Simple Explanation of the No-Free-Lunch Theorem and Its Implications”, Journal of Optimization Theory and Applications V115(3), 549-570
The Science of Anomaly Detection
Page 10
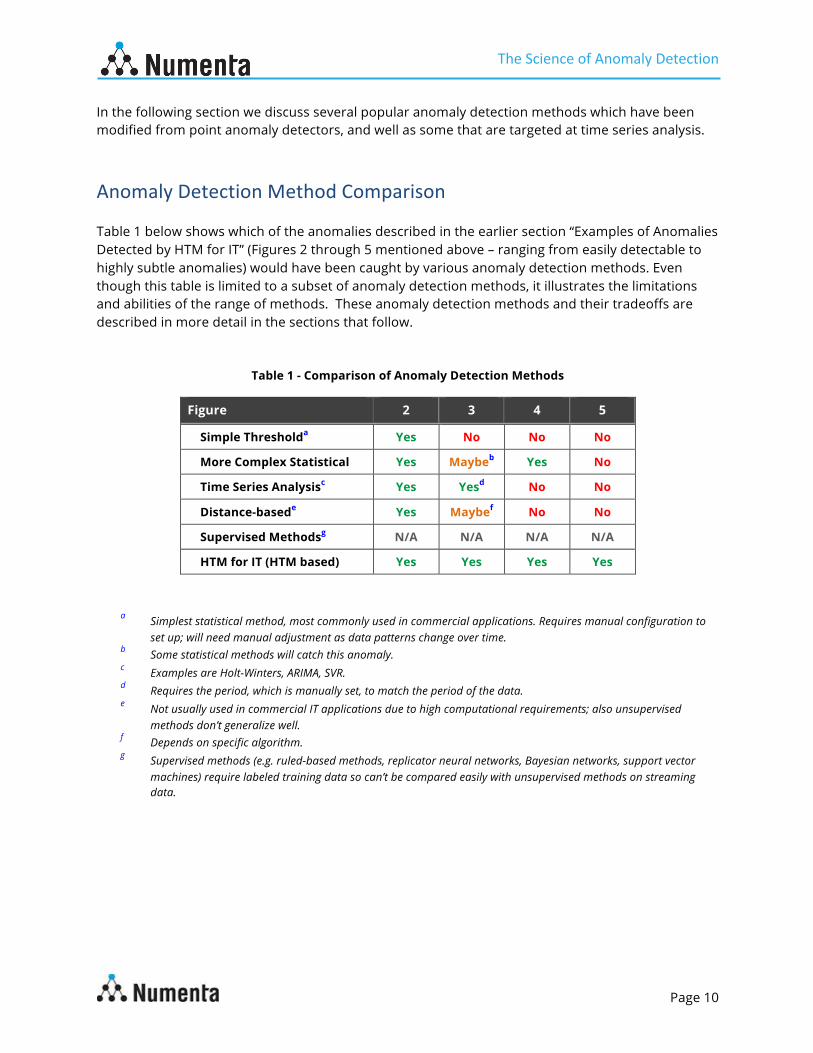
In the following section we discuss several popular anomaly detection methods which have been modified from point anomaly detectors, and well as some that are targeted at time series analysis. Anomaly Detection Method Comparison Table 1 below shows which of the anomalies described in the earlier section “Examples of Anomalies Detected by HTM for IT” (Figures 2 through 5 mentioned above – ranging from easily detectable to highly subtle anomalies) would have been caught by various anomaly detection methods. Even though this table is limited to a subset of anomaly detection methods, it illustrates the limitations and abilities of the range of methods. These anomaly detection methods and their tradeoffs are described in more detail in the sections that follow.
Table 1 - Comparison of Anomaly Detection Methods
Figure 2 3 4 5
Simple Thresholda Yes No No No
More Complex Statistical Yes Maybeb Yes No
Time Series Analysisc Yes Yesd No No
Distance-basede Yes Maybef No No
Supervised Methodsg N/A N/A N/A N/A
HTM for IT (HTM based) Yes Yes Yes Yes
a Simplest statistical method, most commonly used in commercial applications. Requires manual configuration to set up; will need manual adjustment as data patterns change over time.
b Some statistical methods will catch this anomaly. c Examples are Holt-Winters, ARIMA, SVR. d Requires the period, which is manually set, to match the period of the data. e Not usually used in commercial IT applications due to high computational requirements; also unsupervised
methods don’t generalize well. f Depends on specific algorithm. g Supervised methods (e.g. ruled-based methods, replicator neural networks, Bayesian networks, support vector
machines) require labeled training data so can’t be compared easily with unsupervised methods on streaming data.
The Science of Anomaly Detection
Page 11
Simple Thresholds The “simple threshold” method is one of the simplest statistical anomaly detectors, and it is one of the most commonly used methods in commercial IT analytic applications today. A simple threshold method flags data as anomalous when it falls inside or outside a specific range of values in order to find anomalies. Simple thresholds are very fast and require virtually no CPU or memory to compute, making simple thresholds well suited for situations where you have thousands of metrics with very simple detection needs. Simple thresholds have these disadvantages in application to IT analytics:
-‐ They generally are set by the user, rather than learned, which can be a time consuming and difficult process when monitoring many data streams. Moreover, they need to be adjusted as the environment changes, so manual real-time maintenance is needed.
-‐ They can generate many false positives. For example, if an IT operator increases memory on a server, the percentage of memory used may fall below a threshold. The threshold will then continually give false positives until manually changed since it does not automatically learn the new behavior.
-‐ Since they don’t take temporal sequences into account, simple thresholds cannot identify pattern changes that take place within the range. As an example, imagine a regular sine wave pattern that suddenly goes to a straight line in the center. This change would not trigger a threshold but would be a dramatic change, and would be an example of a false negative.
In the previous section, we showed an example of a step change (Figure A) that was identified by HTM for IT. Here, instead of just sending alerts at each step change in the underlying data stream, a simple threshold would have generated a continuous stream of false positive alerts after this change occurred. As another example, a simple threshold would not have detected the change in pattern within a noisy data stream that HTM for IT was able to identify in Figure C. As such, a simple threshold would have falsely reported there to be no anomaly (aka, a false negative). More Complex Statistical Methods
Statistical methods monitor the user or system behavior by measuring certain variables over time … the basic models keep averages of these variables and detect whether thresholds are exceeded based on the standard deviation of the variable. More advanced statistical models also compare profiles of long-term and short-term user activities.3 There are a variety of statistical methods that are used to flag anomalies. Techniques include dynamic thresholds based on standard deviations, moving averages, comparison to a least squares model of the data, statistical comparisons of very recent data to older data, and histogram analysis.
3 Lazarevic, A., “Anomaly Detection/ Outlier Detection in Security Applications”, University of Minnesota
The Science of Anomaly Detection
Page 12
A specific statistical method generally targets very specific behavior in the data, so a single method won’t catch a wide range of types of anomalies. If a type of anomaly is well understood, these targeted statistical methods can work well. Statistical techniques often are very fast to compute and can be combined together in ensembles to catch a broader range of anomalies, greatly reducing the number of false negatives compared to simple thresholds. For instance, the open source Skyline project utilizes an ensemble of statistical functions to find anomalies4. The dynamic threshold method, which is used in commercial applications, is an interesting comparison point. Dynamic thresholds go beyond simple thresholds by taking into account changes in the data in order to look for anomalies. In essence, these systems do a simple form of learning. For example, a dynamic threshold might look at the last 30 days of data, create averages of actual data, and adjust the thresholds in accordance with this data. This calculation helps dynamic thresholds catch a broader range of anomalies while still being very inexpensive to compute for a large number of metrics. Statistical methods, and dynamic thresholds in particular, have these disadvantages in application to IT analytics:
-‐ Statistical methods do not learn patterns and then look for variations to those patterns. Instead, they predetermine anomaly types to look for. Consequently, they generally do not find new types of anomalies, or the “unknown unknown”.
-‐ Standard statistical methods do not learn temporal patterns. If you scramble the last few data points, statistical measures such as mean and standard deviation are unchanged. No anomaly will be detected even though to a human the behavior looks completely different. In real world situations there are a large number of significant behavioral changes that don’t lead to any significant statistical changes.
-‐ Specific statistical methods cannot be easily generalized. Thus, the sort of complex, real world data stream created by server metrics would require a complex model and additional manual tuning.
-‐ Dynamic thresholds:
o While dynamic thresholds perform somewhat better than simple thresholds, they do not detect subtle or slow changes in patterns.
o Dynamic thresholds require manual setting, including the factors for averaging.
o Like simple thresholds, they cannot identify pattern changes that take place within the dynamic range.
4 https://github.com/etsy/skyline/blob/master/src/analyzer/algorithms.py
The Science of Anomaly Detection
Page 13
Time Series Analysis Time Series Analysis. Statistcal models that are fitted to “time series” data (data which is streaming, or non-stationary) in order to better predict future points in the series. Holt-Winters, Auto-Regressive Integrated Moving Average (ARIMA), and Support Vector Regression (SVR) are examples of statistical models that take into account seasonality. These models can be used as a time series dynamic threshold for anomaly detection. Time series analysis methods have these disadvantages in application to IT analytics:
-‐ While these methods better capture seasonality in data, they otherwise exhibit the same disadvantages as dynamic thresholds. They don’t catch, for instance, subtle or slow changes in patterns or pattern changes that take place within the dynamic range for the period.
-‐ The models for dynamic thresholds require an explicit period to be specified which limits the models to learning only seasonality in that period.
-‐ They do not handle extremely noisy behavior where there is no discernible pattern (such as the load balancer scenario).
Distance-based Methods
Distance-based Methods. Distance-based approaches attempt to overcome limitations of statistical outlier detection approaches and they detect outliers by computing distances among points.5
There are many distance-based methods used for detecting anomalies in different domains, including nearest neighbor based and clustering based. While not often used in commercial IT analytics today, these techniques have recently been proposed to detect network anomalies, and there are versions of these methods that can run in an unsupervised mode, so we cover them here. Distance-based methods have these disadvantages in application to IT analytics:
-‐ Distance based methods do not capture temporal behavior.
-‐ Algorithms are very sensitive to distance calculations, and therefore very sensitive to noise (changes in the distance between anomalies)
-‐ For unsupervised techniques, if the data has normal instances that do not have enough close neighbors or if the data has anomalies that have enough close neighbors, the technique fails to label
them correctly, resulting in missed anomalies.
5 Lazarevic, A., “Anomaly Detection/ Outlier Detection in Security Applications”, University of Minnesota
The Science of Anomaly Detection
Page 14
Supervised Machine Learning Methods
As mentioned earlier in this section, supervised machine learning is a class of methods that relies on labeled training sets. This training data includes labels that specify whether or not the data point is an anomaly. These labels are used to build a model that can differentiate between the two classes of data. While supervised algorithms can be very effective for subtle, domain-specific changes, they are generally not well suited for anomaly detection scenarios where the patterns are changing over time, such as with IT analytics. Since supervised methods operate in an entirely different mode from the unsupervised methods discussed here, we have marked this entire category as “not applicable” in the comparison table. Supervised machine learning techniques have these disadvantages in application to IT analytics:
-‐ Supervised models don’t adapt automatically as the patterns change. To learn the new patterns, a new model would have to be built with labeled data. As a result, these models are not suitable for dynamic high-velocity data.
-‐ The labeling process can be very manually intensive and must be repeated periodically to learn new patterns.
-‐ The labeling process can be error-prone and mistakes in labeling can cause poor model performance.
-‐ It is hard, if not impossible, to capture the “unknown unknown” with supervised methods.
The Science of Anomaly Detection
Page 15
HTM for IT (HTM based) The technology used by HTM for IT is a model of a slice of the neocortex. It exhibits many of the capabilities we find in brains, making it best suited for streaming data applications where the underlying patterns in the data are continually changing. The following attributes differentiate HTM for IT’s machine learning technology from other anomaly detection methods:
− HTM for IT is a memory-based system; it learns the patterns in the data. Techniques such as linear regression use formulae to model data. Formulaic systems can learn quickly but only work on specific types of patterns. Memory-based systems such as HTM for IT may take more data to train but they can learn any pattern, including those that don’t easily fit a mathematical expression. Servers and server-based applications generate data that require memory-based models.
− HTM for IT is an online learning system. Online systems learn continuously and thus are better suited for applications where the patterns in the data change over time. It learns continuously, so new patterns replace old patterns in the same way you remember recent events better than old events.
− HTM for IT learns time-based patterns. Many time-based patterns would not be easily learnable by standard machine learning techniques. Some techniques do work with time series data, such as ARIMA or ARMA, but they are based on averages with limited applicability to the types of patterns exhibited by servers and other fast changing data sources. HTM for IT learns high-order time-based patterns. This capability dramatically improves its predictive and anomaly detection capability because it automatically uses as much temporal context as it can to improve predictions.
− HTM for IT uses Sparse Distributed Representations (SDRs) to represent data. SDRs allow HTM for IT to handle almost any kind of data whereas some machine learning techniques are restricted in the kinds of data that can be used or predicted. SDRs are a kind of universal representation. You don’t have to tell HTM for IT anything about what the data you send it represents. SDRs also give HTM for IT the ability to generalize across different but similar patterns.
The Science of Anomaly Detection
Page 16
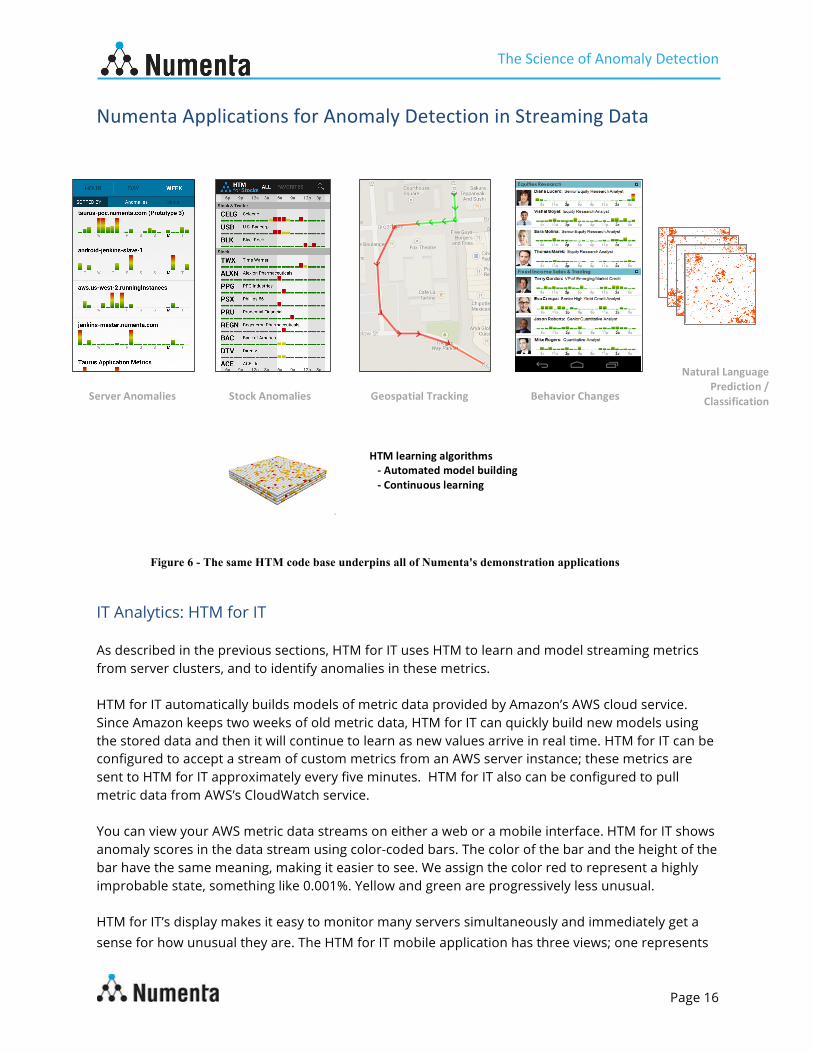
Numenta Applications for Anomaly Detection in Streaming Data
Figure 6 - The same HTM code base underpins all of Numenta's demonstration applications
IT Analytics: HTM for IT As described in the previous sections, HTM for IT uses HTM to learn and model streaming metrics from server clusters, and to identify anomalies in these metrics. HTM for IT automatically builds models of metric data provided by Amazon’s AWS cloud service. Since Amazon keeps two weeks of old metric data, HTM for IT can quickly build new models using the stored data and then it will continue to learn as new values arrive in real time. HTM for IT can be configured to accept a stream of custom metrics from an AWS server instance; these metrics are sent to HTM for IT approximately every five minutes. HTM for IT also can be configured to pull metric data from AWS’s CloudWatch service. You can view your AWS metric data streams on either a web or a mobile interface. HTM for IT shows anomaly scores in the data stream using color-coded bars. The color of the bar and the height of the bar have the same meaning, making it easier to see. We assign the color red to represent a highly improbable state, something like 0.001%. Yellow and green are progressively less unusual. HTM for IT’s display makes it easy to monitor many servers simultaneously and immediately get a sense for how unusual they are. The HTM for IT mobile application has three views; one represents
HTM for IT Rogue human behavior
Server Anomalies
HTM learning algorithms -‐ Automated model building -‐ Continuous learning
Stock Anomalies Geospatial Tracking Behavior Changes
Natural Language Prediction /
Classification
The Science of Anomaly Detection
Page 17
the past two hours (the hour view), one the past 24 hours (the day view), and one the past eight days (the week view). In each view, HTM for IT lists the server instances in order of how anomalous they are, putting the most unusual at the top. Thus it is easy to immediately see which instances are the most anomalous over the past two hours, the past day, or the past week. You can then drill down to see which metrics are anomalous and then see the actual values of the metrics. Doing this quickly on a mobile app lets you quickly ascertain which servers need further attention. For more information on Numenta’s “HTM for IT” application, visit Numenta’s application page.
Rogue Human Behavior
Numenta’s “Rogue Human Behavior” demonstration application uses HTM to automatically learn and model an individual’s “digital footprint” and identify abnormal or irregular activities in the individual’s ongoing behavior, like unauthorized file access or changes in access patterns. Streaming metric data, such as keystrokes or file access operations, is fed into this application and the patterns are understood by the HTM learning algorithms. Anomalies are detected when incoming data isn’t what the application has predicted. This technology applies to the work done by IT security managers in business or government as they monitor internal personnel behavior on their IT systems. For more information on Numenta’s “Rogue Human Behavior” demonstration application, visit Numenta’s application page.
Geospatial Tracking
Numenta’s “Geospatial Tracking” demonstration application uses HTM to automatically learn and model the movement of people, vehicles, materials or other objects, and to identify abnormal or irregular patterns or changes to normal movements. GPS location and speed data streams are fed into the HTM learning algorithms, and the algorithms learn characteristic movement patterns. Anomalies are detected when incoming data isn’t what the application has predicted, indicating an unusual set of movements. This technology applies to the logistics industry, as well as other situations where people or objects are tracked. For more information on Numenta’s “Geospatial Tracking” demonstration application, visit Numenta’s application page.
HTM for Stocks
Numenta’s “HTM For Stocks” application uses HTM to automatically learn and model financial and news data related to companies. An anomaly is reported when the HTM learning algorithms detect a pattern that is unusual in, for example, stock volume. This technology appeals to personal
The Science of Anomaly Detection
Page 18
investors, business people interested in following the stock activity of their company or other companies such as their customers or suppliers. Investment professionals can use it, as well.
Conclusion HTM-based anomaly detection techniques offer advances over current methods in ease of use, scalability, flexibility and the ability to generalize across different domains, using the same algorithms. HTM for IT significantly advances the state-of-the-art of anomaly detection, and it does so by using HTM learning algorithms. HTM learns new data patterns continuously, so that “new normals” can be adopted automatically without requiring manual intervention. Unlike simple thresholds, where over-sensitivity creates false alarms and under-sensitivity puts you in a reactive position, HTM transforms anomaly detection from the experience of managing a flood of alerts that are of questionable value to the experience of having a continuous monitoring environment that accurately reports unknowns. This paper has covered a few simple and elegant anomaly detection applications based on HTM. However, the science behind these applications is profound. To learn more, we invite you to read more about the neuroscience and computer science employed here on the technical pages of our website. By applying years of research in neuroscience and computer science, we believe that our approach to anomaly detection and pattern recognition represents a significant step forward for the monitoring of anything that generates continuous data.
About Numenta Founded in 2005, Numenta has developed a cohesive theory, core software technology, and numerous applications all based on principles of the neocortex. Laying the groundwork for the new era of machine intelligence, this technology is ideal for large-scale analysis of continuously streaming data sets and excels at modeling and predicting patterns in data. Numenta has also developed a suite of products and demonstration applications that utilize their flexible and generalizable HTM learning algorithms to provide solutions that encompass the fields of machine generated data, human behavioral modeling, geo-location processing, semantic understanding and sensory-motor control. In addition, Numenta has created NuPIC (Numenta Platform for Intelligent Computing) as an open source project. Numenta is based in Redwood City, California. Copyright Copyright © 2015 Numenta, Inc. All Rights Reserved. Trademarks Numenta is registered trademark of Numenta.