anomaly detection of polymer resettable circuit protection
TRANSCRIPT

Copyright (c) 2011 IEEE. Personal use is permitted. For any other purposes, permission must be obtained from the IEEE by emailing [email protected].
This article has been accepted for publication in a future issue of this journal, but has not been fully edited. Content may change prior to final publication.
TDMR-2011-07-0097.final 1
Abstract— As a circuit protection device, failure or abnormal
behavior of polymer positive temperature coefficient resettable devices can cause damage to circuits. It is necessary to detect anomalies in the resettable circuit protection devices to provide early warning of failure and avoid damage to a circuit. In this paper, a novel anomaly detection method, the cross-validation-based sequential probability ratio test, is developed and applied to the failure precursor parameters of the resettable circuit protection devices to conduct anomaly detection. The cross-validation-based sequential probability ratio test integrates the advantages of both the sequential probability ratio test for in-situ anomaly detection and the cross-validation technique for model parameter selection to reduce the probability of false and missed alarms in anomaly detection. The cross-validation-based sequential probability ratio test solves the model parameter selection difficulty of the traditional sequential probability ratio test and on improves its performance in anomaly detection.
Index Terms— Anomaly detection, Cross-validation-based sequential probability ratio test, failure precursor parameter, polymer positive temperature coefficient resettable circuit protection device, power supply protection
I. INTRODUCTION olymer positive temperature coefficient (PPTC) resettable circuit protection devices are widely used to protect
circuits in electronics, such as automotive circuits (e.g., the protection of micro-motors in window lifts, seats, and door locks), computers (e.g., the protection of the circuits in hard disk drives, interface ports, and cooling fan motors), telecommunication devices (e.g., cell phones), power supplies of various devices (e.g., computer, medical devices, and security and alarm systems) and batteries (e.g., Lithium-ion/Lithium battery, Nickel Cadmium cells, and Nickel Metal Hydride battery) [1]-[4].
Manuscript received July 15, 2011. S. Cheng was with the Prognostics and Health Management Lab in the Center
for Advanced Life Cycle Engineering (CALCE), University of Maryland, College Park, MD, 20742. He is now with Intel, Hillsboro, OR 97124. Email: [email protected], phone: 503-696-6192.
K. Tom is with the Army Research Laboratory, 2800 Powder Mill Road, Adelphi, Maryland, 20783. Email: [email protected], phone: 301-394-2612.
M. Pecht is with the Center for Advanced Life Cycle Engineering, University of Maryland, College Park, MD 20742 USA, and also with the Prognostics and Health Management Center, City University of Hong Kong, Hong Kong, China. Phone: (301) 405-5278; e-mail: [email protected]
*Corresponding author: [email protected], phone: 301-405-5323, fax: 301-314-9269.
Although there are different types of package styles of
PPTC resettable circuit protection devices, such as surface mount and radial trough-hole styles (shown in Fig. 1), the operational principles and processes are the same for each. Fig. 2 shows a schematic drawing of the operational process of a typical PPTC resettable circuit protection device [1]. Under normal ambient temperature, the PPTC resettable circuit protection device works in a low resistance state when the normal current (less than the hold current, Ihold, which is the maximum steady-state current the device can carry without tripping at the ambient temperature) passes through it. When a fault current (higher than the trip current, Itrip, which is the minimum current that causes the device to trip at the ambient temperature) occurs, the resistance of the PPTC circuit protection device increases sharply. Because of the sharp increase in resistance, the current is decreased to protect the circuit. The sharp increase in resistance is called a trip. After the trip, a PPTC resettable circuit protection device does not break as does a traditional fuse. Instead, it maintains a high resistance state and allows a small trickle current to pass through the circuit. The PPTC resettable circuit protection device will reset to a low resistance state within a short time after the heat or fault current is removed and/or the power is switched off [1],[5]–[7]. The trip time is defined as the time required for a PPTC resettable circuit protection device to decrease the current of the circuit to 50% of the trip current at the ambient temperature [7]. When the current is higher than the trip current, the PPTC circuit protection device will trip. When the current is lower than the hold current, the device will not trip. When the current is between the hold current and the trip current, the device may or may not trip [6][7]. After a number of trip-reset cycles, the PPTC resettable circuit protection device will degrade and failures will occur [1].
Fig. 1: Picture of a radial through-hole PPTC resettable circuit protection device.
Anomaly Detection of Polymer Resettable Circuit Protection Devices
Shunfeng Cheng, Member, IEEE, Kwok Tom, Member, IEEE, and Michael Pecht, Fellow, IEEE
P

Copyright (c) 2011 IEEE. Personal use is permitted. For any other purposes, permission must be obtained from the IEEE by emailing [email protected].
This article has been accepted for publication in a future issue of this journal, but has not been fully edited. Content may change prior to final publication.
TDMR-2011-07-0097.final 2
Although the PPTC resettable circuit protection device is not intended to be used under repeated faults or prolonged tripped conditions, the actual operation of the device will be in a trip-hold-reset condition if it is tripped by abnormal conditions. When a PPTC resettable circuit protection device is tripped, it may hold the tripped state until it is reset. After a number of trip-hold-reset operations, the circuit protection performance of the device will degrade. Failure or abnormal behavior of PPTC resettable circuit protection devices may cause damage to circuits, abnormal operation of circuits (e.g., inability to work at normal current), or unnecessary operations that force operators to switch off and on the power to reset the circuit. It is necessary to monitor the PPTC resettable circuit protection devices in situ to provide advance warning of failures and predict the remaining useful life (RUL) of the devices to prevent damage to the circuits.
Res
ista
nce
Curr
ent
Time
Normal operating current
Fault current
Poweroff
Normal operating current
Lowresistance
Highresistance
Lowresistance
Trip endurance
Time
Hold current
Trip current
Trip time
Tricklecurrent
Coolingwith power on
Fig. 2: Operation process of a PPTC resettable circuit protection device.
Prognostics and health management (PHM) has been
emerged as an effective method to monitor systems in situ and provide an RUL estimate. PHM is an enabling discipline consisting of technologies and methods to assess the reliability of a product in its actual life cycle conditions to determine the advent of failure and mitigate system risk [8][9]. PHM can be implemented by data-driven methods, which can extract information, detect anomalies, and identify trends from the in-situ monitored product data[9][10]; model-based methods, which are based on an understanding of the physical processes that cause degradation and failures of a product [9][10]; and the fusion of these two methods [10][11].
Typically, anomaly detection is a necessary process for data-driven PHM methods to provide advanced warning. This paper focuses on using a cross-validation-based sequential probability ratio test (CV-SPRT) to conduct anomaly detection on in-situ monitored failure precursor parameters to provide early warning of failure of PPTC resettable circuit protection devices. CV-SPRT can solve the problem of model parameter selection faced by traditional SPRT and reduce false alarms and missed alarms from anomaly detection.
II. FAILURE PRECURSOR PARAMETERS
Failure modes, mechanisms, and effects analysis (FMMEA) [12][13] and a series of experimental tests were conducted to determine the failure precursor parameters of PPTC resettable circuit protection devices. The failure modes of PPTC resettable circuit protection devices were defined by authors as follows [1]:
1) A device trips at less than normal current (≤Ihold) at the specific ambient temperature. 2) A device does not trip at fault current (≥Itrip) at the specific ambient temperature. 3) Deviations in the trip time (trip time becoming longer or shorter). Trip in a longer time increases the risk of damage to the circuit because of the longer exposure of the circuit to a high fault current. A shorter trip time makes the circuit more likely to be disturbed by noisy currents, which may result in unnecessary faults in circuit operation. 4) A device becomes high in resistance after reset. The increase in resistance after reset shortens trip time and decreases the voltage drops on other components, which may cause abnormal operation of the circuit. 5) Opens or increases in resistance occur at the physical internal connections between different parts of a device. 6) Physical cracks, breaks, separations, and/or degradation in the dielectric materials occur in the outside package.
Table 1 shows the potential precursor parameters based on
the results of FMMEA. The current through the device, the voltage across the device, and the surface temperature of the device can be monitored in situ. The resistance during the trip can be calculated by Ohm theory using the monitored current and voltage. The resistance after trip can be measured by a data-logger using a 4-wire connection. Trip time can be calculated by the difference between the time when the fault current occurs and the time when the current decreases to the hold current. This can be measured by a current meter or sensors.
TABLE 1: POTENTIAL FAILURE PRECURSOR PARAMETERS Potential Failure Precursors In-situ monitoring possible? Trip time Yes Resistance after reset Yes
Resistance during trip Yes (by measure current and voltage of the device during trip)
Surface temperature Yes
Current through the devices at normal conditions Yes
Trickle current Yes Voltage across the device Yes
Trip cycle tests were designed to determine whether the
trip time, current, resistance, and surface temperature are indicators of degradation in PPTC resettable circuit protection devices. Trip cycle tests were conducted at four different

Copyright (c) 2011 IEEE. Personal use is permitted. For any other purposes, permission must be obtained from the IEEE by emailing [email protected].
This article has been accepted for publication in a future issue of this journal, but has not been fully edited. Content may change prior to final publication.
TDMR-2011-07-0097.final 3
ambient temperature conditions: -10°C, room temperature (RT, 19–23°C), 60°C, and 85°C, respectively. Four samples were tested in each condition. In each cycle, current through the circuit protection device, voltage across the device, surface temperature, trip time, and resistance in the resetting process (power switched off) of the device were monitored.
Programmable 4-channel power supply: Agilent 6705 (I, V, and Trip time)
Radial through-hole PPTC resettable device (in chamber for -10 °C, 60 °Cand 85 °C), in room for RT.
Thermocouple
4-wire connection resistance measurement
Agilent 34970A data logger (surface temperature and resistance)
VEE and Labview programs to communicate with power supply and data logger
Fig. 3: Trip cycle test setup. Fig. 3 shows the setup of the trip cycle test. The Labview
program was used to control a data logger and the VEE program was used to control a 4-channel power supply, each channel of which provided power to one PPTC resettable circuit protection device. The VEE program recorded the time when the initial high current occurred and the time when the current reduced to the hold current at ambient conditions; it then calculated the trip time of each trip cycle. An Agilent Data Logger 34970A was used to monitor the resistance in the resetting process and the surface temperatures of each PPTC device. A 4-wire connection resistance measurement was used to remove the effects of the wire and the connection. The surface temperature was measured by thermocouples, each of which was attached on each side of the PPTC circuit protection device; the maximum temperature of these two thermocouples was used to determine the surface temperature of the device.
Fig. 4 shows the current profile in one trip cycle. When the power was switched on, a high current was input to the PPTC circuit protection device (20A for all conditions). The PPTC device was heated by Joule heat and tripped to a high resistance state in several seconds. When the current reduced to the specified hold current at the environmental temperature, the power supply was kept on for 1 additional minute (called 1 minute trip endurance). After that, the power was switched off for 7 minutes to cool the PPTC device and reset it to a low resistance state.
Power off 7 mins
Trip time (Several seconds)
20 A
Hold current
Current
Time
Trip endurance (1 min)
Trickle current
Fig. 4: Current profile in one trip cycle (current vs. time).
Based on the experimental results, the analysis of correlations among the monitored parameters, and the mapping between the changes in monitored parameters and the observed failures, trip time, resistance after reset, and surface temperature have been determined as precursor parameters. Since a high correlation between the trip time and surface temperature were observed, and since trip time always indicate failures earlier than surface temperature, it is reasonable to use trip time (as shown in Fig. 5) and resistance after reset (as shown in Fig. 6) to conduct anomaly detection of PPTC resettable circuit protection devices.
Number of Cycles
Trip
Tim
e (s
)
200180160140120100806040201
11
10
9
8
7
6
5
4
3(X 100)
85 °C, 20A
60 °C, 20ART, 20A
-10 °C, 20A
Fig. 5: Trip time at different conditions (each point is the average of every 100
cycles).
Number of Cycles
Mini
mum
Res
istan
ce (O
hm)
200180160140120100806040201
0.12
0.11
0.10
0.09
0.08
0.07
0.06
0.05
0.04
0.03(X 100)
85 °C, 20A
60 °C, 20A
RT, 20A
-10 °C, 20A
Fig. 6: Minimum resistance after reset at different conditions (each point is the
average of every 100 cycles).
III. CROSS-VALIDATION-BASED SPRT (CV-SPRT)
There have been no publications on anomaly detection of PPTC resettable circuit protection devices. In this study, a novel method, CV-SPRT, is developed to monitor the trip time and resistance after reset to detect anomalies. CV-SPRT combines the advantages of both SPRT in in-situ anomaly detection and CV in model parameter selection to reduce the number of false and missed alarms.
SPRT is a sequential statistical binary hypothesis test introduced by Wald [14]. SPRT is different from traditional hypothesis testing where it is only after all the data are collected that analysis is conducted and conclusions are

Copyright (c) 2011 IEEE. Personal use is permitted. For any other purposes, permission must be obtained from the IEEE by emailing [email protected].
This article has been accepted for publication in a future issue of this journal, but has not been fully edited. Content may change prior to final publication.
TDMR-2011-07-0097.final 4
drawn [15]. In SPRT, single data is monitored in situ and analyzed directly once it is collected. This ability enables SPRT for the detection of statistical changes against a null hypothesis at the earliest possible time or with the smallest sample size [14]. SPRT has been used in in-situ monitoring, anomaly detection, decision making for electronics, structures, and process controls [10][16]. General anomaly detection using SPRT is shown in Fig. 7.
SPRT Anomaly detection In-situ monitored data
Training data
Fig. 7: Anomaly detection procedure using SPRT. The training data, which are healthy data from a system,
can be obtained from historic data or from stable operational phases when the product is known to be healthy. Statistical features of the training data, such as the distribution, are extracted to create a detection baseline. In the detection procedure, in-situ monitored data are compared with the baseline sequentially using SPRT to detect anomalies.
Healthy
Alarm
Reset the corresponding
SPRTj to 0
Yes
Within Range (A,B)?
<=A>=B
Acquired data: xs
k=k+1
Initialization:i=k=1
i,k=k+1
))()(
ln(0
4~1
k
is s
sjj xf
xfSPRT
Fig. 8: SPRT procedure.
The binary hypothesis of SPRT includes one null
hypothesis and one or more alternative hypotheses. For a normal distribution, the null hypothesis H0 represents the healthy state, with mean = 0 and standard deviation = σ. The alternative hypothesis includes four cases: 1) H1: the mean of the test data has shifted high to +M, with no change in standard deviation; 2) H2: the mean of the test data has shifted low to –M, with no change in standard deviation; 3) H3: the variance of test data has increased to Vσ2, with no change in mean; 4) H4: the variance of test data has decreased to σ2/V, with no change in mean. M and V are the predetermined system disturbance magnitudes, which are decided by the user, and in general they are several times the standard deviation of the training data.
Fig. 8 shows the procedure of SPRT. The SPRT calculates the SPRT index for each in-situ monitored data point and compares the SPRT index with the boundary to make a decision. The SPRT index is the natural logarithm of the ratio of the probability that accepts the null hypothesis to the probability that accepts the alternative hypothesis, as shown in equation (1):
(1)
where SPRTj=1~4 is the SPRT index and LRj is the likelihood ratio for an independent process. Hj is the jth alternative (unhealthy) hypothesis discussed above and H0 is the null (health) hypothesis. SPRTj is defined as equation (2):
(2) The SPRT index can be calculated as long as the
distribution of the detected data is available. Four SPRT index formulas for normal distribution are shown in Equations (3)–(6) [19]. They are used to calculate the SPRT index for mean shift to higher, mean shift to lower, variance increase, and variance decrease of the monitored data, respectively.
(3)
(4)
(5)
(6) SPRT uses the probabilities of missed alarms and false
alarms to create the thresholds of acceptance and rejection of the null hypothesis, as shown in equation (7).
(7)
Each SPRT index is compared to the decision boundaries
(A, B). For each comparison, there are three possible outcomes: 1) the lower limit is reached, in which case the healthy hypothesis (H0) is accepted, the corresponding index is reset, and sampling continues; 2) the upper limit is reached, in which case the alarm is given, the corresponding index is reset, and sampling continues; or 3) neither limit is reached, in which case the information is not sufficient to make a conclusion, and the sampling continues.
Four model parameters should be determined for SPRT detection: the system disturbance magnitude, M, which is m times the standard deviation of the training data; the variation factor, V; the false alarm probability, α; and the missed alarm probability, β. In practice, these model parameters are selected by experience. Even though the system disturbance magnitudes selected are in this recommended range [19][20], the actual false alarm probability and/or missed alarm probability may be higher than the user-allowed values. Developing a systematic model parameter selection method
)2
(1
21
n
ii
MxMSPRT
)2
(1
22
n
ii
MxMSPRT
VnVx
SPRT
n
ii
ln)2/()1(2 2
1
2
4
VnV
xSPRT
n
ii
ln)2/()11(2 21
2
3
)1ln( ),1
ln(
BA
n
i i
jijj )H(x
)H(xLRSPRT
1 0Pr
Prln)ln(
n
i i
ijn
i i
ji
n
jnj
xfxf
)H(x
)H(x
true} given Hnce {Xy of sequeprobabilit true Hgiven }Xsequence {of yprobabilit
LR
1 01 0
0
)()(
Pr
Pr

Copyright (c) 2011 IEEE. Personal use is permitted. For any other purposes, permission must be obtained from the IEEE by emailing [email protected].
This article has been accepted for publication in a future issue of this journal, but has not been fully edited. Content may change prior to final publication.
TDMR-2011-07-0097.final 5
for SPRT is necessary to improve its performance and reduce false and missed alarms. However, based on our literature review, there is no publication on a systemic method for SPRT model parameter selection.
Some methods, such as simulated annealing algorithms [21][22], genetic algorithms [23] [24], and particle swarm optimization [25], are reported as general model parameter selection and optimization methods. However, all these optimization methods are required to optimize their own parameters first; otherwise, the performance of these optimization algorithms will be affected. In this study, a k-fold cross-validation (CV) [26][27][28] method is used as a systematic method to select a proper model parameter set (m, V, α, β) for SPRT without the need for experience. CV is much simpler and more accurate than other methods. The shortcoming of CV is its relatively high computation power consumption.
The procedure of model parameter selection by k-fold CV is shown in Fig. 9. The first step is to select the training dataset, which is composed entirely of healthy data, which become the training data for SPRT after the proper model parameter set is obtained. After the training data is selected, a model parameter set (m, V, α, β) is assigned to SPRT. For each assigned model parameter set, the actual false alarm probability (α') and missed alarm probability (β') are then calculated by k-fold CV, whose process is indicated by the flowchart inside the dashed box.
Training data
Subset 1 Subset 2 Subset k…
Subset iRemaining k-1 subsets
SPRT
False alarm probability αi’ and missed alarm probability βi’ of ith
iteration
i=k?
i=i+1
Initial i=1
False alarm probability α’and missed alarm probability β’ with
(m,V,α,β)
α’<= α,β’<= β, and
to Min. (α’+β’)?
Next (m,V ,α,β)
Initial(m,V,α,β)
Best model parameters (m,V,α,β)
No
No
Yes
Yes
Randomly split
Abnormal dataset i
Fig. 9: Model parameter selection procedure by k-fold CV. In the k-fold CV process, all of the training data are
partitioned into k subsets of equal or nearly equal size. A total
of k iterations should be conducted to calculate the actual false alarm probability (α') and missed alarm probability (β'). In each of the k iterations, one different subset is selected as the original validation data, and the remaining k–1 subsets are the training data. If SPRT is only run on the original validation data, which is all healthy data, only false alarm probability can be calculated. In order to calculate the actual missed alarm probability of SPRT, an abnormal dataset should be added into the original validation dataset, shown as the filled-in boxes in Fig. 9 and Fig. 10.
Iteration Subset 1 Subset 2
Subset 3 … Subset
k 1 V
V A
Fig. 10: Adding an abnormal dataset into an original validation dataset to calculate the missed alarm probability (V: validation dataset; A: abnormal
dataset). The abnormal dataset can be generated by randomly
picking up data outside of the range of [µ–m×σ, µ+m×σ]. Here, the µ and σ are the mean and standard deviation of the training data in each CV iteration (the remaining k–1 subsets of the entire training data). In each iteration, both false alarms and missed alarms can be identified based on a comparison of the detection results with the validation data and abnormal data. The false alarm probability and missed alarm probability can be calculated by equations (8) and (9). The process is repeated k times until each of the subsets has been selected as the original validation dataset. The mean of the k false alarm probabilities and the mean of the k missed alarm probabilities are calculated by equations (10) and (11) as the final false alarm probability (α') and final missed alarm probability (β') when using all of the training data (without the abnormal data) and the selected model parameter set.
(8)
(9)
(10)
(11)
The actual false alarm probability and missed alarm probability are compared with the ones in the selected model parameter set. If both the final false alarm probability and the missed alarm probability are less than the user-specified false alarm probability and missed alarm probability, respectively, the model parameter set is considered as a proper model parameter set for SPRT, but it might not be the optimal model set. The optimal model parameter set can be defined as the
'1'
'1'
'
'
i
i
th
th
i
th
th
i
k
k
iterationiindataabnormalofNumberiterationiinalarmsmissedofNumber
iterationiindatavalidationoriginalofNumberiterationiinalarmsfalseofNumber
Original validation dataset
Abnormal dataset Updated validation dataset

Copyright (c) 2011 IEEE. Personal use is permitted. For any other purposes, permission must be obtained from the IEEE by emailing [email protected].
This article has been accepted for publication in a future issue of this journal, but has not been fully edited. Content may change prior to final publication.
TDMR-2011-07-0097.final 6
one with the minimum error probability, which is the minimum sum of the false and missed alarm probabilities. If the criteria are not satisfied, another model parameter set based on the range and interval in Table 2 should be re-assigned and the performance of the SPRT with the model parameter should be evaluated by k-fold CV again. A model parameter set should be updated when the training data are updated since the actual false alarm and missed alarm probabilities are calculated based on the specific training data.
TABLE 2: RANGE AND CHANGE INTERVAL OF SPRT MODEL PARAMETERS
Parameter Range Start value Interval
m 2–4 2 1
V 2–4 2 1
α 0.005–0.05 0.005 0.005
β 0.005–0.05 0.005 0.005
IV. ANOMALY DETECTION RESULTS OF PPTC RESETTABLE CIRCUIT PROTECTION DEVICES
As a demonstration, trip time under -10°C (as shown in Fig. 5) condition was used individually for anomaly detection by CV-SPRT. First, the first 20 trip-time data points, which represents the trip-time values in the first 2000 cycles, were selected as training data for anomaly detection of trip time. The data may be normalized first using equation (12), where xi' is normalized data, xi is original data, and μ and σ are the mean and standard deviation of the training data, respectively. If the data are not normally distributed, a transformation, such as the Box-Cox transformation [29] or the Johnson transformation [30], may be used to transform the data into a normal distribution. Here, the normalized training data was normally distributed.
(12) Then the model parameters (m, V, α, β) were determined by
the k-fold CV process. Parameter k of a k-fold CV is determined based on the size of the training data. If the size is small, a higher k can be chosen. Otherwise, a lower k should be chosen. The higher the k, the more accurate the error rate calculation is. However, the variance of the detection error rate estimation becomes large and the entire CV process is more time-consuming. In this case, 5-fold CV is chosen. An abnormal dataset with 20 abnormal data points, which were randomly generated out of the range of [µ-m×σ, µ+m×σ], were added into each validation set. Here the µ and σ are the mean and standard deviation of the remaining 4 subsets of the training data in each iteration. The updated validation dataset is used to calculate the actual false alarm and missed alarm probabilities in each iteration.
After the 5-fold CV process, the SPRT model parameter set (m=4, V=4, α =0.005, and β=0.01) was selected for trip time data under -10°C condition. The SPRT then used
these model parameters and the training data to detect the anomalies in-situ when a new trip time data point was collected. Fig. 11 shows the anomaly detection results of trip time using the model parameter set (4, 4, 0.005, 0.01), by which no false alarms or missed alarms were reported. Fig. 12 is a plot of anomaly detection for the trip time using a randomly picked model parameter set (2, 2, 0.02, 0.01), by which some false alarms (shown in zoom-in view) were detected in the training data.
Fig. 11: Anomaly detection of trip time under -10°C conditions.
Fig. 12: Anomaly detection of trip time under -10°C conditions using model
parameters (2, 2, 0.02, 0.01) (false alarms detected).
Number of Cycles
Trip
tim
e (s
)
The number of cycles @ Anomalies
Number of Cycles
Trip time data
(X 100)
Zoom-in
Number of Cycles
Trip
tim
e (s
)
The number of cycles @ Anomalies
Number of Cycles
Trip time data
(X 100)
Zoom-in
i
i
xx '
Copyright (c) 2011 IEEE. Personal use is permitted. For any other purposes, permission must be obtained from the IEEE by emailing [email protected].
This article has been accepted for publication in a future issue of this journal, but has not been fully edited. Content may change prior to final publication.
TDMR-2011-07-0097.final 7
CV can identify more than one proper model parameter sets for SPRT and can ensure the selection of the model parameter set with lowest sum of false and missed alarm rates among all the proper model parameter sets. Therefore, CV-
SPRT can reduce the error rate of the anomaly detection. One point that should be clarified is that in anomaly detection the false alarm is the alarm triggered by signal that is not defined as an anomaly (for example, anomalies detected in training
data are false alarms), instead of an anomaly detected before failure. Anomaly detected before failure is a valuable early warning of failure. Early warning allows people to take actions, such as maintenance and replacement, to avoid the occurrence of failures. The other point is that the actual false alarm or missed alarm rate is affected by the combination of all four parameters in the set. So when we randomly chose a model parameter set, the actual false alarm and/or missed alarm rates may be higher than what were expected; while the model parameter set selected by CV-SPRT had a minimum
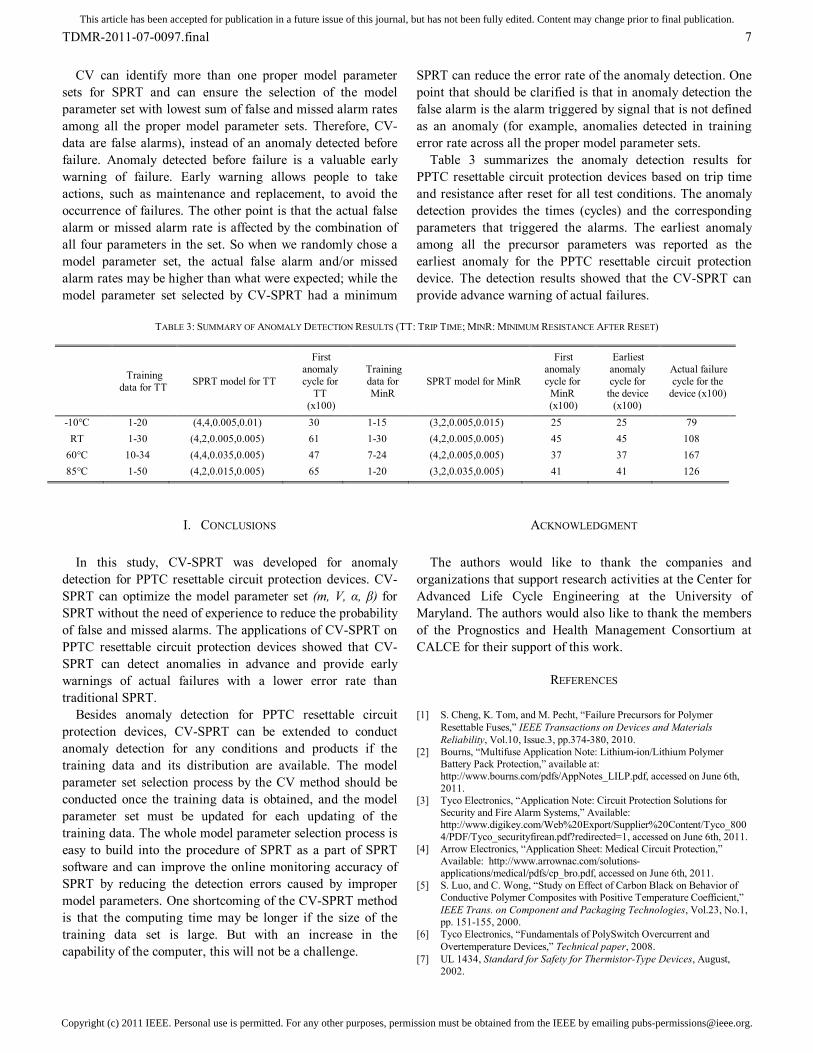
error rate across all the proper model parameter sets. Table 3 summarizes the anomaly detection results for
PPTC resettable circuit protection devices based on trip time and resistance after reset for all test conditions. The anomaly detection provides the times (cycles) and the corresponding parameters that triggered the alarms. The earliest anomaly among all the precursor parameters was reported as the earliest anomaly for the PPTC resettable circuit protection device. The detection results showed that the CV-SPRT can provide advance warning of actual failures.
TABLE 3: SUMMARY OF ANOMALY DETECTION RESULTS (TT: TRIP TIME; MINR: MINIMUM RESISTANCE AFTER RESET)
I. CONCLUSIONS
In this study, CV-SPRT was developed for anomaly detection for PPTC resettable circuit protection devices. CV-SPRT can optimize the model parameter set (m, V, α, β) for SPRT without the need of experience to reduce the probability of false and missed alarms. The applications of CV-SPRT on PPTC resettable circuit protection devices showed that CV-SPRT can detect anomalies in advance and provide early warnings of actual failures with a lower error rate than traditional SPRT.
Besides anomaly detection for PPTC resettable circuit protection devices, CV-SPRT can be extended to conduct anomaly detection for any conditions and products if the training data and its distribution are available. The model parameter set selection process by the CV method should be conducted once the training data is obtained, and the model parameter set must be updated for each updating of the training data. The whole model parameter selection process is easy to build into the procedure of SPRT as a part of SPRT software and can improve the online monitoring accuracy of SPRT by reducing the detection errors caused by improper model parameters. One shortcoming of the CV-SPRT method is that the computing time may be longer if the size of the training data set is large. But with an increase in the capability of the computer, this will not be a challenge.
ACKNOWLEDGMENT
The authors would like to thank the companies and organizations that support research activities at the Center for Advanced Life Cycle Engineering at the University of Maryland. The authors would also like to thank the members of the Prognostics and Health Management Consortium at CALCE for their support of this work.
REFERENCES
[1] S. Cheng, K. Tom, and M. Pecht, “Failure Precursors for Polymer Resettable Fuses,” IEEE Transactions on Devices and Materials Reliability, Vol.10, Issue.3, pp.374-380, 2010.
[2] Bourns, “Multifuse Application Note: Lithium-ion/Lithium Polymer Battery Pack Protection,” available at: http://www.bourns.com/pdfs/AppNotes_LILP.pdf, accessed on June 6th, 2011.
[3] Tyco Electronics, “Application Note: Circuit Protection Solutions for Security and Fire Alarm Systems,” Available: http://www.digikey.com/Web%20Export/Supplier%20Content/Tyco_8004/PDF/Tyco_securityfirean.pdf?redirected=1, accessed on June 6th, 2011.
[4] Arrow Electronics, “Application Sheet: Medical Circuit Protection,” Available: http://www.arrownac.com/solutions-applications/medical/pdfs/cp_bro.pdf, accessed on June 6th, 2011.
[5] S. Luo, and C. Wong, “Study on Effect of Carbon Black on Behavior of Conductive Polymer Composites with Positive Temperature Coefficient,” IEEE Trans. on Component and Packaging Technologies, Vol.23, No.1, pp. 151-155, 2000.
[6] Tyco Electronics, “Fundamentals of PolySwitch Overcurrent and Overtemperature Devices,” Technical paper, 2008.
[7] UL 1434, Standard for Safety for Thermistor-Type Devices, August, 2002.
Training data for TT SPRT model for TT
First anomaly cycle for
TT (x100)
Training data for MinR
SPRT model for MinR
First anomaly cycle for
MinR (x100)
Earliest anomaly cycle for
the device (x100)
Actual failure cycle for the
device (x100)
-10°C 1-20 (4,4,0.005,0.01) 30 1-15 (3,2,0.005,0.015) 25 25 79 RT 1-30 (4,2,0.005,0.005) 61 1-30 (4,2,0.005,0.005) 45 45 108
60°C 10-34 (4,4,0.035,0.005) 47 7-24 (4,2,0.005,0.005) 37 37 167 85°C 1-50 (4,2,0.015,0.005) 65 1-20 (3,2,0.035,0.005) 41 41 126

Copyright (c) 2011 IEEE. Personal use is permitted. For any other purposes, permission must be obtained from the IEEE by emailing [email protected].
This article has been accepted for publication in a future issue of this journal, but has not been fully edited. Content may change prior to final publication.
TDMR-2011-07-0097.final 8
[8] S. Cheng, M. Azarian, and M. Pecht, “Sensor System for Prognostics and Health Monitoring,” Sensors, No. 10, pp.5774-5797, 2010.
[9] M. Pecht, Prognostics and Health Management of Electronics. New York: Wiley-Interscience, 2008.
[10] M. Pecht, M. and R. Jaai, “A Prognostics and Health Management Roadmap for Information and Electronics-Rich Systems,” Microelectronics Reliability, Volume 50, Issue 3, pp. 317-323, 2010.
[11] S. Cheng and M. Pecht, “A Fusion Prognostics Method for Remaining Useful Life Prediction of Electronic Products,” 5th Annual IEEE Conference on Automation Science and Engineering, Bangalore, India, pp. 102-107, August 22-25, 2009.
[12] M. Pecht and A. Dasgupta, “Physics-of-Failure: An Approach to Reliable Product Development”, Journal of the Institute of Environmental Sciences, Vol. 38, pp. 30-34, 1995.
[13] IEEE Standard 1413.1-2002, IEEE Guide for Selecting and Using Reliability Predictions Based on IEEE 1413, IEEE Standard, 2003.
[14] A. Wald, Sequential Analysis, John Wiley & Sons, New York, NY, 1947. [15] H. Sohn, D. Allen, K. Worden, and C. Farrar, “Statistical Damage
Classification Using Sequential Probability Ratio Tests,” Structural Health Monitoring, Vol. 2(1), pp. 57–74, 2003.
[16] K. Whisnant, K. C. Gross, and N. Lingurovska, “Proactive fault monitoring in enterprise servers,” in Proceedings of the International Conference on Computer Design, pp. 3-10, June 2005.
[17] S. Cheng, K. Tom, and M. Pecht, “A Wireless Sensor System for Prognostics and Health Management,” IEEE Sensors Journal, Volume 10, Issue 4, pp. 856-862, 2010.
[18] Z. Stoumbos and M. Reynolds, “The SPRT Control Chart for the Process Mean with Samples Starting at Fixed Times,” Nonlinear Analysis, 2, pp.1-34, 2001.
[19] A. Miron, “A Wavelet Approach for Development and Application of A Stochastic Parameter Simulation System,” PhD Dissertation in Nuclear Engineering of University of Cincinnati, 2001.
[20] J. Herzog, S. Wegerich, R. Singer, K. Gross, “Theoretical Basis of the Multivariate State Estimation Technique (MSET),” Argonne National Laboratory NT Technical Memorandum No. 49, 1997.
[21] P.F. Pai and W.C. Hong, “Software Reliability Forecasting by Support Vector Machines with Simulated Annealing Algorithms,” Journal of Systems and Software, Vol. 79, no. 6, pp. 747-755, 2006.
[22] S. Lin, Z. Lee, S. Chen, and T. Tseng, “Parameter Determination of Support Vector Machine and Feature Selection Using Simulated Annealing Approach,” Applied Soft Computing, Vol.8, Issue 4, pp.1505-1512, 2008.
[23] K.Y. Chen, “Forecasting Systems Reliability based on Support Vector Regression with Genetic Algorithms,” Reliability Engineering & System Safety, Vol. 92, pp. 423- 432, 2007.
[24] A. Oliveira, P. Bragaa, R. Lima, and M. Cornélioa, “GA-based Method for Feature Selection and Parameters Optimization for Machine Learning Regression Applied to Software Effort Estimation,” Information and Software Technology, Vol. 52, Issue 11, November 2010, Pages 1155-1166.
[25] X. Li, S. Yang and J. Qi, “A New Support Vector Machine Optimized by Improved Particle Swarm Optimization and Its Application,” Journal of Central South University of Technology, Vol. 13, Issue 5, pp.568-572, 2006.
[26] B. Efron, “Estimating the Error Rate of a Prediction Rule: Improvement on Cross validation,” Journal of American Statistical Association, 78:316–331, 1983.
[27] M. Browne, “Cross validation Methods,” Journal of Mathematical Psychology, Volume 44, Issue 1, pp. 108-132, 2000.
[28] M. Stone, “Cross-Validatory Choice and Assessment of Statistical Predictions (with discussion),” Journal of the Royal Statistical Society, Series B, 36, pp.111-147, 1974.
[29] G. Box and D. Cox, “An Analysis of Transformations,” Journal of the Royal Statistical Society, Series B, Vol. 26, pp. 211-246, 1964.
[30] Y. Chou, A. Polansky, and R. Mason, “Transforming Non-normal Data to Normality in Statistical Process Control,” Journal of Quality Technology, Vol. 30, No.2, pp. 133-141, 1998.
Shunfeng Cheng, IEEE member, has BS and MS degrees in Mechanical Engineering from Huazhong University of Science and Technology, China. He has Ph.D degree at the Center for Advanced Life Cycle Engineering (CALCE), University of Maryland, College Park. He was working on nondestructive testing methods and technology before 2006. From 2006 to present, he has been working on sensor systems for prognostics and health management, advanced data-driven methods, and physics of failure methods for prognostics. He is now working with Intel as a process TD
engineer.
Kwok Tom, IEEE member, has BS and MS degrees in Electrical Engineering from George Washington University. He is employed by the Army Research Laboratory. A significant amount of his time has been spent in the design of the fuse in the PATRIOT PAC-2 missile system. His work has been in the areas of flight test analysis, simulation, and evaluation of improved signal processors for target detection, target detection algorithm development, target signature collections, hardware-in-the-loop evaluations of the various fuse designs, contracting officer
technical representative on development of fuse design, and technical consultant to the Lower Tier Project Office. He was a team leader for the signal processing team on the Steel Crater program dealing with the application of ultra-wide band radar in the detection and identification of underground objects from 1993 to 1995. From 1995 to 1999, he was the team leader on the development of a Ka band, monopulse, fully polarimetric, instrumentation-grade radar system. From 2004 to present, he has been an integral part of the prognostic and diagnostics program and is currently the team leader for the P&D for condition-based maintenance program.
Prof. Michael Pecht has an MS in Electrical Engineering and an MS and PhD in Engineering Mechanics from the University of Wisconsin at Madison. He is a Professional Engineer, an IEEE Fellow, an ASME Fellow and an IMAPS Fellow. He was awarded the highest reliability honor, the IEEE Reliability Society’s Lifetime Achievement Award in 2008. He has previously received the European Micro and Nano-Reliability Award for outstanding contributions to reliability research, 3M Research Award for electronics packaging, and the IMAPS William D. Ashman Memorial Achievement Award for his
contributions in electronics reliability analysis. He served as chief editor of the IEEE Transactions on Reliability for eight years and on the advisory board of IEEE Spectrum. He is chief editor for Microelectronics Reliability and an associate editor for the IEEE Transactions on Components and Packaging Technology. He is the founder of CALCE (Center for Advanced Life Cycle Engineering) at the University of Maryland, which is funded by over 150 of the world’s leading electronics companies. He is also a Chair Professor in Mechanical Engineering and a Professor in Applied Mathematics at the University of Maryland. He has written more than twenty books on electronic products development, use and supply chain management and over 400 technical articles. He has consulted for over 100 major international electronics companies, providing expertise in strategic planning, design, test, prognostics, IP and risk assessment of electronic products and systems.