anon - housing thesis 09 12 2011
TRANSCRIPT
8/4/2019 Anon - Housing Thesis 09 12 2011
http://slidepdf.com/reader/full/anon-housing-thesis-09-12-2011 1/22
Disclaimer: This communication does not constitute a solicitation for any investments or any investment products and is for informational purposes only. Any views expressed in this messageare those of the individual. Any comments or statements made herein do not necessarily reflect those of the individual’s employer, or their respective subsidiaries, affiliates, officers, directors,
partners or employees. No representation is made as to, and no responsibility or liability is accepted for, the accuracy or completeness , express or implied , of the information provided herein or
any other subject matter hereof. Information contained herein is subject to change at any time without notice.
Housing Bull ThesisSeptember 11, 2011
Intro
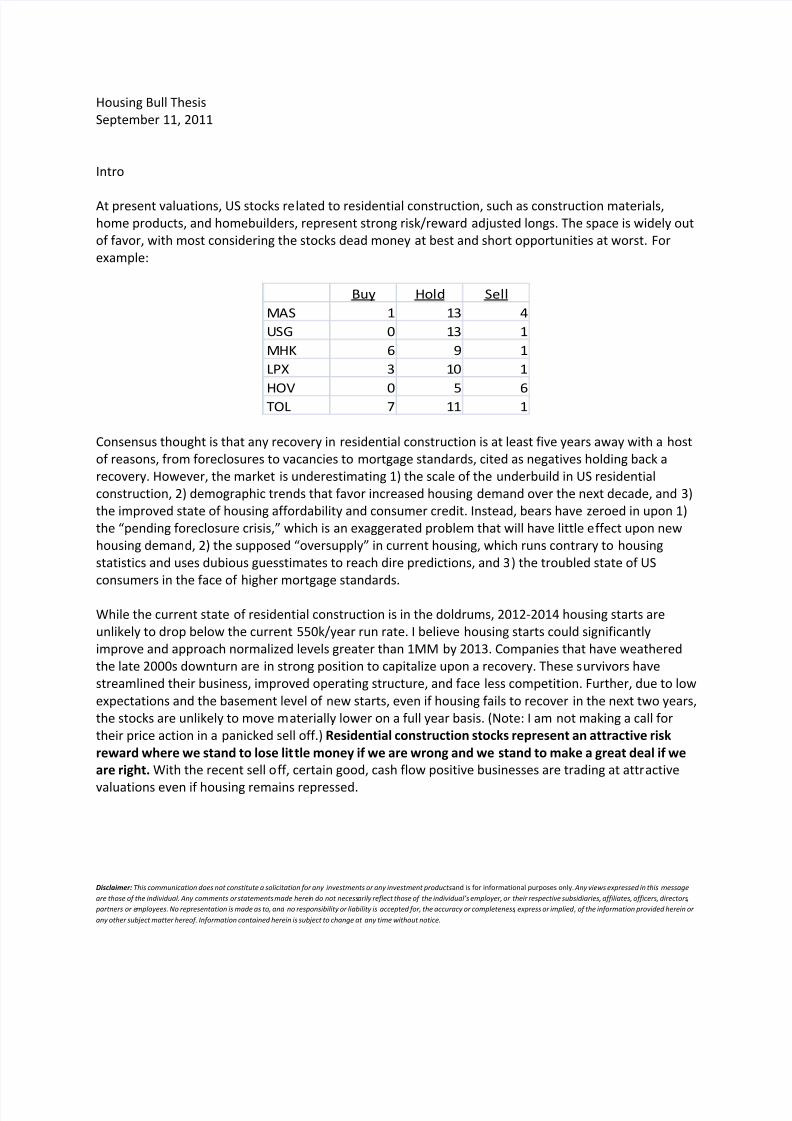
At present valuations, US stocks related to residential construction, such as construction materials,home products, and homebuilders, represent strong risk/reward adjusted longs. The space is widely outof favor, with most considering the stocks dead money at best and short opportunities at worst. Forexample:
Buy Hold SellMAS 1 13 4USG 0 13 1MHK 6 9 1LPX 3 10 1
HOV 0 5 6TOL 7 11 1
Consensus thought is that any recovery in residential construction is at least five years away with a hostof reasons, from foreclosures to vacancies to mortgage standards, cited as negatives holding back arecovery. However, the market is underestimating 1) the scale of the underbuild in US residentialconstruction, 2) demographic trends that favor increased housing demand over the next decade, and 3)the improved state of housing affordability and consumer credit. Instead, bears have zeroed in upon 1)the “pending foreclosure crisis,” which is an exaggerated problem that will have little effect upon newhousing deman d, 2) the supposed “oversupply” in current housing, which runs contrary to housingstatistics and uses dubious guesstimates to reach dire predictions, and 3) the troubled state of USconsumers in the face of higher mortgage standards.
While the current state of residential construction is in the doldrums, 2012-2014 housing starts areunlikely to drop below the current 550k/year run rate. I believe housing starts could significantlyimprove and approach normalized levels greater than 1MM by 2013. Companies that have weatheredthe late 2000s downturn are in strong position to capitalize upon a recovery. These survivors havestreamlined their business, improved operating structure, and face less competition. Further, due to lowexpectations and the basement level of new starts, even if housing fails to recover in the next two years,the stocks are unlikely to move materially lower on a full year basis. (Note: I am not making a call fortheir price action in a panicked sell off.) Residential construction stocks represent an attractive riskreward where we stand to lose lit tle money if we are wrong and we stand to make a great deal if weare right. With the recent sell off, certain good, cash flow positive businesses are trading at attractive
valuations even if housing remains repressed.
8/4/2019 Anon - Housing Thesis 09 12 2011
http://slidepdf.com/reader/full/anon-housing-thesis-09-12-2011 2/22
8/4/2019 Anon - Housing Thesis 09 12 2011
http://slidepdf.com/reader/full/anon-housing-thesis-09-12-2011 3/22
Disclaimer: This communication does not constitute a solicitation for any investments or any investment products and is for informational purposes only. Any views expressed in this messageare those of the individual. Any comments or statements made herein do not necessarily reflect those of the individual’s employer, or their respective subsidiaries, affiliates, officers, directors,
partners or employees. No representation is made as to, and no responsibility or liability is accepted for, the accuracy or completeness , express or implied , of the information provided herein or
any other subject matter hereof. Information contained herein is subject to change at any time without notice.
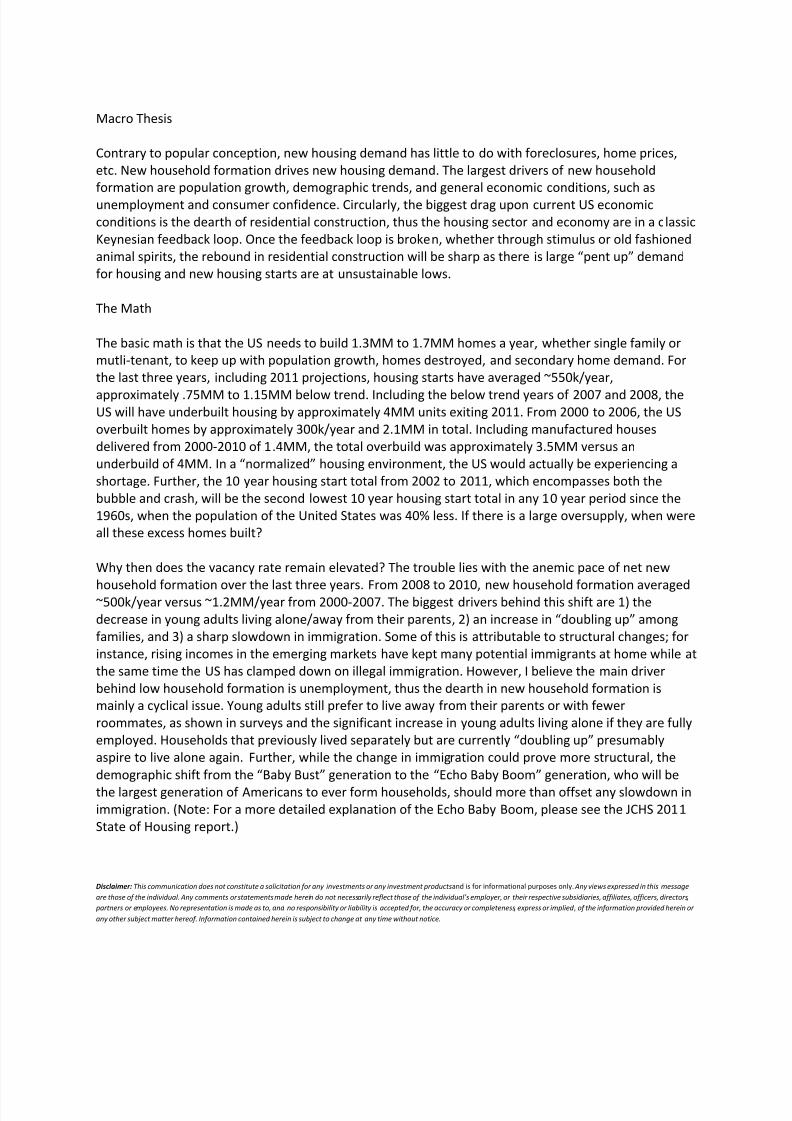
I believe the below trend new household formation represents pent up demand for housing. The USCensus Bureau estimates there was a 1.4MM decrease in “not doubled up” households from 2008 to2010, a 2.2MM increase in doubled up households, and a 0.8MM increase in total households. (So1.4MM plus 0.8MM = 2.2MM.) (Note: a “doubled up” household includes young adult s living at home.) Iassume that the entire 1.4MM decrease in “not doubled up” house holds represents pent up demand.Approximately 77% of all households were “not doubled up” in 2008, so I assume 77%, or 0.6MM, of the0.8MM increase in overall households that chose to double up also represents pent up demand. Thus Iestimate pent up demand for housing currently living in “doubled up” housing at 2. 0MM. Interestingly,this roughly corresponds with the difference between trend household growth and population growth,as illustrated here:
Now we must estimate the number of “excess” vacant houses. I will explain this further in a subsequentsection, but estimating vacancies is more art than science. Most sell side analysts and housing expertsput the total number of excess vacancies between 1.5MM and 3MM, with some very bearish analysts at5MM. I do not think a model of housing starts versus new household formation versus inventories willbe an accurate forecasting tool; although, humorously, I do indulge traditional methods and provide oneat the end of this report. However, I believe underbuilding by 1MM units a year with 2.0MM in pent up

8/4/2019 Anon - Housing Thesis 09 12 2011
http://slidepdf.com/reader/full/anon-housing-thesis-09-12-2011 4/22
Disclaimer: This communication does not constitute a solicitation for any investments or any investment products and is for informational purposes only. Any views expressed in this messageare those of the individual. Any comments or statements made herein do not necessarily reflect those of the individual’s employer, or their respective subsidiaries, affiliates, officers, directors,
partners or employees. No representation is made as to, and no responsibility or liability is accepted for, the accuracy or completeness , express or implied , of the information provided herein or
any other subject matter hereof. Information contained herein is subject to change at any time without notice.
demand versus 1.5MM to 3MM in excess vacancies sets the stage for a large rebound in housing in thenext two years.
NOTE: I do not adjust my forecast for manufactured homes. While it would be technically moreaccurate, I believe macroeconomic forecasts in general have wide margins of error, so I have crudelyswept manufactured housing into a “fudge factor.” M anufactured homes delivered run at about 50k ayear currently and have declined year over year in every year since 2000, which is the earliest year Ihave data on. While they will probably return to 100-200k a year in a housing recovery, and perhapsmore if consumer tastes for manufactured housing improve, in the face of 2.0MM in pent up housingand housing starts running 1MM a year below trend, I do not feel manufactured housing is a large“delta.”
Foreclosures
The media has heavily covered the “pending foreclosure crisis” yet the concept remains poorly defined.Bearish estimates for future foreclosures range as high as 11MM, or roughly 20% of total mortgagesoutstanding. However, I believe the consensus overestimates the threat foreclosures pose to a rebound
in residential construction because 1) foreclosures have little effect upon net demand for housing units,2) foreclosures are a clustered problem that disproportionately affect certain regions, and 3) the direforeclosure forecasts are overblown.
1. Numerous studies have found foreclosures to have little effect upon total housing unitconsumption. A 2009 Federal Reserve Board study found almost no difference in family sizeafter a foreclosure and found only 12% of foreclosure resulted in living with an older adultversus 5% for non-foreclosed families, indicating only 7% of foreclosure result in families movingback in with a parent. The vast majority of foreclosures do not result in families “doubling up”.”Furthermore, of those that experienced a foreclosure start and moved, only about 22% movedfrom a single family home to a multi-family home. Foreclosures have minimal effect upon totalhousing demand and housing preferences.
2.
While ~23% of all mortgages in America have negative equity, those mortgages are clustered in“housing bubble” states, such as Florida and Nevada. The top 5 negative equit y states (FL, NV,AZ, CA, MI) represent 52% of total underwater mortgages and 65% of mortgages 25%+underwater, which are the most likely to selectively default. Housing consumption is inherentlya local decision. (Think: Location, location, location.) Default blighted communities in SouthernFlorida are unlikely to affect housing starts in Texas, where only 10% of mortgages areunderwater and which accounts for one in four housing starts of publically traded homebuilders.Furthermore, research has shown selective defaults to be less frequent than presumed. Bhuttaet. al. found that the median selective defaulter who has not experienced a job loss did notdefault until his or her equity fell to negative 62%.
3. Several analysts, in particular Laurie Goodman of Amherst Securities, have rattled the marketwith dire foreclosure numbers. Ms. Goodman, whose views I have roughly taken as theconsensus bear thesis, is calling for 11MM foreclosures over the next six years, a time frame shearbitrarily picked. To reach these numbers, she extrapolates default rates from the worstmonths of the Great Recession and projects them into the future, despite the fact that currentdefault rates do not follow her predictions. For instance, she estimated 90% of NPLs will default(historic rate was around 50%), 45% of APLs with LTV >120% (aka 45% of those who are down
8/4/2019 Anon - Housing Thesis 09 12 2011
http://slidepdf.com/reader/full/anon-housing-thesis-09-12-2011 5/22
Disclaimer: This communication does not constitute a solicitation for any investments or any investment products and is for informational purposes only. Any views expressed in this messageare those of the individual. Any comments or statements made herein do not necessarily reflect those of the individual’s employer, or their respective subsidiaries, affiliates, officers, directors,
partners or employees. No representation is made as to, and no responsibility or liability is accepted for, the accuracy or completeness , express or implied , of the information provided herein or
any other subject matter hereof. Information contained herein is subject to change at any time without notice.
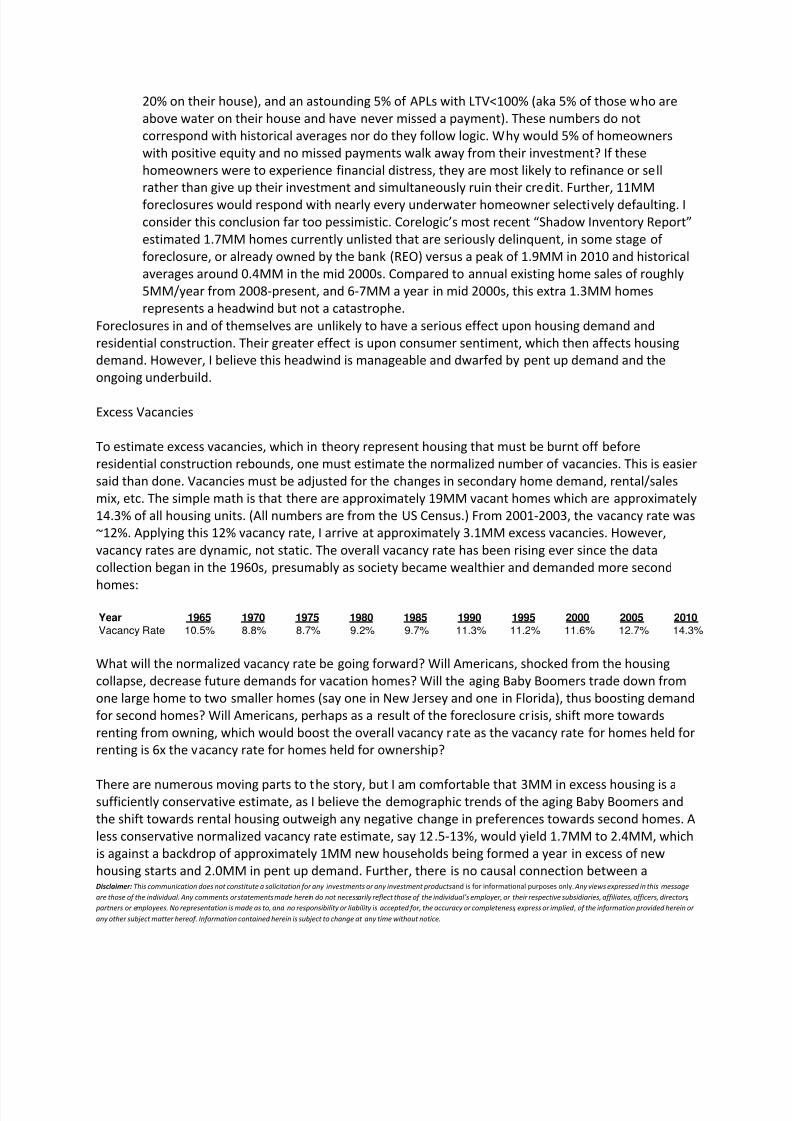
20% on their house), and an astounding 5% of APLs with LTV<100% (aka 5% of those who areabove water on their house and have never missed a payment). These numbers do notcorrespond with historical averages nor do they follow logic. Why would 5% of homeownerswith positive equity and no missed payments walk away from their investment? If thesehomeowners were to experience financial distress, they are most likely to refinance or sellrather than give up their investment and simultaneously ruin their credit. Further, 11MMforeclosures would respond with nearly every underwater homeowner selectively defaulting. Iconsider this conclusion far too pessimistic. Corelogic’s most recent “Shadow Inventory Report”estimated 1.7MM homes currently unlisted that are seriously delinquent, in some stage of foreclosure, or already owned by the bank (REO) versus a peak of 1.9MM in 2010 and historicalaverages around 0.4MM in the mid 2000s. Compared to annual existing home sales of roughly5MM/year from 2008-present, and 6-7MM a year in mid 2000s, this extra 1.3MM homesrepresents a headwind but not a catastrophe.
Foreclosures in and of themselves are unlikely to have a serious effect upon housing demand andresidential construction. Their greater effect is upon consumer sentiment, which then affects housingdemand. However, I believe this headwind is manageable and dwarfed by pent up demand and theongoing underbuild.
Excess Vacancies
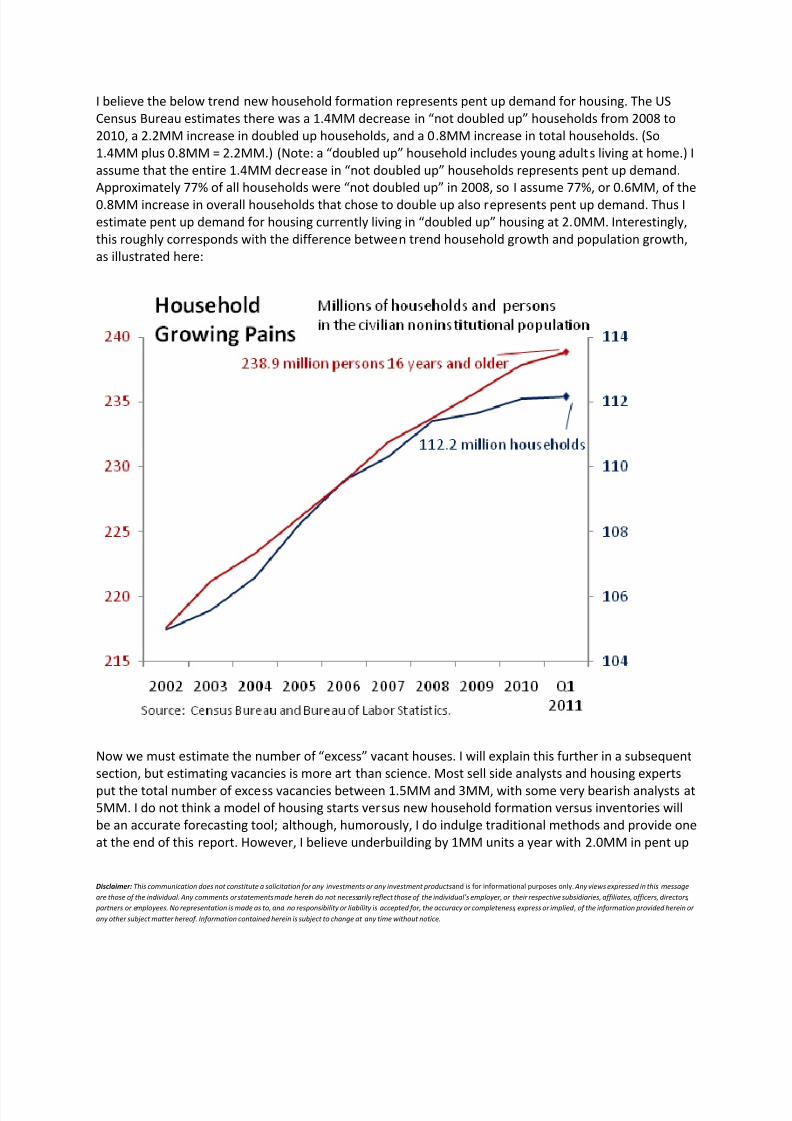
To estimate excess vacancies, which in theory represent housing that must be burnt off beforeresidential construction rebounds, one must estimate the normalized number of vacancies. This is easiersaid than done. Vacancies must be adjusted for the changes in secondary home demand, rental/salesmix, etc. The simple math is that there are approximately 19MM vacant homes which are approximately14.3% of all housing units. (All numbers are from the US Census.) From 2001-2003, the vacancy rate was~12%. Applying this 12% vacancy rate, I arrive at approximately 3.1MM excess vacancies. However,vacancy rates are dynamic, not static. The overall vacancy rate has been rising ever since the datacollection began in the 1960s, presumably as society became wealthier and demanded more second
homes:Year 1965 1970 1975 1980 1985 1990 1995 2000 2005 2010
Vacancy Rate 10.5% 8.8% 8.7% 9.2% 9.7% 11.3% 11.2% 11.6% 12.7% 14.3%
What will the normalized vacancy rate be going forward? Will Americans, shocked from the housingcollapse, decrease future demands for vacation homes? Will the aging Baby Boomers trade down fromone large home to two smaller homes (say one in New Jersey and one in Florida), thus boosting demandfor second homes? Will Americans, perhaps as a result of the foreclosure crisis, shift more towardsrenting from owning, which would boost the overall vacancy rate as the vacancy rate for homes held forrenting is 6x the vacancy rate for homes held for ownership?
There are numerous moving parts to the story, but I am comfortable that 3MM in excess housing is asufficiently conservative estimate, as I believe the demographic trends of the aging Baby Boomers andthe shift towards rental housing outweigh any negative change in preferences towards second homes. Aless conservative normalized vacancy rate estimate, say 12.5-13%, would yield 1.7MM to 2.4MM, whichis against a backdrop of approximately 1MM new households being formed a year in excess of newhousing starts and 2.0MM in pent up demand. Further, there is no causal connection between a
8/4/2019 Anon - Housing Thesis 09 12 2011
http://slidepdf.com/reader/full/anon-housing-thesis-09-12-2011 6/22
Disclaimer: This communication does not constitute a solicitation for any investments or any investment products and is for informational purposes only. Any views expressed in this messageare those of the individual. Any comments or statements made herein do not necessarily reflect those of the individual’s employer, or their respective subsidiaries, affiliates, officers, directors,
partners or employees. No representation is made as to, and no responsibility or liability is accepted for, the accuracy or completeness , express or implied , of the information provided herein or
any other subject matter hereof. Information contained herein is subject to change at any time without notice.
normalized vacancy rate and housing starts nor is the correlation between the two (-0.35) particularlysignificant.
I do not believe an analysis of normalized vs. excess vacancies is likely to be useful for purposes of timingthe rebound in residential construction. However, for arguments sake, I have attached my own usinghousehold growth expectations versus estimated excess vacancies. It can be found at the end of thisreport. It concludes that the excess supply will be exhausted between 2012 and 2014, without anycontribution from the 2.0MM in pent up demand.
As an aside, these arguments circle back to a key point: If there is excess housing, when were all thesehomes built? The 10 year total of housing starts is on pace to be the 2 nd lowest since the 1960s, despitea doubling of the population.
Housing Affordability
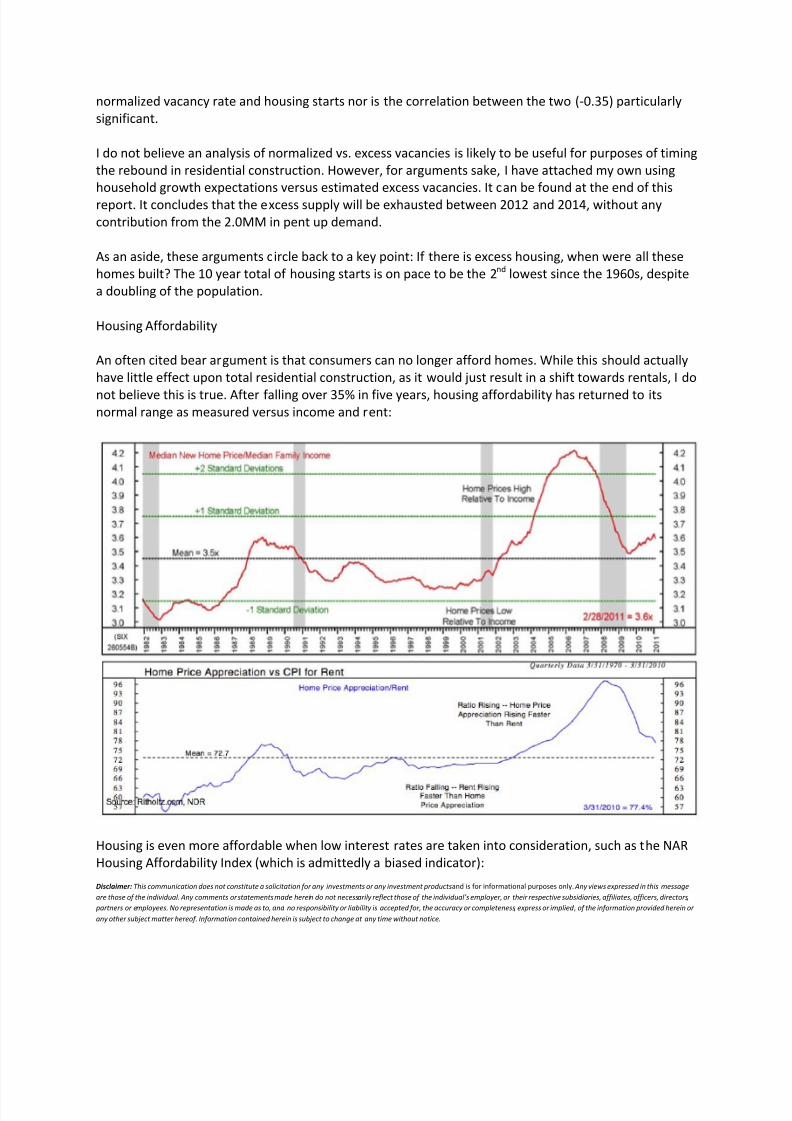
An often cited bear argument is that consumers can no longer afford homes. While this should actuallyhave little effect upon total residential construction, as it would just result in a shift towards rentals, I do
not believe this is true. After falling over 35% in five years, housing affordability has returned to itsnormal range as measured versus income and rent:
Housing is even more affordable when low interest rates are taken into consideration, such as the NARHousing Affordability Index (which is admittedly a biased indicator):

8/4/2019 Anon - Housing Thesis 09 12 2011
http://slidepdf.com/reader/full/anon-housing-thesis-09-12-2011 7/22

8/4/2019 Anon - Housing Thesis 09 12 2011
http://slidepdf.com/reader/full/anon-housing-thesis-09-12-2011 8/22
Disclaimer: This communication does not constitute a solicitation for any investments or any investment products and is for informational purposes only. Any views expressed in this messageare those of the individual. Any comments or statements made herein do not necessarily reflect those of the individual’s employer, or their respective subsidiaries, affiliates, officers, directors,
partners or employees. No representation is made as to, and no responsibility or liability is accepted for, the accuracy or completeness , express or implied , of the information provided herein or
any other subject matter hereof. Information contained herein is subject to change at any time without notice.
purchase. I believe demand for second houses will actually increase over the next decade as the BabyBoomers retire.
In my opinion, the bears’ most convincing argument is the general lack of mortgage availability. Themortgage issuance market remains a mess. While many believe Fannie’s and Freddie’s influence shouldbe curtailed, private lenders as a whole lack the capital to fill the gap the two mortgage giants wouldleave. There are various regulatory ideas out there to increase mortgage lending, such as Fannie andFreddie buying NPLs from banks and issuing preferreds to fill the capital gaps. While great uncertaintyremains, I believe Fannie and Freddie, in some form or another, will remain an integral part of themortgage market for years to come; there is no viable alternative. Further, mortgage demand remainsweak, falling to mid 1990s levels:
Currently, refinancing makes up roughly 75% of total mortgage application. While the mortgage marketseems stuck, it is stuck on both sides. If the demand side were to heat up, such as a boom in housing thisreport predicts, lending may prove more available than currently believed.
Comparative Studies
What follows are comparative studies between the current US housing bubble and subsequent collapseand two previous ones: Japan in the 1980-1990s and the US in the 1920-1930s.
Japan

8/4/2019 Anon - Housing Thesis 09 12 2011
http://slidepdf.com/reader/full/anon-housing-thesis-09-12-2011 9/22
Disclaimer: This communication does not constitute a solicitation for any investments or any investment products and is for informational purposes only. Any views expressed in this messageare those of the individual. Any comments or statements made herein do not necessarily reflect those of the individual’s employer, or their respective subsidiaries, affiliates, officers, directors,
partners or employees. No representation is made as to, and no responsibility or liability is accepted for, the accuracy or completeness , express or implied , of the information provided herein or
any other subject matter hereof. Information contained herein is subject to change at any time without notice.
The 1980s were the high day of the Japanese growth story. Most Japanese assets soared, and homeprices were no exception.
This chart, which if extrapolated forward shows US housing has continued to slide, paints a potentiallydire picture for US home prices over the next decade. However, I would argue there are two keydifferences between deflationary Japanese housing in the 1990s and the current US housing market:1) the US population is growing at a greater rate than Japan ’s did and, more importantly, 2) housingstarts in the US have collapsed since the market peak in 2006 while Japanese housing starts wereunchanged to higher for the first five to eight years of their housing collapse.
The United States population growth, through higher birth rates and more lenient immigration policy,has consistently outpaced Japanese growth over the past three decades.

8/4/2019 Anon - Housing Thesis 09 12 2011
http://slidepdf.com/reader/full/anon-housing-thesis-09-12-2011 10/22
8/4/2019 Anon - Housing Thesis 09 12 2011
http://slidepdf.com/reader/full/anon-housing-thesis-09-12-2011 11/22
Disclaimer: This communication does not constitute a solicitation for any investments or any investment products and is for informational purposes only. Any views expressed in this messageare those of the individual. Any comments or statements made herein do not necessarily reflect those of the individual’s employer, or their respective subsidiaries, affiliates, officers, directors,
partners or employees. No representation is made as to, and no responsibility or liability is accepted for, the accuracy or completeness , express or implied , of the information provided herein or
any other subject matter hereof. Information contained herein is subject to change at any time without notice.
It is important to note that historical and cross country studies such as these are imperfect science. Forinstance, Japanese real estate prices reflect more land value than home value. The general reason isJapanese homes only last 20-25 years, while homes in the US often last more than 50. While thecomparison is imperfect, a general conclusion can be drawn. When the Japanese bubble burst, it took adecade for residential construction to seriously contract; in the US, it took a year. I believe the US isunlikely to experience a Japan-esque drawn out housing slide because the US allowed residentialconstruction to collapse and the excess of the bubble to correct.
The US in the 1930s
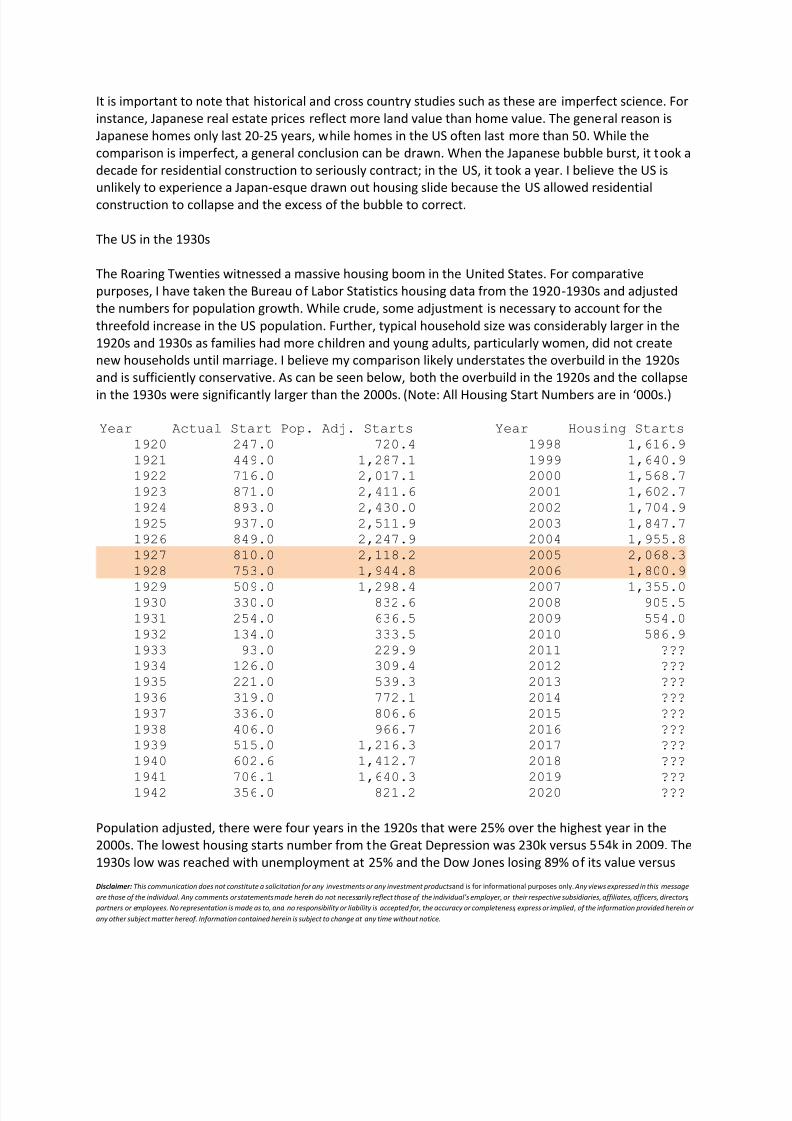
The Roaring Twenties witnessed a massive housing boom in the United States. For comparativepurposes, I have taken the Bureau of Labor Statistics housing data from the 1920-1930s and adjustedthe numbers for population growth. While crude, some adjustment is necessary to account for thethreefold increase in the US population. Further, typical household size was considerably larger in the1920s and 1930s as families had more children and young adults, particularly women, did not createnew households until marriage. I believe my comparison likely understates the overbuild in the 1920sand is sufficiently conservative. As can be seen below, both the overbuild in the 1920s and the collapse
in the 1930s were significantly larger than the 2000s. (Note: All Housing Start Numbers are in ‘000s.)
Year Actual Start Pop. Adj. Starts Year Housing Starts1920 247.0 720.4 1998 1,616.91921 449.0 1,287.1 1999 1,640.91922 716.0 2,017.1 2000 1,568.71923 871.0 2,411.6 2001 1,602.71924 893.0 2,430.0 2002 1,704.91925 937.0 2,511.9 2003 1,847.71926 849.0 2,247.9 2004 1,955.81927 810.0 2,118.2 2005 2,068.31928 753.0 1,944.8 2006 1,800.9
1929 509.0 1,298.4 2007 1,355.01930 330.0 832.6 2008 905.51931 254.0 636.5 2009 554.01932 134.0 333.5 2010 586.91933 93.0 229.9 2011 ???1934 126.0 309.4 2012 ???1935 221.0 539.3 2013 ???1936 319.0 772.1 2014 ???1937 336.0 806.6 2015 ???1938 406.0 966.7 2016 ???1939 515.0 1,216.3 2017 ???1940 602.6 1,412.7 2018 ???1941 706.1 1,640.3 2019 ???1942 356.0 821.2 2020 ???
Population adjusted, there were four years in the 1920s that were 25% over the highest year in the2000s. The lowest housing starts number from the Great Depression was 230k versus 554k in 2009. The1930s low was reached with unemployment at 25% and the Dow Jones losing 89% of its value versus

8/4/2019 Anon - Housing Thesis 09 12 2011
http://slidepdf.com/reader/full/anon-housing-thesis-09-12-2011 12/22
Disclaimer: This communication does not constitute a solicitation for any investments or any investment products and is for informational purposes only. Any views expressed in this messageare those of the individual. Any comments or statements made herein do not necessarily reflect those of the individual’s employer, or their respective subsidiaries, affiliates, officers, directors,
partners or employees. No representation is made as to, and no responsibility or liability is accepted for, the accuracy or completeness , express or implied , of the information provided herein or
any other subject matter hereof. Information contained herein is subject to change at any time without notice.
10.1% and 53% at the bottom in 2009, respectively. Further, the 1930s housing starts contraction lastedonly five or six years before turning in 1933. (Note: While I don’t believe this is necessarily predictive,the timeline would equate 1933 with this year.) Once the market turned, it rallied sharply and improvedevery year from 1933 to 1941, slowing only during World War II. Of note, housing starts improved evenduring the recession of 1937-1938.
It is difficult, if not impossible, to make direct comparisons between the two series and I am wary of extrapolating too much. However, there are a few observations worth noting. First, both the overbuildand underbuild were significantly worse in the 1920-1930s. Second, when housing starts reboundedfrom their repressed levels, the recovery was sharp and strong despite macro headwinds dragging downthe rest of the economy. Finally, even the Great Depression’s collapse lasted only five or six years. TheUS is currently in year five or six of our residential construction contraction and I believe the consensusexpects another five or more years until US housing starts rebound. This comparison would argue thatinvestors are underestimating the odds of a rebound in the next two years.
Catalysts
There are several upcoming macro catalysts that could help spur a recovery in housing. In particular, Ibelieve the Obama administration will do whatever it can to spur residential construction, as the dearthin residential construction is the biggest drug on u nemployment and unemployment is Obama’s biggestchallenge to reelection.
Allowing private equity to buy large pools of Fannie, Freddie, and FHA foreclosures for thepurpose of renting: While it will not directly drive new residential construction, it would alleviatethe backlog of pending foreclosures in a more orderly manner, thus boosting overall homeprices and restoring consumer confidence while at the same time expanding the rental supply,where lack of supply has caused rents to soar 9.2% Y/Y.
State AG settlements over foreclosures: While again not a direct impact on residential
construction, it would move forward the backlog of stalled foreclosures. There are currently~1MM in serious delinquent loans that are one year or more from their last payment. Asettlement could allow banks to process foreclosures and allow the market to move past thisoverhang.
Direct residential construction stimulus: While unlikely, the government could push forwardwith another tax credit encouraging new home purchases.
General fiscal stimulus, particularly an infrastructure bank: The President is likely to push forfurther fiscal stimulus, which would boost demand for new housing. In addition, should a largeinfrastructure push be made, many of those formally employed in residential construction couldfind work on these projects.

8/4/2019 Anon - Housing Thesis 09 12 2011
http://slidepdf.com/reader/full/anon-housing-thesis-09-12-2011 13/22

8/4/2019 Anon - Housing Thesis 09 12 2011
http://slidepdf.com/reader/full/anon-housing-thesis-09-12-2011 14/22
Disclaimer: This communication does not constitute a solicitation for any investments or any investment products and is for informational purposes only. Any views expressed in this messageare those of the individual. Any comments or statements made herein do not necessarily reflect those of the individual’s employer, or their respective subsidiaries, affiliates, officers, directors,
partners or employees. No representation is made as to, and no responsibility or liability is accepted for, the accuracy or completeness , express or implied , of the information provided herein or
any other subject matter hereof. Information contained herein is subject to change at any time without notice.
Year 10 Yr Starts Population Year 10 Yr Starts Year Starts1968 14,114 200,706 1997 13,320 2009 5541969 14,064 202,677 2011 13,379 2010 5871970 14,245 205,052 1998 13,449 2011 6001971 14,984 207,661 1996 13,467 2008 9061972 15,878 209,896 1999 13,714 1991 1,014
1973 16,320 211,909 1995 13,795 1982 1,0621974 16,129 213,854 1969 14,064 1981 1,0841975 15,817 215,973 2000 14,090 1975 1,1601976 16,189 218,035 1968 14,114 1990 1,1931977 16,885 220,239 1994 14,183 1992 1,2001978 17,398 222,585 1970 14,245 1993 1,2881979 17,676 225,055 2010 14,382 1980 1,2921980 17,534 227,726 1993 14,475 1974 1,3381981 16,566 229,966 2001 14,678 1995 1,3541982 15,272 232,188 1991 14,753 2007 1,3551983 14,930 234,307 1990 14,824 1989 1,3761984 15,342 236,348 1992 14,891 1970 1,4341985 15,923 238,466 1989 14,923 1994 1,457
1986 16,191 240,651 1983 14,930 1969 1,4671987 15,824 242,804 1971 14,984 1997 1,4741988 15,292 245,021 2002 15,184 1996 1,4771989 14,923 247,342 1982 15,272 1988 1,4881990 14,824 250,132 1988 15,292 1968 1,5081991 14,753 253,493 1984 15,342 1976 1,5381992 14,891 256,894 2009 15,364 2000 1,5691993 14,475 260,255 2003 15,744 2001 1,6031994 14,183 263,436 1975 15,817 1998 1,6171995 13,795 266,557 1987 15,824 1987 1,6211996 13,467 269,667 1972 15,878 1999 1,6411997 13,320 272,912 1985 15,923 1983 1,7031998 13,449 276,115 1974 16,129 2002 1,705
1999 13,714 279,295 1976 16,189 1985 1,7422000 14,090 282,385 1986 16,191 1979 1,7452001 14,678 285,309 2004 16,243 1984 1,7502002 15,184 288,105 1973 16,320 2006 1,8012003 15,744 290,820 2008 16,450 1986 1,8052004 16,243 293,463 1981 16,566 2003 1,8482005 16,957 296,186 1977 16,885 2004 1,9562006 17,281 298,996 2005 16,957 1977 1,9872007 17,162 302,004 2007 17,162 1978 2,0202008 16,450 304,798 2006 17,281 1973 2,0452009 15,364 307,439 1978 17,398 1971 2,0522010 14,382 310,514 1980 17,534 2005 2,0682011 13,379 313,619 1979 17,676 1972 2,3572012 12,424 316,7552013 11,476 319,9232014 10,521 323,1222015 9,552 326,353
Note: All numbers '000s.

8/4/2019 Anon - Housing Thesis 09 12 2011
http://slidepdf.com/reader/full/anon-housing-thesis-09-12-2011 15/22
Disclaimer: This communication does not constitute a solicitation for any investments or any investment products and is for informational purposes only. Any views expressed in this messageare those of the individual. Any comments or statements made herein do not necessarily reflect those of the individual’s employer, or their respective subsidiaries, affiliates, officers, directors,
partners or employees. No representation is made as to, and no responsibility or liability is accepted for, the accuracy or completeness , express or implied , of the information provided herein or
any other subject matter hereof. Information contained herein is subject to change at any time without notice.
Excess Inventory Model

8/4/2019 Anon - Housing Thesis 09 12 2011
http://slidepdf.com/reader/full/anon-housing-thesis-09-12-2011 16/22
Disclaimer: This communication does not constitute a solicitation for any investments or any investment products and is for informational purposes only. Any views expressed in this messageare those of the individual. Any comments or statements made herein do not necessarily reflect those of the individual’s employer, or their respective subsidiaries, affiliates, officers, directors,
partners or employees. No representation is made as to, and no responsibility or liability is accepted for, the accuracy or completeness , express or implied , of the information provided herein or
any other subject matter hereof. Information contained herein is subject to change at any time without notice.
Scenario A B C
Est. Excess Inventory 1,500 2,250 3,000
2011 Housing Demand
--Organic Population 950 950 950--Destroyed/Vacay 300 300 300--Net Immigration 200 200 200 <--- Legal = 200k, Illegal = 0--Total 1,450 1,450 1,450
2011 New Builds + Manufactured 625 625 625
2011 Ending Excess Inventory 675 1,425 2,175
2012 Housing Demand--Organic Population 950 950 950--Destroyed/Vacay 300 300 300--Net Immigration 200 200 200
--Total 1,450 1,450 1,450
2012 New Builds + Manufactured 625 625 625
2012 Ending Excess Inventory -150 600 1,350
2013 Housing Demand--Organic Population 950 950 950--Destroyed/Vacay 300 300 300--Net Immigration 200 200 200--Total 1,450 1,450 1,450
2013 New Builds + Manufactured 625 625 625
2013 Ending Excess Inventory -975 -225 525
2014 Housing Demand--Organic Population 950 950 950--Destroyed/Vacay 300 300 300--Net Immigration 200 200 200--Total 1,450 1,450 1,450
2014 New Builds + Manufactured 625 625 625
2014 Ending Excess Inventory -1,800 -1,050 -300
This requires you to beli eve two structural changes in US Economy1) Illegal immigration, which has contracted -200k/yr for last 4 yrs wil l remain neutral2) The estimated 2.0MM in pent up demand does not hi t market

8/4/2019 Anon - Housing Thesis 09 12 2011
http://slidepdf.com/reader/full/anon-housing-thesis-09-12-2011 17/22
Disclaimer: This communication does not constitute a solicitation for any investments or any investment products and is for informational purposes only. Any views expressed in this message are those of the individual. Any comments or statements made herein donot necessarily reflect those of the individual’s employer, or their respective subsidiaries, affiliates, officers, directors, pa rtners or employees. No representation is made as to, and no responsibility or liability is accepted for, the accuracy or completeness , express or
implied , of the information provided herein or any other subject matter hereof. Information contained herein is subject to change at a ny time without notice.
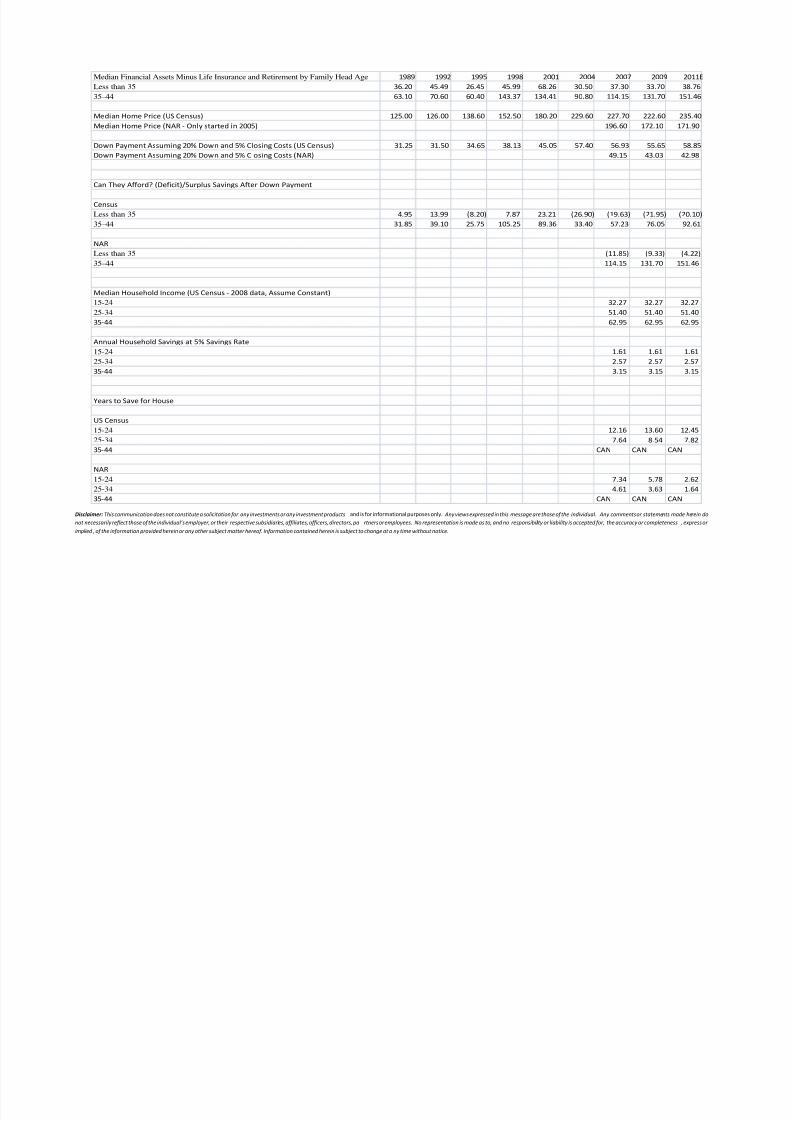
Housing Affordability Model
8/4/2019 Anon - Housing Thesis 09 12 2011
http://slidepdf.com/reader/full/anon-housing-thesis-09-12-2011 18/22
Disclaimer: This communication does not constitute a solicitation for any investments or any investment products and is for informational purposes only. Any views expressed in this message are those of the individual. Any comments or statements made herein donot necessarily reflect those of the individual’s employer, or their respective subsidiaries, affiliates, officers, directors, pa rtners or employees. No representation is made as to, and no responsibility or liability is accepted for, the accuracy or completeness , express or
implied , of the information provided herein or any other subject matter hereof. Information contained herein is subject to change at a ny time without notice.
Median Financial Assets Minus Life Insurance and Retirement by Family Head Age 1989 1992 1995 1998 2001 2004 2007 2009 2011ELess than 35 36.20 45.49 26.45 45.99 68.26 30.50 37.30 33.70 38.7635–44 63.10 70.60 60.40 143.37 134.41 90.80 114.15 131.70 151.46
Median Home Price (US Census) 125.00 126.00 138.60 152.50 180.20 229.60 227.70 222.60 235.40Median Home Price (NAR - Only started in 2005) 196.60 172.10 171.90
Down Payment Assuming 20% Down and 5% Closing Costs (US Census) 31.25 31.50 34.65 38.13 45.05 57.40 56.93 55.65 58.85Down Payment Assuming 20% Down and 5% Closing Costs (NAR) 49.15 43.03 42.98
Can They Afford? (Deficit)/Surplus Savings After Down Payment
CensusLess than 35 4.95 13.99 (8.20) 7.87 23.21 (26.90) (19.63) (21.95) (20.10)35–44 31.85 39.10 25.75 105.25 89.36 33.40 57.23 76.05 92.61
NARLess than 35 (11.85) (9.33) (4.22)35–44 114.15 131.70 151.46
Median Household Income (US Census - 2008 data, Assume Constant)15-24 32.27 32.27 32.2725-34 51.40 51.40 51.4035-44 62.95 62.95 62.95
Annual Household Savings at 5% Savings Rate15-24 1.61 1.61 1.6125-34 2.57 2.57 2.5735-44 3.15 3.15 3.15
Years to Save for House
US Census15-24 12.16 13.60 12.4525-34 7.64 8.54 7.8235-44 CAN CAN CAN
NAR15-24 7.34 5.78 2.6225-34 4.61 3.63 1.6435-44 CAN CAN CAN

8/4/2019 Anon - Housing Thesis 09 12 2011
http://slidepdf.com/reader/full/anon-housing-thesis-09-12-2011 19/22
Disclaimer: This communication does not constitute a solicitation for any investments or any investment products and is for informational purposes only. Any views expressed in this messageare those of the individual. Any comments or statements made herein do not necessarily reflect those of the individual’s employer, or their respective subsidiaries, affiliates, officers, directors,
partners or employees. No representation is made as to, and no responsibility or liability is accepted for, the accuracy or completeness , express or implied , of the information provided herein or
any other subject matter hereof. Information contained herein is subject to change at any time without notice.
Japanese Housing Starts vs. US Housing Starts
Japan Housing Starts US Housing Starts1985 1,236.1 2000 1,568.71986 1,364.6 2001 1,602.71987 1,674.3 2002 1,704.91988 1,684.6 2003 1,847.71989 1,662.6 2004 1,955.81990 1,707.1 2005 2,068.31991 1,370.1 2006 1,800.91992 1,402.6 2007 1,355.01993 1,485.7 2008 905.51994 1,570.3 2009 554.01995 1,470.3 2010 586.91996 1,643.31997 1,387.01998 1,198.3
1999 1,214.62000 1,229.82001 1,173.92002 1,151.02003 1,160.12004 1,189.02005 1,236.22006 1,290.42007 1,060.72008 1,093.52009 788.42010 813.1
Note: All numbers in '000s.

8/4/2019 Anon - Housing Thesis 09 12 2011
http://slidepdf.com/reader/full/anon-housing-thesis-09-12-2011 20/22
Disclaimer: This communication does not constitute a solicitation for any investments or any investment products and is for informational purposes only. Any views expressed in this message are those of the individual. Any comments or statements made herein donot necessarily reflect those of the individual’s employer, or their respective subsidiaries, affiliates, officers, directors, pa rtners or employees. No representation is made as to, and no responsibility or liability is accepted for, the accuracy or completeness , express or
implied , of the information provided herein or any other subject matter hereof. Information contained herein is subject to change at a ny time without notice.
US Housing Starts 1920-1942 vs. US Housing Starts 1998-Present
Year Actual Housing Starts Pop. Adj. Starts Year Housing Starts1920 247.0 720.4 1998 1,616.91921 449.0 1,287.1 1999 1,640.91922 716.0 2,017.1 2000 1,568.71923 871.0 2,411.6 2001 1,602.71924 893.0 2,430.0 2002 1,704.91925 937.0 2,511.9 2003 1,847.71926 849.0 2,247.9 2004 1,955.81927 810.0 2,118.2 2005 2,068.31928 753.0 1,944.8 2006 1,800.91929 509.0 1,298.4 2007 1,355.01930 330.0 832.6 2008 905.51931 254.0 636.5 2009 554.01932 134.0 333.5 2010 586.91933 93.0 229.9 2011 ???1934 126.0 309.4 2012 ???1935 221.0 539.3 2013 ???1936 319.0 772.1 2014 ???1937 336.0 806.6 2015 ???1938 406.0 966.7 2016 ???1939 515.0 1,216.3 2017 ???
1940 602.6 1,412.7 2018 ???1941 706.1 1,640.3 2019 ???1942 356.0 821.2 2020 ???
Note: All Numbers '000s.

8/4/2019 Anon - Housing Thesis 09 12 2011
http://slidepdf.com/reader/full/anon-housing-thesis-09-12-2011 21/22
Disclaimer: This communication does not constitute a solicitation for any investments or any investment products and is for informational purposes only. Any views expressed in this messageare those of the individual. Any comments or statements made herein do not necessarily reflect those of the individual’s employer, or their respective subsidiaries, affiliates, officers, directors,
partners or employees. No representation is made as to, and no responsibility or liability is accepted for, the accuracy or completeness , express or implied , of the information provided herein or
any other subject matter hereof. Information contained herein is subject to change at any time without notice.
2002 2003 2004 2005 2006 2007 2008 2009 2010 2011:Q1 2011:Q2Gr oss dom esti c p rodu ct. .... ... . 115 43. 1 118 36. 4 122 46. 9 12 623. 0 12 958. 5 13 206. 4 13 161 .9 12 703 .1 13 088 .0 1 3227 .9 1 3270 .1
Personal consumption expenditures... 8018.3 8244.5 8515.8 8803.5 9054.5 9262.9 9211.7 9037.5 9220.9 9376.7 9378.9
Goods............................. 2702.9 2827.2 2953.3 3076.7 3178.9 3273.5 3192.9 3098.0 3230.7 3344.4 3333.1
Durable goods................... 927.9 989.1 1060.9 1123.4 1174.2 1232.4 1171.8 1108.3 1188.3 1277.4 1263.1
Motor vehicles and parts...... 394.0 404.8 410.4 408.2 394.4 401.4 346.8 322.5 330.1 368.2 345.3Furnishings and durable
household equipment.......... 217.0 229.1 247.2 261.3 272.5 274.4 262.8 240.6 260.1 269.3 271.2Recreational goods and
vehicles..................... 211.7 238.8 274.7 312.8 356.2 400.9 416.2 409.2 459.6 495.9 506.2Other durable goods........... 109.4 119.1 129.5 141.1 151.9 159.0 153.7 146.0 154.9 161.4 163.6
Nondurable goods................ 1780.1 1840.7 1892.8 1953.4 2005.0 2042.9 2019.1 1983.4 2041.3 2075.4 2076.0
Food and beverages purchasedfor off-premises consumption. 608.9 616.5 623.9 644.5 663.0 673.2 666.0 657.3 673.1 682.1 683.2
Clothing and footwear......... 268.6 282.6 296.0 314.0 328.7 340.1 338.1 322.4 341.0 352.8 354.1Gasoline and other energy
goods........................ 294.0 301.9 305.9 303.8 296.9 294.4 280.6 281.1 281.3 274.2 269.5Other nondurable goods........ 612.2 642.0 668.2 691.1 717.3 737.5 739.7 725.8 750.7 774.4 779.1
Services.......................... 5318.5 5418.2 5562.7 5726.8 5875.6 5990.2 6017.0 5935.5 5991.8 6039.1 6051.8
Household consumptionexpenditures (for services).... 5109.8 5199.4 5345.1 5515.1 5640.6 5745.2 5745.6 5660.5 5714.0 5765.9 5778.7
Housing and utilities......... 1461.9 1480.2 1512.8 1582.6 1616.8 1626.6 1637.8 1654.9 1669.2 1666.0 1667.8Health care................... 1202.4 1228.3 1267.4 1308.9 1333.0 1364.0 1396.5 1423.1 1442.9 1464.3 1469.4Transportation services....... 275.9 276.9 283.8 286.0 285.5 287.9 272.0 248.1 250.2 251.4 251.7Recreation services........... 296.8 306.1 322.1 328.2 339.9 353.2 348.6 334.8 341.4 343.0 345.3Food services and
accommodations............... 477.2 495.0 515.1 533.9 551.6 559.1 553.9 534.3 551.0 567.6 567.6Financial services and
insurance.................... 658.9 659.2 675.5 698.4 716.4 739.8 732.3 676.1 667.8 674.7 677.0Other services................ 737.0 753.9 768.4 777.1 797.4 815.0 805.0 789.5 791.7 798.8 799.8
Final consumption expendituresof nonprofit institutionsserving households............. 209.0 218.7 217.6 211.7 235.1 245.2 272.9 277.1 280.0 274.3 274.2
Gross output of nonprofitinstitutions................. 831.1 844.1 860.5 874.3 902.5 926.0 954.9 970.7 989.2 997.2 998.5
Less: Receipts from sales ofgoods and services bynonprofit institutions....... 622.5 625.2 642.8 662.6 667.5 681.1 683.4 695.0 710.3 722.8 724.1
Gross private domestic investment... 1800.4 1870.1 2058.2 2172.3 2231.8 2159.5 1939.8 1454.2 1714.9 1750.9 1781.2
Fixed investment.................. 1791.5 1854.7 1992.5 2122.3 2172.7 2130.6 1978.6 1606.3 1648.4 1699.0 1723.3
Nonresidential.................. 1173.7 1189.6 1263.0 1347.3 1455.5 1550.0 1537.6 1263.2 1319.2 1378.9 1400.2Structures.................... 356.6 343.0 346.7 351.8 384.0 438.2 466.4 367.3 309.1 305.9 312.0
Equipment and software........ 824.2 850.0 917.3 995.6 1071.1 1106.8 1059.4 889.7 1019.4 1086.9 1102.1Information processing
equipment and software..... 373.9 403.7 443.1 475.3 516.3 558.2 569.7 548.3 602.6 625.0 642.1Computers and peripheral
equipment................ ..... ..... ..... ..... ..... ..... ..... ..... ..... ..... .....Software.................. 173.4 185.6 204.6 218.0 227.1 240.9 250.8 249.1 256.1 263.7 269.7Other..................... 142.7 155.1 168.1 178.4 192.8 208.4 202.4 186.1 207.3 215.2 212.4
Industrial equipment........ 151.9 151.6 147.4 159.6 172.9 179.9 172.9 137.1 146.6 158.1 154.3Transportation equipment.... 154.2 140.4 162.3 181.7 196.5 185.8 142.7 70.7 119.3 139.6 145.4Other equipment............. 148.2 155.0 164.4 178.9 185.5 184.2 177.8 145.6 162.6 174.0 172.4
Residential..................... 613.8 664.3 729.5 775.0 718.2 584.2 444.4 345.6 330.8 321.1 324.1AS % of GDP 5.3% 5.6% 6.0% 6.1% 5.5% 4.4% 3.4% 2.7% 2.5% 2.4% 2.4%
Change in private inventories..... 12.8 17.3 66.3 50.0 59.4 27.7 -36.3 -144.9 58.8 49.1 49.6Farm............................ -3.1 0.1 7.9 0.1 -3.7 -0.8 1.0 -1.5 -1.4 -7.8 -9.3Nonfarm......................... 15.6 17.2 58.3 49.8 63.2 28.7 -37.6 -143.8 60.7 59.7 64.6
Net exports of goods and services... -548.5 -603.7 -687.9 -722.7 -729.4 -648.8 -494.8 -358.8 -421.8 -424.4 -405.7
Exports........................... 1098.3 1116.0 1222.5 1305.1 1422.1 1554.4 1649.3 1494.0 1663.2 1749.6 1775.3
Goods........................... 762.7 776.4 842.6 906.1 991.5 1088.1 1157.0 1018.6 1164.9 1235.6 1256.2Services........................ 335.6 339.6 380.0 399.0 430.6 466.3 492.3 474.9 498.8 514.6 519.7
Imports........................... 1646.8 1719.7 1910.4 2027.8 2151.5 2203.2 2144.0 1852.8 2085.0 2173.9 2181.0
Goods........................... 1372.2 1439.9 1599.3 1708.0 1809.1 1856.1 1784.8 1506.0 1729.3 1818.4 1825.3Services........................ 274.5 279.8 311.0 319.8 342.4 347.1 359.8 347.2 357.4 357.5 357.7
Government consumption expenditures
and gross investment............... 2279.6 2330.5 2362.0 2369.9 2402.1 2434.2 2497.4 2539.6 2556.8 2513.9 2506.7
Federal........................... 779.5 831.1 865.0 876.3 894.9 906.1 971.1 1029.5 1075.9 1053.3 1059.0National defense................ 505.3 549.2 580.4 589.0 598.4 611.8 657.7 695.6 718.3 694.0 706.4
Consumption expenditures...... 445.8 484.1 509.4 514.8 519.1 528.0 559.6 591.5 609.0 594.0 607.6Gross investment.............. 59.6 65.3 71.1 74.2 79.4 84.0 98.7 104.8 110.2 100.3 98.8
Nondefense...................... 273.9 281.7 284.6 287.3 296.6 294.2 313.3 333.8 357.7 359.4 352.6Consumption expenditures...... 239.7 247.1 250.2 251.0 257.5 254.7 271.0 289.7 307.5 308.4 302.5Gross investment.............. 34.2 34.6 34.4 36.3 39.1 39.5 42.5 44.1 50.4 51.3 50.5
State and local................... 1500.6 1499.7 1497.1 1493.6 1507.2 1528.1 1528.1 1514.2 1487.0 1466.4 1453.9
Consumption expenditures........ 1211.3 1207.5 1207.4 1212.0 1220.7 1239.8 1237.1 1228.9 1213.0 1207.4 1203.3Gross investment................ 289.4 292.2 289.8 281.6 286.4 288.3 291.0 285.3 274.3 259.6 251.4
Residual............................ -34.5 -19.7 -6.1 0.0 -4.4 -10.8 -4.5 5.2 -39.3 -74.8 -86.8
Addenda:
Real Gross Domestic Product and Related Measures
[Billions of chained (2005) dollars; quarters seasonally adjusted at annual rates]

8/4/2019 Anon - Housing Thesis 09 12 2011
http://slidepdf.com/reader/full/anon-housing-thesis-09-12-2011 22/22