anthony hang fai lau · finding salient objects in an image anthony hang fai lau depart ment of...
TRANSCRIPT

FINDING SALIENT OBJECTS IN AN IMAGE
Anthony Hang Fai Lau
Depart ment of Elecerical Engineering
SIcGill Cniversity
.\ Thesis siibmitted to the Facttlty of Graduate Studies and Research
in partial fulfilment of the requirements for the degree of
b taster of Engineering

Bibliothèque nationale du Canada
Aquisitioe and Acquisitions et Bibliographe Services services bibliographiques
The author has granted a non- exclusive licence allowing the National Lilbrary of Canada to reproduce, loan, distn'bute or sel copies of tbis thesis in microform, paper or electronic formats.
The author retains ownership of the copyright in this thesis. Neither the thesis nor substantial extracts fiom it may be printed or othemise reproduced without the author's permission.
L'auteur a accordé une Licence non exclusive permettant a la Bibliothèque nationale du Canada de reproduire, prêter, distriibuer ou vendre des copies de cette thèse sous la forme de microfichell5.lm, de reproduction sur papier ou sur format électronique.
L'auteur conserve la propriété du droit d'auteur cpi protège cette thèse. Ni la thése ni des extraits substantiels de celle-ci ne doivent être imprimés ou autrement reproduits sans son autorisation.

Abstract
Slany cornpliter vision applications. such as object recognition. active vision. anci
content briçed image retrieval (CBIR) could be made both more efficient and effective
if thtl ohjwts of interest cotild be segrnenred from the background. This thesis dis-
ciisses the developnient and implementation of a complete ~insiipervised object-biised
atttwion systern for locating salient objects in an image.
Tlie rriajor conipotierits of this system are the segmentation and the attention
procrss. Consiti~rabl~ research haç beeri done in these two areas. but unforturiately.
diere is still not a single rnethod that can be appiied reliably under al1 situations.
\Ci. have analysecl the attention model proposed by Osberger and have founci chac
t h i r rnettiod fails to idcntify some important regions that are saiierit to humaris.
Noditications to this mode1 are proposed to correct some of these problenis. For the
segnientation process. one important aspect is the measurernent of the qiiality of a
partictilar segnientation. since the attention process depends solely on the segmenta-
tion output. in particular. three different cluster tdidity rneasures are consiclered: a
simple thresholcl-based indes. a non-parameter indes. and the modified Hubert in-
des. From the esperirnenta1 resuIts. the simple threshold-based index is shown to
outperforrn the other indices on most test images. We believe that the success of the
rhreshold-basetl index is largely reIated to the incorporation of hurnan preference ici
the selection of the threshold parameter.
Résumé
Dc ntirnbreuses applications en vision artificielle telles que la vision active et I'indesage
(l'images basé sur le contenu pourraient etre rendues plus efficaces si les objets
d'intérêt poutxient segmentés du fond de l'image. Cette thèse discute du développement
et de l'implémentation d'un systérne d'attention non-supervisé basé sur des objets
pour localiser rlcs objets saillants clans une image.
Les cornposantes niajeiires de re systènie sont la segmentation et le mécanimsme
d'itttclntion. Bien que que ces rleiis sujets aient été l'objet de nombreuses recherches.
il n'tlsist~ toujours à ce jour pas de méthode fiable qui puisse 6tre appliqtiée dans
coiitcs les situations. Xoiis avons analysé le modéle d'attention propoé par Osberger
ttr. nous avons trouve qu'elle ne réussi pas a identifier quelques unes ries régions sail-
lantes évicicwes pour des humains. Des modifications à ce modèle sont proposées
pour c.0rrigr.r iwtairis de ces problémes. Cu des aspects importants pour la seg-
iiieiitatioti est Ir i niesure de la quiilité d'une m'ethode en particulier puisque le pro-
resstb rt*i;ittention repose uniquement sur Ir résultat tlc la segnientation. Plus partir-
iiliérement. trois différentes rnéthocles de niesure rle vdirlitl; sont ronsirlér6es;: tin indes
tlPterniin6 par un setiillage simple. un index non-paramétrique et une version niocC
ifiée rie Iïncles d'Hubert. D'après les résultats expérimenta~~x. 1' indes déterminé par
un seuillage siniple surpasse les autres méthodes pour la plupart des images testces.
Nous croyons que le succès de l'index déterminé par un seuillage simple est largement
lié a l'incorporation de préfiences humaines dans la sélection du seuiI utilisé.
Acknowledgements
First of d l . I would like to thank niy supervisor. Prof. '1I.D. Levine. for tiis enthii-
siastic guidance and support. He is always arailable when needed and is willing tu
tliscuss with his stutirnts any clifficulties encountered during the research. I must also
thank GiIbert Soucy for transiating the abstract to French. al1 the people a t CI11 for
providing a goorl working atmosphere. and my farnily for their unfailing support arid
encoiiragenient throiighoiit the period of this w r k .

TABLE OF CONTENTS
. . . . . . . . . . . . . . . . . . . . . . . . . . . . . . . . . . . . . . . . . Abstract 11
... . . . . . . . . . . . . . . . . . . . . . . . . . . . . . . . . LIST OF FIGURES 1-111
. . . . . . . . . . . . . . . . . . . . . . . . . . . . . . . . . LIST OF T.4BLES sii
. . . . . . . . . . . . . . . . . . . . . . . . . . . CH-4PTER 1 . Introrluction 1
. . . . . . . . . . . . . . . . . . . 1 . The Xeed for Object-based Attention 1
2 . 5Iotivation . . . . . . . . . . . . . . . . . . . . . . . . . . . . . . . . . . . - ) 3 . .4n Overview uf the Approach . . . . . . . . . . . . . . . . . . . . . . . -I -
. . . . . . . . . . . . . . . . . . . . . . . . . 4 . Organisation of the Thesis 4
5 . Contributions . . . . . . . . . . . . . . . . . . . . . . . . . . . . . . . . 4
. . . . . . . . . . . . . . . . . . . . . . . . CH-APTER 2 . Literature Review 6 . 1 . Perceptual Grouping . . . . . . . . . . . . . . . . . . . . . . . . . . . . I
. . . . . . . . . . . . . . . . . . . . . . . . . . . . . . . 1.1. Signal Level 10
. . . . . . . . . . . . . . . . . . . . . . . . . . . . . 1.2. Primitive Level 12
. . . . . . . . . . . . . . . . . . . . . . . . . . . . . 1.3. Stn~ctural Lever 12
. . . . . . . . . . . . . . . . . . . . . . . . . . . . . . . 1.4. Conslusions 23
. . . . . . . . . . . . . . . . . . . . 2 . \i-isual Attention System in Humans 13
2.1. Strtlcture of the Human Visual S_vstem . . . . . . . . . . . . . . . . L4
-1.2. Psychophysical Aspects of the Human Visual Attention System . . i5 . . . . . . . . . . . . . . . . . . . . . . . . . . . . . . . -1.3. CoucIrrsions '210
. . . . . . . . . . . . . . . . . . . 3 . Visual -ittention Systems in Slachines 20 3 3 . . . . . . . . . . . . . . . . . . . . . . . . . . . . . . . 3.1. Conchsions --

. . . . . . . . . . . . . . . . . . . CH-APTER 3 . Perceptual Sdiency Sleasure 23 . . . . . . . . . . . . . . . . . . . . . . . . . 1 . Perceptrial Saliency Factors 23
. . . . . . . . . . . . . . . . . . . . . 1.1. Osberger and Maeder 's mode! 2-4
1 2 Discussion . . . . . . . . . . . . . . . . . . . . . . . . . . . . . . . . 26
. . . . . . . . . . . . . . . . 1.3. Xew and Slodified Importance Factors 29
. . . . . . . . . . . . . 2 . Methods for Combining the Importance Factors 33
. . . . . . . . . . . . . . . . . . . . 2.1. Osberger and Uaeder's Method 33 . . . . . . . . . . . . . . . . . . . . . . . . . 2.1. I t t i and Ibch's SIethod 33
. . . . . . . . . . . . . . . . . . . . . . . . . . . . . . . . '2.3. Discussion 34
. . . . . . . . . . . . . . . . . . . . . . . . . CH-WTER 4 . Feaciire Selection :33
1 . Colour . . . . . . . . . . . . . . . . . . . . . . . . . . . . . . . . . . . . 36 . . . . . . . . . . . . . . . . . . . . . . . . . . . . . . 1.1. Coloiir Spaces 35
. . . . . . . . . . . . . . . . . . . . . . . . . . . . . . . 1.2. Conclusions -13 . . . . . . . . . . . . . . . . . . . . . . . . . . . . . . . . . . . . 2 . Testur~ 43
. . . . . . . . . . . . . . . . . . . . . . . . 2.1. Relatecl CVork on Texture -14
2.2. Rrlared \. Vork ori I'risupervised Segmentation of Satura1 1ni:iges . . 4G
. . . . . . . . . . . . . . . . . . . . . . . . . 2.3. TestureRepresentation 47
. . . . . . . . . . . . . . . . . . . . . . . . . . . 4 Gabor Filter Biink 4s
. . . . . . . . . . . . . . . . . . . 2.5. Generation of Texture Feature Set 51 - - . . . . . . . . . . . . . . . . . . . . . . . . . . . . . 3 . Feattire Integration a i
. . . . . . . . . . . . . . . . . . . . . . . CH.4PTER .? . Iniag~ Scgnientation -59
. . . . . . . . . . . . . . . . 1 . Revictv of Image Segmentation Techniques 59
. . . . . . . . . . . . . . . . . . . . . . . 1.1. Clustering-bwed JIethods 60
. . . . . . . . . . . . . . . . . . . . . . . . . . 1 . Edge-bnsetl S l ~ t ho& 61
. . . . . . . . . . . . . . . . . . . . . . . . . 1 ..3 . Rtyjori-basetf SI~thods 62
. . . . . . . . . . . . . . . . . . . . . . . . . . . . . 1.4. Hybriti SIethods 63
. . . . . . . . . . . . . . . . . . . . . . . . . . . . . . . 1.3. Conclusions 63
2 . ?;ou-parametric Density Estimation for Image Clustering . . . . . . . . 63 . . . . . . . . . . . . . . . . . . . . . . . . . . '1.1. Clustering .\ lgorithrn 64
. . . . . . . . . . . . . 2 Cliister Càlidity indices and Stopping Criteria 65
. . . . . . . . . . . . . . . . . . . . . . . . . . . . . '1.3. Post-processing 70
. . . . . . . . . . . . . . . . . . . CH-iPTER 6 . Etduation and Test Results Ti
. . . . . . . . . . . . . . . . . . . . . . . 1 . Determining Parameter Values 71
1.1. Weights for Colour . Texture . and Position . . . . . . . . . . . . . . 71
1.2. Parameters Csed in Image Clustering . . . . . . . . . . . . . . . . . 73 -- . . . . . . . . . . . . . . . . . . . . . . . . . . . . . . 2 . Cluster Measures t t
2.1. -4ssumptions Lsed in Each SIethod . . . . . . . . . . . . . . . . . . 78
2.2. Test Images and Implementation Issues . . . . . . . . . . . . . . . . 78
2.3. Test Results and Discussion . . . . . . . . . . . . . . . . . . . . . . 79
. . . . . . . . . . . . . . . . . . . . . . . . . . . . . . . 3 . Saliençy Factors S2
3.1. Determining the CCéights of Different Sdiency Factors . . . . . . . . 82
. . . . . . . . . . . . . . . . . . . . . . . . . . . . . . . . 3.2. Discussion S 1
. . . . . . . . . . . . . . . . . . . . . . . . . . . . . . . . . 4 . -4pplications 3-1
4.1. Face finding . . . . . . . . . . . . . . . . . . . . . . . . . . . . . . . 8-4
4 .2 . [mage compression . machine vision . and CBIR . . . . . . . . . . . . 86
CHJLPTER 7 . Conritisions . . . . . . . . . . . . . . . . . . . . . . . . . . . . S i
1 . Dirertion of Future Work . . . . . . . . . . . . . . . . . . . . . . . . . . 88
.4 PPESDIS .-\ . Thc Grnphical Cser Interface (GLI) . . . . . . . . . . . . . . 30
APPESDIS B . The Image Database . . . . . . . . . . . . . . . . . . . . . . 92
APPESDIS Ç . The Test Set and Results . . . . . . . . . . . . . . . . . . . . 96
REFERESCES . . . . . . . . . . . . . . . . . . . . . . . . . . . . . . . . . . . 99

LIST OF F I G L X S
LIST OF FIGURES
Systern Block Diagrarn. The niethod consists of three computational
processes shown in the left-hand column. The data transferred
twtween each process is inciicated in the shaded strips. Examples
cif the input. interniediate data. and final output are shown in the
right-harul colurnri . . . . . . . . . . . . . . . . . . . . . . . . . 3
-4 simple pictiire of a baby girl . . . . . . . . . . . . . . . . . 8
6loc:k diagrani for Osherg~r and 1Iarrkr's [niportatire 1Lap
ralciilation . . . . . . . . . . . . . . . . . . . . . . . . . . . . . '24
Situations whcrc a contrast nieasire si~ccecds and where it fails.
The ntinibtbr within the brackets indicates the region's intensity.
For al1 thrce cases. the background's intensity is equal to 100. . 27
. . . . . Situations where foregrounti/backgoiind measure fails 28
Situations where shape rneasure fails . . . . . . . . . . . . . . . 29
Spectral sensitivity of cones from Cos. Estévez. and LVa1rat.cn
11371 . . . . . . . . . . . . . . . . . . . . . . . . . . . . . . . . .3T
. . . . . . . . . . . . . . . . . . . . . . . . . . . . Colour cube 38
. . . . . . . . . . Texture samples from the Brodatz coIIection 44
(a) Real and (b) imaginary components of a Gabor filter nith
a mavelength ( I l f) of 5.3 pixels and uni- aspect ratio. (c) . . . . . . . . . . . . . . . . . Frequency response of this filter. 49
The frequency response of a dyadic bank of Gabor filters with 3
scales and 4 orientations. . . . . . . . . . . . . . . . . . . . . . .50

LIST OF F [ G L . S
Block diagram of the generation of texture features. The filter
bank (FB) generates .Y texture channels. The first Iinear transformation
( LT 1 ) approximates the orientation-invariance tramformat ion.
rcsiilting in K channels where K 5 -V. The nest nonlinear
trarisformation (NTI) and low-pas filter (LPF) produce a local
energy estimation of the filter output. The second nonIin~nr
transformation (XT2) is inciuded to compensate for the effect
of NT1 ancl the final linear transformation (LT'L) improves the
perceptual riniformity of the texture space. . . . . . . . . . . . 2
(a)=\ zebra image. SIagriitude of different texture channels at
2 scales and 4 orientations :(b)-(e) capture the high frequency
coniponents of the image and (f) is the summation of (b)-(e).
(g)-(j) capture the Iow frequency components and ( k ) is the
. . . . . . . . . . . . . . . . . . . . . . . c;ummatiori of (g)-ij). 33
(a ) Test signal. tmo sine waves with different rnagnitittie and a no
rcsponse region. with salt and pepper noise. (b)Loi:aI energy
~stiniated by thret) different nonlinear functions: magnitude. - - squaring. and rectified sigrnoid. cr = 0.25. . . . . . . . . . . . . 9s
-4 transforniation of the testiire space is proposed to improt-e
the perceptual iiniformity. This transformation normalises the
distance between the origin and the three vertices v l . v2. and v3
and the distance between these three sertices. . . . . . . . . . . ' iG
Estit~iatetl testiire scale of the image in figure 4.7. Brighter regiotis
inciicate larger scales. . . . . . . . . . . . . . . . . . . . . . . . 58
(a) -4 simple image that contains roughly 5 different colours m d
(b) the STH index for this image. . . . . . . . . . . . . . . . . . 65
NN-nom (left ). C-corn (center): and 2-score ( right ) for the image
in Figure 5.1 . . . . . . . . . . . . . . . . . . . . . . . . . . . . 69
Part A. Se,mentation of 30 randornly selected images. Boundaries
are shoivn in g r - See figure 6.2 for the other 15 images. . . . 74
Part, B. Segmentation of 30 randomiy selected images. Boundtuies -* . . . are shown in gre- See figure 6.1 for the other 15 images. (9

LIST OF FiGL'RES
Compiitation time of the whole clustering algorithm (upper c w e )
and clie time spent on the density estimation process (lower cunc)
. . . . at different sampling rates on a 300 MHz Pentium II PC 16
Segmentation results of s test image at different sampling rates I I
-1 situiition ivher~ the C-nom in Y P indices gives a wrong result. SU
Samplcs of the test images and the se,gnentations selected by
ilifferent methoth: non-p;irametric indices ( P d column). modifiecl
Hubert index (3"' column). and the thresholcl-basecl method ( d t h
. . . . . . . . . . . . . . . . . . . . . . . . . . . . . . w l t i r r i r i ) . Y 1
Importanc~ maps for ii sample image. (a). Far (c)-(hl, brighter
regions represent higher importance. (c')size factor. (d)colour
factor. (e)ronrrast factor. (f)foreground/backgro11nd, (g)location
factor. and (h)firial importance rnap produced bu weighted summation
of ic)-(g). To fadi tate the evaluation of the final importance niap.
riit. rariking of ttir top€ive most important regions are highlightetf
in (b). Arrow directions indicate the next most salient regions. Y3
lmportanc~ rnap for 16 test images and the niost salient regions
highIightecl in the original image. The most sidient region is
. . . . . . . . . . . . . . . . . . . . . inciicated bu a red cirde.
Face detection. Original irnaged (a) and the corresponding
importance maps (b). Only color (red) and shape (circular)
fartors are used in computing the importance rtiap. . - . . - . .
The main window and the test parameter dialog. . . . . . . . .
The t hurnbnail dialog and the sdiency parameter dialog. . . . .
The first part of the image database. . . . . . . . . . . . . . . .
The second part of the image database. . . . . . . . . . . . . .
The t hird part of the image database. . . . . . . . . . . . . . .
The Iast part of the image database- . . . . . . . . . . . . . . .
The firçt part of the test set dong tnth the final segmentation
selected b - the threshoId-based method and the focus of attention
I
LIST OF FIGL'RES
(FO.4) path. The F0.i path is ordered according CO decreasing
. . . . . . . . . . . . . . . . . . . . . . . . . . . . . . saliency. 96
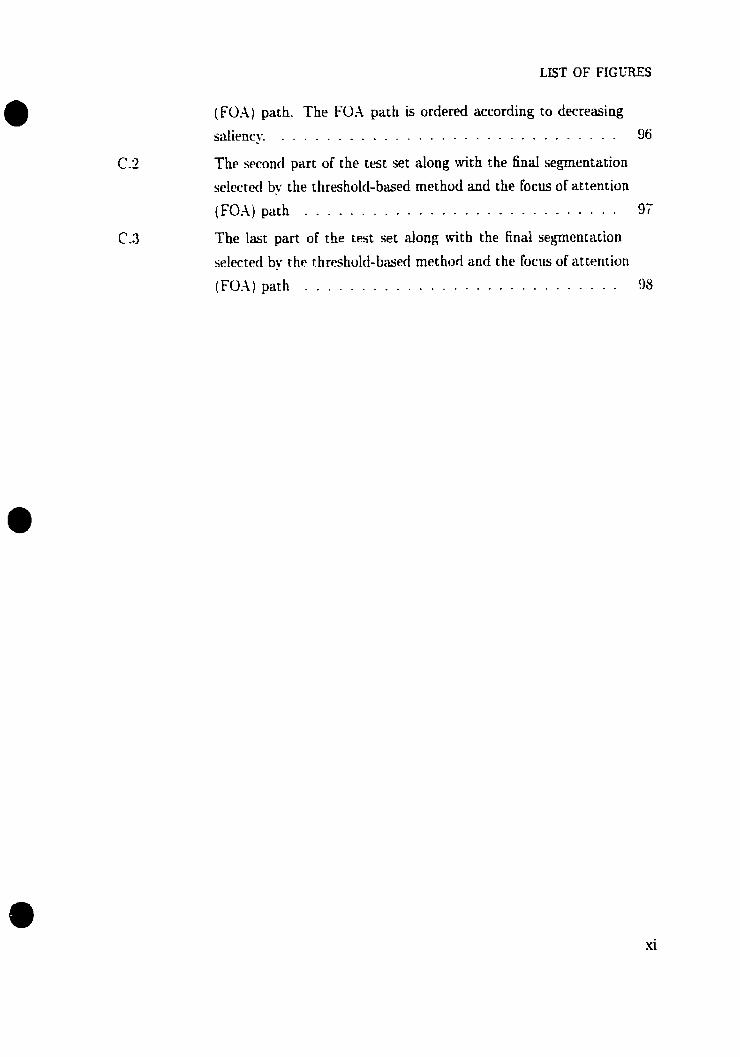
The second part of the test set along with the final segmentation
selectetl bu the thresholti-based rnethod and the focus of attention
. . . . . . . . . . . . . . . . . . . . . . . . . . . . (FO.4) path 97
The 1st part of the test set dong with the final segmentation
selected by the threshold-based methori and the foc~is of attention
. . . . . . . . . . . . . . . . . . . . . . . . . . . . (FO.4)pach 95

UST OF T.4BLES
LIST OF TABLES
Shapt? inipcmance wl~ies for Figure 3.4 . . . . . . . . . . . . . :30

1.1 THE ?iEED FOR OBJECT-BISED ATTELMIOS
CHAPTER 1
Introduction
This thesis disciisses the development and irnpIernentatiou of a complete object-basecl
attcmtion system for locating salient objects in an image. In this chapter. the need
;incl rriotivation for this approacti is presented. A n overview of the thesis follows.
iricliicling a hrief oiitline of each of the remaining chapters.
1.1. The Need for Object-based Attention
)[an! coniputer vision applications. such as object recognition 160, 391. active
vision [l?!. and content b a e d image retriet-al (CBER) [2, 371 can be made hoth more
t~tficieiit and effective if the objects ofhtertist can be segmenteci from the background.
Iii thc ixse of o b j w recog~iition. especially in a cornplex scerie. the recogriition process
rail htb riwrtb efficit~nt ancl robust if even a rough tstimation of the location iirid sim of
the salient objects çau be obtaiued [39]. A ranking of perceptual saliency or closenes
to the target niotlel is then required to rietermine tvhich region should be processed
tint. .As a resiilt. espensive computational resources can be focused mainly on those
regions that are worthy of more detailed examination.
This kind of attention -stem can ako be applied ta CBIR. to improve the retrieval
accuracy The first generation of image cetrietal systems relied solely on ketwords
~ntered h - a humCui when the image was entered into the database. The strength
of this approach cornes from the hi$ accuracy of the identification of major objects
present in each image and its image - p e (such as a xenic picture or art work). For
example. if one wants to retrieve images that contain a polar bear. he just needs to
type in the keyword -polar beaf to retrieve d images that have at least one polar
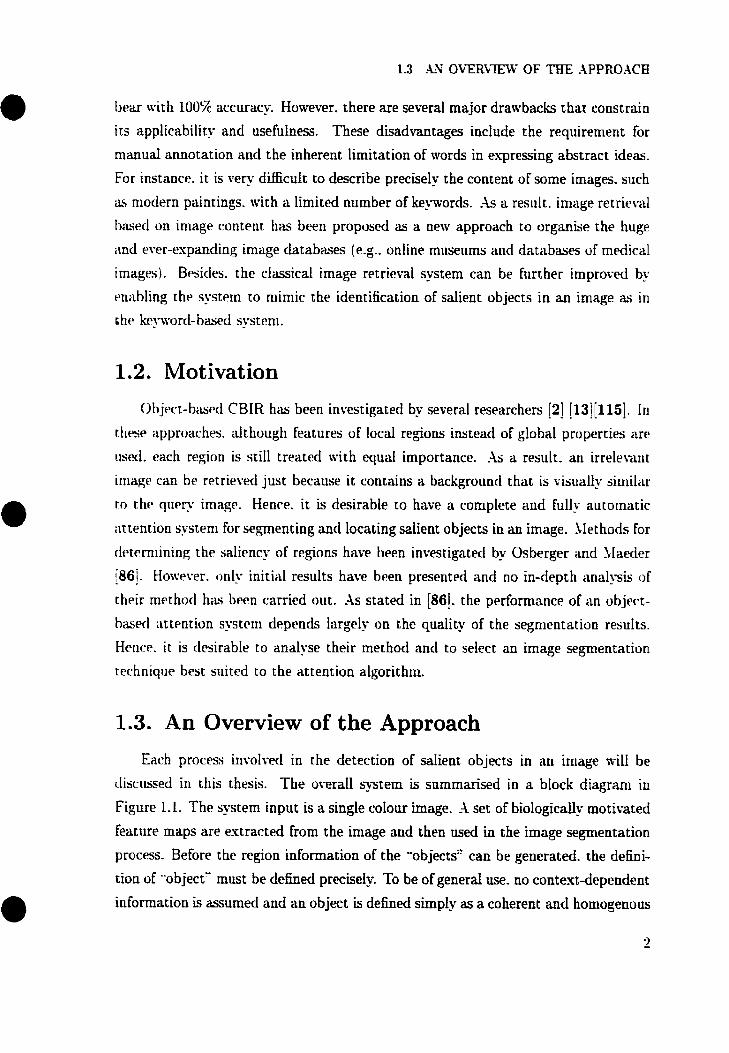
bear with 100% accuracy. However. there are several major drawbacks that constrain
its applicability and usefulneçç. These disadvamages include the requirement for
nianual annotation and the inherent limitation of words in expressing abstract ideas.
For instance. it is very difficult to describe precisely the content of some images. such
a. tsniodern paintings. with a lirnited number of keywords. -4s a resiilt. image retrieval
baseci on image content has been proposed as a uem approach to organise the huge
i d ever-espantiing image databases (e-g.. online museums and databases of medical
images). Besicles. the classical image retrieval system can be frirther improved by
rnabling the systern to mimic the identification of salient objects in an image as in
rhr keyworci-based systcni.
Motivation
Object-biwd CBIR has been investigated by several researchers 121 . 113][115]. . In
these approaches. dthough features of locai regions instead of global properties are
iised. each region is still treated mith equal importance. -4s a result. an irrelevanc
irriage can be retrieved just because it contains a background that is visually sirriili~r
ro the qi iery imagc. Hence. it is desirable to have a complete and fully automatic
attention systeni for segmenting and locating szlient objects in an image. hlethods For
cl~terniining the saliency of regions have been investigated by Osberger and SIaeder
. L86i. . Honever. only initial results have bbeen presented and no in-depth anaiysis of
their rnt~thod hi~s k e n carried out. As stated in f861. the periorrtiance of an objwt-
baseri ;ittmtion systcrri depends largely on the qualit? of the segnicntation resuits.
Heriw. i c is desirable to analyse their method and to select an image segmentation
technique best siiited to the attention algorithm.
1.3. An Overview of the Approach
Each proccss irivolvecl in the detection of salient objects in an iniage di be
rIiscussed i ~ i this thesis. The overall T t e m is summarised in a block diagram in
Figure 1.1. The system input is a single colour image. -4 set of bioIogically motivated
feitture maps are estracted from the image and then used in the image segmentation
process. Before the region information of the "objects' can be generated. the d e h i -
tion of "abject" must be defined preciseiy. To be of general use. no contextdependent
information is assumed and an object is d e h e d simpIy as a coherent and homogenous

Fcanirc I Extraction
Imponance Map Calcuiation
FIGURE 1.1. System Block Diagram. The method consists of three corriputatiotial processes shotvn in the left-hand coliimu. The data cransierreci between each process is indicated in the shaded strips. Ex- aniples of the input. intermediate data. and final output are shown in the right-harict column
region. If higher-ievel. topdonn information is knom a priori. chis information can
t>2 t i sd t o group the regions into a Iogicd e n t i - that resembles the original physical
object. The final stage involves the compmation of the Importance Map based on
a number of factors. such a s contrast and eccentricit- that have been able to draw
attention. This importance map represents the perceived saliency of the regions.

Organisation of the Thesis In Chapter 2 , a ret-iem of the literature of the biological basis of perceptiid g roup
ing and attention will be presented. The current state of machine vision simulating
these t w t a k s will also be described. Etidence from psychophysical experiments
shows rhat ubjects ciin exist preattentively and can affect covert attention. Hoivever.
riiit rriiich researcli has been focused on developing an object-hased rnodel of attention.
Hence. ir is desirable to investigate this topic in detail.
Chapter 3 bt>gins wich a discussion of the only object-based attention mode1 that
tm hem developed for cornputer vision applications 1861. En this model. tive factors
ares identifiecl and formtiiated mathematicauy. Situations mhere these factors fail and
?idutions co these problems will be discussed in this chapter.
[n Chapter 4. the details of selectiag a particular representatiiln schenie for each
fratiirr artn clisci~ssrd. Transformations on the feature spaces to iniprove the percep-
rual iiriiformity will also hr presentecl.
In Ctiaprer .i, t tie first section ret-iews the major image segmentation techniques.
Reasotis for selecting a particitlar image seginentalion method and sorue irnplenieii-
tiiticiti issue will Iie clescrihed in the cernainder of this Chapter.
FinaIl?. Chapter 6 prments a tarie- of results of the system applied to real world
iniriges. This inclucles an ~rarrii~iation of the selection of c-arioirs rnoclel parameters
;mi th^ fwsibiiity of iising chis system as a are-processor to a face-finding system.
1.5. Contributions
The major contributions of this thesis are.
0 Lots of work has been done on image segmentation. Horvever. them is still no
-'off-the-shelF' solutio~i that can be applied to d l types of images. One of t.he
miijor problems is the lack of a good measure of the quality of a particular
segrnerication. In this thesis. three different measures are considered and we
find that a simple threshold-based measure mith a manuaiIy select& thresh-
old give consistently better results than other more cornplex. statistics-basecl
measures.
O Parameters are a signiiicaut aspect of any mathematical formulation of an d-
gorit hm. Some paranieters can be obtained through theoretical arguments.

ffowewr. tht. optiniiitn values for some other parameters depend on subjec-
tive jutigements. such as the importance or saliency of different objects in a
scene. To retluce the bias on aay particular image type or subjective opinion.
systematic and estensive expenmentation has been performed ta find suitable
parameter d u e s .
0 The çomplete systern for locating salient objects is implemented in Microsoft
i'isual C - t tvich .\Iicrosoft Fundation Class (MFC) for a stand-alone appli-
ration. App~ndis A provides a hrief description of the system with imagw of
the graphiral user interface.

CHAPTER 2
Literature Review
David 11arr has mritten [73j:
"\Vhat does it niean. to see? The plain man's answer (and Aristotle's.
toi)) noiiltl be. to know what is where by looking. In other morcls. vision
is the procrss of ciiscovering from images what is present in the world.
and where it is."
i'isiial perception is a natural and native ability of humans and aninlais. Csing an
abrindant arnount of information about colour and form. me can sense the environm~nc
in its original 3-dimensions. or -!-dimensions if time is included. Sot only can ne see
rhc Sdimensional world. btit ive can also recognise the objects and understand their
positional. strtirttrral. iind r.ontestiial relacionships. In nature. the ability CO dewct
irriti r~cognise objects rffectively and efficiently is vital to survival. Animals rtiiist
hr iibIr to tlistingiiish their food from other less edible alternatives. The- musc iilsci
h t b ahIe to detert carnoiiflagtd or occlutled predators. The secmingly straightforwarcl
i d tfFortIess r s k of ohjecc detection and recognition for bath hiimans and anirniils
is estreniely tlifictrlt to sinlulate in the computer. One reason for this ciifficulty is
the inconiplete and unclear definition of object in the field of coniputer vision. If
KP want a computer to recognise an object. the definition of object must he precise
i nd without ambigriity. However. even for humans. there does not elcist a k e d and
uniwrsally held definition of object. Both C l h a n [1341 and Marr (721 raise the
qtiestion about the goal of segmentation. particularly in a bottom-up manner. 4Im asks: -Rla t . for esample. is an object. and mhat makes it so special that it should
be recoverable as a region in an image'? 1s a nose an object? 1s a head one'? ..." Tney
both conclude that it is ex~remely difficult. if not imposçible. either to formulate
ahat should be recovered as a region from ;in image or to separate complete objects.
such as a çar or a hoiise. from a complex scene. -4Ithough the problem of unclear
def nit ion of object or goal of segmentation seerns to be unsolvable. the task of object
detection and recognition is performed smoothly and accurately within the birman
visiial sustem. without an? sign of arnbiguity. in this chapter, both psychophysic:al
and physiological aspects of the rnechanisms iised b~ hiimans in perceptual grouping
ilriil attention will bv revicnecl. An overview of the current state of machine vision
i d 1 then be presented.
2.1. Perceptual Grouping
Iri the literature. perceptual grouping is sometimes described in other terms. suçh
as st~grnentatiori. rliistering. association. and figure-ground separation. depending on
rlie point-of-virw from mhich this problem is viewed. In 1661. Lowe states ttint Tpr-
wpttial r~rganisatioii refers tu a basic çapability of the huinan visud systeni to de r iv~
r thxr i t groupings and structures from an image aithout prior knowledge of its cm-
tents". Similarly. Sarkar [106] defines the term perceptual grouping or pcrceptiial
organisation as the iibility to impose structural organisation on senso- data. so as
to grotip sensop primitives arising from a common underlying cause. If a person is
; w k d to segment an image into different regions. the answer ma? not be unique and
varitls t'rrxn person :o person. For the image in Figure 2.1, one may segment the image
irito E\VO distinct groups: the b i ~ b m d the background. Jlnother possible segnien-
tation r.oulti be the baby the beach. the water. and the sky. Homever. one can also
further segment the baby's head from the body. This variation in cornplexity rnay
arise because of different general grouping systems. However. it is more iikely due to
;i riifftarerice in the level of abstraction rather than the overall -tem. Such a hier-
arrhical franiework for representing objects has been used in man? cornputer vision
systenis for tleriving higher level concepts of objects from lowver Ievel primitives [73I
;95] [78[ i42! 11071. - . In the first chapter of hIarrms book "Vision7 [73]. he descrïbed
four Iev~ls of abstraction for deriving shape information from images. The lowest
level is the image itself and the primitive a t this Ievel is the intensity d u e (either in
grey scaIe or colour) at each pkeI in the image. The second level is the primal sketch.
-4t this level. a set of loa level features is extracted fiom the tntensity or colour map
of the first level. The primitives at this stage are zero-crossings, blobs, terminations
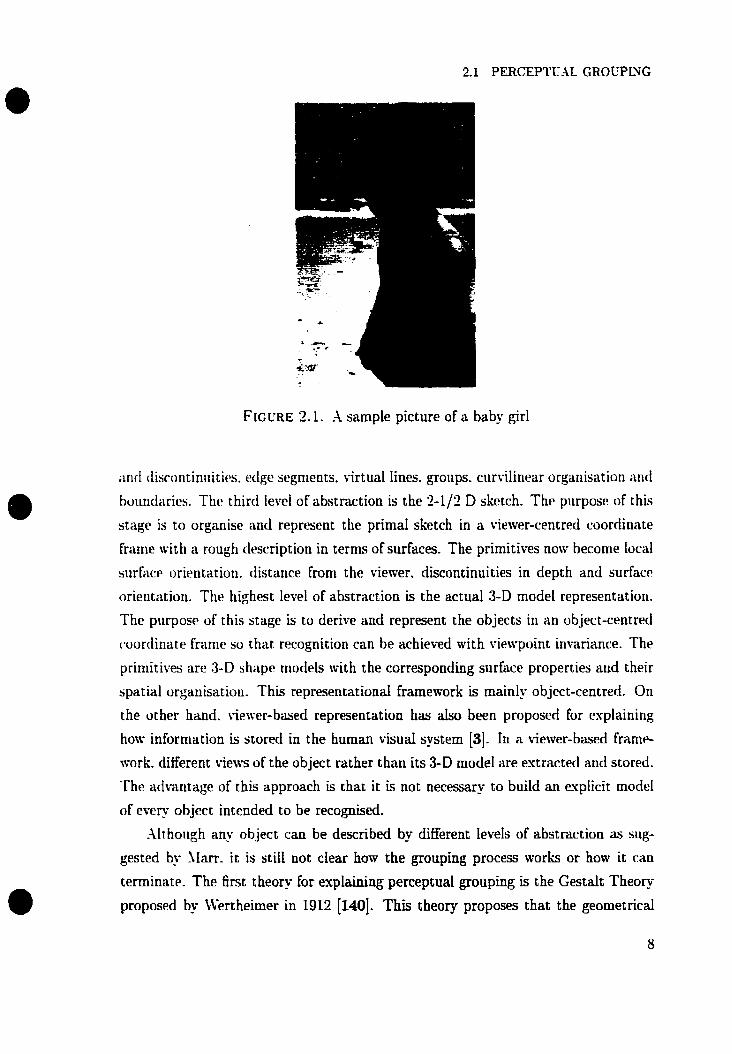
FIGURE 2.1. A sample picture of a baby girl
iiriri cliscontinuities. eclge segnients. virtual lines. groups. ciirvilinear organisation and
boi~rltlarics. Tht1 third level of abstraction is the 2-112 D sketch. The purpose of this
stage is to organise and represent the prima1 sketch in a viewer-centred coordinate
frarne with a rough description in terms of surfaces. The primitives now become local
surfac~ orientation. distance from the viewer. discontinuities in depth and surface
orientation. The highest level of abstraction is the actual 3-D model representation.
The purpose of this stage is to derive and represent the objects in an object-centred
(wordiriate franie so chat recognition can be achieved with riewpoint invariance. The
primitives are 3-D shape models Nith the conesponding sufiace properties and their
spatial organisation. This representationai framework is mainly object-centreci. On
the d e r hand. viewer-based representation has &O been proposed for explairiing
how information is stored in the human visual system [3]. In a viewer-based f r a m ~
mork. different views of the object rather than its 3-D mode1 are extracted and stored.
The adtamage of this approach is chat it is not necessary to build an explicit model
of eve. object intended to be recognised.
Althoiigh any object can be described by different levels of abstraction as sug-
gested by Ilm. it is still not ciear how the grouping process works or how it a n
terminat~. The first theory for explainhg perceptual grouping is the Gestalt Theory
proposed by Wertheimer in 2922 [1401. This t h e o l proposes that the geometrical

relationships thet humans lise in perceptual grouping can be categorised as follows
j141]:
a Similarity: SimiIar elements are grouped together.
a pro sir nit^: Eiements chat are dose cogether tend to be grouped together.
a Conciniiacion: Elenlents that [ie dong a commun Line or smooth cume are
grouped togec her.
a Syrnrnetry: Synmetnc curves are grouped together.
a Closirre: Cimes are connected to enclose regions.
a Familiaricy: Elements are gouped into familiar structures.
This theory implies chat t here is a tendency for humans to seek the rnost unam-
biguoiis and simple interpretarion of the world. This principle of sirnplicity of forni
is siitiilrir ti) the law of least action or the minimum principle discovcred by lincieut
Greek geornclters. This theop- has fostered many other theories and continues CO
rxtlrt significiirit influence on the psychology of perception. .Ilthough introdtrcerl at
the beginning of the ZILh centu- these s k principles are sti1I talid and arp the bilris
of musc groirping rziethortç. It shoulcl be noted that these rules are not esclusivc.
;iml groupings ni- be fornied using combinations of subsets of these relationships.
Cnfortiinately. the adgorithrnic irnplemencation of these mies is ven; difEcult becausc
the! have beeri obtairied through observation and they often confiict. even for simple
stirntili. as s h o m by Lowe !671. Moreover. the theon; is usually dernonstrated usirig
simple visiial patterns. mhich m e not a1was.s occur in the real world. the ivorkl of
iirirriiabIe. uricertain stimuli. Tberefore. on- a relatively few aspects of the Gestalt
rheory have been inçorporated into computer vision ?stems. such as similarity pros-
imity. and continiiity [106]. iVhen these principles are used together. higher Ievei
nieca-rules are employed either explicitlv or irnplici~ly. to guide their application.
Sinw perceptiiai groriping can be defined at many different Ievels of abstraction.
a uriety of specific goals has been selected and pursued by researchers. Sitmerous
interesting roniputational approaches have been proposed ot-er a wide range of ab-
straction Ievels. A classificato- structure in perceptuaI organisation is proposed by
Sarkar and B o y Il061 to organise these algorithms and as a standard nomenclature
n-ith &ich to clisc~çç existing and hture research. In their classification scheme.
algorithms are cIassified based on two characteristics The first is the type of feature
being organiseci or the Ievel of abstraction : signal level. primitive Ievel. structural
level. and assernbly leve1. The second is the dimensions over mhich the organisations
are sought : '2-D. 3-D. 2-0 plus cime and 3-D plus time. .4 grey scale image is in 2-D
rvhile a range image is in 3-D. With this classification scheme. since the totai number
of categories is jiist 16. some categories rnay contain more than one algorithm. Tu
further differentiate these algorithms. additionai classification schemes have been sug-
gested by Sarkar and Boyer. such as the computational technique. This cIwification
muctirre is useful for companng and visualising the similarities and Jifferenceç be-
tweeri dgorithms and chus tvill be used here. However. another possible dassification
schenie can be bzised on whether toplevel knowledge of objrcts is i1ti1ist.d or riuc.
Since the ernphiisis of this thesis is on '2-D images, the review tvill be focused on
those algorithms designed for gre-scale or colour images. Readers are referred to
Sarknr's paper 11061 for methods involving higher dimensions.
2.1.1. Signal Level
This Ievd iiivtilves the lowest and niost basic forrri of orgariisntiori. and the inpiit
Cr) t h algorithms are I o ~ i ~ l point properties.
Zahn 11481 has proposed the use of graphs to extract and detect Gestalt clusters
in dot-dusteririg problems. He uses a famil? of graph-theoretid techniques biuiseti
on the minimal spanning tree to segment severai kinds of dot c1usters. -4 mininial
spanning tree retains both the information of the local neighbourhood and the overédl
structures of the clusters and thus is suitable for data clustenng problems. Ziicker
il511 approached the problem of dot clustenng wïth a probabilistic mode1 for clus-
r e m Each pisel is clzissifierl according to one of three labels: edge. interior. and noise
rvith the corrclsponding probabiiity. -1 relavation process is used to relabel the pisels
iteratively irntil no more pixels are relabeiled. -1 similar method is used bu Spann
'116i i . for tigure-ground separation. He approached the problem using global optimi-
sation of a functiun representing the local error fit of an assrimed mode1 describing the
variation of the luminance over the local regions in the image. To minimise t hr effect
of tariance in scale and noise. a multi-scalar p p m i d was used with interconnections
hetween the layers. The optimisation is carried out using simulated anneaiing. The
use of a mode1 and globaI optimisation removes the necessity of selecting parameters
and t hreshulds. Hoaet-er. choosing a suitabte mode1 may even be more difficuh t han
setting thresholds or parameters depending on the problem domain.
Image segmentation also belongs to this category In a ret-iew paper 1871 pub-
lished in 1993. 173 papers are quoted in the references. Since then. more than ten

new r-tgoritlirns have been published [26, 111, 5, 61, 64, 110, 20, 901. The major
ctintributious of these methods are twofold. The first is a better definition of CO-
herent regions or boundiiries. especidly for comple'c scenes . For example. Deng et
ai. [26I propose a new measiire J for region uniformity that evaluates the spatial
(listrihirtion of rolour in an image. To reduce the overall comple.uity and to improve
t Iit, stability of the distribution estimation, the image is pre-qunntised to rediice the
niiniber of distinct colours. An interesting aspect of this meiisure is t hat bot h texture
and coloirr information are prtiserved and encoded in the distribution. Shi antl Slalik
il111 propûse a Iiew feature distance derived to reduce the instability of a simiiar-
ity niatris. Featiirct ciistance tvas previously defined eittier arbitrririly. such eqrial
rveighting on al1 fetatures. or from the s tat is t i~s in the test image set. Since this nex
distance is baset1 solely on the image data. them is no need to pre-define the signifi-
cancr uf eacti kature. For measilring texture. a set of filters is usually app1id to the
iniag~. B~longir and iIlaIik 151 . . find chat the filter responses insidr textiirtd regioris
are gtiner;tliy spatially inhoinogetitlous. Thtis. th- have dweluped a ncm nlethotf for
rditr:irig t h ( w inhortlcigeneities by a rnechod called area compIetion. The main idea
htlhiiid this rtiectiotf is to int:reue the similarities betmeen pixels if the? are dose n i
eiich other in thtl spatial domain and have neighbotrrs thnt are close in the featiire
cloniiiin. -4s ri restilt. a, non-uniforrn region having a repeticiw pattern of featiires can
still hp cIassifiei1 ns one region. Lambert and Carron [ôl] define a new cololir spiice
syiibolicall~. tvtiere hue is eqJicitly defined and processed according to its relevanc~
co chroma. A fiizzy (:lassifier is used to classift- the reIevance of hile based on the
follotving nites: 1. Hue is not reletant and cannot be utilised in segmentation for
srriall chroma ~x l i r e~ . 2. Hue is approximately ris relevant z i s chroma and intensity
Fur nierlirini chronia rdues. 3. Hue is very relevant for large chroma talues. Leung
iiriti Malik [64] definc! a new deûnition of texture as repeated scene eIements. To be
invariant to s a l e antl perspective. düne transformation is used rvheti measuring the
sirniIarit~ between different regions.
The s~cond contribution of recentlu proposed segmentation aIgoritbrns is a more
~ ' f f m i w or efficient way of region rnergtng and clustering in Feature space. Shi and
lialik [llO{ propose a novel approach to solw the petceptual grouping problem by
t r~a t ing image segmentation as a gmph partitiming problem. -4 globaI criterion.
normaliseci cut. is proposed by them for segmenting the graph. Comaniciu and Meer
[ZO] propose a generai technique for image segmentation based on feature densit.

1.1 PERCEPTCAL GROLTNG
A technique cailed mean shift algorithm is used For estimating density gradients to
locate the position of local maxima. The number of local masima or modes is deter-
rnined automatically by the algorithm: however. the number of mocles depends on the
width of the density estimation kemel. Park et al. [90] suggest using mathematical
morpholog'. to cluster and clas* pixels in the Feature domain. First. a colour his-
tagram is generated and smoothed with a 3-D Gaussian kernel. Xext. mathematical
morphology. tlilation and erosion. is applied to the histograni to remove the outli~iers
and to separatc distinct clusters. Carson et al. il31 propose u ing an Eupectation-
Maximisation (EU) algorithm to perform segmentation based on image features. The
clistribution Fiinction of each cliister is presumed to be Gaussian and the EI I algo-
rithm is used to determine the maximum Iikelihood parameters of a mixture of h*
Caiissians. This method is repeated For different values of K and the nitmber of
c*lust~rs is cletrrmineri by finding the best fit of the estimatecl paranieters to the thta.
2.1.2. Primitive LeveI
This It.vrl involvm the intermediate level of organisation with edges or ciirws as
iriptit .
Hfrault and Horautl 1471 attack the figure-ground discrimination problem frorii
a corribinatorial optimisation perspective. They define the problem as separating ii
salient cime from noise and make explicit the definition ofshape (or figure) based on
~orircirlarity. snioothness. proximity. and contrat in terms of matheniatical Forniuias.
Sitriiilatcd annealing is iisd For solving the conibinatoriiil optiniisatioti problem.
2.1.3. Structural Level
=\t this level. lines and regions are organised into a variet? of 2-D shapes.
Mahan and Setlitia [78] use perceptual organisation for scene segmentation mcl
tltrscription. This segmentation system generates hierarchies of features that corre-
spiintl to structttrai elcnients such as boundaries and surfaces of objects. Bwed on
Gestalt principles. edges are grouped to form curves. Contiguous curves are grouped
to form contours while qmmetric cuves are grouped to form symmetries. Nexx. s y -
rnetries rtlll become ribbans if closure is detected. ..ln exhaustive search is used to
ftnd reiationships between different features. Before each search. inmiid or conflicting
hypotheses of a - joins or groups are removed using geometric constraints: cocunilin-
earity. çoa t inu i~ - proximity. and ccmmnination. Promising results are dernonstrated
on real images with a srnall number of objects. However. because of the inefficient
search method. the complesity can grow exponentially for more cornples scenes.
To overcome the computational comple'uty of rnany hierarchicai approaches.
Sarkar and Boyer [IO?] propose a voting method and graph-theoretic structure to
represent the data organisation. They recognise that the bottleneck of the susteni
is the compatibility test among al1 pairs of tokens. By building a histogram of the
coken's feacirre similar to the Hough transform. the compatibilitv test then becomes
tt boirntled s~arch throrigh the parameter space.
Both rnethods proposetl bv Sarkar and Mohan utilise onIy edges as input to the
syscem. On the other hand. Schlüter and Posch [IO81 proposed combining boch
contour and region information for perceptud grouping. In this method. edges are
first groiiped recursively to form 2-D closures (closed regions). At the sarne time.
rqion segmentation is performed and then the resiilting region map is niatched to
the closest eclge group. Additional boundaries are generated if some rclgions cannot
br matrhctl to ;in! ~ t lgc groiip.
2.1.4. Conclusions
Percepciral grotipirig is a basic and effortles capability of the hurnan risual sys-
t t m Hotwwr. i ~ 5 r~vi~nclci in chis section. this grouping task is ti~vioi~sly riot sirriplts
but a very complirated process that encornpasses severai levels of abstraction. -11-
ttioiigh a lot of research have been done on this topic. there is still no gcneral theory
that can esplain most of the known t-isual grouping phenornena. such as figurepiincl
discrirnination and object detection.
Visual Attention System in Humans In orcler to repiicate human tisual performance. we have to andyse and under-
stand how the system works wïthin our brains. Even though most of the hunian
brain's functional mechanisms and its underlying neurai circuit- are still unknorr-n.
a basic idea about the t-isual -tem c m be acquired fiom psychophysical and neuro-
physiologicai e-xperiments conducted in the past. Based on these hdings, a biologi-
cdiy motit-ated mode1 of attention can be devised.

2.2.1. Structure of the Human Visual System
i'isual information enters the nervous system in the retina. travels through the
lateral geniculate nucleus (LGN). and then enters the cerebral cortex at the back
of the head in an area named 1'1 (also k n o m as the -striate corte<). From this
scarting point. information branches off and traveIs fonvard into the many specialiseci
visual areas that are located in the posterior hdf of the brain (called .*extrastriate"
visiial areas). As the information travels fonvard from the striate cortex into the
txtriutriate cortes. the features coded bu single neurons change from simple bars and
tdges to more complex attributes of object identit.
2.2.1.1. The Retina
T~vo types of photosensitive ceh . rods and cones. exist in the retina. The? have
cliffmwt sensitivities and adaptation rnechanisms to differmt wavelengths. Cones are
;rssociat~d nith coloiir vision ahereas rods are associateci with vision at low light
levels. Three different types of cones (red .'aciually yellow". green. and b h e conrs)
arr foiincl in the humriri rctina n-hile a fourth typçl of conc. the double cone. is forml
in non-primate visual -stems. These cones appear to be distribiited more or iess
riindo~rily i ~ i the retiria. but there are müny ber cones for blue than for grmi or r d
The r~lativc nutnbcrs of recl. green. arid blue cones are fotind to be in the ratio of 40
CO 20 Co 1 pal. An intercsting characteristic of the retina is the non-uniform distribution of the
photoreceptors. The tIensit>r of these receptors is much higtier at the centre of the:
rc1tiria. calleri the fovea. chan in the surrouncling region, The density of the receptors
r1t.c-reast~s mith the distance frorn the centre. This foveated-sampling scheme provides
significant data rediictiori at the expense of having to physicall- move the fovea to
t fit* point of interest.
2.2.1.2. The LGN
The LG?; represents an intemediate rehy stage between the retina and the visual
cortex. The LGS. organisecl in six layers. is an important switching device used to
segregate the parvocellar (P) md magnocellar (hl) channels and to align the input
frorn the two eyes. The SI [ayers are coocemed primarily with non-cotour vision
processing ( e-g.. motion of objects and spatial reasoning) while the P layers are vep-
important for colour vision processing (e.g.. object recognition). Three of the Layers

receive input from the ipsilateral eye and the other three from the contralateral e y .
The distinctions between P and 41 ceils are still maintained in the cortex.
C'1 is layered like the LGX. There are three cypes of cells or neurons in the 1'1:
simple. cornpleu. and hypercomplex. Simple cells are chsracteriseci by receptive fields
with excitaton; and inhibitory fields. and whose profile c m be modelled by Gabor
fiinctions [551. Coniplex cells show orientation selectivity in much the sane Ka-
siniple cells but the? do not have distinct escitatop and inhibitory zones (not phase
sensitive). Firizilly. hypercornplex ceIls. also callecl end-stopped cells. are vert. sensitive
to line endings. cilrvitttire. and angles. Wich these cells. several perceptual properties
ciln be detected stich as selectivity in orierication. size. position. colour. direction. and
depth. The responses of al1 V1 neurons can be thought of as retinotopic feature maps
rharacterising the visiial stiniulus captured by the retina.
.-lfr.~r 1'1. both the pathway and functions becorne more comples. Thc presence
of crossover ancl feecfback make ic v e p difficult to analyse and interpret the actiial
layoiit of tlie neural circuitp.
2.2.1.4. Discussion
One of the reasons for the existence of attention is the need to shift the high-
resoliition fovea onto the most important parts of a scene. providing a tletailed d e
sc-ription of the object of interest. The low-Ievel ieatures extracted and rncorlecl in the
hiimari visual system incltide colour (red. green. and blue). twtiirtD. position. motion
and tlrpth.
2.2.2. Psychophysical Aspects of the Human Visual Attention
System
Man- of the rnechanisnis of ttuman visual attention have been discovered through
psychophyical esperiments. In these experiments. human performance is evaluated
rlnring some sp~cific. t-isromotor task. Most psychophysicai investigations involved
with attention are actually concerned ni th covert attention. and its facilitation effects
on visual tasks.
Two basic models of human visual attention are the zoom-lens model and the
spotlight model. The first rnodel n-as initia& proposeci by Jonides [56] and then
Furt her developed by Erîksen and his associates 1311 [W]. They propose t hat attention
is analogous to il zooni-iens systeni. At a low-power setting. attentionid resources
irre evenly distribiited across the visual field. If the discrimination task is ilifficiilt.
or rvhen a pre-cue haci been previously flahed. the attentional system zooms in to
that area and allocates a clisproportionate share of the processing resources to it.
However. not a11 attentional resources tvould be employed in the pre-cued area. The
remaining resources are sharcd among other locations. The second modcl m s first
introdiiced by Seisser [al] and then moctified by Julesz [58] and Treisman [123] !124/
:125] 11261 il271 j1291. This paradigm proposes that attention involves two distinct
stages. preattentive and attentive stages. In the first stage. processing is perfor~tierl
in piiraIlel over the whole field. whereas in the second stage. a seqiiential analysis of
some parts of the image occurs. The spotlight metaphor is proposed for the attentive
stagf* since it would only affect a limited area of the visual field. Ewn though the
clebiittb ahout this second moclel is still open [139]. it is by far the rnost acceptecl
paradigm of visuiil attention.
2.2.2.1. Topdown and Bottom-up Control
The twri basic nirchariisnis that coritrol visual attention can be describeci as goal-
tlrivm (top-rlotvti). ;ititl stirriiiltis-tlriven (bottorn up) processes. This distinction is not
new. For rxaniple. iVilliani .lames (1590) [54] characterises this tlistiuctiun in terms
of "active" iiritl "passive" riiodes of attention. Attention is said ta be goal-drivcn ivlieri
thtt attention is controlleci bu the observer's deliberate strategies and intetitions. t r i
rvr>ntrast. attention is said to be stimulus-driwn tvhen it is concrolled by some saliwt
attrihiitcs of th^ image that arc! not nec~ssarily relevant to the observer's perceptiid
goals.
2.2.2.2. What features catch the eye?
The niost important question about the t-isual attention system i.s what Featrires
c-;rn catc-h che OP'S attention or mhich feature attracts the most Lxations. For the
passive bottom-up mode of attention. it is necessmy to identify a set of basic features
used in preattentive processing and determine whether attention depends on the
kattire itself. the feature contrat. or both. It is d s o important CO find out whether
chese feattrres have equitalent effects in drawïng attention. SIany experiments have
been condircted to analyse different stimulus propenies. in general. targets having
distinct features are percepttialIy salient and stand out fiom a background pattern,
For the first question. Wolfe Cl461 has an extensive reviem on defining a basic
feature set for visual search. The presumption is made that if a stimulus supports
both efficient search and effodess segmentation. then it is safe to incltide it in the
basic set. He states that there is a reasonable consensus about a srnail n u m b ~ r of basic
features and more d~bace over several other candidates. Some of the basic katures
conststent with chc esperirnental results are:
a colour. [136] lIuch research has led CO the conclusion that colour is one of
the best ways to müke ii stimulus "popout" from its surroundings. For siniple
patterns. roloi~r difference aloiie is siifficient for eficient visiiril search aricl
rffortless texture segmentation.
a onrntatzori. [35! Orientation is also ivell-accepteci as a basic feature in visiral
srarch. Hoivewr. a d i f f e r ~ n c ~ of 1.5 degrer or niore is n~etied to siqiport ~ffirirtit
visiia1 s ~ i i r ~ h .
a r-irn!atiue. [1281 It hè~s hheen foi~ncl that curved lincs can be h n c l anicing
straigtit distnirtcw tising parnlld proccssing. This implies that the tirne rp-
qiiired for Jetecting the ciirwd lines rioes riot cliffer sigriific-antly with tiic rilirii-
b ~ r of cargets. How~wr. the search is l e s eficient if the target is straight and
dit, distracters are c u n d
a srcr. Treisrnan and Gorniican [128] concludc ttiat it is easier to fintl big oh-
jeccs iamong small ones chan srnaII among big. However. for a giveti size of
rlihcractcrs. finding a biggcr target is no eaçier than a srnaller one. In addi-
[ion. the slliptl of the reaction time against the number of targets is v e p sceep.
implying that size is not a. good basic feature for nsiial search: escept for a
siniple case in which a big circk iç surrounded by much smaller ones.
motion. ;74] It is apparent ttiat it niIl be vert- easy to find a moving stimt~lits
among stationary distracters.
shupe. IVolfe States that s h a p is probably the most problematicat basic feüture
becatrse there is no widely agreed layout of shape space". Some candidates
for the u e s OF this çpace are Iine termination [57]. chsure [27], and face [33].
For the second question about the significance of a certain feature and its contrat
in dratving attention. Sorttidurft [82I bas performed a series of experiments designed
to investigate the role of features versus feature contrast in preattentive vision. Hi
study shotvç chat features. in general. are not round to ptay an important roIe in chese
t;isks and performance was instead related to feature contrast. Only in the case of

colour docs performance also depend on the hue feature. Theeuwes' 11211 experinient
dso show che attention-grabbing abiiities of colour. Recent results presented by
'clmrian et al. 170) also suggest chat initial fixation placemenrs are not controHed by
perceptiia! featurrs donc. In this study. eye movements were nieasured while viewers
e s a n ~ i n ~ l grcy-scalp photogaphs of reaI-world scenes. They also at ternptrd to spwify
the visiial fraturrs t h tleterminetl initial fixation placement 1711. They analysecl
!cical regions of their scenes for sevrn spatial features: Iuminmc~ muirriri. liiniinrinrt*
iriiuinia. image çoritrat. mxxirnri of local positive physiologiral contras. mininia of
local riea,ative physiological cont r i t . ectge ciensity. and high spatial frequency. €rom
their analysis. onIy rdge dwsity predictrcl fixation position ro an! reliable riegrw
;inci rven this featirrtl produced only a relatively w a k effect. Thus. the nature of the
visuai features that roacrol Fixittion placement in scenes is still undear.
For the Lut question. whetlier or not features have equimlent effects in tirawirig
attenrilin. the intuitive answr woiilcl be no. Basecl on esperirnents in which sribjecrs
serirr.11 fur singletons ( a singleton is a single target among homogeneoits distracters
and tliffers froni thme clistracten by ii single basic featurt.). llluller arid Foilnd . i791 .
;irpiitb t tiiit t h ~ c.rmtrihrition of an! specific feature to the ovcrall salierice of any object
is runtrolled by a wcight thiit can change frum t a k CO task and. iridtd. frorri trial to
triai. The'. finri that the rwiction titrie for tria1 .V is contingent iipon the rclationship
hmwm targpt identity on trial -V and .V-1. That is. people are fa te r to finci a cduiir
si1ig1twt1 cl11 triai .V if a 1-oloiir smglcton is found on tria1 Y-1. jt-hile esp~rimentri1
r~sults support rhe iinewn wighcings of different feacures in drawing attentiori. h w
r h t w a~ightings iirp tiistritiirt~ti or hoiv the! are altered quantitativel. h a y ~ t to bp
esplaineri.
liost of t ht. rarly psycliologii-al esperiments were coaclucted nit h simple imayfi
havtnq a dark barkground and simple objects such as bars. circles. squares. and Icr-
t m . For th es^ images. it is v e v casy to distinguish the background from the objects.
These esperiments are usefiil in isalating the effects of diierent features. but not for
shm-ing t heir inter-relationships. The attention-grabbing abilip- of dXerent fe-atures
on romples real images ma'; differ from these simple ones. Tû understand how eue
movement is controlled in more realistic visual-rr3gniti1-e ta&. reading and scene
riewing have been studied. -1 common assumption in these studies is that the
cion pnint of the ~ y e is the fotus of attention at a given tirne. Bumetl [Il] Ends that
the 6~ation ptxitions are highly regdar and related to information in the pictures.
For esample. viewers tend to concentrate cheir 6xations on the people rather than
on background regions when esamining Sund- Xtemoon on La Grande Jatte by
Georges Seurat. Henderson et. ai. i46j also have found chat 6rst p a s gaze duration
and second pass gaie duration are longer for sernantically informative than unin-
formative objects. providing evidence for reiatively ear- peripherally-based scene
analusis. To determine whether attention is relaced to semantic informativeness (the
nieaning of the region) beond visuai informativeness (the presence of discontinuity in
tesciire. ïolour. liiminance. and depth). Henderson et ai. [44, 451. conducted a series
of psperiments with the semantic informativeness defined as the degree to which an
objecr vas predictable witbin the scene. A n iinpredictable abject \vil1 have high se-
niantic informativenoss and vice versa. They do not Bnd any tendency by the viewer
to iriiniediately k-atc their attention ou semmticdIy informative objects, De Garaf
flt al. [24] also foiintl no rvidence that semantically inconsistent objects were fixateci
rarlicr than consistent objects. However. the? observe that viewers tend to look back
more ofteri to seniantically informative than to uninformative scene regians. Thcse
resiilts suggest that the attention is first driven bu a bottom-up process before a more
organisecl top-down proress is engaged to analyse the scene in niore detail.
2.2.2.3. A r e objects available preattentively?
-4 rerent t i~ba t r in the literature concerns nyhether covert attention is directecl
to iinsegmented regions of space. or to segmented perceptual groups that are likely
to çoristitutc çohcrerit objects. As our xt ions must ultiniately be clirected towrd
indivitiual objects. sotnt. theorists have proposed that it rvould be efficient for covert
attention to operate on s~grnented objects rather than on unstructured regions of
space [4] [29] [81]. The space-based and object-based rnodels of attention are often
presented as mutually esclusive alternatives [4]. However. m e - hybrid t i e m are pos-
sible. For instance. covert attention ma? operate ivithh a spatial medium (as argued
hy Tsal and Lavie [130j). but grouping processes ma- act to modulate the spatial
estent of the attended region (Latie and Driver [62]). Lavie et al. [62I exarnined the
relation between segmentation and spatiaI attention by esanlinhg patients hating
disorciers (estinction. neglect. and Bdint's syndrome) after brain damage. He found
that the effects of these brain-damage-reIated qadromes can be reduced if the two
concurrent erents forrned a good perceptual group such as dumbbell shape instead
of two circles. Based on this evïdence. he argues that spatiaI attention is diected

within a segmented representation of the visuai scene. Mth a t Ieast some of this seg-
mentation taking place preattentively. Rcnsink et al. [IO21 also show that objects
have some preattentive existence by demonstrating that preattentive processes are
sensirivc to aciiliision. IVolfe Il451 has condiicted a series of experiments that make
i l similar point. These rfiiilts support the idea that objects cari exist preattmtively.
In this section. reçent and past discriveries and Iinowleùge about the human visiial
susteni are prejcntcd. From chis review. it can be seen that there is no general
iigrtlenient on major issues of the visual attention systern. such as a model of attention.
seltlctiun tif r i brwic featiir~ set. and the spatial nierlium of the i i t t~~itioti proces.
Nev~rtheless. thcrtl is both physiral and psyhological evidrrtice showirig the t & t t v w
and iniporranrc ofa sniall srt of basic features. which inchde colour. texture. position.
and motion. within ttit. htrnian visual attention system. In additions. object-biwd
attmtion systenis haw dso been proposed both as an alternative or as an complernent
to the space-based model of attention,
Visual Attention Systems in Machines Reccnt arin~nces in r-ornputer technoiogy are =tonishing and have madc a real-
tirne niachine vision systern FedisibIe. However. despite enormous progress in reçerit
yars . machine vision -stems stiIl have a long way to go before approaching th^ lewl
of iiuman performance. The main reason for this is the Iack of effective and efficient
algorithms For man- general cornputer vision processes. such as image segmentation
and object recognition. One remedy to this problem is information selection or data
reduction so as to reduce computationd time and to suppress irrelevant data and
noise. Starting from the rnid40S. specific efforts have been made towards more effec-
tive uiocfels of attention. Since that time. more than ten models has been proposed
i75, 50, 109, 101, 36, 21, 104, 131, 191. Most of these models. horvever. have been
trst~tf only on simulated data. In r e a l i - we seldom see any objects mith perfectly
uniform colour and teyture- Even for artificial objects. the surface property rnay be
affected by shadons. highlights. and non-uniform lighting. For the mode1 to be prac-
tical. it sbould be able to toterate a certain amount of noise and be applicable to a
wide range of environments. Its performance should also degrade gracefully in case
of failure.
The attention riiadels proposed by Koch 1501 and Milanese [761 are very simihr
and are h z ~ d on an architecture previoiisly proposed by Koch and Cllman [591. This
architectiire is relateci to Treisman's feature integration t h e o l [128]. Visual input is
first decomposed into a set of featiire maps. Colours. intensity. and orientations are
u s ~ d in both moriels nhile edge tnagnitude mcI ciirt-atiire are also usecl in 5liliu1esr's
niod~l. Thesr maps are then transformed into conspicuitv maps representing the
'-ronspiciiity" of locations. Intcgrating al1 thc conspicuity maps forms a final saliency
niilp. The final sritgfl of th es^ two niodels is not the same because their intended
applications arc different. Koch's model is used for simulating the scan path so
that a winner-takeall selection schenie and inhibition of return are used thc final
stage. On the ritticr hand. sinw the purpose of 5Lilanese's model is for locating
iiiicl rtwgnising objccts. the saliency map is further processed to provide both the
position iind region information nhich iiïc fed into another higher-level process for
objert recognition.
Scla and Lrvinr jlO9J mode1 interest points iis the loci of centres of CO-circwlar
rvlgts. Espcrinicntzil results on real images show that centres of symmetry rorr~lnte
w l l with hiinian fisation points. Reisicld et al. [IO11 ;triti Gesii r t al [36] iilso itse
ayninictry in predicting Lxition centres.
In t in ie - ta~ing iniagery. Concept.ion and Kechsler [21] propostd an attention
srhenie baseti un edgr rnaps, motion ciies. and past history. In their algorithm. the
saliency map is iiseci CO guide the coarse to fine classification of objects so that the
irnioiint of information to be processed later is reduced tremendously. Their main
contribution is the integration of active and selective attention with leaniing and
m e m o l in a hierarchical frarnework. Rybak et al. [IO41 describeci an attention mode1
for espiaining innriant object recognition in humans. In their model. attention is
iised r o guide visual perception and recognition. However. the attention mechanisni
is a topdown proces instead of bottom-up.
.-\part from geueral visual attention systerns. Tsotsos et al. 11311 proved that
in visita1 search. if esplicit targets are given in advance. the tirne comple'aty will be
a Linear proportion of the image size. On the other hand. if no e-xplicit target is
provided. the task is XP-complete. Thus. the? propose that the human brain mat-
not be solvin:: this general problem and it is necessary to have attentional selection to
guide the search process. -4 mode! of primate visual attention is d s o presented t h
is boch biolûgically plausible and computationally feasible. -4 topdonn hierarchy of
witiner-take-al1 processes is embedded within the visual processing pyramid. Horvever.
chey nlso state thiir a balance betrveen data-driven and knowledge-driven proceses
rniist be achiewd.
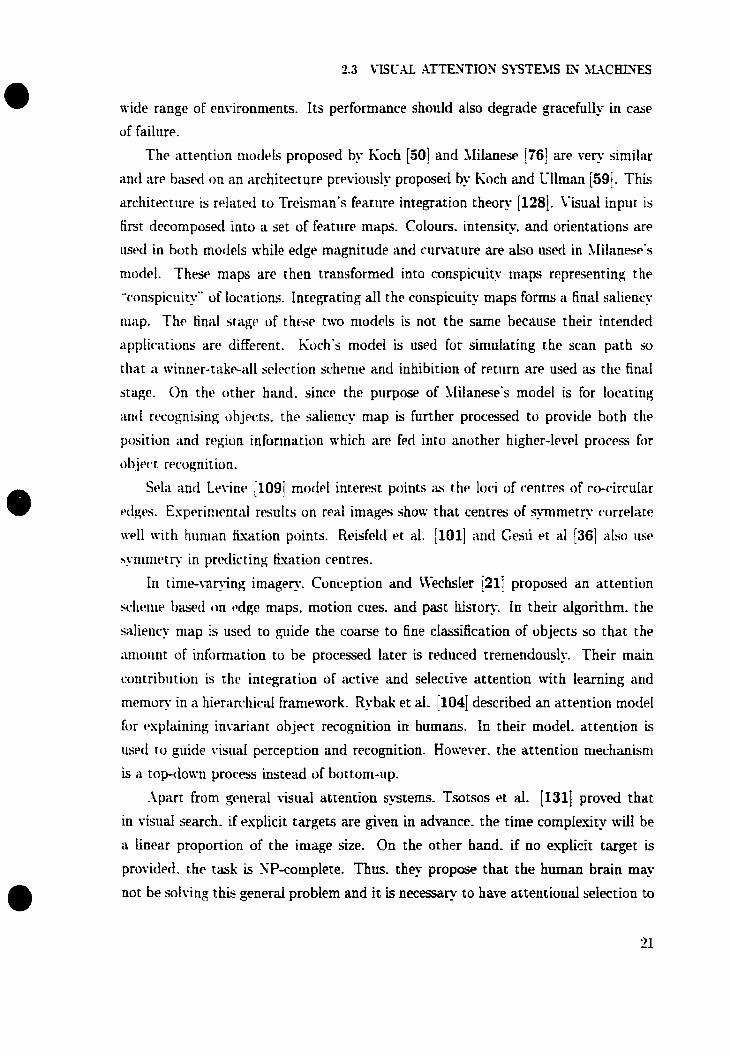
Osberger and S[acder 1861 preseut a method for determining the perceptual itn-
partance of different rpgioris instead of point locations in an image. They sderteil
tivv factors t hat t i w p hem faund CO infitience visual attention in assmsing the overall
iniportariw of each region. Fhese factors are: coatrast. size. shape. location. ruid
foreground-barkgrl~~incl. The finai salien- measure is obtained by the sumrnation of
C ~ P squarP of each factor.
.\Iost of r hc atteiitilin nicicieIs proposed for machine vision are spaccd-buect wtiere
p t ~ ~ p c ~ i i i l sa1icnc.y is cirt~rrnined by local feature contrait. such as Koch's nio( f~1
;trici 1iiI;iriw~'s I I I O ~ P ~ . On the 0 t h hand. ohjecc-based attention rnarlels also arp
r ~ c ~ i v i n g incr~asing rinioiints of attention. For these models. o b j m propertics. srtch
;is: synimetry. region size. shape. and intensity contraçt are çonsiclerrd. [t is not
c-lrirrly iindcrstood wtiich approach is more efficient or effective in niodellitig himan
ittttwion. H O ~ V P V P ~ . ~ i n i . ~ rriost cornputer vision tastsks are Enallu focused on individua1
ohjects. and not rriuch research have been done on chis topic. it is northwhile ancl
huitfiil to investigate object-baseci attention in greater detail.
CHAPTER 3
Perceptual Saliency Measure
This Ctiapter rxplor t~ Iiow ohject-brised visual atteution can be modeiled in a triachine
visiun systeiti. Those factors which have been identified b~ Osberger and Naeder
. 1861 . will h~ presentetl aliing wich several new rneasures infiuenced bu psyrhophysical t~virIt*ntv. Methods for combining these factors ni11 aiso be discused in ttiis Chapter.
Perceptual Saliency Factors
In nwst cases. a perceptually saiient region ail1 correspond to a perc~ptually
nicaningful or interesting object. However. in some situations. a percepti~aIIy salient
regiun m q not be related co any logicai objects. in scene viewing. Henderson imri
Hollirigwrtb 1451 firid that iuitid Lution placement does not seem to depend on the
scrnantic informativeness of regions. In these experiments. semantic informittiveneçs
is definecl as how unlikely the scene region is expected from the context. However.
people tend to look back more often to semantically informative objects. Hence. if
visual attrntion is defined as the point of fkation. there exist at Ieaçt two definitions
for visiiai attention. The first definition is what kinds of regions can attract €kations
instantaneously within the first two seconds of viewing. The second one is which
regions vkaers will look back to more often. These ret-isited regions are what the
rïew~rs are interested in and seek to knom more about. This overt attention often
ÏnvoIws a higti-level topdown process mith the goaI set b - the viever. Objects that
people usualIy look for inchde human faces. animak. automobiles. and aeroplanes.
Csiially. peopIe are less interested in objects that oRen form the background. such as
the sk. floor. and ~ a l i . -4,s a r d t . whenever human judgement is used in assessing

FIGURE 3.1. Block diagram for Osberger and .LIaecler's Importance h p calciilation
;in attention model's performance, these two distinctions have co be stated clearly.
In this thesis. our attentiori will be focused primarily on the low-level, bottoni-up
process.
3.1.1. Osberger and hdaeder's mode1
The prirpost. of this mode1 is to automatically determine the perc~ptiial irnpor-
tance of clifferent regions in an image. The h1ock diagram for Osberger and Maeti~r's
importance niap calculation is shown in Figure 3.1. In [86]. eight low level features
and four tiighcr l e d factors are identificd which have been foiind to influence hii-
nian visiial attention. Thcse low IeveI features are intensity contrast. size. shape.
çolour. motion. brightness. orientation. and line endings. Higher level factors are
location. foregrounc1/backgror1nd. people. and context. These features are simiIar to
those iclrntifietl hy Wolfe 11461 as tiescribed in Chapter 2. Of these features. only
tiw factors are selected by them for rnodelling tlsual attention. The mathematicaI
definition For these fivc factors are stated belom. In order to be able to compare these
factors tlireïtly. the? are scaled to fit in the range [O.11.
Contrrtst of rqiun. Regions haking high contrast ~ 4 t h their surroundingr; are
foiinci to be visiially salient. Aence. the contrast importance l,,t,,,t is defined
as the differenc~ in the mean grey level of the regîon R, and its surrounding
rp.!$ons Rr -rmqhbours -
where 3(&) is the mean g e y level of region 4. and $(&-n,,hhr) is the
mean grey level of al1 neighbouing regions of 4.
3.1 PERCEPTC-IL S.-CE' FACTORS
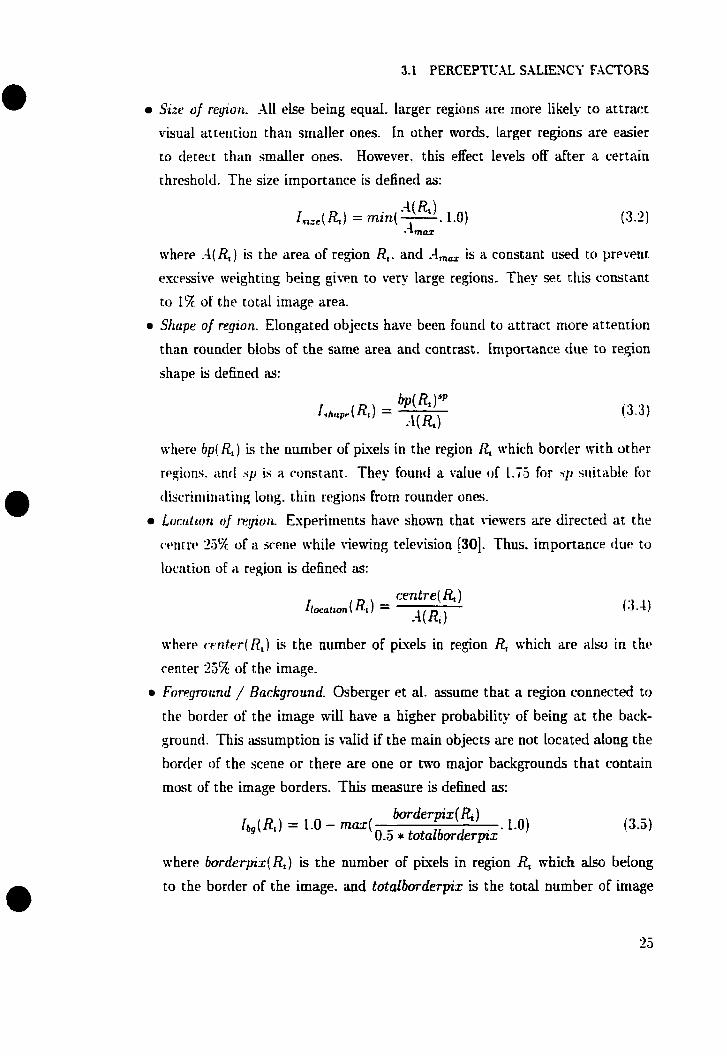
a Sizr of reyiorr. -411 else being equd. larger regions are more likely to attract
visual attention than smaller ones. In other words. larger regions are easier
to tietect than smaller ones. However, this effect levels off after a certain
chrestioId. The size importance is defined as:
where =I(R,) is the area of region R,. and .A,, is a constant used co prevent
excessive weighting being given to very large regions. The- set this constant
to 1% of the total image area.
O S h p e of regzon. Elongated objects have been found to attract more attention
than rounder blobs of the same area and contrast. Importance due to r e ~ o n
s h a p ~ is defined as:
nht3re bp( RI) is the nuniber of pixels in the region R, which border with ot her
r~gions. iind sy is a constant. They foiirirl a value of 1.75 for .sp silitable for
tliscririiiiiatiiig long. tliiri regions froni roiinder ones.
Locritaorr of ryiorr. Esperitrietits have shown that viemers are directed at the
c-tsntrt. 23% of a wene while viewing television [30]. Thus. importance due to
location of il region is definecl as:
where c ~ n t e r ( R , ) is the number of pisels in region R, which arp also in thc
center 23% of the image.
O Foreground / Background. Osberger et al. assume that a region connected to
the border of the image di have a higher probability of being ae the back-
ground. This assumption is vatid if the main objects are not located dong the
border of the scene or there are one or m o major backgrounds that contain
most of the image borders. This measure is defined as:
where borderpx(R) is the number of pixels in region R, ~t-hich also beiong
to the border of the image. and totafborderpix is the totaI number of image

3.1 PFKXPTUAL. S.-CY FACTORS
border pixels. Based on this definition. regions with a high nurnber of image
border pi-els wilI be clasiéied as belonging to the background and \vil1 have a
Lnw Joregro~iind/bnckground importance.
3.1.2. Discussion
The f i v ~ factors chosen by Osberger and 4laeder are usefui for modrlling hurnan
visi~zil attentiotl in simple sititations with strong "popout" effects. -4.5 describeci in
Ctiapter 2 . chr most widely agreed rissumption that has been used in man! psy-
choIogical experinients is that an object or target is salient and pops-out froin thr
background if its visual features ciifFer frotn other objects. T h ~ s idea is proposcd by
Triesnian iri her F ~ a t r i r ~ Integration Theory 11271. Contrast or differcnce in visual
Ctiattirc~s c m fadi tate visual search and thus is visually sdient. Contrast c m be de-
fin~rI not onlv bu incetisity. but also by other Iow-lever features suçh as orientation and
coloitr. Horwver. rontrast alone is not enough for explaining the .-popout" effect of
ohj~crs having ~lisrinct fecttiires among other ciistracters. Contrast can only be iised
t i i tssplain thta rrlutrur perceptiial saliency of rsoluteri objects: nut b r objjects cl[l~;~~tbnt
rci t w t i othcr. Ttiis is riot tiarci to understand. as shown in Figure :3.2.
Contrwt is mi~aily defined as the distance in the feature space. In case 1. intcnsity
cont rast for region -4 and region B is CO and JO. respectively. and chus rttgion .A is
prrccptually niore salient. This prediction is consistent with human judgement. In
rase 2. hoivever. the contrast for region .4 and region B is the sarne. with a talite
t i f 70. The prchlrtn with this image is the lack of a common reference franie for
intcrpretatrori. One in t~rpr~ta t ion of this image can be a very large bright square
having a rwtangirlar hole in the middie. -4nother interpretation can be a dark bar in
a ririifornt white hickground. Although these two cases are v e p simple and pruhably
rvoiiId not occtrr in reality. they show the necessitu for a good measure of figure-
grouud discrimination. In case 3. if someone is asked to decide whether region A or region C can attrrtct more attention. the answer would be A. From the contrrrst
calciilation. the vidue of saliency of region A is 30 whiie that of region C is 35.
:{93 - 30) t (100 - 93)] * 0.5. Hence. the prediction based on contrast done could be
wong For regions adjacent to high contrast regions.
In assessing the relative depth information of different regioris. Osberger et al.
use the percentage of image border as an indication or background. This means
saiient objects are presumed to occupy none or a very srnail portion of the border.

3.1 PERCEPm.U S ~ ~ C Y FACTORS
Case 7
FIGURE 3.2. Situations mhere a contrat medsure succeeds and wherc it fails. The nimiber within the brackets indicates the region's intensity. For al1 three cases. the background's intensity is equal to 100.
Siich iiri assumption is d i d for most photographs since the most important objects
are placed roughly in the centre of the image when the picture is taken. It is not
vlilid. honever. if this placement rule is not followed when the image is taken. siich
as pictures taken from a camera mounted on a mobile robot. or if a background
rcgion is separated into ttvo isotated regions by an occluder. Some of these isolated
rcgions m e not even be close to the image boundary and thus NiII be assigned a
v e e high value for foreground/background measure. In Figure 3.3a. region B is
obvîoiisty iri the foreground while regions A.C. and D belong to the background.
Since region C does nnt touch the image border. it miII be given a very high value.
1.0. for foreground/ background importance. This problem can be solved by grouping
regions A and C by similarit? and continuation. Hon*ewr. this grouping must be done
carehlly to avoid grouping t-cvo seemingIy distinct objects. such a s region B and E.
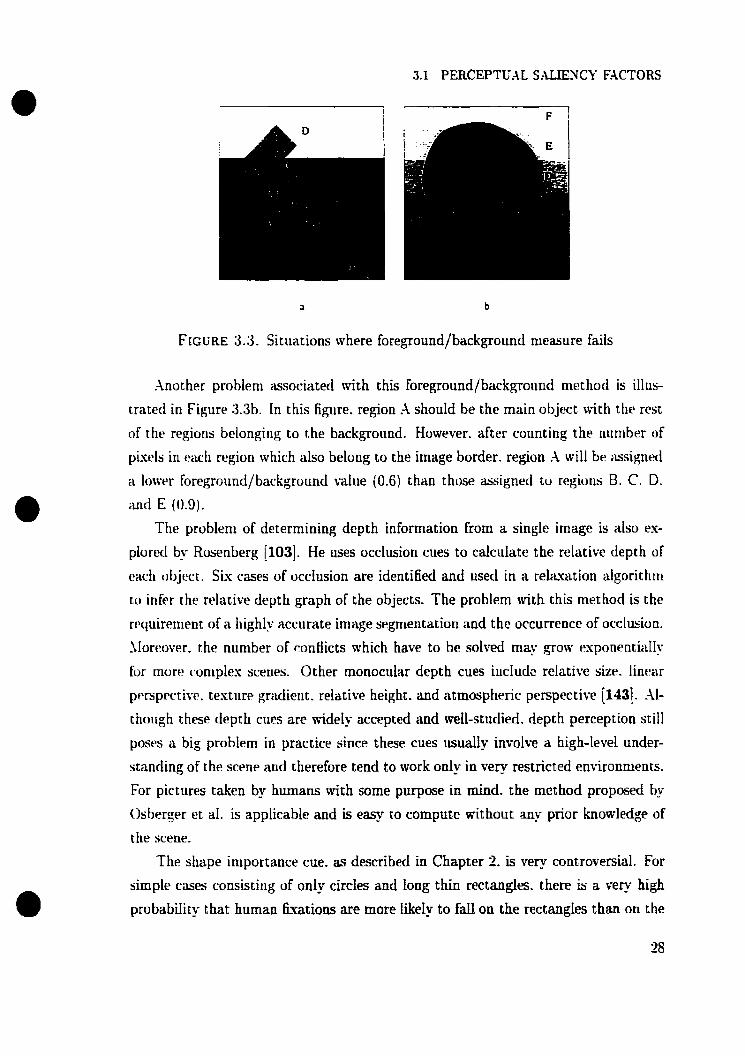
3.1 PERCEPTUAL S.-UIEYX FACTORS
FIGURE 3.3. Situations where foreground/background nieasure fails
;\nocher problem associated with this foreground/background method is illus-
craterl in Figure 3.33. In this figure. region -4 should be the main object with ttie rcw
of the regioris belonging to the background. However. after cotinting the number of
pisels in e d region which also beloug to the image border. region -4 will be assignecl
a lowr foreground/background value (0.6) than those assignecl tu regiotis B. C. D.
irnd E (0.9).
The probleni of determining depth information from a single image is also es-
plorerl by Rosenberg [103]. He uses occlusion cues to caIculate the relative depth of
t~iich object. Sis cases of occiusion are identified and used in a relrisation algorithiii
to inier the relative tlepth graph of the objects. The problem with this method is the
rtquirement of a Iiighly accurate image segmentation and the occurrence of occlusion.
').IOCPOVP~. the number of ronflicts which have to be solwd ma? grow evponentiaIly
for more coniples scenes. Other rnonocular depth cues iucludc relative siii~. linear
p~rspertiw. testiire gradient. relative height. and atmosphcric perspective [143I. -41-
choirgh th es^ depth c u ~ s are widely accepted and weIl-studied. depth perception stiiI
poses a big problem in practice since these cues risualiy involve a high-level under-
standing of the scene and therefore tend to tvork only in very restricted ent-ironmencs.
For pictrir~s taken b_v hirmans with some purpose in mind. the method proposed hy
Osberger et al. is applicable and is easy to compute without an!- prior knowledge of
the scene.
The shape importance cue. as described in Chapter 2. is very controversial. For
simple cases consisting of only circles and long thin rectangles. there is a very high
probability that human Euations are more IikeIy to fall on the rectangles than on the

FIGURE 3.4. Situations where shape measure fails
circles. For niorp comples shiipes. such as the example shown in Figure 3.4. how-
cver. the evidence is less clear. \C'hich shape attracts most of Our fi'rations? 1s the
-'Z" shaped region G more salient than the irregular shaped region D? How about
the hexagon E'I The shiipc importance mesure proposed by Osberger et al. favoiirs
elongatecf regions over rounder ones. The shape importance vaiues of these regions
are shown in Table 3.1. For this image. the most salient region predictetl by the shape
importance niemire is the background B. This regiou is certainly not circular and h a
manu long and narrow parts. Hence. it has the highest perceptiiai saliency valiir for
S~LRPP! Thtb major problern for an? shape definition is the presence of *-hole". such as
the buckgroiind. Do we consicler its shape as the oiitiine of its outerrnost bouridav?
Or do we also ronsidcr the inner boundaries such as the shape of a doriut'.' In other
tvor(ls, do wc treat the encloseri regions as textures or not'.' .lpparently. there is no
simple answer to these questions. If the application is restricted to certain enriron-
nients and the most important objects are well-identi6ed and kriown beforehantf. one
can niake some useiul conclusions about the shape saliency of regions. Otherwise.
the usage of shape in rnodelling the hurnan attention çcstem shoultl be approachecf
catrtiotisly if not eliminated altogether because this feature is not weil-defined and its
effect on attrscting human visuaI attention is not well-understood in generd.
3.1.3. New and Modified Importance Factors
Basecl on the discussion on Osberger and Maeder's method. some of their coni-
putational methods are modified and new factors are proposed.
0 Contrust in colour and teztzlre. The contrast importance ImLrait niil1 be rede-
fined as the Euciidean distance in the mean colour and texture of the region
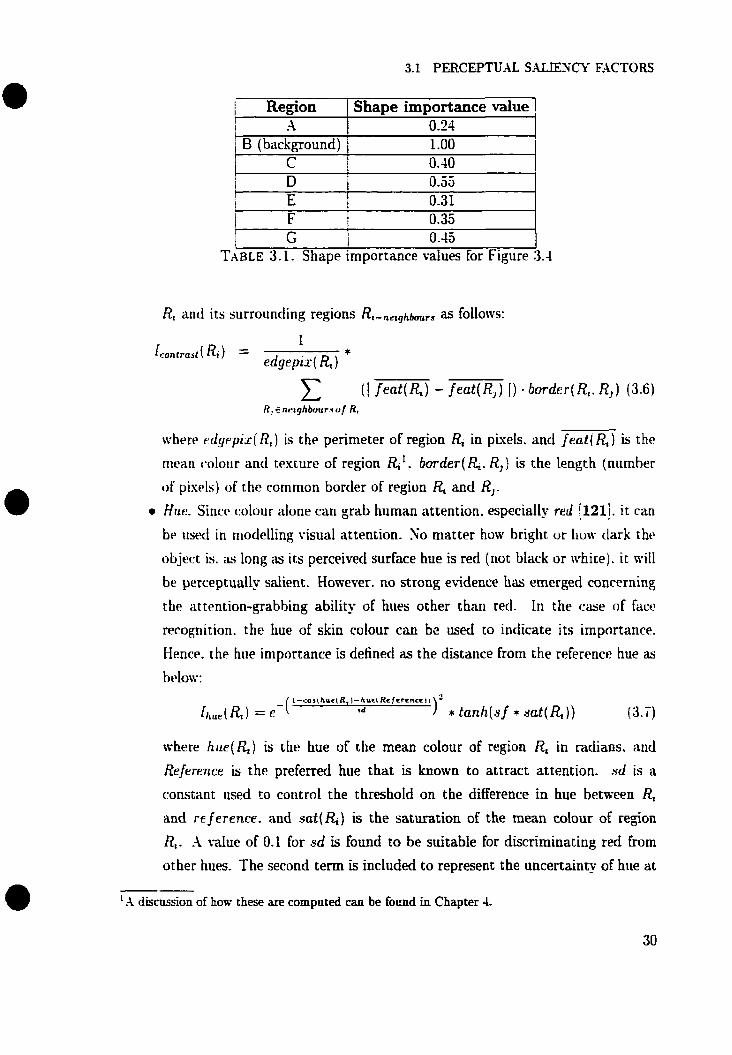
3.1 PERCEPTUAL S . ~ ' i C Y FACTORS
1 Regon 1 Shape importance value !
r I
I G 0.45 TABLE 3.1. Shape importance values for Figure 3.4
l
j A ' B (background)
C
R, and its surrounding regions RI-nriqhbours as follows:
0.24 1 .O0 1 0.40
( 1 f e a t ( 4 ) - feot(R,) 1) - border(Q. R,) (3.6) R! cnrighbuur.r o f R,
wher~ rdgepis( R,) is the perimeter of region & in pisels. and feat(%) is the
niean ralour and testurc of region R,'. border(&. R, f is the length (number
o f p i s ~ l s ) of the common border of region R, and R,. a Hue. Since colour alone can g a b human attention. especially red i121!. it cari
ht. ttscld in niodelling visual attention. Xo niatter how bright or tioii- dark thc
c~b.ject is. as long as its perceived surface hue is red (not black or white). it wiI1
be perceptually salient. However. no strong evidence h a emerged conrerning
the attention-grabbing ability of hues other thüri red. In the case of face
recognition. the hue of skin colour c m be used to indicate its irnportanc~.
Hence. the hile iniportance is defined as the distance From the reference hue as
b t4ow:
~ h e r e hue(R , ) is the hue of the mean colour of region R, in radians. and
Refermce is the preferred hue that is known to attract attention. sd is a
constant used to control the threshold on the difference in hue between R,
and rejerence. and sat(f$) is the saturation of the mean colour of region
R,. .\ d u e of 0.1 for sd is found to be suitabie for discriminating red frorn
other hues. The second term is included to represent the uncertainty of hue at -- '-4 discussion of how these are computed can be found in Chapter 4.
3.1 P ERCEPTG.U S . U N C E ' FACTORS
different saturation Levels. -4t low saturation value. the colour appearance is
grey and thus the value of hue is meaningless. Hence. a rnonotonic increasing
furiction ( t a n h ( x ) ) which levels off alter a certain threshold is used for the hue
uncertainty function. s f is another constant used to control the saturation
level of the uncertainty function. For the CIE L'a'b' color space. a value of
0.0017 for s f is suitable.
O Suturution. ln general. people are more interested in coloiirful regions with
vivid colour. Colour saturation is considered by Braun [SI as a perceptual
saliency factor. Siniply. the importance of saturation is just the saturation
Ievel of the rriean colour of the region .
O Locution. The eqiiacion proposeil by Osberger et al. has a sharp cut-off be-
tmen the centre 25%: ouf the image and the surrounding region. -4 rriort! general
forrri of this function is defined belon-:
tvhere fL, , (~. 9) can be any function relevant to the importance of location. in
particular. the following function is used:
rr and h is the midt h and height of the image.
0 .Veiu f o r t . ~ o u ~ d / h a c k ~ o ~ u n d rneasure. [n order to solve the problem associated
nith Osberger and Naeder's rnethod discussed in the previous section. their
rriettiod is niodified. First. global region properties are used to group regions
together if there is a high probability that these regions corne from a single ob-
ject. In redity. shadows. highlights. uneven lighting, and many other sources
of noise are very cornmon and unavoidable. Thus. it is better to perforrn the
simiiarity testing adaptively so that the merge restrictions are tighter when
the noise lewl is low and l o w r when the noise level is high. One possible
3.1 PERCEPTCAL SAiEWCY FACTORS
approach is to impose a restriction that only regions which form a single con-
nected cluster in the feature space will be considered to be -similar". 147th
this approach. the usage of an absolute threshold can be avoided. Since L W
separate objects can also have sirnilar features that form a single cluster in
feature space. as shown in Figure 3.3. another mesure of '-occlusion" mirst
be iised to estimate how likely the two regions belong to a single objecc and
arc separatcd by an occhder. [n real scenes. ive often observe that if a large
backgroiind is separated bu objects in the foreground. a large portion of the
backgroiind woiild stilI be connected to the border with several rnuch srnaller
isolated regions. Hence. a more consenative condition on the ratio of regions
can be applied to hirther reduces the error probability of merging two different
regions. A high probability for -occlusion" wiil be assigned only if the ratio of
a region is much srnaIler than the total area of al1 the regions chat are -sini-
ilar" to this region. Ti, solve the second problem associatecl with Osberger's
riirthod wlierr the main objects ucciipy a large portion of the image border.
the filreyround/baçkground measiire can be deiïned ,as the ratio betwecn thv
number of border pixels and edge lengths. The final foreground/backgroun(l
rritu.siinn is tlefiri~d as folhvs:
borderpxel( R,) is the number of pkeis in region RJ which aiso belong to the
border of the image. ,and the baundarypixe!( R, ) is the number of pisels in the
bounda - of region R,. The function is the probability of these regions being
occluded by other objects.
3.2 METHODS FOR C O M B ~ ~ G THE II\.iPORT--L\iCE FACTORS
3.2. Methods for Combining the Importance Fac- tors
After obtaining the importance d u e s for each factor. they have to be eombined
to give an overall ranking For each region. A simple sunimation rnethod proposed by
Osberger and hIaeder [861 and Four more complex combination strategies proposed
by Itti i d Kocli [49j wi11 be discussed in this section.
3.2.1. Osberger and Maeder's Method
Osberger and SIaerler [86] chaose to treat each factor as being of equal importanre
sincr it is difficult to deterniine exactly how rnuch more important one factor is than
iinother. They observe that very few regions would respond strongly for al1 factors
and thoscl regions iclentified by hurnans as salient usually have a very high ranking
in anly soriie factors. Hence. each factor is squared and then summetl together to
produce the final importance value as follows:
3.2.2. Itti and Koch's Method
Itti ancl Koch [491 have conducted an experiment to cornparc four feature corri-
hination strategies for sdiency-based tisual attention systerns. The four strategies
they considered are: (1) simpIe nomdised summation. (2) linear combination with
Leamed weights. (3) global non-hear normalisation followed by summation. and (4)
local non-Iinear competition behveen saiient locations. In their tisual attention sys-
tem. visual saliency is defined as the magnitude of spatial discontinuities in colour.
intensit. and orientations at different scales. A large number of featiire maps (a total
of .32) is generated and combined by one of the four methods. They also observe that
salient objects itppear strongiy in oniy a few maps and may be masked by nuise or
l e s salient objects. Experimentai results show that the simple normaIisation rnethod
consistently yields ponr performance mhile the ;trainedV method yields the best per-
formance. However. different learned mights are used for different image cIasses. The
other two methods yield intermediate performance. Since the last two methods (3
3.2 METHODS FOR COMBIMXG THE MPORT+INCE F.4CTORS
and 4) do not require ar- Learning procedures or any specific models. the? are rririre
generic and are applicable to a broader range of situations.
3.2.3. Discussion
-4s discussed in section 1.2. the foreground/background measure is more impor-
tant t han the m i t rast and shape measures in region-basecl attention. Hence. qua1
weights shoiild not be useci. In Itti and Koch's experiments. the 'mained" met hod
consistently yielcled the best performance mith a cwo-fold improvement when corn-
p m r l tci thfa othcr methotls, Since the parameters are allowd to va- for diffcrenr
test images. this niethoci catirioc be iised in a general visiori susterri. Hoivever. it
~vuuld bc usch1 to analyse the performance of a -trainedW methocl with only one set
of paranictcrs for al1 test images. The other two methods proposed bi- itti and Koch
arc more generir, hoaewr. the spatial normalisation Iiinctions I I S P ~ in these nitxthocis
vanririt he e'ttended directlu to a region-based feature map. Thus. these two methods
i d 1 riot hr corisicierrd. -4s ;L result, the int~gration methoci that tvas i~secl in ttiis
reseiirch is the iwighterl suniniacion of a11 importance factors. aitii the wighrs di-
t i~ i r id by ~xprrimentation €rom a large collection of test images. If no speciiic rveights
ton irny Factor ran be found to inlprow the overall performance with confidençe. c)rw
cxn eittirr itscl tyiiaI wights for ;il1 iniportançe factors or cIassify the test images iiito
rlitft'riwt categaries and t h m find the optimum weights for each group.
CHAPTER 4
Feature Selection
The perrcptiial saliency functions described in Chapter 3 require the image CO be pre-
segmented into coherent. non-ovedapping regions. that resemble the original ptrysical
objects in the çcene. Hoivever. before an image can be segmented. it must be trans-
formcti into n set of feattire maps that alIow similarity and surface continuity to btl
(lefine& The rnost commonly iised features for image segmentation are colour (201.
testure [85]. and posicion [131. These features are intuitive to humans in discrim-
iriating and separating different objects. We usualIy use colour and testirre when
cltwribitig tht) visual proprrties of an object such as brown m i curly hair. ti sniooth
ilnt1 shiny slirfactl. etc. Position is also an important crie in ciiscriniiniicing objerts
since if two regions are far apart in the spatial domain. they have a lomer probability
o f helonging to the same object. Biologicaily. specid neurons in the human visual
systerii arp capable of rleterting al1 of these features at an early stage. Spatial infor-
mation about the objects can be easiIy included in the feature vector by inrlurling
the s-y-coordinates of each pisel. However. utifsing this extra information can have
negative sicle-effects such as breaking up a Large unifom region [13j.
For colour and texture. many feature spaces and cornputational methods have
b ~ e n proposed in the Iiterature. Hence. selection cnteria must be adopted to choose
a particular representation scheme for these features. Since the objective of the
segmentation stage is to have the image segmented as if it were performed by a
human. the feature space should also be perceptudy uniform. That means the
perceived difference of an? tmo samples separated by a fked distance in the feature
space should be constant.
4.1 COLOCR
M e r the extraction of these features. the? must be combined to form a single
feature vector. During this integration proceçs. decisions have to be made on how the
features are to hcr cornbined and what to do if these features contradict each other.
For esample. how similar is the perceptual difference of a unit distance in colour space
cornpared to a unit &tance in texture space? In addition. since texture refers to the
spatial distribution of colour. the colour of the pixels within a texture region will riot
be the same or even similar. iinless it is a uniform .non-texture" region.
In the following sections. a brief review of colour and texture is presented. as well
as niethocfs for resolving conflicts that arise from the feature integration process.
4.1. Colour The hurnan visual systern uses three different kinds of cones. each with different
spectral sensitivity. t« sensc the colourful world (see Figur~ 4.1). These cones have
peak responss at wavelengths of 580. 340. and 440 nm. respectively. \C'ith these
rhree rcceptors. ive can distinguish coioured lights mith cliffererit wavelerigtlis ariil
intcnsitirs. Sinw thtl pciwer spectrum of light in the visible freqiiency range is encoded
by three channels only. t his tmodirig is a niany-to-one mapping and the original potver
spectrurri rarinot bc recover~d cor~ipletely by the human visual system. However. this
provides a usefiri additive property of the appearance of light. A misture of two lights
at different waveiengths van produce a colour that appears different from the two
original light sources. -4s a result. the whole visible coiour spectrum can be producecl
by niising three or more primary colours at different proportions. -4s three channels
are iised in the human visiial svstcm. trichromacy has been adopted in computer vision
for reprcsenting coloiir quarititatively. However. the aavelengt hs of the t hree prima-
colours defined in the CIE (Commission Internationale de ïÉclairage) standard are
100. 546.1, and -4353 nm instead of the peak responses of human cones in order to
rriatch the light emitted by artificial light sources.
Based on this standard. al1 image capture and display devices are designed nith
these three primary rolours. subject to s m d variations depending on the actual
materials rssed, The mn-- format of any colour image is the RGB format speci-ng
the relatke intensity of the three primaries. h y coIom is represented by a point
C(r. g. 6) in a colour cube. as shown in Figure 4.2. The origin of the RGB colour space
is the -colouf biack and the full brightness of ali three primaries together appears as

FIGCRE 4.1. Spectral sensitivity of cones from Cos. Estévez. and \IV& rwen il371
~vhitc. Thrrc c-orners of the colour cube located on the major xxes correspond to thcl
thrrr priniaq coloiirs: red. green. and blue. The remaining three corners correspond
to the seçon t i a~ coloiirs: yllotv. cyan. and magenta.
In the romputer. cach of these Lxes is encoded with 8-bits. ranging forni O to 25.5.
Initiallu. the RGB colour space is linearly related to the intensity. However. because
of the nonIinear rrliitionship bettveen the input signal and the resulting brightness
of niost d i s p l - systenis. such as the cathode ray tube(CRT). the input signal to a
(lisplay devire rniist ht* niodificd to eliminatc this nonlinear property. This coniprri-
sacion nietiiorl is called gamma-correction. For a typical rnonitor. the eleçtro-optical
radiation transfer function is often expressed by a mathematical power function:
~ h t w I is the brightness of the pixel. -4 is the masimum luminance of the CRT and
IV is the applied voltage in the range of O and 1. For a conventional CRT. gamma is
aronnd -1.2. For couvenience. images oc photographs. especially those posted on the
irirernet. rvhich are intended to be t-iewed pnmarily from a PC. are already gamma
correcteri thring the encoding process so that no extra correction is needed wheu
displa-ing them- The resulting colour space is cailed nonhear RGB space or sRGB
space [118].

FICCRE 4.2. coloitr cube
4.1.1. Coiour Spaces
Diie cc> the logarithrnic relationship between the perceiveci brightness by Iiiimanu
and the actiial intensity. the linear RGB space is perceptually nonlinear. Moreover.
this cdotir susteni is tiot intuitive sçince people are more acctistomed to the t hree ha-
sic attributes of coloiir: hue. saturation. and bfightness. To correct these problems.
riew rolotir spaces and transforniations of the RGB colour çpaces have been proposed
[48, 147, 961. Some colour spaces are simply linear transformations of the RGB space: CIE 1931 .YYZ and Y . . CIE 1960 YUK and CIE 1976 YU'V'. Coloiir spaces
generated by nonlinear transformation incfude: 1-CBCR(.JPEG and SIPEG digital
stanrlard). PhotoYCC(Kodak PhotoCD systern). HSI(Hue. saturation. and inten-
situ). CIE 1976 (L'a'b'). and CIE 1976 (LBu"v"). Some colour spaces are obtained
by collections of colour sarnples in the form of patches of paint. matches of cloth.
pads of papers. or printings of inks. Such s-tems are referred to as colour order
systems and include the SIunsell system. DIN I t e m . Coloroid system (designed for
use by architects). and OS4 (Optical Society of America) system. Xo mathematical
transformations have been proposed yet For these colour order systems escept the
Slunsell -stem [771.
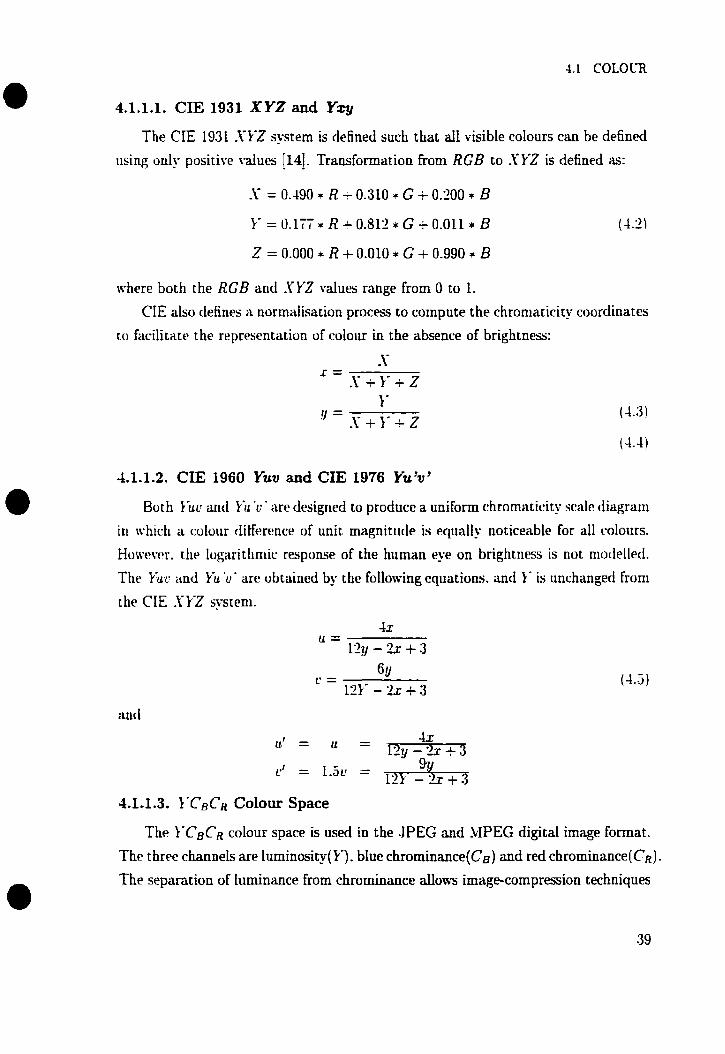
4.1.1.1. CIE 1931 X Y Z and Yxy
The CIE 1931 SYZ system is defined such chat dl visible colours can be defined
using o d y positive \-dues 1141. Transformation from RGB CO S Y Z is defined as:
~l-r-tiere both the RGB and .YYZ values range from O CO 1.
CIE also defines a normalisation process to compute the chroniaticity coordinates
CO facilitate the representation of colour in the absence of brightness:
4.1.1.2. CIE 1960 Yuv and CIE 1976 Yu'v'
Both ILL: aiid Yu 'u' are desigried to produce a uniform chromatiçity scale tliagram
in tvhirti a eoloiir clifference of unit magnitude is equnlly noticeable for al1 coloiirs.
Howevvr. the lugarithrriic response of the human eye on brightriess is uot niorldletl.
The Yur and ).ü 'u' are obtained by the following equations. and 1' is iinchanged frorxi
the CIE . Y k Z systeni.
4.1.1.3. I-CBCR Colour Space
The l'CsCR colour space is used in the JPEG and MPEG digital image format.
The t hree channels are luminosity(k'). bIue chrominance(Cs) and red chrominance(CR)
The separation of luminance from chrominance allows image-compression techniques
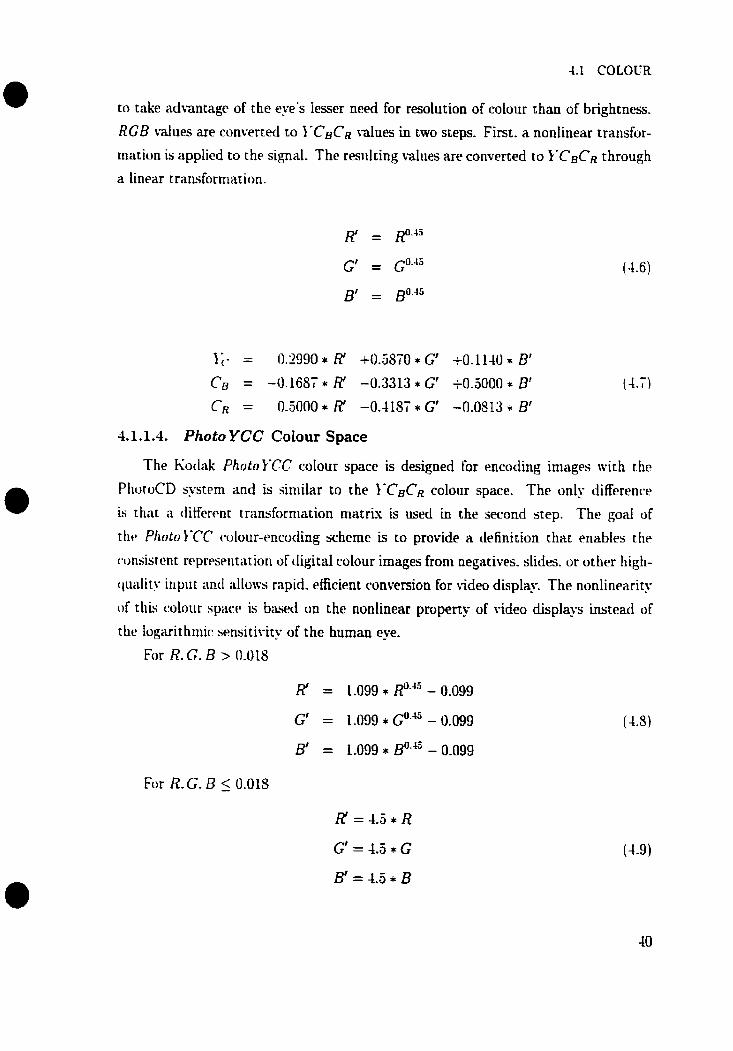
to cake advancage of the eue's Iesser need for resolution of cotour than of brightness.
RGB d u e s are conmrted to IVCBCR d u e s in two steps. First. a nonlinear transfor-
mation is applied co the signal. The resillting values are converted to kWCBCR through
a linear transformation.
1;. = 0.2990 * R' +0.3S70 * G' +0.1140 * Br
Cg = -0.1687 * R' -0.3313tG i-0.$000* B'
CR = 0.3000 * R' -0.41Sï * G' -0.0813 * B'
4.1.1.4. Photo YCC Colour Space
The Kodak Photol-CC colour space is designed for encoding images with the
PhotoCD sustem and is siniilar to the 1-CBCR colour space. The only differenw
is that a ciiiferent trrrnsforniation rnatris is used in the second s e p . The goal of
thtn Pl~otok'CC c-olour-tmmding scheme is to provide a definicion chat enables the
wnsistent r ~ p r ~ s ~ ~ i t a t i o n of cligitai colour images from negatives. slides. or other high-
qiiality inpttt and ;~lIoivs rapid. efficient conversion for ndeo display. The nonlinearity
of tliis wloiir spart* is brisrd lin the nurilinear property of video displays insteatl of
the logarithrnic sensitivity of the human eye.
For R.G. B > O.OIS
For R. G. B < 0.OlS

4.1 .lS. HS V (hue, saturation, and value) Colour Space
Different versions of HSV colour space have been proposed in the literature [122]
;43]. The niost commonly useci HSC' colour space is the cylindrical space where n i~~i t r iun i saturation tloes not depend on the intemitu \ d u e [1141. The probtem
with this space is the high sensitit-ity to noise for v e l dark colours. .-\lternative
colour spaces are gcnerated with different relationships between the intensity and
niri'rimum saturation. such as lineiir 1371 and quadïatic [1441. Despite niociificiitiriiis
to the shapa of this çolour space. dl HSC' coIour spaces mnke no referencr t o the
percrptiori o f light by the hunian vision sytern. The transforniation frritri RCB to
KS\- proposed bu Travis 11221 is given bclow:
\ - - R L- - G let R' = . Gr = and
1' - nlui(R. G. B ) I - - min(R, G. B ) ' 1' - B
B' = 1- - rmnt R.G. B )
.j - B' if R = maz(R. G. B ) and G = min(R. G. B )
I - G' if R = max(R. G. B ) and G f min(R. G. B )
I - R' if G = rnax(R, G. B ) and B = min(R. G. B ) (4-L3)
3 - B' if G = mux(R. G. B) and B # min(R. G. B )
1 3 i G' if B = mar(R. G. B ) and R = min(R. G. B )
4.1.1.6. CIE 1976 L'u'b' and CIE 1976 L * u œ f
Both CIE L'rr'h' and CIE L'u'r;' color spaces arp intended to be uniform colour
spaces. The colour differences in chromaticity and luminance are bath taken into
account in the minimisation process of the variation of perceptual differences of unit
vectors. The nonlinear transformation for L' is designed to mimic the logarithmic

* . response of the human e y . The CIE L'u'c' colour space is based on the CIE 1976
IU'L" while CIE L'n'b' is based directly ou CIE -YYZ. The equation for the parameter
L' is the same for both spaces:
\;,. S,,. and Zn defin~ the appropriately chosen reference white and un and c:, ;ire the
mli i~s obtained €rom the tyuation for l'u'r' using this reference white point.
4.1.1.7. The Muuseil System
The 11unsell systern is one of the most widely used colour order systems. origi-
nated by the artist A.H. Slunsell in 1905. .4n important feature of the hIunsell syçtem
is rhat the coloiirs are arrangd so that. the perceptual difference betmeen any tmo
neighbouring simples is as close to constant as possible. SIiyahara and Eoshida
[77! proposed a transformation. c d e d the hthernat icai Transformation to SIunselI
(SITSI). based on the CIE 1976 L'a'b'. However. this Îs jus an appro-ximation to
the hIiinsell -stem. There does not exist a simple and exact mapping fiom RGB or
SI--Z to the IIunsell coordinate.
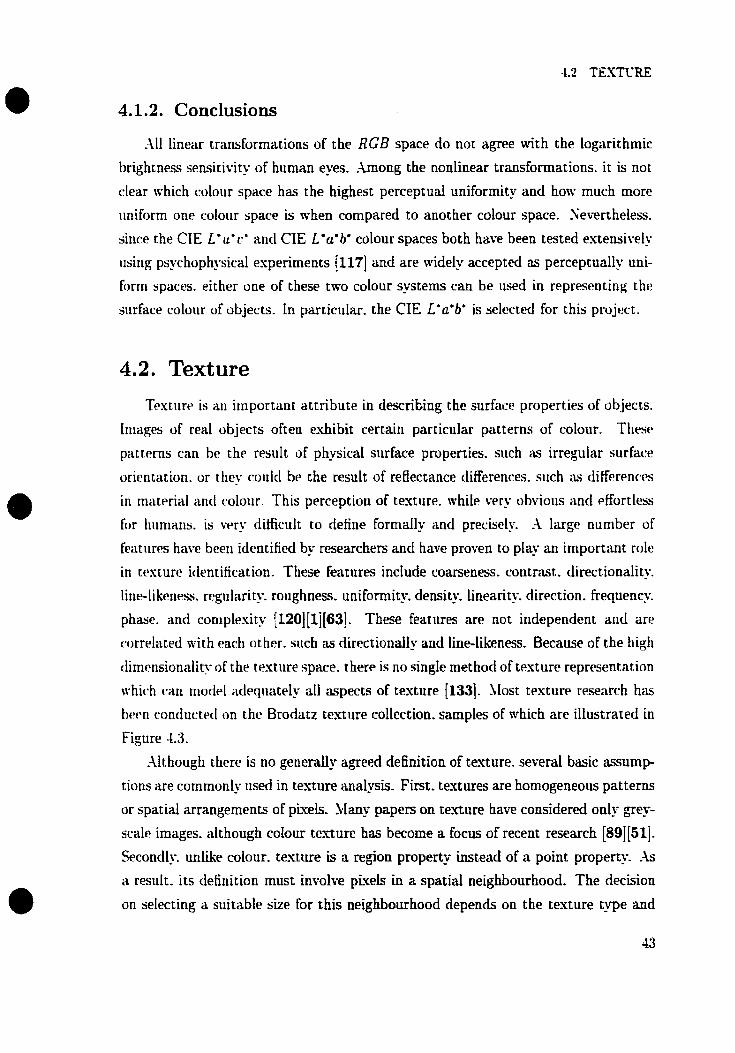
4.1.2. Conclusions
.\il linear transformations of the RGB space do not agree with the logarithmic
brightness sensitivity of hiiman eyes. h o n g the nonlinear transformations. it is not
clear which colour space has the highest perceptual uniformity and hoa much more
iiniform one coloiir space is when compared to another colour space. 3evertheless.
sirice the CIE L"ugr* and CIE L'u'b' colour spaces both have been tested esteusively
using psychophysical esperiments [117] and are widely accepted as perceptually uni-
forrti spaces. either one of these two colour systems can be used in representing the
surface coloiir of objects. In particular. the CIE L'a'b' is selectcd for this project.
4.2. Texture
Texture is an important attribute in descriting the surface properties of objects.
Iniages of real objects ofteu eshibit certain particular patterns of colour. These
patterns can be the resuIt of physical surface properties. such as irregular surface
orientation. or theu coitlcl be the result of reflectance differences. such as differencc~s
i n rtiaterial and colour. This perception of texture. while very obvious and ~ffortless
for humans. is v ~ r y tiifficult to define forrnally and precisely. A large nuniber of
f ~ a t i i r ~ s have beeri identified by researchers and have proven to play an important rnle
in testure identification. These features indude cornenes. contrat. directionality.
lint4ikrness. r ~ g i i l a r i t ~ roiighness. uniformity. density. linearity. direction. frequenc.
phase. and coniplesity [120][1i[631. These featirres are not iridependent ancl arp
mrr~lated with t1ac.h other. such as directionaily and line-likeness. Because of the high
tlimrnsionality of the textiire space. t h e p is no single method of t ~ s t u r e reprcsentation
whi(.h i ï i t; nioclei iitltqiiately al1 aspects of testure [133]. hIost texttir~ r~searrh has
bwn contluctrtl on the Brodatz texture collection, samples of which are illustrated in
Figure 4.3.
Although there is no generally agreed definition of texture. severai basic assump
tions are commonly used in texture anaijsis. First. textures are homogeneous patterns
or spatial arrangements of pixels. Ma- papers on texture have considered only g r e -
scalp images. although colour tesmre has become a focus of recent research [89][51].
Secondl- unlike colour. texture is a region propertt- inçtead of a point propert- =\s
ii result. its definition must involve pi& in a spatid neighbourhood. The decision
on selecting a suitable size for this neighbourhood depends on the texture type and
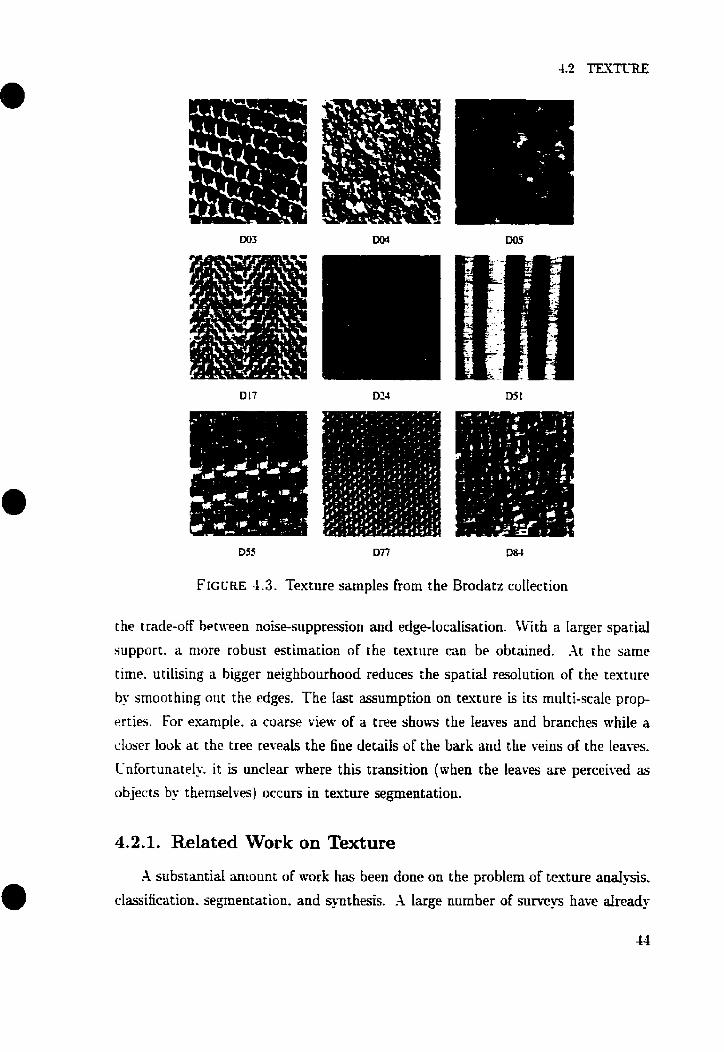
FIGURE 4 -3. Texture samples €rom the Brodatz collection
the [rade-off b~tween noise-suppression and edge-IocaIisation. LVitb a Iarger spatial
support. a niore robust estimation of the testure can be obtained. At the same
tirne. utilising a bigger neighbourhood reduces the spatial resolution of the texture
by smoothing oiic the ~dges. The 1 s t assumption on texture is its multi-scalc p r o p
erties. For example. a coarse tiew of a tree shows the leaves and branches while a
'Ioser look at the tree rewals the fine detaiis of the bark and the veins of the Ieaws.
Cnfortunatel. it k unclear mhere thii transition (when the leaves are perceiveci as
objects by themselves) occurs in texture segmentatiou-
4.2.1. Related Work on Texture
-4 substmtiai amount of work ha. been done on the problem of texture analpis.
classification. segmentation. and q-nthesis. -1 large nwnber of suri-eys have already
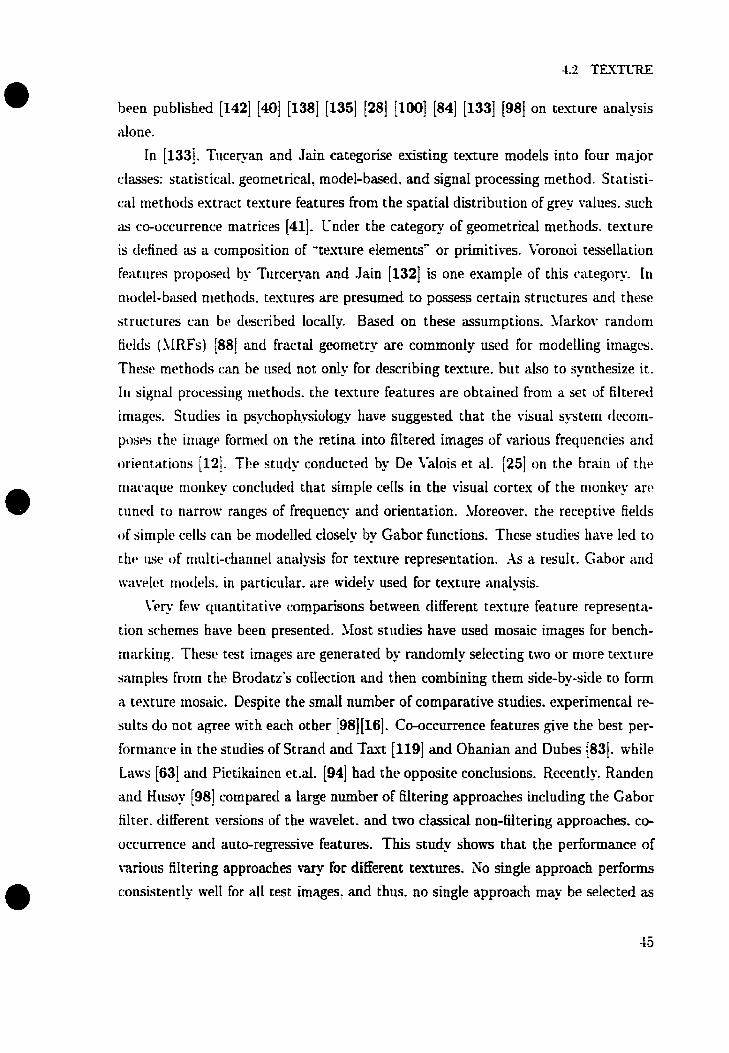
b ~ e n published [1421 [40] [138] (1351 1281 [100] [84] (1331 [98] on texture analysis
alone.
In [133]. Tucepan and Jain categorise existing texture models into four major
classes: statistical. geometrical. model-based, and signal processing met hod. Statisti-
cal methods extract texture features from the spatial distribution of grey values. such
as co-occurrence matrices [41]. rnder the category of geometrical methods. texture
is defined as a composition of Texture elements" or primitives. Voronoi tessellation
features proposed bu Turceryan and Jain [132] is one example of this category. [n
riiotlel-basecl niethocis. testiires a e presumed to possess certain structures and these
structures cati be rlescribed IocdIy. Based on these assumptions. SIarkov random
fields ( JIRFs) (881 and fractal geornetp are commonly used for rnodelling images.
These methods can be used not only for describing texture. but also to syrithesize it.
In signal processing methods. the testure fmtures are obtained from a set of filter~rl
images. Studies in psychophysiology have suggested that the visual systern rlccorii-
poses thtx iriiag~ forniecl on the retina into filtered images of various freqi~enries artcl
orientiitioris [12]. The stuciy conducted by De iTalois et al. 1251 on the brsiri of the
triaratlue rriorikey coriclutled that simple ceIIs in the visual cortex of the nionkcy arc
tiinerl to narrow ranges of frequencv and orientation. Moreover. the reccptiw fields
of simple cells can be niodelled closeiy by Gabor functions. Thcse studies have led to
the use of rnulti-channel anaiysis for texture representation. -4s a result. Gabor and
wavelct niotlels. in particuhr. are wideIy used for texture analysis.
\éry few qiiantitatiw cornpiirisons between different texture feature representii-
tion schemes have been presented- Most stiidies have used mosaic images for bench-
rnarking. These test images are generated by randomly selecting two or more testitre
samples from the Brodatz's cotlection and then combining them side-by-side CO f ~ r m
a texture rnosaic. Despite the srnd number of comparative studies. experimentai re-
stilts do not agree with each other [98][16]. Co-occurrence features give the best per-
forrilance in the studies of Strand and Tavt 11191 and Ohanim and Dubes [83]. mhile
L a w [63] and Pietikainen et.& [94] had the opposite conciusions. Recently. Randen
and Hitioy [981 comparecl a large nurnber O€ ûitering approaches including the Gabor
filter. different versions of the m l e t . and two classical non-filtering approaches. co-
occurrence and auto-regressive features. This study shows that the performance of
various filtering approaches t q for different textures. Yo single approach performs
consistently nie11 for al1 test images. and thus. no single approach may be selected as
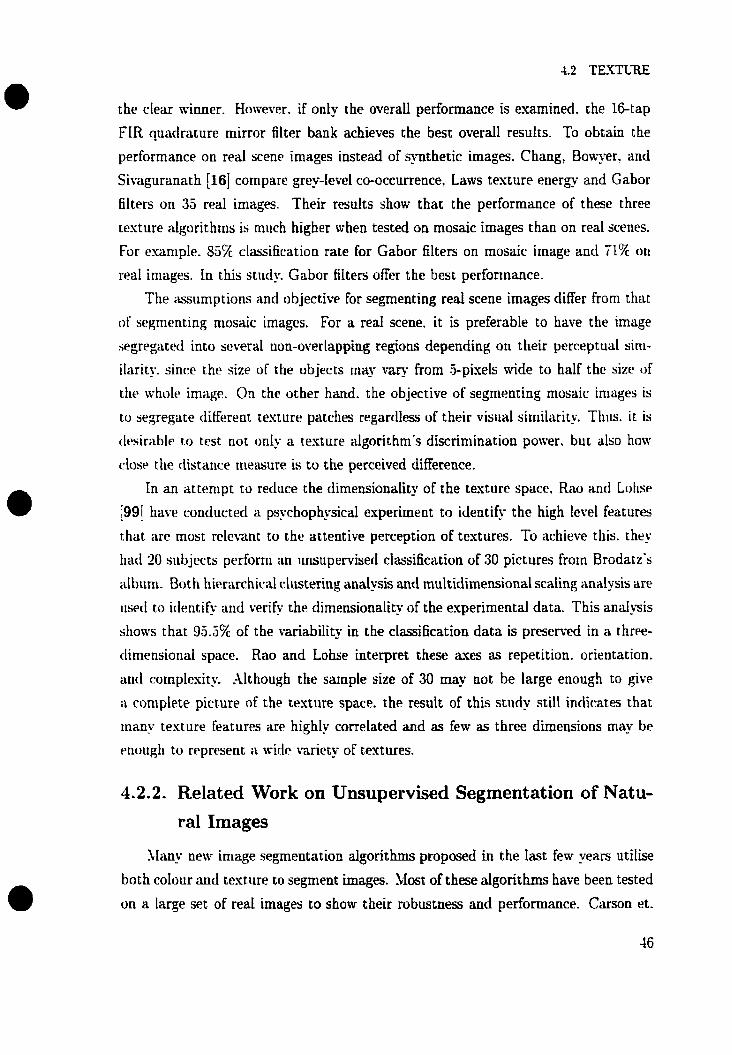
the clear mimer. However. if on- the overail performance is examined. the 16-tap
FIR quadrature mirror filter bank achieves the best overall results. To obtain the
performance on r d scene images instead of exthetic images. Chang, Bowyer. and
Sivaguranath [16] compare gre-Ievel co-occurrence, Laws texture energy and Gabor
filters on 35 real images. Their results show chat the performance of these three
testure algorithms is much higher rvhen tested on mosaic images than on real scenes.
For esaniple. 85% classification rate for Gabor filten on mosaic image and 71% on
real images. In this stiidy, Gabor fitters offer the best performance.
The 2tssiimptions and objective for segrnenting real scene images differ from that
of segmenting mosaic images. For a real scene. it is preferable to have the image
segregated into several uon-overlapping regions depending on their perceptual sini-
ilarity. since the size of the objects may va- from 5-pixels wide to half the sizc of
t t i ~ rvholt* image. On the other hünd. the objective of segmenting mosaic images is
to segregate clifferent testure patches regarcllclss of their visilal siniilarity. Thiis. it is
tifsirable to test not only a texture algorithm's discriniination power. but iilso how
r.losr the distatice meaurc is to the perceived difference.
In an attenipt to reduce the dimensionality of the texture space, Ri10 ancf Lohse
[99] have conductecl a psyhophysicai experiment to identify the high level featurts
that ilïe most relevant to the attentive perception of textures. To achieve this. the?
tiad 20 siibjects pcrforni an unsupervised classification of 30 pictures from Brodacz's
albuni. Both hierarchicd clustering analysis and rnultidimensional scaIing analysis are
iised to icientiF; and verify the dimensionality of the experimental data. This andysis
shows that 95.5% of the ~ariability in the classification data is preserved in a thr~e-
tlimensional space. Rao and Lotise interpret these axes as repetition. orientation.
and complesity. Although the sample size of 30 may not be large enough to giw
a romplete picture of the texture space. the result of this study still indicates that
rnany testure features arp highly correlated and as few as three dimensions may be
erioiigti to rpprrlsent a n- id^ variety of textures.
4.2.2. Related Work on Unsupervised Segmentation of Nat u- ral Images
LImy new image segmentation aigorithrns proposed in the last few y a r s utilise
both colour and texture to segment images. Most of these algorithms have been tested
on a large set of reai images to show their robustness and performance. Carson et.
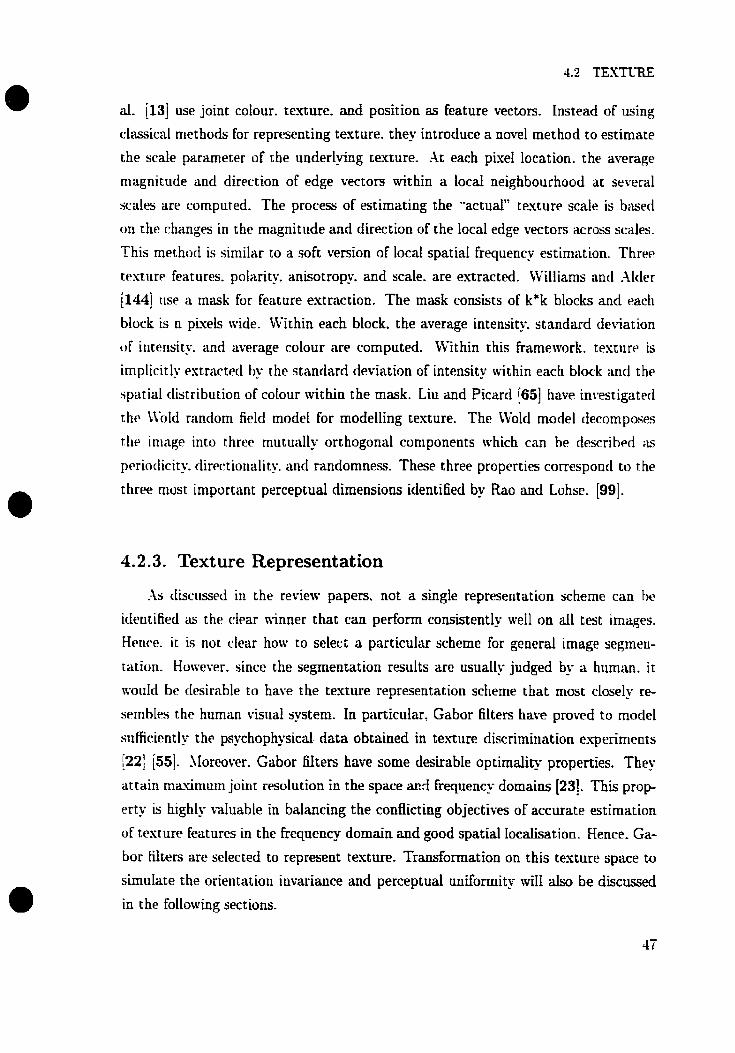
al. [13] use joint colour. texture. and position as feature vectom Instead of using
classical methods for representing texture. they introduce a n o d method to estirnate
the scaie parameter of the underlying texture. At each pi'rel location. the average
niagnitutle and direction of edge vectors within a local neighbourhood at several
scales are çomputed. The process of estimating the ..actua17' texture scale is based
on the changes in the magnitude and direction of the local edge vectors across scales.
This rnethod is similar to a soft version of local spatial frequency estimation. Thrre
texture features. polarity. anisotropy. and scale. are extracted. bïlliams and .Ilder
11441 rise a rnask for feature extraction. The mask consists of k*k blocks and rach
block is n pixels wide. LVithin each block. the average intensity, standard deviation
of intensity. and average colour are computed. Within this frameivork. texture is
implicitly estracted hy the standard deviation of intensity within each block and the
spatial distribution of colour within the rnask. Liu and Picard [65] have investigated
ihc \hic1 random field mode1 for modelling texture. The Wold mode1 decornposes
the image into three niutually orthogonal components which can be described as
p~rioclicity. directioriality. and randomness. These three propenies corresponcl to the
three most iniportant perceptuai dimensions identified by Rao and Lohse. [99].
4.2.3. Texture Representation
-4s C ~ ~ S Ç ~ S S C C I in the review papers. not a singie representacion scheme can bc idetitified as the rlear ninner that can perform consistently weil on al1 test images.
Herire. it is not clear how to select a particular scheme for general image segrneu-
cation. However. since the segmentation resirlts are usually judged b - a human. it
n-oirld be riesirable to have the texture representation scheme that most ctosely re-
smibles t he hurnan visiial systeni. In particuIar. Gabor filters have proved to mode1
siiffkiently the psychopht.sica1 data obtained in texture discrimination experinients
1221 i55I. Sloreover. Gabor filters have some desirable optimaiity properties. They
attziin rmximurn joint resdution in the space acd frequency domains [23]. This prop
erty ïs highly valuable in balancing the conflicting objectives of accurate estimation
of texture fritures in the frequenq domain and good spatial Iocalisation. Hence. Ga-
bor Lilters are selected to represent texture- Transformation on this temure space to
simulate the orientation inmiance and perceptual uniformity d l also be discussed
in the following sections.
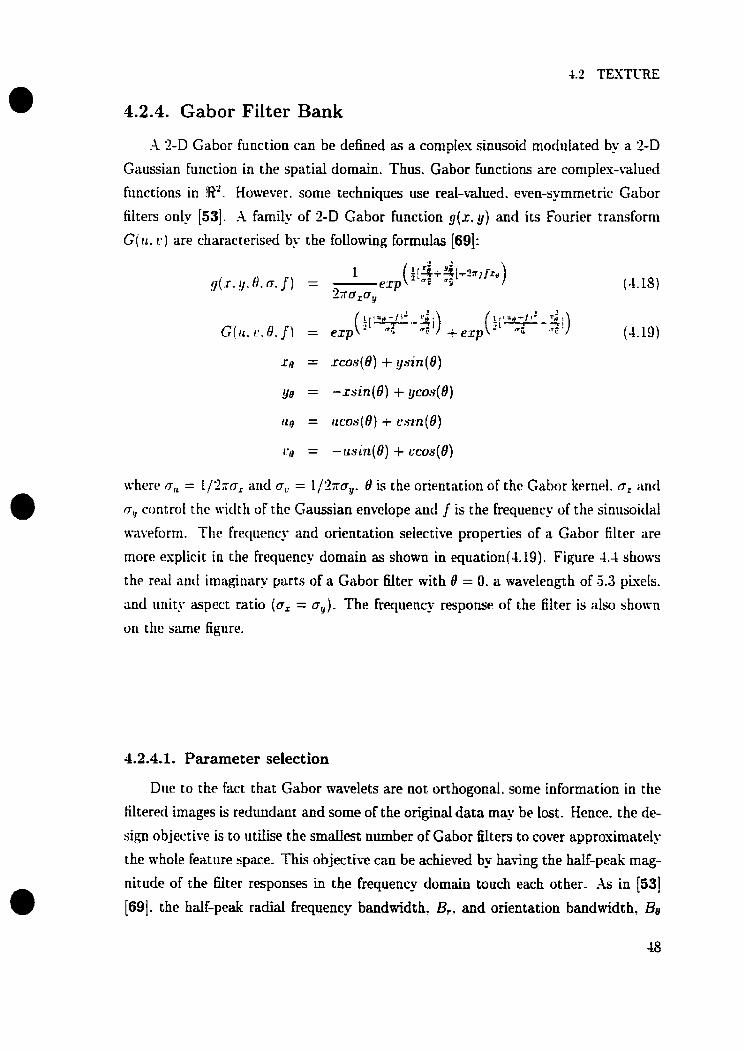
4.2.4. Gabor Filter Bank
A '2-D Gabor function can be defined as a cornplex sinusoid modulated by a 2-D
Gaussian function in the spatial domain. Thus. Gabor functions are coniplex-valueri
functions in 8'. However. some techniques use real-c-alued. even-symmetric Gabor
filters only [53]. -4 fa mil^. of 2-D Gabor function g(x . y) and its Fourier transforrn
G(u. L ' ) are characcerised by the foiiowiag formulas [691:
ivhert* cr,, = !/'27(~, i11~d u , = 1/2ïïag. 0 is the orientation of thc Gabor kernel. cr, and
cr, control the wirlth clf the Gaussian envclope and j is the frequency of the sin~isoidül
naveforni. The frreqirency and orientation setective properties of a Gabor filter are
more esplicit in the freqiiency dornain as shown in equatiori(4.19). Figure 4.4 shows
the real and iniaginary parts of a Gabor filter with 8 = O. a wavelength of 5.3 pixels.
and ii~iity aspect ratio (O, = O,). The frequency response of the filter is also s h o m
uri the sanie figure.
4.2.4.1. Parameter selection
Dtie to the fact that Gabor wavelets are not orthogonal. some information in the
filtered images is redundant and some of the origind data may be Lost. Hence. the de-
sign objective is to utilise the smaiiest number of Gabor füters to cover approximately
the mhole feature space- This objective can be achieved b - hat-ing the half-peak mag-
nitude of the filter responses in the frequency dornain touch each other. -4s in [53]
[69]. the half-peak radial frequency bandwidth. Br, and orientation bandwidth, Be
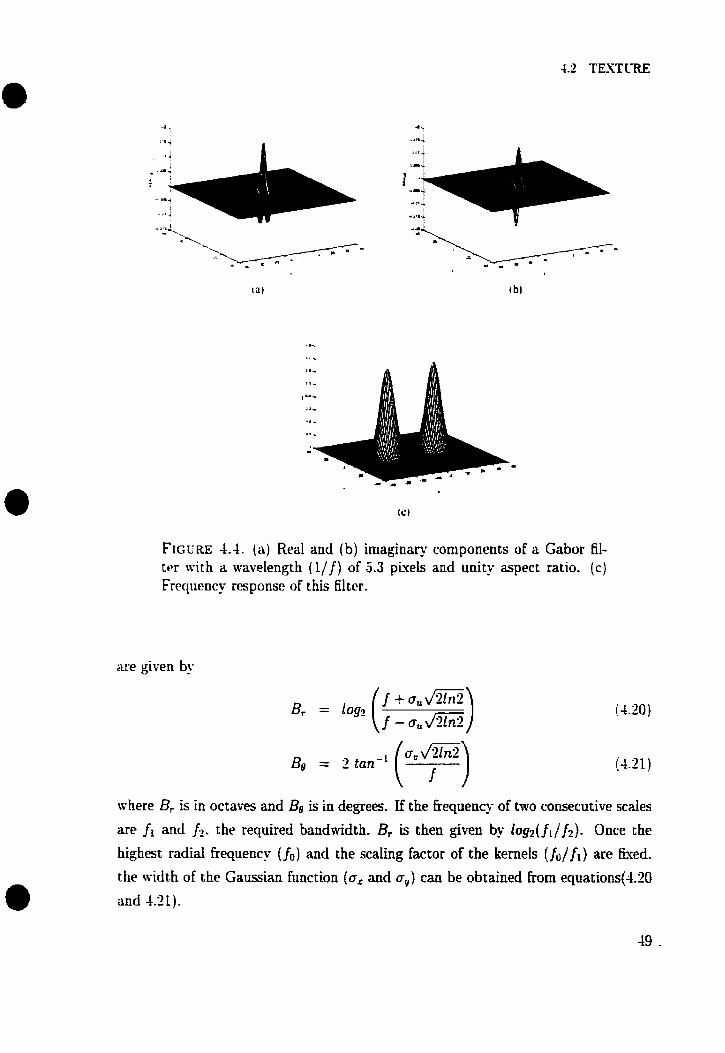
FIGURE 4.4. (a) Real and (b) imaginary components of a Gabor 61- trr with a mvelength (11 f) of 5.3 pixels and unity aspect ratio. (c) Frcqiiency response of this filter.
are given by
where Br is in octaves and Bo is in degrees. If the Frequency of two consecutive scales
are f I and t2. the required bandwidth. Br is then given by log2( fL/ f2). Once the
highest radial frequency ( fo) and the scaling factor of the kernels (fù/f i ) are fiued.
the width of the Gaussian fiinction (0, and a,) can be obtained From equationsf4.20
and 4.21).

FIGURE 4.5. wit h :3 scales
The and
frequency response of a dyadic bank of 1 orientations.
\Vheri ittipIcmenting ir Gabor BIter bank. it is necessa- to çhoose the niimber of
walt~s (tv:iv~lengths) anci orientations. This determines the total number of channels
in the filter bank. Randen and Husoy [98] found that the performance of texture
rlassification increascs with the number of featureç. The ov~raII b s t texture featim
repr~sentation in t heir stiidy also has the highest feature dimensionality of 40. On t h t a
r-rintrary. Smith [Il31 rliscm-~red that the algorithm with -3 scales and 4 orientations
gaw the hpst overall accuracy on 10 texture classiiîcation probkms. He founcl that
utiiising a higher number of scales and orientations could have negatiw eefects on
performance. He called this observation the peaking phenornenoa. The freqitency
rrsponse of the bank of 12 Gabor fdters at 3 scales and 4 orientations is shown in
Figure 4.5. This filter bmk çovers most of the frequency plane except for the low
t'requen- range at the centre. For natural images. tom frequency filters n i I I pict up
the structure of objects rather than the objects' texture. Hence. it is preferabte to
excIude the estremely low frequency filters.
One of the major issues in lirter design reiates to the eficiency of filter impiemen-
catiou. In the general form of the Gabor function, it is not a separable filter. This
rnerins a single convolution of a Gabor function and an image. with a size of K x K and 'i x S respectiveiy. requîres -VA"- multiplications and additions. One way to
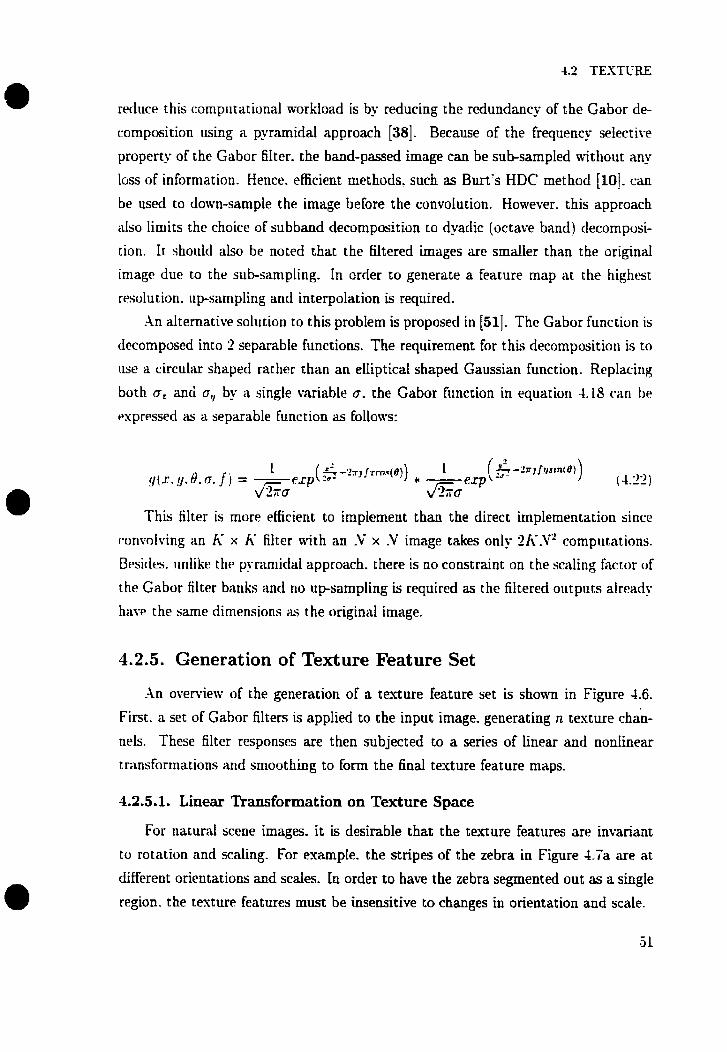
reduce this cornpurational workioad is by reducing the redundancy of the Gabor cle-
composition using a pyramidal approach [38]. Because of the frequency selective
property of the Gabor filter. the band-passed image can be subsampled without any
loss of information. Hence. efficient methods. such as Burt's HDC method [IO]. can
be used to dom-sample the image before the convolution. However. this approach
also liniits the choice of subband deconiposition to d-dic (octave band) decomposi-
tion. Ir shoultl also be noted chat the Liltered images are smailer than the original
image due to the sub-sarnpling. In order to generate a feature rnap ac the highest
resolution. iipsampling ancl interpolation is required.
An alternative soliition to this problem is proposed in [51]. The Gabor function is
tlecomposed into 2 separable fiinctions. The requirernent for this decornposition is to
use a circuliir shaped racher than an eliiptical shaped Gaussiaii function. Replaciiig
both 6, and O,, bu a single variable a. the Gabor function in equatiori 4-18 vilri hr
rxpr~sseti as a separable function as fo1lon.ç:
This filter is more etfivient to impiement than the direct implernentation sincc
c~onvolvirig an K x K filter with an .V x .V image takes only 2h-.V2 computations.
Bf-sitles. iinlike the pyarnidal approach. there is no constraint on the scaling factor of
the Gabor filter banks ancl no upsampling is required as the Filtered outputs already
have the sarne dimensions as the ciriginai image.
4.2.5. Generation of Texture Feature Set
An ovenien- of the generation of a texture feature set is s h o m in Figure 4.6.
First. a set of Gabor filters is appiied to the input image. generating n texture chan-
nels. These filter responses are then subjected to a series of linear and nonlinear
transforruations and smoothing to forrn the 6nal texture feature maps.
4.2.5.1. Linear Transformation on Texture Space
For natural scene images. it is desirable chat the texture features are invariam
to rotation and scaling. For example. the sttipes of the zebra in Figure 4,Ïa are at
different orientations and scaies. In order to have the zebra segmenteci out as a single
region. the texture features must be insensitive to changes in orientation and scale.

-
LTI LPF
FIGCRE 4.6. Block diagram of the generation of texture features. T ~ P filter barik (FB) generates -V texture channels. The first linear transfor- mation (LT1) approsimates the orientation-invariance transformation. resulting in fi channels where K 5 .V. The nest nonlinear transforma- cion (NTl) and low-pass filter (LPF) produce a local energl- estimation of the filter output. The second nonlinear transformation (ST2) is included to compensate for the effect of ?;Tl and the final linear trans- formation (Lm) improves the perceptual uniformit? of the testiire space.
One \va? to rmove the orientation selectivity of the Gabor filters is by sumniing
the filter rcsponses of tlifferent orientations at each scale [114]. The resdting filttlr
arts I i k ~ a band-pascd filter which can be modelled by Difference-of-Gaussian (DOG)
tilr~rs. The magnitude of the Gabor outputs of the zebra image are s h o w in Fig-
ure 4.7. This test image esplicitly shows the discriminative power of the Gabor filrers
on scalc and orientation. The horizontal stripes are completely separated f o m the
vertical and diagonal ones. Honever. the testure features of the zebra's Lori? forni
S P Y P C ~ tvell-s~parat~d (-Iusters. From the rombiried channels. ( f ) and ( k ) . the s h a p ~ of
th^ zehra ht.comes more prominent and complete. [t should be stated that combining
channels of clifferent orientations miIl lower the discrimination pomr since classifica-
tion betwetlri ttvo trsttire regions can no longer be based on the distribution of e n e r c
across different orientations. That means two textures are not distinguishable if their
total amount of energ-- nithin each frequency channels is the same. regardIess of
t heir tfirectionality (eg. tnono-direction or bidirections). Fortunatel- this situation
seldom happens in naturai scenes.
4.2.5.2. Local Energy Measure
[t is a common practice to use the locd energies as the texture features. rather
than directly ixsing the output of the filters. This approach is understandabLe since
the filter otitput of a sinusoidal signal d l stiii be a sinusoid, see Figure 4.7. (b)-(f)
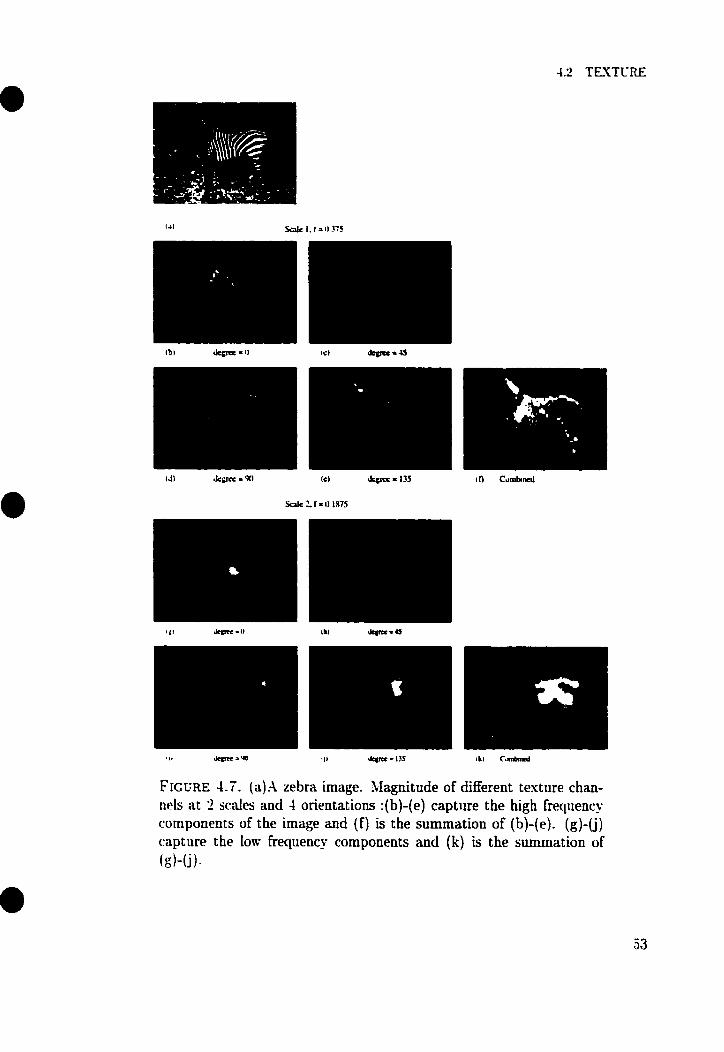
F~GURE 4.7. (a)=\ zebra image. Magnitude of different texture chan- ncls at 2 scales and 4 orientations :(b)-(e) capture the high frequency components of the image and ( f ) is the summation of (b)-(e). (g)-(j) capture the Iow frequency components and (k) is the summation of (d-(j).

in particiilar. Henw. a local energ't function. such as a Gaussian, rectangular. or
circular function. is iised to estimate the energy in a small local region, Jlrnong these
functions. the Gaussian kernel clearly outperforms the other cwo functions because of
its smooth transition frorn the centre to the boundary without iuiy discontinuities. f o
achieve high edge localisation. a small neighbourhood is preferred. On the other hand.
to achieve accurate energy estimation. a large local neighboruhood is required. -1s a
compromise. the size of the filter will be set to a function of the radiai frequency of
the Gabor filter. -1 Gaussian smoothing function. a, = l/(?&f) is used by Randen
ancl Husoy [98] and a, = 0.51 f is suggested by Jain and Fanokhnai [53!.
III order to increase the feature distance behveen difFerent testures while reducing
the variance wit hin each texture region. a nonlinear function is cornmonly applied
b r i o r ~ the smoothing. Commonly used nonlinearities are magnitude 1x1. squaring
(1)'. i~nd rectified sigrnoid Itanh(a - r)l. To provide a feature value that is in the
sarrie units as the input signal. a second nonlinear function is applied. This function
is an inverse of the first nonlinear function to counterbaIance its effect. Differ~nr
rharnrteristics of these noniineariries can be obtained by testjag thern on a test signai.
Because of the band-lirniced property of Gabor filters. the filter output will contain
a seL of sinusoidal signals within the frequency bandwidth of the filter. The strength
of these signals are iisually not the same depending on their central frequencies and
aniplitudes. Hence. a test signai is created to simulate three different t e s tu rd regions.
for siniplicity These regions are two sine maves which differ in magnitude and ri
iwrt3spurise region. Salt and pepper noise is added to the signal to sirnulate the
randornness and rincertainty in real images. This test signal and the resulting local
rnergies are shown in Figure 4.8. The saturation parameter. a. of the sigmoid function
is 5t.t to 0.25 as suggested by dain and Farrokhnia 1531. -4 larger d u e for this
parmieter will cause the signal to satiirate more rapidly. causing the sine wave to
berorne more similar to a square w e . From Figure 4.8b. comparing the fluctuations
in the second region and the differences between the mean energy of the three regions.
KP can see that the sigrnoid function produces the smaiiest intra-texture t-ariation
while squaring achieves the highest inter-texture separation. From experimentation.
ive have found that it is more important to have a larger interillas distance than
a lower intra-ciass variance. As a result. squaring di be used in the subsequent
esperiments.
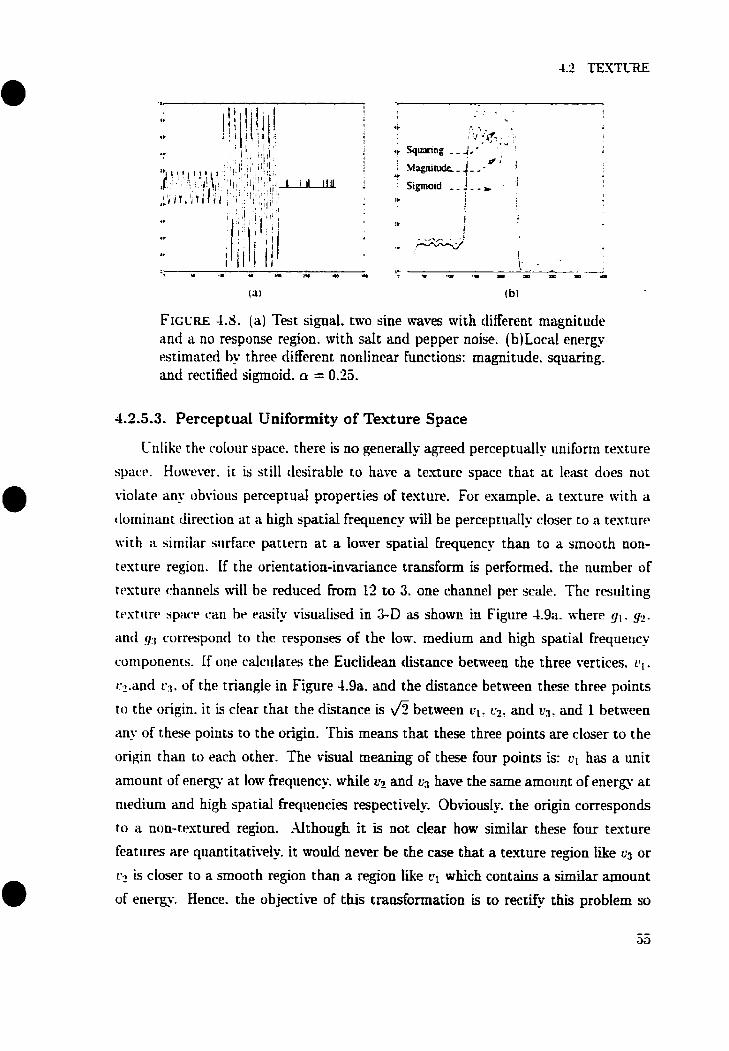
FIGCRE 4.8. (a) Test signal. two sine wvaves with different magnitude and a no response region. with sait and pepper noise. (b)Local energy tstimated hy three different nonlinear functions: magnitude. squaring. and rectified sigrnoid. a = 0.25.
4.2.5.3. Perceptual Uniformity of Texture Space
Cnlike the colour space. there is no generally agreed perceptually uniforrn testure
spacp. Howxcr. it is still desirable to have a tezure spacc that at least does not
violate an- obvioiis perceptud properties of texture. For example. a testure wvith a
clorriiriant direction at a high spatial frequency d l be perceptually doser to a testure
tvith a similar surface pattern a t a lower spatial frequency than to a smooth non-
texture region. If the orientation-invariance transform is performed. the nuniber of
tpsture rhannels wvill be reduced from 23 to 3. one charnel per scale. The rtlliulting
trstiirtl qxiw ~ ' i t ~ i t)r twsily visua-elised in 3-D as s h o w in Figure 4.9a. where y,. y.?.
mti g:i correspond to thc responses of the low. medium and high spatial frequency
coniponents. If one calculates the Euclidean distance between the three vertices. c l .
r2 .and r3 , of the triangle in Figure 4.9a. and the distance between t hese t hree points
ti, the origin. it is clpar that the distance is fi between cl. c?. and UJ. and 1 hetween
an! of these points to the origin. This means chat these three points are closer to the
origin than to each other. The 1-isua1 rneaning of these four points is: UI has a unit
arnoiint of energ'. at low hequency. mhile L? and (;3 have the same amount of energy a t
niedium and high spatial frequencies respectivei. Obviously. the origin corresponds
to a non-testured region. Aithough it is not cIear how similar these four texture
features are quantitati~e-ely. it muid never be the case that a texture region like q or
i- is cioser to a smooth region than a region iike al which contains a similar amount
of energy. Hence. the objecti~e of t b transformation is to rectifj this problem so
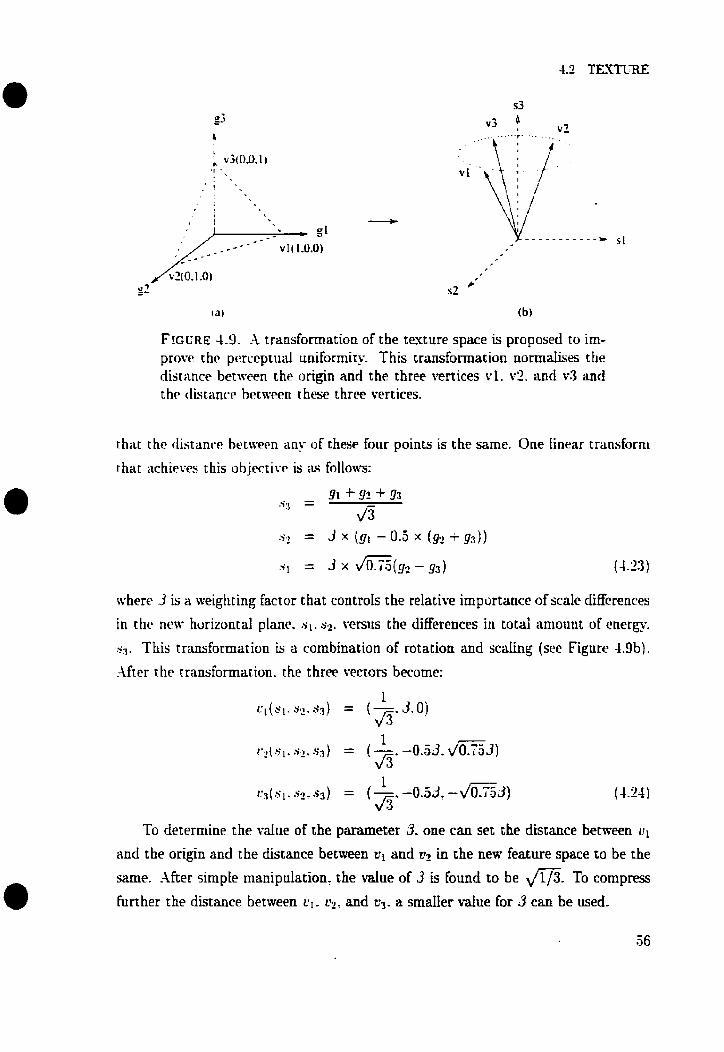
FICL'RE 4.9. -1 transforrnatioa of the texture space is proposed to im- prove the perceptual uniforrnity. This transformatiûn normalises the disriince betwen the origin and the three vertices vl. t.2. and v3 and t hr distanc-r h~ t ~ v ~ ~ n t hese t hree vertices.
that the distance hetwem a- of these four points is the same. One Iinear transforni
chat iichieves this objtctivc is ;LS folloivs:
tvhcre 3 k a weighting factor that controls the relative importance of scale differences
in the new horizontal plane. si. sz. versus the differences in totai amount of energy.
sa. This transformation is a combination of rotation and scaling (sec Figure 4.9b).
After the transformation. the three t-ectors become:
To deterniine the of the parameter 3. one can set the distance berneen uy
and the ongin and the distance betmeen cl and zt2 in the new feature space to be the
same. hfter simple manipulation. the d u e of 3 is lound to be To cornpress
Further the distance betiveen t.1. Q, and q. a smaiier d u e for 3 c m be used.
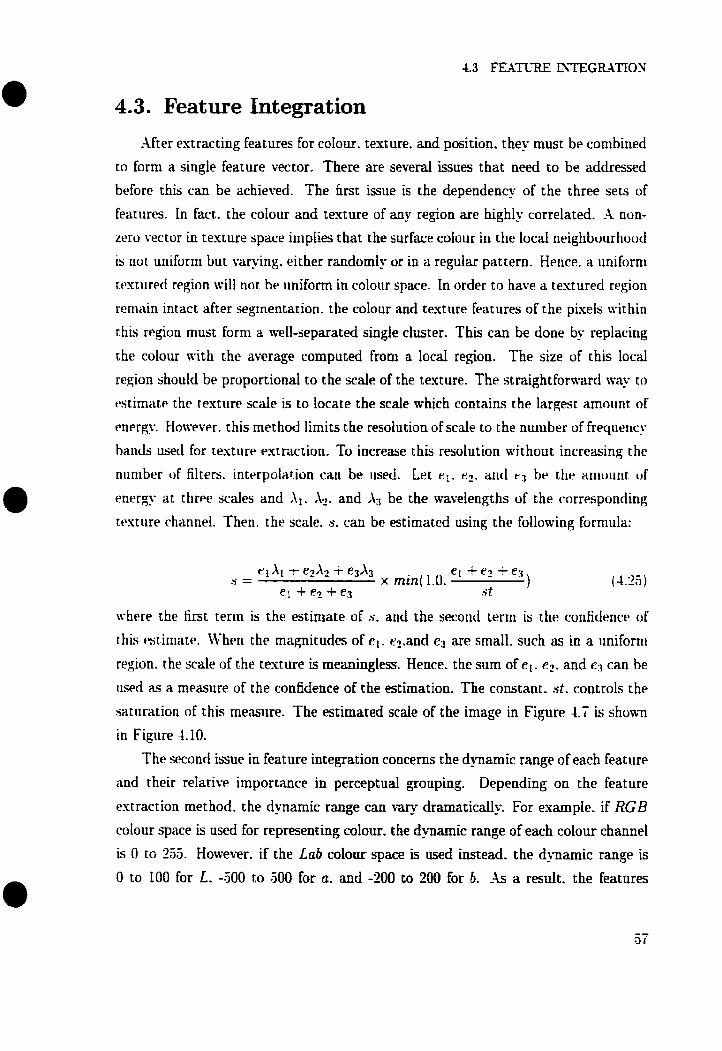
4.3. Feat ure Int egrat ion
Aiter extracting features for coIour. texture. and position. they must be combined
to f o m a single friture vector. There are several issues that need to be addressed
before this can be achieved. The hrst issue is the dependency of the three sets of
features. tn fact. the colour and cexture of any region are highly correlated. -1 non-
rero vtytor in texture space implies that the surface colour in the local neighbourhood
is not uniforni but varying. either randomly or in a regular pattern. Hence. a iiniforni
testiiretl region will tiot be uniform in colour space. In order to have a textureci region
rernain intact after segmentation. the colour and texture features of the pixels within
this region must forni a well-separated single cluster. This can be done by replacing
the colour mith the average computed from a Iocal region. The size of this local
region should be proportionai to the scdc! of the texture. The straightfortvard way to
tlstimate the restiire scde is to !ocate the scale which contains the largest amoiint of
energy. Hoivever. this rnethod Iimits the resoiution of scaie to the number of freqiiericy
bands used for texture extraction. To increase this resolution without increasing the
niiriiber uf filters. intrrpola&m cari be us&. Let el . ez. and cx be the arriuiirit of
energ'- at t h r ~ e scales and XI. A?. and X3 be the wavelengths of the corresponding
ttwiire channel. Then. the scale. S. can be estirnated using the following formula:
tvh~re the first term is the estimate of S. and the second term is the confidencr of
rhis ~srirriate. CVhtw the magnitudes of et. e2.and e3 are srnall. such as in a irniform
region. the scale of the testure is meaningless. Hence. the sum of e 1. e?. and e3 can be
iised as a rneasiire of the confidence of the estimation. The constant. s t . concrols the
satirration of this merisure. The estimated scale of the image in Figure 4.7 is shown
in Figure 4.10.
The second issue in featiire incegration concem the dynamic range ofeach feature
and their relative importance in perceptual grouping. Depending on the feature
estraction method. the d>namic range can tan; dramaticaiiy. For example. if RGB colour space is used for representing colour. the dynamic range of each colour channel
is O to 235. However. if the Lab colour space is used instead. the d y a m i c range is
O to 100 for L. 4 0 0 to 500 for a. and -200 to 200 for 6. -4,s a result. the features
FIGURE 4.10. Estimated texture scaIe of the image in Brighter regions indicate larg~r scales.
r:irist hc nornidised so that differtlnt featurcs (coIour, texture. and
figure 4.7.
position) al1 have
rht. same varinnrr and rm h~ tronipard directly It would also b~ desirabk to scril~
t h r cfynaniic range of each fraturt. so that the perceived diffwence of tivo regions
rvhirh differ t~ one unit in a- dimension of feature space would be the same. Hencc.
~i1r.h fcatiir~ is scal~d bu a weighting Factor. which represents both normalisation
and scaling. More clic integration. Since no perceptual theov exists regarding hon
to splm these parameters. these weights nlII be deterrnined empirically. The fina1
ftutiirr wctor is hmed as follot;:
where IL-,.. lri. ancl IL-, are the meights for colour. texture. and position. respectivelu.
iinrt (cl. (.:>. Q). ( t l . t 2 . ... t k ) . and (pl. p?) are the coordinates of colour. texture and
position respectively.
CHAPTER 5
Image Segmentation
Segnientatioii is i i proces of partitioning a digital image into disjoint connecteci sets
o f pisels. i w h of which c:orresponds to an object or region in the spatial domain. The
division of an rrnagc into regions is baseil on criteria such as similarit? and proximit.
such that each region is homogeneow and no union of any two regions is hoinop~rioous
rvith rttspecL tu the sanie criteria. Image segmentation is a very critical coniponent of
iin image processing system because m o r s at this stage infiuence feature extractioii.
cl;issific;~t ion. and intcrpretacion. Therefore. image segmentation has lotig been an
ac-tiw restsarçh topic in image processing since the eu ly 10's [91. Despite a L-3st
aniounc of researrh. the performance of even the most state-of-the-an techniques are
sri11 l e s chan satisfactory and cannoc be regarded as general purpose. In this chapter.
a brief r e v i ~ w (3f ~s i s t i ng techniques on image segmentation is given. Issues concerning
rhe irnplementation of the s~lected segmentation method wi11 also be discussed.
5.1. Review of Image Segmentation Techniques
[n general. image segmentation techniques cm be classified into four major classes:
i.Iustering-based. etige-based. region-based. and hybrid methods. Clustering-based
rnethorls refer to groupings that are done in measurement or feature space. white
rdge-based and region-based methods refer to groupings that are done in the spatial
tfoniain of the image. The main ciifference betmeen an edge-based and a region-
based method Les in the different segmentation criteria. in a edge-based method.
the segmentation process is based on spatial discontuiuity. On the other hand. in a
region-based method. it is based on spatial similarity among pixels. Hence. region-
based methods are the 1ogicaI dual to the edge-based methods. The last catego-
hybrid methods. are combinations of one or more of the 6rçt three methods which
take advantage of their strengths and minimise their weaknesses.
5.1.1. Clustering-based Met hods
Clustering is a type of classification imposed on a finite set of objects or datiim
points. Each o b j w is çlassified to one of the cluster labels depending on its relation-
ship to other objects. This relationship can be represented by a proximity niatrk
or distances between objects in a d-dimensional space. A brief review of approaches
that have been applied to image segmentation is given below. For more detailed
tlesçriptions. readers are referrt.cl to [52].
This "claïsical" method is probabIy the best-known and most niclely-~isrcl for
(.lustering data. If the clusters are weI1 separaced. il mininium-distance classifier cari
be usetl to separate them. In this method. the means of k clusters are estimatecl by
a r~cursive labelling and updating procedure. First. an initial guess of the riurnb~r
of clusters and their means must be provideci as input to the classifier. One popiilar
rriethod for ohtaining the means of the k clusters is by randomiy selecting k sarnpies
Irnni thc data set as an initial guess. Next. a minimum distance classifier is used
tu dassify the ot)jtws mto ilne of the k clusters. After the labelling. the rneans c d
the cliisters arc- replaced by the centroùis of the new resiilting cliisters. This proccss
is r~peatecl iintil no changes are made to any object in a given cycle. The rnethod
is very siniple and works well for large and well-separated data sets. Cnfortunately-
this niethoci also has a number of disadvantages. First. the nurnber of clusterç mrtsc
be knon-n in acltmce. which itself is a very difficult problem. This algorithm may
i i 1 ~ 0 not converge to the reaI cluster centre if the clusters are unbalanced or elongated
c-lusters are involved and the result produced depends on the initial d u e s of the
means. Recently. modifications to this method have been proposed to improve its
robiistness and efficimcy. such as fuzzy k-means and sequential k-means [931.
5.1.1.2. Density Estimation
Another popular approach to clustering is to estimate the underlilng dens i l of
the rlatum points and to allocate each point to one of the identiiied populations. If the

forrn and number of underlying population densities c m be determined in advance.
pararnetric density estimation met ho& c m be used. Ot hemise. non-parametric den-
sity estimation methods should be used instead.
One conirnonly used density mode1 for parametric density estimation methods is
the Gaussian density îunction and the underlying densities are açsurned to be a rnk-
tiirt3 of y Gaussian densities [lS]. If this assumption holds. and a rough estimation of
the number of clusters or classes is available. then the parameters of the population
ciensities cari be estirnated from the data by maximising the likelihoocl of the pa-
ranieters. A nimber of techniques. such as the E'cpectation-hlxcirnisation algorithrri.
can be iised to obtain the optimum soIution. The major rlrawback of this methoti is
the iissuniptioti about population densities which limits its application. For natur;il
wries. this Gaussian i ~ u r n p t i o n does not seem to hold for niost situations.
CC'ithorit any assiirnptions about the distribution of daturn points. non-paramecric
nicthods itïc based solely on the notion that clusters are regions of featiire space having
high density and separated hy regions of low data density. The probability tiensity
tstirriate at a point r is determineci by a weighted summation of clatum points falling
withiri a sniall region aroiintl s. Clusters are then identifieci by locating local rlensity-
niasirria. Sirice thet? is uo n ~ e d to specifj- in advance the shape and nurnber of the
cltisters (determinecl from the nurnber of local maxima). this approach is niore general
and van be merl to idenci- anv unknawn or irregular shapecl clusters.
5.1.1.3. Pairwise Data Clustering
Sometirnes the characteristics of a data set cannot be represented in a metric
space. Instead. the? are characterised indirectly by paintise cornparisons as in a
prosirnity rnatrix or graph, Advamages of pairnise cornparisons over distance in
nietric. spiice inclutle the support of higher Ieve[ similarity chat violates the triangular
inequality [105] [5]. However. techniques for Cinding the optimum partition or merging
arnong the (fatum points basecl on the more generai similarity matrk are. in general.
lc~ss efficient and require more merno- storage [llO] [97]. For example. the proximitv
matri\: of a small image of size 128x128 has n' = 268.000.000 entnes.
5.1.2. Edge-based Methods
Segmentation can be obtained by detecting the boundaries of various regions.
This task is usuaily accomplished by tocating points of abrupt change in locaI features.

such as intensit. colour. or surface texture. A large variety of edge-detection methods
are available in the literature. such ris the Sobel. Preaitt, Roberts. and Canny edge
operators. However. since the edges are often broken. edge linking is required to
ensurr chat the boundaries form dosed contours. Because of the small spatial support
of the edge detercor. the edges are very close to the actual boundaries. Hoivever.
due to the srune fact. this operator is very susceptible to noise and false edges can
appear in highly testured regioos. Ma and SIanjunath [68] have proposed a novel
boundary detection scheme. which they called .-ccIge Row' , to facilitate the inregration
of difftwnt image a t t r ibu t~s for edge dccection.
5.1.3. Region-based Met hods
Region-basecl methods are the logical tlual to the edge-based methocis. Instead of
locating changrs in surface properties. region-based methods detect the honmgeneous
regions clirec-tly. iisually by iteratim split and rnerge phases. Cnlike the dge-basecl
methods. a measure of region homogeneity must be defined in advance. In general.
aivailable approaches for the cask can be dividecl into two groups. region growing and
split-iind-merge. In a region growing approach. a number of riniform regions (seeds)
ilre givca a priori and the siirrounding piuels are merged to one of these seeds (region
groming) if the iiniformity criteria rire satisfied. For split and merge methods. non-
iinifcirrri nlgioris are broken doim into smaIler areas until all the resrllting regions are
rlassifieri as --iiniform" based an the uniformity criteria. Nest. neighbouring regions
iiïe rwnpared and niergetl if the- are close enough in fcatiire space. In all cases. the
qiiality of the segmentation output is directly related to the tiniforniity criteria. and
tience the selection of a good uniformity rneasure is vital for success. Recently. Deng
et al. [26{ introduced a new measure for hornogeneity. called the .I measure. which
mesures the uniformity of colour distribution in a locai region. By doing this. colour-
texture patterns are incorporateci into the homogenei- measure and thus no explicit
texture feature estraction is needed. In generai. region-based methods are more
robust than edge-based methods because segmentations are based on much Iarger
local neighbourhoods. However. according to uncertain- theory. this approach dso
has poor boundary localisation.
5.2 SON-P-kRXtIETRiC DI-rSTTY ESTllL4TION FOR ihL4GE CLCSTERDiG
5.1.4. Hybrid Methods
Each approach mentioned in the previous sections has both advantages and draw-
backs. Hence. it is desirable to combine some of the existing methods. making use
of each approach's advantages. Because of the duality property of edge-based ancl
region-based methotls. these methods are commonly combined [15] (921 [6]. Zhii ancl
liiille 11501 have proposed a methad cailed region cornpetition" to uni- existing
ttlchriiques siich as snake/b;illoon rnodels. region growing. and Bayesian/SIDL (min-
inium clescription lerigth) within a statistical framework. Nazif and Levine [80] haw
proposeci a rule-based approach mhich systematically organises m d applies a large
iitirritwr of cliffercnt heirristics for Iow level image segmentation.
5.1.5. Conclusions
Each niethod h a its own arlvantages and disadlantages. Edge-baser1 methods
iichiev~ good loralisation but are sensitive to noise. On the other hand. region-based
niethods are niorc robust but at the eypense of poorer ecige localisation. .Uthoiigh hy-
brid ttiethods protluce thc bcst segmentation results. these approaches are. in general.
niore cornples ancl cornpiitationally espensive. Also. since the objective of this thesis
is focused on rra1 scenes. it is preferable to select a method which imposes a niini-
niurn numher of assumptions on the image formation and the form of the underlying
populations. ?rrtiong the mttthods m~ritioned above. non-paranictric clensity estima-
tion satisfies the niininiuni assumptions requirement. [t also provides featiire clerisity
information that is needed for the enstring attention process. Thus. this method is
itstvl for wgnienting rcal scenes in this work.
5.2. Non-parametric Density Estimation for Image
Clustering
The methotl described here folloms the morks in 1911 and [20]. Yon-parametrir.
rliistering starts with the estimation of the d e n s i - Let {-Ya),=,..., be a set of n
tlatum points in the d-dimensional space. Then the muitivariate density estimation
at a point x is tlefined as:

rrhere h is the radius of the density estimation kernel and K ( r ) is the dcnsity esti-
mat ion kernei.
The optimum kemeI yielding minimum mean integrated square error (MISE) is
the Epanech-Nilrov kerneis[ll2]:
wherr rd is the volume of the hypersphere. Other types of kernels, such as linear arid
Gaussian ;Ire also frequently used.
5.2.1. Clustering Algorithm
The steps for the clustering are describecl below:
O Geriercite rr rrrnrlorn su&-sample of the dntum points. To speed up the compiita-
rion. it sct of m points Si...S, is randomly selected €rom the data. Moreover.
i ~ i d e r tu retliice oiitliers ancl -'invalid" düttrm points. pisels lying cm the
rcgions of abrupt changes in spatial domain tire exclucied frorn thc sample W.
a Estinide the 1oc.d Jerisity of euch point in the saniple .set und then ctpply the
grrtdierrt-crscent or hill-climbing method to lowte the local muirno. For eacti
saniple point S,. rqilation(5.L) is iised to estimate the density at -Y,. k nearest
neighbours tif each data point are also determined. The gradient ascent niethod
is usecl to associate each data point to a nearby density maximum by moving
dong the point of highest density among the k nearest iieighbriurs.
Mwqe rieurby r:luster centres. An? pair of cluster centres ivhose distance is less
chan a chreshold ndi be merged. If no significant valley exists between an?
two c1itster centres. these clusters will also be merged.
a Re-cluseif~ny fhe sarnples. Each sample point is relabeiled to the chster de-
Cined by a majority of its k nearest neighbours. Fewer nearest ncighbours can
be used if smdl chsters are expected.
Hiemrchtcal ciusterzrry. After the cluster centres are found. the? are merged
together hierarchicdly The criterion for this merging process is the inter-
cluster distance. Homever. t h i criterion can produce undesirable results. such
as merging mo well-separated but close ciusters before other well-connected
chsters t hat have centres hrther apan in feature space. To avoid this probiem.
PauweIs and Frederk [91j have taken a different approach. First. the choice

5.2 NON-PARAMETRIC DENSITY ESTMATION FOR IMAGE CLESTERING
of h (the width of the density estimation kernel) and k (the number of nearest
neighbours) are set to resuit in an over-segmentation of the feattture space.
Then, the clusters are merged based on the ratio of densities at the saddie point and the neighbouring cluster centres, thereby produchg an ordered tree
of clustering. They defineci the saddle-point as the point of maximal density among the boundaxy points which have neighbours in both clusters. Depending
on the size of k, the estimation of the saddle-point cm deviate from the actual boundary by the distance to the kt" nearest neighbour. To reduce this emr ,
the boundary points can be further limited to points having at least 30% of
neighbom in both clusters. The reason provided by the authors for using
density instead of distance in the merging process is to avoid the undcorne chaining-efkt of hierarchicai clustering. However, if distance information is
ignored completely, the merging process will be vulnerable to error and noise
in the density estimation, especiaüy for smaü clusters. Hence, it is better to
merge the clusters b d on both density and distance. To make these two
measures directly comparable, the distance is normalised by the average inter- cluster distance. Preference can be given to indicate the relative importance
of density and distance. Rom experimentation, the b a t clustering results are
achieved when the relative weights between density and distance are in the
ratio of 10:l.
a Selecting the optimum n v m k of clusters. At the last stage, the number of clusters is deterrnined from indices of cluster-vaiidity or an absolute threshold.
This topic will be discussed in the next section.
5.2.2. Cluster Validity Indices and St opping Criteria
Determining the number of clusters present in an image is a very dif6cult probiem.
This anSes Çom the unclear d a t i o n of what is a good segmentation. For artificid images, it is easy to produce a definition since the ground truth of the image formation
is known a priori. However, for natnral images, obtaining the ground h t h is not at
al1 an easy task or may even be impossible. As discussed in Chapter 2, any image can
be interpreted at different levels of abstraction and it may not be dear which level
of abstraction is optimal for a given image. As a r e d t , many image segmentation
techniques reIy on specifw heuristics b a d on the appIication area, and the d&tion of a good segmentation is hard-coded into the program. Although heuristics are
widely iised in a variety of fields. it is desirable to have a mathematical definition
of a good segmentation so chat it can be analysed systematically. In [52]. a large
number of indices of cluster diditu are reviewed. such as the Davies-Bouldin index
(DB) and the modified Hubert r index (MH). The problem with these indices is
that they al1 are baseci on the assumption of Gaussian-shapecl and well separated
clusters. To overcome this probleni. Pauwels and Freder~v [91] have proposed a
new non-parametric measure for cluster validity which does not exhibit an? shape
preference. To compare the performance and validity of different indices in image
st~gmentation. three different niethods are considered and analysed experimentdly: a
simple chreshold-baser1 index. the !WH index. and the Paiiwels and Frrclerix's non-
parmietric nieasures. The relison for selecting these methods is because they represent
chree major clitises of cluster riliclity indices. from simple threshold rnethods t o nicire
i-omplex indices bath with and withoiit any specific assumptious on the distribution
of th^ data set. In the following. a brief review on these methods is provicled and th^
iinalytiral rtwilts d l be presented in Chapter 6.
5.2.2.1. Thceshold-based Index
Thrcvtiotds arr wry ronirnonly used as stopping criteria beraiise of their simplicity
(no additional wmpiitations is reqiiiretl). Hoivever. in general. the? require firie-
ttinirig to optimise performance. This can be an advantage if it is eaçy to tiinc, this .
para1rietr.r. or a disacivantagt. othenvise. Since hierarchical clustering i.: basetl on tht>
rlensity and distance hetween the clusters. a threshold on this measure cm be usrcl ifi
a scopping criterion. Thus. clusters are merged if the following condition is satisfiecl:
where r l ens i t ! / ( i .~ ) is the ratio of the density at the saddle-point between ctuster 1
and cliister j and the ciensity at the cluster centres. and distancefi. j ) is the distance
htmwen these two clusters. p is a constant indicating the relative importance of
tlensity to distance and r is the pre-defined threshold. From esiximentation. ~ v e
h a v ~ foiind thnt the relative importance of density aud distance is about 10:l and
thus a value of 0.1 is used for p.
5.2.2.2. Modified Hubert r Index This indes is proposed by Dubes [52] and is based on the assumption chat es-
cimates of the cluster centres are close to the ?me" position of the clusters in the

pattern spnce and deviations €rom the centres are due to errors and distortions. Hence.
there is an implicit assiirnption of ball-shaped chsters. For a given clustering, the
.WH indes is defined iis follows:
Lcc C t i j be the label function.
L ( i ) = k , if pattern i is in the kth cluster
and is the Eilclirlean distance betwen ciuster centres j and k . Define
The modihed -11 H index in then given bu:
whew S(l . j) is the Euclidean distance between pattern i and j. n is the tocal number
uf patterns. .il = n ( n - L)/L and
This index rneasures the degree of linear correspondence between the entries of S
anci 1-. The matrk S is the same for d l chsterings but the matris k- varies dependhg
oti the corresponding cluster centres. For strong md mell-separiited clirsters. the
rltister centre associated mith each data point should not deviate significantly from
the t rue cent rp as Iûng as the clilstering is over-segmented. Hoivever. when the merging
process ~sceecls the optimum level and tries to merge tm well-separatecl clusters. the
cluster centres d l then start ta det-iate fkom the red centres and the similarity
betaeen the prosimity matrices 'i and Y Ml1 begÎn to decrease. As a result. the
optimum number of clusters is d e b e d as the "knee- point of the i i H function wbere
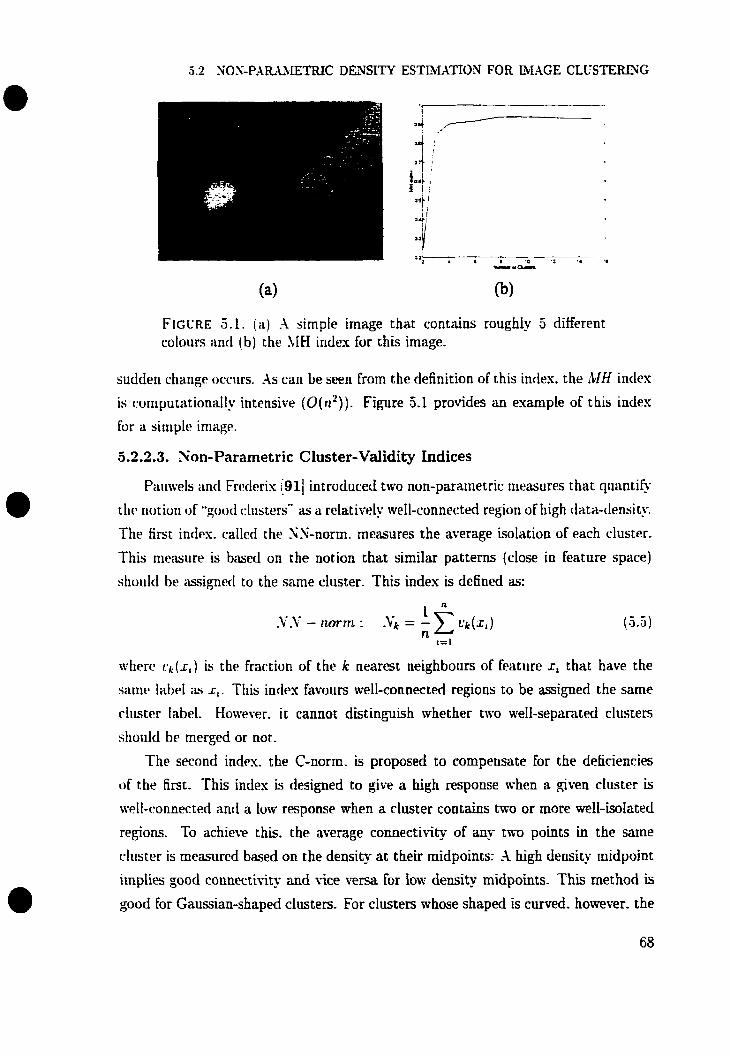
3.2 XOY-PAR~METRIC DE,YSITY ESTJMATION FOR MAGE CLCSTERIYG
F~CCRE 5.1. (a) 3 simple image that contains roughly 5 diffcrent colours i~rid (b) the llIH index for this image.
sudden change ocriirs. As cari be seen from the definition of this irides. the !CIH incles
is computationally intensive ( O ( n 2 ) ) . Figure 5.1 provides an example of this index
for a sitriple image.
5.2.2.3. Non-Parametric Cluster-Validity Indices
Paiiwels and Frt!cleris i911 introduced two non-pararnetric measures that qtiantify
t l i t b riotiori of "goc)d c.lusters'* as is relatively well-connected region of high data-densit-
The tint incles. called the ?S-nom. measures the average isolation of each cluster.
This nieastire is based on the notion that similar patterns (close in feature space)
stiotiltl be assigned to the same cluster. This indes is defined as:
wherc ~'~(1,) is the fraction of the k nearest neighbours of feature x, that have the
siitiitb 1;hd as 1,. This index favours well-cormecteci regions to be assigned the same
cluster label. However. it cannat distinguish whether two well-separatecl cltisters
shoiilti be merged or not.
The second index. the C-nom. is proposed to compensate for the deficiencies
of the first. This indes is designed to give a high response when a given cluster is
~11-connectecl and a low response when a cluster contains two or more well-isoIated
regions, To achieve this. the average connectivity of an!- tm-O points in the same
clliister is measrired based on the density at their niidpoints: -4 high density midpoint
irnplies good connectit-ity and vice versa for low density midpoints. This method is
good for Gauçsian-shaped clusters. For clusters whose shaped is curved. however. the

3.2 XO'i-P.1R.UETRTC DENSITY ESTIorL4TIO-I FOR MXGE CLCSTERCIiG
F~CURE 5 . 2 . NN-norni (left). C-nom (~enter) . iuitl 2-score (right) for the image in Figure 5.1
niitl-point of two randomly selected points can lie on the void betiveen the arc. To
rectify this problem. the midpoint is shifted tomards the high density region until the
local nia..irnirrn is r~achetl. During this shifting process. the sarnct distances betwen
the niidpoint to the two test points must be maintained to avoid ending up at either
ont. of the tcst points. This inties is defined as:
wherts h: is the number of randomly chosen pairs of test points and t , is the mid-point
;ifter the shifting process. f ( t , ) is the data density at the point t,. To select a single clustering. these two clusiier-didity indices musr be combined
tu g iw ;L single measurc. Pau~vels and Frederiv propose first computing the Z-scores of
t t i e C-nortii and .l'.Y-tiorm to niake the itidices directly comparable: thc two rtmlting
2-scores art. summed to give the final score. 2. The clustering hat-ing the maxiniuni
Z-score is selectecl as the optimum segmentation for the given image. The equations
for computi~lg the 2-scores and the final Z score is defined as follows:
where Jl,-LD stands for median absolute deviation. T-picd curves for the NX-nom,
C-norm and the Z-scores are s h o m in Figure 5.2 for The disadvamage of using the
median and the JI.4D to normalise the cluster measures is that their ridues depend
on the range of t d i d clusters. or number of obsenations.
After the segmentation. mathematical morphology. dilation and erosion. are utilised
tu reniove small and thin regions that usuülly correspond to noise. Next. three conser-
vative region rnerging processes are applied to the segmentation result. First. regions
that are smaller than 0.5% of the whole image are rnerged to their Cconnected or
S-connected neighboiirs If more than one neighbour is found. the one closest in feature
space is selected. CVhen position is also included in the feature vector. large regions
.ni- be split into tnro or more regions. Hence. a second step of the region rnerging is
used to merge similar regions based on colour andior tevture only In some images.
the regions' surface features are not uniform but change smoothly (for instance. from
light to dark. such as the sky). Hence. another rnerging process is carriecl out CO
nierge regions whose contrarit ülorig their cornnion borders are heIow ü pre-drfined
t hr~sholtl.
CHAPTER 6
Evaluat ion and Test Result s
This c-hapter examines the performance of the O bject-hased attention algorit hm.
Thtw itrr basically three areas to be analged. First. several important paramecers
that coiild not bc rletermined iising logical and theoretical arg~ments are evaluatecl
esperimentall The second pcm ivill compare and analyse tlifferenc methotfs for SP-
lecting the hest number of cliistem. The Imt part of this chapter will disriiss the
performances of different saliency factors in predicting the perceptiial saliency of r+
giotis in i i srthrit%. Thc image database used in the experiments was chosen from the
Corel image collection1. (See Appendi.. B for al1 of the images in the experiniental
c1ntabaseI.
6.1. Determining Parameter Values
The parameters that need to be determined e?iperimentally are the aeights on the
çuluur. wstiire. and position features in the feature extraction. and the sarnple size.
k r r t d widtli. and nuniber of nearest ueighbours in the process of image segmentation.
6.1.1. Weights for Colour, Texture, and Position
As stated in Chapter 4. the purpose of imposing weighting factors on colour.
texture. and position features is to normalise the dynarnic range of different features
and to improve the perceptual uniformity of the combined feature space. It mould
be preferable to et-aluate the perceptuai differences among these features tbrough
psychophysical experiments. However. th% is beyond the scope of this thesis and no

appropriate literature is amilable on the topic. Alternatively these weights can be
determinecl by finding a parameter set that produces the best overall segmentation
resul ts.
Before appIying any modification to the weights, the features ;rre obtained as
follows:
0 Colour features are obtained by convening the RGB values of each pisel into
L'a'b' space. with L ranging from O to 100. a' ranging from -500 to 500 and
6' ranging from -200 to 200.
Testure features are formed by applying a set of band-pas filterç on rht. in-
censity. L. Sext. the set of transformations described in Chapter 4 is applied.
Position features are the r. y coordinates of the pixels nornialised to the range
of O to 1 by a scaiing factor. To preserve the aspect ratio. the same scaling
factor is used for both r and y coordinates. II the original z. y coordinates
ranges frorn O to width and hright. respectively. l /max(w~dth . helght) ran b~
user1 ~LS the swling factor.
6.1.1.1. Optimisation process for finding the weighting factors
-4lthoi1gh a nuniber of rneasures have been proposed for estimating the qualit!
of a plirticiilar seprn ta t ion [149][7]. they are not very accurate or effective when
mt ipa r~ t l to hiirii;iri performance. In order to avoid extensive psyrhological rxperi-
r~i~nt;ttion and stili Iiaw a subjective justification For the segmentation rrsults, che
following prciwss w;u usect for selecting the best parameter set to gives the bcst ovrrall
r&drs:
Froni a pr~liniina- examination of the image segmentations. ive found that.
for ii large portion of the database. the segmentation resuits rlid not var-
significantly with different weighting factors. Only on a small suhset of the
database could Ive observe significant improvement by modifjing the weights.
Hencc. in order to reduce the complexity of the optimisation process. onIy a
sniall siibset (about 50) of the ciatabase was employed. including al1 of the
images that preferred a different parameter set from the majority of images in
the complece database.
Segmentation results using different weighting factors were obtained and judged
by hiiman ohse~ers . In particdar. the judgement were baed on the following
criteria: 1. Grouping should be consistent with the visual appearmce. S o
visually distinct regions should be merged and vice versa for visually similar
regions. 2 . llore emphasis shouid be placed on the major objeçts in the ini-
age rather chan the background. 3. The overall quality of the segnientation
results for a given parameter set were obtained by counting the number of
images jiidgecl acceptable based on the first two criteria.
6.1.1.2. Resuits and Discussion
Frorri exterisiv~ ~xperinientation on a wicle variety of test images. we have found
that the weighting factors for colour. texture. and position should be iipproximat~ly
cqiial to 1. 1. and 10. respettivel> to achieve the best results. 1: was observecl chat
the incliision of position in the feature vector has both admntages and disadvantages.
The major iidvmtage is chat the proximity of pixels is also considered in the grouping
process. On the other hand. this can be a disadvantage since the position information
may catisr an occlrirled object to form two or more chsters in the featiire space.
Fortiinately. this prohlem can be solved easily by merging regions having similar
d o r i r and texture. For normal scene images where different objects form distinct
c.lusters in feacirre sp;lctl, che segnientation restilts do not cliffer significaritly wliet1it1r
position is inclitdetl or not. Wowever. if two or more objects in a sçene have similar
siirfaw properties. a much better result is produced if position is incorporatrrl irito
rhe feature vwtors. Generally. including position into the featiirp wctor impraves the
sepuability of different regions and produces more compact and smooth regions. thus.
yieldirig ;r h r t t t ~ segmentation result. Figure 6.1 k 6.2 show the final segmentations
of 30 ranctornly selecccd images.
6.1.2. Pararnet ers Used in Image Clustering
There are thrw parameters in the clustering aigorithm outIind in Chapter 5 that
n e d to be sec. The h s t one is the sampling rate. S. From the whole image. m pisels
are randornly seIectecl and irsed in the subsequent density estimation and clustering
procms. wh~re rn = S.\; and 9 is the total number of pixels. The l u t two parameters
r o he determined are the wïdth of the density estimation kernel. h. and the number
of nearest neighborm. k. that are used in the gradient-ascent process.
For an image of size 180x120. the total cornputation time of the clustering al-
gorithm and the time needed for density estimation a t different sampling rates are

FIGURE 6.1. Part -1. Segmentation of 30 randornly selected images. Botindaries are show in gray. See figure 6.2 for the other 15 images.
shom in Figure 6.3. Clearl- the bottleneck of the dustering dgorithm is the density-
escimatioo process. By examining the density-estimation equation on page 63. we can
see that this operation has a computation complesity of 0(n2). This process takes
9.3 minutes on a 300 U H z Pentium II PC if 100% sampling is used, but only 35
seconds if haif the data set are considerd Hence. it is desirable to analyse ho%- much

FIGURE 6.2. Part B. Segmentation of 30 randody selected images. Boundaries are shown in grey- See figure 6.1 for the other 15 images.
segmentation error is introduced when the data set are subsarnpled. From an exam-
ination of the segmentation resdts of a mide varie- of test images, there seems to be
a general trend that the outputs are vee- similar for ary sampIing rate between 40%
and 100%. Below this range. srna11 objects begïns to disappear and the boundaries
start to deviate £rom their actud location- As a r d t . -10% of the whole image is
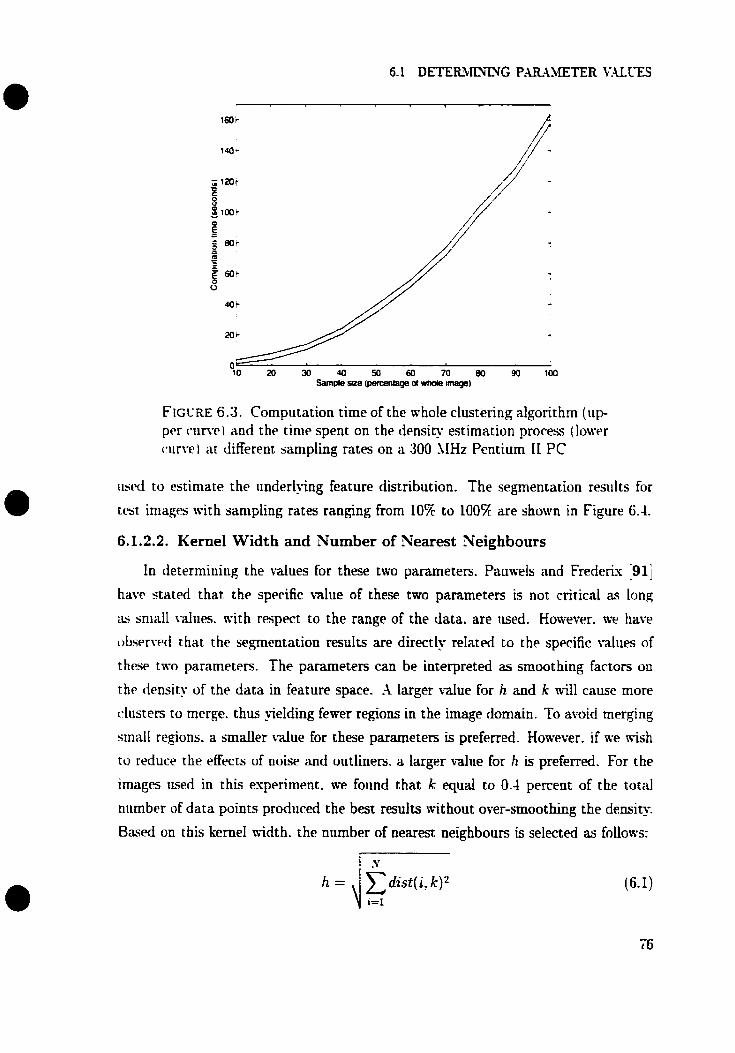
FIGURE 6.3. Computation time of the whole clustering algorithm ( i i p
per i-iin-c ) and the rime spent on the density estimation proces ( h w r run-el at different sarnpling rates on a 300 MHz Pentium II PC
riwd to cstimate the iinderlying feature distribution. The segmentation results for
test images ivith sampling rates ranging from IO% to 100% are shown in Figure 6.4.
6.1.2.2. Kernel Width and Number of Nearest Neighbours
In cletermining the values for these two parameters. Pauwels and Frederis [91i
have stated that the specific kalue of these two parameters is not critical as long
:fi ~ t d 1 values. n-ith respect to the range of the data. are iised. Howewr. ive have
&en-ed that the segmentation results are directly relatd to the specific i d u e s of
these tn-O parameters. The parameters can be interpreted as srnoothtng factors on
r h ~ density of the data in feature space. ,-î larger d u e for h and k will cause more
ciusters to merge. thus yïelding fewer regions in the image domain. To avoid merging
srnaII regions. a s m d e r value for these parameters is preferred. However. if we wish
to reduce the effects of noise and outliners. a larger value for h is preferred. For the
images iised in this esperiment. we found that k equal to 0.4 percent of the total
numbcr of data points prodiiced the best r d t s wit hout over-smoot hing the density.
Bas~d on this kemel n-îdth. the number of neares neighbours is selected as follows:

FIGURE 6.4. Segmentation resuits of a test image at different sampling rates
tvhcrt di.st(i.k) is the distance of the kth nearest neighboiir of point i in the feature
spaw.
6.2. Cluster Measures
Althoiigh it is important to develop better techniques for feature extraction or
groirpirig criteris. and which have a doser resemblance to the performance of the
hiirrian visuai systrm. it is equaily important to e-@ore netv techniques for meauring
the validity of different ciusterings that usualiy arise in the many image segmentation
techniques. The challenge of morking with real scenes is that there may be more than
one possible n-ay to segment an image. and thej- may ail resuit in d i d segmentations.
Hence. a natural question is what determines the d i d i t u of a particular segmentation
and ~ h e t h e r or not this definition can be forma& d e h e d in terms of mathematical
formulas. In other words. hom can we estimates the true or best number of clusters
or regions for a given image'? In Chapter 5, three different methods that are designed
for measuring the cluster-talidil are described: a threshold-based indes. modified
Hubert ï indes (M). and Pauwels and FrecierSs non-parametric measures (LW).
In this section. the performances of these three methods on reaI scene images ni11 be
andysed and compared.

6.2 CLCSTER 'UiE.4SLXES
6.2.1. Assumptions Used in Each Method
Before explaining the test methods and resutts. ic is useful to restate the assump
tions used in these three methods. In a threshoid-based rnethod. an invalid clustering
is defined as a violation of a pre-defined threçhold (see equation(5.3)). Since. it is
(lesirable to minimise the amount of over-~e~pentation. the optimum number of clus-
sers is the one that is both wlid and hris the srnailest number of clusters. The lait
t w niethods. MH and !VP. are global mesures that compute the overall goodness
of a segmentation. Both methods are based on the notion chat the clusters are well-
separated in feaciire ipace. Hence. the performance of these methods may not he wry
rcliable for weakly sepürated clwers. Howewr. Gaussian distributions are assumed
in MH but not in .VP. Cnlike the tttreshold-based method. the decision scheme of
rstimatinç the best number of clusters depends only on the changes of the indices (xs
a firnction of the number of dusters) but not on their specific values. The driwback
of this kind of decision scherne is that a sudden transition or a -knee" in a function
is often riot e s y to detect or define precisely. tn addition. since it is not effectiw to
search for al1 possible cases (the mavimum number of regions wiH be the m a l numbcr
of pixels). for an- given image. the search must be Limited to a specific range. For
instance. 1 to 6 clusters is used in [91] and [13!. Given this resiriction. it is important
to cietcrniine whether the ideal nurnber of clusters lies on the boiindaries of the search
range or even outside this range.
6.2.2. Test Images and Irnplernentat ion Issues
To test the robustness and the vaiidity of the assumptions of the t hree methods.
;i set of 40 real scerie images from the database in Appendix B \vas carefully selected
to capture the rariations in object size. contrat. and other properties present in real
tvurld scenes. Saniples of these test images are s h o m in Figure 6.6 (See Appendix
C for the ahole test set and segmentation results). in this test set. we found that
the best number of clusters can actually be as large as 15. Hence. the search range
is set to [l. .... 131. For the chreshotd-b4 method. based on the criteria stated in
section 1.1.1. a threshoid of 0.5 @\-es the best overaii result. Hence. the threshold
( 7 ) is set to 0.3. For the MH index, the optimum number of cliisters is defined as
the -knee" point of the M K function. In actual implementation. the %te- point is
defined as the ma\imum in the second denmiw of the MH hrnction. Besides. since
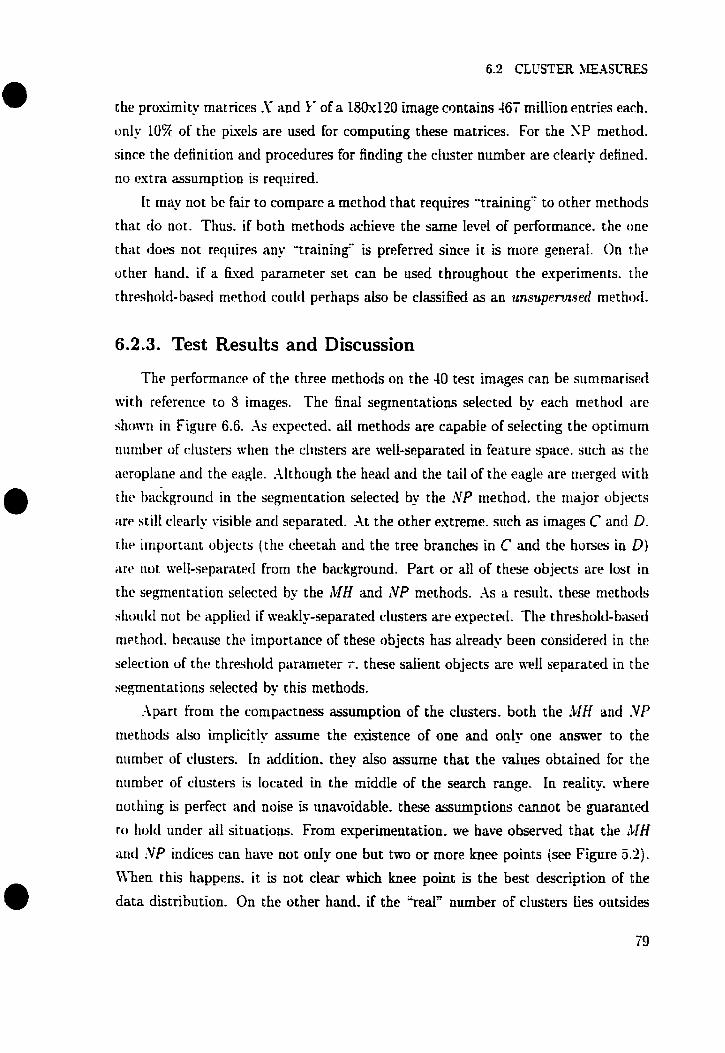
the prosimit? matrices .Y and k- of a 18h120 image contains 467 million entries each.
anly 10% of the pixels are used for computing these matrices. For the NP method.
since the definition and procedures for finding the cluster number are clearly defined.
no estra assiimption is reqcired.
I t may not be fair to compare a method that requires 'rraining'' to other nmhods
that do not. Thus. if both methods achieve the same levei of performance. the one
chat cfoes not reqiiires any "trainin< is prefened since it is more generai. On the
uther hand. if a tiwd parameter set can be used throughout the experiments. the
threshold-batseci method could perhaps aiso be classified as an ~rnsupemsed rnethod.
6.2.3. Test Results and Discussion
The performance of the three methods on the 40 test images can be surnmnris~d
rvith reference to S images. The final segmentations selected by each methocl are
shorvn in Figure 6.6. As espected, al1 met hods are capabie of selecting the optiniiim
riumber of c.lusters when the clilsters are well-separated in feature space. such as the
dfiroplane ancl the eagle. Although the heatl and the tail of the eagle are rrierged rvitti
the background in the segrricntation selected by the NP method. the major objects
are still clearly visible and separated. At the other extrerne. such as images C and D. the iniportant objects (the cheetah a d the tree branches in C rind the hurses in D) artb tioc tvelI-separat~tl from the background. Part or al1 of these objects are lost in
the segmentation sclectpti by the M H and IVP methods. .\s a resiilt. these methorls
shoiild not be applierl if aeakly-separated clusters are expwtetl. The chrshold-baseri
niethoci. because tht> importance of these objects has already been considerd in thp
selection of the threshold parameter r. these salient objects are well separated in the
segmentations selected by this methods.
.\part from the compactness assumption of the clusters. both the .W and .VP methods also implicitly assume the esistence of one and only one a m w to the
nuniber of clusters. In addition. they also assume that the d u e s obtained for the
number of clusters is located in the middle of the search range. In reatity. where
uuthing is perfect and noise is unavoidable. these assumptions cannot be guaranted
to tiold iinder al1 situations. From experimentation. we have obsened that the .CIH
and .VP indices can have not oniy one but two or more knee points jsee Figure 5.2).
U l e n this happens. it is not ciear which knee point is the best description of the
data distribution. On the other hand. if the -rea13 number of clusters Lies outsides
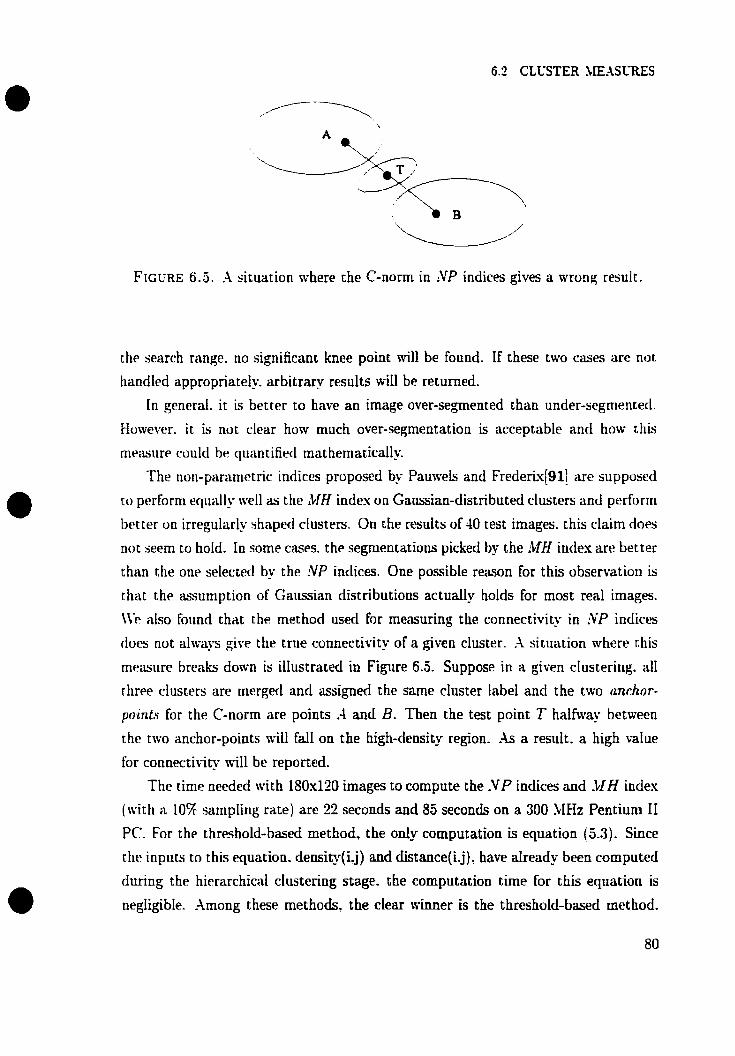
6.3 CLCSTER hiE.4SLRES
FIGURE 6.5 . A situation where the C-norm in :VP indices gives a rvrorig result.
the search range. no significant knee point will be found. IF these two cases are not
tlandled appropriatel. arbitra- resuIts wiIl be retumed.
In general. it is better to have an image over-segmented chan under-segrnented.
However. it is not clear how much over-segmentation is acceptable and how this
niriisiire coultl bc! quantifiecl mathematically
The non-parametric indices proposed by Pauwels and Frederis[911 are supposed
to perforni eqiially well as the ,WH index on Gaussian-distributed clusters and perforni
bet ter on irregularly sbaped clusters. On the rcsdts of 40 test images. this claim does
riot seem co holcl. In sorne m e s . the segmentations picked by the MH index are better
chan the one selected by the NP indices. One possible reüson for this obsemation is
chat the assiiniption of Gairssian distributions actually holds for most real images.
\CF. also Foiind chat the methoci iised For measuring the connectivity in NP indires
tloes not always give the crue connectivity of a given cluster. A situation mhere this
rrieasiire breaks tfown is ilIustrated in Figure 6.3. Suppose in a given clustering. all
rhree clusters are merged and assigned the same cluster label and the two anchor-
points for the C-norm are points -4 and B. Then the test point T haifnray betrveen
the two anchor-points wiil fa11 on the Liigh-density region. -4s a resuIt. a high value
for connectitity d l be reported,
The cime needed with 15k120 Mages to compute the .VP indices and M H index
(with a 10% sampiing rate) are 22 seconds and 55 seconds on a 300 MHz Pentiurn II PC. For the threshold-based rnethod. the on- computation is equation (5.3). Since
the inputs to this equation. densi&(i.j) and distance(ij). have already been compiited
during the hierarchicd ch te r ing stage. the computation time for this equation is
negiigible. Arnong these methods. the clear winner is the threshold-based rnethod.
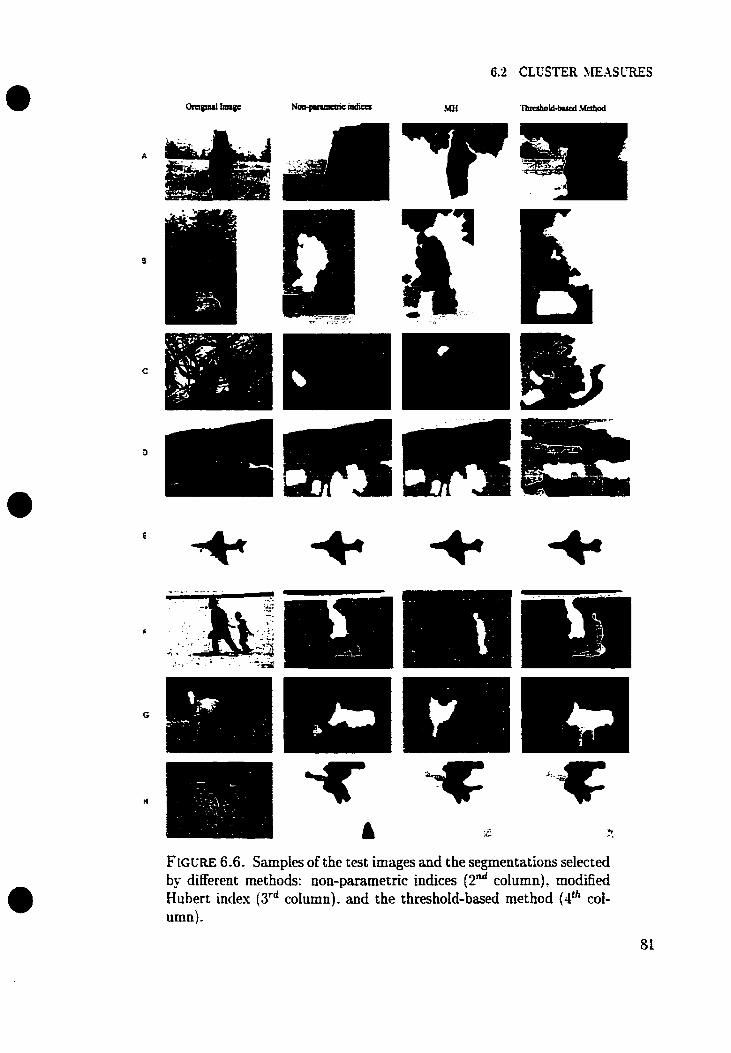
FIGURE 6.6. SampIes of the test images and the segmentations selected by different methods: non-parametric indices (Pd column). modified Hubert index (3rd column). and the threshold-based met hod (4'h COL m)-
lt performs well on dtll test images and requires only simple comparisons. A minor
drawback is that a suitable threshold must be kn0n.n a priori.
Saliency Factors
Before being able to determine the contents of a scene. it is necessa? to 6rçt focus
attention on the niost salient parts of an image. This entails an effective rnodel of the
liiiriiari attention systetn and it is vital to the development of a poweriul conipiiter-
based vision syteni. in this section. the region-based attention model described in
Chapter 3 is a n a l y d and evaluated.
6 Al. Determining the Weights of Different Saliency Factors
Severi saliency factors are described in Chapter 3. These factors are: contrast.
c.oloiir. location. sizp. foreground/background or depth. saturation. and shape. Aiter
c.onsidrrable expcrimentacion. we found that only the 6rst Cive Factors are useful for
prfdicating thr irnp~rt~mce of a region. Saturation and shape factors are useful in
sonic situations. Howewr, thcir rates of failure are much higher than their sucrrss
rates. -4s a result. they wi11 not be considered in the subsequent erperiments.
The final importance d i r e is defined as a weighted sum of each factor as follo~-:
ivtiere IL,^ is the weight lin the kth Factor. Ik. of region L.
Since the resirlts d l be judged findly by a human. a traditional trial and error
method was used to decerrnine the importance of different saliency factors in human
visual attention. At present. no extensive psychologka1 expetiment has beeii con-
tlucteci and the weigbts of the saliency factors were seIected and judged soleIy by the
itut hoc. If more time was a d a b l e . these factors codd be obtained more formally
and reliably by hating a group of subjects rank the relative importance of different
regions in a set of test images. X te r obtaining these statistics. numerical methods or
neural networkç could be used to find the optimum weights b - minimising the overaII
difference betmeen the e-xpected and estimated importance d u e s .
From especimentation. it is found that the results ciosest to human performance
were obtained with weights of 1.0 for foregrcund/background. 0.5 for contrast, and
0.3 for colour. location. and size. For the size factor. a saturation value of region

FIGLRE 6.7. Iniportanc~ n i a p for a scunpie iniage? (a). For (c)-(h). brighter regions represent higher importance. (c)size factor. (d)cotour fartor. (e)contrast factor. (f)foreground/backpound. (g)location fac- tor. anci (ti)final importance rnap produced b_v weighted stirnmatioii nf ( r ) - (g) . To f d i t a t e the ewluation of the final importance map. the ranking of the topfive most important regions are highlighted in (b). -4rrciw direct ions indicate the nest most salient regions.
size qua1 co 5% of the whoie totai image area is found to be better than 1%. The
pdorrnance of these fiw factors and the final important values are illustrated in
Figure 6.7. To indicat~ visuallv the ranking of these regions. the topfive important
regions arp highiigbted in Figure 6.a. For these images. the importance tdues pred-
icated by the mode1 are ven; consistent mit h the resitlts obtained kom a human. The
most important objects. the cdeche. horses, and the bright dome roof, are within the
top-five regions. Moreover. the scm path generated from the importance map also
agrees well with expected human perfomance.

6.3.2. Discussion
To test the robustness of this mode[. it was applied to 100 images ~ 6 t h a 6xed
paranieter set. Resirlts of 16 images are shown in Figure 6.3. in general. the attention
niodel gives consistently good resiilts for a wrïety of images. .As WC can see from
the weights coniprising of the importance factor. the final importance values are
highk biased to the foregound/background factor. Since the test images used folloiv
conventional photographie techniques. the O bjects of interest are usually piaced ac
the centre of the image. Hence. the probability that these objects touch the image
border are rnwh loiver than the background. -4s a result. the foreground/backgrourid
rrieasure cati separate the objects from the background quite accuratel. Hotvever. if
the ubject touches the border. such as the elephanc at the bottom left of Figure 6.3.
k t f&* nrgative error occurs. In this case. the importance factor fails to predict the
saliency of the elephant and it ranks the douds as the most salient region in that
picturr. For sorne images. regions among the topfive ranks selected by the attention
müps do not really reçpond to important objects. such as the sky. shadows. and the
ground. In ordcr to further refine the results. higher Ievel reiiçoning and kno~vledgc
i\ïp recpired. Semrthelms. for a low-lrvel systcm. the restilts are promising ancl the
method is generid eriough to be used in manu cornputer vision applications inclriding
c.otlt~nt-based image retrievai.
6.4. Applications
This technique for locating salient "objects" in an image can be extended easily to
tiantik a number of task-specific applications. such as face finding. image con~pression.
machine rision. and CBIR.
6.4.1. Face finding
This problem is of significant interest in the field of computational vision. and
has posed numerous practical challenges to date. For face hding , the importance
of a race can be encoded Lao the weights factors of the importance factors. For
dicriminating face Eiom other objects. sicin coIour (hue) and shape (roughly circular
or elliptical) can be used. The roundness of a region can be obtained by rneasuring
the ratio of area to edge Iength. In figure 6.9. a test image and its importance map
iç shonni. In this experiment. O - two importance factors are used. colour (red) and

FIGURE 6.8. II regions highIigt indicated by a t
nportance maps for tted in the original :ed circIe.
16 test images and image. The most
the most saLient salient region is

F [CURE 6.9. Face detection. Original imaged (a) and the correspond- ing importance maps (b). Only color (red) and shape (circular) factors are iised in computing the importance map.
shape (etliptical with an aspect ratio of 1:l.s). From the importance map. al1 the
faces are clearly visible in the importance map mith vent high importance wliie when
romparerl to ocher non-faCe regions. However. this method also detects the arni of
tht* person wtio is at the far right. Thus. &ter these candidate regions are icleritified.
niorr sophisticüt~d algorithms could be applied to further screen out the non-face
rt g' wns.
6.4.2. Image compression, machine vision, and CBLR
\ i ï th the availabiiity of an importance map. the major computational resources
cari he utiliseci more eficientiy and effective- by concentrating on the most salient
regions. These resorirces could be measured by the image compression ratio or the
processing cime. For CBIR. one of the major goals is to develop a similarit? measure
that closely resembles the obsemed visual differences. It generally accepted that
global features are not adequate for judging visual ciifferences. Csing an importance
map. the similarity measure can be basecl on the salient regions only and hence si11
not be affected by the background.

CHAPTER 7
Conclusions
[n m e n t years. considerable emphasis has been placed on the development of com-
ptiter vision systems emiilating the performance of a human. Despite the v a t dificul-
tirs twoiintered in niodelling the human visual system (Hi's). the benefits in being
able to achieve this have led to continutd widespread research in this area. One active
rcsearch topic is the simulation of the human visual attention sytem. To function in a
real-world environment. an autonomous agent must have an attentional process to lo-
cate objeïts in order to build a high-level interpretation of its environment. With this
kriowlerlge. the agent can navigate around and perform more compleir tasks. Apart
froni active vision. such an attentional systeni could be beneficial to other compucer
vision applications. such as content-based image r e t r i ed (CBIR). This thesis has
tliscussed the implementation issues related to the development of such a system for
lwating salient objects in a scene image.
First. the attention mode1 proposed by Osberger and SIaeder [86] is analyseci.
Satisfactory results on real images c m be obtained with their originaI method. Hozr-
cwr. iinder certain situations. their method fails to identi- some importance regions
that are salient to a human. To correct these problerns. a number of modifications
and several new sdiency factors are proposed. From experimentation, we have found
that onIy some of these factors are actually iiseful for estimating a region-s saliency
in general. These factors are: contrast. foreground/background. coiour. size. and lo-
cation. Other factors. such as shape and saturation. are applicable only in a number
oE speciiïc conditions. These factors do not seem to have an equd influence on visuaI
ae tention. For photographs. where important objects are usualiy located in the cen-
tre of the image. the foreground/background factor is much more important than the

others. The second most important factor is contrast. The rest of the factors have
less but similar abilities to attract human attention.
Sext. issues related to the implementation of image segmentation and feature
selection is disctissed. Since the performance of the object-based attention mode1
jusr describecl depends larg~ly on the quality of the "object" information. aa effective
image segmentation technique is required. To mimic the perceptiial grouping mecha-
nism in HVS. a niimber of biologically motivated features for representing the visual
property of a region are selected. These features are colour (L'a'b'). cesture (Gabor).
and position. -4 simple method for estimating the scale of the texture feature is also
described.
-1 nurnber of image segmentation techniques are reviewed with ernphasis on their
relative strengths and weaknesses. In particuiar. non-pararnetric density estimation
t~chniqu~hj are best siiited to the algorithm used in the attention process since no
c-ontcst-relatecf information is assumed and the regions' information is represented in
both spatial and feature domains. In order to have the system fuIly autoniatic without
an- human supervision. a niimber of clustering validity measure are considered for
estiniatirig the hest number of clusters. These measures are: modified Hubert index
!Xi!]. Pauwels and Frederk's non-parametric mesures [91]. and a t hreshold-baseci
nïeasure. Surprisingly. the simple threshold-based measure clearly out-perforrns the
ottier more corriples meaçures for al1 test images. We believe this contradiction is
caused by the incorporatiou of human preference in the threshold-based measure.
Althoi~gh it is desirable to have an aigorithm that is formdly defined and does not
rrquire an! training. it is much more important to have an algorithm that performs
correctly a intendeci. Our experiments indicated that both the modified Hubert index
and the Pauwels and Freclerix's non-pararnetric measure did not provide consistent
segnientations over a wide range of images.
7.1. Direction of Future Work The next logical step in the research is the incorporation of high-level. conrext-
dependent groiiping and attentional cues. In reaiitl-, we seldom find an object that
is uniform in colour and texture. Lu general. most objects. including natural and
artificial ones. are composed of severai heterogeneous parts. For example. a car has
four tires and a chassis. Ctiiising this higher-IeveI knowledge c m help reduce the

over-segmentation inherent in the low-level definition of an object as a coherent and
honiogeneous region. -Ln example of this approach is the body plan of Forsyth and
Fleck [34].
Another areii deserving further attention is the extension of the system to CBIR.
In ciment approaches to CBIR. the similarity measure used treats the whole image
as a single region or each sub-regions with equal importance. With a saliency virliie
;~ssoc.iated with each r~gion. the comparison between two images can be focused on
thcl salient parts only regardless of the background. This approach is desirable since
riiost image classi6cation triethods consider only the few major abjects in the scene.
stirh as iniages containing zebras. cars. or eagles.

APPENDIX A
The Graphical User Interface (GUI)
To facilitate the experirneritation with different approaches and rnethodologies. a
graphiral user interface (GL-1) ivas created (see Figure -4.1 ). Before an! operation
can be pdorrned. the user musc speci- an input image either from the .-File Opeu"
tiidog or r he .*Thumbnails" tlialog (see Figure -4.2). Both dialogs can be accessed from
the .*File" menu or the toolbar Located at the topleft corner of the winciow. After an
imagr is selccted. it d l be rlisplayed on the left side of .'Main" section of the main
tuirtdow. Theri. the image can be analysed by selecting -colour segmentation" frorn
tht* ".\(~tioti" nienii. This operation takes about 20 seconds for a 180x120 image. Afc~r
rhis oprration has rompletd. the best segmentation selected by the cluster validity
rneastm and the corr~sponding saliency map will be displayed in the first row of the
"Resiilts" section. Apart from this information. the segmentations for two to elewn
regions from the hierarchical clustering d l also be displayed on the last trvo rom of
the samc section. Each region in the segmented images is colour coded according to
its salieriry ranking. The colour scherne iised is shown on the right side of the -5lain"
section.
-411 major parameters of the feature extraction and image segmentation processes
can be niodified from the '-Test Parmeters- diaiog (see Figure -4.1) y - selecting
the '*Test Rirameters" from the -Settinge menu. To change the parameters of the
importance map calculation. one can select the "Saliency Parameters- from the same
menu CO open the 5aIiency Parameters" dialog (see Figure -4.2).

APPEISDE A. THE GRAPBICAL USER MTERFACE (GL7)
FIGURE -4.1. T h niairi rvinclow and the test parameter dialog.
FIGURE A.2. The thumbaaîi diaiog and the saliency parameter dialog.
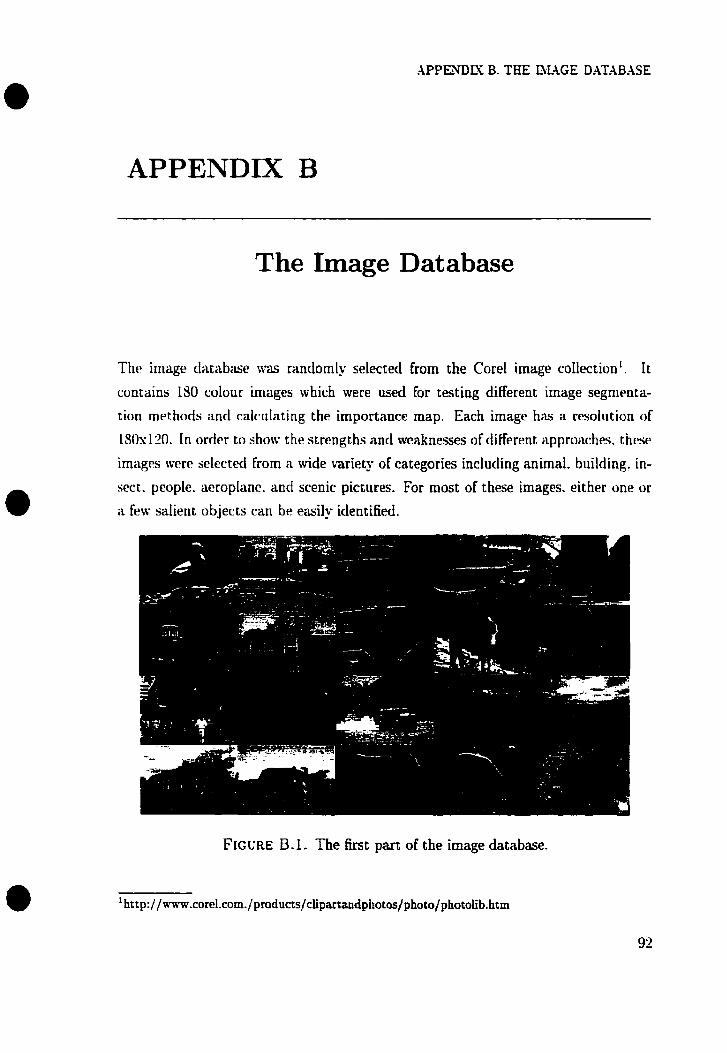
?LPPENDN B. THE DLIGE DATABASE
APPENDIX B
The Image Database
The image cl;itabiii;e mas ri~ndomly selected [rom the Corel image collection'. It
contains 180 colour images mhich were used for testing tlifferent image segnienta-
tion rnethods and calculating the importance map. Each image has a resolution of
LSOsllO. In orrlcr to s h o ~ the strengths and wcakneses of different approaches. thcse
images w r e selected from a wide vririety of categories including animal. building. in-
sect. people. aeroplane. and sceniç pictures. For most of these images. either one or
a few salient objects can bt! easily identifid.
FIGURE B. 1. The 6rst part of the image database.

FIGURE B-2- The second part of the image database.
93
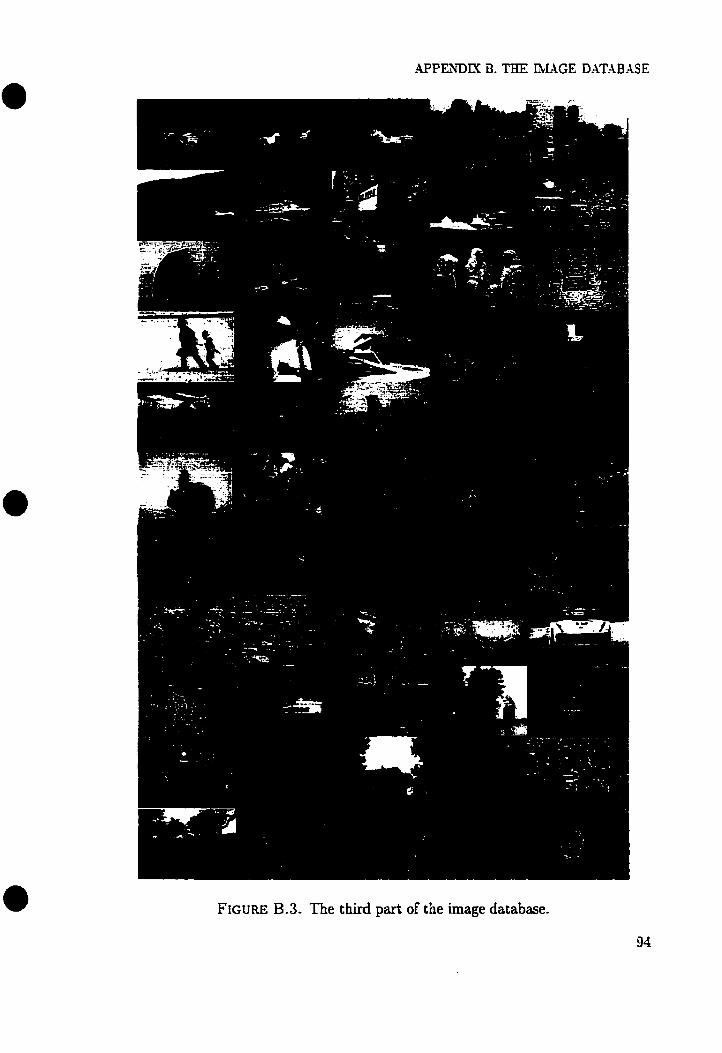
FIGURE B.3. The thkd part of the image database.

.APPE'iDIX B. THE MAGE D.ATABr\SE
FLGC'RE B.4. The Iast part of the image database.

.4îPESDLY C. THE TEST SET .Qii REStZTS
APPENDIX C
The Test Set and Results
FIGURE C. 1. The first part of the test set dong mith the final seg- mentation selected by the threshoId-based method and the focus of at- tention (FO.4) path. The FO-4 path is ordered according to decreasing salienc--

.APPEXDLY C. TEE TEST SET .L%P RESLLTS
F~GURE C.2. The second part of the test set dong with the haI seg- mentation seiected by the threshold-based method and the focus of attention (FO-4) path 97
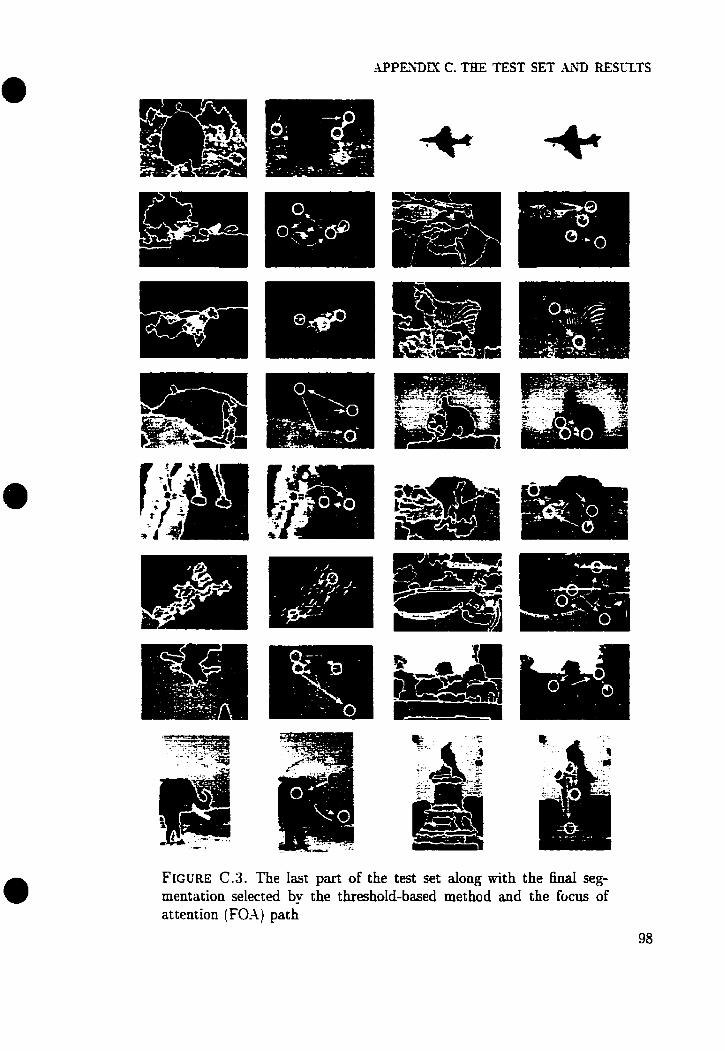
APPEW- K C. THE TEST SET ILXD RESCLTS
FIGURE C.3. The last part of the test set along with the final seg- mentation selected by the threshold-based method and the focus of attention (FO.4) path
98

REFERENCES
1 , SI. Amadasun .and R. King. Texture features corresponding to textural propenies. IEEE Tmm. un Sysiem
Man und Cykrnrt içs . 19:126--1174. 1989.
..PI -. J. ;\Jhley. R. Barber. 1t.D. Flickner. J.L. Kafner, D. Lee. W. Yiblack. and D. Pctkovic. Automatic md
semiautomatic rnethods for image annotation and r e t r i e d In query bv image content (qbic). s'PIE. 'L.YIO:?I-
3.5. 199.5.
1 R. Barsi. L'iewer-centered representations in object recognition: A cornpurational approach. Ln H a n d h k of
Pattern Recognition and Computcr Vuion. pages 925-944. LVorld Scientific. 2 dit ion. 1999.
4 r;.C. Baylis and J. Dnver. Visuai attention and objects: Evidence for hierarchical cMiing of location. Journal
o j E~plnmrntu l Psycholagy: Humun Perception and Pcrfomance. LS:451-470. 1993.
S. Belongie anci J. Staiik. Finding boundariev in natural images: A new method wing puint d w n p t o m aiid
area completion. In 5th Eumpcan C o n / m c e on L'amputer Vision. F'reibury Gerrnany. Junr l!398.
ti / .\. Bhderao and R. LVilson. LIultiresolution image segmentation combining region md boundap informarion.
CC'f:IP-Imuqe IJndcr.~tundrny, .;9(3):75!3-366. 1994.
'71 . . M. Borsott. P. Cmpadelli, and R. Schettini. Quantitative evaiuation of color image segrncntation resiilts.
Pattern reccynrtton letiers. I9 : Ï -&l - ÏJ f . 1998.
3 J . Braun. VWuai search among items of different dience: m m o d of visual attention mimicrs a lesion in
extriutriate ,ire& v-1. J. ?feurusci. t4(?):Jt4-56ï. 1994.
:9! C.R. Brice and C.L. Fennema Scene anal-ais using regions. AI. 3205-T16. 1970.
:1Ui P.J. Burt. Fast filter trausforrn for image proceising. Compriter Crriphic~ and Image Procesarnq. L6:20-51.
198 1.
1 1 ; G.T. Buswell. Hvw people look at piclurer. L'niversity of Chicago Press. Chicago.
.121 F.iV. Campbell and J.C.. Robwn. Application of fourier andysis to the visibilitv of gmtings. J . Phpinl..
L3T551-566. 1968.
113: C. C m n . S. Belongie. K. Greenspan. and S. SIalik. Blobworld: image segmentation using expectation-
rnaumization and its application to image querying. In PrOCCLdings of LAc IEEE Internattond ConJerence on
Cornpater Vuion. pages 675-682.. P i t a w a y , W. [;SA. 1998.
1 4 Central Bureau of the Commission Internationale d e L'Éclairage, Vielienna Xustrih Publrcairon CIE No. 15.2.
2 edition. 1986.
[ 1 3 A. Chakraborty. Came theoretic integrarion for image segmentation. IEEE ?tom. un PAMI. 7 1 ( I ) . Janu-
1999.

K.1. Chang, K.W. Bowyer. and S k i g U ~ ~ t h .LIuncrh. Evalua~ion of texture segmentacion algorithms. I E E E Cornputer Vmon and Priliem Rccognitton. L:19.1-299. 1999.
H. Chrrsteman. K. Bowyer. and H. Bunke. .-lctrve Robot Vuron. World Scientih Press. Singapore, 1993.
C.11. Cicerone md J.L. Yer~er. The ratio of I cones to rn con- in the human padovea l rectna Vumn
Keszilrch. 3l(j):d7!3-888. 1992.
C. Culby. The neiimmatarny and neurophysiology of attention. J. Child NewoL. 6:gP 118. L99l.
D. (fomaniciu and P Meer. Robusr analysis of feature *Pace: Color image segmentation. In Pmcccdangs uJ
C,'ompuler Vuron and Pattern Rlcognitron, 1997.
V C'uricepçion and H. Wechsler. Detectioo md 1ocdir;ttion of objecw in rimtvarying image- attention.
representation and rnrmorv pyramids. Pattern Recruyiiitron. ?3(4):1543 - L537. 1396.
J.G. Daugrnan. Two-dimensional spectral aualpis of mrticd receptive field profile. V u ~ o n Rcsmnh 2O:af; -
,956. 1980.
I.C. Daugrnan. Complete discrrte ?d gabur craaforms by neural nrtworks for image analysiu and comprmiün.
IEEE Troni. .-iSSP. 56: 16% L79. 1988.
P. De Garef and Ti. Cliristiawns. D. adn d'Ydewalle. Perceptuai eKectsof x e n e conrexr on abject identification.
Psychalogrcul Rcscurch. 5?:317 -329. f9W.
R.L. De v;ilois. D.G. Albrrecht. and L.C. Thorell. Spatial-frequenq selectivity of cells in macaque v~siial
canex. Vtsron Remmh. 'lS:51> 599. 1982.
Y D c ~ K . B.S. Xliuiliinnth. .mrf H. Shin. Color image segmentation. In P m . oj IEEE Conf on Cornputer
L'~iiun m d F ' d r r n iiewynfrun, 1999.
S . Donnclly. G.W. Kiimphrc~ . and 1l.J. Riddoch Parailel cornpuration nf pritnitive shape dexnptiom
Journiif of Espnmzntd P*ychulogy; Human Perception and Pmfonnonce. L7(2):j61-5ÏQ. [NI.
J. du Brif. SI. I iudm. and 51. Spann. Texture feacure performance for image .segmentation. Pattern Rermj-
nition. '1:1:291 309. 1990.
. I . Duncan. Seleciive attention ;uid the organuatim of visual infarniation. Joirrnul oJ Erpenmcnial Pqcholoytj:
1;cnerni. 1 I3:JQI -517. 1984.
G . E h . I;. Shtmvin. and J. Wise. Eye mmemenrs whiIe viewing YTSC format television. SMPTE PJV-
ihptiystcs Siibçi~nimiitt~ iVhi?e Paper. Mar& LW.
(.:.LV. Enkn u d J.D 5.T. James. Visuai atrention within and uound the field of focal attention: A zoom
iens rnorlel. Prrcepiiun and P~ycliophy~tu. 40(4):175-'240. 1986.
(:.iV. Eriksrn and Y. 'réh. .Uocation of attention in the visuai fieid. Journal of Erpcnmentul Psychnlogg:
Human Perctplton and Performance. L1:33-59Ï. lM.5.
11. Farah. 1s an object m objecc an object? Cognitive and neuropsycholagicai inwstigations of domain
specificitr. in visuai objmr recognition. Cirrmt Dmetions in P s y d r o l o g d Screncc. 1(5)rL65-L63. 1992,
D. F o ~ y t h and SI. Fleck. Body plans. In P m . rEEE Comp. Soc- Conf. Comp. W. and Patl. k c . . pages
63-683. 1991.
D.H. Fmter and P..\. Ward. .+memetries in aricnted-line detectiou indicare twu orthogond fiIters in earlv
vision. Procedtllqs of the Royal Soncty, 24363-86. 1991.
b-.D. G-Y. C. ralenti. and L StrinatL L o d operators ro dececi regions of interest. Pattena Rrcognrhon
Lctter. 18:IOZ-lm[. L99Ï.
fi. Greenspan. S. Belongie. C. Canon. and J. Malik. Recognition of images in large databases using color and
texcure. CC'PR'Y7. 1997.
H. Greenspan. S. Belongic. P. Perona. R. Goodman. S. Rakshit. and C.H. Anderson. Overcomplete steerable
pyramid filters and rotation invariance. Pmcredings 01 the IEEE Conference on Cornputer Vuron and Pattern
Recognrtron. pages 2 2 - 2 8 . 1993.
W.E.L Griman. The combinatorics of object recognition in cluttered evnimnments using constrained warch.
In P m . O/ the Int. Conf. on Cornp. Vu.. 1988.
R. H d i c k . Statistical aad stmctural approaches to texture. Pmcrcdmgs of the IEEE, 6?786-80.L. 1979.
R. Haraiick. K. Shanmugam. and 1. Dinstein. Tex tud Features for image segmentation. lEEE Tram. on
Systcrn Man and Cykrnctics. 3:610-6'1. 1913.
P. Havaldar. G. Sledioni. and Stein F. Perceptuai grouping for generic recognition. [nt. Journal of Cornp.
Vu . . >O( 112):59-80. 1990.
D. Hearn and !.[.P. Baker. Cornputet gmprlics. Prentice Hall. 2 edition. 1986.
1.11. Hendersan ;inri .A. Ilollingworth. Eye movements during scene viewing: :ln overview. Technical report.
Slichigan statr Ctiiversiry. 1997.
.l.SI. Hendcriwn ancl h. Hollingwunh. Hiqh-lewl scme perception. Annn. Rev. Psychol.. 50:?43-171. 1999.
J.M. Hrnderson. P.A. .Ir. Weeks. and A. H o l l i n ~ r t h . The efects of semanric consistencv un rue mouernenü
during complex xene viewing. Journal of Erpcnmental Paycholqy: Ilumtin Pcrceptron und Prrfonnuncr.
?S:ZLU-28. 1999.
L. Hérault and K. ttoraiid. f igur~ground discriminacion: a cornbinatorial optimizacion approach. lEEE tmna.
on PAMI., l.5( l):89'&I) 1.1. 191)X
1LtV.C;. tiuiit. .\leurunnq coluur. Ellk Honvriod Limited. 2 dition. 1991.
1.. Itti and C . Koch. .\ cornparison of feature cornbinntion ~trategies for sdiency-based visuai attention systerns.
s'PIE Ilumnn Vrsrun and Electronac fmoqmg IV. J m u q 1999.
L. Itti. C. Koch. .md E. Nicbur. .\ modcl of diency-based vistid attention for rapid sccne analysis. l E E E
Tram. un PA Ml. 20( 1 1 ): 12.54-.5'>59. Novernber 19g8.
.\. J a n and C. Hedey. .A multiscaie representation including opponent color features for texture recoqnition.
IEEE Tmrw. of Image Processrng. Ï( 1): 114- i28. 1998.
X.K. Jain .md R.C. Dubes. Algcmthm for clmtcnng date Prentice Hall. inc.. 1988.
:\.K. Jain anr i F. Farrokhnia. Cnsupewised texture segmentation using gabor filtem. Pattern Recopttnn.
24(12):11fi7-118fi. 1991.
LV. James. The pnncrplrr~ O/ psycho&qy. volume 1. H e n ~ Holt k Co.. Yew York. 1890.
J.B. Jones and Palmer L A . An evaluation of the tupdiiensionai gabor filter model of simple receptive fields
in rat striate cnrtex. J. ,VearophyiioL. 58(6):1?33-1258. 1987.
J. Jonidti. Furthcr t o r d a model of the mind's eye's movement. Bulletrn of the Psychonomu Socrety.
?1(4):247-450. 1983.
B. Jiilnz. A brief outline of the texton theory of human vision. %ndr rn Neumicitnce. 7: 41-45. Fèburary
198.4.
B. Julesz. Tnw;ir<is an axioma~ic theory of preattentive vision. In Dynamic Aspeck of Ncacortical Fanctron.
.585-612. Nïlry. 1984.
C . Koch and S. Cllman. Sliifts in selecrive visual attention: Towards the underlying n e u d circuit- In
Mattcrs a/ Intellrgence. pages ILS-L4I. Reidel PubIihing, 1987.
SI. Lades. Face recognition technology. h C.E. Chen, LF. Pau. and P.S.P. Wang, ditom. Handbook of
Pattern Recognrtton and Cornputer Vuion, pages 667-W. World Scientific. 2 edition. 1999.

P. Lambert and T. C m n . S-mbolic fusion of luminancehue-chroma features for region segmentation. Pattern
Recognition. 32: 1857- 1872. 1999.
S. Lavie and J. Driver. On the spatial extent of artenrion in object-based visual selection. Percrptr~n und
Piychophysics. 58: 1'138- 1251. 1996.
K t . Law. Tuture imuge ~ e g m r n t a t i o ~ PhD thesis. University of Southern California. 1980.
T Leung and J Slalik. Detecting. localizing and grouping repeated scene elements from an image. In 4th
Eumpean Conjcrencc on Cornputer L'uion Cambridge. Engfand. Apnl 1996.
F Liu and R.W. Picard. Periodicity. directiondity, and randornnes: Wold features for image rnodeling m d
retneval. IEEE Trnns. on Pattern rlndyiu and Machme IntelIigence. 18(7):22-733. 1996.
D.G. Lowe. Perceptual organuaiion and mual recoqnition. KIuwer academic publwherj. 1983
DA:. Lowe. ïhree-dimensiand objm recogniriun fmm single tw*dimensional images. itrtifinul Intelliyrnce.
$L:.).i.i-395. 1987.
1V.Y. Ma and 8.5. Slanjiinath. Edge How: A lrame wark of boundary detection and t m q e segmentation.
Technical Report 07-02. Cniversity of California Sima Barbara. CA. 1997.
B.S. Slanjtinath u d Nr Y. Ma. Texture features for b m i n g and retriewl of image data. lEEE Tmiu. on
Priltrm Anuly~ta and Machine Intelligence. 18(81:t137-842. L996.
5 . K . .ifanrian. K.H. Ruddock. .uid D.9. Wooiiings. diitornatic control tif saccadic eye movrrrteiiis m d e in
vwuîd ilwpvct~oti nf briefly p r e n i e d 2-d images. Sput. Vis.. 9:36:1-M6. 1995.
5 .K. Slannan. K i t . Ruddock. anci D.S. Woodinp. The reIationship betreen the locations iil ~piiti;il ferrrim
.ind thmie of tixarians made dunng visual examination 01 hnefly presented images. Sput. Via.. lU:165-LYW.
1996.
D. Starr. Visiun: .4 computattonui rnuestigaitun mto the Haman prcsrntation and pmcesstnq of urruul infor-
mation. chiiptrr 1 . page 270. U' H. Freernan and Company. 1982.
D. Starr Vuion: :l computaftonal rnsestiqalion tnto the human mpresentation and pmcssing oj vuuul
tnjormatiun. 1V.H. Frwrnan and Company. 198?.
P StcLeod. .J. Driver. .ind J . Crisp. LÏisual search for conjunctians of movement and form in parailel. .Vaatnn.
:CE: 1.5.I- 15.5. 1988.
R. Stilanese. Dctcctinq jalient regionr in an mage: h m biologicul emdcncc to cornputer implemcntutton.
PhD thesw. Kniversity of Ceneva. Switzerliand. December 1993.
R. SIilaneue. CI. Wechsler. S. Çit. J.M. East. and T. Pun. Integrarion of bottom-up and topdown tues for
visud attention using non-linear relaxation. IEEE. pagei 231-785. 1994.
SI. Miyahara and Y. Ywhida. SIarhernaticaI transformation of (r.g.b) color data to Sfiinsell i E1.V.C) color
data. SPlE Vunul Communicatiuns and image Procesang, lOOl:ô50-637, 1988.
R. !dahm and R. Nevatia. Perceptual organization for scene segmentation and description. LEE& Tmm. un
P.Sdll. 146):61G-6%5. June 1992.
I1.J. Sluller and A. Found. Visuai search [or cunjunctions of motion and formi Display derwity snd asymmety
reversat. Journal of Ezpenmental Psgchol~pj: FIuman Perceplion und Perfannunce. 22(I):I12-132. 1996.
. L M Natif and M.D. Levine. Low level segxuenta~ion: An expert m e m . IEEE 'hm. Pattern Anal. and
Machine lntcll.. 6(5):53>5X. t98-l.
V. Seiwr . Coqnitme psycholqy. Appleton. iiew York. 196'1.
H.C. Nonhdurft. The rote of features in preattentive vision: Cornparisan of orientation. motion. and color
CU*. b'u:on Resuirch 33(14):1937-1958. 1993.

P.P. Ohauian and P.C. Dubes. Performance evaluarion for lour cl- of texturai fearures. Pattern Recagnr-
tiun. 25(6\:8I!kd33. 1992.
T. Ojala. .LI. Pktikainen, and D. H-ad. A comparative study of texture measures wirh classification basmi
rin feariire disttiburions. Pattern Rccognitron LXl(1):51-59, L996.
'ï. Ojale and LI. Pi~tikainen. FlwiupervUed texture segmentation using feacure disrributions. Pattern Rccoq-
nitron. 32.1;;-486. L999.
!Y. Osberger and A.J. SIaeder. .&utornatic identification of perceptually important regions in an image. III
ICPR '98. pages 70 1-70.1. Brisbane, Australia, August 1998.
S.R. Pal ;uid S.K. Pd. :\ review on image segmentation techniques. Pattern Recugnriron. 2(ii.9):l'l77-12W.
1993.
D.K. Pmjrnni and (;. CIeaIcy. Xlarkov randorn fieId models fur uasupenihd segmentation of rexturetl color
irnqes. IEEE Tmni on Putlcm :lnatysw and Machrnc fntellrgenee. 17(10):93~453. L99.5.
T.V Papathutrias. R . 5 h i h i . and A. C a m A human vision based computationai mode1 for çhrornacrc
texture .qreg;ition. IEEE Tmru. un Syslcm Mon and C y k m e t : ~ ~ , '37(3):,12H39. Junr 1997.
S.H. Park. I.D. Min. and S.L. Lee. Calor imagesegmentation based on 3 4 clusrering: hIorphologicd appro~ch.
Pattern Rewynttion. :(LIS): 106 1 - 1076. 1998.
E.J. Paiiivrh .uid (;. Frrrivrix. Finding salient regions in images. Journal of Compulcr Viatun and Imuyr
Irnderrrandtny. T i ( l.?):;R--14.5. LW9.
D.L. Pham ancl J.L. Prince. .\n adaptive f u q c-means algorithm for image segmentation in the presence of
intenait? iiihu~iiugeneities Pattern Remqnt1:un Letitr. 'IO(l):57-68. 1999.
LI. PietikSnen. A. Rosenfeld. and L.S. Davis. Experimenrs with texture ciassification using averiyya of locd
pattern matclles. IEEE Tmna. on Sqstcm Mon and C~&rneiïcs. 13(3):4?t-126. 1983.
S. Pwch .utd D. Schtürrr. P e m p i u d grouping using markov random fielch and me intepation of contaiir
and region information. Technicd Report SFB3oü-TR-98/10. L'niversity of bielefefd. L998.
r-.:\. Poynton. A ttchnrcul tntroducturn fo diqatai mdw. N'de'-, Yew York. 1996.
.I. Pirzich,~ .uid .1.SI. Buhmann. S l u l t k d e mncding for reai-time unsupenrised texture ?iegmentatÏon. In
Prucetdtnip «f the IEEE [nt. Con[. on Lbmp. Crr. 9 6 pages 267-23. P k a t a w y . NJ. CSX. 1498.
T. Randen and J. K w y Filtering for texture classification: A comparative stuay. IEEE ?ianr. on Paltem
: \ndysr~ and Muchinc Intclhgcnce. >l(-I):291-310. 19W.
.LR. Rao and G.L. L o k . Identifying high l m 1 leacures of t e n u r e perception. CVGIP: CmphicaI ModcLr
und lmaye Pnxcsstng. 533):218-233. 1993.
T. Red and J. d u Buf. X review of m e n t t m u r e segmentation 3nd feature exrraccion techniques. CVGIP:
Image Undersianding. .57(3):59'2-d7l. 51- 1993.
D. Reisfeld. tI. Wolfson. and Y. iéshuntn. Concext-free attentional operators: the generalüed symrnetry
rransform. Int. Journal of Comp. VU.. L-L:tI!I-130. 1995.
R.X. Rerwink and .I.T. Enns. Pre-ernption efects in visual search: evidence for lm-Ievei. grouping. P~ycho-
logtcul Rcmcw. 102(1):IOL-130. 1995.
D. Roÿenberg. Monocuiar depth perception for a cornputer vision system. Siasteri thetis. XlcGiU L'niversity.
September 1981.
I..L Rybak. Y 1. Gusakova. Li'. Golovan. L.Y. Podladchiko~, and Y..L Shevmra. A mode1 of attention-
guided visual perception and recognition. h i o m Ra.. J8:2357400. August 1998.
S. Santini and R. J a n . Similari- rneasures. IEEE %m. on Pattmr Analysu and iifachtne Intelltgence.
11(9):871-883. 1999.
S. Sarkar and K.L. Boyer. Perceptual oqanization in cornputer vision: A review and a proposai for a classi-
ficatory structure. IEEE Tmn. on SMC. 23(2):352-399. 1993.
S. Sarkar and K.L. Boyer. A cornputarionai structure for preattentive perceptual organization: Graphicd
eniimerarion and vilring merhotis. IEEE %M. on SMC. ?4(2):?16-267. Febmary 1994.
D. Schlüter and Poseh S. Comhining contour and region information for perceptud grouping. In Pmceedrngd
20. D.4C:M-Symposturn. pages 393-401. Slustererkennmu, 1998.
(;. Srla rnri SI.1). Levine. Heal-tirnr attention for robotic vision. Rrnl-timr Imapng, 3173- 194. 1997
J . Shi .inri J . XIdik. ?iomdizett cuts and i m q r segmentation. In Proc. I J / the IEEE L'onf. on C'omp. Vi.iton
mrl Puttcm Rrcoynition. San Juan. Puerto Rico. l u n e 1997.
J. Shi and J . Mrilik. Self inducing mlaional distance and its application to image segmentation. I n 5th
Europcan Con/errncr un Cornputer Vitam June 1998.
B.LV. cjilverman. Den~rty esfrrnatton for diatutics and data analysu. Chapman and Hall. ?iew York. 1986.
G.11. Smith. Image tez tun unalysu umq tcm nnssmgs rnformatton PhD thesis. The Cnivrnity af Queens
Land. 1998.
.J.R. Smith. Intetp~tcd qmtrai and feuturc m q e qs tem: RefnuaL analfiru. und compression. PhD thais .
<'~~liimbiii i.nrvrrsitv. F e b n i q 1997
J.R. Smith .uid ('.S. Li. [mage classification arid querying using cornpusite region remplarcs. CIJmputrr Vtston
and Imuyri l!ndrr.rtanding. X( 1): 1fi.i- 174. 1999.
SI. 5p;rnn. Figure, groiind separaiion using stochasric pyramid relinking. Pattern Recognrtron. L4( 1U):r)!J3
100'1. Inni.
P.F.XI. cjtdnieier and SI.51. ~ l r Weert. Large color differences and selectiw attention. J. Opt. SM. Am. A.
3(1):2:r-247. 19!)1.
11. Stokrs. XI. .inderson. 5. Chanilrasekas. and R. ?.lotta. .i standard defarrlt color space for the internet-srgb.
h t t p : ~ www.w:~.or~;Craphics/CoIor/sRGB.hcmI. 1999.
J. Strand and T . T,axt. Local frequency f e a t u m for texture ciimsification. Pattcrn Rrcq)nifton. 27(10):1397-
1.106. 1994.
k1. Tamiira. ci. \lori. and l. Y u n a d i . Tenural features cormponding to vkud perception. IEEE Tmns.
on Systcm Man und cybrnrettw. rl:.ltïû--173. 1471.
J. Theeuwes. Perceptuai selcxtivity for cofor and rom. Perceplwn and psgchaphyms. 51(6):599-606. 1992.
D. Travis. Efecttoe coior Juplays. Xcadernic Press. London. 1991.
.%.1I. Treisman. The mle of attention in o b j m perception. In O.J. Braddick and A C . Sleigh. editors. P m . of
Royal S m r t y Int. S~ymp. un Phystcal a d Biologtaf Pmccrsanq uf Images. pages 316-325. Yew York. 1983.
Spnnger.
Treisman. Preattentive processing in vision. Cornputer Visioir. Gmphics. and Image Processmg, 31:156-
1 7 . 1985.
X.11. Treisman. Ratures and abjects: n e founeenth barlett mernoriai lecture. Qnarteriy JournaI of Etper-
[mental P.~ycholoqy. -1Oa:2OL-237. 1988.

REFEREN CES
A.M. Treisman. P. Cavanagh, B. Fisher. V.S. Ramadiandran. and R. van der Heydt. Form perception and
st ten~ion. In Vasual perception: The nenrophy~ologacal foarndafwnr. Xcadernic Press. New York. t990.
:\.SE. Treisman and G. Gelade. ..\ feature-integrarion theory of attention. Cognalive Psychology, 12:47-136.
1980.
A.51. Treisman and S. Gormican. Feature analysis rn early vision: Evidence from search asymmetries. Psy-
chological Review. 9.5: 15-48. 1988.
;\.SI. Treismim and R Paterson. Emergcnt feature. attention and object perception. Journal of Erpcmnrnial
Pqchology: Human Pemepl~on un3 Perfonnance. 10:11-31. 198.1.
Y. Tsal and N. Lavie. Locarion domination in attending to color and shape. Journal of Erpcnmental Psy-
çhology: Human Perceplia und Performance. 19 1x1 - 138. 1993.
J.K. Twtws. S.SI Culhane. l ' .K. Wai, ?i. Lai 'iuzhong. Davis. and F. Nuflo. Modeling visud attention r ia
4 x t i v i ? timing. .Artaficiul Intellrgencr.. 78:.507-545. 1995.
SI. T i i c e ~ a n and :\.K. J a n . Texture segmentation using voronoi polygow. IEEE Tmrw. on Pattern :tndyau
and Machine Intelligence. 12:- I l --116. 19110.
11. ~IICF- m d ,\.K. Jain. Texrtire iuralpis. In Ç.Cl. Chen. L.F. Pau. and P.S.P. LVJng, di tors . I i~~ndlwoh
,JI pilrrn rrclwptlaun. 2. page 207-248. kVorltl Scientific. 19911.
i I'llrnan. iliqh-leuel iiuion. Ohject recqn;linn und urdual ctynrtion. rhapter 8 . pages 251-235. The lllT
Press. !9!Jt3.
1.. u n Cool. P. Dewiiel. .md A. Ostcrlinck. 'hxttirc analpis imno 1983. Compuicr Vuaon Grnphtcs und Imaqc
P n ~ e m n g . 23:33l%:1.57. 1985.
K.F. Can Orden. Retlundant iiyc of luminance and Rayhing with shape and color ay htghlighting çutlts in
symbolic displays. Human Foctor~, 35(?): 1 4 - 160, 1993.
J.J. Vos. O. Estéva. and P.L. \Wraven. lrnproved color fundamentals offer a new view un ptiotornetric
.uic!itiuity. V~qron Rescamh. :10:336-943. 1990.
H. Wechsler. Texture analysis - a SUN- Signal Pn>ccs~mg. 2:271-281. 1980.
E. Wichseigarrner mcf G . dperling. Dynamics *iI automatic and contmlled visuai attention. s'crence. pages
78-230. 1987.
SI. Wertheimer. Expertmentelle stiidien üiber des sehen von bewegung. % a b . f. Psychol.. 6l:lfil-265. 1912.
SI. Wertheimer. Pnncaples of p m p f u a l organaznfaoa Princeton. N.J.. 1958.
J . LVeszk C. Dyer. and .A. Rwnfeld. .A comparative study of texture measures for terrain classificarion.
IEEE Tram. en S~s t cmr Man und Cybemetrw. 6267-35. 1976.
C.D. Wickens. Engtnemng Psychology and Human Perfonnance. ElarperCollins Publihers Inc.. Sew York-
2 dit ion. 1991.
P.S. Williams and 5I.D. Alder. Segmentarion of narural images using hierarchical and syntactic rnrthods. I I I
Second Infamutroncil CVorhhop on Statdicai Technrques in Pattern Recognttron. August 1998.
J.M. Wolfe. Extending guideci seardi: N I y guided search needs a preattentive 'item map*. In Cmnerpnq
opcmliorw an the dady of a u ~ f selcrttm attcntron. pages 747-27û. hrnerirran Psychological .&ociation,
Uashingon. DC. 1996-
J.M. Wolfe. dttcntrm. chaprer 1. Psycbology Press, 1998.
G . W y e c k i and W.S. Stiles. Colm science: Conœpk and metliods, paantitaiitre data and formulac. .A
Wiley-Interscience Publication. 2 edition. 1982.

REFERENCES
1 4 C.T. Zahn. Craph-theoretical rnethods for detming and describig gestalt clusten. IEEE h m . on Comp..
?O( 1 ):68-86. 1971.
jl-19j Y J . Zhang. A survey of rmLuarion rnethods for image segmentation. Pattern Rccognitton. 29(8). 1335-1549
1996.
:15O] S.C. Zhu and A. bi l le . Region cornpecition: Cnifying snakes, region grawng, and bayeslrndl for rnultiband
image segmentation. IEEE Tmru. on Pattcrn Anuiysu and Machne In~ell~gmce. 19(9):88.1-900. 1996.
-1.51; S.W. Zucker. Toward s low-tevel description of dot clusten: labeting edge. interior. and noise points. IEEE
Pmerdinqs. pages 213-233. 1974.