anticipating real estate capital markets downturns ... the capital market cycle. anticipating real...
TRANSCRIPT

1 LaSalle Investment Management | Research & Strategy
Research & Strategy
We provide a simple framework for collating the best leading indicators of the Capital Market cycle.
Anticipating Real Estate Capital Markets Downturns LaSalle’s 2015 Investment Strategy Annual (ISA) focuses closely on cycles; we delineate
the different cycles that impact real estate (RE) returns, estimate where we are in those
cycles, and propose strategic and tactical actions to take in response. The three most
important cycles that we analyze relate to the economy, real estate markets, and capital
markets.
This paper expands the note on tracking and more importantly anticipating capital
markets in Chapter 4 of the 2015 ISA. We discuss the importance of capital markets for
real estate investing, identify tools and techniques for tracking capital markets across the
globe, and provide a simple framework for collating the best leading indications of the
next turning point in the current cycle in the three regions where we are most active:
North America, Europe, and Asia-Pacific.
Real estate capital markets are notorious for “animal spirits” driving booms that run for
years followed by sudden busts. A recent report from the World Economic Forum (WEF)
on this topic highlights how challenging it can be for governments, regulators, central
banks, and private market participants to predict and manage the real estate downturns1.
The WEF report highlights areas to look for signals but does not fully provide the
guidelines and tools to help anticipate a real estate downturn, which is the focus of this
paper.
Capital markets data is also generally very noisy. A 3% decline in stock prices or a 20
bps increase in interest rates could be the first sign of an inflection point, or it could
simply be reversed the next day. Separating signals from noise is challenging both for
high frequency public market data as well as less frequent private real estate market
information.
After reviewing prior studies and testing potential indicators for their ability to track
markets and anticipate changes in market conditions, we identify three key areas that are
likely to provide advance signals:
1. Real estate supply / demand: What are likely future economic conditions and
how do they affect demand for real estate? What are real estate occupancy rates
and the level of supply response?
2. Debt / Equity flows and terms: Is bank lending conservative or aggressive? Are
banks still in good health? Is securitization (CMBS, RMBS, etc.) contributing to
the debt /equity imbalance? Are loans being repaid in a timely manner?
1 Emerging Horizons in Real Estate. An Industry Initiative on Asset Price Dynamics, Profiles,
Prescriptions and Proposals, World Economic Forum, January 2015.
2 LaSalle Investment Management | Research & Strategy
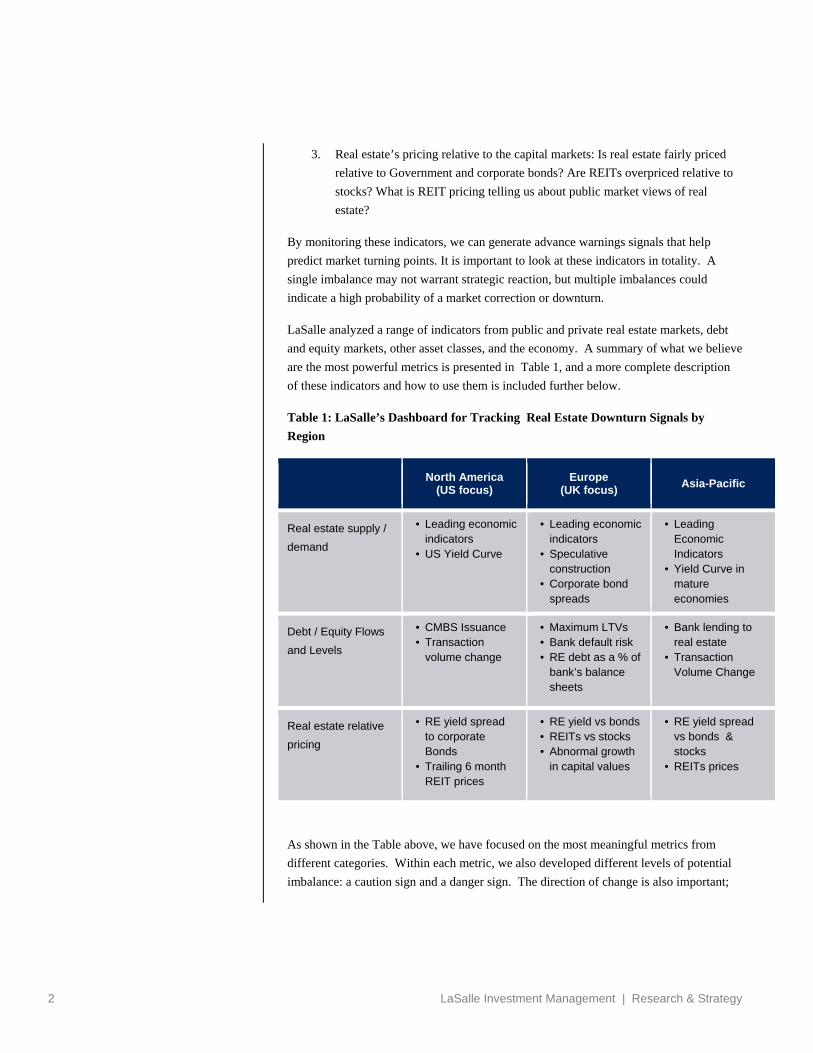
3. Real estate’s pricing relative to the capital markets: Is real estate fairly priced
relative to Government and corporate bonds? Are REITs overpriced relative to
stocks? What is REIT pricing telling us about public market views of real
estate?
By monitoring these indicators, we can generate advance warnings signals that help
predict market turning points. It is important to look at these indicators in totality. A
single imbalance may not warrant strategic reaction, but multiple imbalances could
indicate a high probability of a market correction or downturn.
LaSalle analyzed a range of indicators from public and private real estate markets, debt
and equity markets, other asset classes, and the economy. A summary of what we believe
are the most powerful metrics is presented in Table 1, and a more complete description
of these indicators and how to use them is included further below.
Table 1: LaSalle’s Dashboard for Tracking Real Estate Downturn Signals by
Region
North America
(US focus) Europe
(UK focus) Asia-Pacific
Real estate supply /
demand
• Leading economic indicators
• US Yield Curve
• Leading economic indicators
• Speculative construction
• Corporate bond spreads
• Leading Economic Indicators
• Yield Curve in mature economies
Debt / Equity Flows
and Levels
• CMBS Issuance • Transaction
volume change
• Maximum LTVs • Bank default risk • RE debt as a % of
bank’s balance sheets
• Bank lending to real estate
• Transaction Volume Change
Real estate relative
pricing
• RE yield spread to corporate Bonds
• Trailing 6 month REIT prices
• RE yield vs bonds • REITs vs stocks • Abnormal growth
in capital values
• RE yield spread vs bonds & stocks
• REITs prices
As shown in the Table above, we have focused on the most meaningful metrics from
different categories. Within each metric, we also developed different levels of potential
imbalance: a caution sign and a danger sign. The direction of change is also important;

3 LaSalle Investment Management | Research & Strategy
an indicator in the caution range might be worrying, but could also be a sign of comfort if
it was recently in the danger zone. Importantly, we recognize that careful tracking of
potential warning signs will rarely provide an unambiguous advanced signal of a turning
point. Clear, objective consideration and analysis of the data and market context is still
needed before actionable conclusions should be drawn.
North America Capital Market Indicators We have identified indicators for the US and Canada, both of which have broad and deep
historical data. The following discussion focuses on the indicators for the US, as it is the
largest and most important market for global real estate investors.
Real estate supply / demand imbalance
o Leading Economic indicators – This is a basket of economic indicators
designed to predict future economic conditions, including downturns. A two
month decline in this index indicates a cautionary note for real estate
fundamentals and capital markets, while four months of decline is a danger
sign.
o Yield Curve – The yield curve has been a reliable indicator of economic risk,
which often drives negative capital market conditions. A negative spread
between the 10 year note and the 3 month bill is a good indicator of future GDP
declines.
Debt / Equity imbalance
o CMBS Issuance – Commercial Mortgage Backed Securities are one of the
major avenues for debt financing for real estate. Issuance of CMBS bonds
responds quickly to investor sentiment. We track the change in trailing 3 month
issuance, with two consecutive months of declines indicating caution.
o Real Estate Transaction Volume Growth – The year on year change in the
trailing three month transaction volume is a good indicator of investor
sentiment. One month of decline indicates caution while two consecutive
months of decline or a 10% decline indicates a danger signal.
Real estate relative pricing imbalance
o Pricing Relative to Corporate Bonds –Baa Corporate bonds have a similar
risk profile to core real estate income risk. The spread between the trailing
NCREIF income yield and the Baa yield is a good indicator of relative pricing.
A negative spread (real estate yields lower than bond yields) has reliably
preceded real estate downturns, but sometimes precedes the downturn by
several years.

4 LaSalle Investment Management | Research & Strategy
Current signals suggest capital
markets are mid-cycle in the US.
o REIT Pricing – A 10% decline in the trailing 6 month trailing average
indicates a significant shift in investor expectations regarding commercial real
estate and a likely downturn in private real estate values.
US Capital Market Indicators
Figure 1: Key Capital Markets Indicators Dashboard
As of 22 January 2015
Figure 2a and 2b: Capital Markets Indicators Transaction Volumes Healthy, NPI Income Spread to Baa Above Historic Avg.
Figure 2a: Real Estate Transaction Volume Change
As of 23 January 2015 Source: Real Capital Analytics, NCREIF, Bloomberg
The year-over-year growth in real estate transaction volumes, shown above on a trailing
3-month basis, has slowed from the dramatic rebound in 2010-2011. It remains modestly
positive, consistent with capital markets that are mid-cycle.

5 LaSalle Investment Management | Research & Strategy
Current Signal: Positive. Monthly volumes are in-line with 2005 volumes, and still
below highs reached in 2007.
Figure 2b: NCREIF Income Yield Spread to Corp. Baa
As of 23 January 2015 Source: Real Capital Analytics, NCREIF, Bloomberg
The spread of 3Q trailing-year NPI income yields to Baa corporate bond yields was 67
bps as of December 31, 2014. This is above 15-year average spread of 29 bps, leaving
room for compression of the spread in the event that interest rates move up.
Current Signal: Positive. However, interest rates are historically low and a rapid
upward movement in rates could impact real estate values.
Figure 3a and 3b: Capital Markets Indicators REIT Prices and CMBS Issuance on Upward Trend
Figure 3a: US Equity REIT Prices
As of 23 January 2015 Source: Bloomberg, CMA Alert
6 LaSalle Investment Management | Research & Strategy
US REIT prices have historically been a leading indicator of private markets. This is a
volatile indicator, influenced by interest rate movements, and the modest dips in the 6-
month moving average in late 2011 and 2013 did not translate into a property market
downturn. A decline greater than 10% would signal a shift in the market.
Current Signal: Positive. Prices have already recovered after a 6.5% decline in
September.
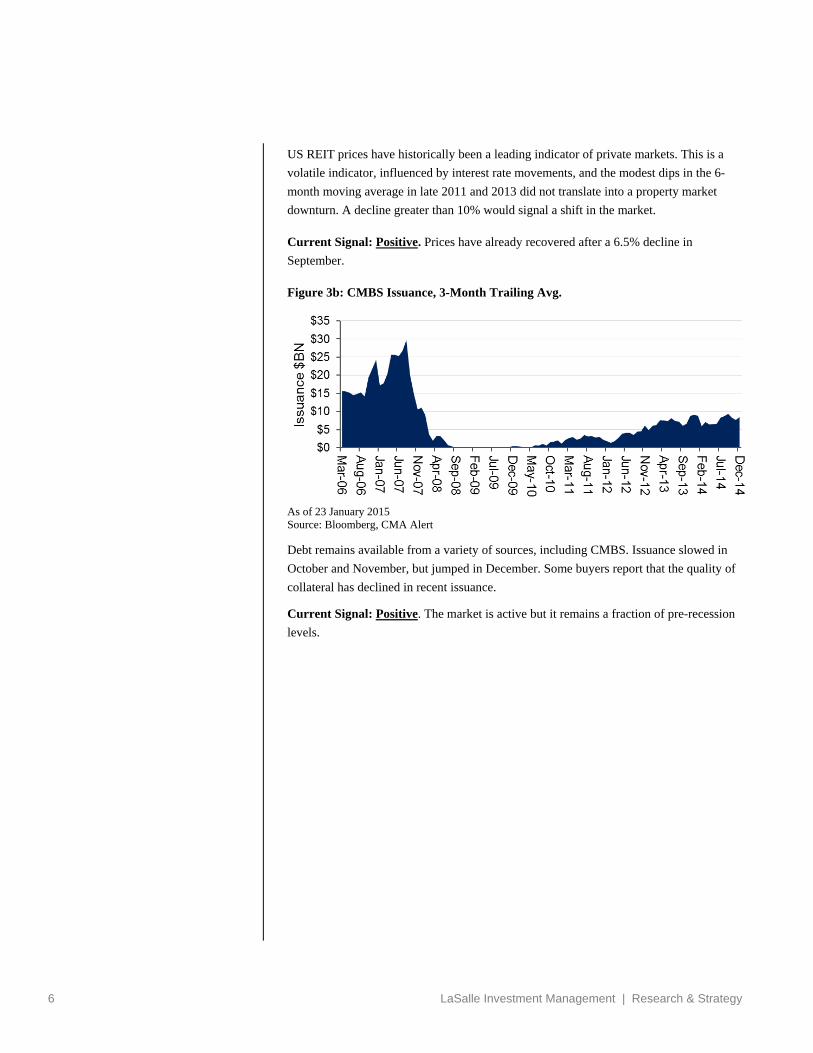
Figure 3b: CMBS Issuance, 3-Month Trailing Avg.
As of 23 January 2015 Source: Bloomberg, CMA Alert
Debt remains available from a variety of sources, including CMBS. Issuance slowed in
October and November, but jumped in December. Some buyers report that the quality of
collateral has declined in recent issuance.
Current Signal: Positive. The market is active but it remains a fraction of pre-recession
levels.

7 LaSalle Investment Management | Research & Strategy
Figure 4a and 4b: Leading Economic Indicators Yield Curve and Other Leading Indicators are Positive
Figure 4a: Yield Spreads of 10Y to 3-Month Treasuries
As of 23 January 2015 Source: Bloomberg, The Conference Board
All six recessions since 1968 have been preceded by at least 3 consecutive months of
negative spreads (average yields for the month) in the 12 months before the start of the
recessions. During this same period, this measure has produced no false positives.
Current Signal: Positive. Spreads have been consistently positive since mid-2006.
Figure 4b: Leading Economic Indicators Index
As of 23 January 2015 Source: Bloomberg, The Conference Board
The Leading Economic Indicators Index (LEI) is a composite economic index of 10
leading economic indicators. It is constructed to summarize and reveal turning points in
the business cycle while removing the volatility of individual indicators.
Current Signal: Positive. It has been positive or stable 20 of the past 21 months.
8 LaSalle Investment Management | Research & Strategy
European Capital Market Indicators
Europe is a large region with diverse real estate markets. The UK capital market cycle
has reliably been 6 to 12 months ahead of other European markets. Rather than focus
simultaneously on all European countries, we advocate tracking the UK economy and
market, given the depth and long dated time series as well as the maturity and liquidity of
its markets. However, it is perfectly feasible to extend the signals discussed below to
other European markets.
Real estate supply / demand imbalance
o Leading Economic indicators – The Composite PMI index has historically
been a good predictor of UK GDP recession risk. During the last recession this
indicator provided a clear signal in late 2007.
o BBB Corporate health check - We use corporate bond spreads: this is the
spread of BBB corporate bond yields to that of AAA rated companies. This
metric captures the ability of the average UK corporate to access affordable
credit and make real estate occupancy decisions. During the previous crisis this
delivered a clear risk signal as early as September 2007.
o Oversupply risk - This is a pure real estate signal. Here we track and monitor
the extent of speculative completions in London as a warning sign of an
overheating market. Over the past three cycles, a market downturn followed
immediately after a period where speculative developments have exceeded the
long run average for 18-24 months.
Debt / Equity Imbalance
o Over stretched Loan to Value (LTV) Ratios - Maximum loan to value ratios
for core property are used to measure whether lending conditions have become
too lax. LTV levels tend to increase with overall market confidence and lender
competition. Pre-GFC it was not uncommon for these levels to reach 80-90%
in many European markets. LTV levels above 80% are considered warning
signs.
o Banking system’s exposure to CRE loans - The overall exposure of the UK
banking system to commercial property loans is a good indicator of an
overheating market if banks’ exposure surpass the 9-10% mark (it reached 9%
in 1991 and 10% in 2005). The current reading of this ratio is 8.8%.
o Bank default risk- Traded Credit Default Swaps (CDS) have proven to be
good indicators of bank stress and predictors of distress and credit tightening. A
significant and persistent spike such as the one witnessed in July 2007 is a
useful early indicator.

9 LaSalle Investment Management | Research & Strategy
But 4 out of 9 indicators have turned
to “Caution” for the UK.
Real estate relative pricing imbalance
o Real estate yields spread to government bonds – This metric is the difference
between average UK property yields and the 10-year Gilt yield. A spread falling
durably below its long term average of 190bps calls for caution.
o REITs versus equities (REITs Dividend vs Stocks’ yield spread). A negative
spread between UK REIT and UK equities dividend yields (normally positive)
is a signal that REITs may be overheating. During the last downturn this signal
set off alarm bells throughout the year 2007 as the spread thinned towards zero
and even turned negative in March 2008.
o Three-year IPD Real Capital Growth: This is signal is somewhat chartist in
its approach but over the past three cycles in the UK (i.e. since 1971) two or
three successive years of 6%+ real capital appreciation at an all-property level
in the UK has systematically led to a market correction. For the time being we
have one such year: 2014 with an 11% real capital growth.
Illustrations for Europe Figure 5: LaSalle Risk Dashboard*: Capital Markets in Check
Goal: Monitor leading indicators of capital market inflection points (UK focused here)
* We use a variety of indicators with many in the UK as the regional leading indicator. We monitor three market imbalances. Any two in “Danger” zone implies imminent (6-12 months) downturn Source: LaSalle (12/14)

10 LaSalle Investment Management | Research & Strategy
Figure 6: Supply / Demand Imbalance Concerns over economic outlook not reflected in construction levels
Source: JLL / LaSalle (10/14) / OECD / DataStream Figure 7: Debt / Equity Imbalance Stability returning to lending conditions but LTVs rising
Source: Bank of England, Capital Economics / DeMontfort UK Commercial Property Lending Market Year-End 2013 (2014)/ Bloomberg / LaSalle

11 LaSalle Investment Management | Research & Strategy
Figure 8: Pricing Imbalance Scope for further yield compression
Source: Bloomberg / IPD / ONS / DataStream
Selection of Two Key Indicators for Europe Figure 9: London/SE Office Completions (000sqm) Watch for: Overall completion levels as well as % spec

12 LaSalle Investment Management | Research & Strategy
Figure 10: Property Correction Trigger: UK Real Capital Growth (%) Watch for: two consecutive yrs of 6%+ real capital growth
Source: IPD
Asia Pacific Capital Market Indicators The economies and financial markets of the Asia Pacific region, while closely linked, are
also heterogeneous and at different stages of evolution. While similar drivers such as
debt, credit spreads, and REIT pricing are reputed as valuable leading indicators, there is
no single set of financial markets data that are fit for all purposes. Furthermore, while
data transparency and availability is rapidly improving, time series for many indicators
are still relatively short, covering at best two real estate cycles. The exception is
Australia, where long time series permit meaningful cyclical analysis. Nevertheless, we
have sought to track a suite of indicators for Australia, China, and Japan that are
indicative of turning points in financial markets and are roughly comparable to what is
tracked elsewhere. The sources and perhaps the indicators themselves will change as data
availability improves and local capital markets deepen and broaden.
Real estate supply / demand imbalance
o Leading Economic indicators – The Composite Leading Indicators Index
(CLI) is designed to provide early signals of turning points in business cycles by
comparing current economic momentum to long-term trends. These indices,
calculated by the OECD, are some of the longest available time series of
monthly economic data for Asia, and allow comparison to previous downturns
in 2009, 2001, 1998, and 1990. The warning threshold is when the index is
below long-term trend and falling.

13 LaSalle Investment Management | Research & Strategy
o Yield Curve – In mature economies, short-term rates that are higher than long-
term rates are a good indicator of imminent economic recession. This indicator
is less reliable for emerging or state-directed economies such as China.
Debt / Equity imbalance
o Bank Lending to Real Estate – Historically, growth in lending has nearly
always been a medium- to long-term precursor to property sector overheating
and correction. Heightened debt flows can last for several years prior to any
turning point. We monitor for consecutive quarters with rates of growth
comparable to the 2006-06 boom, that is in excess of 15% y/y in China or
Australia or 5% in Japan.
o Real Estate Transaction Volume Growth – There is limited data available on
a national basis prior to the GFC outside of Australia and China’s evolving and
non-transparent land transaction driven market is difficult to assess historically.
Large declines in monthly transaction volumes could be potential warning signs
of emerging stress in a market.
Real estate relative pricing imbalance
o REIT Pricing – The REIT markets in Australia and Japan are deep and liquid,
though their volatility is linked to broader equity markets. Furthermore, the
externally managed sponsor structure in Japan can be distortive to value relative
to fundaments. China has not yet passed REIT legislation, but Hong Kong and
Singapore have listed REITs with exclusively Chinese exposure. These can be
tracked as a proxy. For ease of comparison we have adopted a similar measure
to the US: a trailing 6 month price change and a 10% decline threshold.
o Real Estate Pricing Relative to Corporate Bonds –For each market we have
sought to use a cap rate based on in-pace NOI, though sources differ. For
Australia and Japan, we use the IPD All Property Index while China yields are
based on the Shanghai Overall CBD Office Index. This is then compared to a
low investment grade bond yield index, sourced from Bank of America Merrill
Lynch. The depth of country’s corporate bond markets differ – China’s is just
emerging. The comparison threshold is the long term average, but this also
varies due to data availability: Australia from 1996, Japan from 2002, and
China from 2004+.
14 LaSalle Investment Management | Research & Strategy
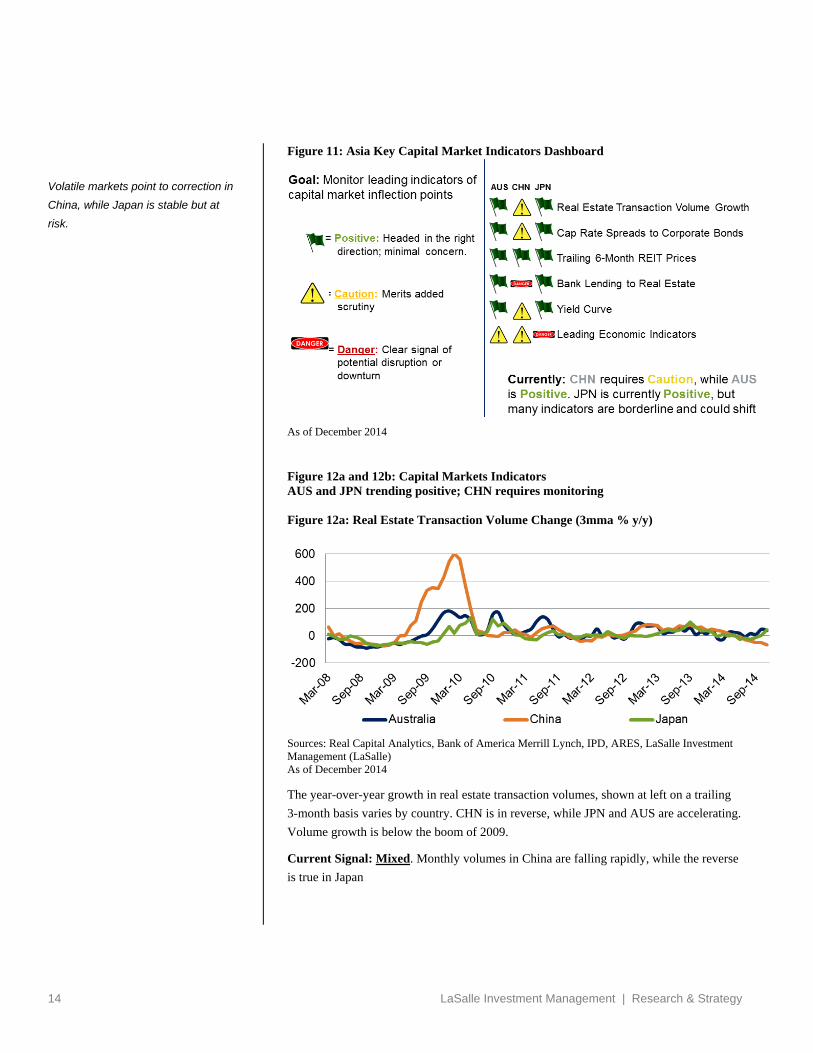
Volatile markets point to correction in
China, while Japan is stable but at
risk.
Figure 11: Asia Key Capital Market Indicators Dashboard
As of December 2014
Figure 12a and 12b: Capital Markets Indicators AUS and JPN trending positive; CHN requires monitoring Figure 12a: Real Estate Transaction Volume Change (3mma % y/y)
Sources: Real Capital Analytics, Bank of America Merrill Lynch, IPD, ARES, LaSalle Investment Management (LaSalle) As of December 2014
The year-over-year growth in real estate transaction volumes, shown at left on a trailing
3-month basis varies by country. CHN is in reverse, while JPN and AUS are accelerating.
Volume growth is below the boom of 2009.
Current Signal: Mixed. Monthly volumes in China are falling rapidly, while the reverse
is true in Japan

15 LaSalle Investment Management | Research & Strategy
Figure 12b: All Property Cap Rate Spread* to Corp. Bonds (bps)
*In each case we have sought to use a cap rate based on in-pace NOI, though sources differ. Australia and Japan are All Property while China is specifically Shanghai Overall CBD Office. Also, time series differ, Japan (2002+), Australia (1996+), and China (2004+) Sources: Real Capital Analytics, Bank of America Merrill Lynch, IPD, ARES, LaSalle Investment Management (LaSalle) As of December 2014
In Q3, the spread of cap rates to corporate bond yields in AUS was 298bps and in JPN
457bps, the former well above its long term average and the latter in line. In CHN, the
spread for Shanghai office income yields was -159bps, well below its long-term average.
A short time series and single city/sector diminishes the impact of this variable.
Current Signal: Positive, though CHN needs monitoring. Also, interests rates are
historically low and a rapid move up could impact real estate values.
16 LaSalle Investment Management | Research & Strategy
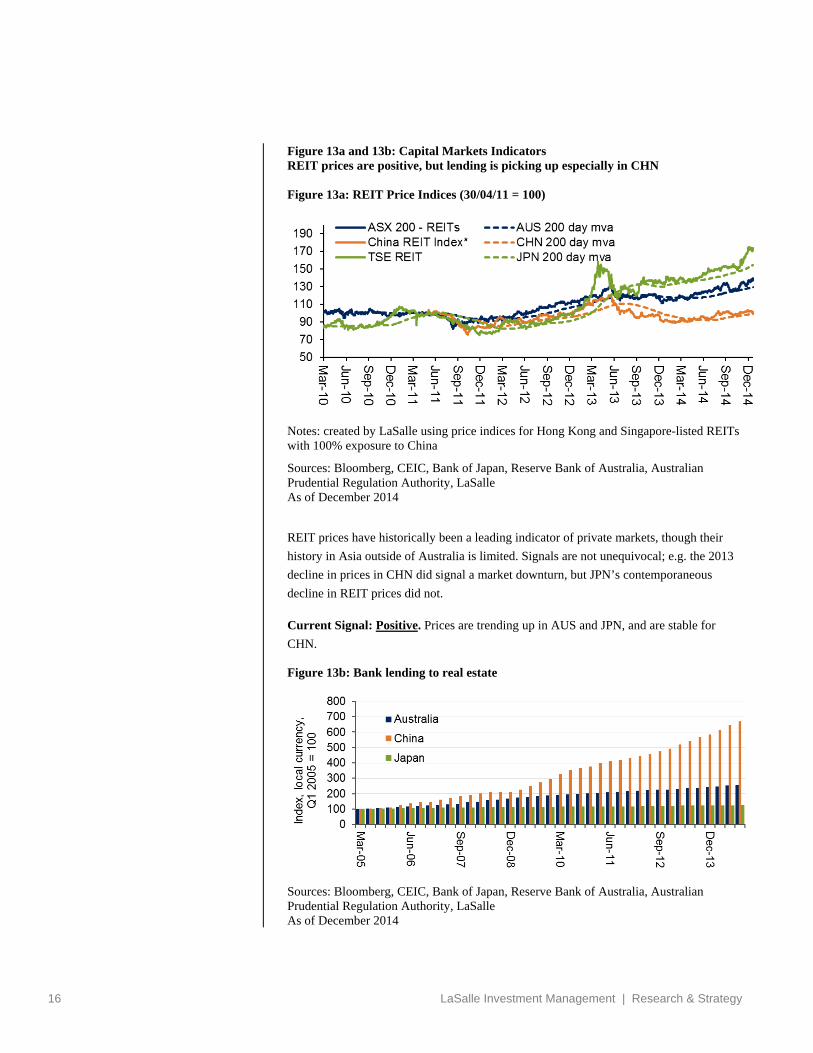
Figure 13a and 13b: Capital Markets Indicators REIT prices are positive, but lending is picking up especially in CHN Figure 13a: REIT Price Indices (30/04/11 = 100)
Notes: created by LaSalle using price indices for Hong Kong and Singapore-listed REITs with 100% exposure to China
Sources: Bloomberg, CEIC, Bank of Japan, Reserve Bank of Australia, Australian Prudential Regulation Authority, LaSalle As of December 2014
REIT prices have historically been a leading indicator of private markets, though their
history in Asia outside of Australia is limited. Signals are not unequivocal; e.g. the 2013
decline in prices in CHN did signal a market downturn, but JPN’s contemporaneous
decline in REIT prices did not.
Current Signal: Positive. Prices are trending up in AUS and JPN, and are stable for
CHN.
Figure 13b: Bank lending to real estate
Sources: Bloomberg, CEIC, Bank of Japan, Reserve Bank of Australia, Australian Prudential Regulation Authority, LaSalle As of December 2014
17 LaSalle Investment Management | Research & Strategy
Lending to real estate remains readily available through a variety of channels, with banks
increasingly competitive across the region.
Current Signal: Mixed. In AUS and JPN, lending growth is up but is still less than half
the rate of the 2007/08 boom. In CHN, the quantum of debt is a major worry. And,
although the rate of gain slowed in 2012, it has re-accelerated in 2014.
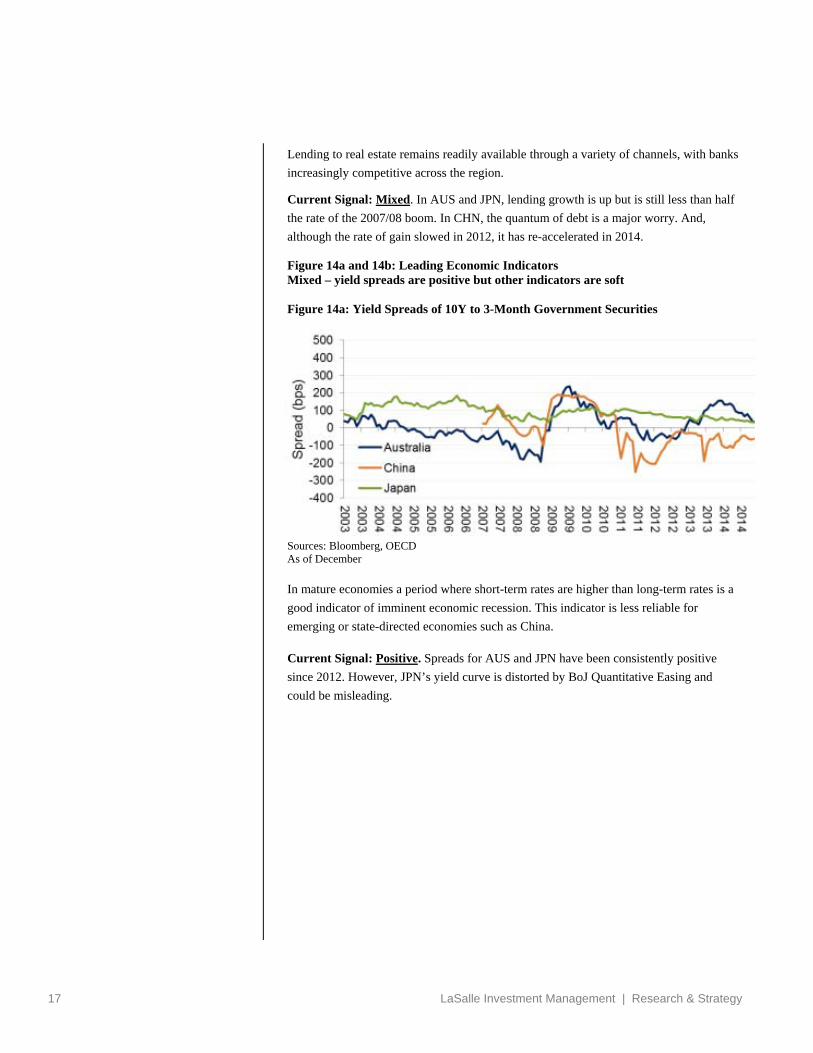
Figure 14a and 14b: Leading Economic Indicators Mixed – yield spreads are positive but other indicators are soft Figure 14a: Yield Spreads of 10Y to 3-Month Government Securities
Sources: Bloomberg, OECD As of December
In mature economies a period where short-term rates are higher than long-term rates is a
good indicator of imminent economic recession. This indicator is less reliable for
emerging or state-directed economies such as China.
Current Signal: Positive. Spreads for AUS and JPN have been consistently positive
since 2012. However, JPN’s yield curve is distorted by BoJ Quantitative Easing and
could be misleading.

18 LaSalle Investment Management | Research & Strategy
Figure 14b: Leading Economic Indicators Index
Sources: Bloomberg, OECD As of December
The Composite Leading Indicators Index (CLI) is designed to provide early signals of
turning points in business cycles by comparing current economic momentum to long-
term trends.
Current Signal: Caution. All major economies are below long-term trend; however,
while AUS and CHN are recovering momentum, JPN is still trending downward.
Overall there are a few conclusions to be drawn from tracking and trying to predict
capital markets swings:
Identifying reliable signals for capital markets and calibrating the appropriate
thresholds for what is considered ‘risky’ versus ‘normal’ is not an exact science.
Historical analysis shows that the trigger for the repricing of risk differs nearly every
cycle, meaning that an unequivocal ‘sell’ signal is unlikely for an illiquid asset class
such as real estate.
We also acknowledge that even if these tools can predict the cycle inflection point
correctly and sufficiently well in advance, it can be difficult to execute a major
portfolio adjustment given the relatively illiquidity of real estate. Indeed, building a
high quality real estate portfolio often takes many years and a wholesale exiting of
that portfolio can be counter-productive.
However, for real estate investors these signals can help position portfolios
defensively early enough in the cycle, by selling weak assets early in an overheating
market, avoiding high leveraged positions, and focusing on high quality assets which
traditionally perform well in market downturns.

19 LaSalle Investment Management | Research & Strategy
As we start 2015, we are carefully watching for signs of changes in the real estate market.
As of Q1 2015, our signals are still globally “green” -- we are not seeing signs of a major
downturn or market correction in any of the three regions we monitor. As discussed, for
core benchmark driven investors, early warning signals would provide the opportunity to
shift portfolios to a more defensive orientation by scaling back various risk positions,
reducing leverage, and selling weaker assets. For closed–end funds and other absolute
return strategies, warning indicators can be both buy and sell signals, and could have an
outsized impact on risk-adjusted returns as timing is central to fund/portfolio
performance.
The dramatic collapse of credit markets during the 2007-2009 Global Financial Crisis
also plays a big role in our thinking. To summarize these lessons:
1. Capital markets around the world are interconnected. Systemic risks can occur when
poor credit decisions in one country affect the investment portfolios of financial
institutions in distant countries.
2. Financial innovation outstrips regulators’ ability to track and manage new financial
products.
3. Intermediary behavior (originate to distribute) creates mis-alignments between the
creators of financial products and the investors in these products.
4. Rating agencies and securities analysts are also under constant pressure to support
these financial innovations, rather than to be skeptical or critical of them.
5. The speed of trading in the securities markets and the currency markets today is
unlike that of any previous era in financial history. Transmission of crises from one
market to another and other “contagion” effects are present in the capital markets to
a degree that adds volatility and unpredictability to already-volatile capital markets
tendencies.

20 LaSalle Investment Management | Research & Strategy
Authors and Contributors
Jacques Gordon
Global Strategist
Paul Guest
Head of Asia-Pacific Strategy, Singapore
Richard Kleinman
Managing Director, Chicago
Bill Maher
Head of North America Strategy, Baltimore
Mahdi Mokrane
Head of European Strategy, London
This information is intended to assist professional investors in deciding whether they wish to
consider the investment further. This publication does not constitute an offer to sell, or the
solicitation of an offer to buy, any securities or any interests in investment funds sponsored by,
or the advisory services of, LaSalle Investment Management and is subject to correction,
completion and amendment without notice. Any such offer, if made, will only be made by means
of a confidential prospectus. The prospectus will include information regarding investment risk
and investors should have the financial ability and willingness to accept these risks. All
information obtained from third party sources is believed to be reliable and current, but accuracy
cannot be guaranteed and we do not undertake to update any information contained in this
document. All assumptions, figures and calculations contained in the information must be
independently verified by the professional investor. This publication has been prepared without
regard to the specific investment objectives, financial situation or particular needs of recipients.
No legal or tax advice is provided. Recipients should independently evaluate specific
investments and trading strategies. By accepting receipt of this publication, the recipient
acknowledges that this publication is confidential and agrees not to distribute, offer or sell this
publication or copies of it and agrees not to make use of the publication other than for its own
general information purposes.
Copyright © 2015 LaSalle Investment Management. All rights reserved. No part of this
publication may be reproduced by any means, whether graphically, electronically, mechanically
or otherwise howsoever, including without limitation photocopying and recording on magnetic
tape, or included in any information store and/or retrieval system without prior permission of
LaSalle Investment Management.