“men argue. nature acts.”summary overall economy cirt sentiment index third quarter 2014...
TRANSCRIPT
CURRENT CIRTSUMMARY
Overall Economy
CIRT SENTIMENT INDEX THIRD QUARTER 2014 EXECUTIVE SUMMARY
The great man of letters and champion of reason, Voltaire might have been talking about the climate when he wrote, “Men argue. Nature acts.” Men and women argue about climate change and global warming, but nature does what nature does, acts, be it drought, doldrums, snow, rain and/or natural disasters like hurricanes. Argue as we will, we inevitably enjoy and suffer the acts of nature. Much the same can be said about the economy. Pundits and politicians argue—incessantly—and the economic climate changes in spite of argument and often in reaction to nature. For instance, nasty winter weather and a continuing drought in the West are among the explanations for a slowing economy in the first quarter. Although there are many arguments about what to do about these events, we remain largely at the “mercy” of Mother Nature and the effects she may have on our business cycles. Not so with respect to the business climate or environment which we create for ourselves by government policies, rules, regulations, taxes, laws and litigation. Here we reap the whirlwind of our own hostile or overburdensome decisions that either directly or indirectly impact our economic activities. Unlike nature however, every other fall we get a chance to influence the “elements” of government policy through the national elections. Last quarter we asked panelists to give us some idea of their R&D activities. Clearly, R&D is necessary to keep up or get ahead of the changing nature of the construction business. R&D activities are usually kept close to the vest, as we received few secrets in response to our questions. This quarter we asked panelists to tell us about their experience with joint ventures and partnerships, an activity that works best when partners are not secretive but open and collaborative with each other. The responses were mixed, indicating that JVs are not for everyone. Some do well to avoid them, and others have found success in forming them for successful projects.
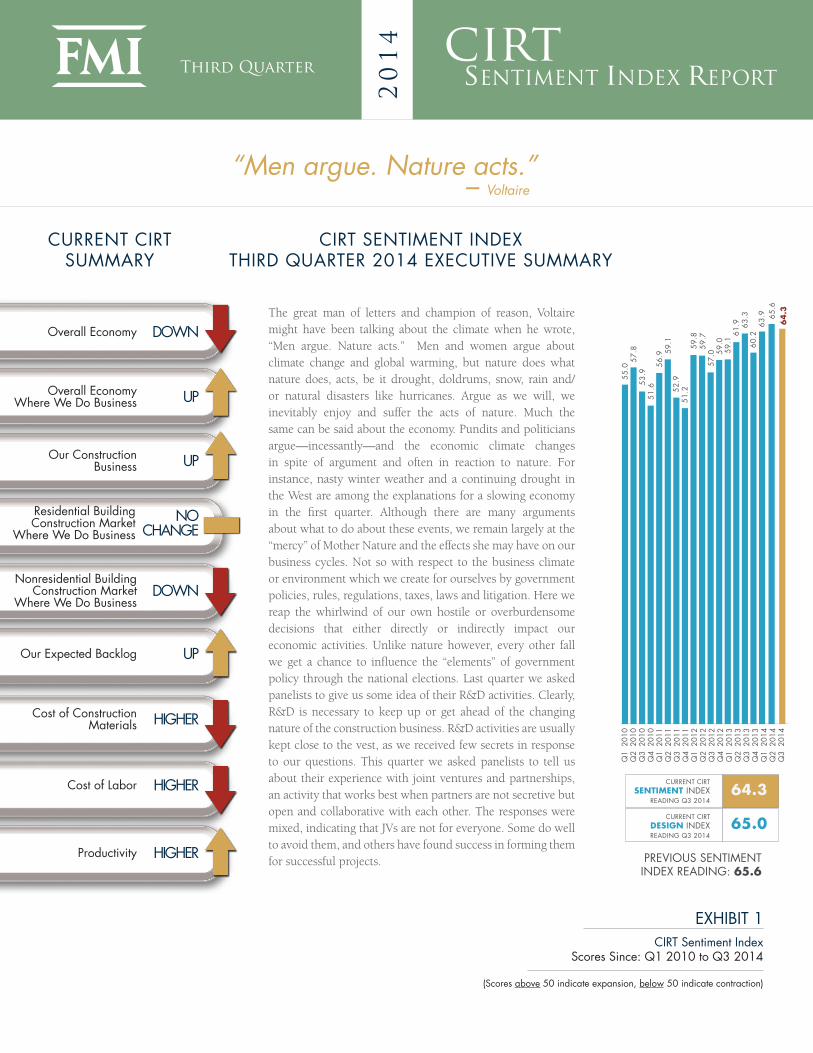
EXHIBIT 1CIRT Sentiment Index
Scores Since: Q1 2010 to Q3 2014
(Scores above 50 indicate expansion, below 50 indicate contraction)
Overall Economy Where We Do Business
Our ConstructionBusiness
Residential Building Construction Market
Where We Do Business
Our Expected Backlog
Cost of Construction Materials
Cost of Labor
Productivity
UP
HIGHER
HIGHER
Third Quarter
20
14
HIGHER
Nonresidential Building Construction Market
Where We Do BusinessDOWN
UP
UP
DOWN
“Men argue. Nature acts.” – Voltaire
NOCHANGE
Q1
201
0Q
2 2
010
Q3
201
0Q
4 2
010
Q1
201
1Q
2 2
011
Q3
201
1Q
4 2
011
Q1
201
2Q
2 2
012
Q3
201
2Q
4 2
012
Q1
201
3Q
2 2
013
Q3
201
3Q
4 2
013
Q1
201
4Q
2 2
014
Q3
201
4CURRENT CIRT
SENTIMENT INDEXREADING Q3 2014
64.3
PREVIOUS SENTIMENTINDEX READING: 65.6
51.6
53.9
57.8
55.0 56
.9
CURRENT CIRTDESIGN INDEXREADING Q3 2014
65.0
59.1
52.9
51.2
59.8
59.7
57.0 59
.0
63.9
59.1
61.9 63
.360
.2
65.6
64
.3
ABOUT THE CONSTRUCTION INDUSTRY ROUND TABLE (CIRT)
The Construction Industry Round Table (CIRT) is composed exclusively of approximately 100 CEOs from the leading architectural,
engineering and construction firms doing business in the United States.
CIRT is the only organization that is uniquely situated as a single voice representing the richly diverse and dynamic design/
construction community. First organized in 1987 as the Construction Industry Presidents’ Forum, the Forum has since been
incorporated as a not-for-profit association with the mission “to be a leading force for positive change in the design/construction
industry while helping members improve the overall performance of their individual companies.”
The Round Table strives to create one voice to meet the interests and needs of the design/construction community. CIRT supports
its members by actively representing the industry on public policy issues, by improving the image and presence of its leading
members, and by providing a forum for enhancing and developing strong management approaches through networking and peer
interaction.
The Round Table’s member CEOs serve as prime sources of information, news and background on the design/construction
industry and its activities. If you are interested in obtaining more information about the Construction Industry Round Table,
please call 202-466-6777 or contact us by email at [email protected].
The CIRT Sentiment Index is a survey of members of the Construction Industry Round Table
conducted quarterly by FMI Research, Raleigh, N.C. For press contact or questions about the CIRT
Sentiment Index, contact Mark Casso at [email protected] and/or Phil Warner, research consultant with
FMI Corporation, at [email protected] or call 919-785-9357.
CIRT SENTIMENT INDEX
CONFIDENTIALITYAll individual responses to this survey will be confidential and shared outside of FMI only in the aggregate.
All names of individuals responding to this survey will remain confidential to FMI.
CIRT Sentiment Index Report3
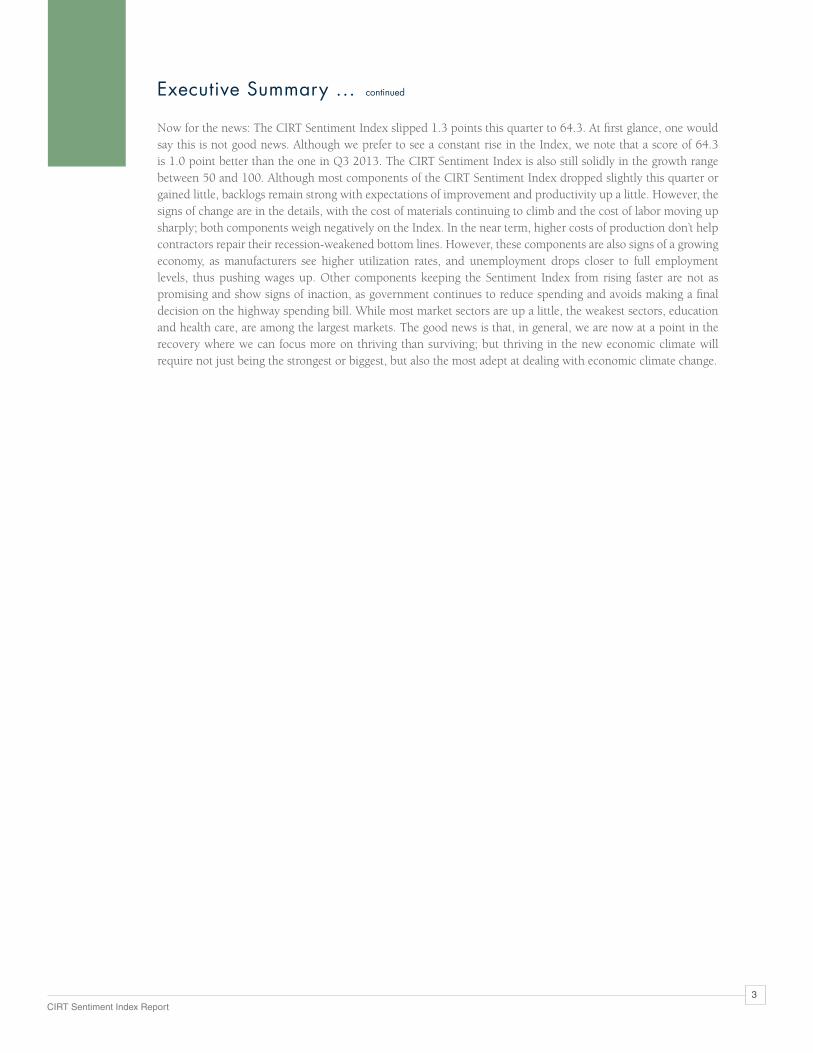
Executive Summary ... continued
Now for the news: The CIRT Sentiment Index slipped 1.3 points this quarter to 64.3. At first glance, one would say this is not good news. Although we prefer to see a constant rise in the Index, we note that a score of 64.3 is 1.0 point better than the one in Q3 2013. The CIRT Sentiment Index is also still solidly in the growth range between 50 and 100. Although most components of the CIRT Sentiment Index dropped slightly this quarter or gained little, backlogs remain strong with expectations of improvement and productivity up a little. However, the signs of change are in the details, with the cost of materials continuing to climb and the cost of labor moving up sharply; both components weigh negatively on the Index. In the near term, higher costs of production don’t help contractors repair their recession-weakened bottom lines. However, these components are also signs of a growing economy, as manufacturers see higher utilization rates, and unemployment drops closer to full employment levels, thus pushing wages up. Other components keeping the Sentiment Index from rising faster are not as promising and show signs of inaction, as government continues to reduce spending and avoids making a final decision on the highway spending bill. While most market sectors are up a little, the weakest sectors, education and health care, are among the largest markets. The good news is that, in general, we are now at a point in the recovery where we can focus more on thriving than surviving; but thriving in the new economic climate will require not just being the strongest or biggest, but also the most adept at dealing with economic climate change.
CIRT Sentiment Index Report4
Overall Economy: The CIRT Sentiment Index component for the overall economy dropped 3.1 points from 79.5 last quarter to 76.4 this quarter. This is a significant pullback in sentiments, but it is still signaling growth and is much improved over ratings of a year ago.
Overall Economy Where Panelists Do Business: The economy where panelists do business improved a point to 78.2, a small but positive move.
CIRT Design Index Components
Consulting Planning: Consulting planning edged up 1.8 points this quarter to 70.8. This is a good sign for other potential work in the future.
Predesign work: Predesign work softened from 76.1 last quarter to 72.2 for the third quarter.
Commercial: Considering the weakness in this area during the recession, commercial design work improved significantly from a score of 63.2 to 69.6.
Residential: Design work for residential construction jumped up from 56.3 to 71.1 this quarter. If the strength in this market continues, it will be one of the strongest recoveries of any of the Index components.
Education: Design work for education facilities remains slow, but the component score made some improvement from 50.0 to 54.5 this quarter.
Health Care: Design work for health care continues its weak outlook, dropping 4.3 points this quarter to 54.5.
Industrial: Industrial design dropped sharply from 72.2 last quarter to 65.8 this quarter. Although there are signs in the economy that manufacturing is improving, it is not yet to the point where significant capital additions are needed.
Transportation: Reflecting lower and uncertain future government spending, transportation design dropped 7.6 points to 59.1.
Heavy/Civil: In harmony with transportation, heavy/civil design work dropped from 68.4 last quarter to 61.9.
International: International design work component scores have been solid but volatile, but the move from 61.4 last quarter to 70.5 this quarter is encouraging.
Construction
Panelists’ Construction Business: Panelists’ construction business is seen as only slightly better than last quarter for a component score of 75.0. This component has been in this range for the past three quarters.
Private Sector Construction Business: The brightening outlook for commercial construction has been one of the best signs that the economy is improving. That trend continues this quarter, but the expected recovery is slow. Health care construction has had one of the most significant slowdowns in private construction and will likely remain weak until there is more clarity on health care policy—both political and insurance-related. While we noted above that design for industrial work is slower, manufacturing construction continues to improve. Education construction work continues to be weak and awaits improvements while facing tight state and municipal budgets. Lodging construction continues its slow recovery and is now achieving respectable component scores.
Cost of Construction Materials and Labor: The cost of materials rose 7.8 points over last quarter. The cost of labor also increased this quarter, rising 5.4 points over last quarter. For our index, rising material and labor costs are considered a drag on the index score.
CIRT Sentiment Index Third Quarter 2014 Highlights

CIRT Sentiment Index Report5
CIRT Sentiment Index Scores: Q1 2011 to Q3 2014
(Scores based on a 100-point scale, above 50 indicate expansion, below 50 indicate contraction.)
Current Issues:The Experience With Forming Joint Ventures and Partnerships in the Construction Industry
In a highly competitive industry like construction, one might not expect contractors to form partnerships and joint ventures to win projects and perform the work. However, when we asked CIRT’s membership about their opinions and experience with JVs and partnerships this quarter, only 9% said they are not participating in JVs. (Compare this with 48% of the panelists answering the general NRCI survey this quarter who said they weren’t participating in a JV. The critical difference appears to be the average revenue for companies represented in the NRCI report, which contains a broad range including many small firms, whereas the CIRT survey is populated by only the larger firms in the industry.) As such, the companies responding to the CIRT Sentiment Index survey realize a more significant portion of their revenues from work involving joint ventures and partnerships.
Often joint ventures and partnerships in construction are formed to meet owner requirements such as government set-aside contracts, experience and capacity, and 16% of panelists said these reasons were among the top-three
reasons to form joint ventures. However, topping the list of reasons to form joint ventures was the need to add unique capabilities to the team to win the project and specific skills or assets such as specialized engineering or equipment (20%). Gaining additional resources or capacity needed to pursue the project ranked second in the top-three reasons to form JVs, and expanding market penetration was noted by 16% of panelists. We can boil down most of the top reasons to form joint ventures or partnerships to the old saw, “If you can’t beat ‘em, join ‘em.” If there is a trend to forming more JVs, it is in large part a sign of industry competitiveness, not a sign of being less competitive.
Among the reasons companies seek out these advantages is due to owners seeking larger, more complex projects, megaprojects, that require a broad spectrum of expertise not always extant in a single company. Forming joint ventures gives companies the opportunity to qualify for the project and put in a competitive bid. On large projects, joint ventures can be in effect for several years, so the experience is not unlike a temporary merger of companies. As with actual mergers, joint ventures offer opportunities and challenges. In fact, of those panelists who have had experience with joint ventures and partnerships, only 39% rank the experiences as an 8 or above on a scale of 1 to 10. The majority ranked the experience between 5 and 7, which indicates the difficulty in forming good partnerships and joint ventures.
EXHIBIT 2C
IRT
Sent
imen
t Ind
ex S
core
Q12011
Q22011
Q32011
Q42011
Q12012
56.9
55.2 59
.157
.552
.959
.3
51.2 55
.0 59.8
59.8
59.7
61.1
Q22012
Sentiment IndexDesign Index
Q32012
57.0
56.5
Q42012
59.0
56.3
20
25
30
35
40
45
50
55
60
65
70
75
Q12013
59.1
57.4
Q22013
61.9 65
.4
63.3 67
.5
Q32013
Q42013
62.1
60.2
Q12014
65.9
63.9
Q22014
64.4
65.6
Q32014
65.0
64.3

CIRT Sentiment Index Report6
When a contractor’s strategy calls for finding a joint venture partner, it is important to note that forming a joint venture requires serious commitments and considerations to be understood and decided even before the joint venture relationship begins. In addition to financial and operational concerns, there are also organizational issues to understand before entering a joint venture. Any contractor should consult its attorney, insurance agent/broker and accountant before entering into a joint venture agreement to ensure it has a clear understanding of the legal and financial considerations. In other words, do not enter joint venture relationships without preparation. As one panelist who avoids joint ventures said, “We do not like to expose our company to decisions outside our control. We do not do joint ventures.” Another panelist noted:
We utilize JVs when:
1. It gives us a competitive advantage. 2. It is a megaproject and requires multiple bonding entities.3. It is in the best interest of the client, and it must make sense to all parties in the JV.
The comments from panelists below further elucidate the advantages and disadvantages of forming joint ventures. From the comments received, it is clear that successfully combining corporate cultures plays an important role in a winning joint venture.
What is your estimated annual revenue from joint ventures/partnerships as a percentage of total annual revenue? (%)
9%
0%
Revenue Ranges
% o
f Res
pons
e
40%
31%
15%
5%
1%to
10%
11%to
20%
21%to
30%
>30%
EXHIBIT 3

CIRT Sentiment Index Report7
What are the top-three reasons to form joint ventures?
20%
16%
Add unique capabilities, for example, specific skills or assets such as specialized engineering capabilities
or equipment, for the team to win the project.
Gain additional resources or capacityneeded to pursue the project.
Expand market penetration by tappinginto another company’s expertise.
Meet owner requirements, such as governmentset-aside contracts, experience, capacity or other
pre-qualification requirements.
Mitigate risks on higher-risk projects by spreadingthe risks among joint venture partners.
Meet capacity and capability requirements of megaprojects.
Maximize surety capacity.
16%
16%
15%
10%
7%
On a scale of 1 to 10, how would you generally rate the JV/partnership experiences you have had? (1=Very poor relationship; 5=OK, some good, some bad; 10=Great results)
0%
% o
f Res
pons
e
1=VeryPoor
Relationships
4% 2% 4%9%
17%
39%
24%
11%4%
2 3 4 5=OK,somegood,somebad
6 7 8 9 10=GreatResults
EXHIBIT 4
EXHIBIT 5

CIRT Sentiment Index Report8
Selected Panelists’ Comments Concerning Drawbacks and Advantages of Joint Ventures and Partnerships:
The following comments from panelists concerning their experience and concerns with joint venturing fall primarily into four categories, the four “C’s,” we might call them: culture, control, contract agreements and communications. Management, risk and trust are also concerns mostly related to the four C’s. However, many have issues with most of those categories. Despite the long list of disadvantages of JV relationships, panelists noted a number of advantages that can be or have been realized in successful joint ventures. Successful synergy might be the phrase to summarize the best JV results. In other words, there is an opportunity for a win-win outcome for the JV partners as well as the project owners when everything goes well.
What do you consider to be the biggest drawbacks of JV partnerships?
� Added level of communication to meet all the stakeholders’ expectations.
� At times huge cultural differences have to be overcome such that the JV is one new team and not a combination of individuals.
� Blending together the teams.
� Building a new team and deciding which company’s standard procedures to adopt for the JV.
� Clash of philosophies in approaching and building work. Lack of an equitable approach.
� Commitment to JV.
� Compatibility between partners.
� Competing priorities.
� Conflicting cultures among JV partners.
� Cultures have to be aligned. If you do not figure that out beforehand, you quickly do.
� Difference in business culture.
� Differences in operational philosophies.
� Different cultures. Too many chiefs. Less timely conflict resolution.
� Hidden agendas.
� Different levels of performance and behavioral capabilities and expectations.
� Dilution of potential fees and difficulty in combining different cultural attitudes to present one common front to owner.
� Dividing the profits.
� Finding the same culture as our company. Working through risk allocation. Agreeing on contract terms.
� Getting everyone on the same page initially.
� Joint and severable liability. Decision-making.
� Keeping partners in alignment.
� Lack of alignment.
� Lack of ultimate responsibility and clear liability.
� Loss of control; tendency to use compromised “team” decisions which may not be the best for business and/or technical reasons.

CIRT Sentiment Index Report9
� Making sure that all dealing with JV partners are fair, with equal consideration for all partners.
� Merging cultures to provide best service offerings.
� Merging cultures, selecting leaders for the project.
� Misalignment of cultures, especially in the area of safety.
� Mixing of cultures into one project team is difficult. Even if senior leadership is committed to a JV approach to winning and building a project, it takes great effort to get the project staff on board from the beginning.
� Need to include additional parties in the process.
� Not always sure what you’re getting into.
� Partners that may not understand the risk associated with joint and several liability.
� Redundancy of staffing assignments, leading to inefficiencies, different working styles and incompatible corporate values.
� Reputational risk if partner does not perform. Conflicts arising from imbalances in management capacity, appetite for risk, technical competence, etc. Slower decision-making.
� Risk management.
� Shared liability. You have to pick your partners carefully. On top of that, culture and trustworthiness of the partner are necessary.
� Sharing the fees.
� Take a significant amount of time during the proposal and bid process. Also, the treatment under GAAP of consolidation (or not) and the implications on balance sheet of JVs.
� The risk associated with these megaprojects is huge and getting worse for the contractor who is at the bottom of the food chain.
� Two different cultures. There still can be an us versus them mentality, no matter how you try to overcome that issue.
� We are not in control of everything, so there is a learning curve and team-building process that must be accomplished so that we can accomplish the goals we want to achieve.
� We do not do JVs. Our partner relationships: Biggest drawbacks are client-mandated MBEs.
� We don’t see any drawbacks as long as appropriate due diligence is completed and alignment is well-defined.
What are the greatest advantages of JV partnerships?
� A strong second estimate.
� Ability to get projects otherwise could not get.
� Access to building for new clients and building long-term relationships.
� Allows for entry into new markets. Expands capabilities and allows pursuit of new projects that would not be possible otherwise.
� Allows you to spread risk and see more opportunities.
� Being able to pursue/win/deliver larger, more complex projects.
� Being local, vicinity of job sites.
� Brings top resources to the project.
CIRT Sentiment Index Report10
� Building a strong team complementing each other’s strengths.
� Complementary skills in managing work with the benefit of two management groups watching the outcome.
� Comply with governmental requirements to include local and/or minority-owned firms as a principal partner.
� Diverse expertise and talent.
� Expand market share and stretch bonding capacity.
� Geographical expansion without the cost.
� Increased expertise, larger talent pool.
� Increased resources for the JV project, allowing expanded internal resource usage on other projects.
� Increased team capabilities.
� Marketability to the client, access to additional resources.
� Melding of expertise/capacity/ability of firms to meet specific and unique project requirements.
� Multiple estimates decrease the chance of estimating errors. Ability to staff up quicker to meet demand of these projects from a resources standpoint.
� Often a more competitive proposition and usually an opportunity to learn and improve our business.
� See how other successful companies plan and manage projects and learn from them.
� Spread surety risk. Learn how other companies of similar size or larger manage projects. Pursue megaprojects.
� Synergies of financials, expertise and personnel from two or more companies.
� Useful in acquiring new work.
� You always learn something. They can lead to other opportunities you may not have been aware of. The good ones become ongoing partnerships.
� You can leverage strengths of multiple companies to get better results for a customer.
� Mitigation of risk, sharing of resources expertise.
CIRT Sentiment Index Report11
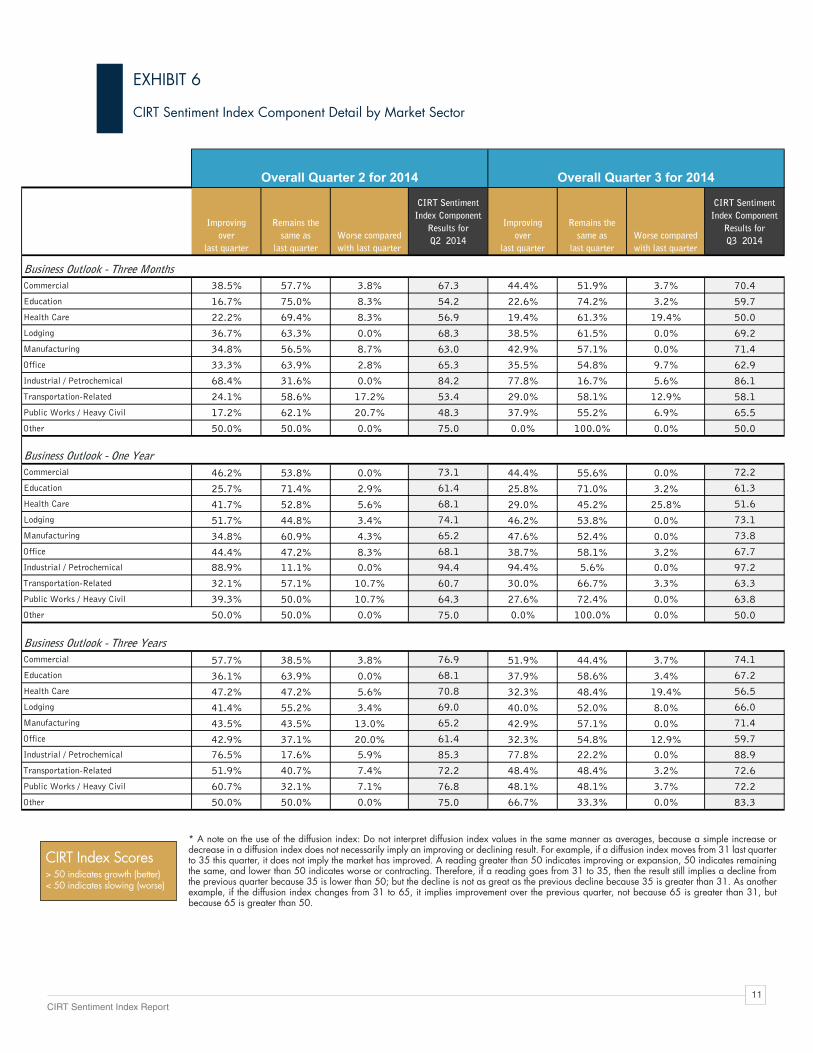
* A note on the use of the diffusion index: Do not interpret diffusion index values in the same manner as averages, because a simple increase or decrease in a diffusion index does not necessarily imply an improving or declining result. For example, if a diffusion index moves from 31 last quarter to 35 this quarter, it does not imply the market has improved. A reading greater than 50 indicates improving or expansion, 50 indicates remaining the same, and lower than 50 indicates worse or contracting. Therefore, if a reading goes from 31 to 35, then the result still implies a decline from the previous quarter because 35 is lower than 50; but the decline is not as great as the previous decline because 35 is greater than 31. As another example, if the diffusion index changes from 31 to 65, it implies improvement over the previous quarter, not because 65 is greater than 31, but because 65 is greater than 50.
CIRT Index Scores> 50 indicates growth (better)< 50 indicates slowing (worse)
CIRT Sentiment Index Component Detail by Market Sector
EXHIBIT 6
Improving over
last quarter
Remains the same as
last quarterWorse compared with last quarter
CIRT SentimentIndex Component
Results forQ2 2014
Improving over
last quarter
Remains the same as
last quarterWorse compared with last quarter
CIRT SentimentIndex Component
Results forQ3 2014
Commercial 38.5% 57.7% 3.8% 67.3 44.4% 51.9% 3.7% 70.4Education 16.7% 75.0% 8.3% 54.2 22.6% 74.2% 3.2% 59.7Health Care 22.2% 69.4% 8.3% 56.9 19.4% 61.3% 19.4% 50.0Lodging 36.7% 63.3% 0.0% 68.3 38.5% 61.5% 0.0% 69.2Manufacturing 34.8% 56.5% 8.7% 63.0 42.9% 57.1% 0.0% 71.4Office 33.3% 63.9% 2.8% 65.3 35.5% 54.8% 9.7% 62.9Industrial / Petrochemical 68.4% 31.6% 0.0% 84.2 77.8% 16.7% 5.6% 86.1Transportation-Related 24.1% 58.6% 17.2% 53.4 29.0% 58.1% 12.9% 58.1Public Works / Heavy Civil 17.2% 62.1% 20.7% 48.3 37.9% 55.2% 6.9% 65.5Other 50.0% 50.0% 0.0% 75.0 0.0% 100.0% 0.0% 50.0
Commercial 46.2% 53.8% 0.0% 73.1 44.4% 55.6% 0.0% 72.2Education 25.7% 71.4% 2.9% 61.4 25.8% 71.0% 3.2% 61.3Health Care 41.7% 52.8% 5.6% 68.1 29.0% 45.2% 25.8% 51.6Lodging 51.7% 44.8% 3.4% 74.1 46.2% 53.8% 0.0% 73.1Manufacturing 34.8% 60.9% 4.3% 65.2 47.6% 52.4% 0.0% 73.8Office 44.4% 47.2% 8.3% 68.1 38.7% 58.1% 3.2% 67.7Industrial / Petrochemical 88.9% 11.1% 0.0% 94.4 94.4% 5.6% 0.0% 97.2Transportation-Related 32.1% 57.1% 10.7% 60.7 30.0% 66.7% 3.3% 63.3Public Works / Heavy Civil 39.3% 50.0% 10.7% 64.3 27.6% 72.4% 0.0% 63.8Other 50.0% 50.0% 0.0% 75.0 0.0% 100.0% 0.0% 50.0
Commercial 57.7% 38.5% 3.8% 76.9 51.9% 44.4% 3.7% 74.1Education 36.1% 63.9% 0.0% 68.1 37.9% 58.6% 3.4% 67.2Health Care 47.2% 47.2% 5.6% 70.8 32.3% 48.4% 19.4% 56.5Lodging 41.4% 55.2% 3.4% 69.0 40.0% 52.0% 8.0% 66.0Manufacturing 43.5% 43.5% 13.0% 65.2 42.9% 57.1% 0.0% 71.4Office 42.9% 37.1% 20.0% 61.4 32.3% 54.8% 12.9% 59.7Industrial / Petrochemical 76.5% 17.6% 5.9% 85.3 77.8% 22.2% 0.0% 88.9Transportation-Related 51.9% 40.7% 7.4% 72.2 48.4% 48.4% 3.2% 72.6Public Works / Heavy Civil 60.7% 32.1% 7.1% 76.8 48.1% 48.1% 3.7% 72.2Other 50.0% 50.0% 0.0% 75.0 66.7% 33.3% 0.0% 83.3
Overall Quarter 2 for 2014 Overall Quarter 3 for 2014
Business Outlook - Three Months
Business Outlook - One Year
Business Outlook - Three Years
CIRT Sentiment Index Report12
CIRTSentiment
Index ComponentsQ4 for 2013
CIRTSentiment
Index ComponentsQ1 for 2014
CIRTSentiment
Index ComponentsQ2 for 2014
CIRTSentiment
Index ComponentsQ3for 2014
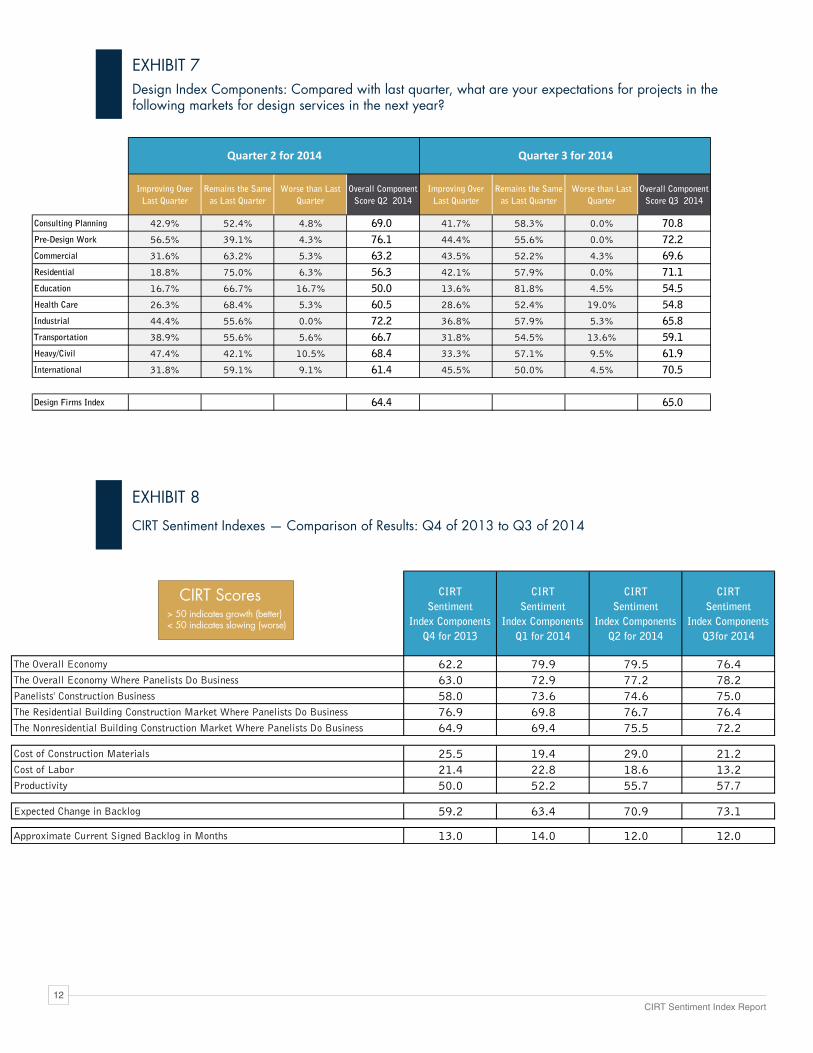
The Overall Economy 62.2 79.9 79.5 76.4The Overall Economy Where Panelists Do Business 63.0 72.9 77.2 78.2Panelists' Construction Business 58.0 73.6 74.6 75.0The Residential Building Construction Market Where Panelists Do Business 76.9 69.8 76.7 76.4The Nonresidential Building Construction Market Where Panelists Do Business 64.9 69.4 75.5 72.2
Cost of Construction Materials 25.5 19.4 29.0 21.2Cost of Labor 21.4 22.8 18.6 13.2Productivity 50.0 52.2 55.7 57.7
Expected Change in Backlog 59.2 63.4 70.9 73.1
Approximate Current Signed Backlog in Months 13.0 14.0 12.0 12.0
Design Index Components: Compared with last quarter, what are your expectations for projects in the following markets for design services in the next year?
CIRT Sentiment Indexes — Comparison of Results: Q4 of 2013 to Q3 of 2014
CIRT Scores> 50 indicates growth (better)< 50 indicates slowing (worse)
EXHIBIT 7
Improving Over Last Quarter
Remains the Same as Last Quarter
Worse than Last Quarter
Overall Component Score Q2 2014
Improving Over Last Quarter
Remains the Same as Last Quarter
Worse than Last Quarter
Overall Component Score Q3 2014
Consulting Planning 42.9% 52.4% 4.8% 69.0 41.7% 58.3% 0.0% 70.8Pre-Design Work 56.5% 39.1% 4.3% 76.1 44.4% 55.6% 0.0% 72.2Commercial 31.6% 63.2% 5.3% 63.2 43.5% 52.2% 4.3% 69.6Residential 18.8% 75.0% 6.3% 56.3 42.1% 57.9% 0.0% 71.1Education 16.7% 66.7% 16.7% 50.0 13.6% 81.8% 4.5% 54.5Health Care 26.3% 68.4% 5.3% 60.5 28.6% 52.4% 19.0% 54.8Industrial 44.4% 55.6% 0.0% 72.2 36.8% 57.9% 5.3% 65.8Transportation 38.9% 55.6% 5.6% 66.7 31.8% 54.5% 13.6% 59.1Heavy/Civil 47.4% 42.1% 10.5% 68.4 33.3% 57.1% 9.5% 61.9International 31.8% 59.1% 9.1% 61.4 45.5% 50.0% 4.5% 70.5
Design Firms Index 64.4 65.0
Quarter 2 for 2014 Quarter 3 for 2014
EXHIBIT 8
CIRT Sentiment Index Report13
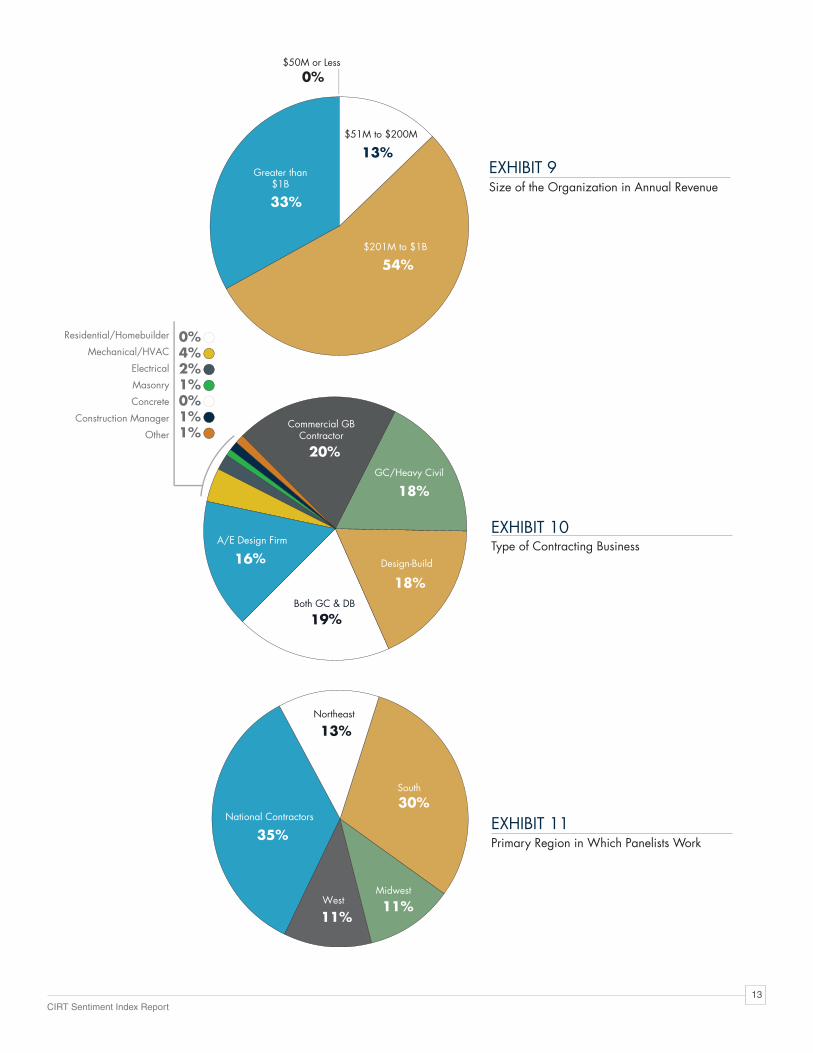
EXHIBIT 9
EXHIBIT 10
EXHIBIT 11
Size of the Organization in Annual Revenue
Type of Contracting Business
Primary Region in Which Panelists Work
Residential/Homebuilder
Mechanical/HVAC
Electrical
Masonry
Concrete
Construction Manager
Other
33%
Greater than$1B
54%$201M to $1B
13%$51M to $200M
$50M or Less
0%
30%South
11%West
13%Northeast
11%Midwest
35%National Contractors
19%Both GC & DB
18%Design-Build
0%4%2%1%0%1%1%
18%GC/Heavy Civil
16%A/E Design Firm
Commercial GBContractor
20%

CIRT Sentiment Index Report14
Sector 3 Months 1 Year 3 Years 3 Months 1 Year 3 Years 3 Months 1 Year 3 Years
Commercial 66.1 82.3 76.7 67.3 73.1 76.9 70.4 72.2 74.1Education 56.3 67.1 76.3 54.2 61.4 68.1 59.7 61.3 67.2Health Care 50.0 65.9 80.0 56.9 68.1 70.8 50.0 51.6 56.5Lodging 64.1 65.2 59.7 68.3 74.1 69.0 69.2 73.1 66.0Manufacturing 68.2 66.7 66.7 63.0 65.2 65.2 71.4 73.8 71.4Office 72.5 70.7 69.2 65.3 68.1 61.4 62.9 67.7 59.7Industrial / Petrochemical 74.1 89.7 87.9 84.2 94.4 85.3 86.1 97.2 88.9Transportation-Related 53.9 68.4 81.6 53.4 60.7 72.2 58.1 63.3 72.6Public Works / Heavy Civil 47.5 62.2 80.0 48.3 64.3 76.8 65.5 63.8 72.2Other 70.0 70.0 90.0 75.0 75.0 75.0 50.0 50.0 83.3
Results Q1 of 2014 Results Q2 of 2014 Results Q3 of 2014
CIRT Sentiment Index Results: Q2 of 2014 and Q3 of 2014
CIRT Scores> 50 indicates growth (better)< 50 indicates slowing (worse)
CIRT Sentiment Index Components: Q2 of 2014 to Q3 of 2014Business Outlook Summary by Market Sector
EXHIBIT 12
Improving over
last quarter
Staying thesame as
last quarter
Worsecompared with
last quarter
CIRTQ2
2014
Improving over
last quarter
Staying thesame as
last quarter
Worsecompared with
last quarter
CIRTQ3
2014
Overall Economy 60.7% 37.5% 1.8% 79.5 54.5% 43.6% 1.8% 76.4Overall Economy Where Panelists Do Business 57.9% 38.6% 3.5% 77.2 56.4% 43.6% 0.0% 78.2Panelists' Construction Business 57.9% 33.3% 8.8% 74.6 55.6% 38.9% 5.6% 75.0Residential Building Construction MarketWhere Panelists Do Business 58.1% 37.2% 4.7% 76.7 58.3% 36.1% 5.6% 76.4Nonresidential Building Construction MarketWhere Panelists Do Business 56.6% 37.7% 5.7% 75.5 50.0% 44.4% 5.6% 72.2
Backlog in Months High Median Low High Median Low
Approximate Current Signed Backlog 84.0 12.0 4.0 48.0 12.0 6.0
Grow fasterthan
last quarter
Stay aboutsame as
last quarter
Shrinkcompared tolast quarter
Grow fasterthan
last quarter
Stay aboutsame as
last quarter
Shrinkcompared tolast quarter
Expected Change in Backlog 49% 44% 7% 70.9% 46% 54% 0% 73.1%
Higher thanlast quarter
Same aslast quarter
Lower thanlast quarter
Higher thanlast quarter
Same aslast quarter
Lower thanlast quarter
Cost of Construction Materials 42% 58% 0% 29.0% 58% 42% 0% 21.2%Cost of Labor 63% 37% 0% 18.6% 74% 26% 0% 13.2%
Improvingover
last quarterSame as
last quarter
Decliningcompared tolast quarter
Improvingover
last quarterSame as
last quarter
Decliningcompared tolast quarter
Productivity 15% 81% 4% 55.7% 19% 77% 4% 57.7%
CIRT Sentiment Index, Quarter 2 of 2014 CIRT Sentiment Index, Quarter 3 of 2014
EXHIBIT 13

About FMIFMI is a leading provider of management consulting, investment banking† and research to the engineering and construction
industry. We work in all segments of the industry providing clients with value-added business solutions, including:
� Strategic Advisory
� Market Research and Business Development
� Leadership and Talent Development
� Project and Process Improvement
� Mergers, Acquisitions and Financial Consulting†
� Compensation Benchmarking and Consulting
� Risk Management Consulting
Founded by Dr. Emol A. Fails in 1953, FMI has professionals in offices across the U.S. We deliver innovative, customized solutions
to contractors, construction materials producers, manufacturers and suppliers of building materials and equipment, owners and
developers, engineers and architects, utilities, and construction industry trade associations. FMI is an advisor you can count on to
build and maintain a successful business, from your leadership to your site managers.
† Investment banking services provided by FMI Capital Advisors, Inc., a registered broker-dealer and wholly owned subsidiary of FMI.
www.fminet.com
Copyright © 2014 FMI Corporation
Notice of Rights: No part of this publication may be reproduced or transmitted in any form, or by any means, without permission from the publisher.
Raleigh (headquarters) 5171 Glenwood AvenueSuite 200Raleigh, NC 27612T 919.787.8400
Denver210 University BoulevardSuite 800Denver, CO 80206T 303.377.4740
Tampa308 South BoulevardTampa, FL 33606T 813.636.1364
Houston3920 Cypress Creek ParkwaySuite 360Houston, TX 77068T 713.936.5400
Scottsdale 14500 N. Northsight BoulevardSuite 313Scottsdale, AZ 85260T 602.381.8108