ape con macro
DESCRIPTION
ape ceTRANSCRIPT
Advanced Placement Economics: MacroeconomicsJohn S. Morton
This newly revised program is keyed to the College Board’s recommended coursesyllabus, meets every syllabus requirement, and prepares students for all AdvancedPlacement economics tests. All lessons and activities incorporate methods thatfocus learning on student activity rather than teacher lecture.
Description:
9,10,11,12Grade Levels:
Instructional Unit; WorkbookDocument Type:
This document may be printed.
Advanced Placement Economics
Macroeconomics Student Activities
John S. Morton
ii
AuthorJohn S. Morton is Director of Educational Programs for the E. Angus Powell Endowment forAmerican Enterprise in Richmond, VA. He teaches economics at Collegiate School and theUniversity of Richmond.
Copyright © 1996, National Council on Economic Education, 1140 Avenue of the Americas, New York, NY 10036.All rights reserved. Some material in this publication was previously published in Advanced Placement InstructionalPackage, © 1988 by the National Council on Economic Education. No part of this book may be kept in an infor-mation storage or retrieval system, transmitted or reproduced in any form or by any means without permission inwriting from the publisher. Printed in the United States of America.ISBN 1-56183-478-5 5 4 3 2 1
Contents
Unit 1Basic Economic Concepts . . . . . . . . . . . . . . . . . . . . . . . . . . . . . . . . . . . . . . . . . . . . . . . . . . 1Key Ideas . . . . . . . . . . . . . . . . . . . . . . . . . . . . . . . . . . . . . . . . . . . . . . . . . . . . . . . . . . . . . . . . . . 3Activity 1 Scarcity, Opportunity Cost, and Production Possibilities Curves . . . . . . . . . . . . . . 5Activity 2 Demand Curves, Moves Along Demand Curves, and Shifts in Demand Curves . . . 9Activity 3 Supply Curves, Moves Along Supply Curves, and Shifts in Supply Curves . . . . . . 13Activity 4 Equilibrium Prices and Equilibrium Quantities . . . . . . . . . . . . . . . . . . . . . . . . . . 17Unit 1: Sample Multiple-Choice Questions . . . . . . . . . . . . . . . . . . . . . . . . . . . . . . . . . . . . . . . 23Unit 1: Sample Short Essay Questions . . . . . . . . . . . . . . . . . . . . . . . . . . . . . . . . . . . . . . . . . . . 27Unit 1: Sample Long Essay Questions . . . . . . . . . . . . . . . . . . . . . . . . . . . . . . . . . . . . . . . . . . . 29
Unit 2Measuring Economic Performance . . . . . . . . . . . . . . . . . . . . . . . . . . . . . . . . . . . . . . . . . 31Key Ideas . . . . . . . . . . . . . . . . . . . . . . . . . . . . . . . . . . . . . . . . . . . . . . . . . . . . . . . . . . . . . . . . . 33Activity 5 Test of Macroeconomic Thinking . . . . . . . . . . . . . . . . . . . . . . . . . . . . . . . . . . . . . 35Activity 6 Understanding the Circular Flow of the Macroeconomy . . . . . . . . . . . . . . . . . . . 37Activity 7 Numbers That Make News . . . . . . . . . . . . . . . . . . . . . . . . . . . . . . . . . . . . . . . . . . 39Activity 8 Measuring Broad Economic Goals . . . . . . . . . . . . . . . . . . . . . . . . . . . . . . . . . . . . 41Activity 9 All About GDP . . . . . . . . . . . . . . . . . . . . . . . . . . . . . . . . . . . . . . . . . . . . . . . . . . . 47Activity 10 GDP and Its Cousins . . . . . . . . . . . . . . . . . . . . . . . . . . . . . . . . . . . . . . . . . . . . . . 49Activity 11 Price Indexes . . . . . . . . . . . . . . . . . . . . . . . . . . . . . . . . . . . . . . . . . . . . . . . . . . . . 55Activity 12 Who Is Hurt and Who Is Helped by Inflation? . . . . . . . . . . . . . . . . . . . . . . . . . . . 57Activity 13 Types of Unemployment . . . . . . . . . . . . . . . . . . . . . . . . . . . . . . . . . . . . . . . . . . . 59Activity 14 The Business Cycle . . . . . . . . . . . . . . . . . . . . . . . . . . . . . . . . . . . . . . . . . . . . . . . . 61Activity 15 Problems on Macroeconomic Indicators . . . . . . . . . . . . . . . . . . . . . . . . . . . . . . . 65Unit 2: Sample Multiple-Choice Questions . . . . . . . . . . . . . . . . . . . . . . . . . . . . . . . . . . . . . . . 67Unit 2: Sample Short Essay Questions . . . . . . . . . . . . . . . . . . . . . . . . . . . . . . . . . . . . . . . . . . . 71Unit 2: Sample Long Essay Questions . . . . . . . . . . . . . . . . . . . . . . . . . . . . . . . . . . . . . . . . . . . 73
Unit 3Aggregate Demand and Aggregate Supply: Fluctuations of Outputs and Prices . . 75Key Ideas . . . . . . . . . . . . . . . . . . . . . . . . . . . . . . . . . . . . . . . . . . . . . . . . . . . . . . . . . . . . . . . . . 77Activity 16 An Introduction to Aggregate Demand . . . . . . . . . . . . . . . . . . . . . . . . . . . . . . . . 79Activity 17 An Introduction to Short-Run Aggregate Supply . . . . . . . . . . . . . . . . . . . . . . . . . 81Activity 18 The Equilibrium Price Level and Equilibrium Output . . . . . . . . . . . . . . . . . . . . . . 83Activity 19 Long-Run Aggregate Supply (LRAS) and the Production Possibilities Curve (PPC) . . 87Activity 20 Manipulating the AD/AS Model: Exogenous Demand and Supply Shocks . . . . . . 89Activity 21 Full Employment in a Capitalist Economy (Part 1) . . . . . . . . . . . . . . . . . . . . . . . 95Activity 22 Full Employment in a Capitalist Economy (Part 2) . . . . . . . . . . . . . . . . . . . . . . . 97
iii
Activity 23 Classical and Keynesian Views of the Economy . . . . . . . . . . . . . . . . . . . . . . . . . . 99Activity 24 What Is an MPC? . . . . . . . . . . . . . . . . . . . . . . . . . . . . . . . . . . . . . . . . . . . . . . . . 101Activity 25 The Consumption Function . . . . . . . . . . . . . . . . . . . . . . . . . . . . . . . . . . . . . . . . 103Activity 26 Plotting the Investment Function . . . . . . . . . . . . . . . . . . . . . . . . . . . . . . . . . . . 107Activity 27 The Magic of the Multiplier . . . . . . . . . . . . . . . . . . . . . . . . . . . . . . . . . . . . . . . . 111Activity 28 Keynesian Equilibrium without Government . . . . . . . . . . . . . . . . . . . . . . . . . . . 113Activity 29 Reconciling the Keynesian Aggregate Expenditure Model . . . . . . . . . . . . . . . . . 115
with the Aggregate Demand and Supply ModelActivity 30 Discretionary and Automatic Fiscal Policy . . . . . . . . . . . . . . . . . . . . . . . . . . . . . 117Activity 31 The Tools of Fiscal Policy . . . . . . . . . . . . . . . . . . . . . . . . . . . . . . . . . . . . . . . . . . 119Activity 32 Two Ways to Analyze Fiscal Policy . . . . . . . . . . . . . . . . . . . . . . . . . . . . . . . . . . . 121Activity 33 Analyzing the Macroeconomy . . . . . . . . . . . . . . . . . . . . . . . . . . . . . . . . . . . . . . 123Unit 3: Sample Multiple-Choice Questions . . . . . . . . . . . . . . . . . . . . . . . . . . . . . . . . . . . . . . 127Unit 3: Sample Short Essay Questions . . . . . . . . . . . . . . . . . . . . . . . . . . . . . . . . . . . . . . . . . . 133Unit 3: Sample Long Essay Questions . . . . . . . . . . . . . . . . . . . . . . . . . . . . . . . . . . . . . . . . . . 135
Unit 4Money, Monetary Policy, and Economic Stability . . . . . . . . . . . . . . . . . . . . . . . . . . . 137Key Ideas . . . . . . . . . . . . . . . . . . . . . . . . . . . . . . . . . . . . . . . . . . . . . . . . . . . . . . . . . . . . . . . . 139Activity 34 Money Is What Money Does . . . . . . . . . . . . . . . . . . . . . . . . . . . . . . . . . . . . . . . 141Activity 35 What’s All This about the M’s? . . . . . . . . . . . . . . . . . . . . . . . . . . . . . . . . . . . . . . 143Activity 36 The Monetary Equation of Exchange . . . . . . . . . . . . . . . . . . . . . . . . . . . . . . . . . 147Activity 37 The Multiple Expansion of Demand Deposits . . . . . . . . . . . . . . . . . . . . . . . . . . 151Activity 38 Reserve Requirements and the Multiplier . . . . . . . . . . . . . . . . . . . . . . . . . . . . . . 153Activity 39 The Federal Reserve System and Monetary Policy . . . . . . . . . . . . . . . . . . . . . . . 157Activity 40 Monetary Policy . . . . . . . . . . . . . . . . . . . . . . . . . . . . . . . . . . . . . . . . . . . . . . . . . 161Activity 41 Graphing Keynesian Monetary Policy . . . . . . . . . . . . . . . . . . . . . . . . . . . . . . . . 167Activity 42 Monetarist Monetary Policy . . . . . . . . . . . . . . . . . . . . . . . . . . . . . . . . . . . . . . . . 171Unit 4: Sample Multiple-Choice Questions . . . . . . . . . . . . . . . . . . . . . . . . . . . . . . . . . . . . . . 173Unit 4: Sample Short Essay Questions . . . . . . . . . . . . . . . . . . . . . . . . . . . . . . . . . . . . . . . . . . 177Unit 4: Sample Long Essay Questions . . . . . . . . . . . . . . . . . . . . . . . . . . . . . . . . . . . . . . . . . . 179
Unit 5Monetary and Fiscal Combinations: Economic Policy in the Real World . . . . . . . 181Key Ideas . . . . . . . . . . . . . . . . . . . . . . . . . . . . . . . . . . . . . . . . . . . . . . . . . . . . . . . . . . . . . . . . 183Activity 43 Monetary and Fiscal Policy . . . . . . . . . . . . . . . . . . . . . . . . . . . . . . . . . . . . . . . . 185Activity 44 Graphing Monetary and Fiscal Policy Interactions . . . . . . . . . . . . . . . . . . . . . . . 187Activity 45 Crowding Out: A Graphical Representation . . . . . . . . . . . . . . . . . . . . . . . . . . . 189Activity 46 Economic Growth and the Determinants of Productive Capacity . . . . . . . . . . . 193Activity 47 The Expansion of the 1960s . . . . . . . . . . . . . . . . . . . . . . . . . . . . . . . . . . . . . . . . 197Activity 48 The Inflation of the 1970s . . . . . . . . . . . . . . . . . . . . . . . . . . . . . . . . . . . . . . . . . 199Activity 49 Supply-Side Economics, Budget Deficits, and Tax Changes . . . . . . . . . . . . . . . . . 201
iv
Activity 50 Analyzing Short-Run and Long-Run Effects of Monetary and Fiscal Policies . . . 203Activity 51 Why Economists Disagree . . . . . . . . . . . . . . . . . . . . . . . . . . . . . . . . . . . . . . . . . 205Activity 52 Sorting Out Macroeconomic Theories . . . . . . . . . . . . . . . . . . . . . . . . . . . . . . . . 209Activity 53 Graphing Macroeconomic Theories . . . . . . . . . . . . . . . . . . . . . . . . . . . . . . . . . . 213Activity 54 What Should the President Do? . . . . . . . . . . . . . . . . . . . . . . . . . . . . . . . . . . . . . 215Unit 5: Sample Multiple-Choice Questions . . . . . . . . . . . . . . . . . . . . . . . . . . . . . . . . . . . . . . 217Unit 5: Sample Short Essay Questions . . . . . . . . . . . . . . . . . . . . . . . . . . . . . . . . . . . . . . . . . . 221Unit 5: Sample Long Essay Questions . . . . . . . . . . . . . . . . . . . . . . . . . . . . . . . . . . . . . . . . . . 223
Unit 6The United States in a Global Economy . . . . . . . . . . . . . . . . . . . . . . . . . . . . . . . . . . . . 225Key Ideas . . . . . . . . . . . . . . . . . . . . . . . . . . . . . . . . . . . . . . . . . . . . . . . . . . . . . . . . . . . . . . . . 227Activity 55 The Iowa Car Crop . . . . . . . . . . . . . . . . . . . . . . . . . . . . . . . . . . . . . . . . . . . . . . . 229Activity 56 Determining Comparative Advantage . . . . . . . . . . . . . . . . . . . . . . . . . . . . . . . . 231Activity 57 The Gains from International Trade . . . . . . . . . . . . . . . . . . . . . . . . . . . . . . . . . . 235Activity 58 Economic Efficiency and the Gains from Trade . . . . . . . . . . . . . . . . . . . . . . . . . 237Activity 59 Barriers to Trade . . . . . . . . . . . . . . . . . . . . . . . . . . . . . . . . . . . . . . . . . . . . . . . . . 241Activity 60 Imbalance of Payments . . . . . . . . . . . . . . . . . . . . . . . . . . . . . . . . . . . . . . . . . . . 243Activity 61 Using Foreign Exchange Rates . . . . . . . . . . . . . . . . . . . . . . . . . . . . . . . . . . . . . . 247Activity 62 Using Supply and Demand to Analyze Exchange Rates . . . . . . . . . . . . . . . . . . . 249Activity 63 The International Effects of Monetary and Fiscal Policies . . . . . . . . . . . . . . . . . . 251Activity 64 The International Way of Thinking . . . . . . . . . . . . . . . . . . . . . . . . . . . . . . . . . . 253Unit 6: Sample Multiple-Choice Questions . . . . . . . . . . . . . . . . . . . . . . . . . . . . . . . . . . . . . . 255Unit 6: Sample Short Essay Questions . . . . . . . . . . . . . . . . . . . . . . . . . . . . . . . . . . . . . . . . . . 259Unit 6: Sample Long Essay Questions . . . . . . . . . . . . . . . . . . . . . . . . . . . . . . . . . . . . . . . . . . 261
v

vi
Macroeconomics
Unit 1Basic EconomicConcepts
1

2
Unit 1
• Scarcity exists because we have limited resourcesand unlimited wants. No society has ever hadenough resources to produce all the goods andservices its members wanted.
• Because of scarcity, there are no decisions free ofcosts.
• Opportunity cost is the forgone benefit of thenext best alternative when resources are used forone purpose rather than another.
• A production possibilities curve graphicallyillustrates scarcity, choices, and opportunitycosts.
• In a market system, resources are allocated inresponse to prices.
• A demand curve is all the prices and quantitiesat which consumers wish to purchase a good orservice. The law of demand states that con-sumers will want to buy more at a lower priceand less at a higher price.
• There is a difference between a change indemand and a change in quantity demanded. A change in quantity demanded is a movementalong the demand curve and can be caused onlyby a change in the price of the good or service.At a lower price, a greater quantity is demanded.A change in demand is a shift in the curvewhereby more or less is demanded at everyprice. Changes in preferences, incomes, popula-tion, or the prices of complementary or substi-tute goods will cause a change in demand.
• A supply curve is all the prices and quantities atwhich producers are willing to sell a good orservice. Producers want to sell more at a higherprice and less at a lower price.
• There is a difference between a change in supply and a change in quantity supplied. A change in quantity supplied is a movementalong the supply curve and can be caused onlyby a change in the price of the good or service.At a lower price, a lesser quantity is supplied. A change in supply is a shift of the curve whereby more or less is supplied at every price.A change in technology or in production costswill cause a change in supply.
• In competitive markets, supply and demandconstitute the sum of many individual decisionsto sell and buy. The interaction of supply anddemand determines the price and quantity thatwill clear the market. This price is where thequantity supplied and quantity demanded areequal. It is called the equilibrium or market-clearing price.
• Equilibrium prices and quantities are deter-mined as follows: At a price higher than equilibrium, there is a surplus and pressure onsellers to lower their prices. At a price lowerthan equilibrium, there is a shortage and pressure on buyers to offer higher prices.
• In a market economy, prices provide information,allocate resources, and act as rationing devices.It is important to know how to illustrate a widerange of situations with supply and demandgraphs.
3
Unit 1
Key Ideas

4
Unit 1
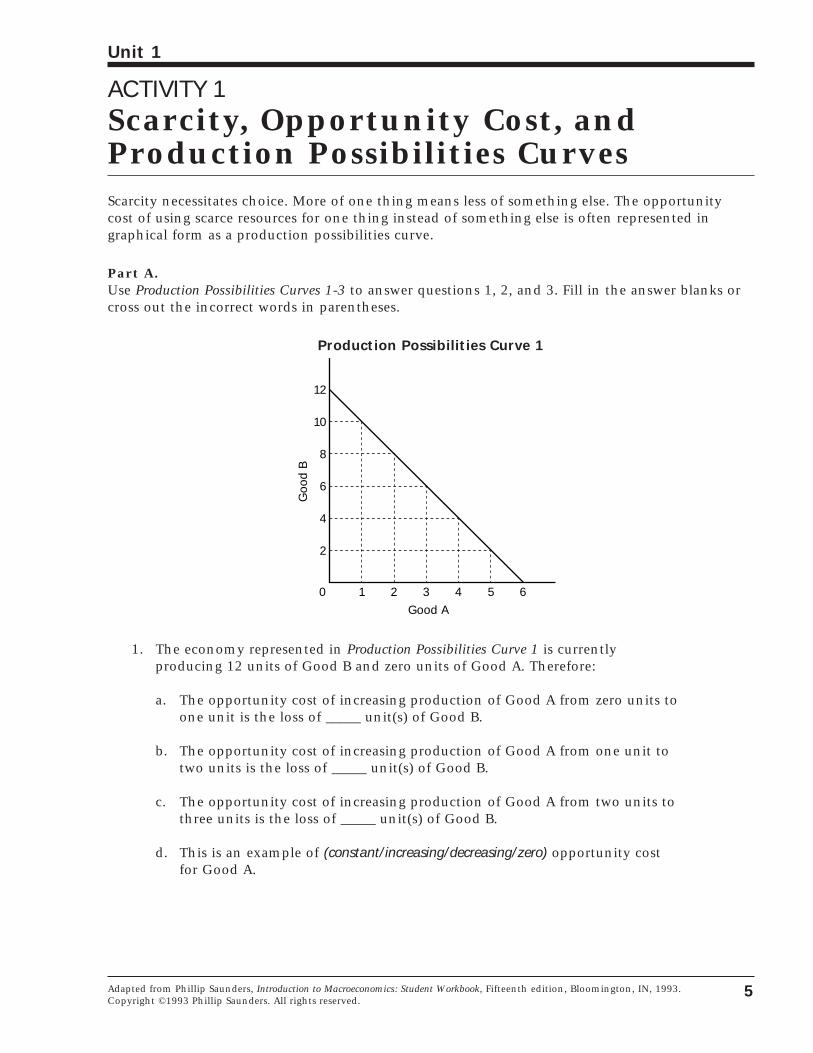
ACTIVITY 1Scarcity, Opportunity Cost, andProduction Possibilities CurvesScarcity necessitates choice. More of one thing means less of something else. The opportunity cost of using scarce resources for one thing instead of something else is often represented ingraphical form as a production possibilities curve.
Part A.Use Production Possibilities Curves 1-3 to answer questions 1, 2, and 3. Fill in the answer blanks orcross out the incorrect words in parentheses.
Production Possibilities Curve 1
1. The economy represented in Production Possibilities Curve 1 is currently producing 12 units of Good B and zero units of Good A. Therefore:
a. The opportunity cost of increasing production of Good A from zero units toone unit is the loss of _____ unit(s) of Good B.
b. The opportunity cost of increasing production of Good A from one unit totwo units is the loss of _____ unit(s) of Good B.
c. The opportunity cost of increasing production of Good A from two units tothree units is the loss of _____ unit(s) of Good B.
d. This is an example of (constant/increasing/decreasing/zero) opportunity costfor Good A.
Goo
d B
Good A
12
10
8
6
4
2
1 2 3 4 5 60
5
Unit 1
Adapted from Phillip Saunders, Introduction to Macroeconomics: Student Workbook, Fifteenth edition, Bloomington, IN, 1993.Copyright ©1993 Phillip Saunders. All rights reserved.
ACTIVITY 1 continued
Production Possibilities Curve 2
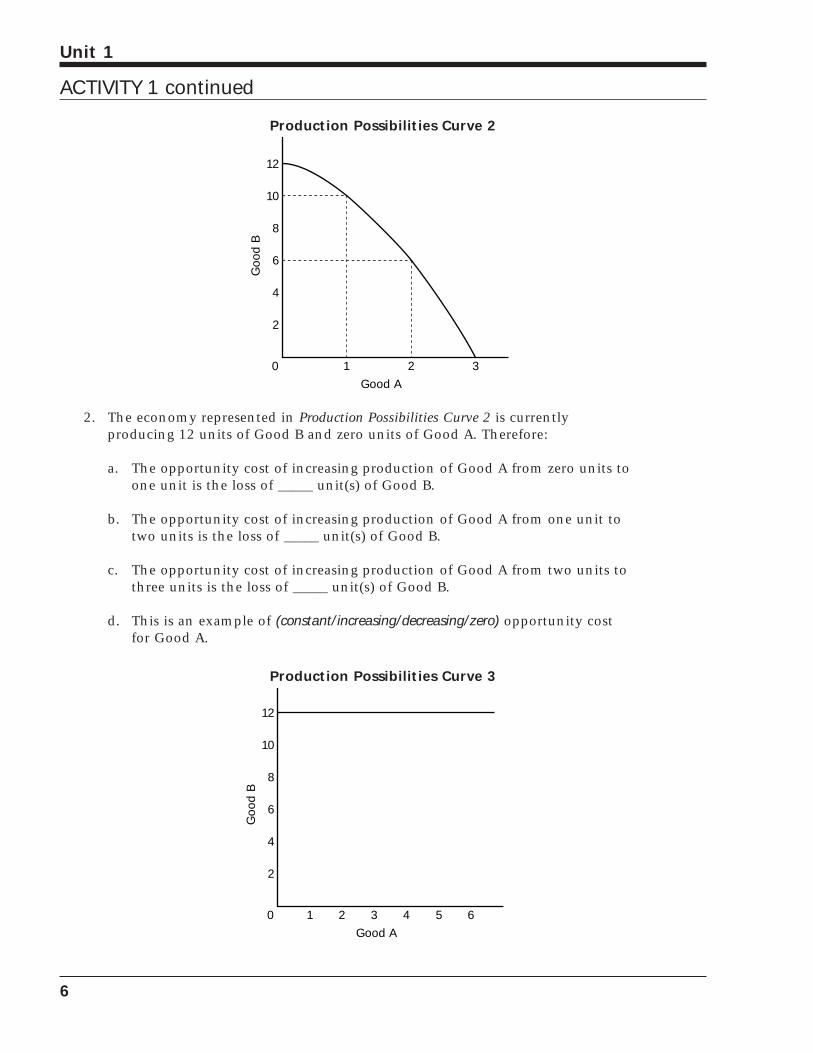
2. The economy represented in Production Possibilities Curve 2 is currently producing 12 units of Good B and zero units of Good A. Therefore:
a. The opportunity cost of increasing production of Good A from zero units toone unit is the loss of _____ unit(s) of Good B.
b. The opportunity cost of increasing production of Good A from one unit totwo units is the loss of _____ unit(s) of Good B.
c. The opportunity cost of increasing production of Good A from two units tothree units is the loss of _____ unit(s) of Good B.
d. This is an example of (constant/increasing/decreasing/zero) opportunity costfor Good A.
Production Possibilities Curve 3
12
10
8
6
4
2
1 2 3 4 5 60
Goo
d B
Good A
12
10
8
6
4
2
1 2 30
Goo
d B
Good A
6
Unit 1
ACTIVITY 1 continued
3. The economy represented in Production Possibilities Curve 3 is currently producing12 units of Good B and zero units of Good A. Therefore:
a. The opportunity cost of increasing production of Good A from zero units toone unit is the loss of _____ unit(s) of Good B.
b. The opportunity cost of increasing production of Good A from one unit totwo units is the loss of _____ unit(s) of Good B.
c. The opportunity cost of increasing production of Good A from two units tothree units is the loss of _____ unit(s) of Good B.
d. This is an example of (constant/increasing/decreasing/zero) opportunity costfor Good A.
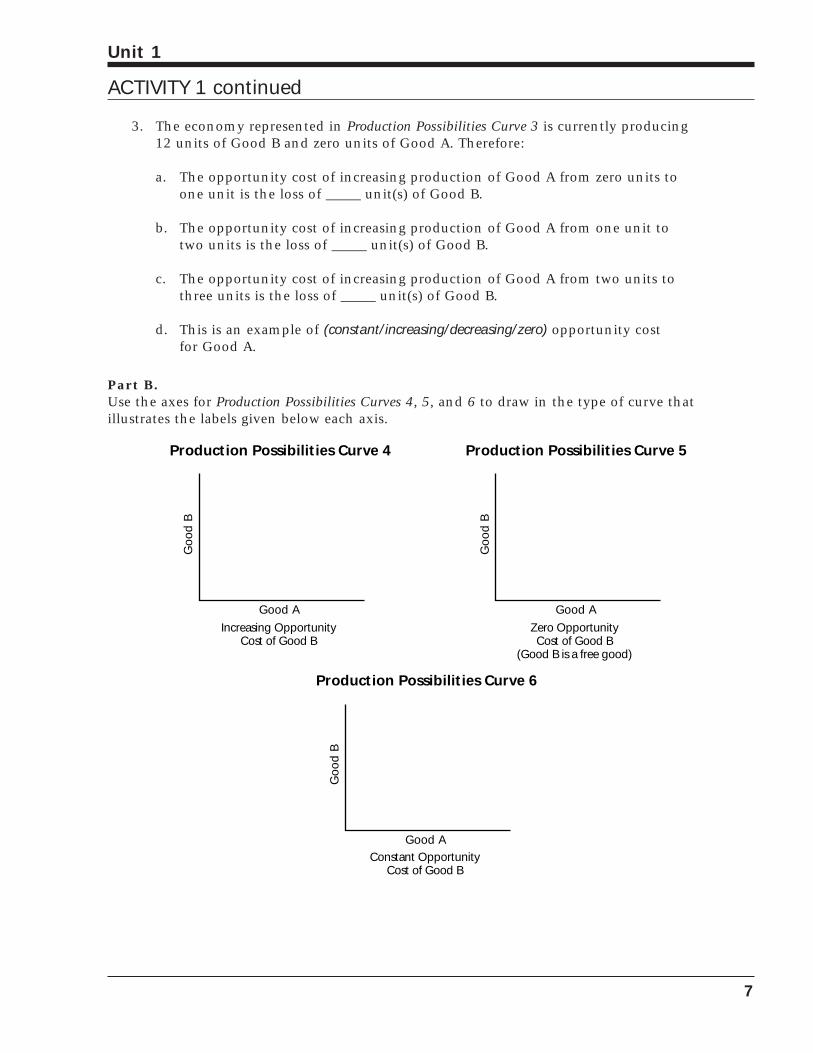
Part B.Use the axes for Production Possibilities Curves 4, 5, and 6 to draw in the type of curve that illustrates the labels given below each axis.
Production Possibilities Curve 4 Production Possibilities Curve 5
Production Possibilities Curve 6
Increasing OpportunityCost of Good B
Zero OpportunityCost of Good B
(Good B is a free good)
Constant OpportunityCost of Good B
Goo
d B
Good A
Goo
d B
Good A
Goo
d B
Good A
7
Unit 1
ACTIVITY 1 continued
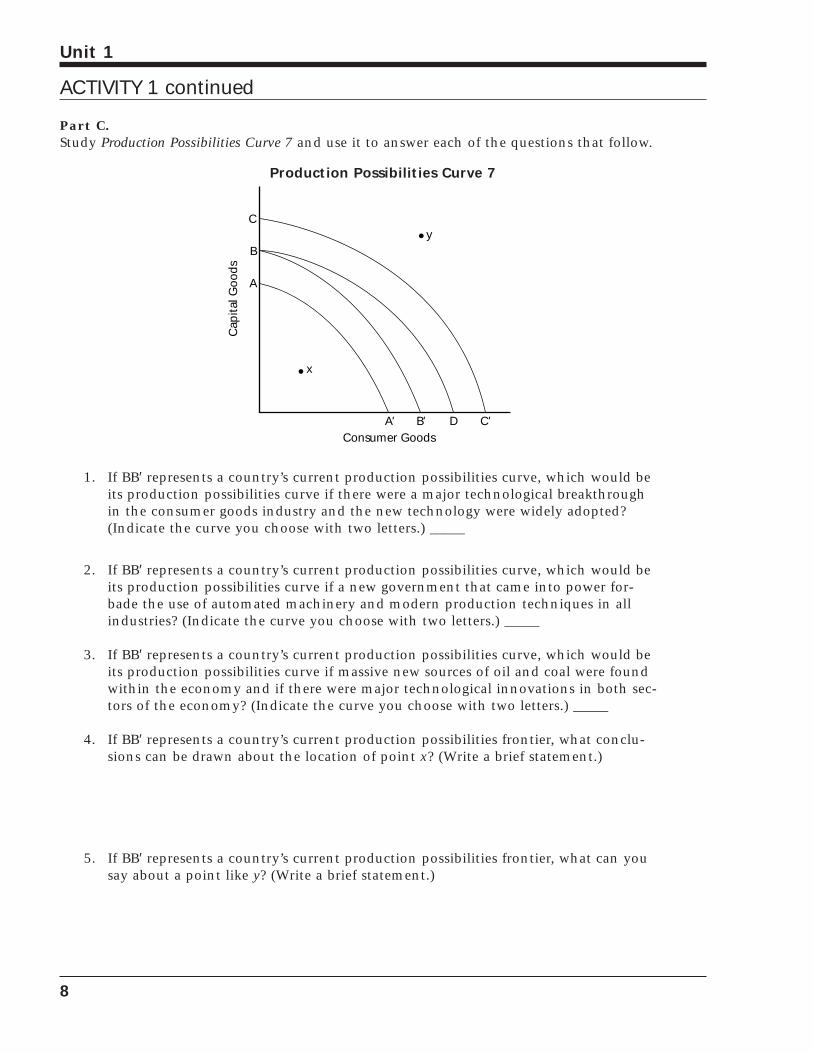
Part C.Study Production Possibilities Curve 7 and use it to answer each of the questions that follow.
Production Possibilities Curve 7
1. If BB′ represents a country’s current production possibilities curve, which would beits production possibilities curve if there were a major technological breakthroughin the consumer goods industry and the new technology were widely adopted?(Indicate the curve you choose with two letters.) _____
2. If BB′ represents a country’s current production possibilities curve, which would beits production possibilities curve if a new government that came into power for-bade the use of automated machinery and modern production techniques in allindustries? (Indicate the curve you choose with two letters.) _____
3. If BB′ represents a country’s current production possibilities curve, which would beits production possibilities curve if massive new sources of oil and coal were foundwithin the economy and if there were major technological innovations in both sec-tors of the economy? (Indicate the curve you choose with two letters.) _____
4. If BB′ represents a country’s current production possibilities frontier, what conclu-sions can be drawn about the location of point x? (Write a brief statement.)
5. If BB′ represents a country’s current production possibilities frontier, what can yousay about a point like y? (Write a brief statement.)
C
B
A
B' C'A' D
x
yC
apita
l Goo
ds
Consumer Goods
8
Unit 1
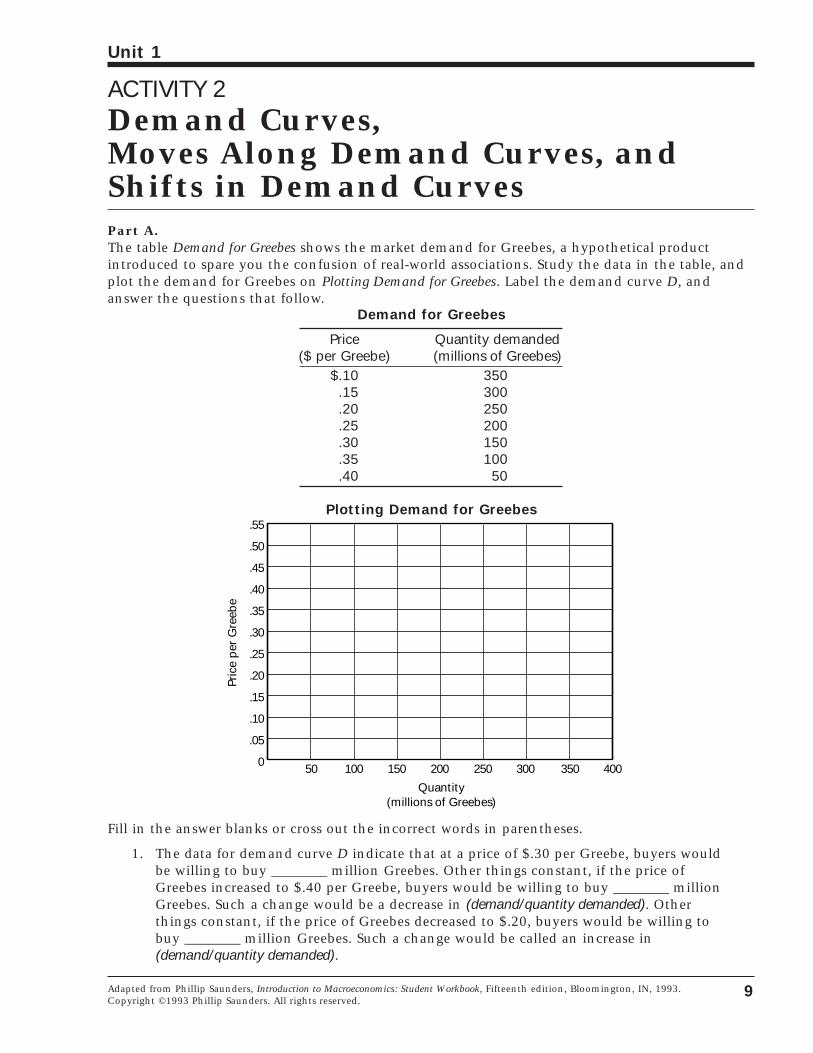
ACTIVITY 2Demand Curves, Moves Along Demand Curves, andShifts in Demand CurvesPart A.The table Demand for Greebes shows the market demand for Greebes, a hypothetical product introduced to spare you the confusion of real-world associations. Study the data in the table, andplot the demand for Greebes on Plotting Demand for Greebes. Label the demand curve D, andanswer the questions that follow.
Demand for Greebes
Price Quantity demanded($ per Greebe) (millions of Greebes)
$.10 350.15 300.20 250.25 200.30 150.35 100.40 50
Plotting Demand for Greebes
Fill in the answer blanks or cross out the incorrect words in parentheses.
1. The data for demand curve D indicate that at a price of $.30 per Greebe, buyers wouldbe willing to buy ________ million Greebes. Other things constant, if the price ofGreebes increased to $.40 per Greebe, buyers would be willing to buy ________ millionGreebes. Such a change would be a decrease in (demand/quantity demanded). Otherthings constant, if the price of Greebes decreased to $.20, buyers would be willing tobuy ________ million Greebes. Such a change would be called an increase in(demand/quantity demanded).
Pric
e p
er G
reeb
e
Quantity(millions of Greebes)
.55
.50
.45
.40
.35
.30
.25
.20
.15
.10
.05
0 50 100 150 200 250 300 350 400
9
Unit 1
Adapted from Phillip Saunders, Introduction to Macroeconomics: Student Workbook, Fifteenth edition, Bloomington, IN, 1993.Copyright ©1993 Phillip Saunders. All rights reserved.
ACTIVITY 2 continued
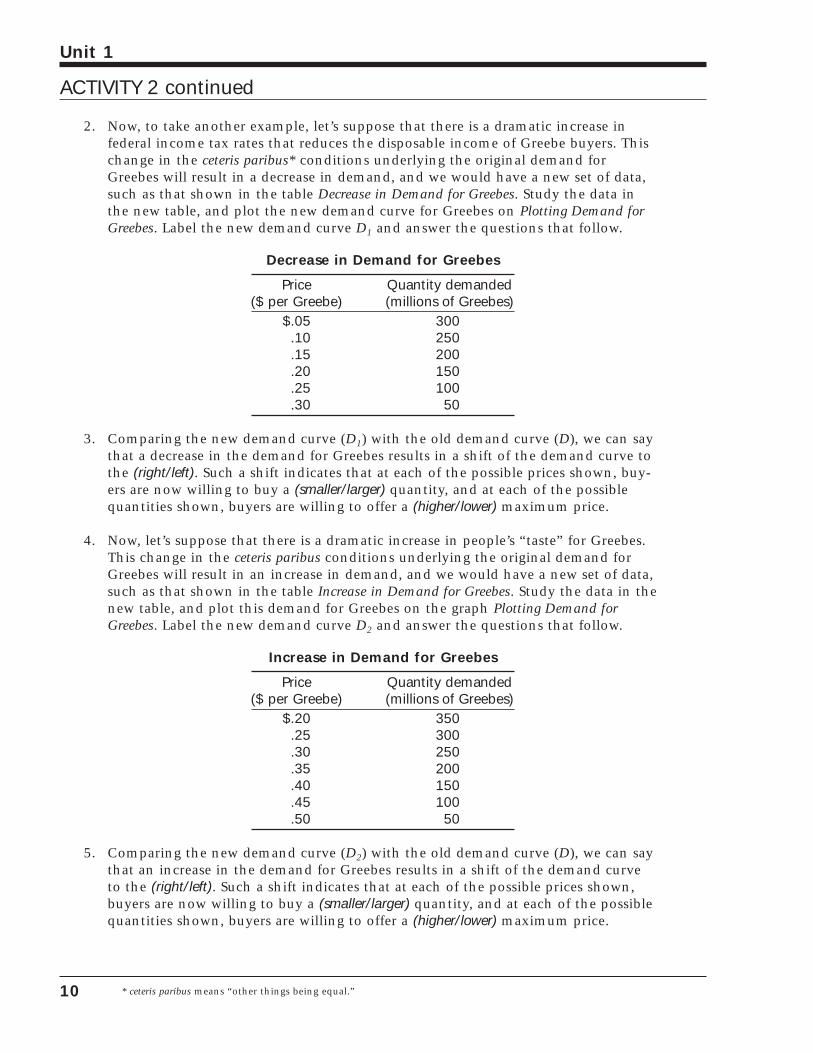
2. Now, to take another example, let’s suppose that there is a dramatic increase in federal income tax rates that reduces the disposable income of Greebe buyers. Thischange in the ceteris paribus* conditions underlying the original demand forGreebes will result in a decrease in demand, and we would have a new set of data,such as that shown in the table Decrease in Demand for Greebes. Study the data inthe new table, and plot the new demand curve for Greebes on Plotting Demand forGreebes. Label the new demand curve D1 and answer the questions that follow.
Decrease in Demand for Greebes
Price Quantity demanded($ per Greebe) (millions of Greebes)
$.05 300.10 250.15 200.20 150.25 100.30 50
3. Comparing the new demand curve (D1) with the old demand curve (D), we can saythat a decrease in the demand for Greebes results in a shift of the demand curve tothe (right/left). Such a shift indicates that at each of the possible prices shown, buy-ers are now willing to buy a (smaller/larger) quantity, and at each of the possiblequantities shown, buyers are willing to offer a (higher/lower) maximum price.
4. Now, let’s suppose that there is a dramatic increase in people’s “taste” for Greebes.This change in the ceteris paribus conditions underlying the original demand forGreebes will result in an increase in demand, and we would have a new set of data,such as that shown in the table Increase in Demand for Greebes. Study the data in thenew table, and plot this demand for Greebes on the graph Plotting Demand forGreebes. Label the new demand curve D2 and answer the questions that follow.
Increase in Demand for Greebes
Price Quantity demanded($ per Greebe) (millions of Greebes)
$.20 350.25 300.30 250.35 200.40 150.45 100.50 50
5. Comparing the new demand curve (D2) with the old demand curve (D), we can saythat an increase in the demand for Greebes results in a shift of the demand curveto the (right/left). Such a shift indicates that at each of the possible prices shown,buyers are now willing to buy a (smaller/larger) quantity, and at each of the possiblequantities shown, buyers are willing to offer a (higher/lower) maximum price.
10
Unit 1
* ceteris paribus means “other things being equal.”
ACTIVITY 2 continued
Part B.Now, the dog work over, see if you have the point by circling the letter of the answer you think is the one best alternative in each of the following multiple-choice questions.
1. Other things constant, which of the following would not cause a change in thedemand (shift in the demand curve) for mopeds?
a. A decrease in consumer incomes.
b. A decrease in the price of mopeds.
c. An increase in the price of bicycles.
d. An increase in people’s tastes for mopeds.
2. “Rising oil prices have caused a sharp decrease in the demand for oil.” Speakingprecisely, and using terms as they are defined by economists, choose the statementthat best describes this quotation:
a. The quotation is correct—an increase in price always causes a decrease in “demand.”
b. The quotation is incorrect—an increase in price always causes an increase in “demand” not a decrease in “demand.”
c. The quotation is incorrect—an increase in price causes a decrease in the “quantity demanded” not a decrease in “demand.”
d. The quotation is incorrect—an increase in price causes an increase in the “quantity demanded” not a decrease in “demand.”
3. “As the price of domestic automobiles has inched upward, customers have foundforeign autos to be a better bargain. Consequently, domestic auto sales have beenslipping and foreign auto sales have been moving briskly.” Using only the informationin this quotation, and assuming everything else constant, which of the followingbest describes this statement?
a. A shift in the demand curves for both domestic and foreign automobiles.
b. A movement along the demand curves for both foreign and domestic automobiles.
c. A movement along the demand curve for domestic autos and a shift in thedemand curve for foreign autos.
d. A shift in the demand curve for domestic autos and a movement along thedemand curve for foreign autos.
11
Unit 1
4. A fellow student is heard to say the following: “Economic markets are like a perpetual seesaw. If demand rises, the price rises; if price rises, then demand willfall; if demand falls, price will fall; if price falls, demand will rise… and so on forever.” Dispel your friend’s obvious confusion (in no more than one short paragraph) below.
12
Unit 1
ACTIVITY 2 continued
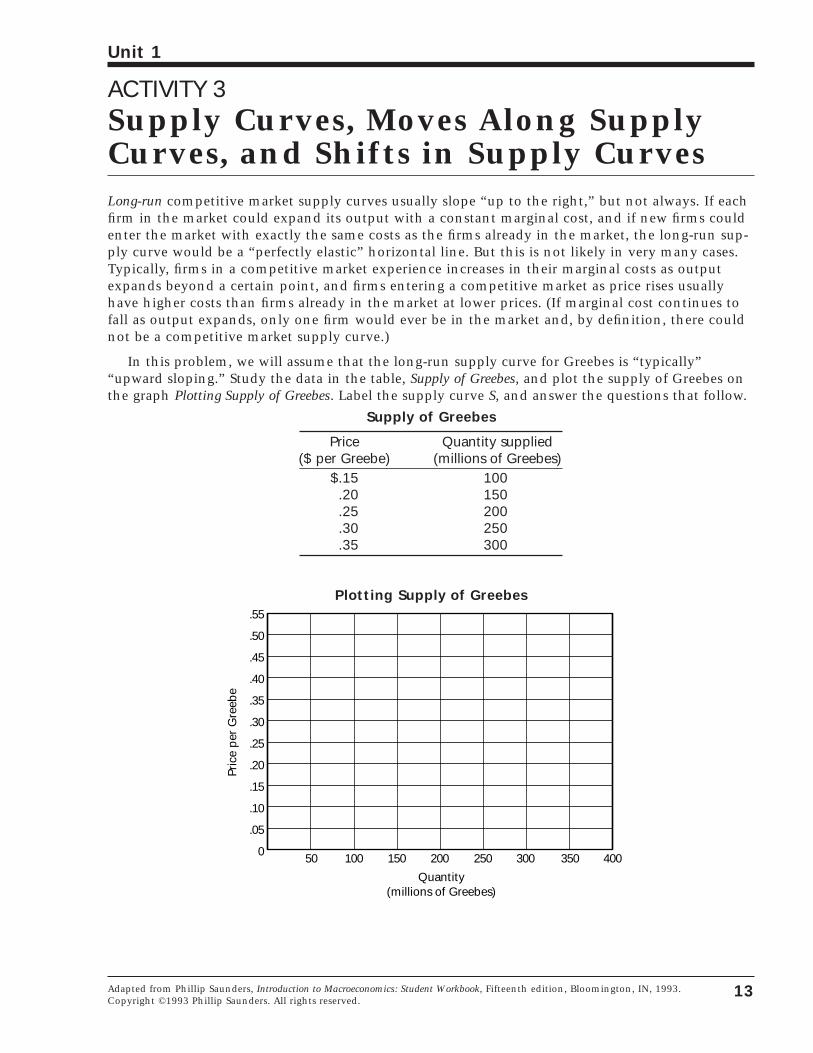
ACTIVITY 3Supply Curves, Moves Along SupplyCurves, and Shifts in Supply CurvesLong-run competitive market supply curves usually slope “up to the right,” but not always. If eachfirm in the market could expand its output with a constant marginal cost, and if new firms couldenter the market with exactly the same costs as the firms already in the market, the long-run sup-ply curve would be a “perfectly elastic” horizontal line. But this is not likely in very many cases.Typically, firms in a competitive market experience increases in their marginal costs as outputexpands beyond a certain point, and firms entering a competitive market as price rises usuallyhave higher costs than firms already in the market at lower prices. (If marginal cost continues tofall as output expands, only one firm would ever be in the market and, by definition, there couldnot be a competitive market supply curve.)
In this problem, we will assume that the long-run supply curve for Greebes is “typically”“upward sloping.” Study the data in the table, Supply of Greebes, and plot the supply of Greebes onthe graph Plotting Supply of Greebes. Label the supply curve S, and answer the questions that follow.
Supply of Greebes
Price Quantity supplied($ per Greebe) (millions of Greebes)
$.15 100.20 150.25 200.30 250.35 300
Plotting Supply of Greebes
Pric
e p
er G
reeb
e
Quantity(millions of Greebes)
.55
.50
.45
.40
.35
.30
.25
.20
.15
.10
.05
0 50 100 150 200 250 300 350 400
13
Unit 1
Adapted from Phillip Saunders, Introduction to Macroeconomics: Student Workbook, Fifteenth edition, Bloomington, IN, 1993.Copyright ©1993 Phillip Saunders. All rights reserved.
ACTIVITY 3 continued
Part A.Fill in the answer blanks or cross out the incorrect words in parentheses.
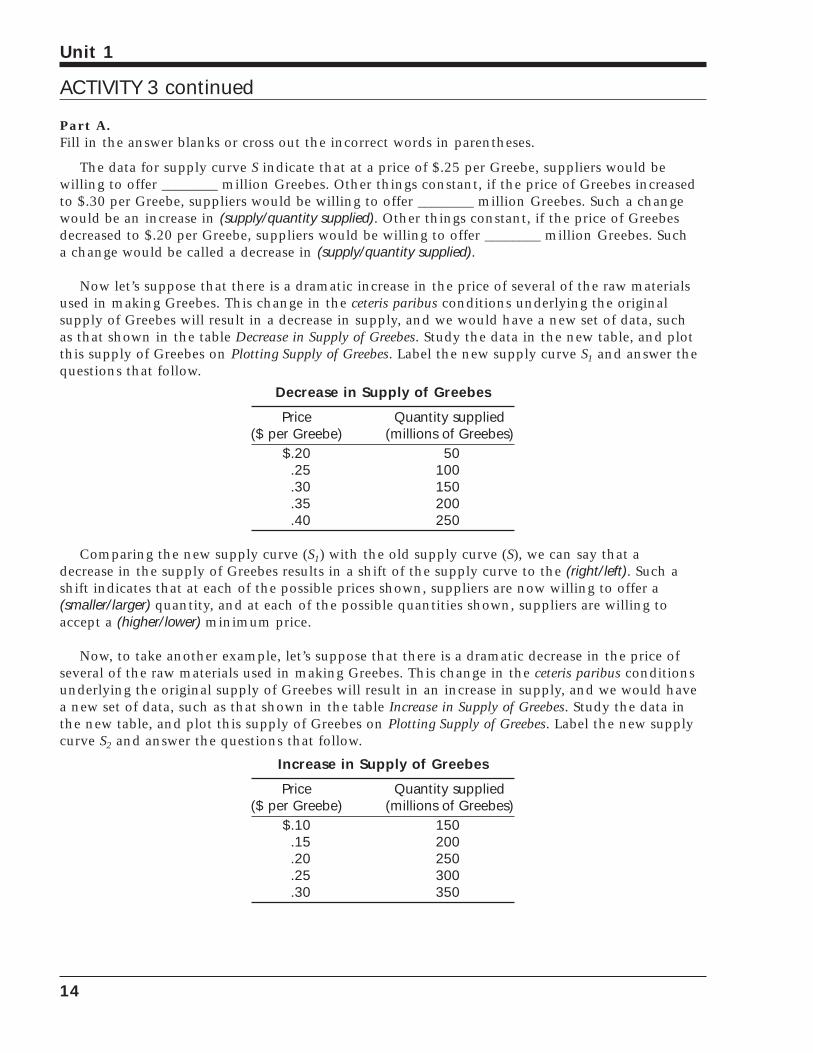
The data for supply curve S indicate that at a price of $.25 per Greebe, suppliers would be willing to offer ________ million Greebes. Other things constant, if the price of Greebes increasedto $.30 per Greebe, suppliers would be willing to offer ________ million Greebes. Such a changewould be an increase in (supply/quantity supplied). Other things constant, if the price of Greebesdecreased to $.20 per Greebe, suppliers would be willing to offer ________ million Greebes. Such a change would be called a decrease in (supply/quantity supplied).
Now let’s suppose that there is a dramatic increase in the price of several of the raw materialsused in making Greebes. This change in the ceteris paribus conditions underlying the original supply of Greebes will result in a decrease in supply, and we would have a new set of data, such as that shown in the table Decrease in Supply of Greebes. Study the data in the new table, and plotthis supply of Greebes on Plotting Supply of Greebes. Label the new supply curve S1 and answer thequestions that follow.
Decrease in Supply of Greebes
Price Quantity supplied($ per Greebe) (millions of Greebes)
$.20 50.25 100.30 150.35 200.40 250
Comparing the new supply curve (S1) with the old supply curve (S), we can say that a decrease in the supply of Greebes results in a shift of the supply curve to the (right/left). Such ashift indicates that at each of the possible prices shown, suppliers are now willing to offer a (smaller/larger) quantity, and at each of the possible quantities shown, suppliers are willing toaccept a (higher/lower) minimum price.
Now, to take another example, let’s suppose that there is a dramatic decrease in the price ofseveral of the raw materials used in making Greebes. This change in the ceteris paribus conditionsunderlying the original supply of Greebes will result in an increase in supply, and we would havea new set of data, such as that shown in the table Increase in Supply of Greebes. Study the data inthe new table, and plot this supply of Greebes on Plotting Supply of Greebes. Label the new supplycurve S2 and answer the questions that follow.
Increase in Supply of Greebes
Price Quantity supplied($ per Greebe) (millions of Greebes)
$.10 150.15 200.20 250.25 300.30 350
14
Unit 1
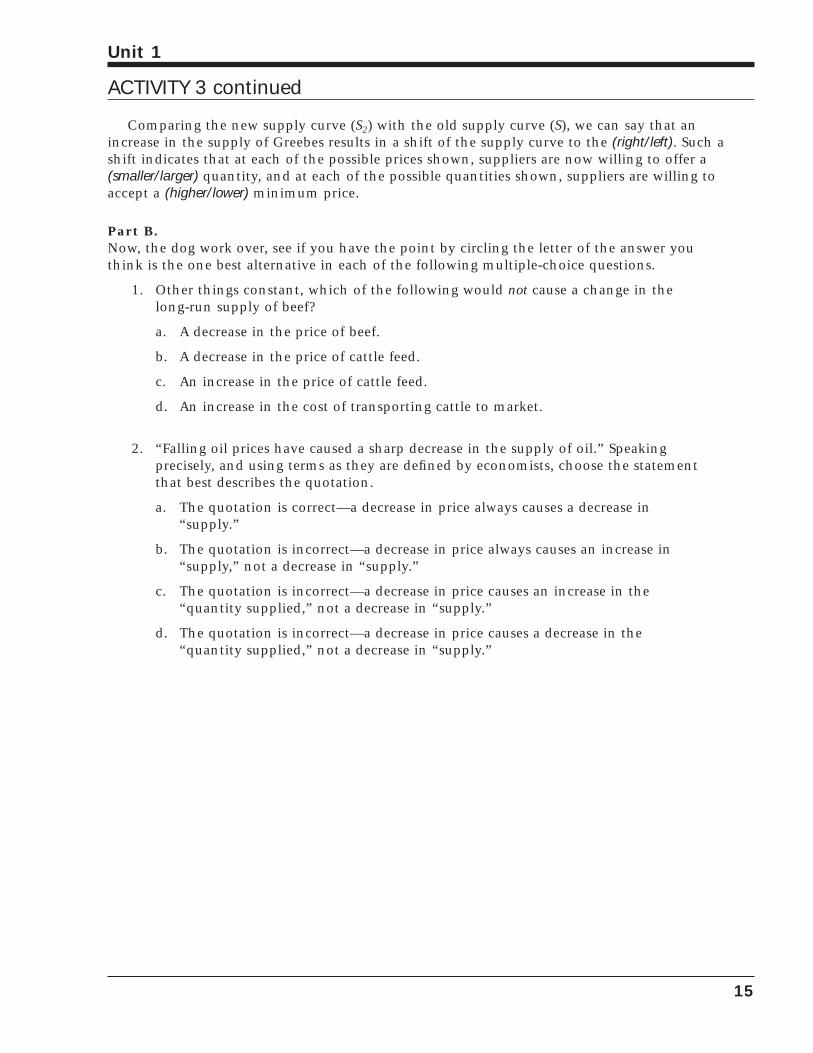
Comparing the new supply curve (S2) with the old supply curve (S), we can say that an increase in the supply of Greebes results in a shift of the supply curve to the (right/left). Such ashift indicates that at each of the possible prices shown, suppliers are now willing to offer a (smaller/larger) quantity, and at each of the possible quantities shown, suppliers are willing toaccept a (higher/lower) minimum price.
Part B.Now, the dog work over, see if you have the point by circling the letter of the answer you think is the one best alternative in each of the following multiple-choice questions.
1. Other things constant, which of the following would not cause a change in thelong-run supply of beef?
a. A decrease in the price of beef.
b. A decrease in the price of cattle feed.
c. An increase in the price of cattle feed.
d. An increase in the cost of transporting cattle to market.
2. “Falling oil prices have caused a sharp decrease in the supply of oil.” Speaking precisely, and using terms as they are defined by economists, choose the statementthat best describes the quotation.
a. The quotation is correct—a decrease in price always causes a decrease in“supply.”
b. The quotation is incorrect—a decrease in price always causes an increase in“supply,” not a decrease in “supply.”
c. The quotation is incorrect—a decrease in price causes an increase in the“quantity supplied,” not a decrease in “supply.”
d. The quotation is incorrect—a decrease in price causes a decrease in the“quantity supplied,” not a decrease in “supply.”
15
Unit 1
ACTIVITY 3 continued

16
Unit 1
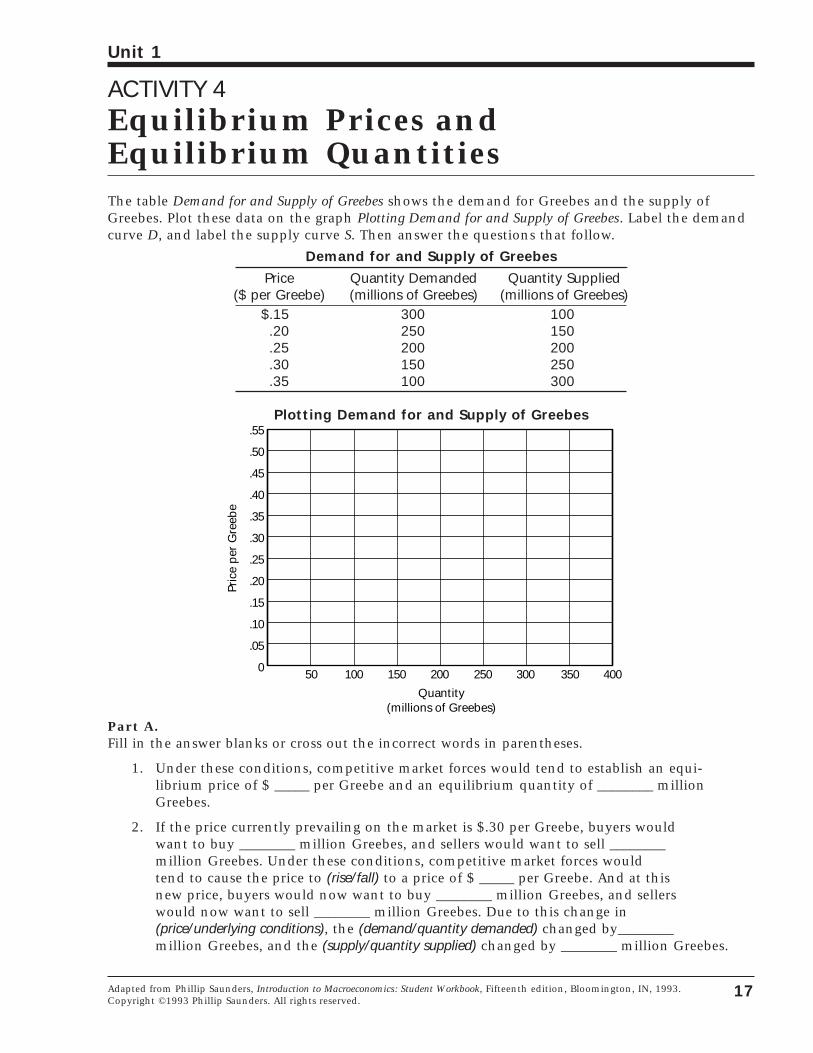
ACTIVITY 4Equilibrium Prices and Equilibrium QuantitiesThe table Demand for and Supply of Greebes shows the demand for Greebes and the supply ofGreebes. Plot these data on the graph Plotting Demand for and Supply of Greebes. Label the demandcurve D, and label the supply curve S. Then answer the questions that follow.
Demand for and Supply of Greebes________________ __________________Price Quantity Demanded Quantity Supplied
($ per Greebe) (millions of Greebes) (millions of Greebes)$.15 300 100
.20 250 150
.25 200 200
.30 150 250
.35 100 300
Plotting Demand for and Supply of Greebes
Part A.Fill in the answer blanks or cross out the incorrect words in parentheses.
1. Under these conditions, competitive market forces would tend to establish an equi-librium price of $ _____ per Greebe and an equilibrium quantity of ________ millionGreebes.
2. If the price currently prevailing on the market is $.30 per Greebe, buyers would want to buy ________ million Greebes, and sellers would want to sell ________ million Greebes. Under these conditions, competitive market forces would tend to cause the price to (rise/fall) to a price of $ _____ per Greebe. And at this new price, buyers would now want to buy ________ million Greebes, and sellers would now want to sell ________ million Greebes. Due to this change in (price/underlying conditions), the (demand/quantity demanded) changed by________ million Greebes, and the (supply/quantity supplied) changed by ________ million Greebes.
Pric
e p
er G
reeb
e
Quantity(millions of Greebes)
.55
.50
.45
.40
.35
.30
.25
.20
.15
.10
.05
0 50 100 150 200 250 300 350 400
17
Unit 1
Adapted from Phillip Saunders, Introduction to Macroeconomics: Student Workbook, Fifteenth edition, Bloomington, IN, 1993.Copyright ©1993 Phillip Saunders. All rights reserved.
ACTIVITY 4 continued
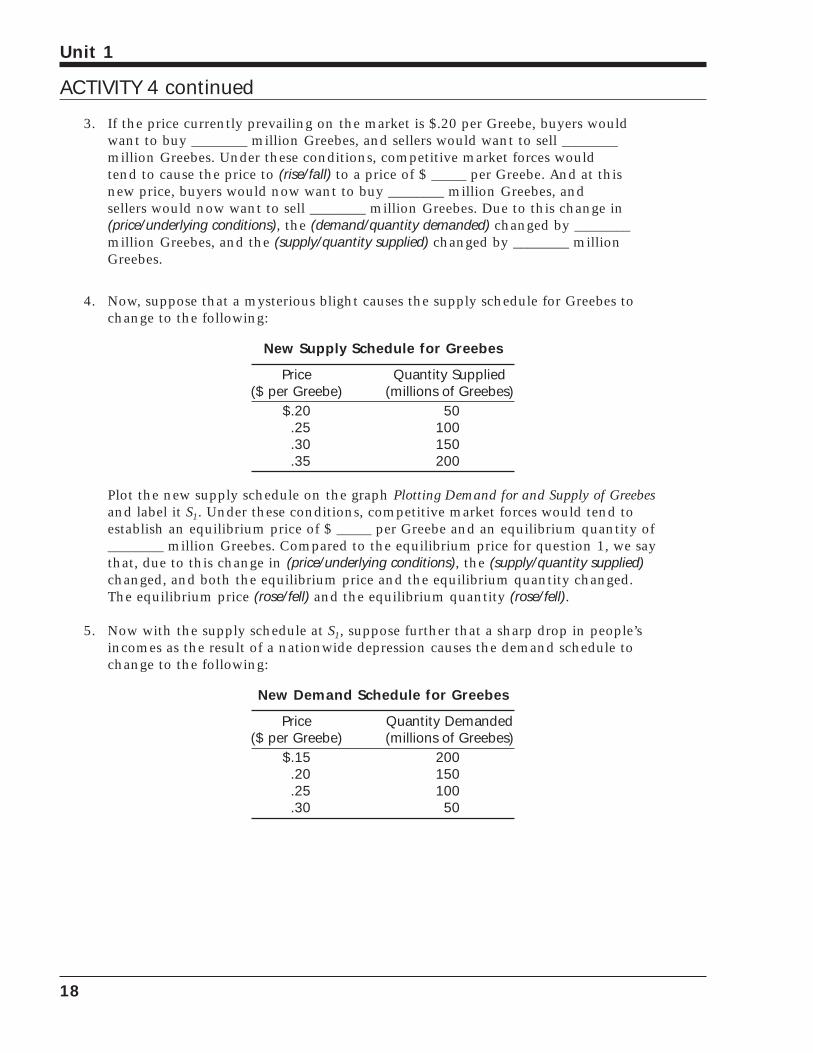
3. If the price currently prevailing on the market is $.20 per Greebe, buyers wouldwant to buy ________ million Greebes, and sellers would want to sell ________ million Greebes. Under these conditions, competitive market forces would tend to cause the price to (rise/fall) to a price of $ _____ per Greebe. And at this new price, buyers would now want to buy ________ million Greebes, and sellers would now want to sell ________ million Greebes. Due to this change in(price/underlying conditions), the (demand/quantity demanded) changed by ________million Greebes, and the (supply/quantity supplied) changed by ________ millionGreebes.
4. Now, suppose that a mysterious blight causes the supply schedule for Greebes tochange to the following:
New Supply Schedule for Greebes
Price Quantity Supplied($ per Greebe) (millions of Greebes)
$.20 50.25 100.30 150.35 200
Plot the new supply schedule on the graph Plotting Demand for and Supply of Greebesand label it S1. Under these conditions, competitive market forces would tend toestablish an equilibrium price of $ _____ per Greebe and an equilibrium quantity of________ million Greebes. Compared to the equilibrium price for question 1, we saythat, due to this change in (price/underlying conditions), the (supply/quantity supplied)changed, and both the equilibrium price and the equilibrium quantity changed.The equilibrium price (rose/fell) and the equilibrium quantity (rose/fell).
5. Now with the supply schedule at S1, suppose further that a sharp drop in people’sincomes as the result of a nationwide depression causes the demand schedule tochange to the following:
New Demand Schedule for Greebes
Price Quantity Demanded($ per Greebe) (millions of Greebes)
$.15 200.20 150.25 100.30 50
18
Unit 1
ACTIVITY 4 continued
Plot the new demand schedule on the graph Plotting Demand for and Supply ofGreebes and label it D1. Under these conditions, with the supply schedule at S1,competitive market forces would tend to establish an equilibrium price of $ _____ per Greebe and an equilibrium quantity of ________ million Greebes. Compared to the equilibrium price in question 4, due to this change in (price/underlying conditions), the (demand/quantity demanded) changed. The equilibrium price (rose/fell) and the equilibrium quantity (rose/fell).
6. If market conditions were represented by D1 and S, the equilibrium price would be$ _____ per Greebe, and the equilibrium quantity would be ________ millionGreebes.
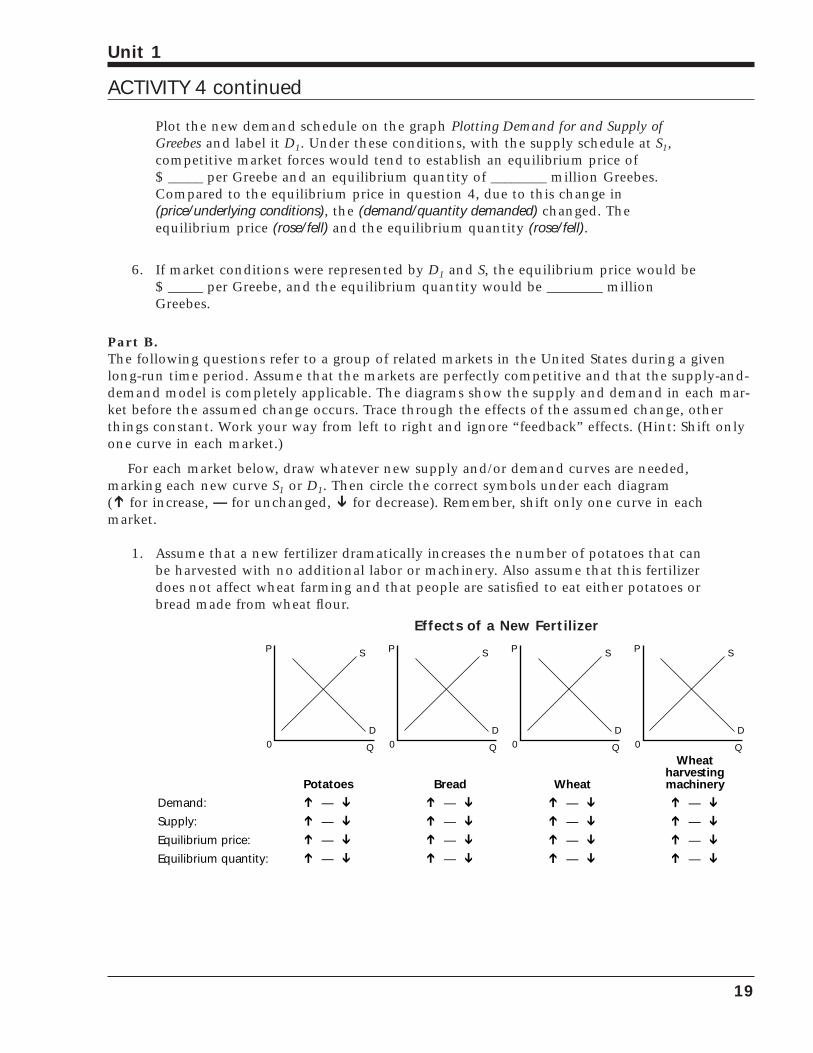
Part B.The following questions refer to a group of related markets in the United States during a givenlong-run time period. Assume that the markets are perfectly competitive and that the supply-and-demand model is completely applicable. The diagrams show the supply and demand in each mar-ket before the assumed change occurs. Trace through the effects of the assumed change, otherthings constant. Work your way from left to right and ignore “feedback” effects. (Hint: Shift onlyone curve in each market.)
For each market below, draw whatever new supply and/or demand curves are needed, marking each new curve S1 or D1. Then circle the correct symbols under each diagram (Õ for increase, — for unchanged, Ô for decrease). Remember, shift only one curve in each market.
1. Assume that a new fertilizer dramatically increases the number of potatoes that canbe harvested with no additional labor or machinery. Also assume that this fertilizerdoes not affect wheat farming and that people are satisfied to eat either potatoes orbread made from wheat flour.
Effects of a New Fertilizer
P
Q
D
S P
Q
D
S P
Q
D
S P
Q
D
S
0 0 0 0
Potatoes
Demand:
Supply:
Equilibrium price:
Equilibrium quantity:
ÔÔÔÔ
ÕÕÕÕ
—
—
—
—
Bread
ÔÔÔÔ
ÕÕÕÕ
—
—
—
—
Wheat
ÔÔÔÔ
ÕÕÕÕ
—
—
—
—
Wheatharvestingmachinery
ÔÔÔÔ
ÕÕÕÕ
—
—
—
—
19
Unit 1
ACTIVITY 4 continued
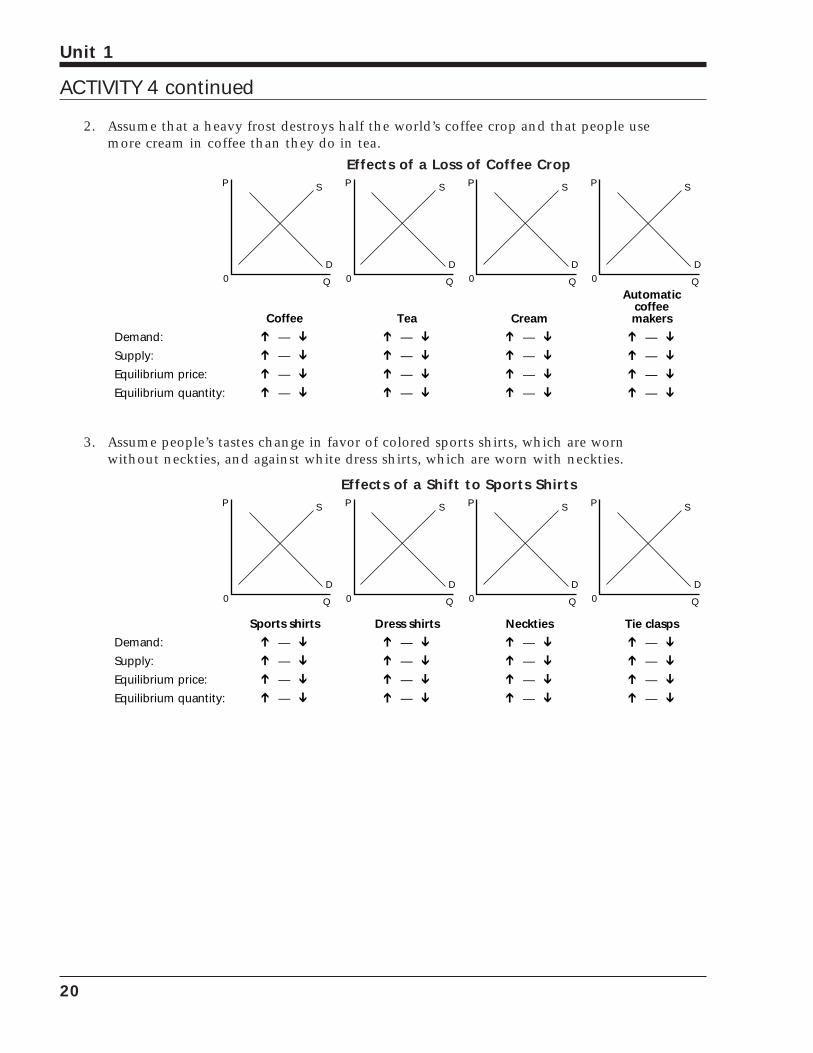
2. Assume that a heavy frost destroys half the world’s coffee crop and that people usemore cream in coffee than they do in tea.
Effects of a Loss of Coffee Crop
3. Assume people’s tastes change in favor of colored sports shirts, which are wornwithout neckties, and against white dress shirts, which are worn with neckties.
Effects of a Shift to Sports ShirtsP
Q
D
S P
Q
D
S P
Q
D
S P
Q
D
S
0 0 0 0
Sports shirts
Demand:
Supply:
Equilibrium price:
Equilibrium quantity:
ÔÔÔÔ
ÕÕÕÕ
—
—
—
—
Dress shirts
ÔÔÔÔ
ÕÕÕÕ
—
—
—
—
Neckties
ÔÔÔÔ
ÕÕÕÕ
—
—
—
—
Tie clasps
ÔÔÔÔ
ÕÕÕÕ
—
—
—
—
P
Q
D
S P
Q
D
S P
Q
D
S P
Q
D
S
0 0 0 0
Coffee
Demand:
Supply:
Equilibrium price:
Equilibrium quantity:
ÔÔÔÔ
ÕÕÕÕ
—
—
—
—
Tea
ÔÔÔÔ
ÕÕÕÕ
—
—
—
—
Cream
ÔÔÔÔ
ÕÕÕÕ
—
—
—
—
Automaticcoffeemakers
ÔÔÔÔ
ÕÕÕÕ
—
—
—
—
20
Unit 1
ACTIVITY 4 continued
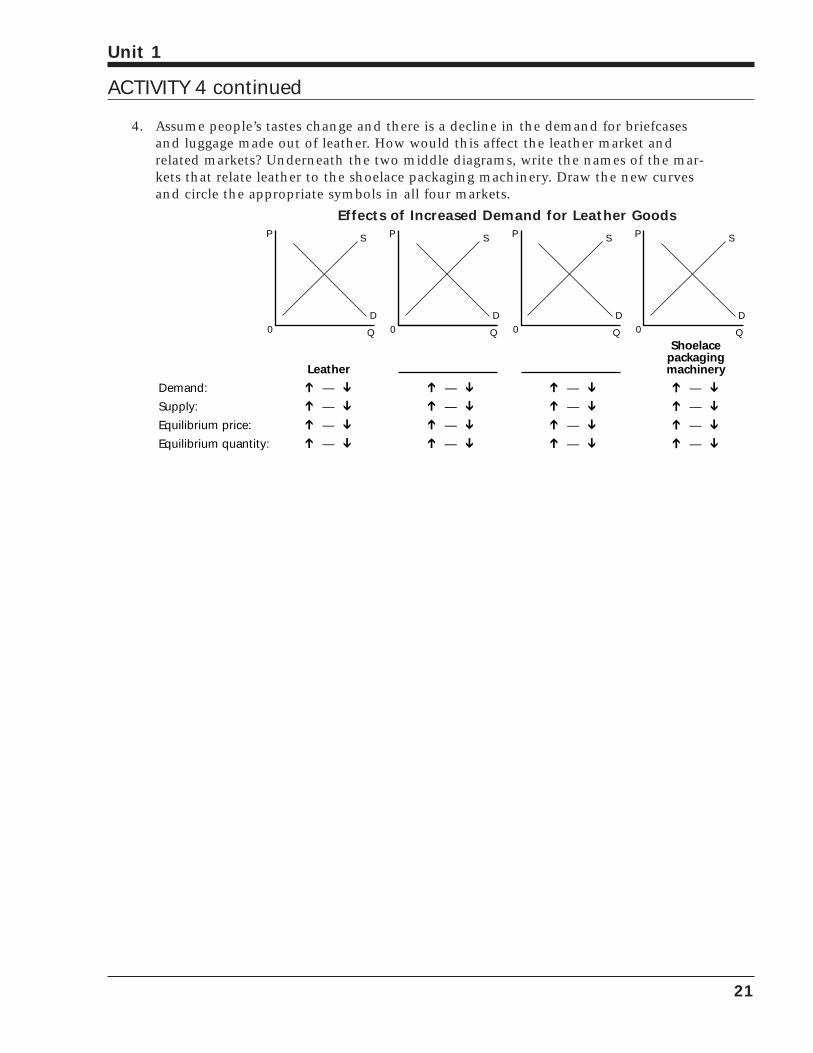
4. Assume people’s tastes change and there is a decline in the demand for briefcasesand luggage made out of leather. How would this affect the leather market andrelated markets? Underneath the two middle diagrams, write the names of the mar-kets that relate leather to the shoelace packaging machinery. Draw the new curvesand circle the appropriate symbols in all four markets.
Effects of Increased Demand for Leather GoodsP
Q
D
S P
Q
D
S P
Q
D
S P
Q
D
S
0 0 0 0
Leather
Demand:
Supply:
Equilibrium price:
Equilibrium quantity:
ÔÔÔÔ
ÕÕÕÕ
—
—
—
—
ÔÔÔÔ
ÕÕÕÕ
—
—
—
—
ÔÔÔÔ
ÕÕÕÕ
—
—
—
—
Shoelacepackagingmachinery
ÔÔÔÔ
ÕÕÕÕ
—
—
—
—
21
Unit 1

22
Unit 1
Sample Multiple-Choice QuestionsCircle the letter of each correct answer.
23
Unit 1
1. To be considered scarce, an economicresource must be:
I. Limited.
II. Free.
III. Desirable.
a. I only
b. I and II only
c. II and III only
d. I and III only
e. I, II, and III
2. The value of the best alternative forgonewhen a decision is made defines:
a. Economic good.
b. Opportunity cost.
c. Scarcity.
d. Tradeoff.
e. Comparative advantage.
3. An example of the opportunity cost of pro-ducing an additional unit of product A is:
a. All of the human and capital resourcesused to produce product A.
b. The retail price paid for product A.
c. The wholesale price of product A.
d. The amount of product B that cannotnow be produced because of product A.
e. The profit that could have been madefrom producing product A.
4. In which way does a straight-line productionpossibilities curve differ from a concaveproduction possibilities curve?
a. A straight-line production possibilitiescurve has a decreasing opportunity cost.
b. A straight-line production possibilitiescurve has a constant opportunity cost.
c. A straight-line production possibilitiescurve has an increasing opportunitycost.
d. A straight-line production possibilitiescurve does not show opportunity cost.
e. There is no difference between the twoproduction possibilities curves.
5. The law of increasing opportunity cost isreflected in the shape of the:
a. Production possibilities curve concave to the origin.
b. Production possibilities curve convex to the origin.
c. Horizontal production possibilitiescurve.
d. Straight-line production possibilitiescurve.
e. Upward-sloping production possibilities curve.
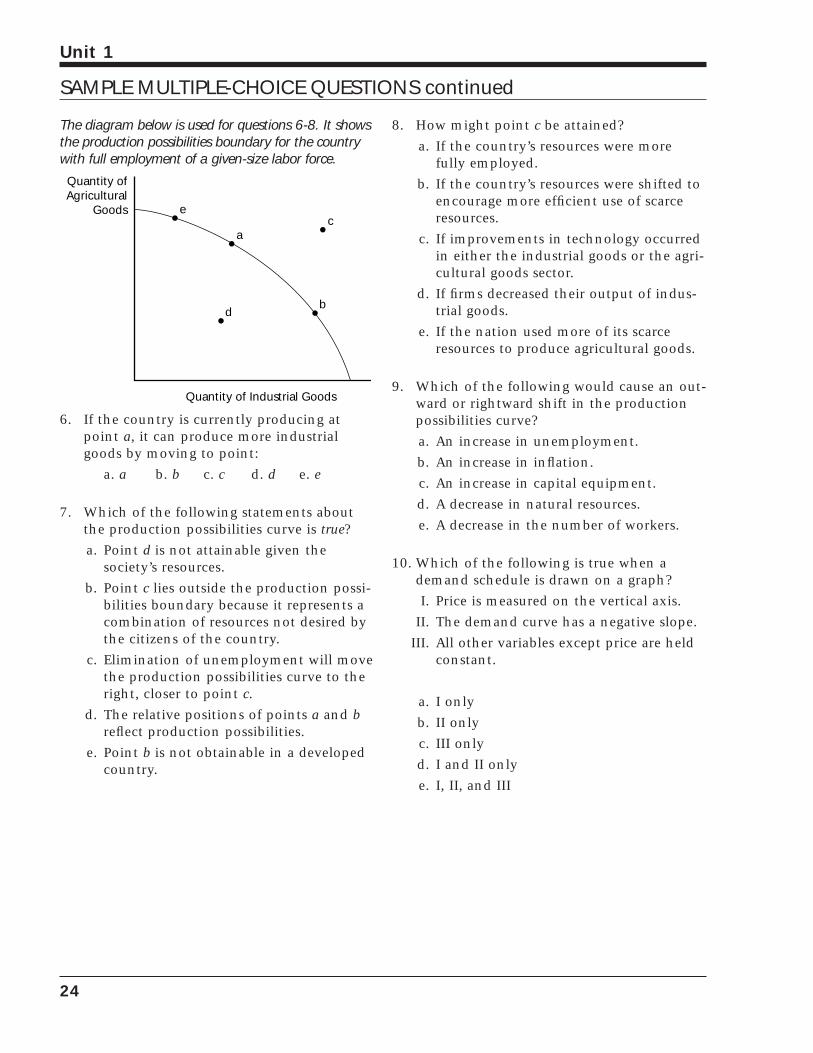
The diagram below is used for questions 6-8. It showsthe production possibilities boundary for the countrywith full employment of a given-size labor force.
6. If the country is currently producing atpoint a, it can produce more industrialgoods by moving to point:
a. a b. b c. c d. d e. e
7. Which of the following statements aboutthe production possibilities curve is true?
a. Point d is not attainable given the society’s resources.
b. Point c lies outside the production possi-bilities boundary because it represents acombination of resources not desired bythe citizens of the country.
c. Elimination of unemployment will movethe production possibilities curve to theright, closer to point c.
d. The relative positions of points a and breflect production possibilities.
e. Point b is not obtainable in a developedcountry.
8. How might point c be attained?
a. If the country’s resources were morefully employed.
b. If the country’s resources were shifted toencourage more efficient use of scarceresources.
c. If improvements in technology occurredin either the industrial goods or the agri-cultural goods sector.
d. If firms decreased their output of indus-trial goods.
e. If the nation used more of its scarceresources to produce agricultural goods.
9. Which of the following would cause an out-ward or rightward shift in the productionpossibilities curve?
a. An increase in unemployment.
b. An increase in inflation.
c. An increase in capital equipment.
d. A decrease in natural resources.
e. A decrease in the number of workers.
10. Which of the following is true when ademand schedule is drawn on a graph?
I. Price is measured on the vertical axis.
II. The demand curve has a negative slope.
III. All other variables except price are heldconstant.
a. I only
b. II only
c. III only
d. I and II only
e. I, II, and III
e
ac
bd
Quantity ofAgricultural
Goods
Quantity of Industrial Goods
24
Unit 1
SAMPLE MULTIPLE-CHOICE QUESTIONS continued
11. If there is an increase in demand, what willhappen to the price and quantity of thegood exchanged?
Price Quantitya. Increase Decreaseb. Increase Increasec. Decrease Increased. Decrease Decreasee. No change Increase
12. What effect would a decrease in the price ofsilicon chips and a greater production ofuser-friendly software have on the price andquantity of computers?
Price Quantitya. Increase Decreaseb. Increase Increasec. Decrease Cannot be
determinedd. Cannot be Increase
determinede. Decrease Decrease
13. An increase in the price of gasoline shiftsthe demand for tires in which direction?
a. To the left, because gasoline and tires aresubstitutes.
b. To the left, because gasoline and tires arenormally used together.
c. To the right, because gasoline and tiresare substitutes.
d. To the right, because gasoline and tiresare normally used together.
e. To the right, because an increase in theprice of gasoline makes consumers poor-er and thus not willing to pay as muchfor tires.
14. Four of the five events described belowmight reasonably be expected to shift thedemand curve for beef to a new position.One would not shift that demand curve.What is the single exception?
a. A fall in the price of beef.
b. A change in people’s tastes with respectto beef.
c. An increase in the money incomes ofbeef consumers.
d. A widespread advertising campaignundertaken by the producers of a prod-uct competitive with beef, such as pork.
e. Expectations that beef prices will fall inthe future.
15. This question is based on the followingdata:
Year Quantity sold Price
1994 30,000 $10
1995 50,000 $20
Which of the following statements is/are true?
I. Demand has increased.
II. Quantity demanded has increased.
III. Supply has increased.
IV. Quantity supplied has increased.
V. Supply has decreased.
a. I only
b. V only
c. I and IV only
d. I and V only
e. I, II, and III only
25
Unit 1
SAMPLE MULTIPLE-CHOICE QUESTIONS continued

26
Unit 1
Sample Short Essay Questions
1. True, false, or uncertain, and why? “The economic concept of scarcity is not relevantto the study of a modern economy such as that of the United States because theexistence of unsold stocks of goods (books, cars, homes) is vivid evidence that weare surrounded by plenty, not scarcity.”
2. A newspaper headline says, “The Coldest Winter in 20 Years Brings Record Pricesfor Heating Oil.”
a. Draw a diagram that illustrates this economic condition.
b. Explain your diagram.
3. In a recent year, the price of wheat fell. Draw three diagrams showing this is consistent with the following:
a. The quantity of wheat decreasing.
b. The quantity of wheat increasing.
c. The quantity of wheat staying the same.
Briefly explain each of these diagrams.
4. True, false, or uncertain, and why? “If you won a million dollars in the lottery, youwouldn’t have the economic problem of scarcity.”
27
Unit 1

28
Unit 1
Sample Long Essay Questions
1. Every society has the fundamental problem of scarcity.
a. What is scarcity?
b. What three questions must every society answer because of scarcity?
c. What are the three ways societies have dealt with the scarcity problem?
d. Give one example of how each way is used in the United States.
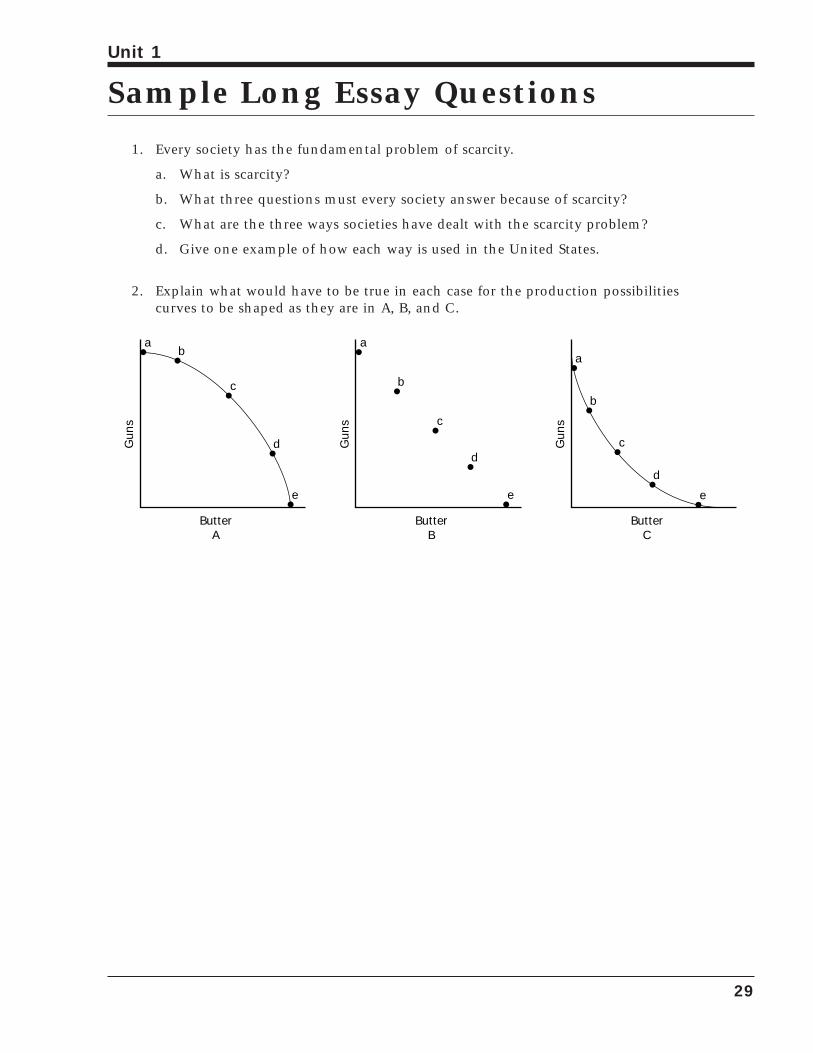
2. Explain what would have to be true in each case for the production possibilitiescurves to be shaped as they are in A, B, and C.
Gun
s
ButterA
ab
c
d
e
Gun
s
ButterB
a
b
c
d
e
Gun
s
ButterC
a
b
c
d
e
29
Unit 1
SAMPLE LONG ESSAY QUESTIONS continued
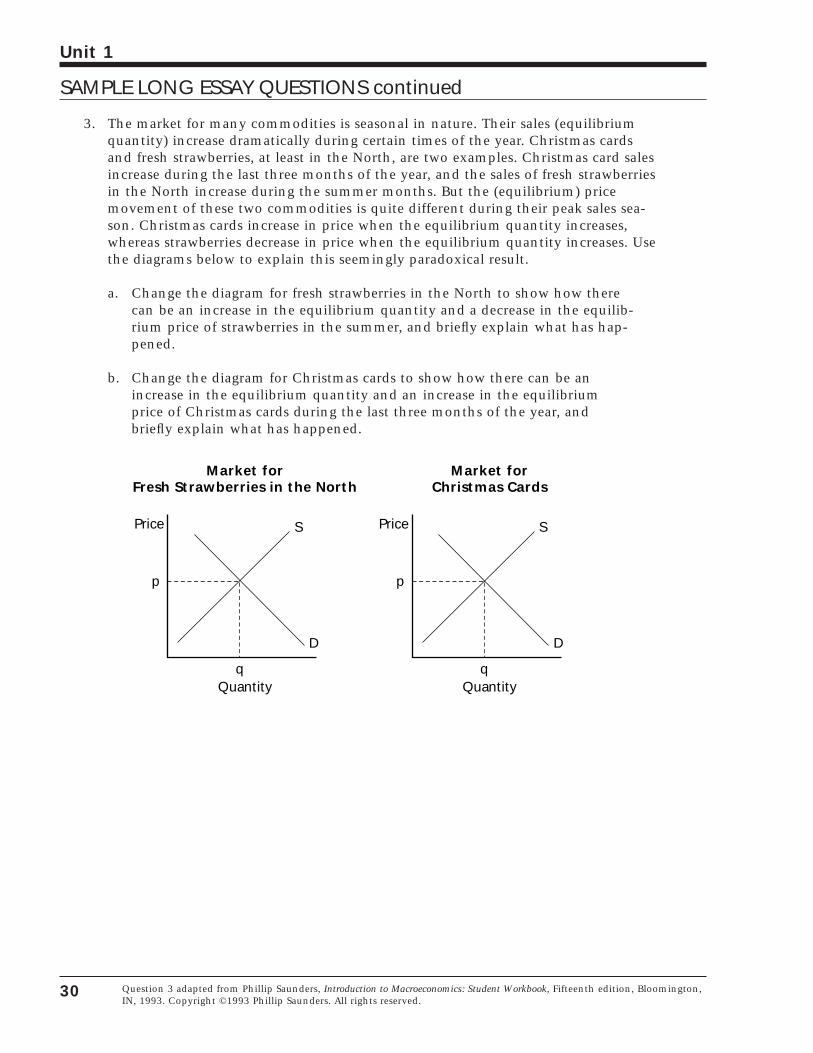
3. The market for many commodities is seasonal in nature. Their sales (equilibriumquantity) increase dramatically during certain times of the year. Christmas cardsand fresh strawberries, at least in the North, are two examples. Christmas card salesincrease during the last three months of the year, and the sales of fresh strawberriesin the North increase during the summer months. But the (equilibrium) pricemovement of these two commodities is quite different during their peak sales sea-son. Christmas cards increase in price when the equilibrium quantity increases,whereas strawberries decrease in price when the equilibrium quantity increases. Usethe diagrams below to explain this seemingly paradoxical result.
a. Change the diagram for fresh strawberries in the North to show how therecan be an increase in the equilibrium quantity and a decrease in the equilib-rium price of strawberries in the summer, and briefly explain what has hap-pened.
b. Change the diagram for Christmas cards to show how there can be anincrease in the equilibrium quantity and an increase in the equilibriumprice of Christmas cards during the last three months of the year, andbriefly explain what has happened.
p
q
D
SPrice
Quantity
Market forChristmas Cards
p
q
D
SPrice
Quantity
Market forFresh Strawberries in the North
30
Unit 1
Question 3 adapted from Phillip Saunders, Introduction to Macroeconomics: Student Workbook, Fifteenth edition, Bloomington,IN, 1993. Copyright ©1993 Phillip Saunders. All rights reserved.
Macroeconomics
Unit 2Measuring EconomicPerformance
31

32
Unit 2
Key Ideas
33
Unit 2
• Macroeconomics is the study of the economy asa whole; microeconomics is the study of indi-vidual parts of the economy such as businesses,households, and prices. Macroeconomics looksat the forest, microeconomics at the trees.
• A circular-flow diagram illustrates the majorflows of goods and services, resources, andmoney in an economy. It shows how changes inthose flows can alter the level of goods and ser-vices, employment, and income.
• Gross Domestic Product (GDP) is the marketvalue of all final goods and services produced ina nation in one year; it is the most importantmeasurement of production and output.
• GDP counts only final goods and services; itdoes not count intermediate goods and services.
• GDP also does not count secondhand goods; thebuying and selling of stocks and bonds; andtransfer payments such as social security bene-fits, unemployment compensation, and certaininterest payments.
• GDP includes profits earned by foreign-ownedbusinesses and income earned by foreigners inthe United States, but it excludes profits earnedby U.S.-owned companies overseas and incomeearned by U.S. citizens working abroad.
• GDP is most easily calculated in two ways: (1) add all the consumption, investment, andgovernment expenditures plus net exports; and(2) add all the incomes received by owners ofproductive resources in the economy.
• Gross National Product (GNP) includes profitsearned by U.S.-owned companies overseas andincome earned by U.S. citizens working abroad,but it does not include profits earned by for-eign-owned companies in the United States orincome earned by foreigners working in thiscountry.
• Other measures derived from national incomeaccounting measures include Net National Product(NNP), National Income (NI), Personal Income(PI), and Disposable Personal Income (DPI).
• In 1991, the basic measurement of output andproduction in the United States was changedfrom GNP to GDP. Most other nations alreadyused GDP, and this change reflected the increas-ing interdependence of the world’s economies.
• Price indexes are used to measure price changesin the economy; they are used to compare theprices of a given “bundle” or “market basket” ofgoods and services in one year with the pricesof the same “bundle” or “market basket” inanother year.
• A price index has a base year, and the price levelin that year is given an index number of 100;the price level in all other years is expressed as apercentage of the price level in the base year.
• Price index number = Current year prices x 100Base year prices
• The most frequently used price indexes are theGDP Price Deflator, the Consumer Price Index(CPI), and the Producer Price Index (PPI).
• Real GDP is adjusted for price changes; nominalGDP is not adjusted for price changes.
• Inflation is a general increase in the overallprice level.
• Savers, lenders, and people on fixed incomesgenerally are hurt by unanticipated inflation;borrowers gain from unanticipated inflation.
• Unemployment occurs when people who arewilling and able to work cannot find jobs at satisfactory wage rates.
• Unemployment is classified into four categories:frictional, cyclical, structural, and seasonal.
• The unemployment rate represents the percent-age of the labor force that cannot find work onacceptable terms.
• Full employment is not defined to mean zerounemployment. Frictional and structural unemployment exist even with zero cyclicalunemployment.
• A business cycle measures the ups and downs ofeconomic activity over a period of years.
• The phases of the business cycle are expansion,peak, contraction, and trough.

34
Unit 2
ACTIVITY 5Test of Macroeconomic ThinkingCircle T for true or F for false in the statements that follow.
T F 1. If the United States could maintain a high economic growth rate, we wouldeventually be able to satisfy everyone’s wants for goods and services.
T F 2. If all the nations of the world disarmed, the international economy wouldcollapse into a long depression and unemployment would increase.
T F 3. Money is an important economic resource.
T F 4. The higher the GDP, the better off all the people of the country are.
T F 5. Full employment means zero unemployment.
T F 6. The United States has had an inflation rate of at least three percent for each ofthe last 30 years.
T F 7. Inflation hurts almost everyone.
T F 8. Money consists mainly of currency and coins and is created by governmentprinting presses and mints.
T F 9. The value of the dollar is determined by the fact that it is backed by gold.
T F 10. Most economists believe the only purpose of taxes is to provide money forgovernment.
T F 11. The chief task of the Federal Reserve Board is to insure the deposits of bankcustomers.
T F 12. Tariffs are needed to protect our standard of living from competition fromcheap foreign labor.
35
Unit 2
Activity developed by John Morton.

36
Unit 2
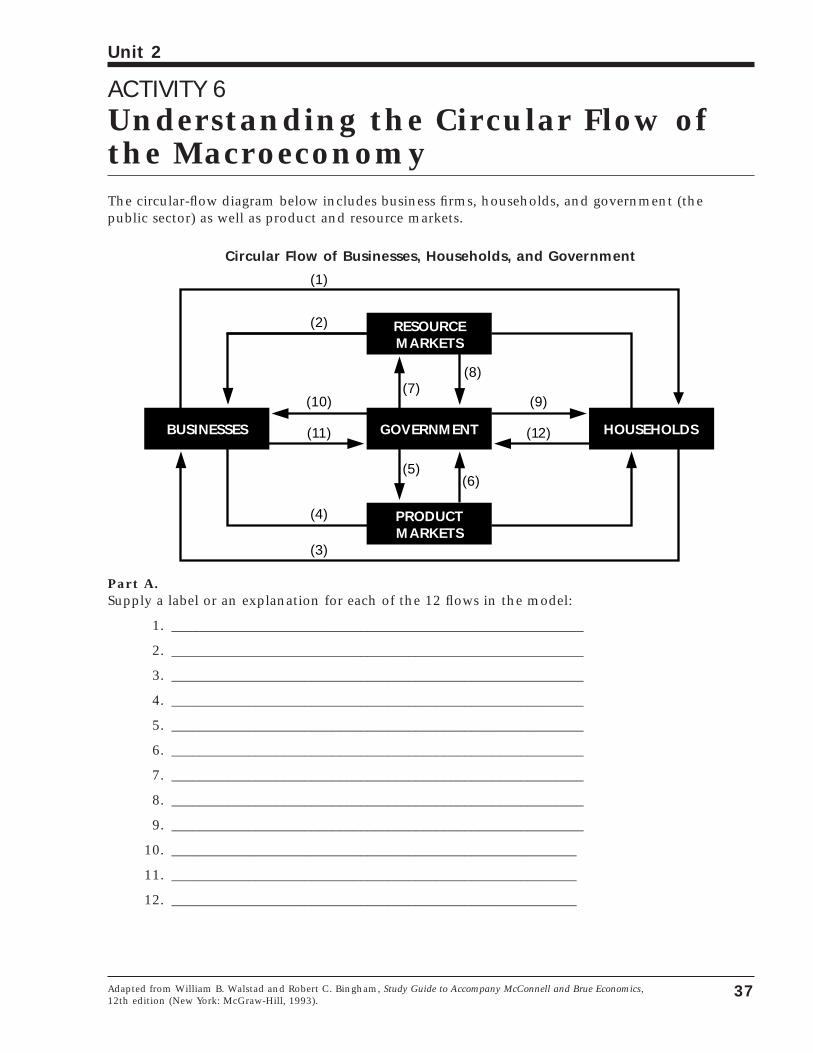
ACTIVITY 6Understanding the Circular Flow ofthe MacroeconomyThe circular-flow diagram below includes business firms, households, and government (the public sector) as well as product and resource markets.
Circular Flow of Businesses, Households, and Government
Part A.Supply a label or an explanation for each of the 12 flows in the model:
1. ___________________________________________________________
2. ___________________________________________________________
3. ___________________________________________________________
4. ___________________________________________________________
5. ___________________________________________________________
6. ___________________________________________________________
7. ___________________________________________________________
8. ___________________________________________________________
9. ___________________________________________________________
10. __________________________________________________________
11. __________________________________________________________
12. __________________________________________________________
BUSINESSES HOUSEHOLDS
PRODUCTMARKETS
GOVERNMENT
RESOURCEMARKETS
(10)
(11)
(2)
(1)
(3)
(4)
(7)(8)
(5)(6)
(9)
(12)
37
Unit 2
Adapted from William B. Walstad and Robert C. Bingham, Study Guide to Accompany McConnell and Brue Economics, 12th edition (New York: McGraw-Hill, 1993).
ACTIVITY 6 continued
Part B.Use the number that labels each flow on the diagram, Circular Flow of Businesses, Households andGovernment, to complete questions 1 and 2. Cross out the incorrect words in question 3.
1. If government wanted to expand output and employment in the economy, itwould increase expenditure flows ______ or ______, decrease net tax flows ______ or______, or do both.
2. If government wanted to increase the production of public (social) goods anddecrease the production of private goods in the economy, it would increase flows______ and ______ or ______.
3. If government wanted to redistribute income from high-income to low-incomehouseholds, it would (increase/decrease) the net taxes (taxes minus transfers) paid byhigh-income households and (increase/decrease) the net taxes paid by low-incomehouseholds.
38
Unit 2
ACTIVITY 7Numbers That Make News*
39
Unit 2
Copyright 1994 by Consumers Union of U.S., Inc., Yonkers, NY 10703-1057. Reprinted by permission from CONSUMERREPORTS, August 1994.
You hear the phrases all the time: “The CPIis up,” “the prime is down,” “the GDP isflat.” Though your first impulse may be to
change the channel, such numbers are at leastas relevant to most consumers’ lives as the lat-est sports scores. Here’s a quick guide to someof the most influential economic statistics andwhat they can mean to you.
Consumer price index (CPI). This is a mea-sure of the average change in prices paid byurban consumers for a “market basket” ofgoods and services, including food, clothing,shelter, transportation, and prescriptiondrugs. The items in the index are averaged andgiven weights that relate to their importance inoverall spending. As with any weighted index,however, the overall CPI probably won’t matchyour own budget. If you have hospital bills orcollege tuition to pay, your spending for thoseitems will be far higher than what the CPI con-siders average for a household. For that rea-son, the CPI is often faulted as an unrealisticmeasure.
Realistic or not, it remains influential. Theincrease in the CPI is what most people think ofas the “inflation rate.” A 5 percent annualincrease in the CPI, for example, is interpretedas an inflation rate of 5 percent. The inflationrate is used by manufacturers and retailers inpredicting future price increases, by employersin calculating salaries and pensions, and by thegovernment in determining cost-of-livingincreases for Social Security recipients.
Produce price index (PPI). While the CPImeasures retail prices, the Producer PriceIndex measures changes in prices received byproducers of commodities or finished goodsbefore those products are sold to individuals orbusinesses. The PPI provides a clue to thefuture costs that consumers will pay. When pro-ducers receive higher prices from retailers fortheir products, it’s likely that those increaseswill be passed on to consumers. There isn’talways much you can do about it, but a majorincrease in the PPI may be a signal to stock upon nonperishables or to consider buying a newcar this year instead of next.
Unemployment rate. In simplest terms,this is the number of unemployed people divid-ed by the number in the total labor force. Ifthere were 1000 unemployed in a labor force of50,000, for example, the unemployment ratewould be 2 percent (1000 divided by 50,000).
However, the unemployment rate is not aprecise measure of the number of people whoare out of work. The government counts peopleas being employed even if they worked only onehour in the surveyed week. And it doesn’tinclude as members of the labor force so-called “discouraged workers”—people whomight be able to work but who haven’t activelylooked for a job in the preceding four weeks.For those reasons, critics charge that the realunemployment rate in the U.S. is always sever-al percentage points higher than the one that isannounced every month. To consumers whohaven’t joined the unemployment statisticsthemselves, a low unemployment rate may be asignal that it’s a good time to sell a home orstart a business. A high unemployment rate mayindicate that it’s time to give serious consider-ation to one’s own job security.
Gross domestic product (GDP). This is ameasure of the total value of all finished goodsand services produced within the UnitedStates. (A former measure, gross nationalproduct, included goods produced by U.S. indi-viduals or businesses operating overseas;gross domestic product eliminates productionabroad but includes production in the U.S. byforeign-owned companies. Honda and Toyotaautomobiles manufactured in the U.S., forexample, are included in the gross domesticproduct.)
GDP is perhaps the most importantbarometer of national economic health. A risingGDP points to a strong and expanding economy,one in which consumers are likely to feel betterabout their job security or about making majorpurchases; a falling GDP is associated withhigher unemployment and overall economicweakness.
Index of leading economic indicators. Theeconomists’ attempt to predict where theeconomy is headed, this index consists of 11indicators, including initial claims for unem-ployment insurance, new orders placed to man-ufacturers, residential building permits, moneysupply, and the length of the average workweek. The word “leading” refers not to popu-larity but to the fact that movements in theseindicators tend to precede more noticeablechanges in the economy. The index is consid-ered a predictor of what will be happening inthe economy six to nine months in the futureand is worth a look before you make any majorcareer or financial moves.
Prime rate. This is the interest rate bankscharge their best commercial customers. Theprime rate is significant to consumers becausemany types of loans have interest rates that arepegged to it. An adjustable-rate home-equityloan, for example, may have an interest rateexpressed as “prime plus 21⁄2” meaning theprime rate (7.25 percent in mid-June) plus 2.5points, or 9.75 percent. If the prime rate goesup or down, loans pegged to the prime will fol-low in the same direction.
Existing-home sales. This statistic is gath-ered by the National Association of Realtorsand reflects sales of single-family homes thatwere owned by someone other than theirbuilders. Existing homes account for about 80percent of all home sales.
Existing-home sales provide a quick checkon how healthy the U.S. residential real-estatemarket is. If sales are high, then the market isconsidered healthy, with many people able topurchase their first homes or trade up to larg-er ones. That’s good news for homeownerswishing to sell. Falling home sales may indicatea saturated or overpriced housing market,sometimes due to higher interest rates or togenerally bleak economic conditions that makepeople wary of taking on a new mortgage.Falling sales can be bad news for home sellers,but good news for would-be buyers with bothmoney and fortitude.
A strong dollar (or a weak one). Wheneconomic commentators refer to the U.S. dol-lar as being “strong” or “weak,” they’re talkingabout its value compared with other countries’currencies. When the dollar is strong, it isworth more yen, francs, lire, pounds, and soforth.
For American consumers, a strong dollarmeans that you may be able to buy importedgoods for less money than would otherwise bethe case. It also means that your money isworth more when you travel abroad—a dollarthat’s worth nine French francs (as was thecase in the mid-1980s) goes a lot farther thanone that’s worth 5.5 francs (as was the caseearlier [in 1994]).
A weak dollar isn’t necessarily bad news. Itmeans that the U.S. is a better deal for touristsfrom other countries; it also can be a boon forU.S. manufacturers because the exchange ratemay make their goods cheaper for foreignersand therefore easier to sell overseas.
ACTIVITY 7 continued
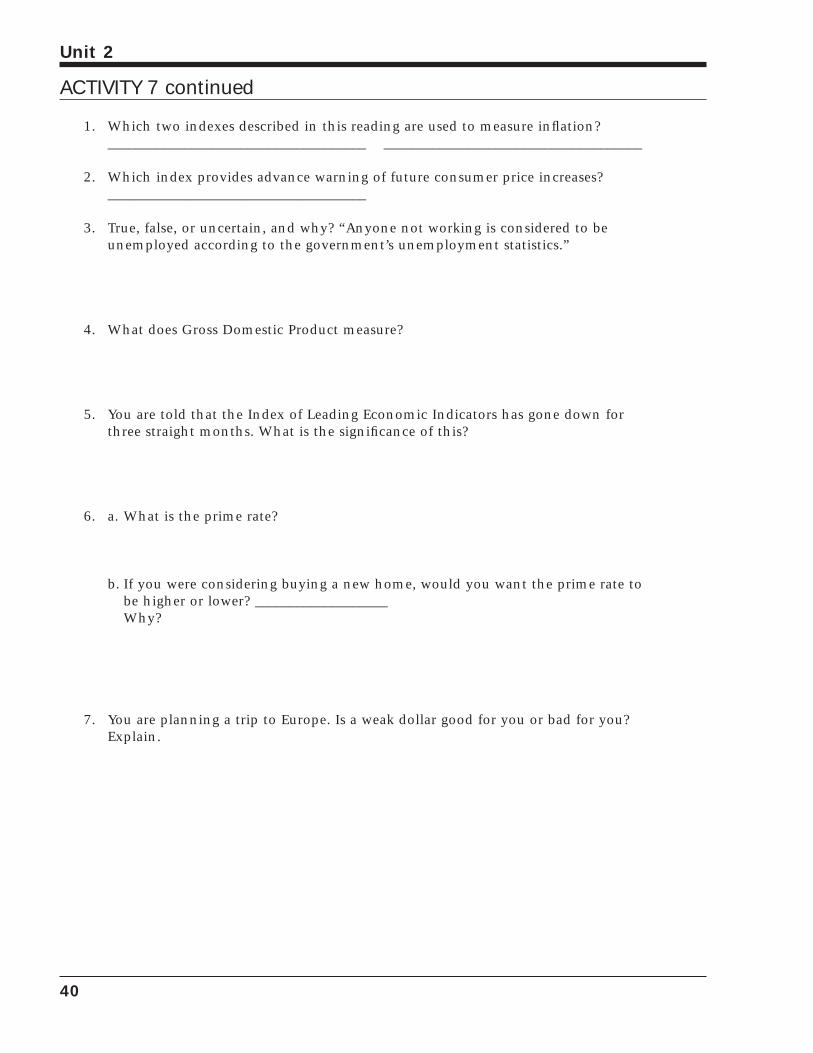
1. Which two indexes described in this reading are used to measure inflation?_____________________________________ _____________________________________
2. Which index provides advance warning of future consumer price increases? _____________________________________
3. True, false, or uncertain, and why? “Anyone not working is considered to be unemployed according to the government’s unemployment statistics.”
4. What does Gross Domestic Product measure?
5. You are told that the Index of Leading Economic Indicators has gone down forthree straight months. What is the significance of this?
6. a. What is the prime rate?
b. If you were considering buying a new home, would you want the prime rate tobe higher or lower? ___________________Why?
7. You are planning a trip to Europe. Is a weak dollar good for you or bad for you?Explain.
40
Unit 2
ACTIVITY 8Measuring Broad Economic Goals
41
Unit 2
From Master Curriculum Guide in Economics: Teaching Strategies for High School Economics Courses. (New York: National Councilon Economic Education, 1985), p.126.
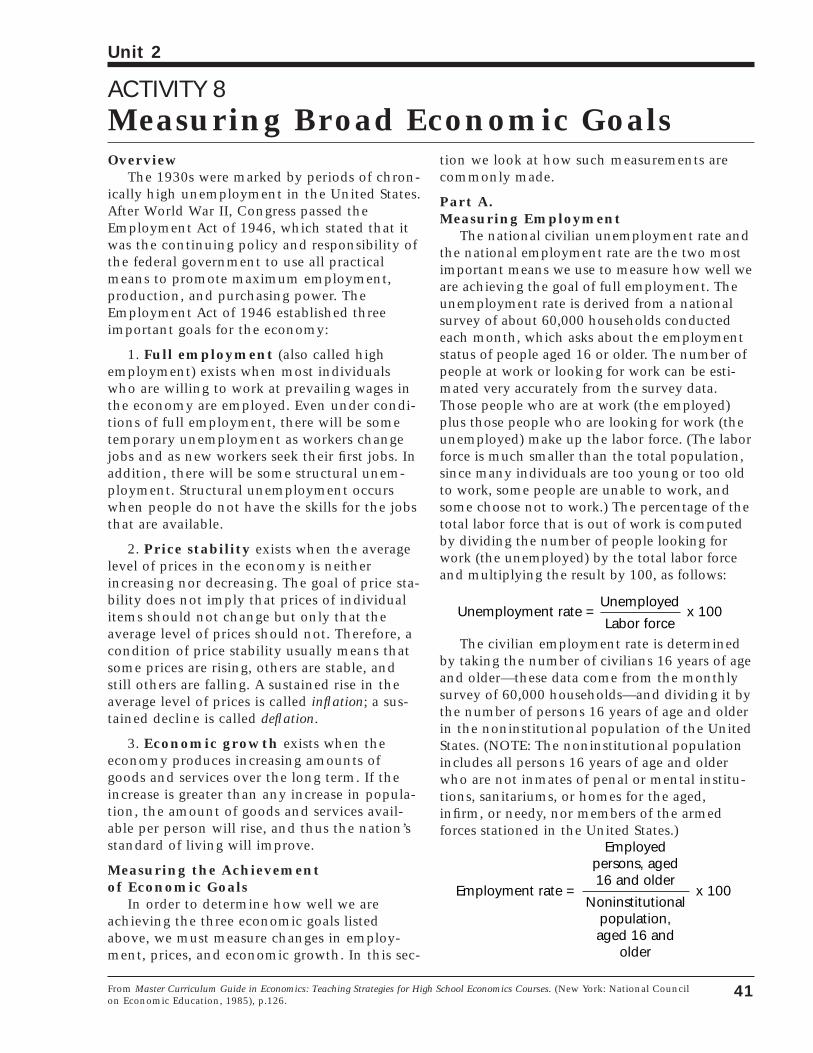
OverviewThe 1930s were marked by periods of chron-
ically high unemployment in the United States.After World War II, Congress passed theEmployment Act of 1946, which stated that itwas the continuing policy and responsibility ofthe federal government to use all practicalmeans to promote maximum employment,production, and purchasing power. TheEmployment Act of 1946 established threeimportant goals for the economy:
1. Full employment (also called highemployment) exists when most individualswho are willing to work at prevailing wages inthe economy are employed. Even under condi-tions of full employment, there will be sometemporary unemployment as workers changejobs and as new workers seek their first jobs. Inaddition, there will be some structural unem-ployment. Structural unemployment occurswhen people do not have the skills for the jobsthat are available.
2. Price stability exists when the averagelevel of prices in the economy is neitherincreasing nor decreasing. The goal of price sta-bility does not imply that prices of individualitems should not change but only that theaverage level of prices should not. Therefore, acondition of price stability usually means thatsome prices are rising, others are stable, andstill others are falling. A sustained rise in theaverage level of prices is called inflation; a sus-tained decline is called deflation.
3. Economic growth exists when theeconomy produces increasing amounts ofgoods and services over the long term. If theincrease is greater than any increase in popula-tion, the amount of goods and services avail-able per person will rise, and thus the nation’sstandard of living will improve.
Measuring the Achievement of Economic Goals
In order to determine how well we areachieving the three economic goals listedabove, we must measure changes in employ-ment, prices, and economic growth. In this sec-
tion we look at how such measurements arecommonly made.
Part A.Measuring Employment
The national civilian unemployment rate andthe national employment rate are the two mostimportant means we use to measure how well weare achieving the goal of full employment. Theunemployment rate is derived from a nationalsurvey of about 60,000 households conductedeach month, which asks about the employmentstatus of people aged 16 or older. The number ofpeople at work or looking for work can be esti-mated very accurately from the survey data.Those people who are at work (the employed)plus those people who are looking for work (theunemployed) make up the labor force. (The laborforce is much smaller than the total population,since many individuals are too young or too oldto work, some people are unable to work, andsome choose not to work.) The percentage of thetotal labor force that is out of work is computedby dividing the number of people looking forwork (the unemployed) by the total labor forceand multiplying the result by 100, as follows:
The civilian employment rate is determinedby taking the number of civilians 16 years of ageand older—these data come from the monthlysurvey of 60,000 households—and dividing it bythe number of persons 16 years of age and olderin the noninstitutional population of the UnitedStates. (NOTE: The noninstitutional populationincludes all persons 16 years of age and olderwho are not inmates of penal or mental institu-tions, sanitariums, or homes for the aged,infirm, or needy, nor members of the armedforces stationed in the United States.)
Employment rate =
Employedpersons, aged16 and older
Noninstitutionalpopulation,aged 16 and
older
x 100
Unemployment rate =Unemployed
Labor forcex 100
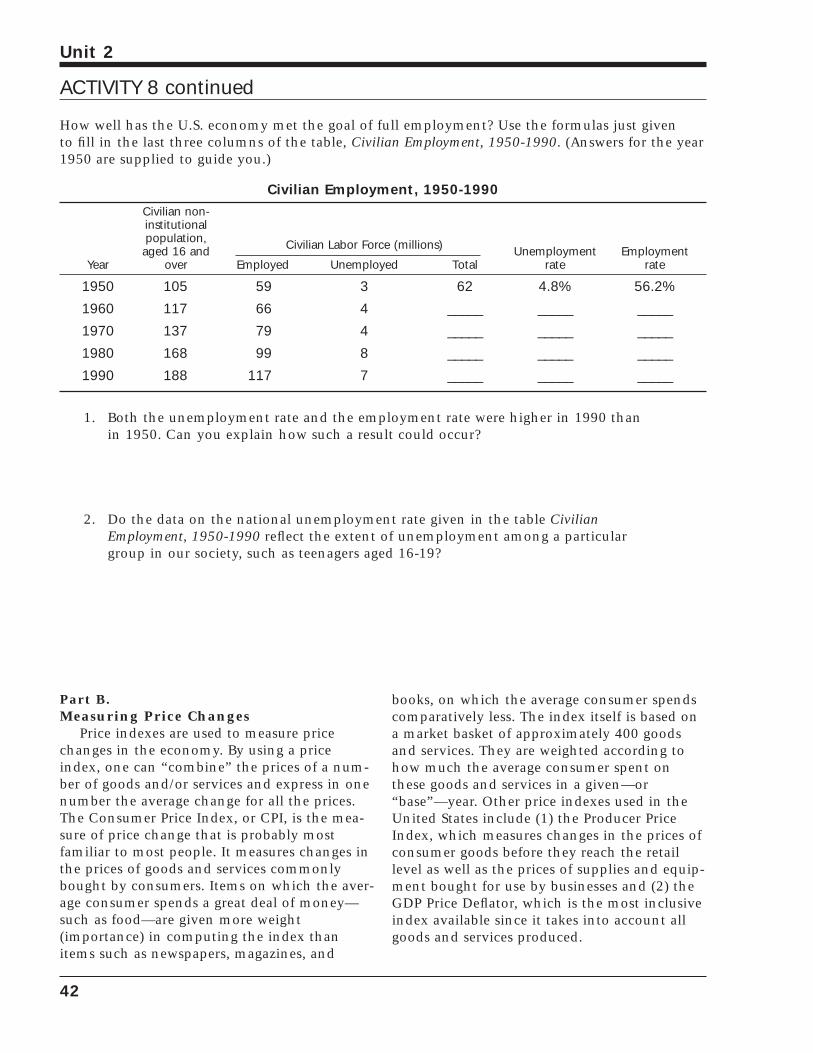
Part B.Measuring Price Changes
Price indexes are used to measure pricechanges in the economy. By using a priceindex, one can “combine” the prices of a num-ber of goods and/or services and express in onenumber the average change for all the prices.The Consumer Price Index, or CPI, is the mea-sure of price change that is probably mostfamiliar to most people. It measures changes inthe prices of goods and services commonlybought by consumers. Items on which the aver-age consumer spends a great deal of money—such as food—are given more weight(importance) in computing the index thanitems such as newspapers, magazines, and
books, on which the average consumer spendscomparatively less. The index itself is based ona market basket of approximately 400 goodsand services. They are weighted according tohow much the average consumer spent onthese goods and services in a given—or“base”—year. Other price indexes used in theUnited States include (1) the Producer PriceIndex, which measures changes in the prices ofconsumer goods before they reach the retaillevel as well as the prices of supplies and equip-ment bought for use by businesses and (2) theGDP Price Deflator, which is the most inclusiveindex available since it takes into account allgoods and services produced.
42
Unit 2
How well has the U.S. economy met the goal of full employment? Use the formulas just given to fill in the last three columns of the table, Civilian Employment, 1950-1990. (Answers for the year1950 are supplied to guide you.)
Civilian Employment, 1950-1990
Civilian non-institutionalpopulation,aged 16 and Civilian Labor Force (millions) Unemployment Employment
Year over Employed Unemployed Total rate rate
1950 105 59 3 62 4.8% 56.2%
1960 117 66 4 _____ _____ _____
1970 137 79 4 _____ _____ _____
1980 168 99 8 _____ _____ _____
1990 188 117 7 _____ _____ _____
1. Both the unemployment rate and the employment rate were higher in 1990 thanin 1950. Can you explain how such a result could occur?
2. Do the data on the national unemployment rate given in the table CivilianEmployment, 1950-1990 reflect the extent of unemployment among a particulargroup in our society, such as teenagers aged 16-19?
ACTIVITY 8 continued
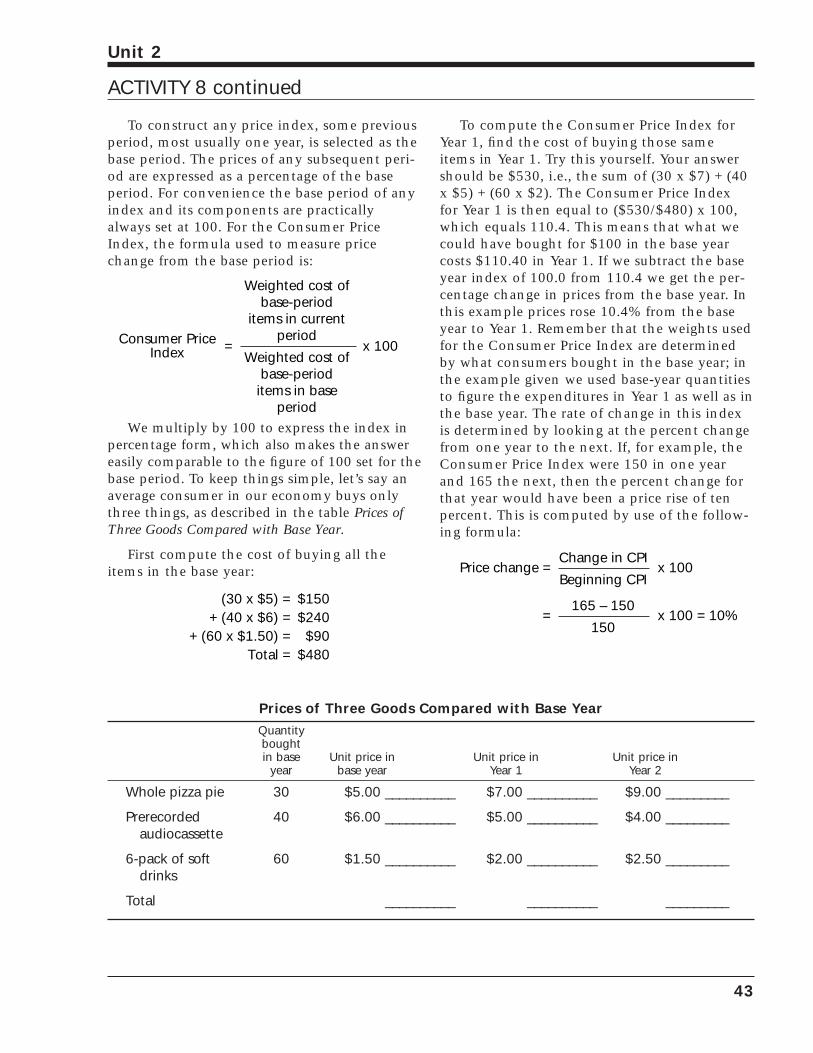
To construct any price index, some previousperiod, most usually one year, is selected as thebase period. The prices of any subsequent peri-od are expressed as a percentage of the baseperiod. For convenience the base period of anyindex and its components are practicallyalways set at 100. For the Consumer PriceIndex, the formula used to measure pricechange from the base period is:
We multiply by 100 to express the index inpercentage form, which also makes the answereasily comparable to the figure of 100 set for thebase period. To keep things simple, let’s say anaverage consumer in our economy buys onlythree things, as described in the table Prices ofThree Goods Compared with Base Year.
First compute the cost of buying all theitems in the base year:
To compute the Consumer Price Index forYear 1, find the cost of buying those sameitems in Year 1. Try this yourself. Your answershould be $530, i.e., the sum of (30 x $7) + (40x $5) + (60 x $2). The Consumer Price Indexfor Year 1 is then equal to ($530/$480) x 100,which equals 110.4. This means that what wecould have bought for $100 in the base yearcosts $110.40 in Year 1. If we subtract the baseyear index of 100.0 from 110.4 we get the per-centage change in prices from the base year. Inthis example prices rose 10.4% from the baseyear to Year 1. Remember that the weights usedfor the Consumer Price Index are determinedby what consumers bought in the base year; inthe example given we used base-year quantitiesto figure the expenditures in Year 1 as well as inthe base year. The rate of change in this indexis determined by looking at the percent changefrom one year to the next. If, for example, theConsumer Price Index were 150 in one yearand 165 the next, then the percent change forthat year would have been a price rise of tenpercent. This is computed by use of the follow-ing formula:
Price change =Change in CPI
Beginning CPIx 100
=165 – 150
150x 100 = 10%
(30 x $5) = $150+ (40 x $6) = $240
+ (60 x $1.50) =Total =
$90$480
Consumer PriceIndex
Weighted cost ofbase-period
items in currentperiod
Weighted cost ofbase-period
items in baseperiod
x 100=
43
Unit 2
ACTIVITY 8 continued
Prices of Three Goods Compared with Base Year
Quantityboughtin base Unit price in Unit price in Unit price in
year base year Year 1 Year 2
Whole pizza pie 30 $5.00 __________ $7.00 __________ $9.00 _________
Prerecorded 40 $6.00 __________ $5.00 __________ $4.00 _________audiocassette
6-pack of soft 60 $1.50 __________ $2.00 __________ $2.50 _________drinks
Total __________ __________ _________
Now try the following problems, based on the table Prices of Three Goods Compared with Base Year.
1. What is the cost of buying the base-year items in Year 2? _________
2. What is the CPI for Year 2? _________
3. What was the percentage increase in prices from the base year to Year 2? _________
4. In December 1990, the CPI was at 130.7, and in December 1991, the CPI was at 136.2.What was the percentage change in prices for this 12-month period? _________
44
Unit 2
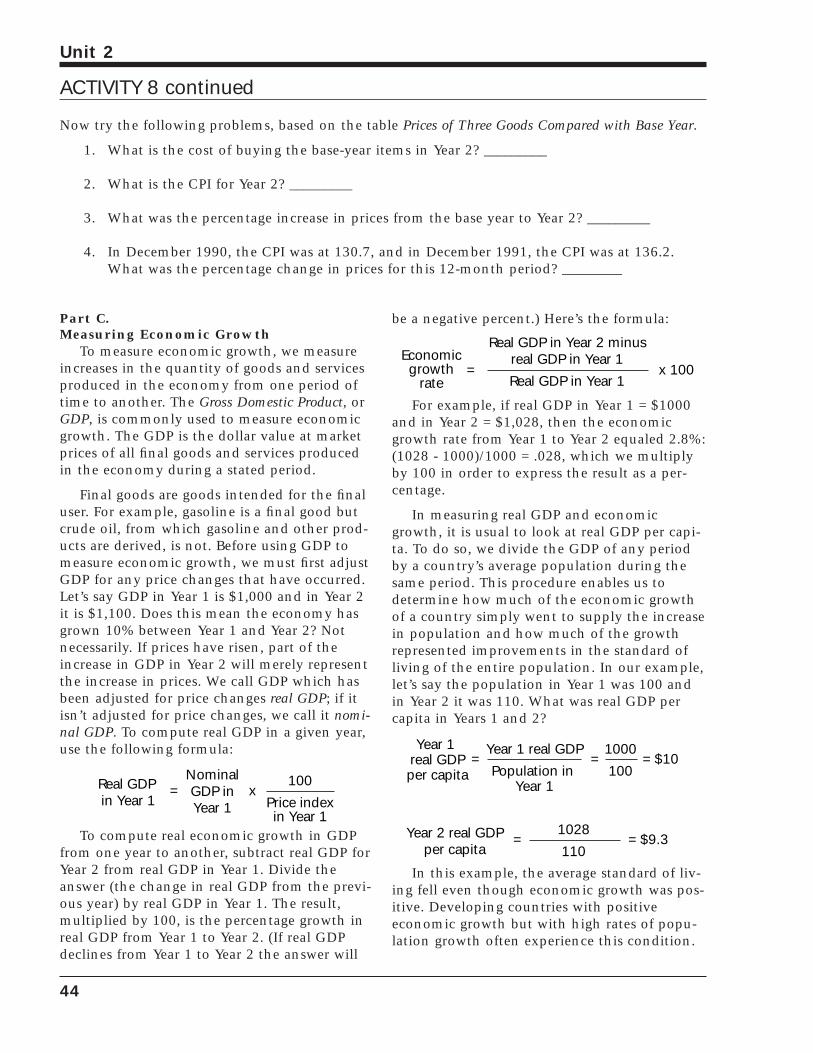
Part C.Measuring Economic Growth
To measure economic growth, we measureincreases in the quantity of goods and servicesproduced in the economy from one period oftime to another. The Gross Domestic Product, orGDP, is commonly used to measure economicgrowth. The GDP is the dollar value at marketprices of all final goods and services producedin the economy during a stated period.
Final goods are goods intended for the finaluser. For example, gasoline is a final good butcrude oil, from which gasoline and other prod-ucts are derived, is not. Before using GDP tomeasure economic growth, we must first adjustGDP for any price changes that have occurred.Let’s say GDP in Year 1 is $1,000 and in Year 2it is $1,100. Does this mean the economy hasgrown 10% between Year 1 and Year 2? Notnecessarily. If prices have risen, part of theincrease in GDP in Year 2 will merely representthe increase in prices. We call GDP which hasbeen adjusted for price changes real GDP; if itisn’t adjusted for price changes, we call it nomi-nal GDP. To compute real GDP in a given year,use the following formula:
To compute real economic growth in GDPfrom one year to another, subtract real GDP forYear 2 from real GDP in Year 1. Divide theanswer (the change in real GDP from the previ-ous year) by real GDP in Year 1. The result,multiplied by 100, is the percentage growth inreal GDP from Year 1 to Year 2. (If real GDPdeclines from Year 1 to Year 2 the answer will
be a negative percent.) Here’s the formula:
For example, if real GDP in Year 1 = $1000and in Year 2 = $1,028, then the economicgrowth rate from Year 1 to Year 2 equaled 2.8%:(1028 - 1000)/1000 = .028, which we multiplyby 100 in order to express the result as a per-centage.
In measuring real GDP and economicgrowth, it is usual to look at real GDP per capi-ta. To do so, we divide the GDP of any periodby a country’s average population during thesame period. This procedure enables us todetermine how much of the economic growthof a country simply went to supply the increasein population and how much of the growthrepresented improvements in the standard ofliving of the entire population. In our example,let’s say the population in Year 1 was 100 andin Year 2 it was 110. What was real GDP percapita in Years 1 and 2?
In this example, the average standard of liv-ing fell even though economic growth was pos-itive. Developing countries with positiveeconomic growth but with high rates of popu-lation growth often experience this condition.
=Year 1 real GDP
Population in Year 1
=1000
100= $10
Year 1 real GDPper capita
Year 2 real GDPper capita
=1028
110= $9.3
Real GDP in Year 2 minusreal GDP in Year 1
Real GDP in Year 1x 100=
Economicgrowth
rate
Real GDPin Year 1
100
Price indexin Year 1
xNominalGDP inYear 1
=
ACTIVITY 8 continued
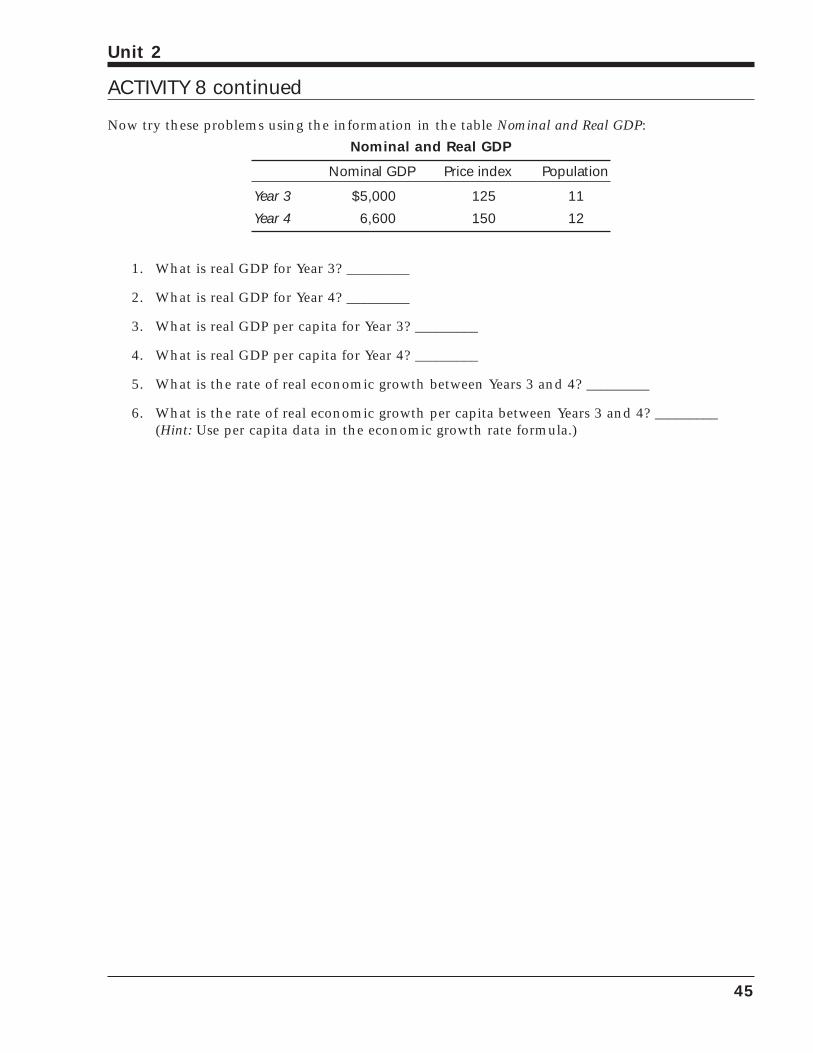
Now try these problems using the information in the table Nominal and Real GDP:
Nominal and Real GDP
Nominal GDP Price index Population
Year 3 $5,000 125 11
Year 4 6,600 150 12
1. What is real GDP for Year 3? _________
2. What is real GDP for Year 4? _________
3. What is real GDP per capita for Year 3? _________
4. What is real GDP per capita for Year 4? _________
5. What is the rate of real economic growth between Years 3 and 4? _________
6. What is the rate of real economic growth per capita between Years 3 and 4? _________(Hint: Use per capita data in the economic growth rate formula.)
45
Unit 2
ACTIVITY 8 continued
46
Unit 2
ACTIVITY 9All About GDPPart A. Is This Counted as Part of GDP?Which of the following are included and which are excluded in calculating this year’s GDP? Explain your decisions.
1. A monthly check received by an economics student who has been granted a government scholarship.
2. A farmer’s purchase of a new tractor.
3. A plumber’s purchase of a used truck.
4. The cashing of a U.S. government bond.
5. The services of a mechanic in fixing the radiator on his car.
6. A Social Security check paid by the government to a retired store clerk.
7. An increase in business inventories.
8. The government’s purchase of a new submarine for the Navy.
9. A barber’s income from cutting hair.
10. Income received from the sale of Nike stock.
47
Unit 2
Part A adapted from William B. Walstad, Michael W. Watts, Robert F. Smith, and Campbell R. McConnell, Instructor’s Manualto Accompany Economics, 10th ed. (New York: McGraw-Hill Book Co., 1987), p. 33. Parts B and C developed by John Morton.
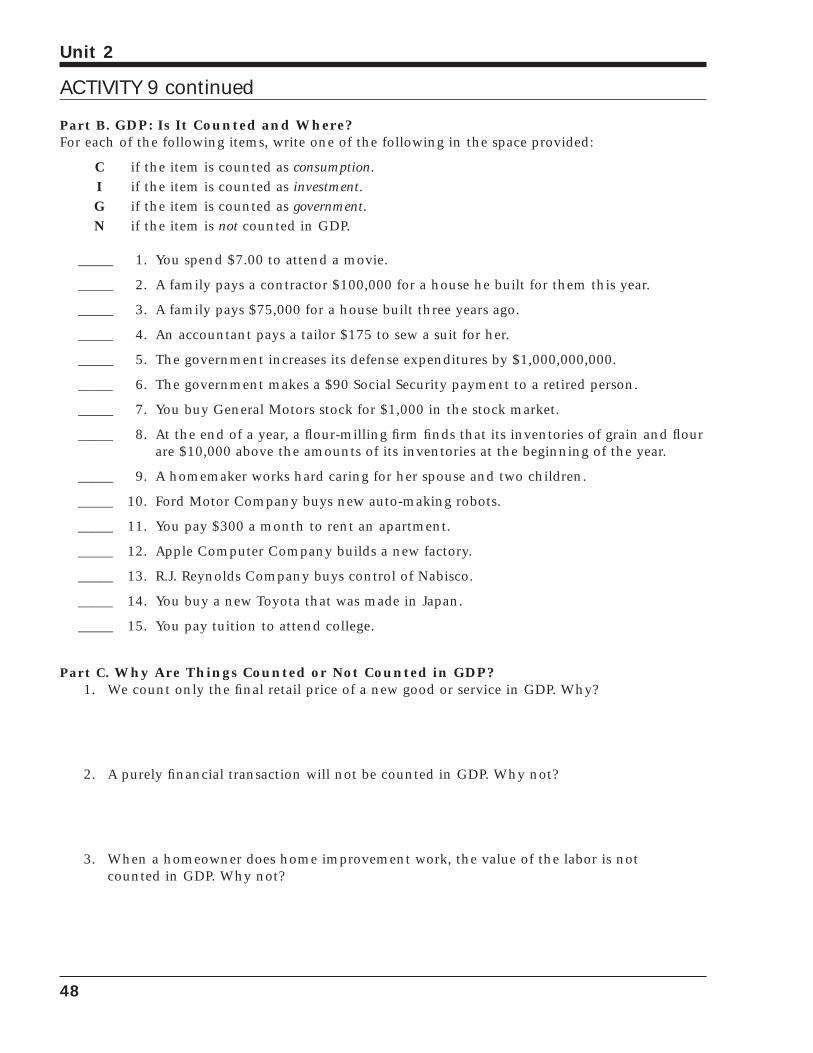
Part B. GDP: Is It Counted and Where?For each of the following items, write one of the following in the space provided:
C if the item is counted as consumption.I if the item is counted as investment.G if the item is counted as government.N if the item is not counted in GDP.
_____ 1. You spend $7.00 to attend a movie.
_____ 2. A family pays a contractor $100,000 for a house he built for them this year.
_____ 3. A family pays $75,000 for a house built three years ago.
_____ 4. An accountant pays a tailor $175 to sew a suit for her.
_____ 5. The government increases its defense expenditures by $1,000,000,000.
_____ 6. The government makes a $90 Social Security payment to a retired person.
_____ 7. You buy General Motors stock for $1,000 in the stock market.
_____ 8. At the end of a year, a flour-milling firm finds that its inventories of grain and flourare $10,000 above the amounts of its inventories at the beginning of the year.
_____ 9. A homemaker works hard caring for her spouse and two children.
_____ 10. Ford Motor Company buys new auto-making robots.
_____ 11. You pay $300 a month to rent an apartment.
_____ 12. Apple Computer Company builds a new factory.
_____ 13. R.J. Reynolds Company buys control of Nabisco.
_____ 14. You buy a new Toyota that was made in Japan.
_____ 15. You pay tuition to attend college.
Part C. Why Are Things Counted or Not Counted in GDP?1. We count only the final retail price of a new good or service in GDP. Why?
2. A purely financial transaction will not be counted in GDP. Why not?
3. When a homeowner does home improvement work, the value of the labor is notcounted in GDP. Why not?
48
Unit 2
ACTIVITY 9 continued
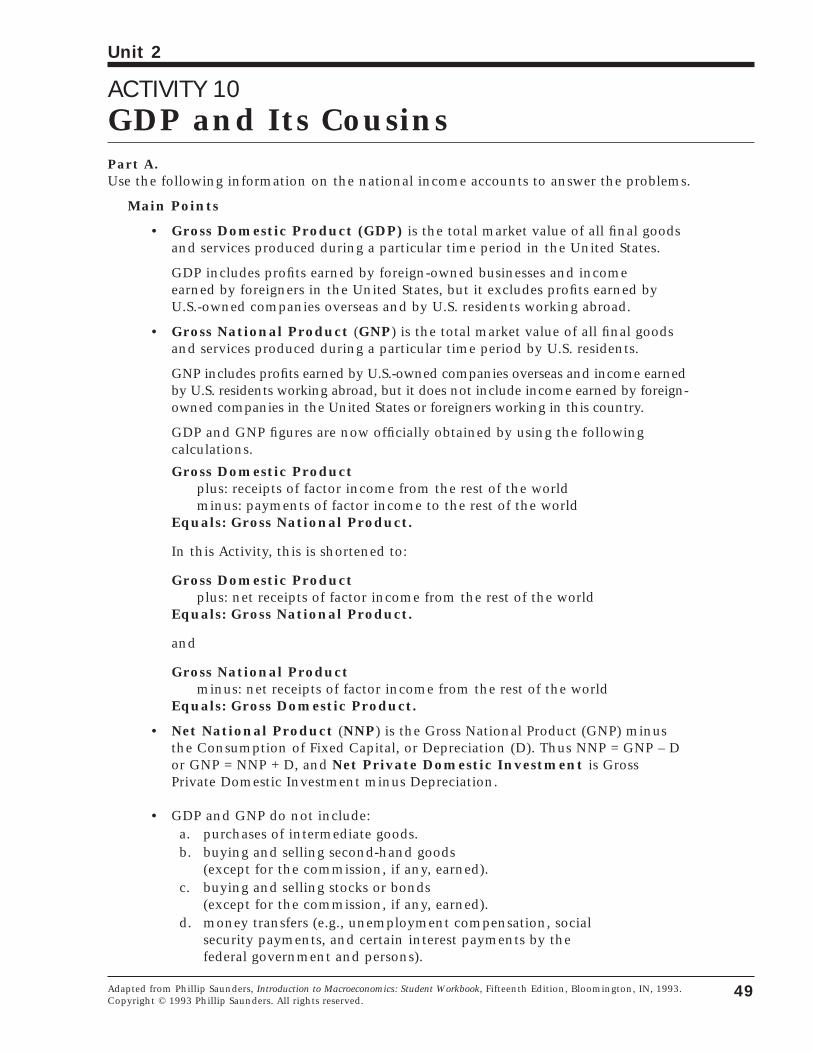
ACTIVITY 10GDP and Its CousinsPart A.Use the following information on the national income accounts to answer the problems.
Main Points
• Gross Domestic Product (GDP) is the total market value of all final goodsand services produced during a particular time period in the United States.
GDP includes profits earned by foreign-owned businesses and income earned by foreigners in the United States, but it excludes profits earned byU.S.-owned companies overseas and by U.S. residents working abroad.
• Gross National Product (GNP) is the total market value of all final goodsand services produced during a particular time period by U.S. residents.
GNP includes profits earned by U.S.-owned companies overseas and income earnedby U.S. residents working abroad, but it does not include income earned by foreign-owned companies in the United States or foreigners working in this country.
GDP and GNP figures are now officially obtained by using the following calculations.
Gross Domestic Product plus: receipts of factor income from the rest of the world minus: payments of factor income to the rest of the world
Equals: Gross National Product.
In this Activity, this is shortened to:
Gross Domestic Productplus: net receipts of factor income from the rest of the world
Equals: Gross National Product.
and
Gross National Product minus: net receipts of factor income from the rest of the world
Equals: Gross Domestic Product.
• Net National Product (NNP) is the Gross National Product (GNP) minusthe Consumption of Fixed Capital, or Depreciation (D). Thus NNP = GNP – Dor GNP = NNP + D, and Net Private Domestic Investment is GrossPrivate Domestic Investment minus Depreciation.
• GDP and GNP do not include: a. purchases of intermediate goods. b. buying and selling second-hand goods
(except for the commission, if any, earned). c. buying and selling stocks or bonds
(except for the commission, if any, earned). d. money transfers (e.g., unemployment compensation, social
security payments, and certain interest payments by the federal government and persons).
49
Unit 2
Adapted from Phillip Saunders, Introduction to Macroeconomics: Student Workbook, Fifteenth Edition, Bloomington, IN, 1993.Copyright © 1993 Phillip Saunders. All rights reserved.
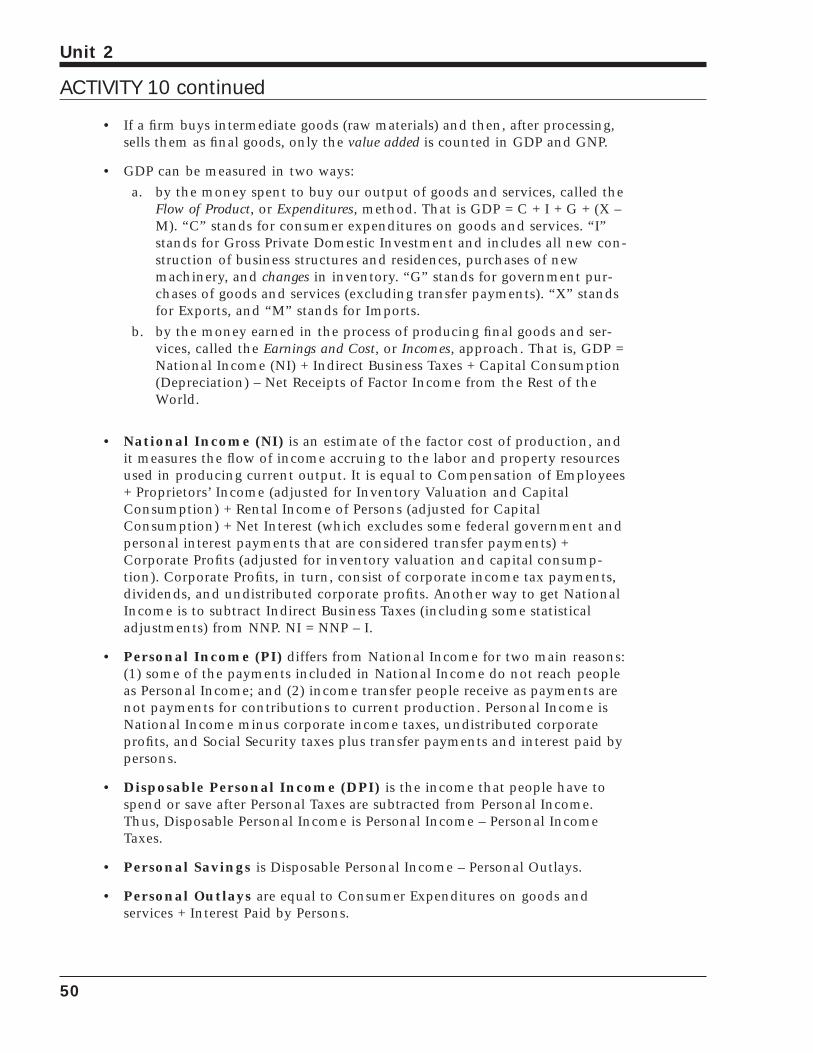
• If a firm buys intermediate goods (raw materials) and then, after processing,sells them as final goods, only the value added is counted in GDP and GNP.
• GDP can be measured in two ways:
a. by the money spent to buy our output of goods and services, called theFlow of Product, or Expenditures, method. That is GDP = C + I + G + (X –M). “C” stands for consumer expenditures on goods and services. “I”stands for Gross Private Domestic Investment and includes all new con-struction of business structures and residences, purchases of newmachinery, and changes in inventory. “G” stands for government pur-chases of goods and services (excluding transfer payments). “X” standsfor Exports, and “M” stands for Imports.
b. by the money earned in the process of producing final goods and ser-vices, called the Earnings and Cost, or Incomes, approach. That is, GDP =National Income (NI) + Indirect Business Taxes + Capital Consumption(Depreciation) – Net Receipts of Factor Income from the Rest of theWorld.
• National Income (NI) is an estimate of the factor cost of production, andit measures the flow of income accruing to the labor and property resourcesused in producing current output. It is equal to Compensation of Employees+ Proprietors’ Income (adjusted for Inventory Valuation and CapitalConsumption) + Rental Income of Persons (adjusted for CapitalConsumption) + Net Interest (which excludes some federal government andpersonal interest payments that are considered transfer payments) +Corporate Profits (adjusted for inventory valuation and capital consump-tion). Corporate Profits, in turn, consist of corporate income tax payments,dividends, and undistributed corporate profits. Another way to get NationalIncome is to subtract Indirect Business Taxes (including some statisticaladjustments) from NNP. NI = NNP – I.
• Personal Income (PI) differs from National Income for two main reasons:(1) some of the payments included in National Income do not reach peopleas Personal Income; and (2) income transfer people receive as payments arenot payments for contributions to current production. Personal Income isNational Income minus corporate income taxes, undistributed corporateprofits, and Social Security taxes plus transfer payments and interest paid bypersons.
• Disposable Personal Income (DPI) is the income that people have tospend or save after Personal Taxes are subtracted from Personal Income.Thus, Disposable Personal Income is Personal Income – Personal IncomeTaxes.
• Personal Savings is Disposable Personal Income – Personal Outlays.
• Personal Outlays are equal to Consumer Expenditures on goods and services + Interest Paid by Persons.
50
Unit 2
ACTIVITY 10 continued
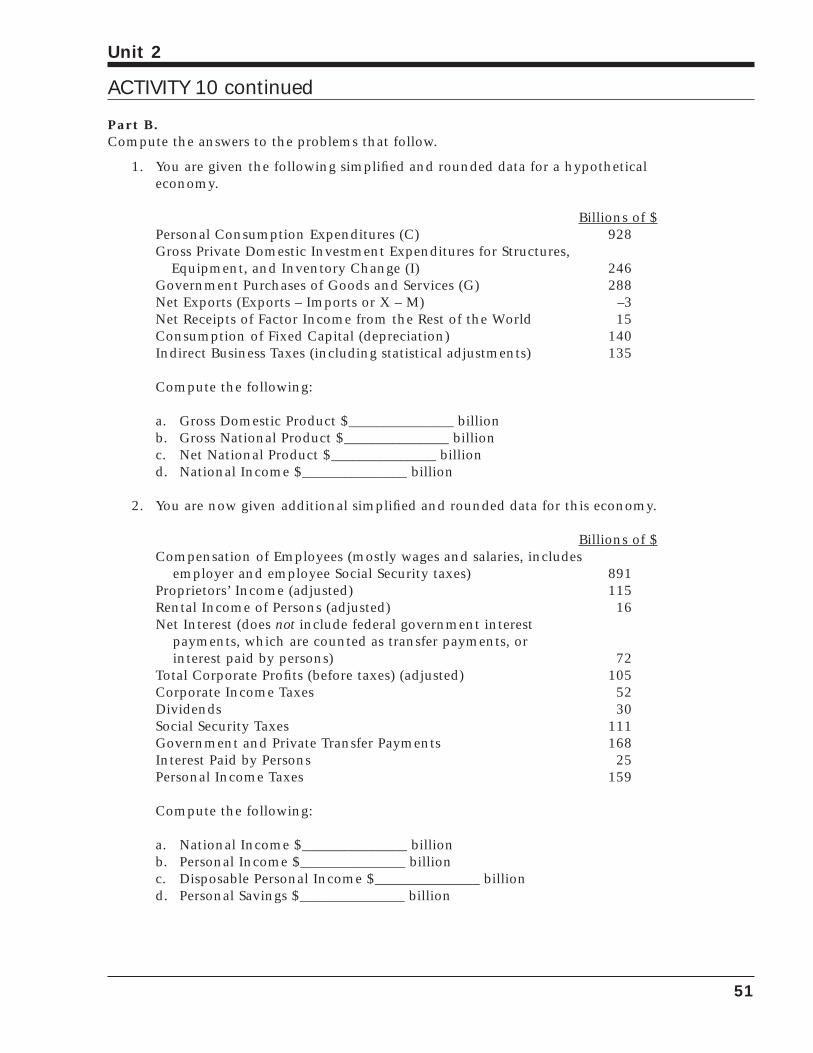
Part B.Compute the answers to the problems that follow.
1. You are given the following simplified and rounded data for a hypothetical economy.
Billions of $Personal Consumption Expenditures (C) 928Gross Private Domestic Investment Expenditures for Structures,
Equipment, and Inventory Change (I) 246Government Purchases of Goods and Services (G) 288Net Exports (Exports – Imports or X – M) –3Net Receipts of Factor Income from the Rest of the World 15Consumption of Fixed Capital (depreciation) 140Indirect Business Taxes (including statistical adjustments) 135
Compute the following:
a. Gross Domestic Product $_______________ billionb. Gross National Product $_______________ billionc. Net National Product $_______________ billiond. National Income $_______________ billion
2. You are now given additional simplified and rounded data for this economy.
Billions of $Compensation of Employees (mostly wages and salaries, includes
employer and employee Social Security taxes) 891Proprietors’ Income (adjusted) 115Rental Income of Persons (adjusted) 16Net Interest (does not include federal government interest
payments, which are counted as transfer payments, or interest paid by persons) 72
Total Corporate Profits (before taxes) (adjusted) 105Corporate Income Taxes 52Dividends 30Social Security Taxes 111Government and Private Transfer Payments 168Interest Paid by Persons 25Personal Income Taxes 159
Compute the following:
a. National Income $_______________ billionb. Personal Income $_______________ billionc. Disposable Personal Income $_______________ billiond. Personal Savings $_______________ billion
51
Unit 2
ACTIVITY 10 continued
Part C.Answer the following questions. Use the Worksheet for Activity 10 on the following page.
1. Why can’t one add up the value of sales for all producing units to arrive at nationalproduct? What must one add up instead?
2. Explain the relationships among GDP, GNP, NNP, NI, PI, and DPI. For what differ-ent purposes might one be interested in each of these different totals?
52
Unit 2
ACTIVITY 10 continued
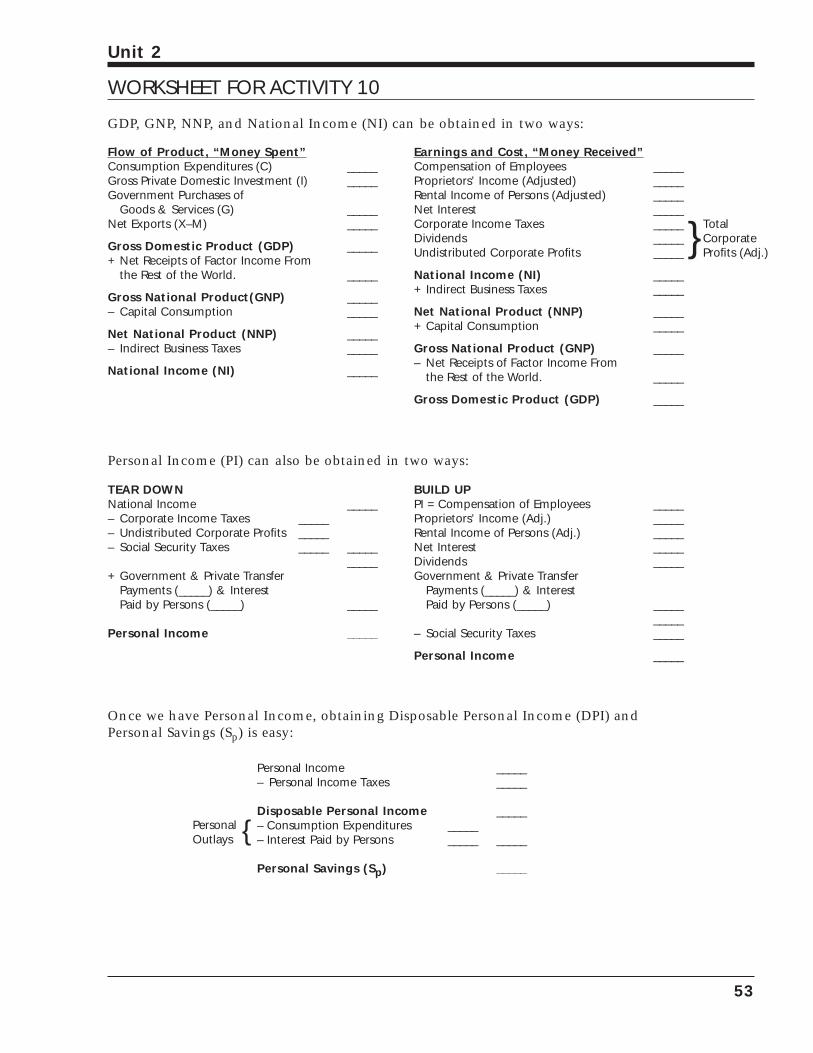
WORKSHEET FOR ACTIVITY 10
GDP, GNP, NNP, and National Income (NI) can be obtained in two ways:
53
Unit 2
Flow of Product, “Money Spent”Consumption Expenditures (C) _____Gross Private Domestic Investment (I) _____Government Purchases of
Goods & Services (G) _____Net Exports (X–M) _____
Gross Domestic Product (GDP) _____+ Net Receipts of Factor Income From
the Rest of the World. _____
Gross National Product(GNP) _____– Capital Consumption _____
Net National Product (NNP) _____– Indirect Business Taxes _____
National Income (NI) _____
Earnings and Cost, “Money Received”Compensation of Employees _____Proprietors’ Income (Adjusted) _____Rental Income of Persons (Adjusted) _____Net Interest _____Corporate Income Taxes _____Dividends _____Undistributed Corporate Profits _____
National Income (NI) _____+ Indirect Business Taxes _____
Net National Product (NNP) _____+ Capital Consumption _____
Gross National Product (GNP) _____– Net Receipts of Factor Income From
the Rest of the World. _____
Gross Domestic Product (GDP) _____
Personal Income (PI) can also be obtained in two ways:
TEAR DOWNNational Income _____– Corporate Income Taxes _____– Undistributed Corporate Profits _____– Social Security Taxes _____ _____
_____+ Government & Private Transfer
Payments (_____) & Interest Paid by Persons (_____) _____
Personal Income _____
BUILD UPPI = Compensation of Employees _____Proprietors’ Income (Adj.) _____Rental Income of Persons (Adj.) _____Net Interest _____Dividends _____Government & Private Transfer
Payments (_____) & InterestPaid by Persons (_____) _____
_____– Social Security Taxes _____
Personal Income _____
Personal Income _____– Personal Income Taxes _____
Disposable Personal Income _____– Consumption Expenditures _____– Interest Paid by Persons _____ _____
Personal Savings (Sp) _____
Once we have Personal Income, obtaining Disposable Personal Income (DPI) and Personal Savings (Sp) is easy:
TotalCorporateProfits (Adj.)}
PersonalOutlays {

54
Unit 2
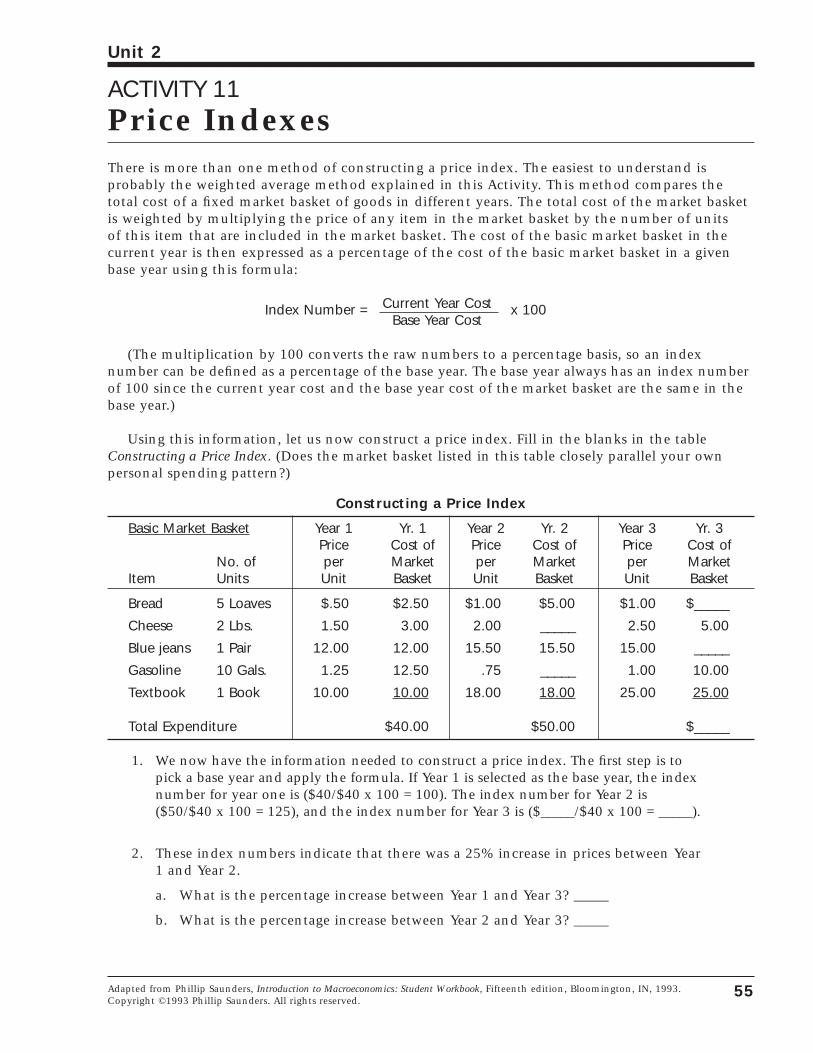
ACTIVITY 11Price IndexesThere is more than one method of constructing a price index. The easiest to understand is probably the weighted average method explained in this Activity. This method compares thetotal cost of a fixed market basket of goods in different years. The total cost of the market basketis weighted by multiplying the price of any item in the market basket by the number of units of this item that are included in the market basket. The cost of the basic market basket in thecurrent year is then expressed as a percentage of the cost of the basic market basket in a givenbase year using this formula:
Index Number = Current Year Cost x 100Base Year Cost
(The multiplication by 100 converts the raw numbers to a percentage basis, so an index number can be defined as a percentage of the base year. The base year always has an index numberof 100 since the current year cost and the base year cost of the market basket are the same in thebase year.)
Using this information, let us now construct a price index. Fill in the blanks in the tableConstructing a Price Index. (Does the market basket listed in this table closely parallel your own personal spending pattern?)
Constructing a Price Index
Basic Market Basket Year 1 Yr. 1 Year 2 Yr. 2 Year 3 Yr. 3Price Cost of Price Cost of Price Cost of
No. of per Market per Market per MarketItem Units Unit Basket Unit Basket Unit Basket
Bread 5 Loaves $.50 $2.50 $1.00 $5.00 $1.00 $_____
Cheese 2 Lbs. 1.50 3.00 2.00 _____ 2.50 5.00
Blue jeans 1 Pair 12.00 12.00 15.50 15.50 15.00 _____
Gasoline 10 Gals. 1.25 12.50 .75 _____ 1.00 10.00
Textbook 1 Book 10.00 10.00 18.00 18.00 25.00 25.00
Total Expenditure $40.00 $50.00 $_____
1. We now have the information needed to construct a price index. The first step is topick a base year and apply the formula. If Year 1 is selected as the base year, the indexnumber for year one is ($40/$40 x 100 = 100). The index number for Year 2 is($50/$40 x 100 = 125), and the index number for Year 3 is ($_____/$40 x 100 = _____).
2. These index numbers indicate that there was a 25% increase in prices between Year1 and Year 2.
a. What is the percentage increase between Year 1 and Year 3? _____
b. What is the percentage increase between Year 2 and Year 3? _____
55
Unit 2
Adapted from Phillip Saunders, Introduction to Macroeconomics: Student Workbook, Fifteenth edition, Bloomington, IN, 1993.Copyright ©1993 Phillip Saunders. All rights reserved.
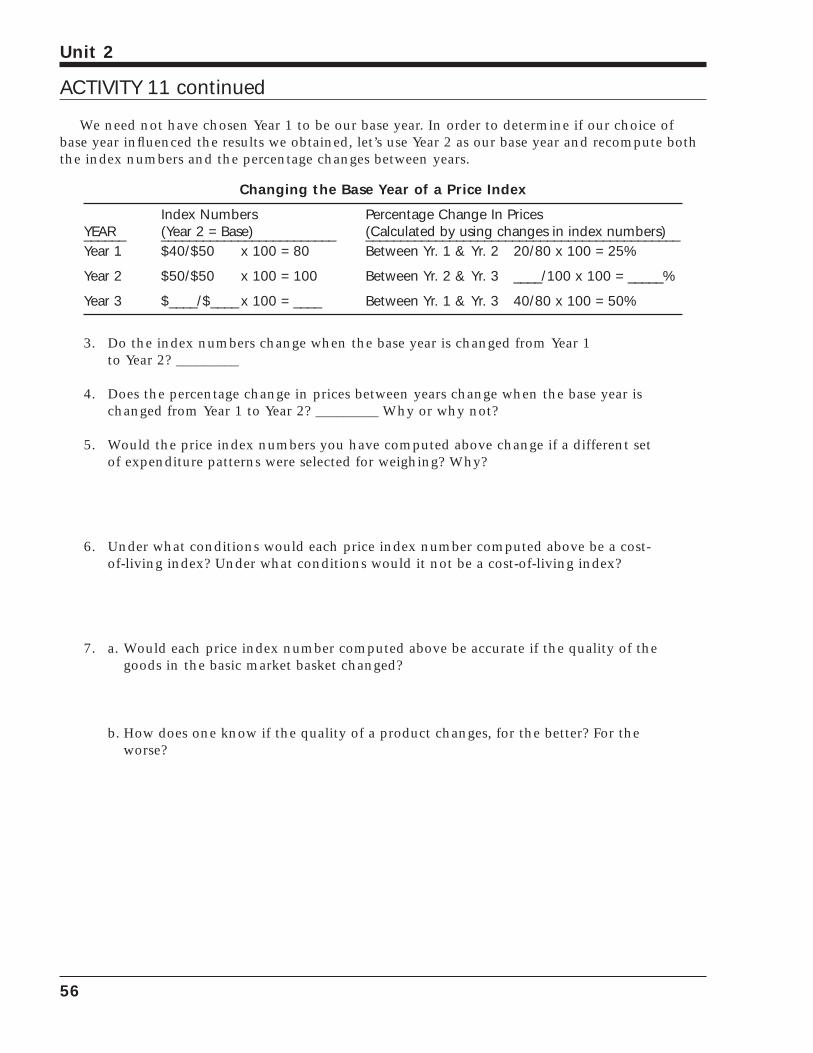
We need not have chosen Year 1 to be our base year. In order to determine if our choice ofbase year influenced the results we obtained, let’s use Year 2 as our base year and recompute boththe index numbers and the percentage changes between years.
Changing the Base Year of a Price Index
Index Numbers Percentage Change In PricesYEAR (Year 2 = Base) (Calculated by using changes in index numbers)______ _________________________ _____________________________________________Year 1 $40/$50 x 100 = 80 Between Yr. 1 & Yr. 2 20/80 x 100 = 25%
Year 2 $50/$50 x 100 = 100 Between Yr. 2 & Yr. 3 ____/100 x 100 = _____%
Year 3 $____/$____ x 100 = ____ Between Yr. 1 & Yr. 3 40/80 x 100 = 50%
3. Do the index numbers change when the base year is changed from Year 1 to Year 2? _________
4. Does the percentage change in prices between years change when the base year ischanged from Year 1 to Year 2? _________ Why or why not?
5. Would the price index numbers you have computed above change if a different setof expenditure patterns were selected for weighing? Why?
6. Under what conditions would each price index number computed above be a cost-of-living index? Under what conditions would it not be a cost-of-living index?
7. a. Would each price index number computed above be accurate if the quality of thegoods in the basic market basket changed?
b. How does one know if the quality of a product changes, for the better? For theworse?
56
Unit 2
ACTIVITY 11 continued
ACTIVITY 12Who Is Hurt and Who Is Helped by Inflation?Describe groups that are hurt by inflation and groups that benefit from inflation. Circle:
H if the person or group is hurt by inflation.
G if the person or group gains from inflation.
U if it is uncertain if the person or group is affected by inflation or if the effects are unclear.
Then explain why you answered as you did.
1. Banks extend many fixed-rate loans.
H G U Why?
2. A farmer buys machinery with a fixed-rate loan to be repaid over a ten-year period.
H G U Why?
3. Your family buys a new home with an adjustable-rate mortgage.
H G U Why?
4. Your savings from your summer job are in a savings account paying a fixed rate ofinterest.
H G U Why?
5. A widow lives entirely on income from fixed-rate corporate bonds.
H G U Why?
6. A retired couple lives entirely on income from a pension the woman receives fromher former employer.
H G U Why?
7. A retired man lives entirely on income from Social Security.
H G U Why?
8. A retired bank official lives entirely on income from stock dividends.
H G U Why?
57
Unit 2
Lesson developed by Betty Shackelford, Maconaquah High School, Bunker Hill, IN, and Kathleen Whitsett, Princeton HighSchool, Cincinnati, OH.
9. The federal government has a $5,000,000,000 debt.
H G U Why?
10. A firm signs a contract to provide maintenance services at a fixed rate for the nextfive years.
H G U Why?
11. A state government receives revenue mainly from a progressive income tax.
H G U Why?
12. A local government receives revenue mainly from fixed-rate license fees charged tobusinesses.
H G U Why?
13. Your friend rents an apartment with a three-year lease.
H G U Why?
14. A bank has loaned millions of dollars for home mortgages at a fixed rate of interest.
H G U Why?
15. Parents are putting savings for their child’s college education in a bank savingsaccount.
H G U Why?
16. What conclusions can you draw about who is helped and who is hurt by inflation?
17. If you were certain that the inflation rate would be ten percent a year for the nextten years, how might your behavior change?
58
Unit 2
ACTIVITY 12 continued
ACTIVITY 13Types of UnemploymentThere are four types of unemployment.
• Frictional unemployment includes people who are temporarily between jobs. They mayhave quit one job to find another, or they could be trying to find the best opportuni-ty after graduating from high school or college.
• Cyclical unemployment rises in a recession. For example, it may be caused by too littlespending in the economy. People are not buying many goods and services, so work-ers are laid off.
• Structural unemployment involves mismatches between job seekers and job openings.Unemployed people who lack skills or have a poor education are structurally unem-ployed.
• Seasonal unemployment affects workers who have worked during the past year but areunemployed during other parts of the year due to changes in the weather.
For each of the following situations, put the appropriate letter before the example.
F if it is an example of frictional unemployment.
C if it is an example of cyclical unemployment.
St if it is an example of structural unemployment.
S if it is an example of seasonal unemployment.
_____ 1. A Wisconsin construction worker cannot find work in the winter.
_____ 2. A steelworker is laid off because of a long recession.
_____ 3. A computer programmer quits her job in Chicago to look for a new job in San Diego.
_____ 4. A store clerk loses her job because sales are slow during a business slump.
_____ 5. A high school dropout applies for several jobs but is told each time that he is not qualified.
_____ 6. An unemployed college senior is looking for her first job.
_____ 7. An unemployed auto worker has been replaced by a robot.
_____ 8. A person rejects a job offer because the wage is too low.
59
Unit 2
Exercise developed by John Morton.

60
Unit 2
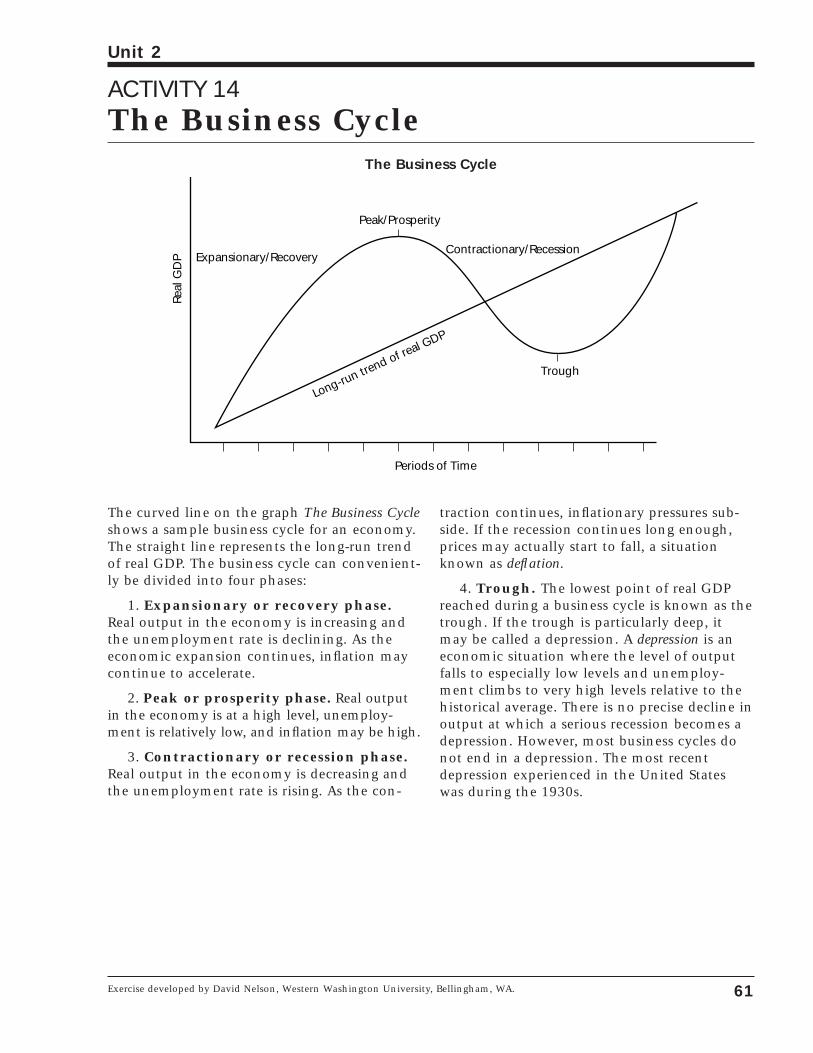
ACTIVITY 14The Business Cycle
The Business CycleRe
al G
DP
Periods of Time
Peak/Prosperity
Trough
Expansionary/RecoveryContractionary/Recession
Long-run trend of re
al GDP
61
Unit 2
Exercise developed by David Nelson, Western Washington University, Bellingham, WA.
The curved line on the graph The Business Cycleshows a sample business cycle for an economy.The straight line represents the long-run trendof real GDP. The business cycle can convenient-ly be divided into four phases:
1. Expansionary or recovery phase.Real output in the economy is increasing andthe unemployment rate is declining. As theeconomic expansion continues, inflation maycontinue to accelerate.
2. Peak or prosperity phase. Real outputin the economy is at a high level, unemploy-ment is relatively low, and inflation may be high.
3. Contractionary or recession phase.Real output in the economy is decreasing andthe unemployment rate is rising. As the con-
traction continues, inflationary pressures sub-side. If the recession continues long enough,prices may actually start to fall, a situationknown as deflation.
4. Trough. The lowest point of real GDPreached during a business cycle is known as thetrough. If the trough is particularly deep, itmay be called a depression. A depression is aneconomic situation where the level of outputfalls to especially low levels and unemploy-ment climbs to very high levels relative to thehistorical average. There is no precise decline inoutput at which a serious recession becomes adepression. However, most business cycles donot end in a depression. The most recentdepression experienced in the United Stateswas during the 1930s.
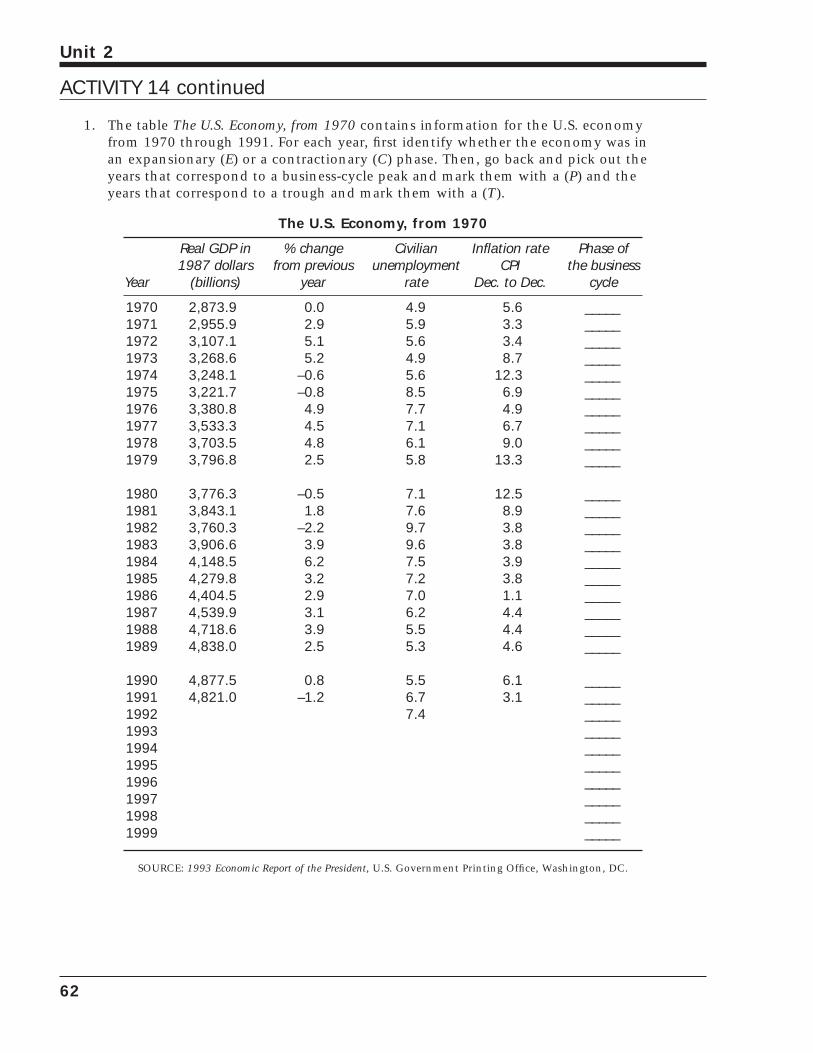
1. The table The U.S. Economy, from 1970 contains information for the U.S. economyfrom 1970 through 1991. For each year, first identify whether the economy was inan expansionary (E) or a contractionary (C) phase. Then, go back and pick out theyears that correspond to a business-cycle peak and mark them with a (P) and theyears that correspond to a trough and mark them with a (T).
The U.S. Economy, from 1970
Real GDP in % change Civilian Inflation rate Phase of1987 dollars from previous unemployment CPI the business
Year (billions) year rate Dec. to Dec. cycle
1970 2,873.9 0.0 4.9 5.6 _____1971 2,955.9 2.9 5.9 3.3 _____1972 3,107.1 5.1 5.6 3.4 _____1973 3,268.6 5.2 4.9 8.7 _____1974 3,248.1 –0.6 5.6 12.3 _____1975 3,221.7 –0.8 8.5 6.9 _____1976 3,380.8 4.9 7.7 4.9 _____1977 3,533.3 4.5 7.1 6.7 _____1978 3,703.5 4.8 6.1 9.0 _____1979 3,796.8 2.5 5.8 13.3 _____
1980 3,776.3 –0.5 7.1 12.5 _____1981 3,843.1 1.8 7.6 8.9 _____1982 3,760.3 –2.2 9.7 3.8 _____1983 3,906.6 3.9 9.6 3.8 _____1984 4,148.5 6.2 7.5 3.9 _____1985 4,279.8 3.2 7.2 3.8 _____1986 4,404.5 2.9 7.0 1.1 _____1987 4,539.9 3.1 6.2 4.4 _____1988 4,718.6 3.9 5.5 4.4 _____1989 4,838.0 2.5 5.3 4.6 _____
1990 4,877.5 0.8 5.5 6.1 _____1991 4,821.0 –1.2 6.7 3.1 _____1992 7.4 _____1993 _____1994 _____1995 _____1996 _____1997 _____1998 _____1999 _____
SOURCE: 1993 Economic Report of the President, U.S. Government Printing Office, Washington, DC.
62
Unit 2
ACTIVITY 14 continued
2. How many business cycles did the U.S. economy have between 1970 and 1991?_________
3. In how many years was output expanding? _________
4. In how many years was output contracting? _________
5. What economic expansionary period looks best to you? Why?
6. What economic contraction/recession looks worst to you? Why?
7. During years in which real GDP fell, what happened to the unemployment ratecompared with the previous year? Why?
8. Look at the unemployment rate in years corresponding to a business-cycle peak.Why do you think there was still some unemployment in those years?
9. Based on the years 1970-1991, how does the rate of inflation correspond with thebusiness cycle?
63
Unit 2
ACTIVITY 14 continued

64
Unit 2
ACTIVITY 15Problems on MacroeconomicIndicatorsAnswer the questions and briefly explain your answers on a separate sheet of paper.
1. The unemployment rate and employment both go up. Ellen says that it is not possiblefor both of these rates to rise at the same time. Is Ellen correct or incorrect? Why?
2. True, false, or uncertain, and why? “Gross Domestic Product measures the amountof wealth in the economy.”
3. True, false, or uncertain, and why? “A decrease in Gross Domestic Product mustreduce a person’s standard of living.”
4. True, false, or uncertain, and why? “If nominal GDP increases by five percent andthe price level increases by seven percent, real GDP has decreased.”
5. True, false, or uncertain, and why? “In preparing an index of prices, it is importantthat all commodities entering the index be given equal weight.”
6. True, false, or uncertain, and why? “Frictional and structural unemployment are twowords for the same thing.”
7. Why does unanticipated inflation help borrowers and hurt lenders?
8. True, false, or uncertain, and why? “Inflation always increases when unemploy-ment decreases.”
9. True, false, or uncertain, and why? “If the economy is at full employment, theunemployment rate is zero.”
10. True, false, or uncertain, and why? “Seasonal unemployment is a continual worrybecause some people are out of work on a regular basis.”
65
Unit 2
Several questions from Phillip Saunders, Introduction to Macroeconomics: Student Workbook, Fifteenth edition, Bloomington, IN, 1993. Copyright©1993 Phillip Saunders. All rights reserved.Betty Shackelford, Maconaquah High School, Bunker Hill, IN, and Kathleen Whitsett, Princeton High School, Cincinnati, OH, contributed tothis activity.

66
Unit 2
Sample Multiple-Choice QuestionsCircle the letter of each correct answer.
67
Unit 2
1. In product markets:
a. Households sell products to business firms.
b. Households sell resources to business firms.
c. Business firms sell resources to households.
d. Business firms sell goods and services tohouseholds.
e. Households buy resources from business firms.
2. In resource or factor markets:
a. Households sell products to businessfirms.
b. Households sell resources to business firms.
c. Business firms sell resources to households.
d. Business firms sell goods and services to households.
e. Households buy resources from business firms.
3. Which of the following economic indica-tors is the best measure of production oroutput of an economy?
a. Consumer Price Index.
b. Unemployment rate.
c. Gross Domestic Product.
d. Prime rate.
e. Index of Leading Indicators.
4. The market value of all final goods and services produced in the economy in agiven year is the:
a. Net National Product.
b. National Income.
c. Personal Income.
d. Gross Domestic Product.
e. Producer Price Index.
5. Which of the following would cause theunemployment rate to increase?
I. A man who quits his job to spend moretime with his children.
II. A woman who has not looked for a jobin two years and begins looking again.
III. A woman who quits her job and beginslooking for a new job in another city.
a. I only
b. II only
c. III only
d. I and II only
e. II and III only
6. The largest item in the expenditure or flowof product approach to GDP is:
a. consumer spending.
b. Gross Domestic Investment.
c. Net exports of goods and services.
d. Government purchases of goods and ser-vices.
e. Rental payments.
7. The largest item in the income or earningsand costs approach to GDP is:
a. Rental payments.
b. Government expenditures on goods andservices.
c. Consumer spending.
d. Wages or compensation of employees.
e. Net interest.
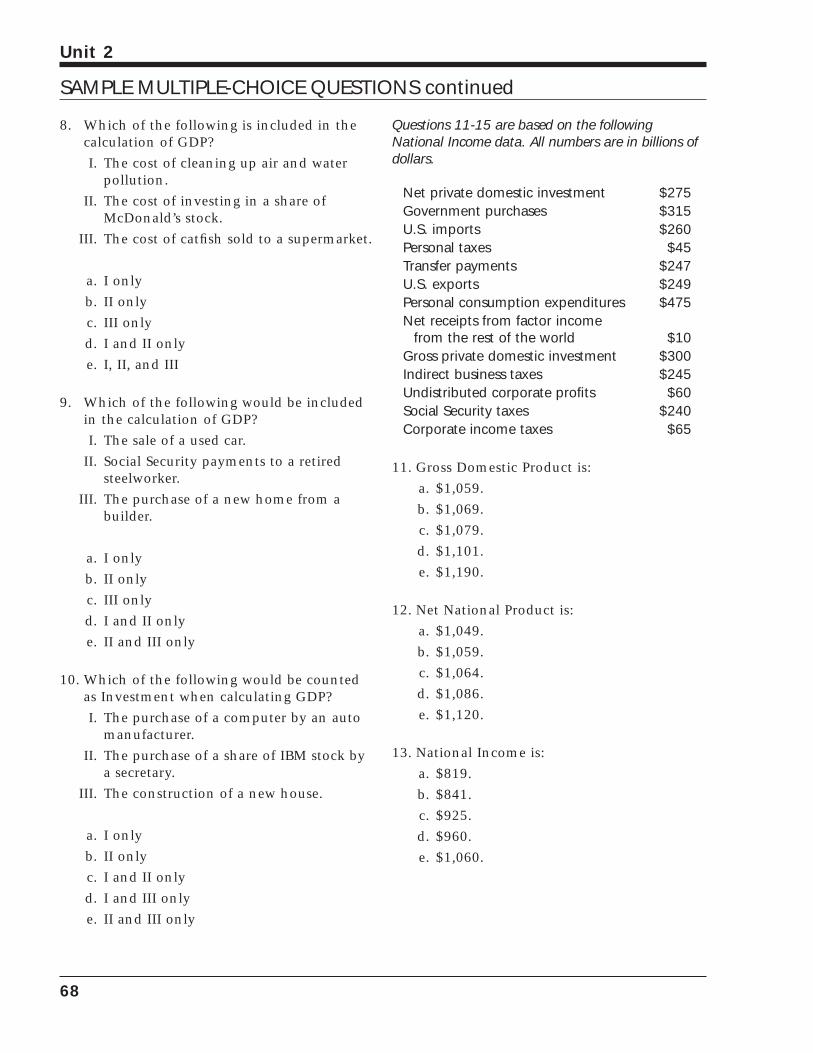
8. Which of the following is included in thecalculation of GDP?
I. The cost of cleaning up air and waterpollution.
II. The cost of investing in a share ofMcDonald’s stock.
III. The cost of catfish sold to a supermarket.
a. I only
b. II only
c. III only
d. I and II only
e. I, II, and III
9. Which of the following would be includedin the calculation of GDP?
I. The sale of a used car.
II. Social Security payments to a retiredsteelworker.
III. The purchase of a new home from abuilder.
a. I only
b. II only
c. III only
d. I and II only
e. II and III only
10. Which of the following would be countedas Investment when calculating GDP?
I. The purchase of a computer by an automanufacturer.
II. The purchase of a share of IBM stock bya secretary.
III. The construction of a new house.
a. I only
b. II only
c. I and II only
d. I and III only
e. II and III only
Questions 11-15 are based on the followingNational Income data. All numbers are in billions ofdollars.
Net private domestic investment $275Government purchases $315U.S. imports $260Personal taxes $45Transfer payments $247U.S. exports $249Personal consumption expenditures $475Net receipts from factor income
from the rest of the world $10Gross private domestic investment $300Indirect business taxes $245Undistributed corporate profits $60Social Security taxes $240Corporate income taxes $65
11. Gross Domestic Product is:
a. $1,059.
b. $1,069.
c. $1,079.
d. $1,101.
e. $1,190.
12. Net National Product is:
a. $1,049.
b. $1,059.
c. $1,064.
d. $1,086.
e. $1,120.
13. National Income is:
a. $819.
b. $841.
c. $925.
d. $960.
e. $1,060.
68
Unit 2
SAMPLE MULTIPLE-CHOICE QUESTIONS continued
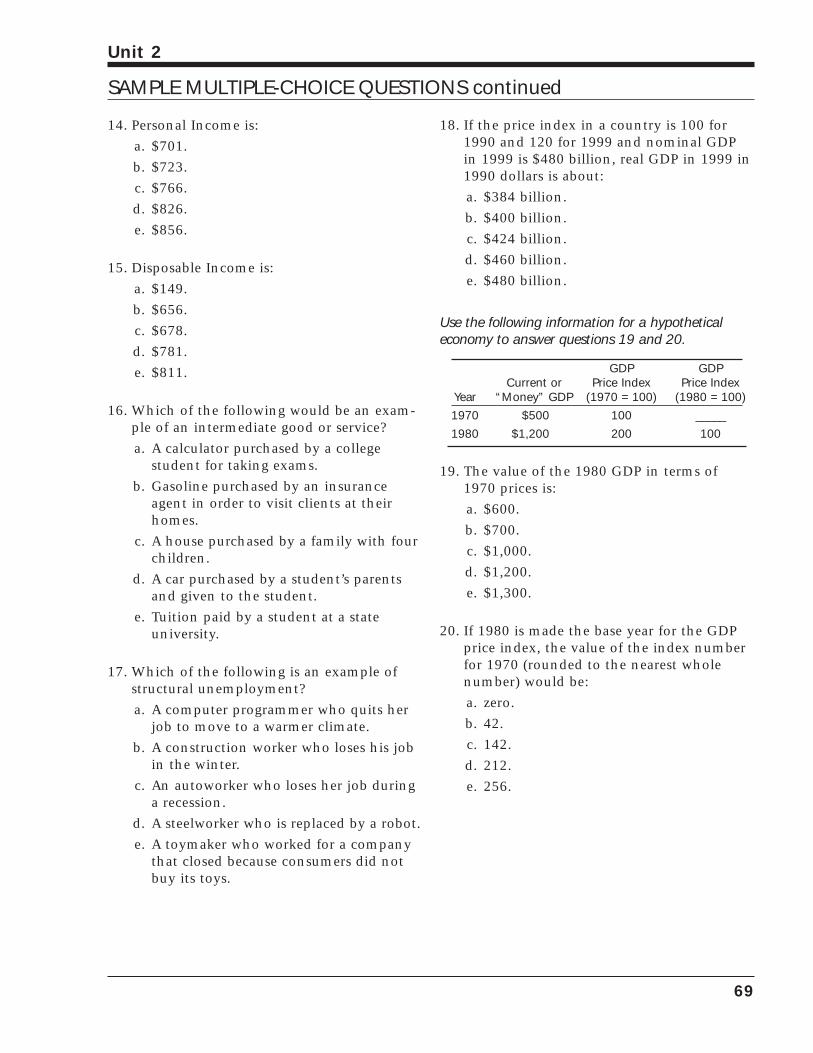
14. Personal Income is:
a. $701.
b. $723.
c. $766.
d. $826.
e. $856.
15. Disposable Income is:
a. $149.
b. $656.
c. $678.
d. $781.
e. $811.
16. Which of the following would be an exam-ple of an intermediate good or service?
a. A calculator purchased by a college student for taking exams.
b. Gasoline purchased by an insuranceagent in order to visit clients at theirhomes.
c. A house purchased by a family with fourchildren.
d. A car purchased by a student’s parentsand given to the student.
e. Tuition paid by a student at a state university.
17. Which of the following is an example ofstructural unemployment?
a. A computer programmer who quits herjob to move to a warmer climate.
b. A construction worker who loses his jobin the winter.
c. An autoworker who loses her job duringa recession.
d. A steelworker who is replaced by a robot.
e. A toymaker who worked for a companythat closed because consumers did notbuy its toys.
18. If the price index in a country is 100 for1990 and 120 for 1999 and nominal GDPin 1999 is $480 billion, real GDP in 1999 in1990 dollars is about:
a. $384 billion.
b. $400 billion.
c. $424 billion.
d. $460 billion.
e. $480 billion.
Use the following information for a hypotheticaleconomy to answer questions 19 and 20.
GDP GDPCurrent or Price Index Price Index
Year “Money” GDP (1970 = 100) (1980 = 100)
1970 $500 100 _____
1980 $1,200 200 100
19. The value of the 1980 GDP in terms of1970 prices is:
a. $600.
b. $700.
c. $1,000.
d. $1,200.
e. $1,300.
20. If 1980 is made the base year for the GDPprice index, the value of the index numberfor 1970 (rounded to the nearest wholenumber) would be:
a. zero.
b. 42.
c. 142.
d. 212.
e. 256.
69
Unit 2
SAMPLE MULTIPLE-CHOICE QUESTIONS continued

70
Unit 2
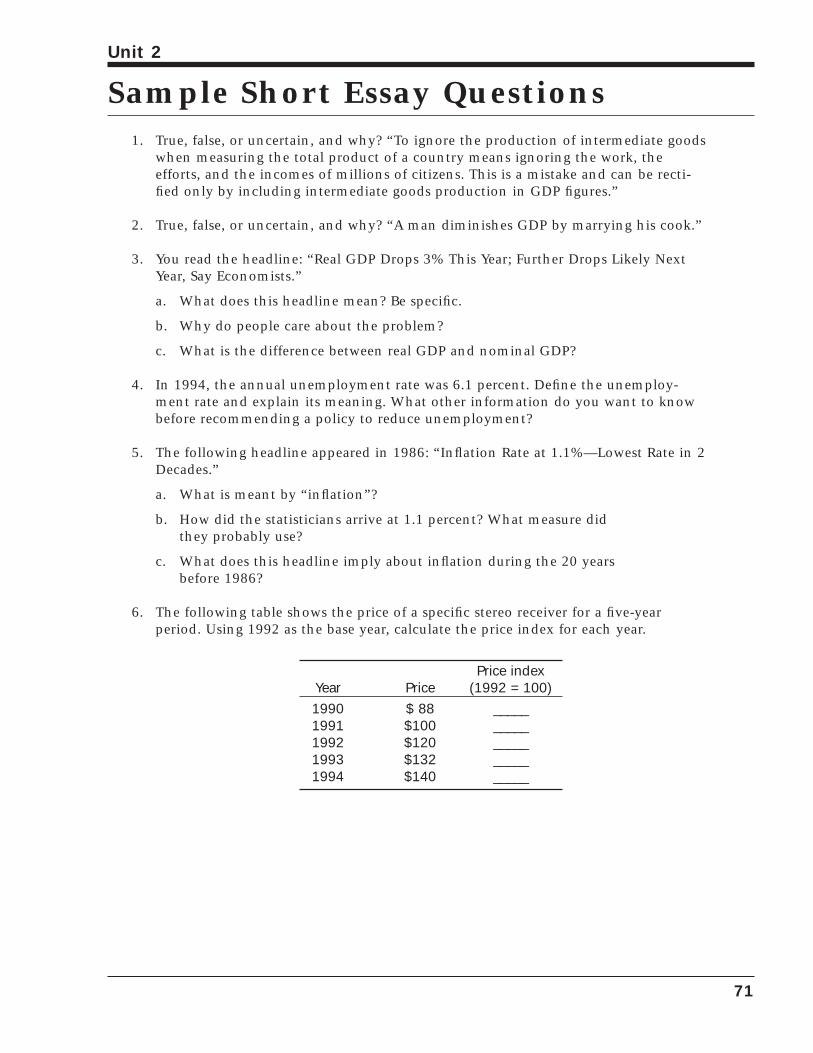
Sample Short Essay Questions1. True, false, or uncertain, and why? “To ignore the production of intermediate goods
when measuring the total product of a country means ignoring the work, theefforts, and the incomes of millions of citizens. This is a mistake and can be recti-fied only by including intermediate goods production in GDP figures.”
2. True, false, or uncertain, and why? “A man diminishes GDP by marrying his cook.”
3. You read the headline: “Real GDP Drops 3% This Year; Further Drops Likely NextYear, Say Economists.”
a. What does this headline mean? Be specific.
b. Why do people care about the problem?
c. What is the difference between real GDP and nominal GDP?
4. In 1994, the annual unemployment rate was 6.1 percent. Define the unemploy-ment rate and explain its meaning. What other information do you want to knowbefore recommending a policy to reduce unemployment?
5. The following headline appeared in 1986: “Inflation Rate at 1.1%—Lowest Rate in 2Decades.”
a. What is meant by “inflation”?
b. How did the statisticians arrive at 1.1 percent? What measure did they probably use?
c. What does this headline imply about inflation during the 20 years before 1986?
6. The following table shows the price of a specific stereo receiver for a five-year period. Using 1992 as the base year, calculate the price index for each year.
Price indexYear Price (1992 = 100)
1990 $ 88 _____1991 $100 _____1992 $120 _____1993 $132 _____1994 $140 _____
71
Unit 2

72
Unit 2
Sample Long Essay Questions1. Define “unanticipated inflation.” How does unanticipated inflation affect lenders,
borrowers, homeowners, and the federal government?
2. You read the following information about the economy:
Real GDP up three percent from a year ago.Unemployment rate of 6.1 percent.Consumer Price Index up six percent from a year ago.Index of Leading Indicators up for the last six months.Prime interest rate of ten percent, up from seven percent a year ago.
a. Explain what each of these economic indicators measures and what the significance of the current data is for the economy.
b. These indicators should paint a picture of the entire economy. Describe thatpicture.
73
Unit 2

74
Unit 2
Macroeconomics
Unit 3Aggregate Demandand AggregateSupply: Fluctuations inOutputs and Prices
75

76
Unit 3
Key Ideas
77
Unit 3
• Aggregate demand (AD) and aggregate supply(AS) curves look and operate much like the supplyand demand curves used in microeconomics.However, these macroeconomic AD and AScurves depict different things, and they changefor different reasons than microeconomicdemand and supply curves. AD and AS curvescan be used to illustrate changes in real outputand the price level of an economy.
• The downward sloping aggregate demand curveis explained by the wealth effect, the incomeeffect, and the foreign purchases effect.
• The aggregate supply curve is divided into threeranges: the horizontal or Keynesian range, theupward sloping or intermediate range, and thevertical or classical range.
• Changes in the price level and output are illus-trated by shifts and movements along the aggre-gate demand and supply curves.
• Shifts in aggregate demand can change the levelof output and the price level or both. The deter-minants of AD include changes in consumerspending, investment spending, governmentspending, and net export spending.
• Shifts in aggregate supply can also change thelevel of output and the price level.Determinants of AS include changes in inputprices, productivity, the legal institutional environment, and the quantity of availableresources.
• Changes in outputs can also be illustrated by theKeynesian expenditure-output model. This modeldiffers from the AD/AS model because in theKeynesian model the price level is assumed to beconstant. The Keynesian model has fixed prices.
• The AD/AS model can be reconciled with theKeynesian expenditure-output model. In theKeynesian (horizontal) range of the AS curve,both models are identical. The models differ inthe intermediate and vertical ranges of the AScurve.
• Autonomous spending is that part of AD that isindependent of the current rate of economicactivity.
• Induced spending is that part of AD thatdepends upon the current rate of economicactivity.
• The multiplier is a number that influences therelationship of changes in autonomous spend-ing to changes in real GDP.
• The formula for calculating the multiplier is:
M = ___1___1 – MPC
• The multiplier results from subsequent roundsof induced spending that occur whenautonomous spending changes.
• Keynesian economists believe that equilibriumlevels of GDP can occur at less than or morethan the full-employment level of GDP.Classical economists believe that long-run equilibrium can occur only at full employment.
• Fiscal policy consists of government actions that may increase or decrease aggregatedemand. These actions involve changes in government spending and taxing.
• The government uses an expansionary fiscalpolicy to try to increase aggregate demand dur-ing a recession. The government may decreasetaxes, increase spending, or do a combination of the two.
• The government uses a contractionary fiscal policy to try to decrease aggregate demand dur-ing a period of inflation. The government mayincrease taxes, decrease spending, or do a com-bination of the two.
• Discretionary fiscal policy means the federalgovernment must take deliberate action or passa new law changing taxes or spending. Theautomatic or built-in stabilizers change govern-ment spending or taxes without new laws beingpassed or deliberate action being taken.
• The balanced budget multiplier indicates thatequal increases or decreases in taxes and govern-ment spending increase or decrease equilibriumGDP by an amount equal to that increase ordecrease.
• Stagflation can be explained by a decrease inaggregate supply.

78
Unit 3
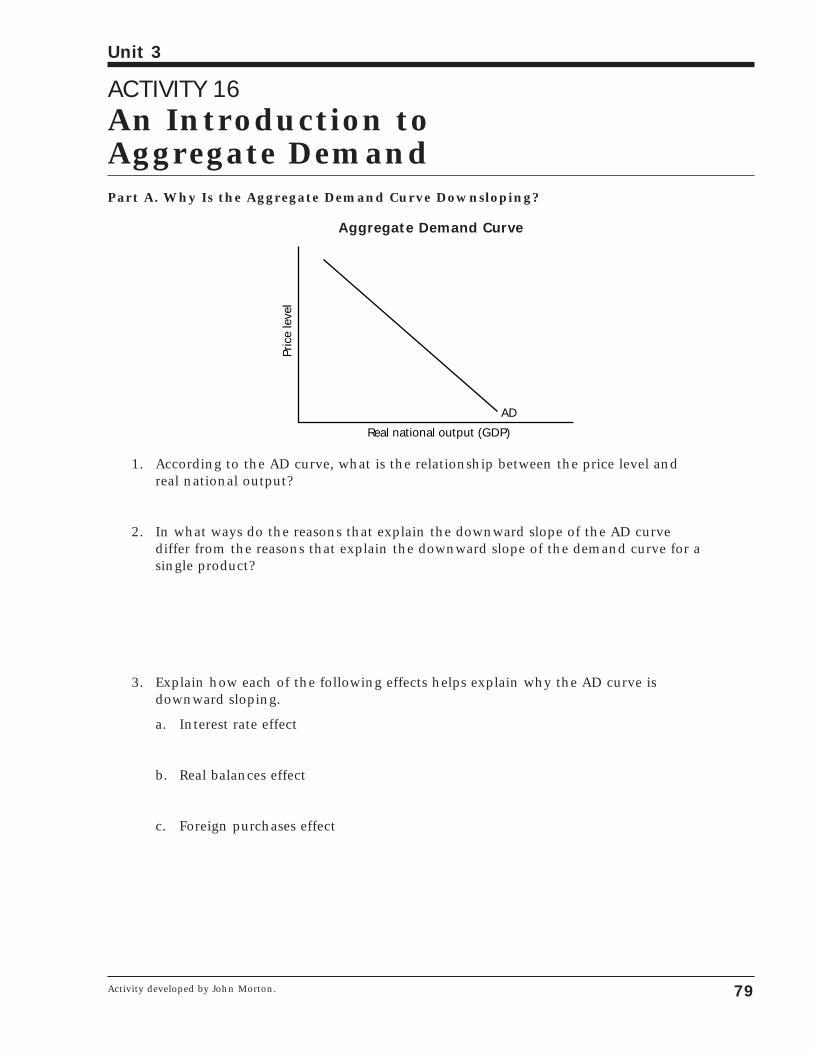
ACTIVITY 16An Introduction to Aggregate DemandPart A. Why Is the Aggregate Demand Curve Downsloping?
Aggregate Demand Curve
1. According to the AD curve, what is the relationship between the price level andreal national output?
2. In what ways do the reasons that explain the downward slope of the AD curve differ from the reasons that explain the downward slope of the demand curve for asingle product?
3. Explain how each of the following effects helps explain why the AD curve is downward sloping.
a. Interest rate effect
b. Real balances effect
c. Foreign purchases effect
AD
Pric
e le
vel
Real national output (GDP)
79
Unit 3
Activity developed by John Morton.
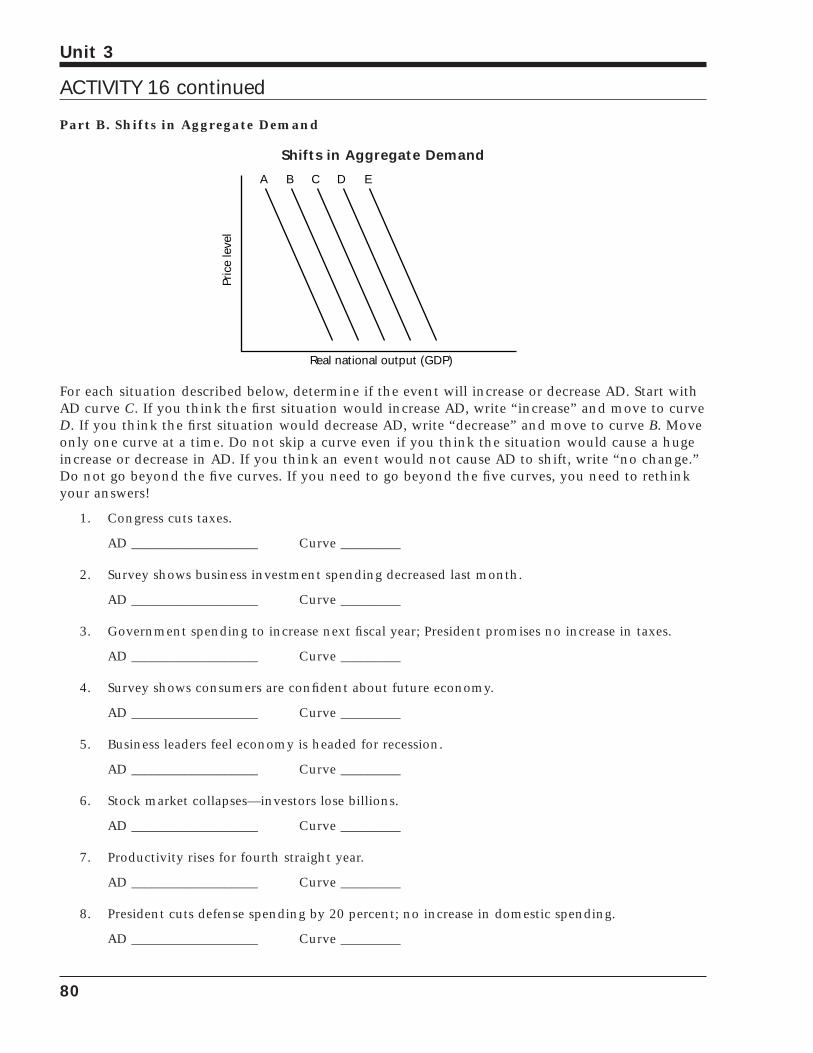
Part B. Shifts in Aggregate Demand
Shifts in Aggregate Demand
For each situation described below, determine if the event will increase or decrease AD. Start withAD curve C. If you think the first situation would increase AD, write “increase” and move to curveD. If you think the first situation would decrease AD, write “decrease” and move to curve B. Moveonly one curve at a time. Do not skip a curve even if you think the situation would cause a hugeincrease or decrease in AD. If you think an event would not cause AD to shift, write “no change.”Do not go beyond the five curves. If you need to go beyond the five curves, you need to rethinkyour answers!
1. Congress cuts taxes.
AD ___________________ Curve _________
2. Survey shows business investment spending decreased last month.
AD ___________________ Curve _________
3. Government spending to increase next fiscal year; President promises no increase in taxes.
AD ___________________ Curve _________
4. Survey shows consumers are confident about future economy.
AD ___________________ Curve _________
5. Business leaders feel economy is headed for recession.
AD ___________________ Curve _________
6. Stock market collapses—investors lose billions.
AD ___________________ Curve _________
7. Productivity rises for fourth straight year.
AD ___________________ Curve _________
8. President cuts defense spending by 20 percent; no increase in domestic spending.
AD ___________________ Curve _________
Pric
e le
vel
Real national output (GDP)
A B C D E
80
Unit 3
ACTIVITY 16 continued
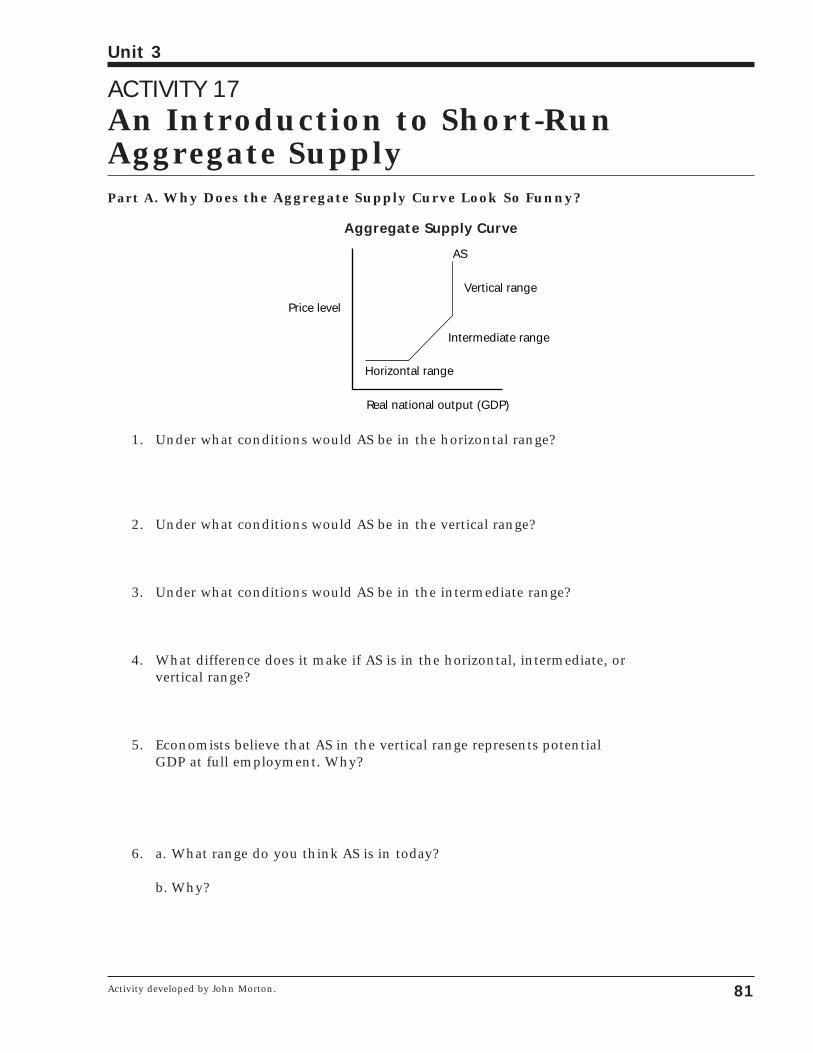
ACTIVITY 17An Introduction to Short-RunAggregate SupplyPart A. Why Does the Aggregate Supply Curve Look So Funny?
Aggregate Supply Curve
1. Under what conditions would AS be in the horizontal range?
2. Under what conditions would AS be in the vertical range?
3. Under what conditions would AS be in the intermediate range?
4. What difference does it make if AS is in the horizontal, intermediate, or vertical range?
5. Economists believe that AS in the vertical range represents potential GDP at full employment. Why?
6. a. What range do you think AS is in today?
b. Why?
Price level
AS
Vertical range
Intermediate range
Horizontal range
Real national output (GDP)
81
Unit 3
Activity developed by John Morton.
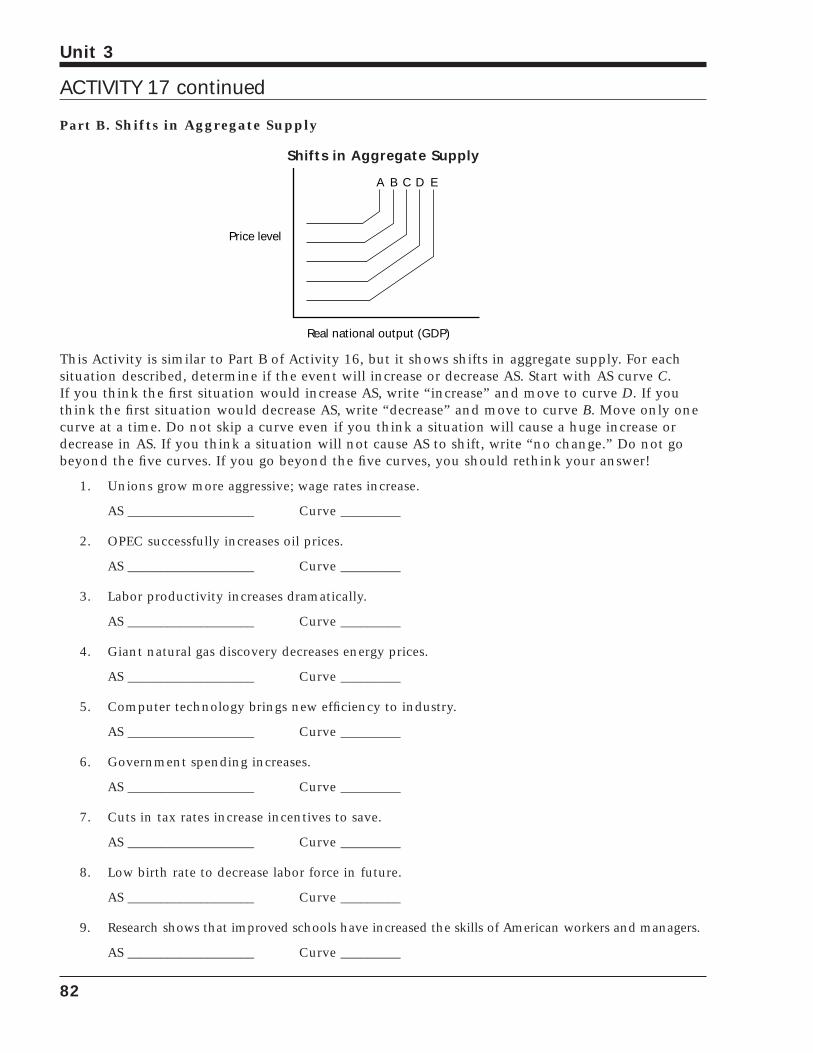
Part B. Shifts in Aggregate Supply
Shifts in Aggregate Supply
This Activity is similar to Part B of Activity 16, but it shows shifts in aggregate supply. For each situation described, determine if the event will increase or decrease AS. Start with AS curve C. If you think the first situation would increase AS, write “increase” and move to curve D. If youthink the first situation would decrease AS, write “decrease” and move to curve B. Move only onecurve at a time. Do not skip a curve even if you think a situation will cause a huge increase ordecrease in AS. If you think a situation will not cause AS to shift, write “no change.” Do not gobeyond the five curves. If you go beyond the five curves, you should rethink your answer!
1. Unions grow more aggressive; wage rates increase.
AS ___________________ Curve _________
2. OPEC successfully increases oil prices.
AS ___________________ Curve _________
3. Labor productivity increases dramatically.
AS ___________________ Curve _________
4. Giant natural gas discovery decreases energy prices.
AS ___________________ Curve _________
5. Computer technology brings new efficiency to industry.
AS ___________________ Curve _________
6. Government spending increases.
AS ___________________ Curve _________
7. Cuts in tax rates increase incentives to save.
AS ___________________ Curve _________
8. Low birth rate to decrease labor force in future.
AS ___________________ Curve _________
9. Research shows that improved schools have increased the skills of American workers and managers.
AS ___________________ Curve _________
Price level
A B C D E
Real national output (GDP)
82
Unit 3
ACTIVITY 17 continued
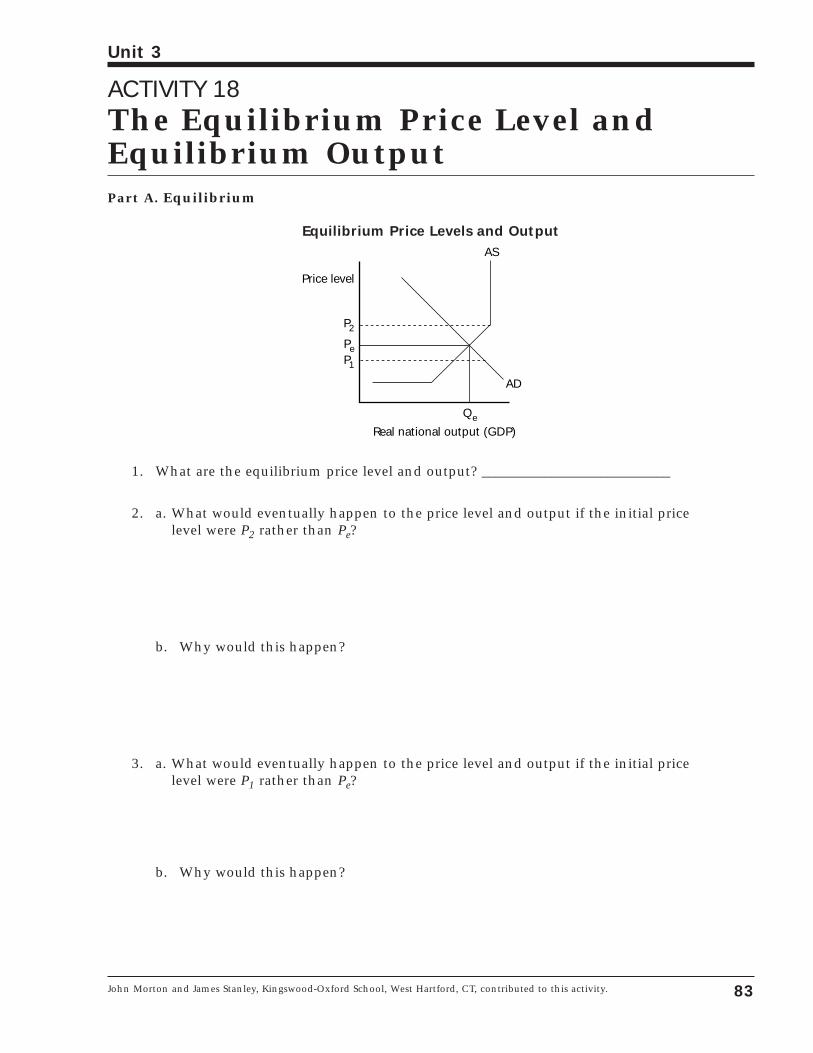
ACTIVITY 18The Equilibrium Price Level andEquilibrium OutputPart A. Equilibrium
Equilibrium Price Levels and Output
1. What are the equilibrium price level and output? ___________________________
2. a. What would eventually happen to the price level and output if the initial pricelevel were P2 rather than Pe?
b. Why would this happen?
3. a. What would eventually happen to the price level and output if the initial pricelevel were P1 rather than Pe?
b. Why would this happen?
Price level
AS
AD
P2
PeP1
Qe
Real national output (GDP)
83
Unit 3
John Morton and James Stanley, Kingswood-Oxford School, West Hartford, CT, contributed to this activity.
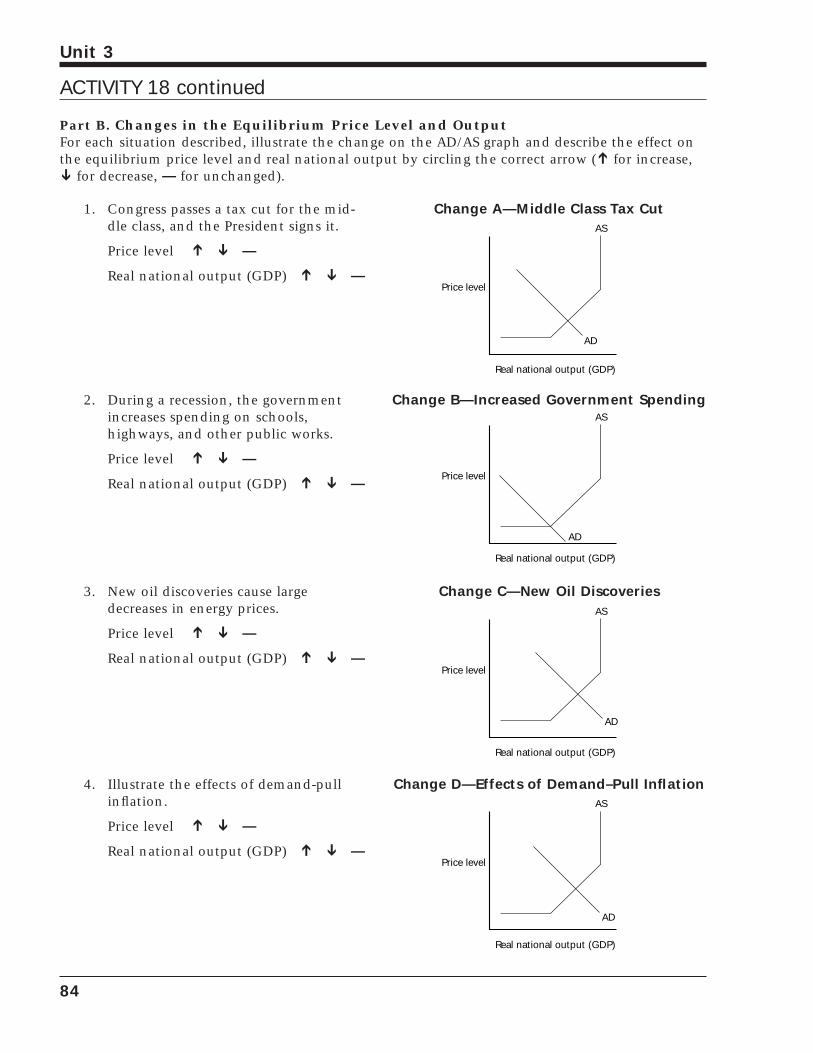
Part B. Changes in the Equilibrium Price Level and OutputFor each situation described, illustrate the change on the AD/AS graph and describe the effect onthe equilibrium price level and real national output by circling the correct arrow (Õ for increase,Ô for decrease, — for unchanged).
84
Unit 3
1. Congress passes a tax cut for the mid-dle class, and the President signs it.
Price level Õ Ô —Real national output (GDP) Õ Ô —
Change A—Middle Class Tax Cut
Price level
AS
AD
Real national output (GDP)
2. During a recession, the governmentincreases spending on schools, highways, and other public works.
Price level Õ Ô —Real national output (GDP) Õ Ô —
Change B—Increased Government Spending
Price level
AS
AD
Real national output (GDP)
3. New oil discoveries cause largedecreases in energy prices.
Price level Õ Ô —Real national output (GDP) Õ Ô —
Change C—New Oil Discoveries
Price level
AS
AD
Real national output (GDP)
4. Illustrate the effects of demand-pullinflation.
Price level Õ Ô —Real national output (GDP) Õ Ô —
Change D—Effects of Demand–Pull Inflation
Price level
AS
AD
Real national output (GDP)
ACTIVITY 18 continued
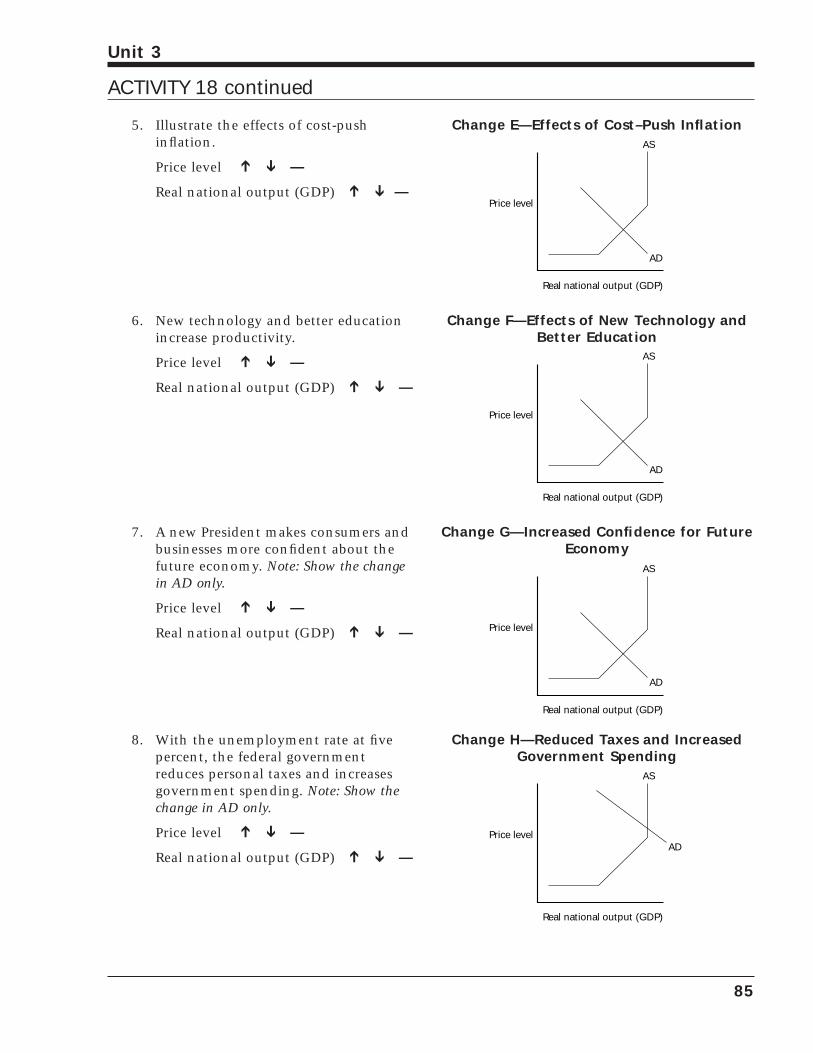
85
Unit 3
5. Illustrate the effects of cost-pushinflation.
Price level Õ Ô —Real national output (GDP) Õ Ô —
Change E—Effects of Cost–Push Inflation
Price level
AS
AD
Real national output (GDP)
6. New technology and better educationincrease productivity.
Price level Õ Ô —Real national output (GDP) Õ Ô —
Change F—Effects of New Technology andBetter Education
Price level
AS
AD
Real national output (GDP)
7. A new President makes consumers andbusinesses more confident about thefuture economy. Note: Show the change in AD only.
Price level Õ Ô —Real national output (GDP) Õ Ô —
Change G—Increased Confidence for FutureEconomy
Price level
AS
AD
Real national output (GDP)
8. With the unemployment rate at fivepercent, the federal government reduces personal taxes and increasesgovernment spending. Note: Show thechange in AD only.
Price level Õ Ô —Real national output (GDP) Õ Ô —
Change H—Reduced Taxes and IncreasedGovernment Spending
Price level
AS
Real national output (GDP)
AD
ACTIVITY 18 continued
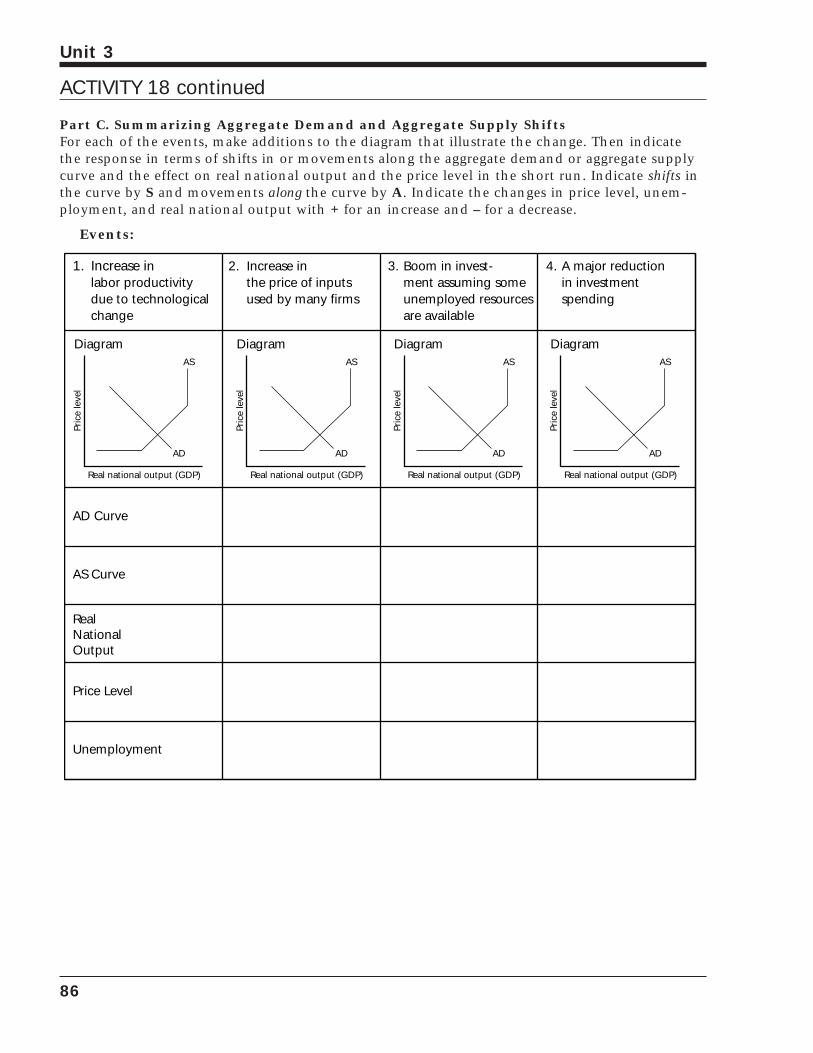
Part C. Summarizing Aggregate Demand and Aggregate Supply ShiftsFor each of the events, make additions to the diagram that illustrate the change. Then indicatethe response in terms of shifts in or movements along the aggregate demand or aggregate supplycurve and the effect on real national output and the price level in the short run. Indicate shifts inthe curve by S and movements along the curve by A. Indicate the changes in price level, unem-ployment, and real national output with + for an increase and – for a decrease.
Events:
Pric
e le
vel
AS
AD
Real national output (GDP)
Diagram
Pric
e le
vel
AS
AD
Real national output (GDP)
Diagram
Pric
e le
vel
AS
AD
Real national output (GDP)
Diagram
Pric
e le
vel
AS
AD
Real national output (GDP)
Diagram
AD Curve
AS Curve
Real National Output
Price Level
Unemployment
1. Increase in 2. Increase in 3. Boom in invest- 4. A major reduction labor productivity the price of inputs ment assuming some in investment
due to technological used by many firms unemployed resources spendingchange are available
86
Unit 3
ACTIVITY 18 continued
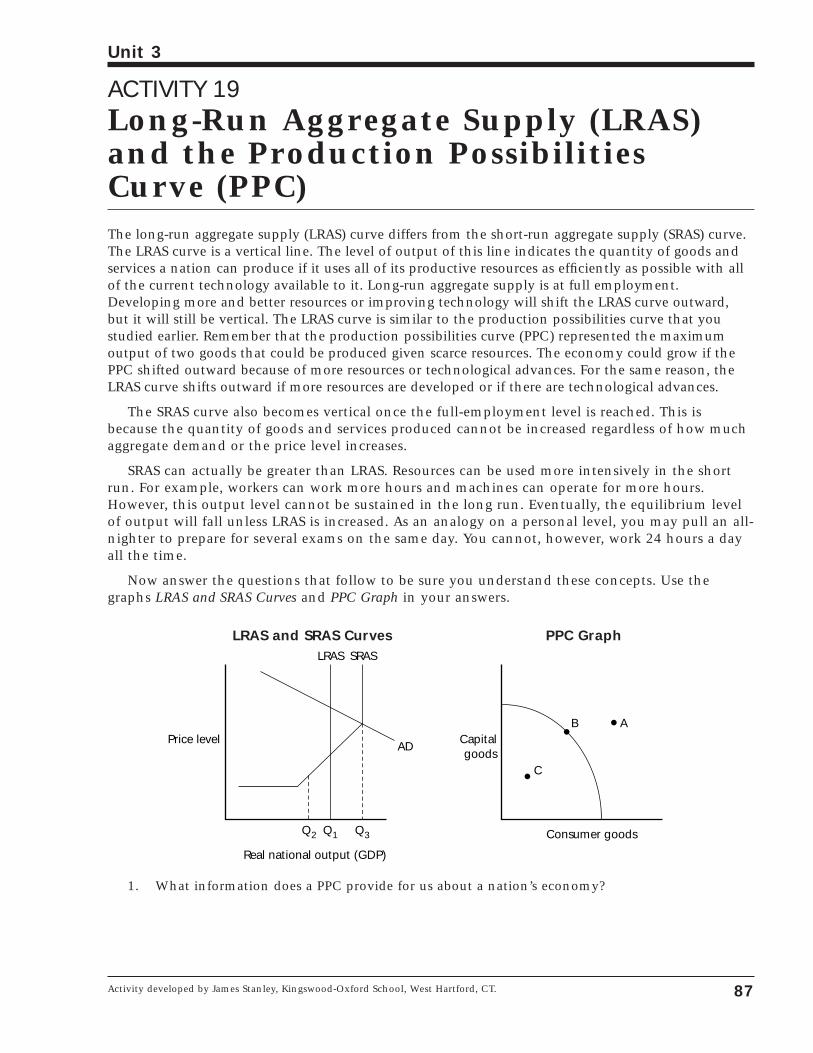
ACTIVITY 19Long-Run Aggregate Supply (LRAS)and the Production PossibilitiesCurve (PPC)The long-run aggregate supply (LRAS) curve differs from the short-run aggregate supply (SRAS) curve.The LRAS curve is a vertical line. The level of output of this line indicates the quantity of goods andservices a nation can produce if it uses all of its productive resources as efficiently as possible with allof the current technology available to it. Long-run aggregate supply is at full employment.Developing more and better resources or improving technology will shift the LRAS curve outward,but it will still be vertical. The LRAS curve is similar to the production possibilities curve that youstudied earlier. Remember that the production possibilities curve (PPC) represented the maximumoutput of two goods that could be produced given scarce resources. The economy could grow if thePPC shifted outward because of more resources or technological advances. For the same reason, theLRAS curve shifts outward if more resources are developed or if there are technological advances.
The SRAS curve also becomes vertical once the full-employment level is reached. This isbecause the quantity of goods and services produced cannot be increased regardless of how muchaggregate demand or the price level increases.
SRAS can actually be greater than LRAS. Resources can be used more intensively in the shortrun. For example, workers can work more hours and machines can operate for more hours.However, this output level cannot be sustained in the long run. Eventually, the equilibrium levelof output will fall unless LRAS is increased. As an analogy on a personal level, you may pull an all-nighter to prepare for several exams on the same day. You cannot, however, work 24 hours a dayall the time.
Now answer the questions that follow to be sure you understand these concepts. Use thegraphs LRAS and SRAS Curves and PPC Graph in your answers.
LRAS and SRAS Curves PPC Graph
1. What information does a PPC provide for us about a nation’s economy?
Price level
SRASLRAS
Real national output (GDP)
AD
Q2 Q1 Q3
Capitalgoods
Consumer goods
C
B A
87
Unit 3
Activity developed by James Stanley, Kingswood-Oxford School, West Hartford, CT.
2. What assumptions about the use of available resources are inherent in a PPC?
3. What forces or conditions will cause a nation’s PPC to move?
4. What does the LRAS tell us about a nation’s economy?
5. Why is the LRAS curve vertical?
6. If the price level rises, will LRAS shift? Will it shift if AD changes?
7. If an economy finds that it faces a short-run equilibrium where real national outputis Q2, how would you describe the condition of the economy? Given this equilibriumlevel of output, at what point would we lie on the PPC graph? Explain your answer.
8. If an economy finds that it faces a short-run equilibrium where real national outputis Q1, how would you describe the condition of the economy? Given this equilibriumlevel of output, at what point would we lie on the PPC graph? Explain your answer.
9. If an economy finds that it faces a short-run equilibrium where real national outputis Q3, how would you describe the condition of the economy? Given this equilibriumlevel of output, at what point would we lie on the PPC graph? Explain your answer.
10. If the economy were producing at Q3, what would happen in the long run? Why?
11. What could cause LRAS to shift?
12. If the LRAS curve shifted to the right, what would happen on the PPC graph?
88
Unit 3
ACTIVITY 19 continued
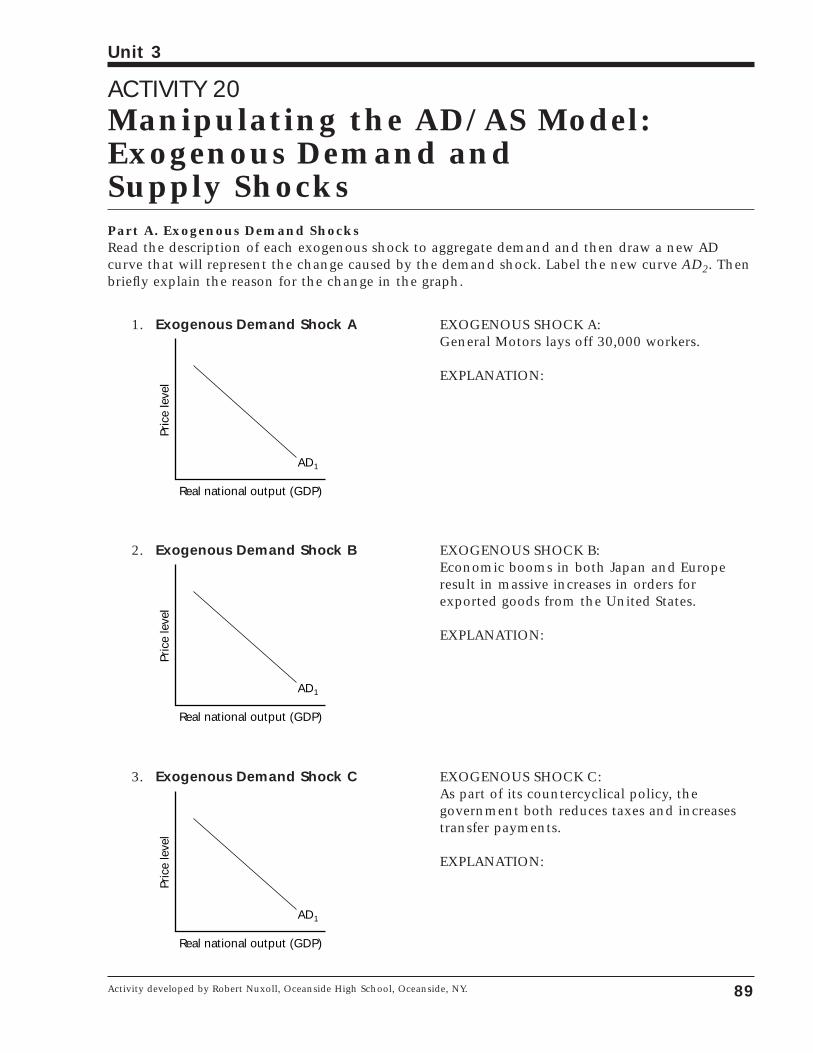
ACTIVITY 20Manipulating the AD/AS Model:Exogenous Demand and Supply ShocksPart A. Exogenous Demand Shocks Read the description of each exogenous shock to aggregate demand and then draw a new ADcurve that will represent the change caused by the demand shock. Label the new curve AD2. Thenbriefly explain the reason for the change in the graph.
89
Unit 3
Activity developed by Robert Nuxoll, Oceanside High School, Oceanside, NY.
1. Exogenous Demand Shock A EXOGENOUS SHOCK A: General Motors lays off 30,000 workers.
EXPLANATION:
Pric
e le
vel
AD1
Real national output (GDP)
3. Exogenous Demand Shock C EXOGENOUS SHOCK C: As part of its countercyclical policy, the government both reduces taxes and increasestransfer payments.
EXPLANATION:
Pric
e le
vel
AD1
Real national output (GDP)
2. Exogenous Demand Shock B EXOGENOUS SHOCK B: Economic booms in both Japan and Europeresult in massive increases in orders for exported goods from the United States.
EXPLANATION:
Pric
e le
vel
AD1
Real national output (GDP)
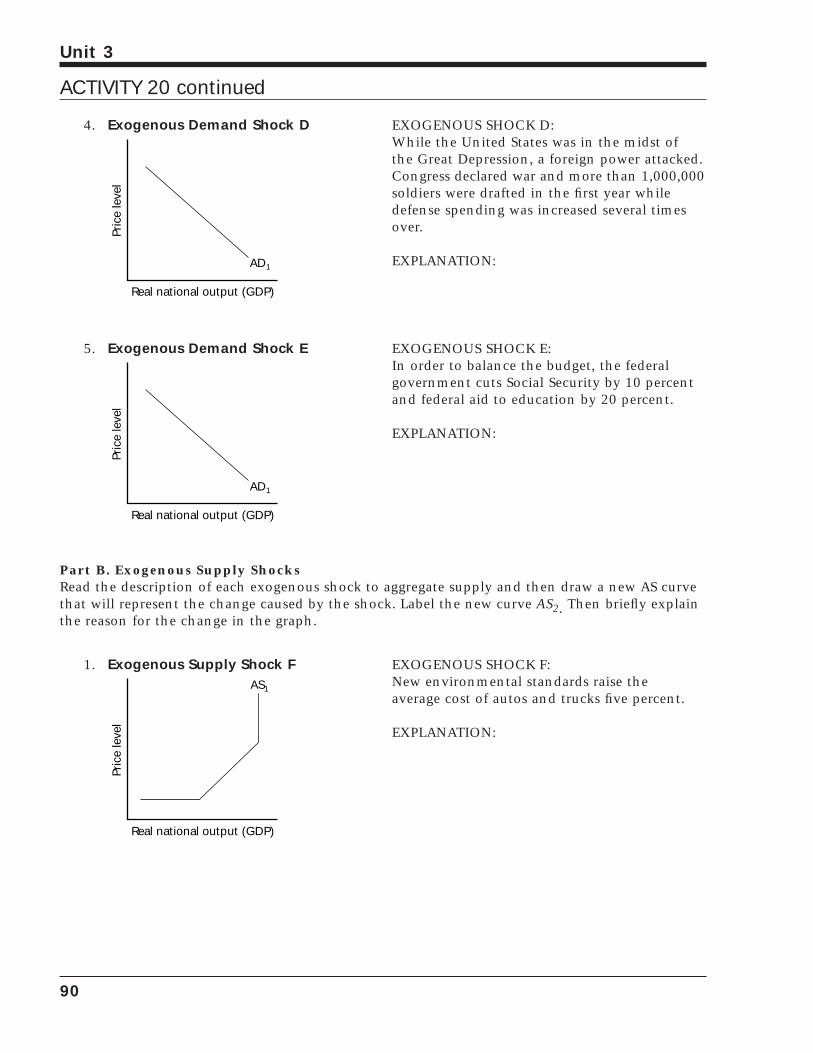
90
Unit 3
4. Exogenous Demand Shock D EXOGENOUS SHOCK D: While the United States was in the midst of the Great Depression, a foreign power attacked.Congress declared war and more than 1,000,000soldiers were drafted in the first year whiledefense spending was increased several timesover.
EXPLANATION:
Pric
e le
vel
AD1
Real national output (GDP)
5. Exogenous Demand Shock E EXOGENOUS SHOCK E: In order to balance the budget, the federal government cuts Social Security by 10 percentand federal aid to education by 20 percent.
EXPLANATION:
Pric
e le
vel
AD1
Real national output (GDP)
1. Exogenous Supply Shock F EXOGENOUS SHOCK F: New environmental standards raise the average cost of autos and trucks five percent.
EXPLANATION:
AS1
Pric
e le
vel
Real national output (GDP)
Part B. Exogenous Supply ShocksRead the description of each exogenous shock to aggregate supply and then draw a new AS curvethat will represent the change caused by the shock. Label the new curve AS2. Then briefly explainthe reason for the change in the graph.
ACTIVITY 20 continued
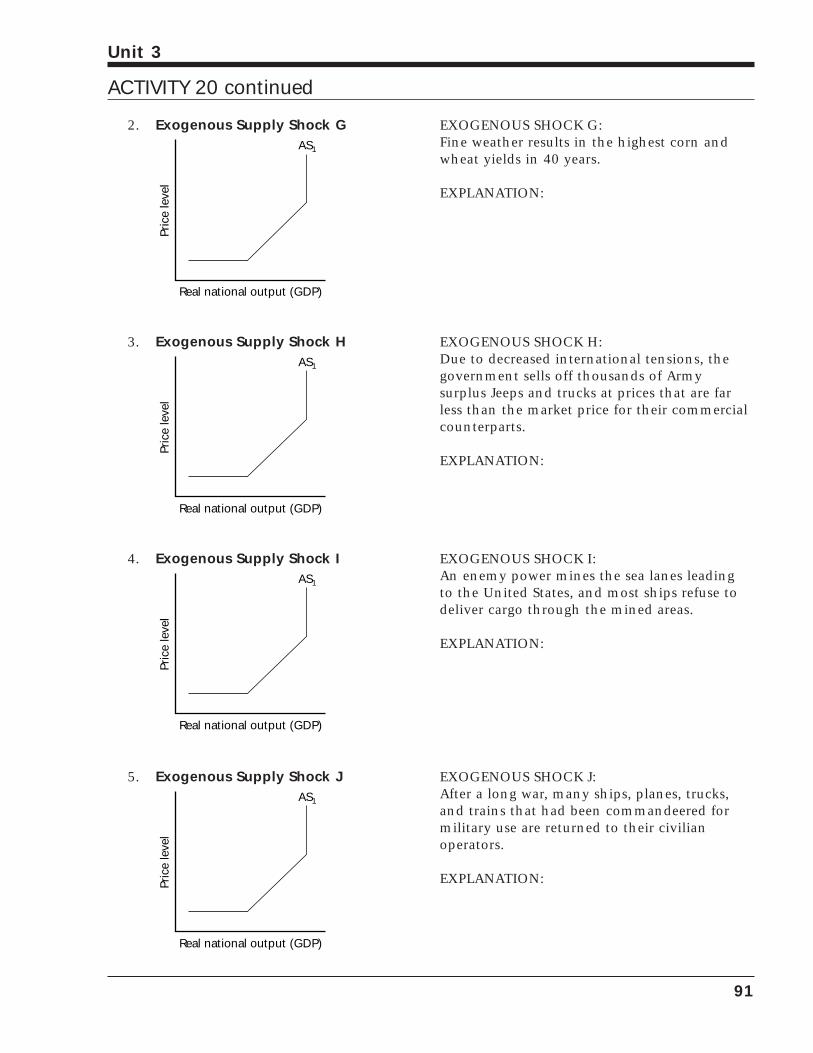
91
Unit 3
2. Exogenous Supply Shock G EXOGENOUS SHOCK G: Fine weather results in the highest corn andwheat yields in 40 years.
EXPLANATION:
AS1
Pric
e le
vel
Real national output (GDP)
3. Exogenous Supply Shock H EXOGENOUS SHOCK H: Due to decreased international tensions, thegovernment sells off thousands of Army surplus Jeeps and trucks at prices that are farless than the market price for their commercialcounterparts.
EXPLANATION:
AS1
Pric
e le
vel
Real national output (GDP)
4. Exogenous Supply Shock I EXOGENOUS SHOCK I: An enemy power mines the sea lanes leading to the United States, and most ships refuse todeliver cargo through the mined areas.
EXPLANATION:
AS1
Pric
e le
vel
Real national output (GDP)
5. Exogenous Supply Shock J EXOGENOUS SHOCK J: After a long war, many ships, planes, trucks,and trains that had been commandeered formilitary use are returned to their civilian operators.
EXPLANATION:
AS1
Pric
e le
vel
Real national output (GDP)
ACTIVITY 20 continued
Part C. Manipulating the Aggregate Supply and Demand ModelRead each of the scenarios below and explain the impact the exogenous shocks will have onaggregate supply and demand. Then draw an aggregate demand and aggregate supply diagram toillustrate each impact.
1. During a long, slow recovery from a recession, consumerspostponed major purchases. Suddenly they begin to buy cars,refrigerators, televisions, and heating units to replace theirfailing models.
2. With no other dramatic changes, the government raises taxes and reduces transfer payments in the hope of balancing the budget.
3. News of possible future layoffs frightens the public into reducing spending and saving for the feared “rainy day.”
4. Due to rising tensions in many developing countries, firmsbegin to build new factories in the United States and to purchase sophisticated machinery that will enable them toproduce here at prices that are competitive with those of low-salaried foreign countries.
5. Brazil solves its foreign debt and inflation problems. It thenorders $10 billion worth of capital machinery from the United States.
92
Unit 3
ACTIVITY 20 continued
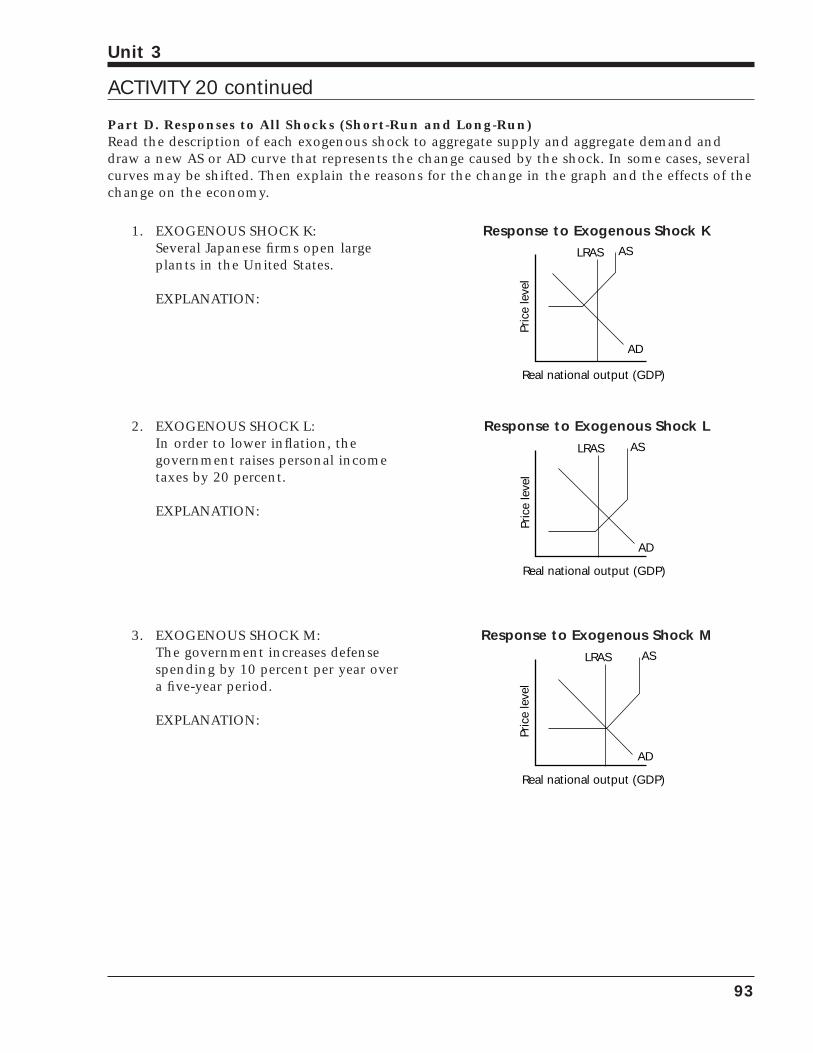
Part D. Responses to All Shocks (Short-Run and Long-Run)Read the description of each exogenous shock to aggregate supply and aggregate demand anddraw a new AS or AD curve that represents the change caused by the shock. In some cases, severalcurves may be shifted. Then explain the reasons for the change in the graph and the effects of thechange on the economy.
93
Unit 3
1. EXOGENOUS SHOCK K:Several Japanese firms open large plants in the United States.
EXPLANATION:
Response to Exogenous Shock K
Pric
e le
vel
ASLRAS
Real national output (GDP)
AD
2. EXOGENOUS SHOCK L:In order to lower inflation, the government raises personal incometaxes by 20 percent.
EXPLANATION:
Response to Exogenous Shock L
Pric
e le
vel
ASLRAS
Real national output (GDP)
AD
3. EXOGENOUS SHOCK M:The government increases defensespending by 10 percent per year over a five-year period.
EXPLANATION:
Response to Exogenous Shock M
Pric
e le
vel
ASLRAS
Real national output (GDP)
AD
ACTIVITY 20 continued
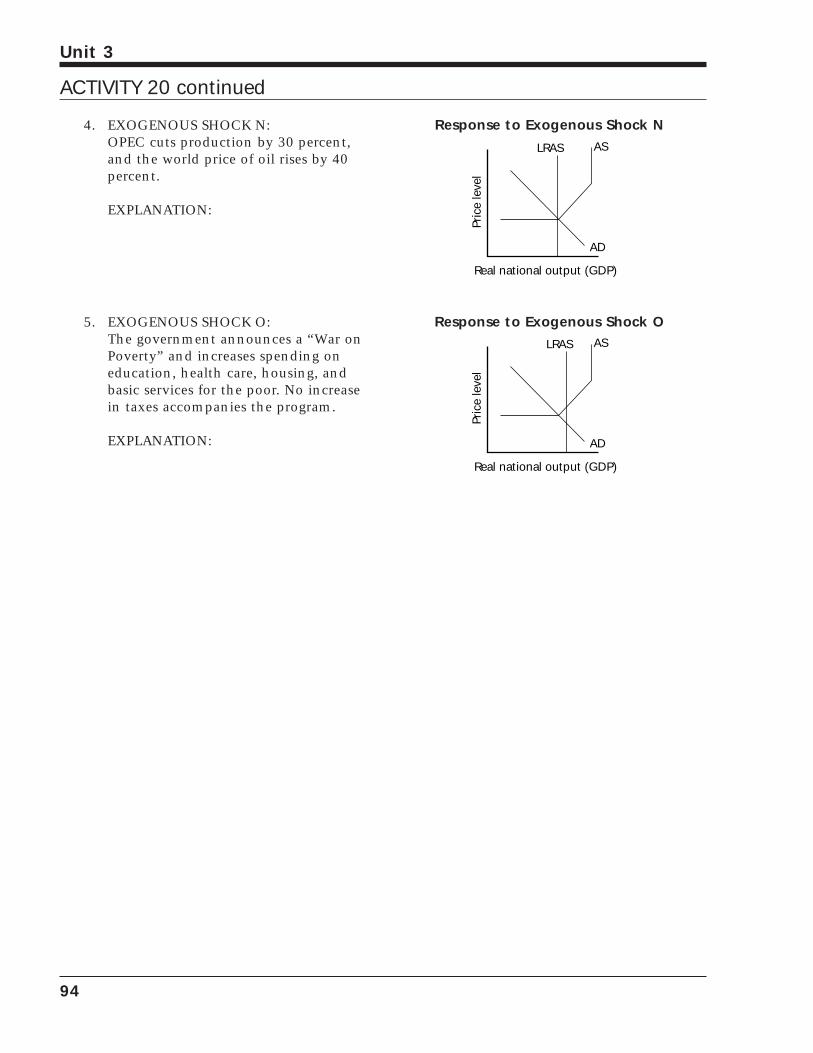
94
Unit 3
4. EXOGENOUS SHOCK N:OPEC cuts production by 30 percent,and the world price of oil rises by 40percent.
EXPLANATION:
Response to Exogenous Shock N
Pric
e le
vel
ASLRAS
Real national output (GDP)
AD
5. EXOGENOUS SHOCK O:The government announces a “War onPoverty” and increases spending oneducation, health care, housing, andbasic services for the poor. No increasein taxes accompanies the program.
EXPLANATION:
Response to Exogenous Shock O
Pric
e le
vel
ASLRAS
Real national output (GDP)
AD
ACTIVITY 20 continued
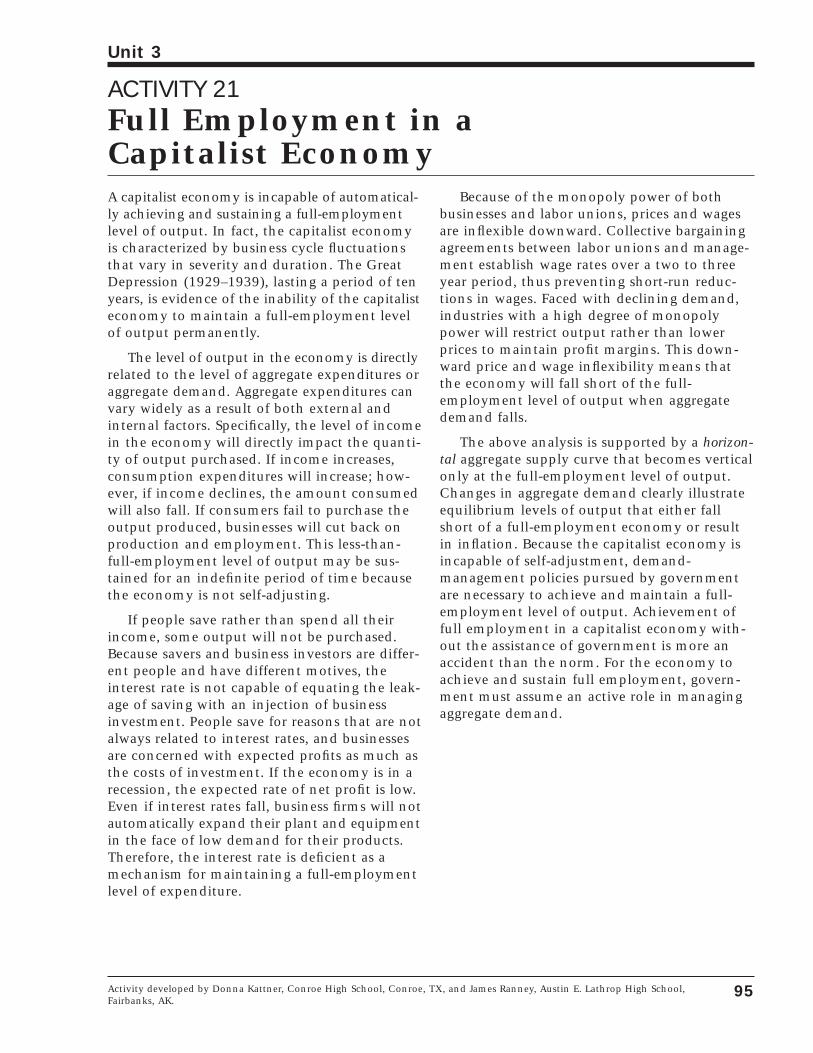
ACTIVITY 21Full Employment in a Capitalist Economy
95
Unit 3
Activity developed by Donna Kattner, Conroe High School, Conroe, TX, and James Ranney, Austin E. Lathrop High School,Fairbanks, AK.
A capitalist economy is incapable of automatical-ly achieving and sustaining a full-employmentlevel of output. In fact, the capitalist economyis characterized by business cycle fluctuationsthat vary in severity and duration. The GreatDepression (1929–1939), lasting a period of tenyears, is evidence of the inability of the capitalisteconomy to maintain a full-employment levelof output permanently.
The level of output in the economy is directlyrelated to the level of aggregate expenditures oraggregate demand. Aggregate expenditures canvary widely as a result of both external andinternal factors. Specifically, the level of incomein the economy will directly impact the quanti-ty of output purchased. If income increases,consumption expenditures will increase; how-ever, if income declines, the amount consumedwill also fall. If consumers fail to purchase theoutput produced, businesses will cut back onproduction and employment. This less-than-full-employment level of output may be sus-tained for an indefinite period of time becausethe economy is not self-adjusting.
If people save rather than spend all theirincome, some output will not be purchased.Because savers and business investors are differ-ent people and have different motives, theinterest rate is not capable of equating the leak-age of saving with an injection of businessinvestment. People save for reasons that are notalways related to interest rates, and businessesare concerned with expected profits as much asthe costs of investment. If the economy is in arecession, the expected rate of net profit is low.Even if interest rates fall, business firms will notautomatically expand their plant and equipmentin the face of low demand for their products.Therefore, the interest rate is deficient as amechanism for maintaining a full-employmentlevel of expenditure.
Because of the monopoly power of bothbusinesses and labor unions, prices and wagesare inflexible downward. Collective bargainingagreements between labor unions and manage-ment establish wage rates over a two to threeyear period, thus preventing short-run reduc-tions in wages. Faced with declining demand,industries with a high degree of monopolypower will restrict output rather than lowerprices to maintain profit margins. This down-ward price and wage inflexibility means thatthe economy will fall short of the full-employment level of output when aggregatedemand falls.
The above analysis is supported by a horizon-tal aggregate supply curve that becomes verticalonly at the full-employment level of output.Changes in aggregate demand clearly illustrateequilibrium levels of output that either fallshort of a full-employment economy or resultin inflation. Because the capitalist economy isincapable of self-adjustment, demand-management policies pursued by governmentare necessary to achieve and maintain a full-employment level of output. Achievement offull employment in a capitalist economy with-out the assistance of government is more anaccident than the norm. For the economy toachieve and sustain full employment, govern-ment must assume an active role in managingaggregate demand.

Questions for small group discussion:
1. Do business-cycle fluctuations occur as a result of external or internal factors?Explain.
2. Are periods of economic instability temporary, or can they be of long duration?
3. Identify and explain the main determinant of the level of output and employmentin the economy.
4. If people save their income instead of spending it, what will be the effect on thelevel of output and employment? Will interest rates automatically equate the leak-age of saving with an injection of investment spending by business firms? Explainwhy or why not.
5. Are wages and prices downwardly flexible in the event of decreases in aggregatedemand? Explain why or why not.
6. Does a capitalist economy contain inherent self-adjusting mechanisms that assist itin achieving and sustaining full-employment levels of output?
7. What should be the proper role of government in the capitalist economy? Explain why.
8. Describe the shape of the aggregate supply curve. Illustrate how the shape of the AScurve explains, in the event of changing aggregate demand, the conclusion drawnin question 6.
96
Unit 3
ACTIVITY 21 continued
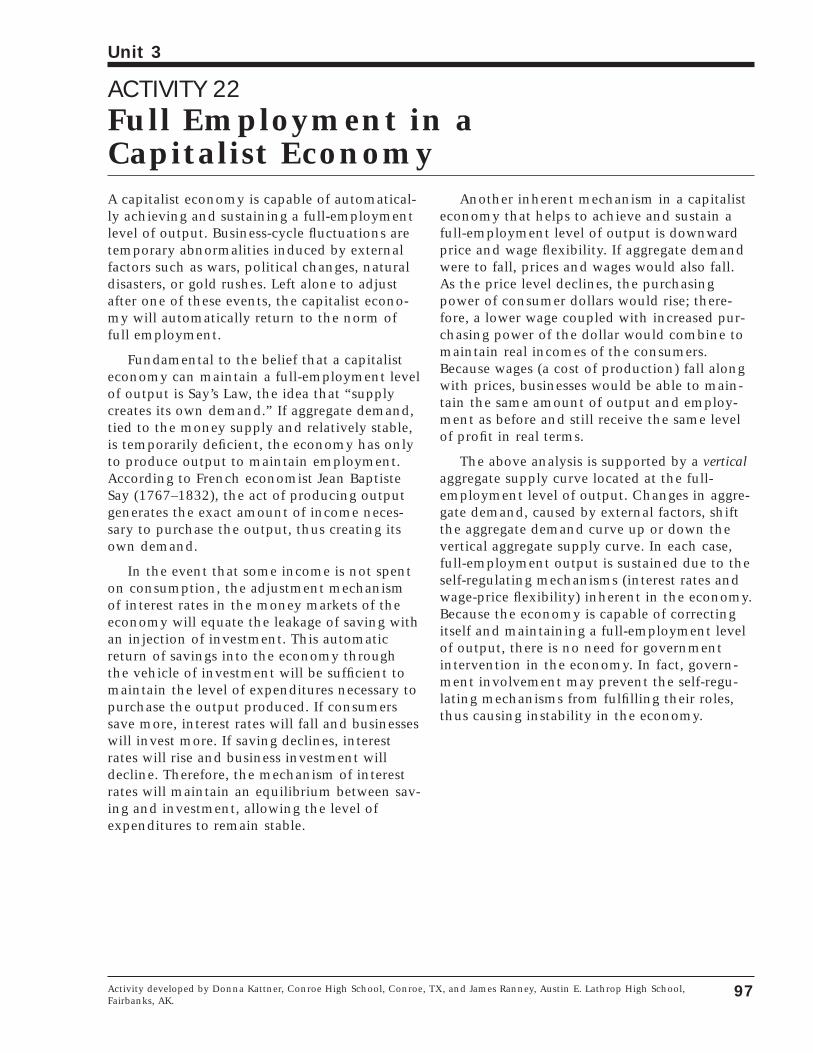
ACTIVITY 22Full Employment in a Capitalist Economy
97
Unit 3
Activity developed by Donna Kattner, Conroe High School, Conroe, TX, and James Ranney, Austin E. Lathrop High School,Fairbanks, AK.
A capitalist economy is capable of automatical-ly achieving and sustaining a full-employmentlevel of output. Business-cycle fluctuations aretemporary abnormalities induced by externalfactors such as wars, political changes, naturaldisasters, or gold rushes. Left alone to adjustafter one of these events, the capitalist econo-my will automatically return to the norm offull employment.
Fundamental to the belief that a capitalisteconomy can maintain a full-employment levelof output is Say’s Law, the idea that “supplycreates its own demand.” If aggregate demand,tied to the money supply and relatively stable,is temporarily deficient, the economy has onlyto produce output to maintain employment.According to French economist Jean BaptisteSay (1767–1832), the act of producing outputgenerates the exact amount of income neces-sary to purchase the output, thus creating itsown demand.
In the event that some income is not spenton consumption, the adjustment mechanismof interest rates in the money markets of theeconomy will equate the leakage of saving withan injection of investment. This automaticreturn of savings into the economy throughthe vehicle of investment will be sufficient tomaintain the level of expenditures necessary topurchase the output produced. If consumerssave more, interest rates will fall and businesseswill invest more. If saving declines, interestrates will rise and business investment willdecline. Therefore, the mechanism of interestrates will maintain an equilibrium between sav-ing and investment, allowing the level ofexpenditures to remain stable.
Another inherent mechanism in a capitalisteconomy that helps to achieve and sustain afull-employment level of output is downwardprice and wage flexibility. If aggregate demandwere to fall, prices and wages would also fall.As the price level declines, the purchasingpower of consumer dollars would rise; there-fore, a lower wage coupled with increased pur-chasing power of the dollar would combine tomaintain real incomes of the consumers.Because wages (a cost of production) fall alongwith prices, businesses would be able to main-tain the same amount of output and employ-ment as before and still receive the same levelof profit in real terms.
The above analysis is supported by a verticalaggregate supply curve located at the full-employment level of output. Changes in aggre-gate demand, caused by external factors, shiftthe aggregate demand curve up or down thevertical aggregate supply curve. In each case,full-employment output is sustained due to theself-regulating mechanisms (interest rates andwage-price flexibility) inherent in the economy.Because the economy is capable of correctingitself and maintaining a full-employment levelof output, there is no need for governmentintervention in the economy. In fact, govern-ment involvement may prevent the self-regu-lating mechanisms from fulfilling their roles,thus causing instability in the economy.
Questions for small group discussion:
1. Do business cycle fluctuations occur as a result of external or internal factors?Explain.
2. Are periods of economic instability temporary, or can they be of long duration?
3. Identify and explain the main determinant of the level of output and employmentin the economy.
4. If people save their income instead of spending it, what will be the effect on thelevel of output and employment? Will interest rates automatically equate the leak-age of saving with an injection of investment spending by business firms? Explainwhy or why not.
5. Are wages and prices downwardly flexible in the event of decreases in aggregatedemand? Explain why or why not.
6. Does a capitalist economy contain inherent self-adjusting mechanisms that assist itin achieving and sustaining full-employment levels of output?
7. What should be the proper role of government in the capitalist economy? Explain why.
8. Describe the shape of the aggregate supply curve. Illustrate how the shape of the AScurve explains, in the event of changing aggregate demand, the conclusion drawnin question 6.
98
Unit 3
ACTIVITY 22 continued
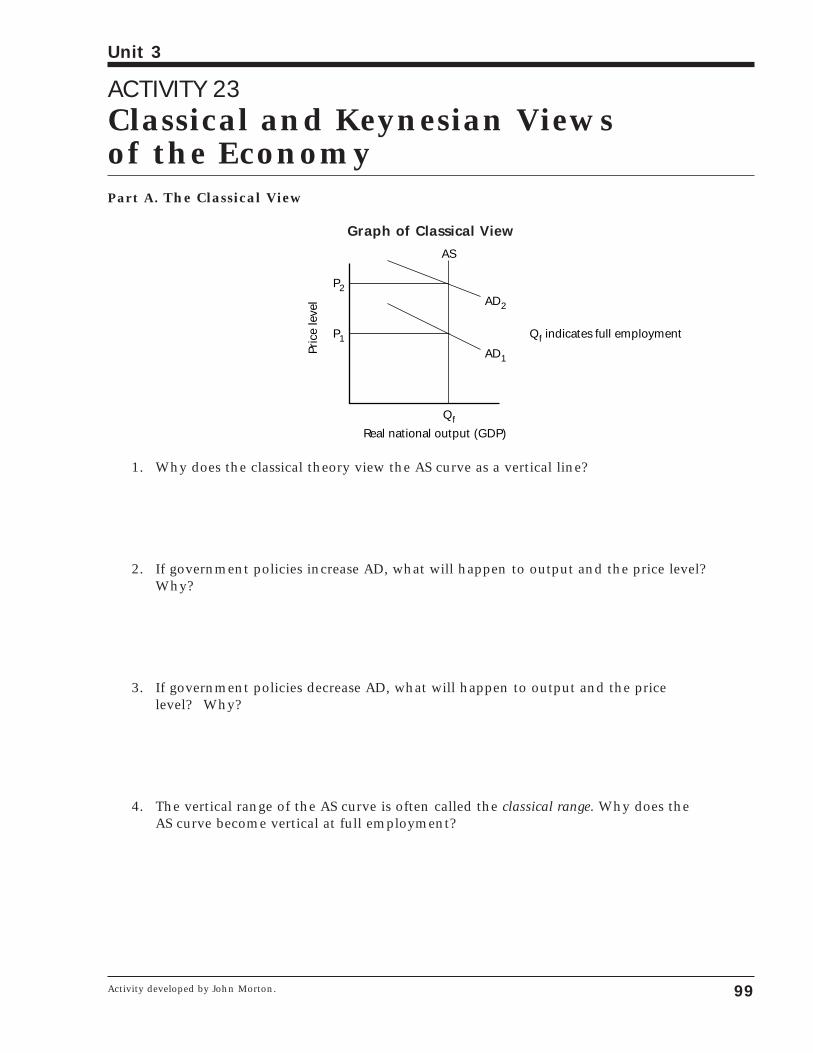
ACTIVITY 23Classical and Keynesian Views of the EconomyPart A. The Classical View
Graph of Classical View
1. Why does the classical theory view the AS curve as a vertical line?
2. If government policies increase AD, what will happen to output and the price level?Why?
3. If government policies decrease AD, what will happen to output and the pricelevel? Why?
4. The vertical range of the AS curve is often called the classical range. Why does theAS curve become vertical at full employment?
Pric
e le
vel
AS
AD1
P2
P1
Qf
Real national output (GDP)
AD2
Qf indicates full employment
99
Unit 3
Activity developed by John Morton.
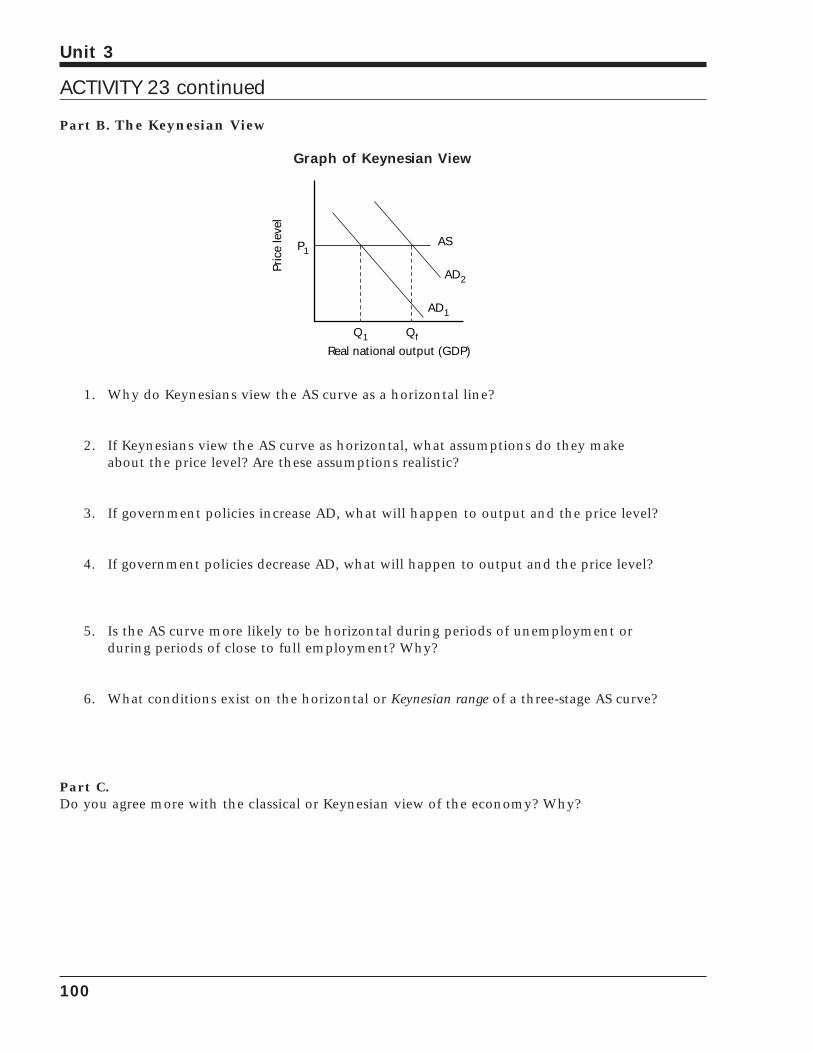
Part B. The Keynesian View
Graph of Keynesian View
1. Why do Keynesians view the AS curve as a horizontal line?
2. If Keynesians view the AS curve as horizontal, what assumptions do they makeabout the price level? Are these assumptions realistic?
3. If government policies increase AD, what will happen to output and the price level?
4. If government policies decrease AD, what will happen to output and the price level?
5. Is the AS curve more likely to be horizontal during periods of unemployment orduring periods of close to full employment? Why?
6. What conditions exist on the horizontal or Keynesian range of a three-stage AS curve?
Part C.Do you agree more with the classical or Keynesian view of the economy? Why?
Pric
e le
vel
AS
AD1
P1
Qf
Real national output (GDP)
AD2
Q1
100
Unit 3
ACTIVITY 23 continued
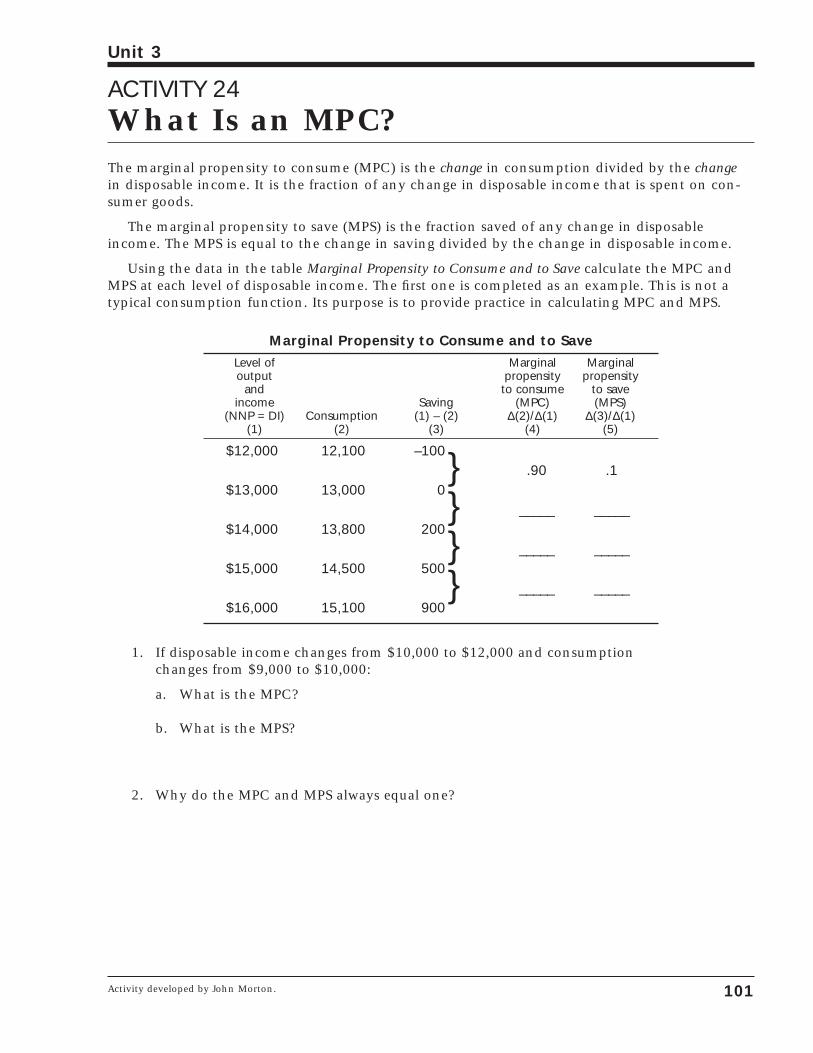
ACTIVITY 24What Is an MPC?The marginal propensity to consume (MPC) is the change in consumption divided by the changein disposable income. It is the fraction of any change in disposable income that is spent on con-sumer goods.
The marginal propensity to save (MPS) is the fraction saved of any change in disposableincome. The MPS is equal to the change in saving divided by the change in disposable income.
Using the data in the table Marginal Propensity to Consume and to Save calculate the MPC andMPS at each level of disposable income. The first one is completed as an example. This is not atypical consumption function. Its purpose is to provide practice in calculating MPC and MPS.
Marginal Propensity to Consume and to Save
Level of Marginal Marginaloutput propensity propensity
and to consume to saveincome Saving (MPC) (MPS)
(NNP = DI) Consumption (1) – (2) ∆(2)/∆(1) ∆(3)/∆(1)(1) (2) (3) (4) (5)
$12,000 12,100 –100
} .90 .1$13,000 13,000 0
} _____ _____$14,000 13,800 200
} _____ _____$15,000 14,500 500
} _____ _____$16,000 15,100 900
1. If disposable income changes from $10,000 to $12,000 and consumption changes from $9,000 to $10,000:
a. What is the MPC?
b. What is the MPS?
2. Why do the MPC and MPS always equal one?
101
Unit 3
Activity developed by John Morton.

102
Unit 3
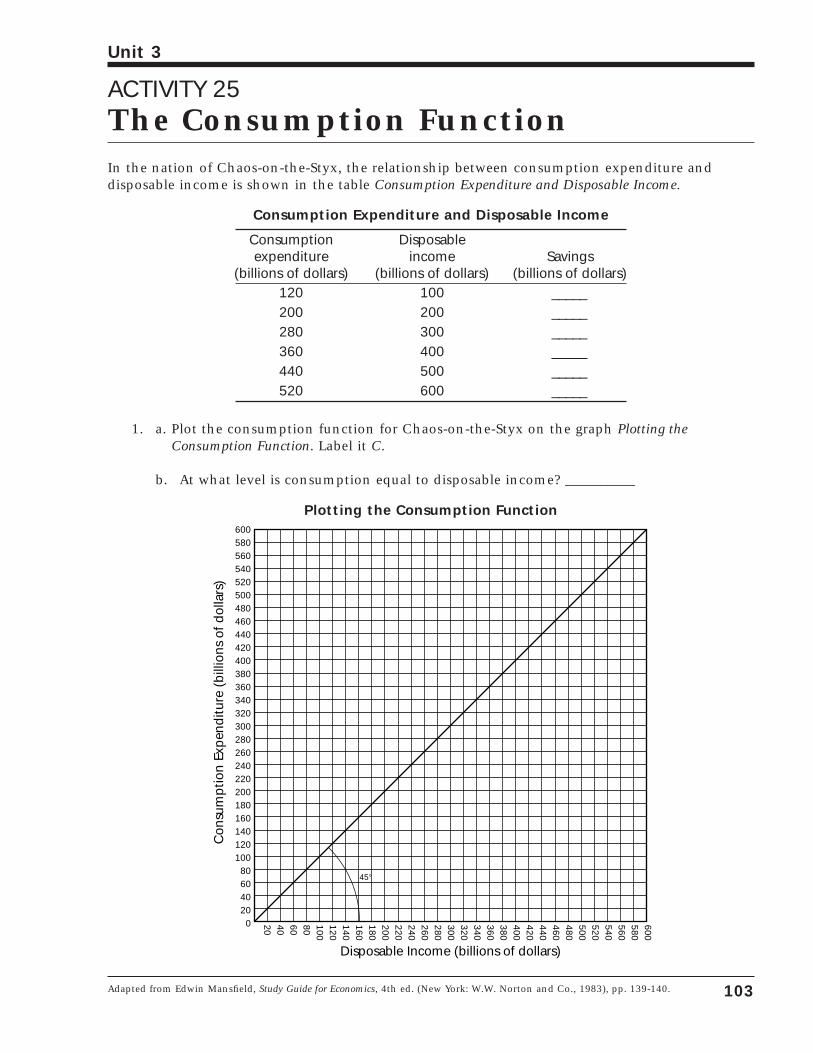
ACTIVITY 25The Consumption FunctionIn the nation of Chaos-on-the-Styx, the relationship between consumption expenditure and disposable income is shown in the table Consumption Expenditure and Disposable Income.
Consumption Expenditure and Disposable Income
Consumption Disposableexpenditure income Savings
(billions of dollars) (billions of dollars) (billions of dollars)120 100 _____200 200 _____280 300 _____360 400 _____440 500 _____520 600 _____
1. a. Plot the consumption function for Chaos-on-the-Styx on the graph Plotting theConsumption Function. Label it C.
b. At what level is consumption equal to disposable income? __________
Plotting the Consumption Function
60058056054052050048046044042040038036034032030028026024022020018016014012010080604020
Disposable Income (billions of dollars)
Con
sum
ptio
n Ex
pen
ditu
re (
billi
ons
of d
olla
rs)
600580560540520500480460440420400380360340320300280260240220200180160140120100806040200
45°
103
Unit 3
Adapted from Edwin Mansfield, Study Guide for Economics, 4th ed. (New York: W.W. Norton and Co., 1983), pp. 139-140.
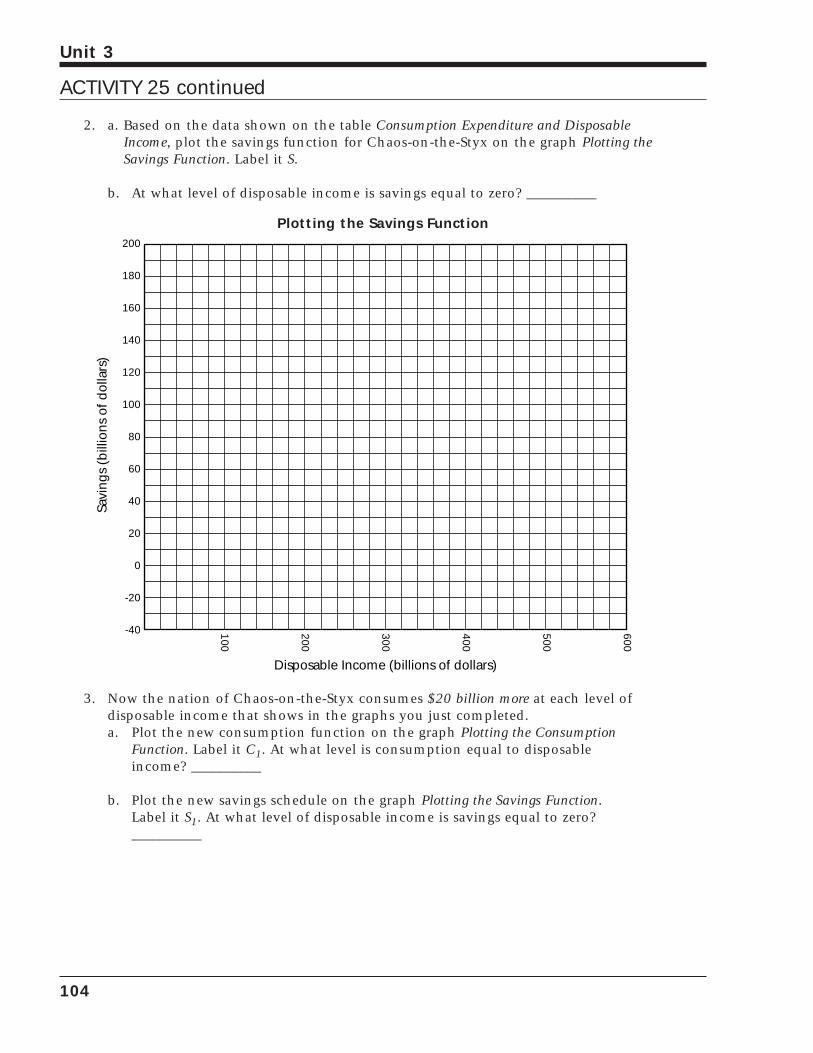
2. a. Based on the data shown on the table Consumption Expenditure and DisposableIncome, plot the savings function for Chaos-on-the-Styx on the graph Plotting theSavings Function. Label it S.
b. At what level of disposable income is savings equal to zero? __________
Plotting the Savings Function
3. Now the nation of Chaos-on-the-Styx consumes $20 billion more at each level ofdisposable income that shows in the graphs you just completed.a. Plot the new consumption function on the graph Plotting the Consumption
Function. Label it C1. At what level is consumption equal to disposableincome? __________
b. Plot the new savings schedule on the graph Plotting the Savings Function.Label it S1. At what level of disposable income is savings equal to zero?__________
600
500
400
300
200
100
Disposable Income (billions of dollars)
Savi
ngs
(bill
ions
of d
olla
rs)
200
180
160
140
120
100
80
60
40
20
0
-20
-40
104
Unit 3
ACTIVITY 25 continued
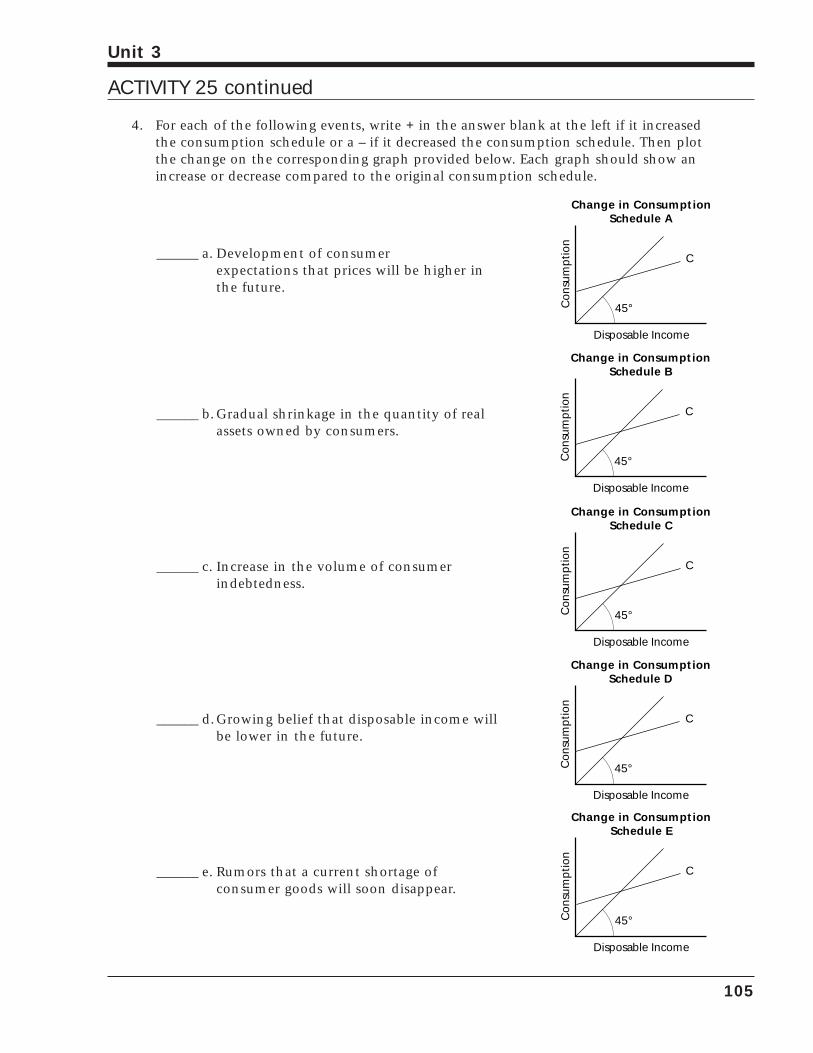
4. For each of the following events, write + in the answer blank at the left if it increasedthe consumption schedule or a – if it decreased the consumption schedule. Then plotthe change on the corresponding graph provided below. Each graph should show anincrease or decrease compared to the original consumption schedule.
105
Unit 3
ACTIVITY 25 continued
______ a. Development of consumer expectations that prices will be higher inthe future.
______ b. Gradual shrinkage in the quantity of realassets owned by consumers.
______ c. Increase in the volume of consumer indebtedness.
______ d.Growing belief that disposable income willbe lower in the future.
______ e. Rumors that a current shortage of consumer goods will soon disappear.
Con
sum
ptio
n
C
45°
Disposable Income
Change in ConsumptionSchedule E
Con
sum
ptio
n
C
45°
Disposable Income
Change in ConsumptionSchedule D
Con
sum
ptio
nC
45°
Disposable Income
Change in ConsumptionSchedule C
Con
sum
ptio
n
C
45°
Disposable Income
Change in ConsumptionSchedule B
Con
sum
ptio
n
C
45°
Disposable Income
Change in ConsumptionSchedule A

106
Unit 3
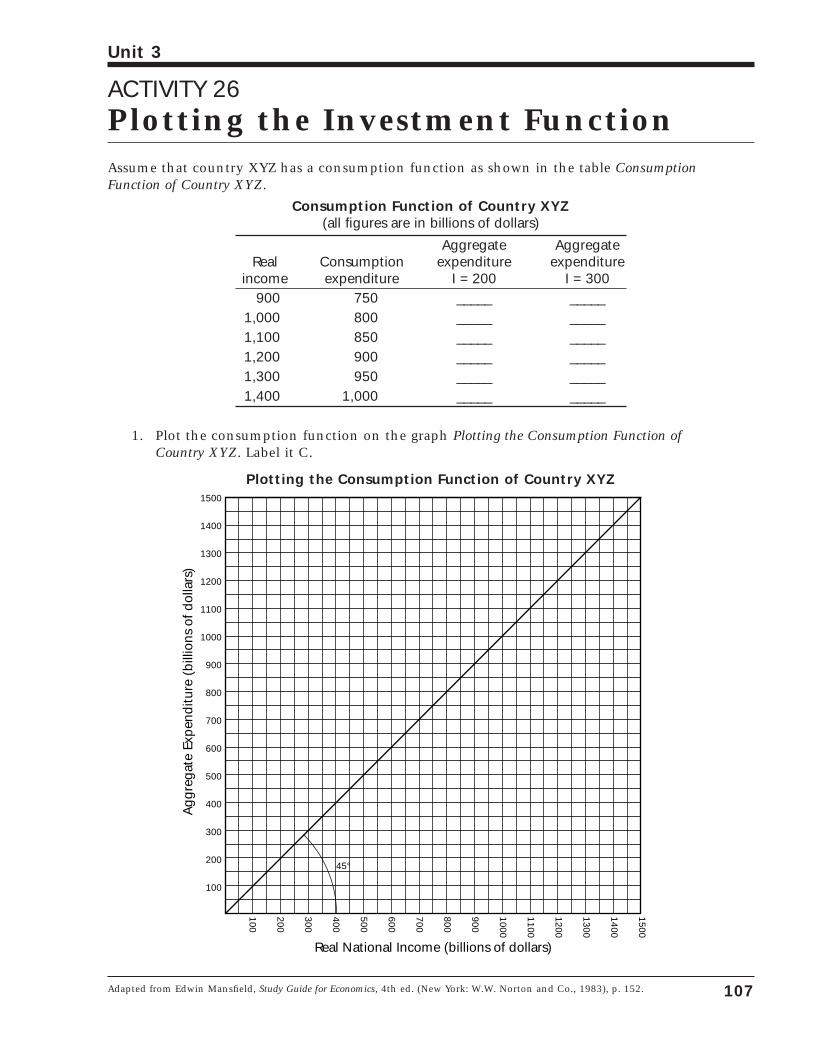
ACTIVITY 26Plotting the Investment FunctionAssume that country XYZ has a consumption function as shown in the table Consumption Function of Country XYZ.
Consumption Function of Country XYZ(all figures are in billions of dollars)
Aggregate AggregateReal Consumption expenditure expenditure
income expenditure I = 200 I = 300900 750 _____ _____
1,000 800 _____ _____1,100 850 _____ _____1,200 900 _____ _____1,300 950 _____ _____1,400 1,000 _____ _____
1. Plot the consumption function on the graph Plotting the Consumption Function ofCountry XYZ. Label it C.
Plotting the Consumption Function of Country XYZ
1500
1400
1300
1200
1100
1000
900
800
700
600
500
400
300
200
100
Real National Income (billions of dollars)
Agg
rega
te E
xpen
ditu
re (
billi
ons
of d
olla
rs)
1500
1400
1300
1200
1100
1000
900
800
700
600
500
400
300
200
100
45°
107
Unit 3
Adapted from Edwin Mansfield, Study Guide for Economics, 4th ed. (New York: W.W. Norton and Co., 1983), p. 152.
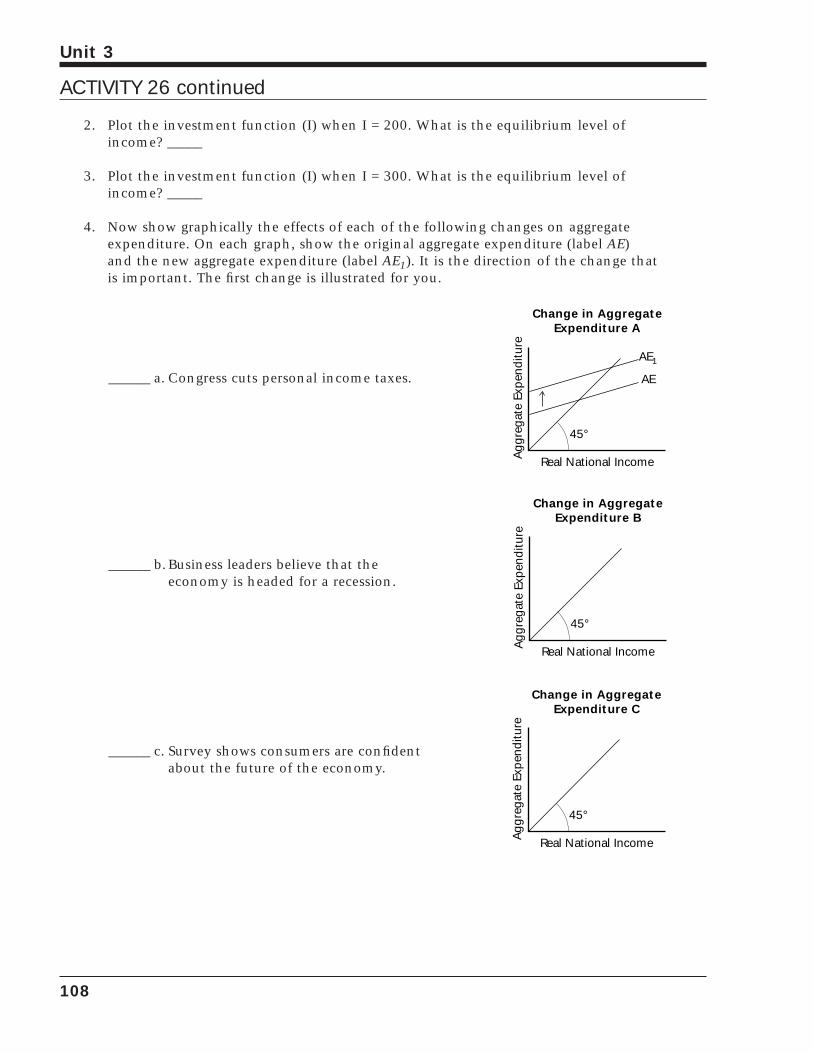
2. Plot the investment function (I) when I = 200. What is the equilibrium level ofincome? _____
3. Plot the investment function (I) when I = 300. What is the equilibrium level ofincome? _____
4. Now show graphically the effects of each of the following changes on aggregateexpenditure. On each graph, show the original aggregate expenditure (label AE)and the new aggregate expenditure (label AE1). It is the direction of the change thatis important. The first change is illustrated for you.
108
Unit 3
ACTIVITY 26 continued
______ a. Congress cuts personal income taxes.
______ b. Business leaders believe that the economy is headed for a recession.
______ c. Survey shows consumers are confidentabout the future of the economy.
Agg
rega
te E
xpen
ditu
re
45°
Real National Income
Change in AggregateExpenditure C
Agg
rega
te E
xpen
ditu
re
45°
Real National Income
Change in AggregateExpenditure B
Agg
rega
te E
xpen
ditu
re
AE
45°
Real National Income
Change in AggregateExpenditure A
AE1
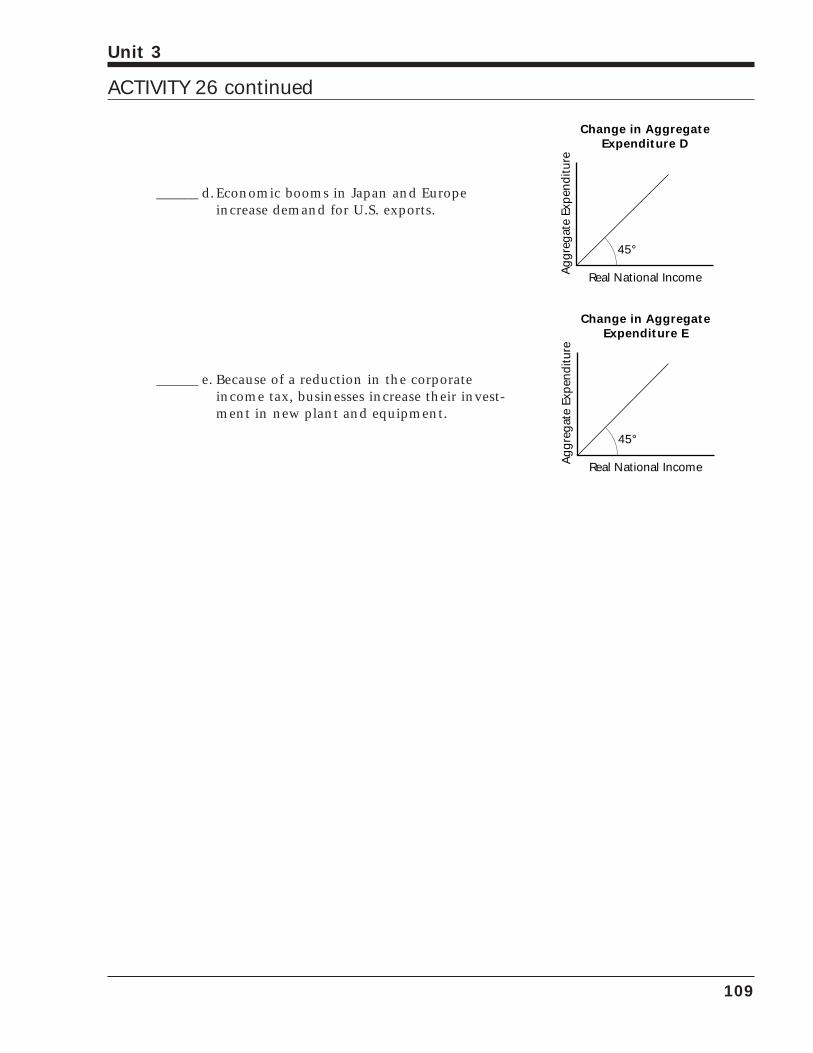
109
Unit 3
______ d.Economic booms in Japan and Europeincrease demand for U.S. exports.
______ e. Because of a reduction in the corporateincome tax, businesses increase their invest-ment in new plant and equipment.
Agg
rega
te E
xpen
ditu
re
45°
Real National Income
Change in AggregateExpenditure E
Agg
rega
te E
xpen
ditu
re
45°
Real National Income
Change in AggregateExpenditure D
ACTIVITY 26 continued

110
Unit 3
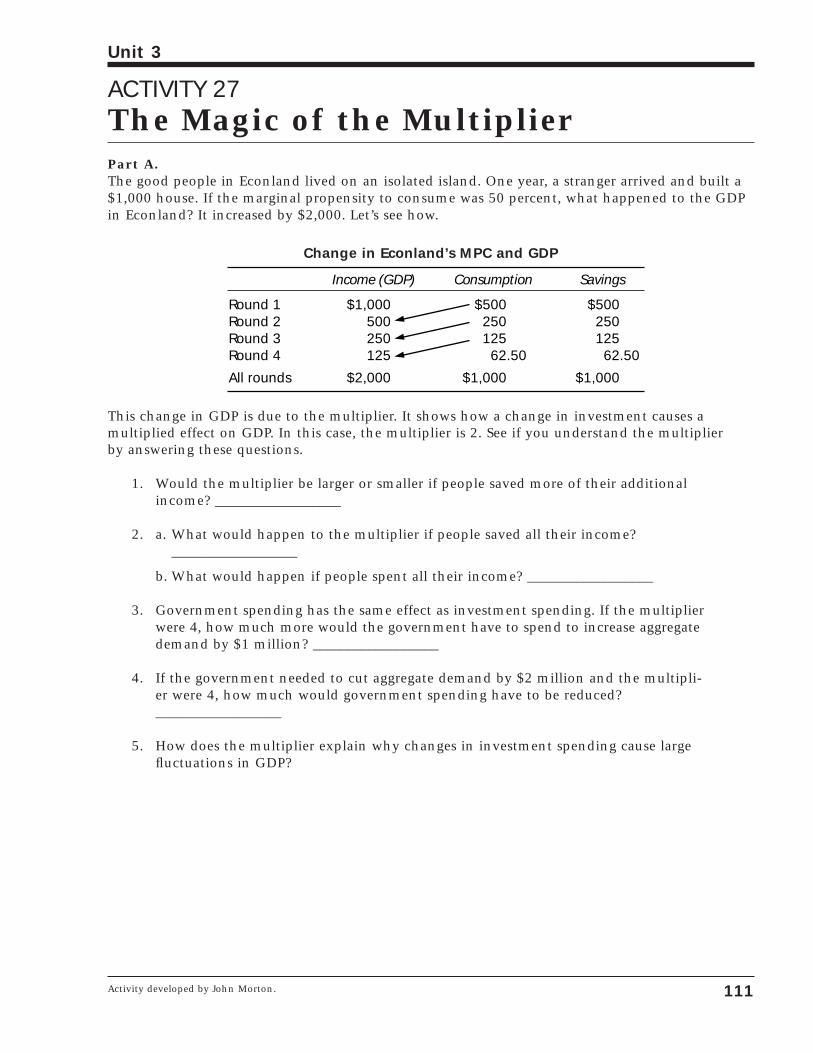
ACTIVITY 27The Magic of the MultiplierPart A.The good people in Econland lived on an isolated island. One year, a stranger arrived and built a$1,000 house. If the marginal propensity to consume was 50 percent, what happened to the GDPin Econland? It increased by $2,000. Let’s see how.
Change in Econland’s MPC and GDP
This change in GDP is due to the multiplier. It shows how a change in investment causes a multiplied effect on GDP. In this case, the multiplier is 2. See if you understand the multiplier by answering these questions.
1. Would the multiplier be larger or smaller if people saved more of their additionalincome? __________________
2. a. What would happen to the multiplier if people saved all their income?__________________
b. What would happen if people spent all their income? __________________
3. Government spending has the same effect as investment spending. If the multiplierwere 4, how much more would the government have to spend to increase aggregatedemand by $1 million? __________________
4. If the government needed to cut aggregate demand by $2 million and the multipli-er were 4, how much would government spending have to be reduced?__________________
5. How does the multiplier explain why changes in investment spending cause largefluctuations in GDP?
Income (GDP) Consumption Savings
Round 1 $1,000 $500 $500Round 2 500 250 250Round 3 250 125 125Round 4 125 62.50 62.50
All rounds $2,000 $1,000 $1,000
111
Unit 3
Activity developed by John Morton.
Part B. The Algebra of the MultiplierThe size of the multiplier is calculated by this formula:
In the case of Econland,
1. What is the multiplier if the MPC is equal to 3/4? _________
2. What is the multiplier if the MPC is equal to 9/10? _________
3. What is the multiplier if the marginal propensity to save (MPS) is 1/5? _________
4. Why is the multiplier important in understanding business cycles?
M =1
1 – 1/2=
11/2
= 2
Multiplier =1
1 – MPC
112
Unit 3
ACTIVITY 27 continued
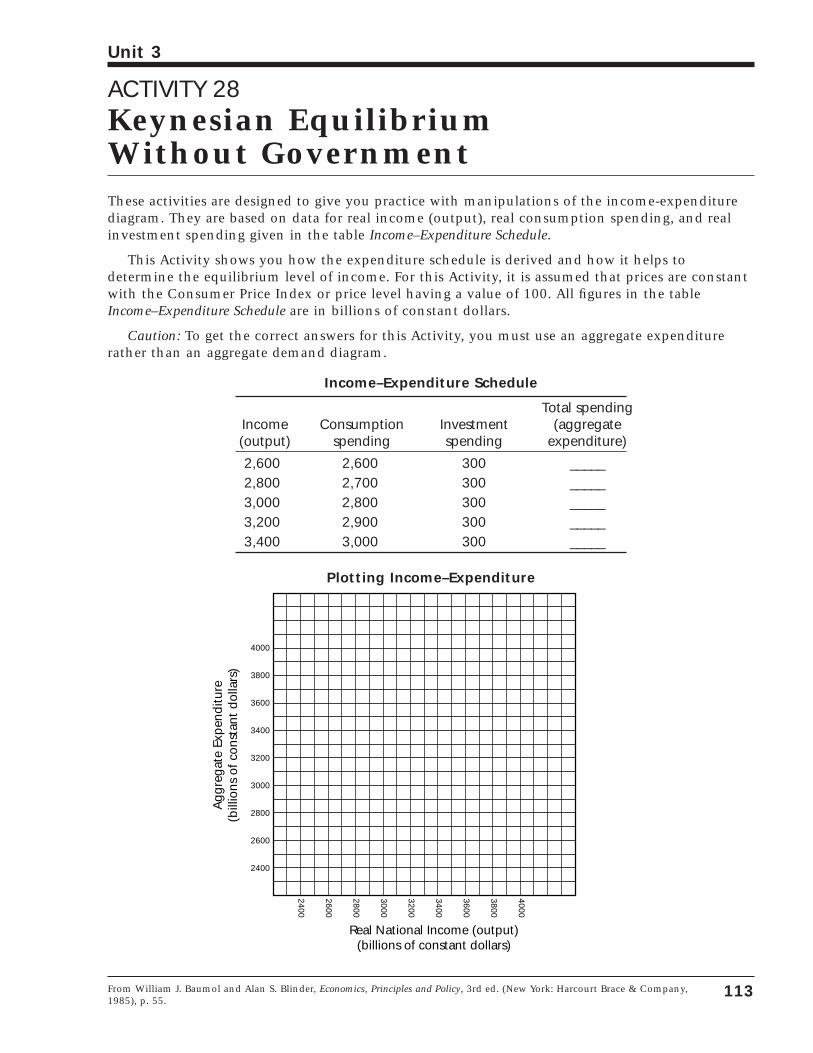
ACTIVITY 28Keynesian Equilibrium Without GovernmentThese activities are designed to give you practice with manipulations of the income-expenditurediagram. They are based on data for real income (output), real consumption spending, and realinvestment spending given in the table Income–Expenditure Schedule.
This Activity shows you how the expenditure schedule is derived and how it helps to determine the equilibrium level of income. For this Activity, it is assumed that prices are constantwith the Consumer Price Index or price level having a value of 100. All figures in the tableIncome–Expenditure Schedule are in billions of constant dollars.
Caution: To get the correct answers for this Activity, you must use an aggregate expenditurerather than an aggregate demand diagram.
Income–Expenditure Schedule
Total spendingIncome Consumption Investment (aggregate(output) spending spending expenditure)
2,600 2,600 300 _____2,800 2,700 300 _____3,000 2,800 300 _____3,200 2,900 300 _____3,400 3,000 300 _____
Plotting Income–Expenditure
4000
3800
3600
3400
3200
3000
2800
2600
2400
Real National Income (output)(billions of constant dollars)
Agg
rega
te E
xpen
ditu
re(b
illio
ns o
f con
stan
t do
llars
)
4000
3800
3600
3400
3200
3000
2800
2600
2400
113
Unit 3
From William J. Baumol and Alan S. Blinder, Economics, Principles and Policy, 3rd ed. (New York: Harcourt Brace & Company,1985), p. 55.
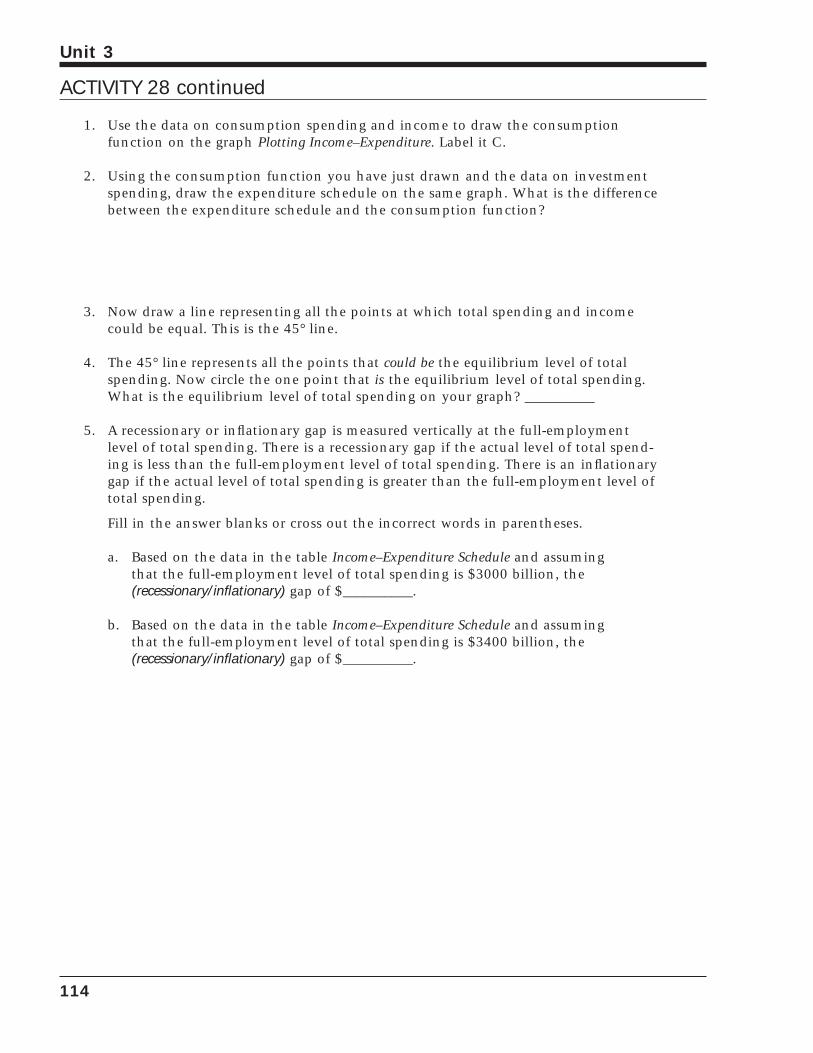
1. Use the data on consumption spending and income to draw the consumptionfunction on the graph Plotting Income–Expenditure. Label it C.
2. Using the consumption function you have just drawn and the data on investmentspending, draw the expenditure schedule on the same graph. What is the differencebetween the expenditure schedule and the consumption function?
3. Now draw a line representing all the points at which total spending and incomecould be equal. This is the 45° line.
4. The 45° line represents all the points that could be the equilibrium level of totalspending. Now circle the one point that is the equilibrium level of total spending.What is the equilibrium level of total spending on your graph? __________
5. A recessionary or inflationary gap is measured vertically at the full-employmentlevel of total spending. There is a recessionary gap if the actual level of total spend-ing is less than the full-employment level of total spending. There is an inflationarygap if the actual level of total spending is greater than the full-employment level oftotal spending.
Fill in the answer blanks or cross out the incorrect words in parentheses.
a. Based on the data in the table Income–Expenditure Schedule and assumingthat the full-employment level of total spending is $3000 billion, the (recessionary/inflationary) gap of $__________.
b. Based on the data in the table Income–Expenditure Schedule and assumingthat the full-employment level of total spending is $3400 billion, the (recessionary/inflationary) gap of $__________.
114
Unit 3
ACTIVITY 28 continued
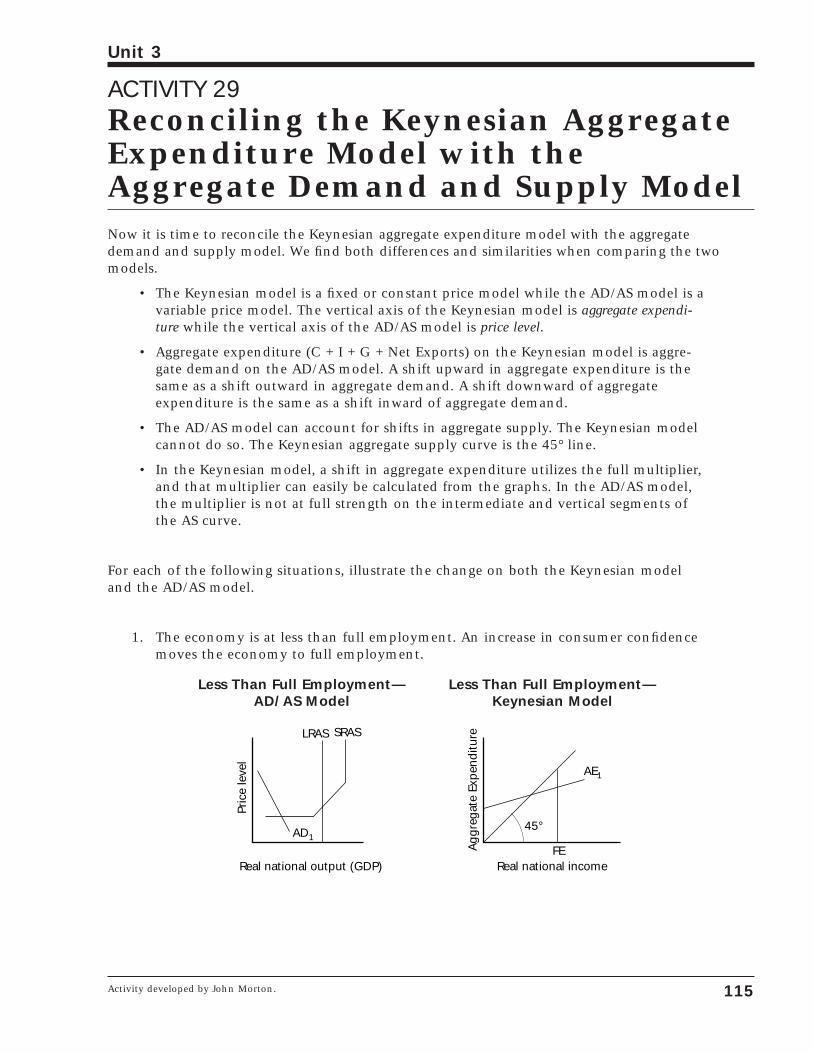
ACTIVITY 29Reconciling the Keynesian AggregateExpenditure Model with theAggregate Demand and Supply ModelNow it is time to reconcile the Keynesian aggregate expenditure model with the aggregate demand and supply model. We find both differences and similarities when comparing the twomodels.
• The Keynesian model is a fixed or constant price model while the AD/AS model is avariable price model. The vertical axis of the Keynesian model is aggregate expendi-ture while the vertical axis of the AD/AS model is price level.
• Aggregate expenditure (C + I + G + Net Exports) on the Keynesian model is aggre-gate demand on the AD/AS model. A shift upward in aggregate expenditure is thesame as a shift outward in aggregate demand. A shift downward of aggregateexpenditure is the same as a shift inward of aggregate demand.
• The AD/AS model can account for shifts in aggregate supply. The Keynesian modelcannot do so. The Keynesian aggregate supply curve is the 45° line.
• In the Keynesian model, a shift in aggregate expenditure utilizes the full multiplier,and that multiplier can easily be calculated from the graphs. In the AD/AS model,the multiplier is not at full strength on the intermediate and vertical segments ofthe AS curve.
For each of the following situations, illustrate the change on both the Keynesian model and the AD/AS model.
1. The economy is at less than full employment. An increase in consumer confidencemoves the economy to full employment.
Less Than Full Employment— Less Than Full Employment—AD/AS Model Keynesian Model
Agg
rega
te E
xpen
ditu
re
AE1
45°
FEReal national income
Pric
e le
vel
SRASLRAS
Real national output (GDP)
AD1
115
Unit 3
Activity developed by John Morton.
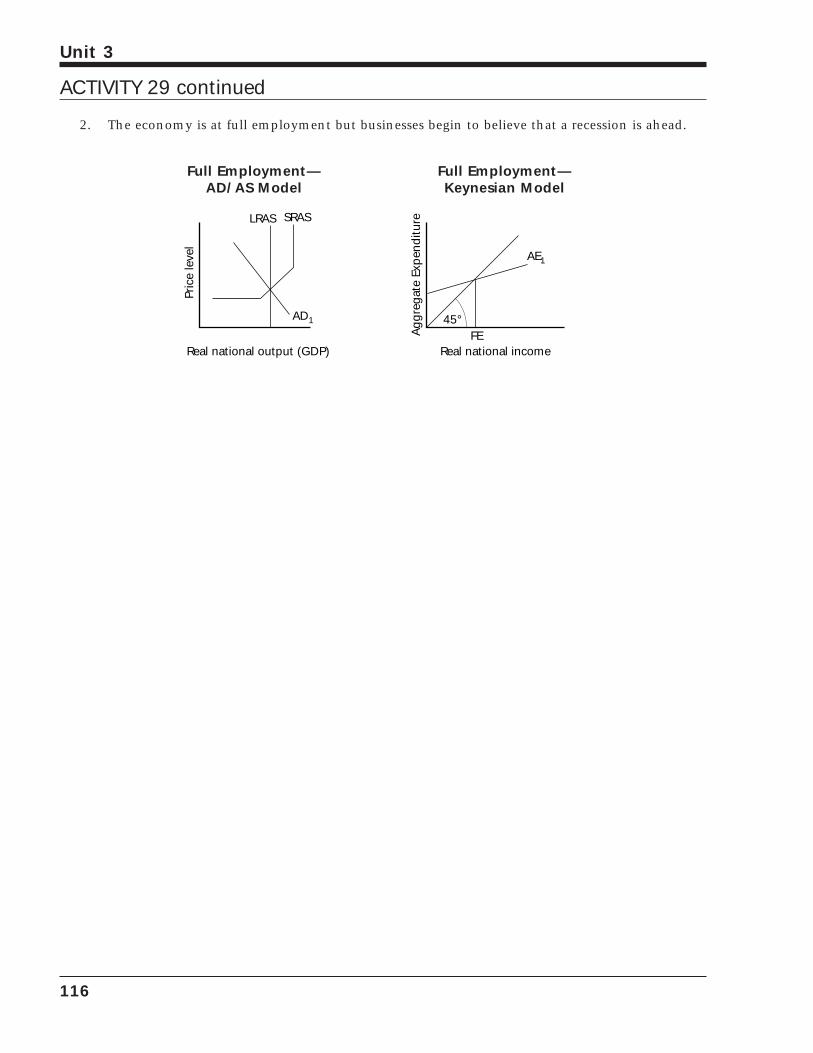
2. The economy is at full employment but businesses begin to believe that a recession is ahead.
Full Employment— Full Employment— AD/AS Model Keynesian Model
Agg
rega
te E
xpen
ditu
re
AE1
45°
Real national income
Pric
e le
vel
SRASLRAS
Real national output (GDP)
AD1
FE
116
Unit 3
ACTIVITY 29 continued
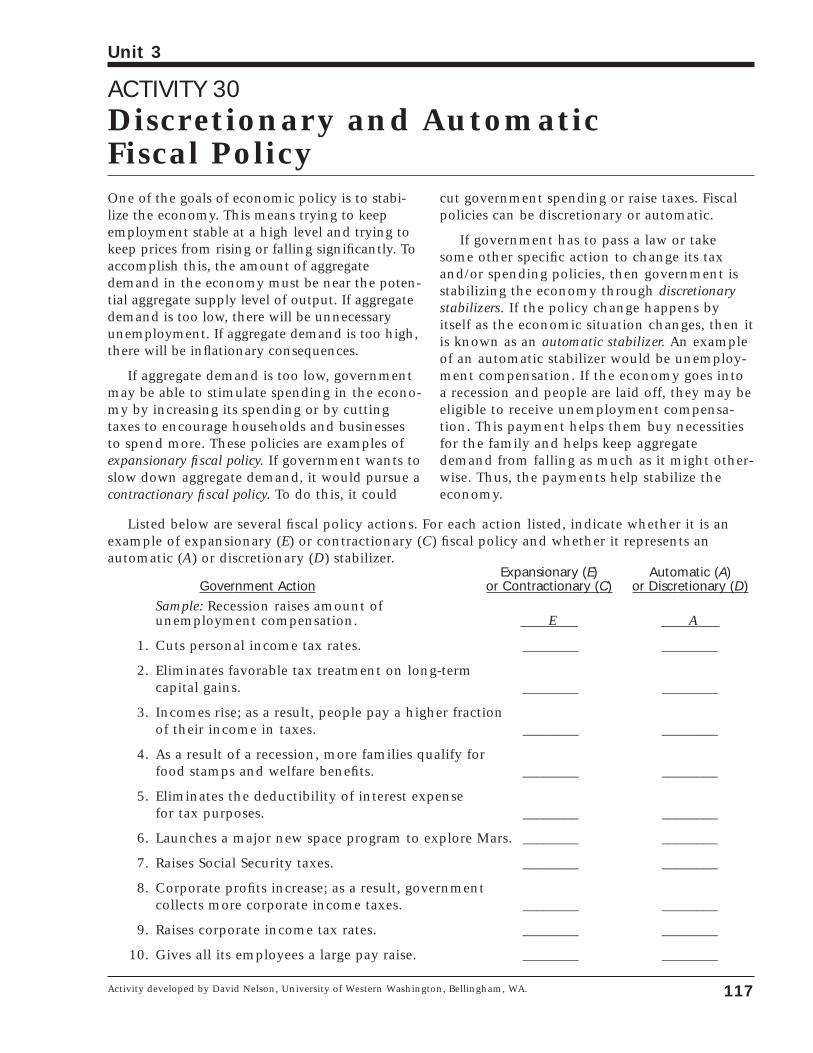
ACTIVITY 30Discretionary and Automatic Fiscal Policy
117
Unit 3
Activity developed by David Nelson, University of Western Washington, Bellingham, WA.
One of the goals of economic policy is to stabi-lize the economy. This means trying to keepemployment stable at a high level and trying tokeep prices from rising or falling significantly. Toaccomplish this, the amount of aggregatedemand in the economy must be near the poten-tial aggregate supply level of output. If aggregatedemand is too low, there will be unnecessaryunemployment. If aggregate demand is too high,there will be inflationary consequences.
If aggregate demand is too low, governmentmay be able to stimulate spending in the econo-my by increasing its spending or by cuttingtaxes to encourage households and businessesto spend more. These policies are examples ofexpansionary fiscal policy. If government wants toslow down aggregate demand, it would pursue acontractionary fiscal policy. To do this, it could
cut government spending or raise taxes. Fiscalpolicies can be discretionary or automatic.
If government has to pass a law or takesome other specific action to change its taxand/or spending policies, then government isstabilizing the economy through discretionarystabilizers. If the policy change happens byitself as the economic situation changes, then itis known as an automatic stabilizer. An exampleof an automatic stabilizer would be unemploy-ment compensation. If the economy goes intoa recession and people are laid off, they may beeligible to receive unemployment compensa-tion. This payment helps them buy necessitiesfor the family and helps keep aggregatedemand from falling as much as it might other-wise. Thus, the payments help stabilize theeconomy.
Listed below are several fiscal policy actions. For each action listed, indicate whether it is anexample of expansionary (E) or contractionary (C) fiscal policy and whether it represents an automatic (A) or discretionary (D) stabilizer.
Expansionary (E) Automatic (A)Government Action or Contractionary (C) or Discretionary (D)
Sample: Recession raises amount of unemployment compensation. ____E___ ____A___
1. Cuts personal income tax rates. ________ ________
2. Eliminates favorable tax treatment on long-term capital gains. ________ ________
3. Incomes rise; as a result, people pay a higher fraction of their income in taxes. ________ ________
4. As a result of a recession, more families qualify for food stamps and welfare benefits. ________ ________
5. Eliminates the deductibility of interest expense for tax purposes. ________ ________
6. Launches a major new space program to explore Mars. ________ ________
7. Raises Social Security taxes. ________ ________
8. Corporate profits increase; as a result, government collects more corporate income taxes. ________ ________
9. Raises corporate income tax rates. ________ ________
10. Gives all its employees a large pay raise. ________ ________

118
Unit 3
ACTIVITY 31The Tools of Fiscal Policy
119
Unit 3
From Master Curriculum Guide in Economics: Teaching Strategies for High School Economics Courses (New York: National Councilon Economic Education, 1985), pp. 151-152.
Changes in federal taxes and federal govern-ment spending designed to affect the level ofaggregate demand (and in some cases aggregatesupply) in the economy are called fiscal policy.
Aggregate demand is the total amount ofspending on goods and services in the econo-my during a stated period of time. Aggregatedemand consists of consumer spending, gov-ernment spending, and investment spending.
Aggregate supply consists of the total amountof goods and services available in the economyduring a stated period of time.
During a recession, aggregate demand is usu-ally too low to bring about full employment ofresources. Government can increase aggregatedemand by spending more, cutting taxes, or
doing both. These actions often result in budgetdeficits because the government spends morethan it collects in taxes. Increasing governmentspending without increasing taxes or decreasingtaxes without decreasing government expendi-tures should increase aggregate demand. Suchan expansionary fiscal policy should increaseemployment, inflation, or both.
If the level of aggregate demand is too high,government can reduce its spending, increasetaxes, or do both. These actions should resultin a larger budget surplus or a smaller budgetdeficit than existed before. Such a contrac-tionary fiscal policy should lower the level ofaggregate demand, and the economy will expe-rience less employment of its resources, lessinflation, or both.
Part A.Decide whether each of the following fiscal policies of the federal government is expansionary orcontractionary. Write expansionary or contractionary and explain the reasons for your choice.
1. The government cuts business and personal income taxes and increases its ownspending.
2. The government increases the personal income tax, Social Security tax, and corporate income tax. Government spending stays the same.
3. Government spending goes up while taxes remain the same.
4. The government reduces the wages of its employees while raising taxes on consumers and business. Other government spending remains the same.
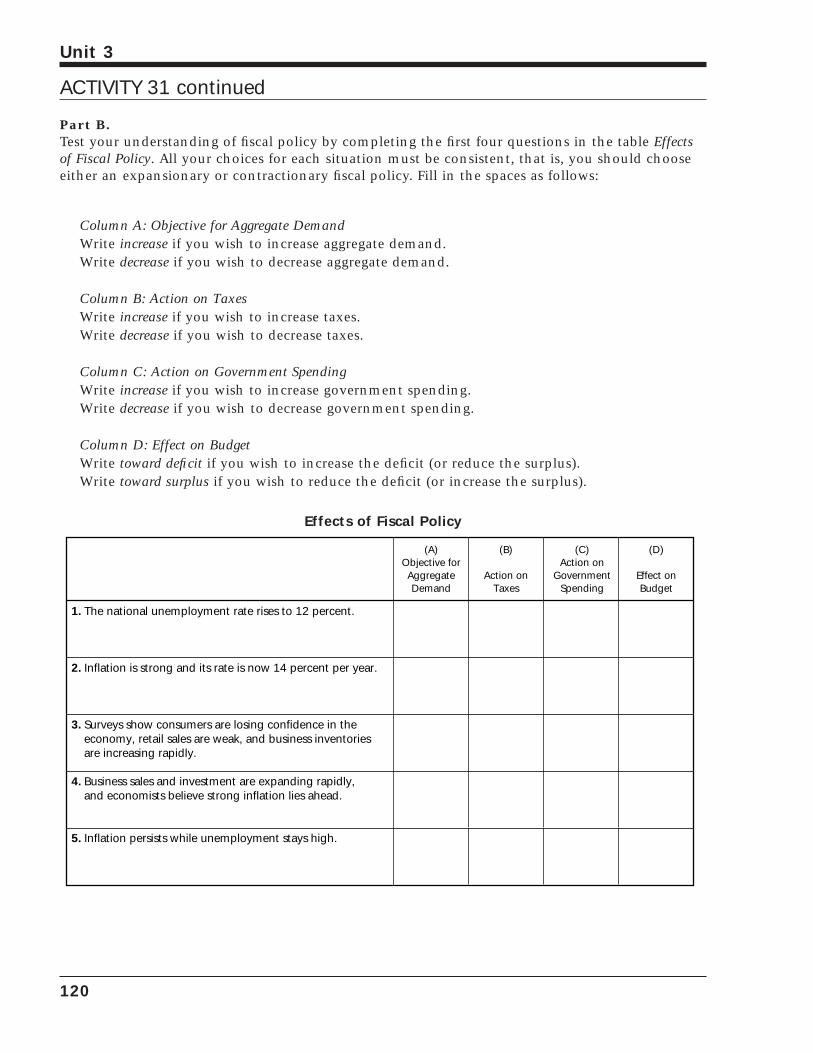
Part B.Test your understanding of fiscal policy by completing the first four questions in the table Effectsof Fiscal Policy. All your choices for each situation must be consistent, that is, you should chooseeither an expansionary or contractionary fiscal policy. Fill in the spaces as follows:
Column A: Objective for Aggregate Demand Write increase if you wish to increase aggregate demand. Write decrease if you wish to decrease aggregate demand.
Column B: Action on Taxes Write increase if you wish to increase taxes. Write decrease if you wish to decrease taxes.
Column C: Action on Government Spending Write increase if you wish to increase government spending. Write decrease if you wish to decrease government spending.
Column D: Effect on Budget Write toward deficit if you wish to increase the deficit (or reduce the surplus). Write toward surplus if you wish to reduce the deficit (or increase the surplus).
Effects of Fiscal Policy
(A)Objective forAggregateDemand
(B)
Action onTaxes
(C)Action on
GovernmentSpending
(D)
Effect onBudget
1.
2.
3.
4.
5.
The national unemployment rate rises to 12 percent.
Inflation is strong and its rate is now 14 percent per year.
Surveys show consumers are losing confidence in the economy, retail sales are weak, and business inventories are increasing rapidly.
Business sales and investment are expanding rapidly, and economists believe strong inflation lies ahead.
Inflation persists while unemployment stays high.
120
Unit 3
ACTIVITY 31 continued
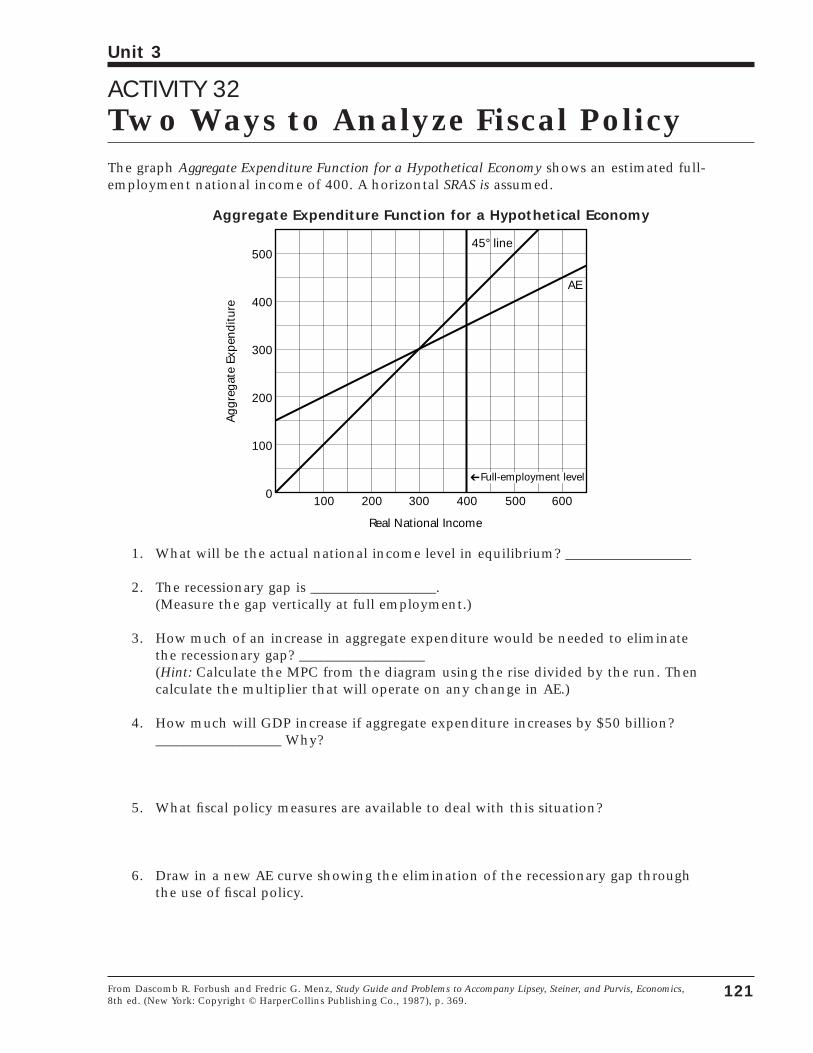
ACTIVITY 32Two Ways to Analyze Fiscal PolicyThe graph Aggregate Expenditure Function for a Hypothetical Economy shows an estimated full-employment national income of 400. A horizontal SRAS is assumed.
Aggregate Expenditure Function for a Hypothetical Economy
1. What will be the actual national income level in equilibrium? __________________
2. The recessionary gap is __________________. (Measure the gap vertically at full employment.)
3. How much of an increase in aggregate expenditure would be needed to eliminatethe recessionary gap? __________________(Hint: Calculate the MPC from the diagram using the rise divided by the run. Thencalculate the multiplier that will operate on any change in AE.)
4. How much will GDP increase if aggregate expenditure increases by $50 billion?__________________ Why?
5. What fiscal policy measures are available to deal with this situation?
6. Draw in a new AE curve showing the elimination of the recessionary gap throughthe use of fiscal policy.
500
400
300
200
100
0
Real National Income
Agg
rega
te E
xpen
ditu
re
100 200 300 400 500 600
AE
45° line
Full-employment levelÓ
121
Unit 3
From Dascomb R. Forbush and Fredric G. Menz, Study Guide and Problems to Accompany Lipsey, Steiner, and Purvis, Economics,8th ed. (New York: Copyright © HarperCollins Publishing Co., 1987), p. 369.
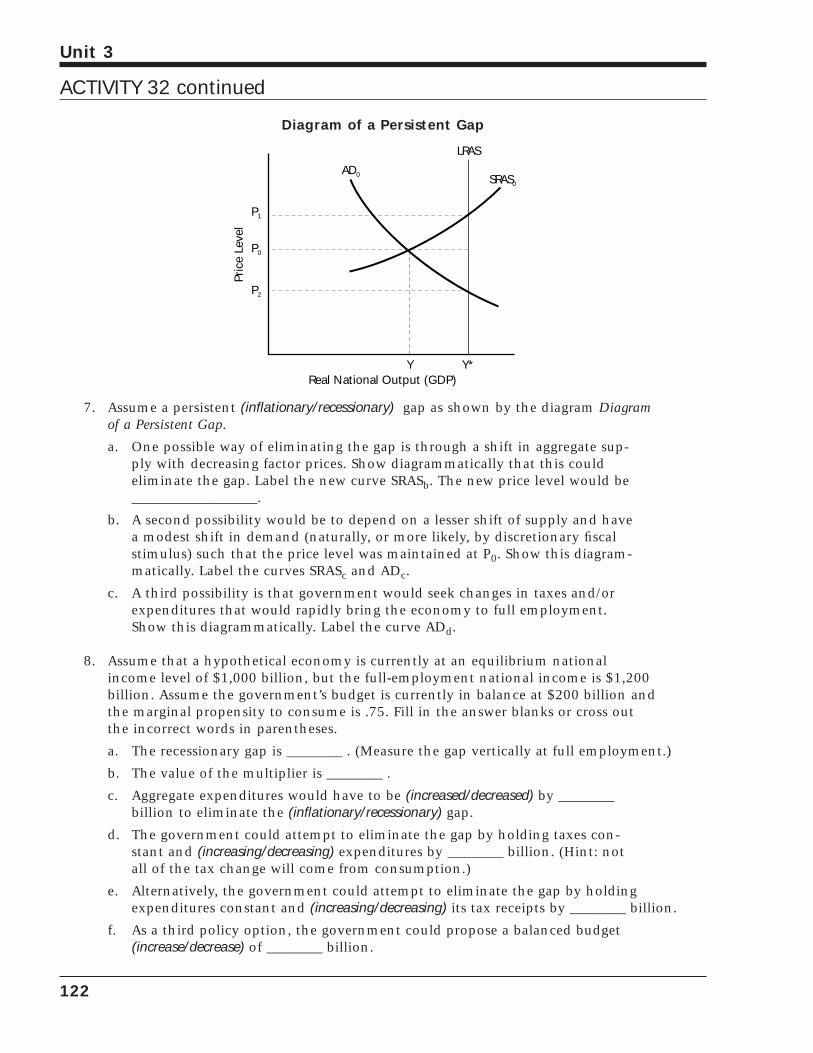
Diagram of a Persistent Gap
7. Assume a persistent (inflationary/recessionary) gap as shown by the diagram Diagramof a Persistent Gap.
a. One possible way of eliminating the gap is through a shift in aggregate sup-ply with decreasing factor prices. Show diagrammatically that this couldeliminate the gap. Label the new curve SRASb. The new price level would be__________________.
b. A second possibility would be to depend on a lesser shift of supply and havea modest shift in demand (naturally, or more likely, by discretionary fiscalstimulus) such that the price level was maintained at P0. Show this diagram-matically. Label the curves SRASc and ADc.
c. A third possibility is that government would seek changes in taxes and/orexpenditures that would rapidly bring the economy to full employment.Show this diagrammatically. Label the curve ADd.
8. Assume that a hypothetical economy is currently at an equilibrium nationalincome level of $1,000 billion, but the full-employment national income is $1,200billion. Assume the government’s budget is currently in balance at $200 billion andthe marginal propensity to consume is .75. Fill in the answer blanks or cross outthe incorrect words in parentheses.
a. The recessionary gap is ________ . (Measure the gap vertically at full employment.)
b. The value of the multiplier is ________ .
c. Aggregate expenditures would have to be (increased/decreased) by ________billion to eliminate the (inflationary/recessionary) gap.
d. The government could attempt to eliminate the gap by holding taxes con-stant and (increasing/decreasing) expenditures by ________ billion. (Hint: notall of the tax change will come from consumption.)
e. Alternatively, the government could attempt to eliminate the gap by holdingexpenditures constant and (increasing/decreasing) its tax receipts by ________ billion.
f. As a third policy option, the government could propose a balanced budget(increase/decrease) of ________ billion.
P1
LRAS
P2
Y
AD0 SRAS0
Real National Output (GDP)
P0
Y*
Pric
e Le
vel
122
Unit 3
ACTIVITY 32 continued
ACTIVITY 33Analyzing the MacroeconomyFor each of the following situations, give an answer of one or two sentences. Then support youranswer with sound economic reasoning. In some cases, you will also need to include a graph.
1. True, false, or uncertain, and why? “Regardless of our current economic situation,an increase in aggregate demand will always create new jobs.”
2. True, false, or uncertain, and why? “In the long run, when nominal wages increase,everyone has more money to spend; therefore, the economy as a whole benefits.”
3. In the 1960s, Americans became accustomed to decreasing unemployment ratescoming with rising prices, but in the 1970s the United States experienced risingunemployment and rising price levels. Some newspapers then reported that macro-economics was “bankrupt” because it could not explain this “mystery.” Use short-runAD/AS analysis to explain this mysterious change in economic conditions betweenthe 1960s and the 1970s. What events caused these conditions to change?
4. A politician was heard to say, “John Maynard Keynes’s observation that wages andprices are sticky explains why our economy is able to adjust to a long-run equilibriumafter a decrease in aggregate demand.” Evaluate the accuracy of this statement.
5. Sid Simple, a student in Econ 001, was heard to say, “If we are in a recession, aslong as we continue to increase aggregate demand, we can achieve full employmentwithout driving up the inflation rate.” Evaluate the accuracy of Sid’s statement.
123
Unit 3
James Stanley, Kingswood-Oxford School, West Hartford, CT, and John Morton contributed to this Activity.
6. Use short-run AD/AS analysis to illustrate the results of the following events. Thenexplain why these changes have taken place. Each answer should be accompaniedby a clearly labeled diagram.a. There is a 25 percent decrease in the price of crude oil.
b. Price levels in Germany, Japan, and Great Britain rise considerably, whileprice levels in the United States remain unchanged.
c. The federal government launches a major new highway construction program.
d. An insidious computer virus causes all IBM computers in the United Statesto crash.
e. The economy suffers from demand-pull inflation.
f. There is an increase in worker productivity.
7. True, false, or uncertain, and why? “When the economy experiences an increase in aggregate demand, it will discover that its production possibilities frontier hasshifted outward.”
124
Unit 3
ACTIVITY 33 continued
8. Illustrate the following changes in fiscal policy using both the AD/AS model andthe Keynesian aggregate expenditure model. In other words, draw two graphs foreach fiscal policy change and give a brief explanation of each graph. In your explanation, be sure to emphasize the line of reasoning that generated your results.It is not enough to list the results of your analysis.a. At less than full employment, the federal government decreases taxes while
holding spending constant.
b. At full employment, the government sharply increases defense spending withouteither raising taxes or reducing expenditures on other government programs.
c. At less than full employment, the government increases its expendituresand taxes by the same amount.
d. At full employment, the government passes a law providing universalhealth care with no increase in taxes.
e. At less than full employment, the government raises Social Security benefitsby ten percent.
f. At less than full employment, the government increases its spending with-out changing the tax rate.
125
Unit 3
ACTIVITY 33 continued

126
Unit 3
Sample Multiple-Choice QuestionsCircle the letter of each correct answer.
127
Unit 3
Joe Ed Dooley, South Garland High School, Garland, TX; Donna Kattner, Conroe High School, Conroe, TX; and JamesRanney, Austin E. Lathrop High School, Fairbanks, AK, contributed significantly to this test.
1. Aggregate supply is:
a. The amount buyers plan to spend onoutput.
b. Equal to the money income received bythe owners of the factors of production.
c. Always equal to aggregate demand.
d. A schedule indicating the level of realnational output that will be purchased ateach possible price level.
e. Never equal to aggregate demand.
2. There will be a shift in aggregate demandwhen:
a. The price of consumer goods changes.
b. The price of inputs changes.
c. Consumer expectations change.
d. Productivity changes.
e. Energy prices change.
3. The aggregate supply curve will shift to theright when:
a. Energy prices increase.
b. Input prices decrease.
c. Productivity levels decrease.
d. Investment spending decreases.
e. The value of the dollar decreases.
4. According to Keynesian economists, thelevels of output and employment are deter-mined by:
a. Economic stability that maintains a full-employment economy.
b. Supply creating its own demand.
c. Price-wage flexibility.
d. The level of aggregate demand (C + I + G+ Net Exports).
e. The application of Say’s Law.
5. Which of the following fiscal policy mea-sures would increase aggregate demand?
I. Decrease personal income tax
II. Increase excise taxes
III. Decrease government expenditures
a. I only
b. II only
c. III only
d. I and II only
e. I, II, and III
6. What would be the effect of a large increasein labor productivity on real GDP and theprice level?
Real GDP Price level
a. Increase Increase
b. Increase Decrease
c. Decrease Decrease
d. Decrease Increase
e. Increase No change
7. If Maria Escalera’s disposable incomeincreases from $600 to $650 and her levelof personal consumption expendituresincreases from $480 to $520, it may be con-cluded that her marginal propensity to:
a. Consume is .2.
b. Consume is .4.
c. Consume is .8.
d. Save is .25.
e. Save is .8.
8. The consumption function is best explainedby which of the following statements?I. Consumer spending is solely determined
by the current money supply.II. Consumer spending is dependent on
only current income and the MPC.III. Consumer spending is dependent on
current income, the consumer’s expecta-tions of income, personal taxes paid, andthe MPC.
a. I onlyb. II onlyc. III onlyd. I and II only
e. I and III only
9. If the MPC is .75, the multiplier will be:
a. 2. b. 3. c. 3.5. d. 4. e. 5.
10. If the MPC is .75 and government purchasesincrease by $5 billion, the aggregate expen-diture curve will:
a. Shift vertically upward by $5 billion andtotal income will increase by $6.5 billion.
b. Shift vertically upward by $5 billion andtotal income will increase by $20 billion.
c. Not shift and total income will decreaseby $5 billion.
d. Not shift and total income will increaseby $5 billion.
e. Rotate downward and total income willbe unchanged.
11. Assume the following conditions describethe current U.S. economy: there is rapidlyrising inflation (13.3 percent annual rate);the unemployment rate is stable at 3.1 per-cent; there is a high level of real GDP. Whatpart of the aggregate supply curve is mostapplicable to this economy?
a. Keynesian range.
b. Intermediate range.
c. Classical range.
d. Horizontal range.
e. Both a and d.
12. Recent studies reveal that in a closed no-government economy, households save 20percent of any increase in income. If a newtechnology causes investment to increaseby $40 billion, economists would forecast achange in GDP of:
a. $8 billion.
b. $32 billion.
c. $40 billion.
d. $160 billion.
e. $200 billion.
13. Which of the following are summed to getthe aggregate expenditure function?
I. Consumption
II. Business investment
III. Government transfer payments
IV. Net exports
V. Government purchases of goods and ser-vices
a. I, II, and III only
b. I, II, III, and IV only
c. I, II, IV, and V only
d. I, II, III, IV, and V
e. II, III, IV, and V only
14. Equilibrium in the Keynesian model is bestdescribed by which of the following state-ments?
I. Injections = Leakages
II. Aggregate spending = Value of total output
III. All resources are fully employed.
a. I only
b. II only
c. III only
d. I and II only
e. I, II, and III
128
Unit 3
SAMPLE MULTIPLE-CHOICE QUESTIONS continued
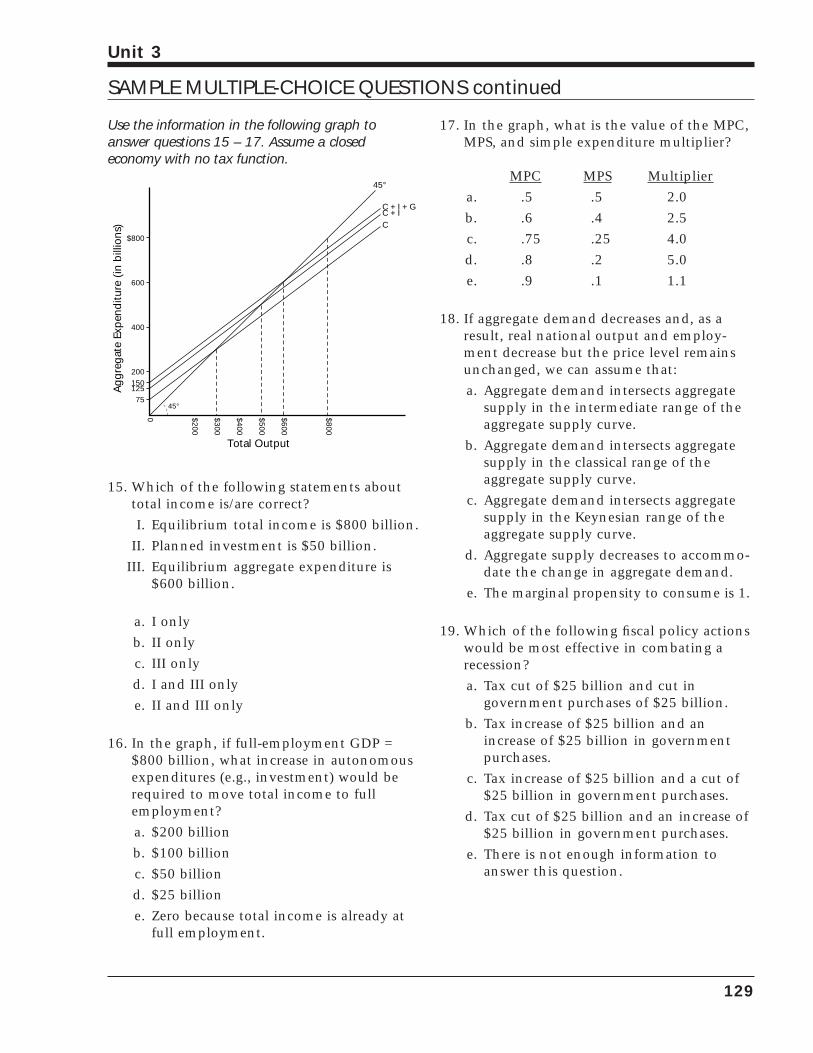
Use the information in the following graph toanswer questions 15 – 17. Assume a closed economy with no tax function.
15. Which of the following statements abouttotal income is/are correct?
I. Equilibrium total income is $800 billion.
II. Planned investment is $50 billion.
III. Equilibrium aggregate expenditure is$600 billion.
a. I only
b. II only
c. III only
d. I and III only
e. II and III only
16. In the graph, if full-employment GDP =$800 billion, what increase in autonomousexpenditures (e.g., investment) would berequired to move total income to fullemployment?
a. $200 billion
b. $100 billion
c. $50 billion
d. $25 billion
e. Zero because total income is already atfull employment.
17. In the graph, what is the value of the MPC,MPS, and simple expenditure multiplier?
MPC MPS Multiplier
a. .5 .5 2.0
b. .6 .4 2.5
c. .75 .25 4.0
d. .8 .2 5.0
e. .9 .1 1.1
18. If aggregate demand decreases and, as aresult, real national output and employ-ment decrease but the price level remainsunchanged, we can assume that:
a. Aggregate demand intersects aggregatesupply in the intermediate range of theaggregate supply curve.
b. Aggregate demand intersects aggregatesupply in the classical range of theaggregate supply curve.
c. Aggregate demand intersects aggregatesupply in the Keynesian range of theaggregate supply curve.
d. Aggregate supply decreases to accommo-date the change in aggregate demand.
e. The marginal propensity to consume is 1.
19. Which of the following fiscal policy actionswould be most effective in combating arecession?
a. Tax cut of $25 billion and cut in government purchases of $25 billion.
b. Tax increase of $25 billion and anincrease of $25 billion in governmentpurchases.
c. Tax increase of $25 billion and a cut of$25 billion in government purchases.
d. Tax cut of $25 billion and an increase of$25 billion in government purchases.
e. There is not enough information toanswer this question.
$800
$600
$500
$400
$300
$200
0
Total Output
Agg
rega
te E
xpen
ditu
re (
in b
illio
ns)
$8007757507257006756506256005755505255004754504254003753503253002752502252001751501251007550250
45°
45°
C + I + GC + IC
129
Unit 3
SAMPLE MULTIPLE-CHOICE QUESTIONS continued
20. Assume the economy is described as follows:the federal budget is balanced; there isannual inflation of less than one percent;real GDP has fallen for the last three con-secutive quarters; and business investmentis declining. Which of the following fiscalactions would be most appropriate?
a. Increase taxes on all levels of income.
b. Increase government expenditures andtransfer payments.
c. Decrease federal spending on highwayconstruction.
d. Continue to balance the federal budget.
e. Urge citizens to save more and spend less.
21. Which of the following represent(s) prob-lems with discretionary fiscal policy in theUnited States?
I. Special interests in Congress
II. Time lags in recognition, decision, andimplementation of solutions to fiscalproblems
III. Imprecise knowledge of current economicconditions
a. I only
b. II only
c. III only
d. I and II only
e. I, II, and III
22. Which of the following represent(s) auto-matic stabilizers in the economy?
I. Graduated (progressive) income tax
II. Unemployment insurance compensationpayments
III. A law passed by Congress increasing taxrates
a. I only
b. II only
c. III only
d. I and II only
e. I and III only
23. Assume the economy is in a severe recession. Which set of fiscal policies wouldbe consistent and designed to cure therecession?
Taxes Government spending
a. Lower Lower
b. Lower Raise
c. Raise Raise
d. Raise Lower
e. Lower Lower
24. In order to be called a “built-in stabilizer,”taxes must automatically do which one ofthe following?
Recession Inflationary period
a. Increase Increase
b. Decrease Increase
c. Increase Decrease
d. Decrease Decrease
e. No change No change
25. If unplanned investment in inventory isoccurring, the Keynesian model forecasts:
a. An increase in national output andincome.
b. A decrease in national output andincome.
c. An increase in the price index.
d. A decline in the unemployment rate.
e. An increase in planned spending.
130
Unit 3
SAMPLE MULTIPLE-CHOICE QUESTIONS continued
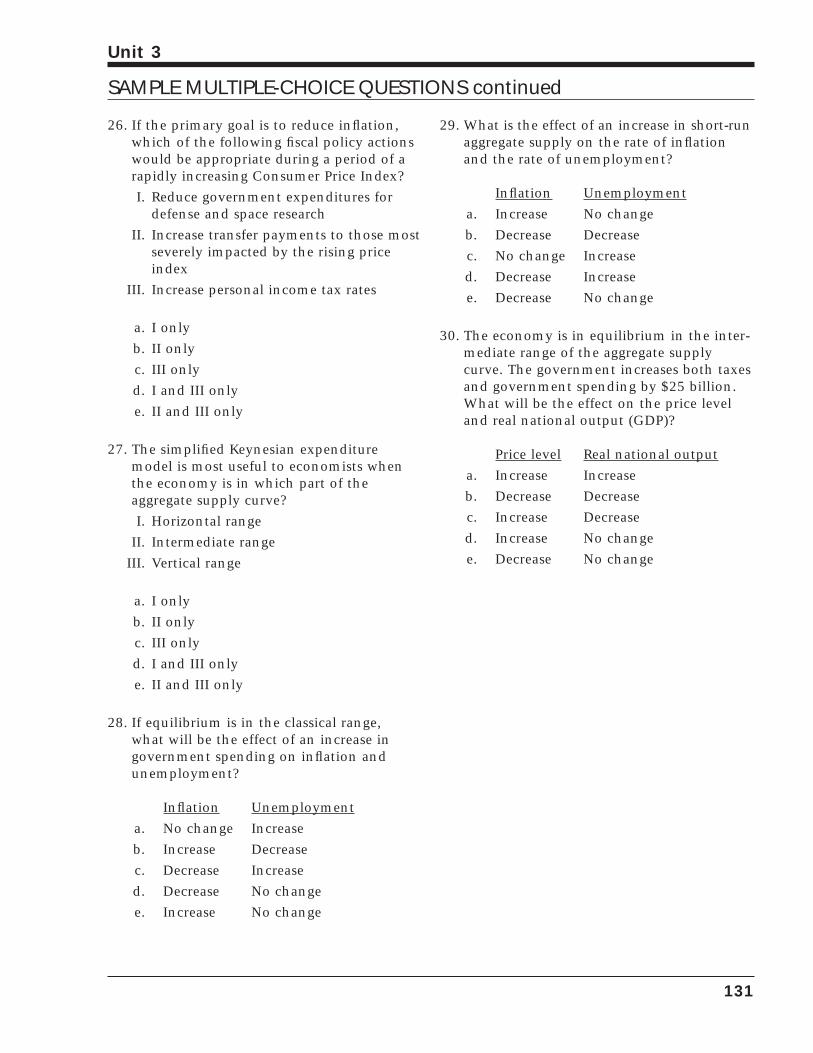
26. If the primary goal is to reduce inflation,which of the following fiscal policy actionswould be appropriate during a period of arapidly increasing Consumer Price Index?
I. Reduce government expenditures fordefense and space research
II. Increase transfer payments to those mostseverely impacted by the rising priceindex
III. Increase personal income tax rates
a. I only
b. II only
c. III only
d. I and III only
e. II and III only
27. The simplified Keynesian expendituremodel is most useful to economists whenthe economy is in which part of the aggregate supply curve?
I. Horizontal range
II. Intermediate range
III. Vertical range
a. I only
b. II only
c. III only
d. I and III only
e. II and III only
28. If equilibrium is in the classical range, what will be the effect of an increase ingovernment spending on inflation andunemployment?
Inflation Unemployment
a. No change Increase
b. Increase Decrease
c. Decrease Increase
d. Decrease No change
e. Increase No change
29. What is the effect of an increase in short-runaggregate supply on the rate of inflationand the rate of unemployment?
Inflation Unemployment
a. Increase No change
b. Decrease Decrease
c. No change Increase
d. Decrease Increase
e. Decrease No change
30. The economy is in equilibrium in the inter-mediate range of the aggregate supplycurve. The government increases both taxesand government spending by $25 billion.What will be the effect on the price leveland real national output (GDP)?
Price level Real national output
a. Increase Increase
b. Decrease Decrease
c. Increase Decrease
d. Increase No change
e. Decrease No change
131
Unit 3
SAMPLE MULTIPLE-CHOICE QUESTIONS continued

132
Unit 3
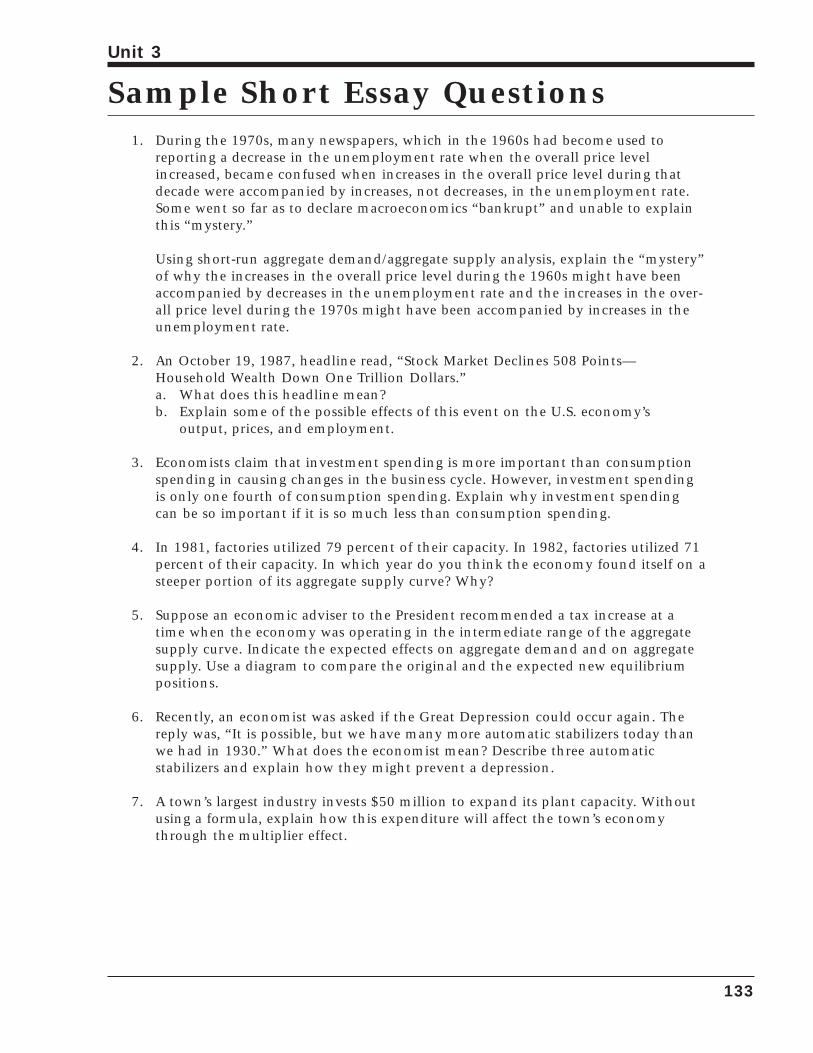
Sample Short Essay Questions1. During the 1970s, many newspapers, which in the 1960s had become used to
reporting a decrease in the unemployment rate when the overall price levelincreased, became confused when increases in the overall price level during thatdecade were accompanied by increases, not decreases, in the unemployment rate.Some went so far as to declare macroeconomics “bankrupt” and unable to explainthis “mystery.”
Using short-run aggregate demand/aggregate supply analysis, explain the “mystery”of why the increases in the overall price level during the 1960s might have beenaccompanied by decreases in the unemployment rate and the increases in the over-all price level during the 1970s might have been accompanied by increases in theunemployment rate.
2. An October 19, 1987, headline read, “Stock Market Declines 508 Points—Household Wealth Down One Trillion Dollars.”a. What does this headline mean?b. Explain some of the possible effects of this event on the U.S. economy’s
output, prices, and employment.
3. Economists claim that investment spending is more important than consumptionspending in causing changes in the business cycle. However, investment spendingis only one fourth of consumption spending. Explain why investment spendingcan be so important if it is so much less than consumption spending.
4. In 1981, factories utilized 79 percent of their capacity. In 1982, factories utilized 71percent of their capacity. In which year do you think the economy found itself on asteeper portion of its aggregate supply curve? Why?
5. Suppose an economic adviser to the President recommended a tax increase at atime when the economy was operating in the intermediate range of the aggregatesupply curve. Indicate the expected effects on aggregate demand and on aggregatesupply. Use a diagram to compare the original and the expected new equilibriumpositions.
6. Recently, an economist was asked if the Great Depression could occur again. Thereply was, “It is possible, but we have many more automatic stabilizers today thanwe had in 1930.” What does the economist mean? Describe three automatic stabilizers and explain how they might prevent a depression.
7. A town’s largest industry invests $50 million to expand its plant capacity. Withoutusing a formula, explain how this expenditure will affect the town’s economythrough the multiplier effect.
133
Unit 3

134
Unit 3
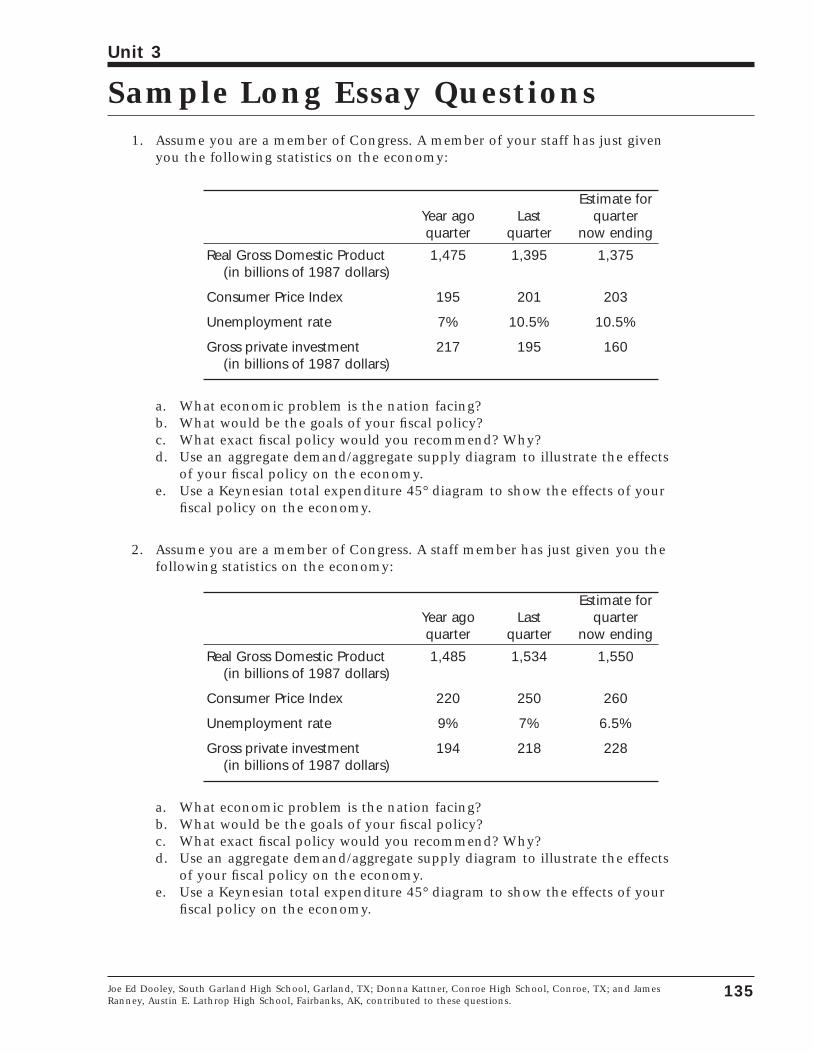
Sample Long Essay Questions1. Assume you are a member of Congress. A member of your staff has just given
you the following statistics on the economy:
Estimate forYear ago Last quarterquarter quarter now ending
Real Gross Domestic Product 1,475 1,395 1,375(in billions of 1987 dollars)
Consumer Price Index 195 201 203
Unemployment rate 7% 10.5% 10.5%
Gross private investment 217 195 160(in billions of 1987 dollars)
a. What economic problem is the nation facing?b. What would be the goals of your fiscal policy?c. What exact fiscal policy would you recommend? Why?d. Use an aggregate demand/aggregate supply diagram to illustrate the effects
of your fiscal policy on the economy.e. Use a Keynesian total expenditure 45° diagram to show the effects of your
fiscal policy on the economy.
2. Assume you are a member of Congress. A staff member has just given you the following statistics on the economy:
Estimate forYear ago Last quarterquarter quarter now ending
Real Gross Domestic Product 1,485 1,534 1,550(in billions of 1987 dollars)
Consumer Price Index 220 250 260
Unemployment rate 9% 7% 6.5%
Gross private investment 194 218 228(in billions of 1987 dollars)
a. What economic problem is the nation facing?b. What would be the goals of your fiscal policy?c. What exact fiscal policy would you recommend? Why?d. Use an aggregate demand/aggregate supply diagram to illustrate the effects
of your fiscal policy on the economy.e. Use a Keynesian total expenditure 45° diagram to show the effects of your
fiscal policy on the economy.
135
Unit 3
Joe Ed Dooley, South Garland High School, Garland, TX; Donna Kattner, Conroe High School, Conroe, TX; and JamesRanney, Austin E. Lathrop High School, Fairbanks, AK, contributed to these questions.
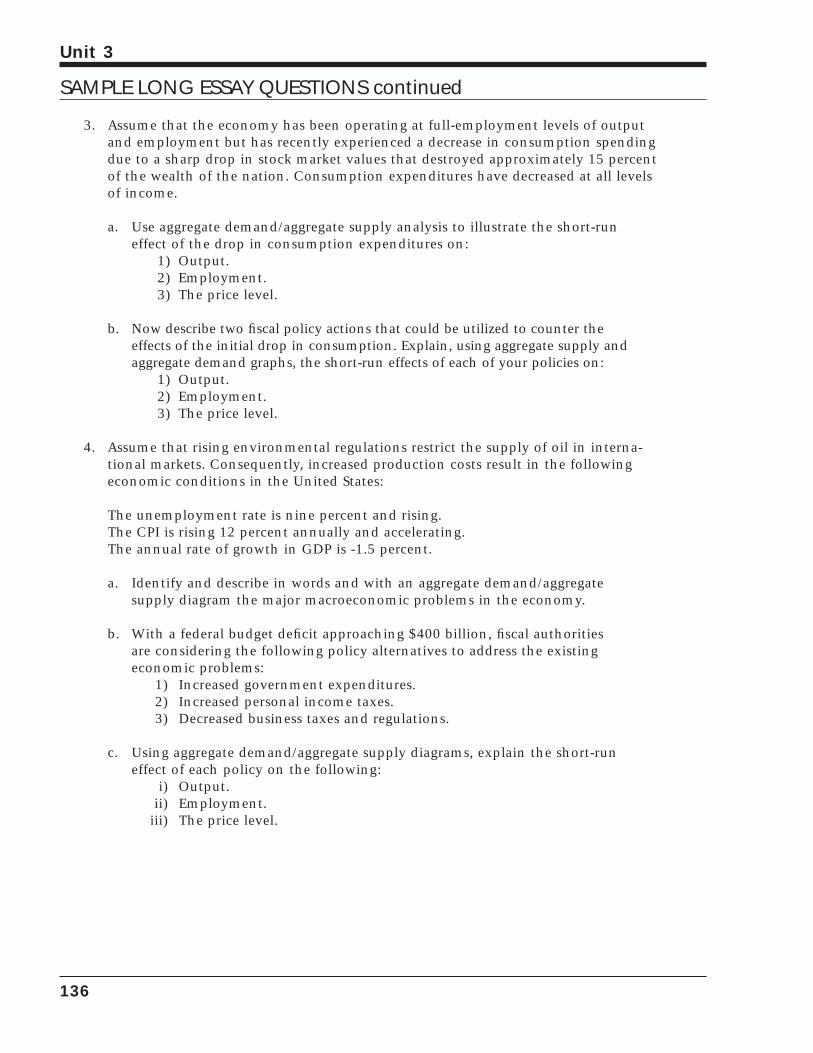
3. Assume that the economy has been operating at full-employment levels of outputand employment but has recently experienced a decrease in consumption spendingdue to a sharp drop in stock market values that destroyed approximately 15 percentof the wealth of the nation. Consumption expenditures have decreased at all levelsof income.
a. Use aggregate demand/aggregate supply analysis to illustrate the short-runeffect of the drop in consumption expenditures on:
1) Output.2) Employment.3) The price level.
b. Now describe two fiscal policy actions that could be utilized to counter theeffects of the initial drop in consumption. Explain, using aggregate supply andaggregate demand graphs, the short-run effects of each of your policies on:
1) Output.2) Employment.3) The price level.
4. Assume that rising environmental regulations restrict the supply of oil in interna-tional markets. Consequently, increased production costs result in the followingeconomic conditions in the United States:
The unemployment rate is nine percent and rising.The CPI is rising 12 percent annually and accelerating.The annual rate of growth in GDP is -1.5 percent.
a. Identify and describe in words and with an aggregate demand/aggregatesupply diagram the major macroeconomic problems in the economy.
b. With a federal budget deficit approaching $400 billion, fiscal authorities are considering the following policy alternatives to address the existing economic problems:
1) Increased government expenditures.2) Increased personal income taxes.3) Decreased business taxes and regulations.
c. Using aggregate demand/aggregate supply diagrams, explain the short-runeffect of each policy on the following:
i) Output.ii) Employment.
iii) The price level.
136
Unit 3
SAMPLE LONG ESSAY QUESTIONS continued
Macroeconomics
Unit 4Money, MonetaryPolicy, andEconomic Stability
137

138
Unit 4
Key Ideas
139
Unit 4
• To accomplish its functions, money should havecertain characteristics which include portability,uniformity, acceptability, durability, divisibility,and stability in value.
• Throughout history, there have been four basictypes of money: commodity money, representa-tive money, fiat money, and checkbook money.
• Money has three main functions—as a mediumof exchange, a standard of value, and a store ofvalue.
• Economists often disagree about what money is. M1 is the narrowest definition and consistsof checkable deposits, traveler’s checks, and currency. Checkable deposits are called demand deposits and account for about 75 percent of M1.
• M2 and M3 are broader definitions of moneyand include savings accounts and other timedeposits.
• MV = PQ is the equation of exchange; moneytimes velocity equals price times quantity ofgoods. PQ is the nominal GDP.
• Velocity is the number of times per year themoney supply is used to make payments forfinal goods and services:
V = GDPM
• Money is created when banks make loans. Onebank’s loan becomes another bank’s demanddeposit. Demand deposits are money. When aloan is repaid, money is destroyed.
• Banks are required to keep a percentage of theirdeposits as reserves. Reserves can be currency inthe bank vault or deposits at the Federal ReserveBanks. This reserve requirement limits theamount of money banks can create.
• The money multiplier is equal to one divided by the reserve requirement.
Money multiplier = 1rr
The higher the reserve requirement, the lessmoney can be created; the lower the reserverequirement, the more money can be created.
• The Federal Reserve, or “Fed,” regulates financialinstitutions and controls the nation’s moneysupply. The three main tools that it uses to controlthe money supply are: changing the discountrate, changing the reserve requirement, andbuying and selling government bonds on theopen market (open market operations).
• If the Fed wants to encourage bank lending andincrease the money supply, it will decrease thediscount rate, decrease the reserve requirement,and buy bonds on the open market. The Fedexpands the money supply to fight unemploy-ment. This is called an expansionary monetarypolicy or an “easy money” policy.
• If the Fed wants to hold down or decrease themoney supply, it will discourage bank lendingby increasing the discount rate, increasing thereserve requirement, and selling bonds on theopen market. The Fed discourages bank lendingduring inflation. This is called a contractionarymonetary policy or a “tight money” policy.
• The reserve requirement is the most powerfultool of monetary policy; it is rarely used becauseof its power. Open market operations are themost frequently used tool because they permitthe Fed to make small changes in the moneysupply.
• Monetarists believe that money directly affectsthe economy through the equation ofexchange. Monetarists believe the money sup-ply should be increased at the rate of three tofive percent a year, exactly the same amount asthe increase in real GDP.
• Keynesians believe that money affects interestrates and that interest rates, in turn, affectinvestment and GDP. Tight money increasesinterest rates, which decreases aggregatedemand, which helps fight inflation. Easymoney decreases interest rates and increasesGDP during recessions.
• The Fed cannot target both the money supplyand interest rates simultaneously so it mustchoose which goal to attempt to achieve.

140
Unit 4
ACTIVITY 34Money Is What Money DoesThroughout history, a wide variety of items have served as money. These include gold, silver, largestone wheels, tobacco, beer, dog teeth, porpoise teeth, cattle, metal coins, paper bills, and checks.All of these types of money should be judged on how well they accomplish the functions ofmoney. Money is what money does.
To be a good medium of exchange, money must be accepted by people when buying and selling their productive resources and when buying and selling goods and services. It should beportable or easily carried from place to place. It also must be divisible so that large and small transactions can be made.
To be a good store of value, money must be durable so it can be kept for future use. It alsoshould have a stable value so people do not lose purchasing power if they use the money at a later time.
To be a good standard of value or unit of account, money must be useful for quoting prices. To accomplish this, money must be familiar, divisible, and acceptable.
Evaluate each item below as to how well it would perform the functions of money. In your evaluation, discuss how well the item would serve as a medium of exchange, a store of value, and a standard of value. As you make your evaluations, be sure to consider portability, uniformity,acceptability, durability, and stability in value.
1. Salt
2. Large stone wheels
3. Cattle
4. Gold
5. Copper coins
6. Pieces of paper printed by a government
7. A personal check
141
Unit 4
Activity developed by John Morton.

142
Unit 4
ACTIVITY 35What’s All This About the M’s?
143
Unit 4
From Econ Ed, The Federal Reserve Bank of New York, September 1987.
The Federal Reserve and its monetary policieshave been in the news to an unprecedenteddegree. A great deal of attention has focused onthe rate at which the money supply growsbecause of the increased awareness that moneygrowth influences inflation, unemployment,and output. By law the Fed is charged with targeting rates of money growth that promoteprice stability, full employment, and economicgrowth. The Fed’s choice of target rates ofgrowth for the money supply and its ability toachieve them are constantly analyzed and commented on by economists, elected officials,and the media, among others.
The Fed reports to Congress twice a year onits target rates for growth of money. In addi-tion, representatives of the Federal ReserveSystem often testify before congressional com-mittees on the difficulty of achieving monetarytargets when the financial system is rapidlychanging and on the ongoing problem ofsimultaneously reaching full employment andprice stability. These occasions provide a regu-lar public forum in which members of Congressexamine policies pursued by the Fed.
While monetary policy is the subject ofdebates that occur in the limelight, the firststeps in the formulation of policy may appearrelatively mundane: the money supply must bedefined and measured. Defining and measuringmoney is difficult because people hold moneyin a variety of forms.
A Perennial Political ProblemThroughout our history the public has
linked the money supply to the economic well-being of our country. Questions concerning themoney supply and the proper role of govern-ment in the financial system have from time totime dominated the political scene.
Before the Revolutionary War, many of the13 colonies issued their own paper moneydespite intense political opposition both fromdomestic adversaries and the king of England.After the adoption of the Constitution, one ofthe first major political controversies faced by
Congress concerned the proper role of the federal government in the banking system. Thedebate focused on chartering the First Bank ofthe United States and its successor, the SecondBank of the United States, both of which exer-cised some of the functions of a central bank.The debate continued until the charter of theSecond Bank expired in 1836.
In the 1870s the principal plank of theGreenback party platform called for an expan-sion of the money supply through an increasein the outstanding level of “greenbacks,” thatis, paper money. In the 1890s the money sup-ply was again at the center of the politicalstage. The Populist party called for increasingthe money supply through the “free andunlimited coinage of silver.” The passage of theFederal Reserve Act in 1913, which created thisnation’s central bank, was preceded by a six-yeardebate. The controversy focused on preventingthe kinds of financial “panics” that had severe-ly tested the stability of banks and the mone-tary system from the Civil War through thepanic of 1907.
Money Defined…There is widespread agreement on a simple
conceptual definition of money. However, thecomplexity of the real world prevents agree-ment on a single measure of money, and thatcauses some confusion. Conceptually, money isany item that is (1) widely accepted as a meansof payment (a medium of exchange), and (2)used to transfer purchasing power from oneperiod of time to the next (a store of value).Money performs other functions, but these arenot crucial to the working definition of theM’s. Problems arise in defining the measures ofmoney because a variety of financial assets,from currency (and coin) to large certificates ofdeposit of $100,000 or more, serve as both amedium of exchange and a store of value.
The Fed sets targets for the monetary aggre-gates, or M’s, by grouping assets that the publicuses in roughly similar ways. In defining thesemeasures of money, the Fed draws somewhatarbitrary lines between groups of assets that
can perform both the medium of exchange andstore of value functions of money.
…And MeasuredM1 is the narrowest definition and measure
of the money supply. It contains only thoseassets that are used primarily for transactions,that is, as a medium of exchange—currency inthe hands of the public and deposits in check-ing accounts. The payment of interest on somechecking accounts is a fairly recent phenome-non and has changed the reasons people useand hold these accounts. With the payment ofinterest on some checking accounts, peoplehave increased their use as a store of value.There are other assets that serve primarily asstores of value, but that can be converted into amedium of exchange with a minimum ofinconvenience. These assets are included inbroader measures of money.
M2 is one of the broader measures. In addi-tion to the items in M1, M2 includes theamount in savings and small time deposits,including money market deposit accounts(MMDA’s), noninstitutional money marketmutual funds shares (MMMF’s), and certainother short-term money market assets.
M3 is an even broader definition of themoney supply. It includes all the componentsof M2 plus a number of financial assets andinstruments generally employed by large busi-nesses and financial institutions.
The Fed considers a number of factors whenit defines the monetary aggregates, but ulti-mately what matters is how the public uses thedifferent forms of money available to it. Forexample, depositors can write checks on theirMMDA’s or their MMMF’s. The public, howev-er, uses them primarily for savings and onlysecondarily for transactions. Consequently, theFed places MMDA’s and MMMF’s in M2 withsavings accounts and time deposits, which arealso primarily held as stores of value. On theother hand, deposits in NOW (negotiable orderof withdrawal) accounts and ATS (automatictransfer service) accounts are included in M1because they are mainly used for transactionseven though they pay interest and depositors
use them for savings.
The M’s will continue to be examined andrevised as necessary by the central bank when-ever financial innovations lead people to alterthe forms in which they hold money. Theseinnovations have also caused changes in therelationship between money and economicactivity.
Our Current M’sThe technical definitions of the M’s can be
found in the Federal Reserve Bulletin:
M1:
1. Currency (including coin) in the hands ofthe public
2. Traveler’s checks3. Balances in demand deposit accounts4. Balances in NOW accounts5. Balances in ATS accounts6. Balances in credit union share draft accounts
M2: M1 plus
1. Savings and small time deposits (less than$100,000) at depository institutions (includ-ing MMDA’s)
2. Overnight repurchase agreements (RP’s) atcommercial banks
3. Overnight Eurodollar deposits4. Shares in MMMF’s held primarily by house-
holds and small businesses
M3: M2 plus
1. Large time deposits ($100,000 or more) atdepository institutions
2. Repurchase agreements with maturitieslonger than one day at commercial banksand savings and loan associations
3. Eurodollars with maturities longer than one day
4. Shares in MMMF’s that are used by largefinancial institutions and corporations
144
Unit 4
ACTIVITY 35 continued
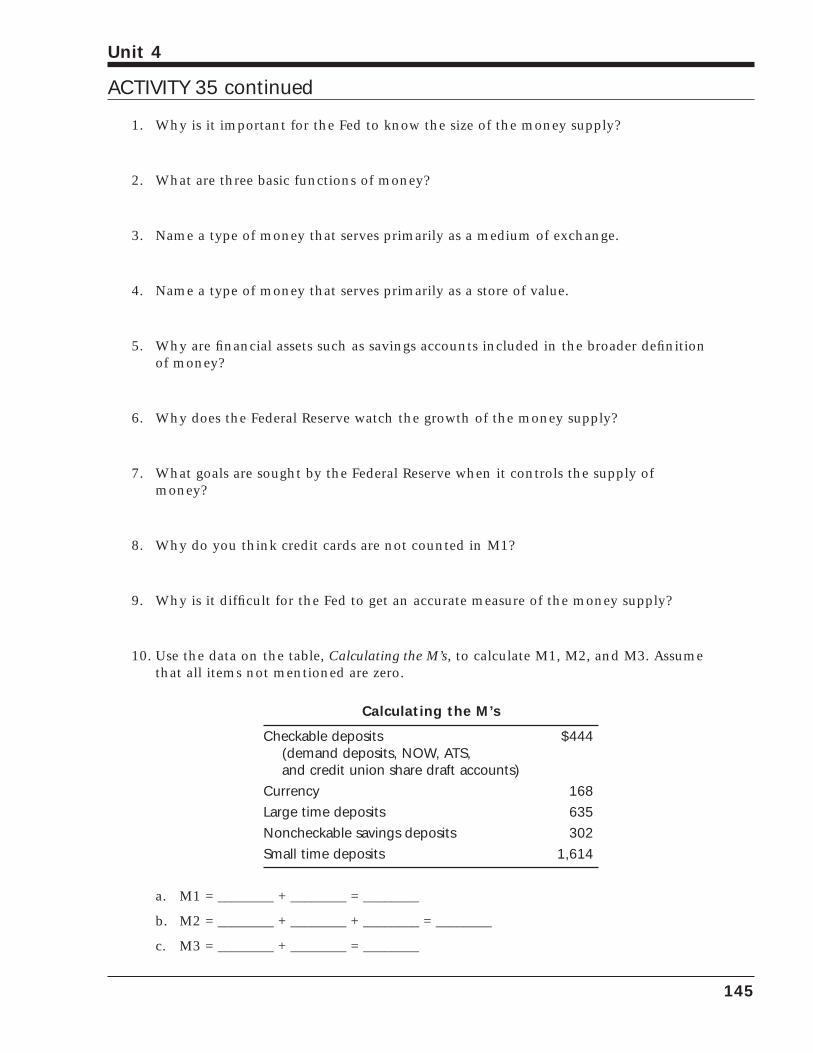
1. Why is it important for the Fed to know the size of the money supply?
2. What are three basic functions of money?
3. Name a type of money that serves primarily as a medium of exchange.
4. Name a type of money that serves primarily as a store of value.
5. Why are financial assets such as savings accounts included in the broader definitionof money?
6. Why does the Federal Reserve watch the growth of the money supply?
7. What goals are sought by the Federal Reserve when it controls the supply ofmoney?
8. Why do you think credit cards are not counted in M1?
9. Why is it difficult for the Fed to get an accurate measure of the money supply?
10. Use the data on the table, Calculating the M’s, to calculate M1, M2, and M3. Assumethat all items not mentioned are zero.
Calculating the M’s
Checkable deposits $444(demand deposits, NOW, ATS,and credit union share draft accounts)
Currency 168
Large time deposits 635
Noncheckable savings deposits 302
Small time deposits 1,614
a. M1 = ________ + ________ = ________
b. M2 = ________ + ________ + ________ = ________
c. M3 = ________ + ________ = ________
145
Unit 4
ACTIVITY 35 continued

146
Unit 4
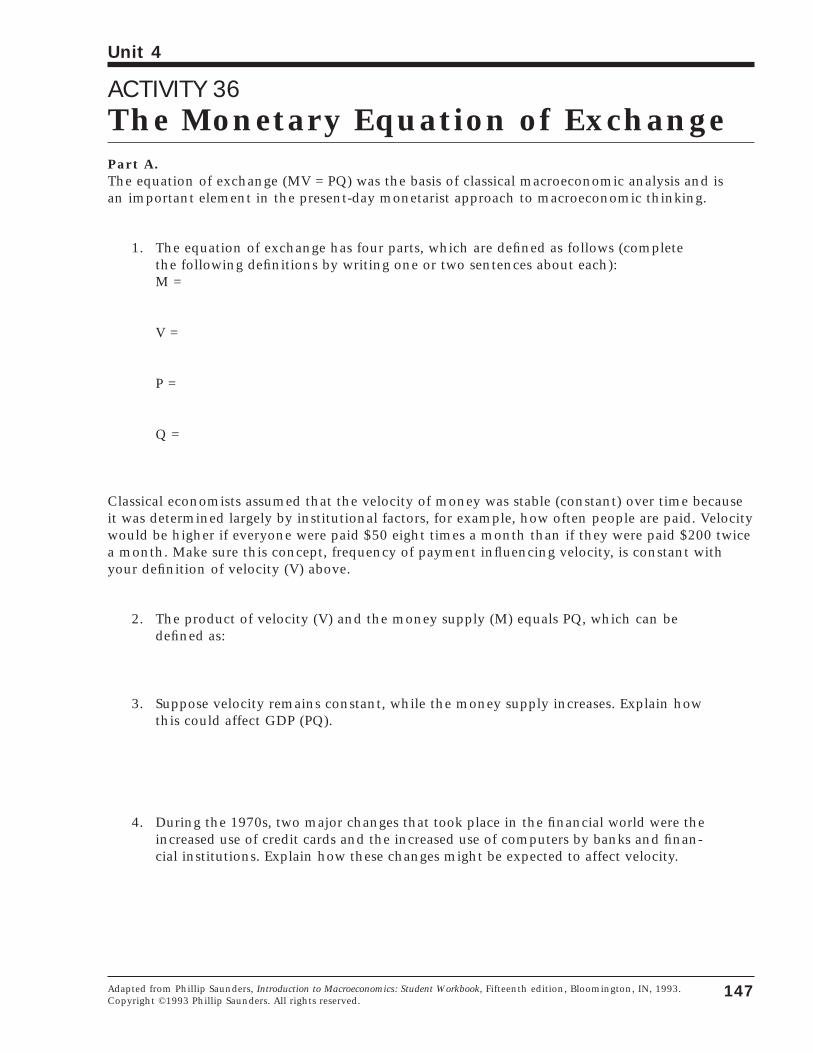
ACTIVITY 36The Monetary Equation of ExchangePart A.The equation of exchange (MV = PQ) was the basis of classical macroeconomic analysis and is an important element in the present-day monetarist approach to macroeconomic thinking.
1. The equation of exchange has four parts, which are defined as follows (completethe following definitions by writing one or two sentences about each):M =
V =
P =
Q =
Classical economists assumed that the velocity of money was stable (constant) over time becauseit was determined largely by institutional factors, for example, how often people are paid. Velocitywould be higher if everyone were paid $50 eight times a month than if they were paid $200 twicea month. Make sure this concept, frequency of payment influencing velocity, is constant withyour definition of velocity (V) above.
2. The product of velocity (V) and the money supply (M) equals PQ, which can bedefined as:
3. Suppose velocity remains constant, while the money supply increases. Explain howthis could affect GDP (PQ).
4. During the 1970s, two major changes that took place in the financial world were theincreased use of credit cards and the increased use of computers by banks and finan-cial institutions. Explain how these changes might be expected to affect velocity.
147
Unit 4
Adapted from Phillip Saunders, Introduction to Macroeconomics: Student Workbook, Fifteenth edition, Bloomington, IN, 1993.Copyright ©1993 Phillip Saunders. All rights reserved.
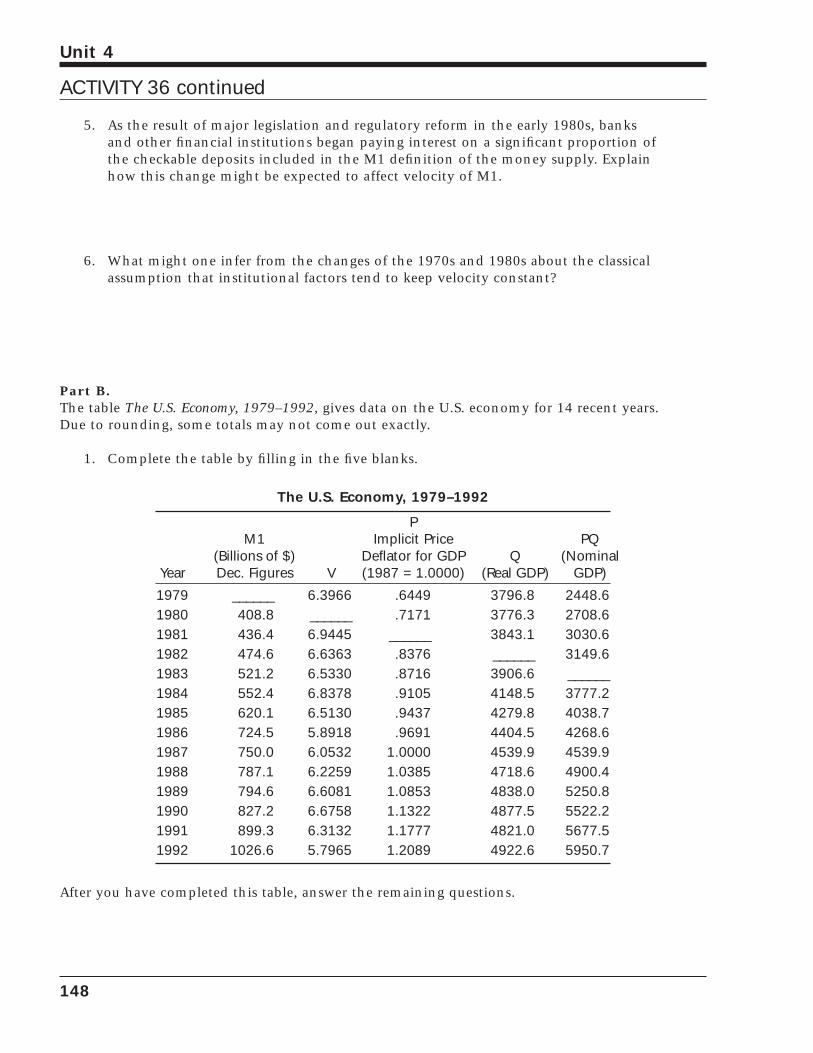
5. As the result of major legislation and regulatory reform in the early 1980s, banksand other financial institutions began paying interest on a significant proportion ofthe checkable deposits included in the M1 definition of the money supply. Explainhow this change might be expected to affect velocity of M1.
6. What might one infer from the changes of the 1970s and 1980s about the classicalassumption that institutional factors tend to keep velocity constant?
Part B.The table The U.S. Economy, 1979–1992, gives data on the U.S. economy for 14 recent years. Due to rounding, some totals may not come out exactly.
1. Complete the table by filling in the five blanks.
The U.S. Economy, 1979–1992
PM1 Implicit Price PQ
(Billions of $) Deflator for GDP Q (NominalYear Dec. Figures V (1987 = 1.0000) (Real GDP) GDP)
1979 ______ 6.3966 .6449 3796.8 2448.61980 408.8 ______ .7171 3776.3 2708.61981 436.4 6.9445 ______ 3843.1 3030.61982 474.6 6.6363 .8376 ______ 3149.61983 521.2 6.5330 .8716 3906.6 ______1984 552.4 6.8378 .9105 4148.5 3777.21985 620.1 6.5130 .9437 4279.8 4038.71986 724.5 5.8918 .9691 4404.5 4268.61987 750.0 6.0532 1.0000 4539.9 4539.91988 787.1 6.2259 1.0385 4718.6 4900.41989 794.6 6.6081 1.0853 4838.0 5250.81990 827.2 6.6758 1.1322 4877.5 5522.21991 899.3 6.3132 1.1777 4821.0 5677.51992 1026.6 5.7965 1.2089 4922.6 5950.7
After you have completed this table, answer the remaining questions.
148
Unit 4
ACTIVITY 36 continued
2. Between 1979 and 1980, velocity was increasing. During this same period, real out-put (Q, the quantity of goods and services produced) actually decreased. Whatexplanation can you provide for this? (Hint: What happened to the price level?)
3. Between 1982 and 1983, velocity was decreasing, but during this same period boththe price level (P) and real output (Q) were increasing. What explanation can youprovide for this? (Hint: What happened to the stock of money?)
149
Unit 4
ACTIVITY 36 continued

150
Unit 4
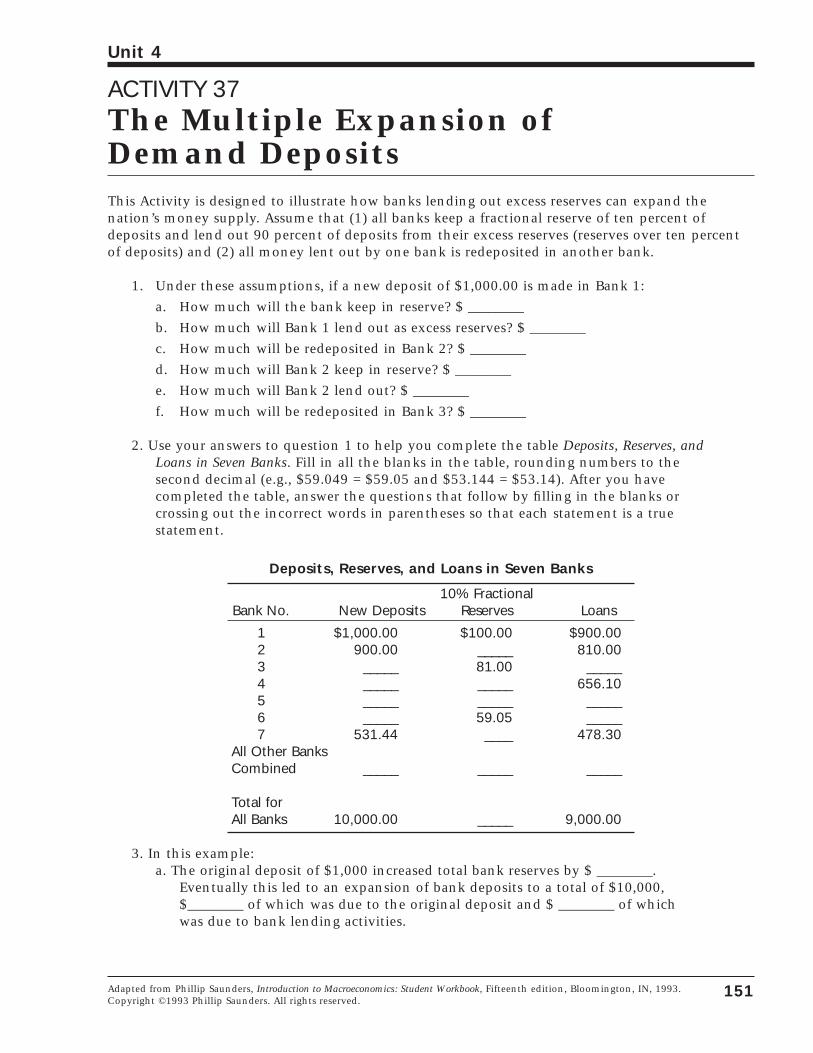
ACTIVITY 37The Multiple Expansion of Demand DepositsThis Activity is designed to illustrate how banks lending out excess reserves can expand thenation’s money supply. Assume that (1) all banks keep a fractional reserve of ten percent ofdeposits and lend out 90 percent of deposits from their excess reserves (reserves over ten percentof deposits) and (2) all money lent out by one bank is redeposited in another bank.
1. Under these assumptions, if a new deposit of $1,000.00 is made in Bank 1:
a. How much will the bank keep in reserve? $ ________
b. How much will Bank 1 lend out as excess reserves? $ ________
c. How much will be redeposited in Bank 2? $ ________
d. How much will Bank 2 keep in reserve? $ ________
e. How much will Bank 2 lend out? $ ________
f. How much will be redeposited in Bank 3? $ ________
2. Use your answers to question 1 to help you complete the table Deposits, Reserves, andLoans in Seven Banks. Fill in all the blanks in the table, rounding numbers to thesecond decimal (e.g., $59.049 = $59.05 and $53.144 = $53.14). After you have completed the table, answer the questions that follow by filling in the blanks orcrossing out the incorrect words in parentheses so that each statement is a truestatement.
Deposits, Reserves, and Loans in Seven Banks
10% FractionalBank No. New Deposits Reserves Loans
1 $1,000.00 $100.00 $900.002 900.00 _____ 810.003 _____ 81.00 _____4 _____ _____ 656.105 _____ _____ _____6 _____ 59.05 _____7 531.44 ____ 478.30
All Other Banks Combined _____ _____ _____
Total forAll Banks 10,000.00 _____ 9,000.00
3. In this example:a. The original deposit of $1,000 increased total bank reserves by $ ________.
Eventually this led to an expansion of bank deposits to a total of $10,000,$________ of which was due to the original deposit and $ ________ of whichwas due to bank lending activities.
151
Unit 4
Adapted from Phillip Saunders, Introduction to Macroeconomics: Student Workbook, Fifteenth edition, Bloomington, IN, 1993.Copyright ©1993 Phillip Saunders. All rights reserved.
b. This total-to-original deposit expansion ratio of _________ to one was basedon a fractional reserve of ten percent, a lending out of all excess reserves byall banks, and a redeposit of all loans to the banking system.
c. Therefore, if the fractional reserve had been 15 percent instead of ten per-cent, the amount of deposit expansion would have been (more/less) than inthis example.
d. If the fractional reserve had been five percent instead of ten percent, theamount of deposit expansion would have been (more/less) than in thisexample.
e. If banks had not lent out all their excess reserves, the amount of depositexpansion would have been (more/less) than in this example.
f. If all loans had not been redeposited in the banking system, the amount ofdeposit expansion would have been (more/less) than in this example.
152
Unit 4
ACTIVITY 37 continued
ACTIVITY 38Reserve Requirements and the MultiplierOne of the primary functions of the Federal Reserve is to limit the growth of the money supply.In order to do this, the Board of Governors sets reserve requirements, percentages of the bank’sdeposits that must be held by the bank. Banks may not loan out these required reserves.
The use of this fractional reserve system actually allows banks to create money. The totalamount of reserves held by a bank is known as the actual reserves. These actual reserves are composed of required reserves, which the bank must keep, and excess reserves, which thebank can loan to other customers. The reserves held by the bank beyond those required by theFed are excess reserves.
Complete the following calculations illustrating reserve requirements.
1. If $1,000 is deposited in the bank, calculate how much the bank must hold inreserve for each of the following reserve requirements. How much is the requiredreserve?
a. _____1% c. _____10% e. _____15%
b. _____5% d. _____12.5% f. _____25%
2. If $1,000 is deposited in the bank, calculate how much the bank can loan out foreach of the following reserve requirements. How much is the excess reserve?
a. _____1% c. _____10% e. _____15%
b. _____5% d. _____12.5% f. _____25%
Money is created when the bank makes loans to customers. To illustrate how money can be “created,” a bank balance sheet is shown in the next question. We will begin with two assumptions:
• The reserve requirement is ten percent, and the bank will loan out all of its excessreserves.
• All money loaned out will be returned to the same bank in the form of demanddeposits (for example, if Jamal borrowed $1,000 to buy a bike from Emilio, Emiliowould deposit his $1,000 back into the same bank that issued Jamal the loan).
153
Unit 4
Lesson developed by Lisa C. Herman-Ellison, Kokomo High School–South Campus, Kokomo, IN.
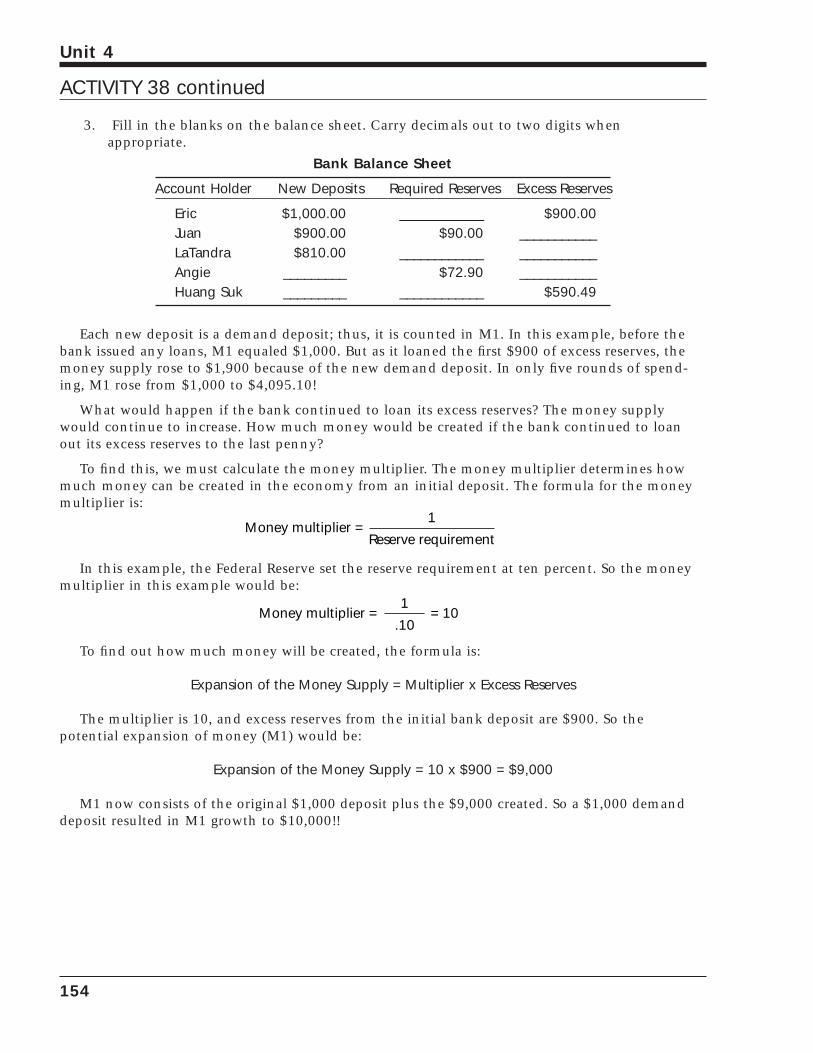
3. Fill in the blanks on the balance sheet. Carry decimals out to two digits whenappropriate.
Bank Balance Sheet
Account Holder New Deposits Required Reserves Excess Reserves
Eric $1,000.00 ____________ $900.00Juan $900.00 $90.00 ___________LaTandra $810.00 ____________ ___________Angie _________ $72.90 ___________Huang Suk _________ ____________ $590.49
Each new deposit is a demand deposit; thus, it is counted in M1. In this example, before thebank issued any loans, M1 equaled $1,000. But as it loaned the first $900 of excess reserves, themoney supply rose to $1,900 because of the new demand deposit. In only five rounds of spend-ing, M1 rose from $1,000 to $4,095.10!
What would happen if the bank continued to loan its excess reserves? The money supplywould continue to increase. How much money would be created if the bank continued to loanout its excess reserves to the last penny?
To find this, we must calculate the money multiplier. The money multiplier determines howmuch money can be created in the economy from an initial deposit. The formula for the moneymultiplier is:
In this example, the Federal Reserve set the reserve requirement at ten percent. So the moneymultiplier in this example would be:
To find out how much money will be created, the formula is:
Expansion of the Money Supply = Multiplier x Excess Reserves
The multiplier is 10, and excess reserves from the initial bank deposit are $900. So the potential expansion of money (M1) would be:
Expansion of the Money Supply = 10 x $900 = $9,000
M1 now consists of the original $1,000 deposit plus the $9,000 created. So a $1,000 demanddeposit resulted in M1 growth to $10,000!!
Money multiplier =1
.10= 10
Money multiplier =1
Reserve requirement
154
Unit 4
ACTIVITY 38 continued
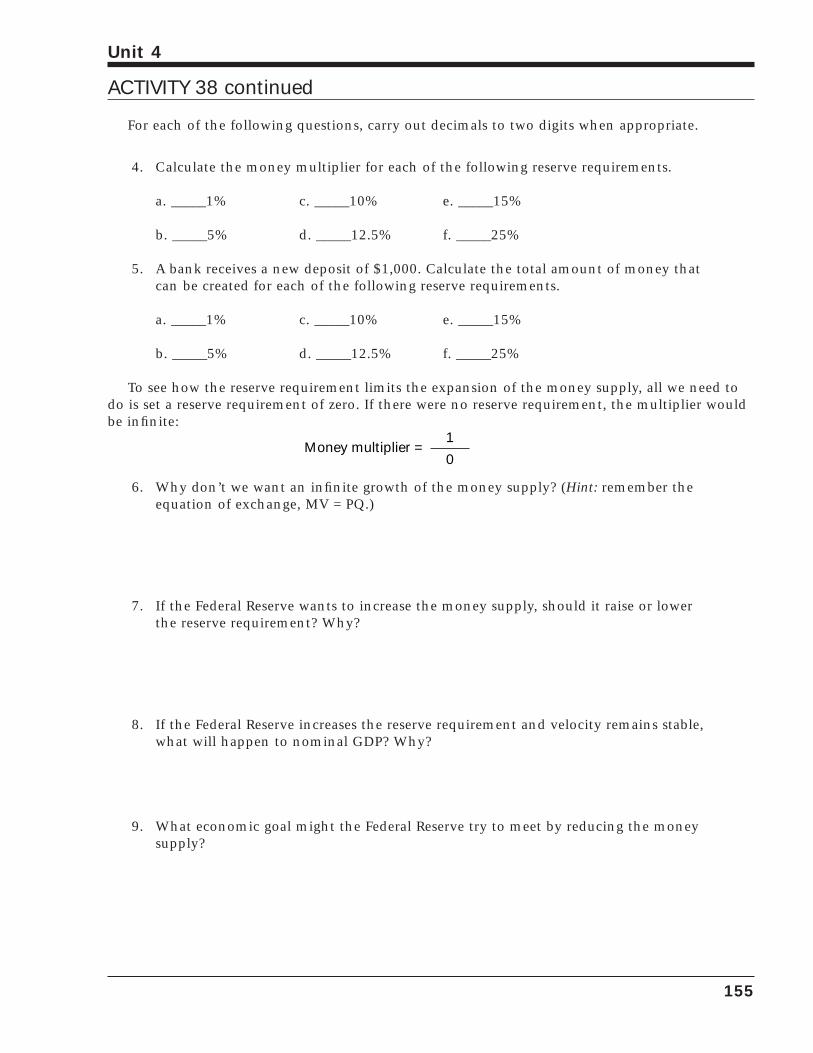
For each of the following questions, carry out decimals to two digits when appropriate.
4. Calculate the money multiplier for each of the following reserve requirements.
a. _____1% c. _____10% e. _____15%
b. _____5% d. _____12.5% f. _____25%
5. A bank receives a new deposit of $1,000. Calculate the total amount of money thatcan be created for each of the following reserve requirements.
a. _____1% c. _____10% e. _____15%
b. _____5% d. _____12.5% f. _____25%
To see how the reserve requirement limits the expansion of the money supply, all we need todo is set a reserve requirement of zero. If there were no reserve requirement, the multiplier wouldbe infinite:
6. Why don’t we want an infinite growth of the money supply? (Hint: remember theequation of exchange, MV = PQ.)
7. If the Federal Reserve wants to increase the money supply, should it raise or lowerthe reserve requirement? Why?
8. If the Federal Reserve increases the reserve requirement and velocity remains stable,what will happen to nominal GDP? Why?
9. What economic goal might the Federal Reserve try to meet by reducing the moneysupply?
Money multiplier =1
0
155
Unit 4
ACTIVITY 38 continued

156
Unit 4
ACTIVITY 39The Federal Reserve System andMonetary Policy
157
Unit 4
Adapted from Master Curriculum Guide in Economics: Teaching Strategies for High School Economics Courses (New York: NationalCouncil on Economic Education, 1985), p. 146.
The amount of money in an economy isimportant because it affects the level of spend-ing in a country. Too much spending can causeinflation while too little spending can causeunemployment and declining levels of produc-tion. In the United States, Congress hasassigned the responsibility for controlling ourmoney supply to the Federal Reserve System.
The Federal Reserve System, or Fed, hasfunctioned as the central bank of the UnitedStates since 1913. It consists of a seven-memberBoard of Governors in Washington, DC, plustwelve regional banks throughout the country.
As a central bank, the Fed manages themoney supply by influencing the lending activ-ity of commercial banks and other financialinstitutions. Another major part of its directinfluence comes about through its relationsand dealings with commercial banks fromwhich the effects spill over to the financial system as a whole.
Monetary PolicyThe deliberate actions of the Fed to expand
or contract the money supply are called mone-tary policy. The purpose of monetary policy is tomaintain or change the trend of economic out-put, employment, and prices at desired levels.A policy of the Fed designed to expand thegrowth of money and credit in the economy isknown as an expansionary (or easy) monetarypolicy. A policy to restrict the growth of moneyand credit in the economy is known as a con-tractionary (or tight) monetary policy. The cre-ation of too much money can cause inflation,and the creation of too little money can causerecession.
The Fed has three primary tools with whichto carry out monetary policy. These are openmarket operations, the discount rate, andreserve requirements.
Open Market OperationsOpen market operations refer to the Fed’s buy-
ing and selling of U.S. government securities inorder to add to or subtract from the reserves ofthe nation’s commercial banking system. Theoperations are conducted by the Federal OpenMarket Committee, which consists of the sevenmembers of the Fed Board and five FederalReserve Bank presidents. Government securi-ties, such as U.S. Treasury bills, notes, andbonds, are issued by the U.S. Treasury in returnfor money borrowed from individuals and busi-nesses in order to finance government spend-ing. If the Federal Reserve wants to put moneyinto the economy, it buys some of these gov-ernment securities by writing a check on itself.If, for instance, the Fed buys $10,000 worth ofgovernment securities with such a check, it cre-ates the $10,000 used to pay for them. The sell-ers are not $10,000 richer, since they no longerown the securities, but the money supply growsbecause there is $10,000 of new money in theeconomy. If the Fed wants to pursue a contrac-tionary monetary policy, it sells some of thegovernment securities it owns. The money thatis paid to the Fed for the securities is removedfrom the economy so the money supplyshrinks. Open market operations are the mostfrequently used tool of monetary policy.
Open market operations and other mone-tary tools of the Fed affect interest rates. TheFed does not directly set interest rates.However, if the Fed sells securities on the openmarket, the growth of the money supply isreduced. Interest rates are determined by sup-ply and demand in a way very similar to anyother price. If the supply of money decreases,interest rates rise. On the other hand, if the Fedbuys securities and expands the growth of themoney supply, interest rates decrease.
One of the interest rates most associatedwith the Fed’s monetary policy is the federalfunds rate. Federal funds are reserve balances offinancial institutions at the twelve regionalFederal Reserve Banks. If a financial institutioncannot meet its reserve requirement, it can bor-
row funds from other financial institutions.The federal funds rate is the rate of interest itmust pay for these funds. Although newspapersoften say the Federal Open Market Committeeraised or lowered the federal funds rate, this isnot true. What the Fed did was to change therate of growth of the money supply, and theopen market transaction used to implementthis policy changed the federal funds rate. Anexpansionary monetary policy will tend tolower the federal funds rate. A contractionarymonetary policy will tend to raise the federalfunds rate. The federal funds rate is differentfrom the discount rate.
The Discount RateThe Fed directly sets the discount rate. The
discount rate, the second tool of monetary poli-cy, is the interest rate the Fed charges banksthat borrow money. If a bank borrows fromthe Federal Reserve, the Fed credits the loan tothe bank’s reserves. In other words, theamount of the loan is added to the bank’sreserves held at the Fed. This process increasesthe amount of money and credit in the econo-my. The Fed does not automatically allow abank to borrow from it whenever the bankwants to. The Fed can refuse to make such aloan. If the discount rate is low and the Feddoes not discourage banks from borrowingfrom it, the Fed will foster an expansionarymonetary policy. If the discount rate is highand the Fed discourages banks from borrowingfrom it, the Fed will foster a tight monetarypolicy. The discount rate is probably the leaststrong of the three principal tools of monetarypolicy, but the Federal Reserve does use achange in it to indicate an overall tighteningor loosening of monetary policy.
Reserve RequirementsThe third important tool of monetary policy
consists of changing the reserve requirements forbank deposits. The Federal Reserve requires thatbanks keep as reserves a certain fraction of thedeposits they hold. These reserves must be keptas balances at Federal Reserve Banks or as cashthe banks have on hand (i.e., vault cash). Banksthat fail to meet their reserve requirements aresubject to monetary penalties. These requiredreserves cannot be lent to borrowers.
If the Fed wants to pursue a contractionarymonetary policy, it can raise reserve require-ments, thereby restricting the amount of fundsbanks can lend. If the Fed wants to pursue anexpansionary monetary policy, it can lowerreserve requirements. Let’s say you deposit$10,000 at your local bank and the reserverequirement on deposits is 15 percent. Thismeans that your bank would have to keep$1,500 on reserve at the Fed (.15 x $10,000 =$1,500). It could lend the other $8,500 to bor-rowers. If the Fed were to lower its reserverequirement to 10 percent, then the bank couldlend $500 more of your $10,000 deposit, or atotal of $9,000. Such an expansion of banklending causes the money supply in the econo-my to increase. However, if the Fed were toraise its reserve requirement to 20 percent, thebank could lend only $8,000 of your $10,000deposit, thus curbing the possible increase inthe money supply. Changes in reserve require-ments can be a very powerful tool of monetarypolicy, but this tool is used infrequently pre-cisely because it is so powerful. Most often, theFed desires to make gradual or minor changesin policy, aims for which changes in reserverequirements are not suitable.
158
Unit 4
1. Describe the organization of the Federal Reserve System.
ACTIVITY 39 continued
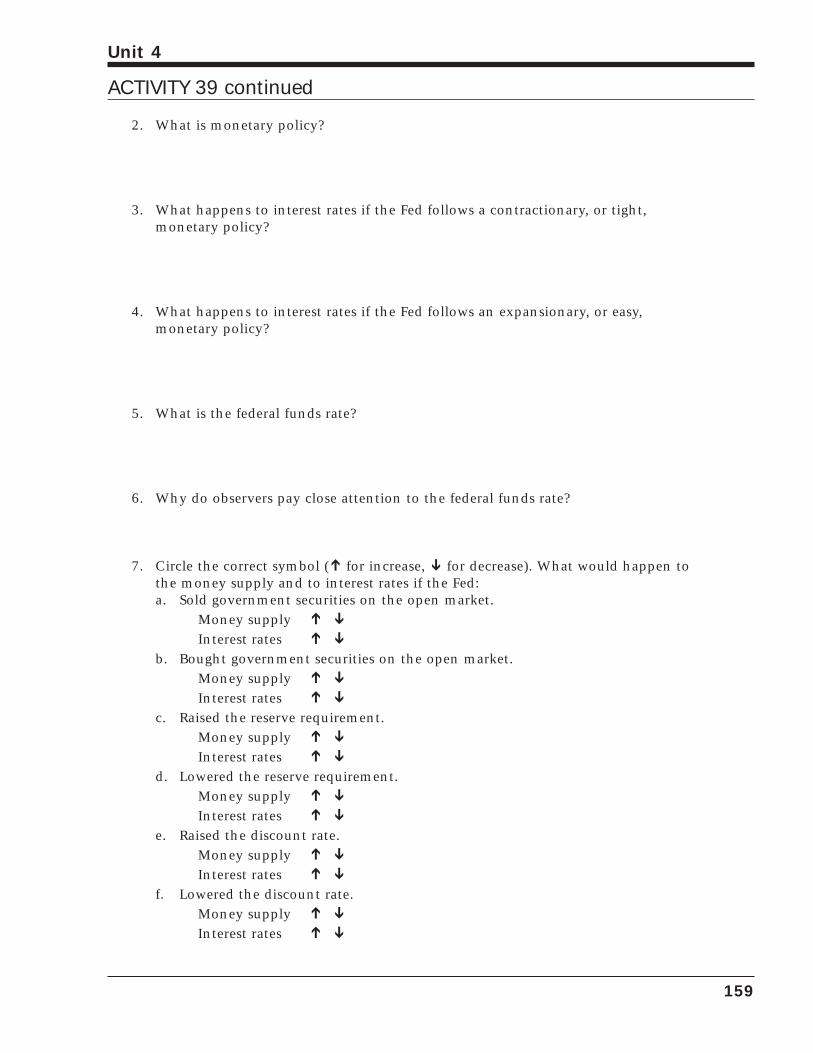
2. What is monetary policy?
3. What happens to interest rates if the Fed follows a contractionary, or tight, monetary policy?
4. What happens to interest rates if the Fed follows an expansionary, or easy, monetary policy?
5. What is the federal funds rate?
6. Why do observers pay close attention to the federal funds rate?
7. Circle the correct symbol (Õ for increase, Ô for decrease). What would happen tothe money supply and to interest rates if the Fed:a. Sold government securities on the open market.
Money supply Õ ÔInterest rates Õ Ô
b. Bought government securities on the open market.Money supply Õ ÔInterest rates Õ Ô
c. Raised the reserve requirement.Money supply Õ ÔInterest rates Õ Ô
d. Lowered the reserve requirement.Money supply Õ ÔInterest rates Õ Ô
e. Raised the discount rate.Money supply Õ ÔInterest rates Õ Ô
f. Lowered the discount rate.Money supply Õ ÔInterest rates Õ Ô
159
Unit 4
ACTIVITY 39 continued
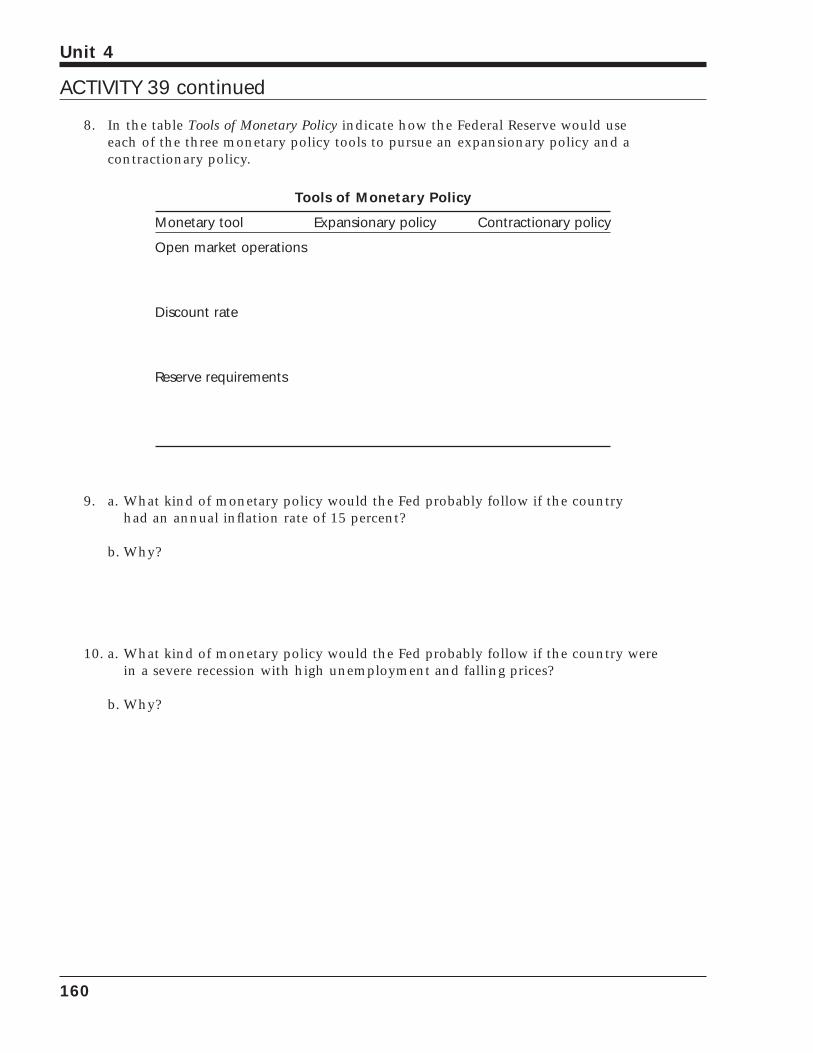
8. In the table Tools of Monetary Policy indicate how the Federal Reserve would useeach of the three monetary policy tools to pursue an expansionary policy and acontractionary policy.
Tools of Monetary Policy
Monetary tool Expansionary policy Contractionary policy
Open market operations
Discount rate
Reserve requirements
9. a. What kind of monetary policy would the Fed probably follow if the country had an annual inflation rate of 15 percent?
b. Why?
10. a. What kind of monetary policy would the Fed probably follow if the country werein a severe recession with high unemployment and falling prices?
b. Why?
160
Unit 4
ACTIVITY 39 continued
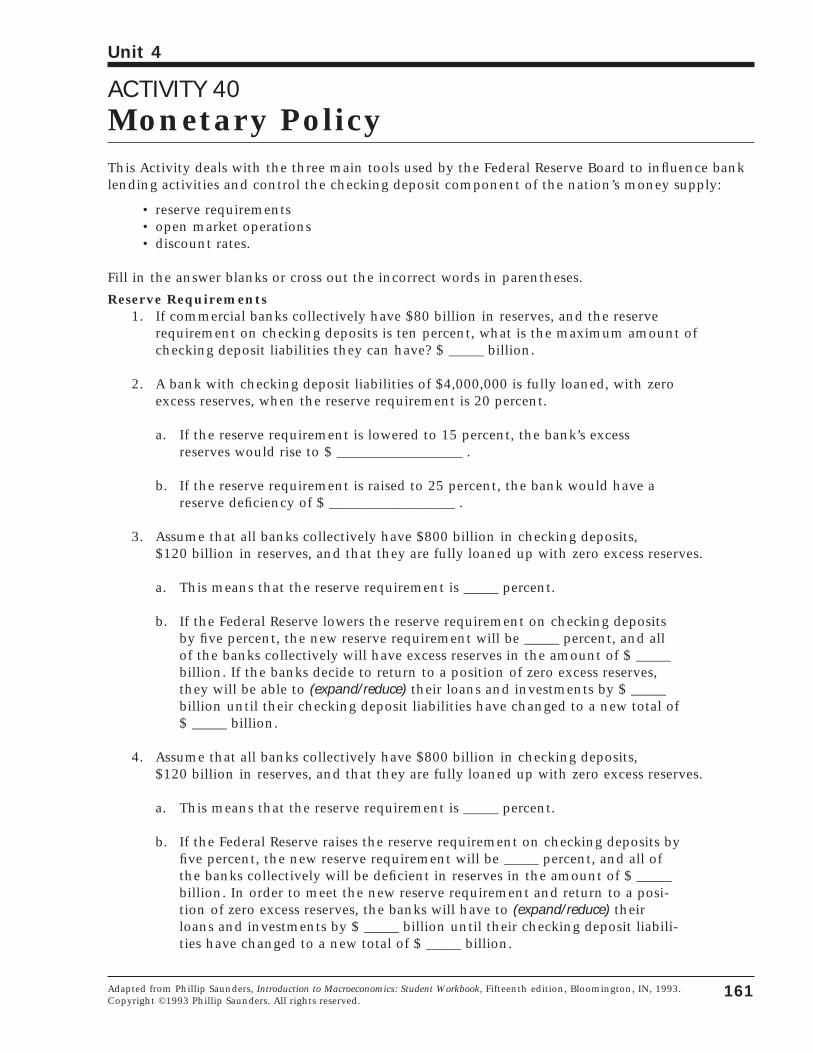
ACTIVITY 40Monetary PolicyThis Activity deals with the three main tools used by the Federal Reserve Board to influence banklending activities and control the checking deposit component of the nation’s money supply:
• reserve requirements • open market operations • discount rates.
Fill in the answer blanks or cross out the incorrect words in parentheses.
Reserve Requirements1. If commercial banks collectively have $80 billion in reserves, and the reserve
requirement on checking deposits is ten percent, what is the maximum amount ofchecking deposit liabilities they can have? $ _____ billion.
2. A bank with checking deposit liabilities of $4,000,000 is fully loaned, with zeroexcess reserves, when the reserve requirement is 20 percent.
a. If the reserve requirement is lowered to 15 percent, the bank’s excessreserves would rise to $ __________________ .
b. If the reserve requirement is raised to 25 percent, the bank would have areserve deficiency of $ __________________ .
3. Assume that all banks collectively have $800 billion in checking deposits, $120 billion in reserves, and that they are fully loaned up with zero excess reserves.
a. This means that the reserve requirement is _____ percent.
b. If the Federal Reserve lowers the reserve requirement on checking depositsby five percent, the new reserve requirement will be _____ percent, and allof the banks collectively will have excess reserves in the amount of $ _____ billion. If the banks decide to return to a position of zero excess reserves,they will be able to (expand/reduce) their loans and investments by $ _____billion until their checking deposit liabilities have changed to a new total of$ _____ billion.
4. Assume that all banks collectively have $800 billion in checking deposits, $120 billion in reserves, and that they are fully loaned up with zero excess reserves.
a. This means that the reserve requirement is _____ percent.
b. If the Federal Reserve raises the reserve requirement on checking deposits byfive percent, the new reserve requirement will be _____ percent, and all ofthe banks collectively will be deficient in reserves in the amount of $ _____billion. In order to meet the new reserve requirement and return to a posi-tion of zero excess reserves, the banks will have to (expand/reduce) theirloans and investments by $ _____ billion until their checking deposit liabili-ties have changed to a new total of $ _____ billion.
161
Unit 4
Adapted from Phillip Saunders, Introduction to Macroeconomics: Student Workbook, Fifteenth edition, Bloomington, IN, 1993.Copyright ©1993 Phillip Saunders. All rights reserved.
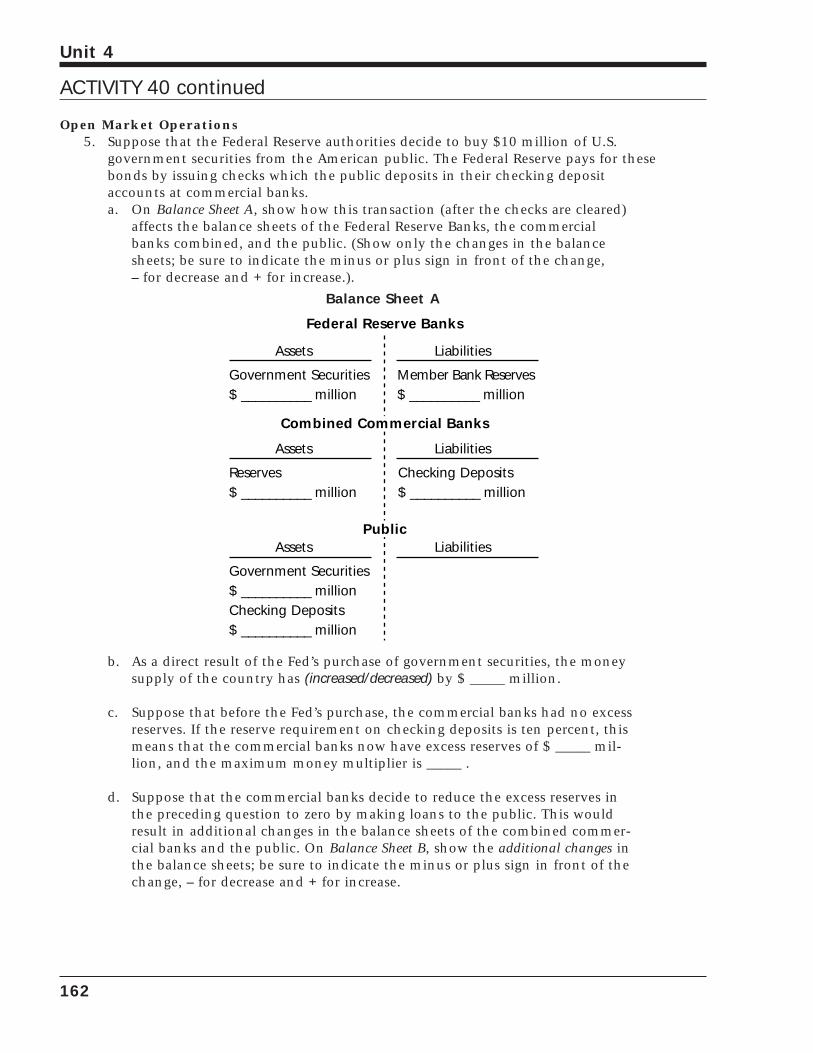
Open Market Operations5. Suppose that the Federal Reserve authorities decide to buy $10 million of U.S.
government securities from the American public. The Federal Reserve pays for thesebonds by issuing checks which the public deposits in their checking depositaccounts at commercial banks.a. On Balance Sheet A, show how this transaction (after the checks are cleared)
affects the balance sheets of the Federal Reserve Banks, the commercialbanks combined, and the public. (Show only the changes in the balancesheets; be sure to indicate the minus or plus sign in front of the change, – for decrease and + for increase.).
Balance Sheet A
b. As a direct result of the Fed’s purchase of government securities, the moneysupply of the country has (increased/decreased) by $ _____ million.
c. Suppose that before the Fed’s purchase, the commercial banks had no excessreserves. If the reserve requirement on checking deposits is ten percent, thismeans that the commercial banks now have excess reserves of $ _____ mil-lion, and the maximum money multiplier is _____ .
d. Suppose that the commercial banks decide to reduce the excess reserves inthe preceding question to zero by making loans to the public. This wouldresult in additional changes in the balance sheets of the combined commer-cial banks and the public. On Balance Sheet B, show the additional changes inthe balance sheets; be sure to indicate the minus or plus sign in front of thechange, – for decrease and + for increase.
Federal Reserve Banks
Government Securities$ __________ million
Member Bank Reserves$ __________ million
Assets Liabilities
Combined Commercial Banks
Reserves$ __________ million
Checking Deposits$ __________ million
Assets Liabilities
Public
Government Securities$ __________ millionChecking Deposits$ __________ million
Assets Liabilities
162
Unit 4
ACTIVITY 40 continued
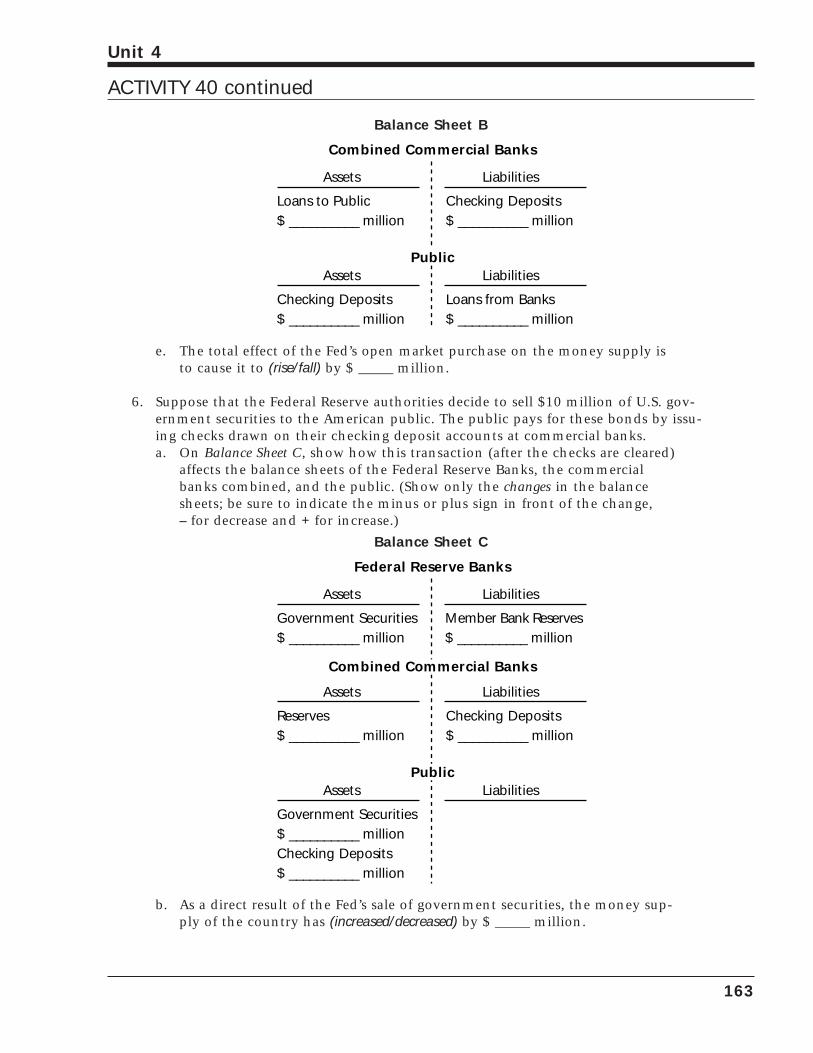
Balance Sheet B
e. The total effect of the Fed’s open market purchase on the money supply isto cause it to (rise/fall) by $ _____ million.
6. Suppose that the Federal Reserve authorities decide to sell $10 million of U.S. gov-ernment securities to the American public. The public pays for these bonds by issu-ing checks drawn on their checking deposit accounts at commercial banks.a. On Balance Sheet C, show how this transaction (after the checks are cleared)
affects the balance sheets of the Federal Reserve Banks, the commercialbanks combined, and the public. (Show only the changes in the balancesheets; be sure to indicate the minus or plus sign in front of the change, – for decrease and + for increase.)
Balance Sheet C
b. As a direct result of the Fed’s sale of government securities, the money sup-ply of the country has (increased/decreased) by $ _____ million.
Federal Reserve Banks
Government Securities$ __________ million
Member Bank Reserves$ __________ million
Assets Liabilities
Combined Commercial Banks
Reserves$ __________ million
Checking Deposits$ __________ million
Assets Liabilities
Public
Government Securities$ __________ millionChecking Deposits$ __________ million
Assets Liabilities
Combined Commercial Banks
Loans to Public$ __________ million
Checking Deposits$ __________ million
Assets Liabilities
Public
Checking Deposits$ __________ million
Assets Liabilities
Loans from Banks$ __________ million
163
Unit 4
ACTIVITY 40 continued
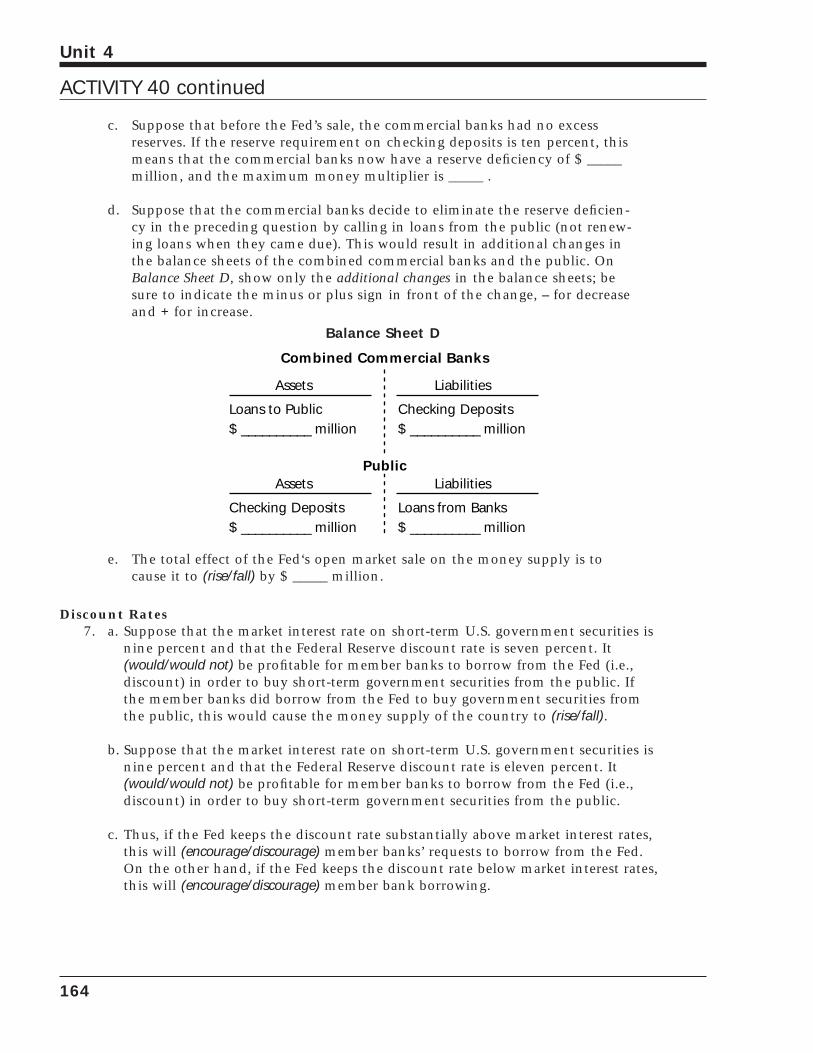
c. Suppose that before the Fed’s sale, the commercial banks had no excessreserves. If the reserve requirement on checking deposits is ten percent, thismeans that the commercial banks now have a reserve deficiency of $ _____million, and the maximum money multiplier is _____ .
d. Suppose that the commercial banks decide to eliminate the reserve deficien-cy in the preceding question by calling in loans from the public (not renew-ing loans when they came due). This would result in additional changes inthe balance sheets of the combined commercial banks and the public. OnBalance Sheet D, show only the additional changes in the balance sheets; besure to indicate the minus or plus sign in front of the change, – for decreaseand + for increase.
Balance Sheet D
e. The total effect of the Fed‘s open market sale on the money supply is tocause it to (rise/fall) by $ _____ million.
Discount Rates7. a. Suppose that the market interest rate on short-term U.S. government securities is
nine percent and that the Federal Reserve discount rate is seven percent. It(would/would not) be profitable for member banks to borrow from the Fed (i.e.,discount) in order to buy short-term government securities from the public. Ifthe member banks did borrow from the Fed to buy government securities fromthe public, this would cause the money supply of the country to (rise/fall).
b. Suppose that the market interest rate on short-term U.S. government securities isnine percent and that the Federal Reserve discount rate is eleven percent. It(would/would not) be profitable for member banks to borrow from the Fed (i.e.,discount) in order to buy short-term government securities from the public.
c. Thus, if the Fed keeps the discount rate substantially above market interest rates,this will (encourage/discourage) member banks’ requests to borrow from the Fed.On the other hand, if the Fed keeps the discount rate below market interest rates,this will (encourage/discourage) member bank borrowing.
Combined Commercial Banks
Loans to Public$ __________ million
Checking Deposits$ __________ million
Assets Liabilities
Public
Checking Deposits$ __________ million
Assets Liabilities
Loans from Banks$ __________ million
164
Unit 4
ACTIVITY 40 continued
A Final Summary Problem: What Is the Total Money Supply?8. Assume there is a very small country with a monetary system similar to that of the
United States. The money supply of this country is currently $500 thousand, ofwhich $100 thousand is currency and $400 thousand is checking deposits. Thereserve requirement is 25 percent and the banks have no excess reserves, so thesum of the required reserves of the commercial banks is $100 thousand.
a. Suppose Sally Student deposits $1,000 of currency in the banking system. In making this deposit, Student is exchanging money in one form (currency) formoney in another form (checking deposits), so this transaction between Studentand the banking system directly causes the money supply of the country to(increase/remain the same/decrease). The composition of the money supply, however, would change in favor of (checking deposits/currency) at the expense of(checking deposits/currency); and, in accepting Student’s deposit, the banking system has increased both its liabilities (checking deposits) and its assets(reserves) by $ _____ .
b. Since the reserve requirement is 25 percent, $ _____ of the currency which thebanking system received from Student should be classified as additional requiredreserves and $ _____ should be classified as excess reserves.
c. Assuming the banking system takes full advantage of its opportunity to extendnew loans to the public, the banking system’s loans will increase by $ _____ , andits deposits will increase by $ _____ .
165
Unit 4
ACTIVITY 40 continued

166
Unit 4
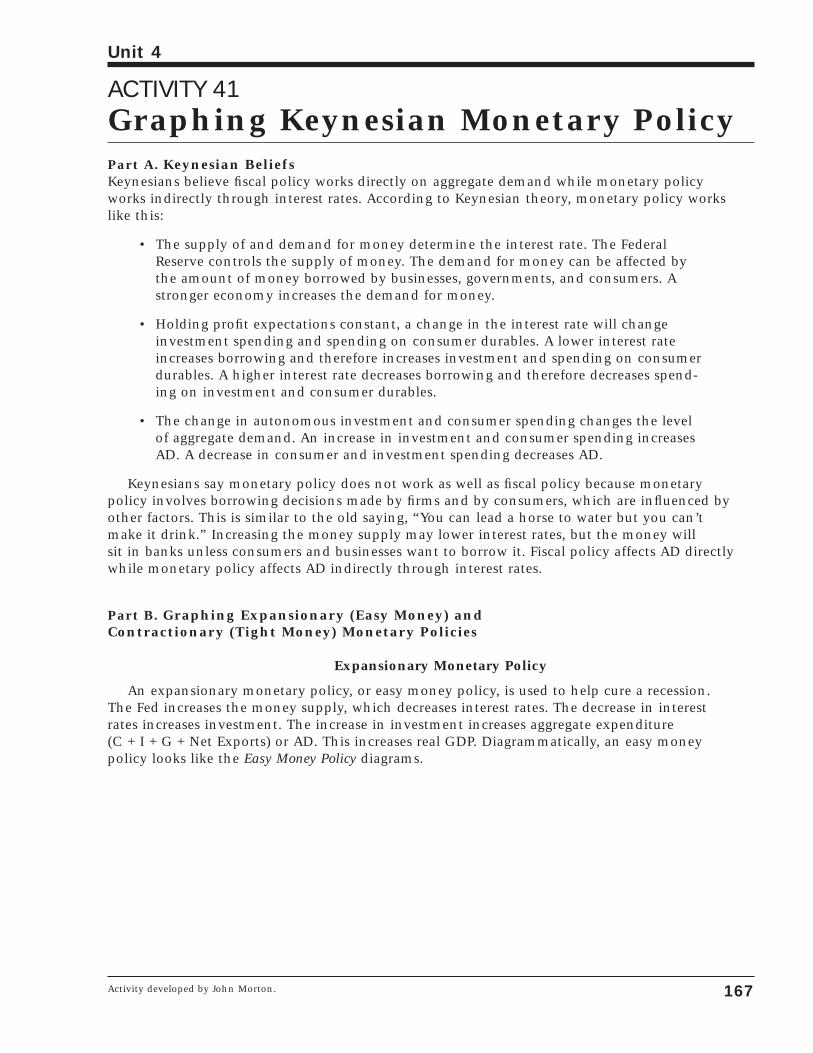
ACTIVITY 41Graphing Keynesian Monetary PolicyPart A. Keynesian BeliefsKeynesians believe fiscal policy works directly on aggregate demand while monetary policy works indirectly through interest rates. According to Keynesian theory, monetary policy works like this:
• The supply of and demand for money determine the interest rate. The FederalReserve controls the supply of money. The demand for money can be affected bythe amount of money borrowed by businesses, governments, and consumers. Astronger economy increases the demand for money.
• Holding profit expectations constant, a change in the interest rate will changeinvestment spending and spending on consumer durables. A lower interest rateincreases borrowing and therefore increases investment and spending on consumerdurables. A higher interest rate decreases borrowing and therefore decreases spend-ing on investment and consumer durables.
• The change in autonomous investment and consumer spending changes the levelof aggregate demand. An increase in investment and consumer spending increasesAD. A decrease in consumer and investment spending decreases AD.
Keynesians say monetary policy does not work as well as fiscal policy because monetary policy involves borrowing decisions made by firms and by consumers, which are influenced byother factors. This is similar to the old saying, “You can lead a horse to water but you can’t make it drink.” Increasing the money supply may lower interest rates, but the money will sit in banks unless consumers and businesses want to borrow it. Fiscal policy affects AD directlywhile monetary policy affects AD indirectly through interest rates.
Part B. Graphing Expansionary (Easy Money) and Contractionary (Tight Money) Monetary Policies
Expansionary Monetary Policy
An expansionary monetary policy, or easy money policy, is used to help cure a recession. The Fed increases the money supply, which decreases interest rates. The decrease in interest rates increases investment. The increase in investment increases aggregate expenditure (C + I + G + Net Exports) or AD. This increases real GDP. Diagrammatically, an easy money policy looks like the Easy Money Policy diagrams.
167
Unit 4
Activity developed by John Morton.
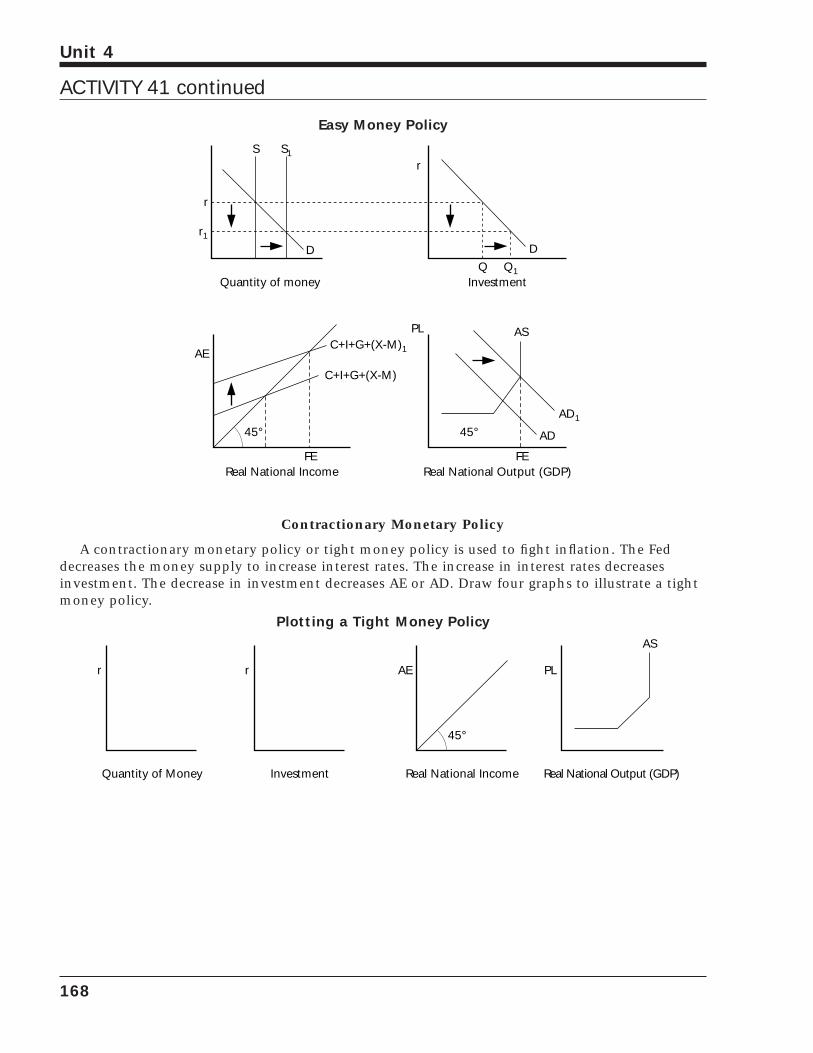
Easy Money Policy
Contractionary Monetary Policy
A contractionary monetary policy or tight money policy is used to fight inflation. The Feddecreases the money supply to increase interest rates. The increase in interest rates decreasesinvestment. The decrease in investment decreases AE or AD. Draw four graphs to illustrate a tightmoney policy.
Plotting a Tight Money Policy
AE
45°
Real National Income
PL
Real National Output (GDP)
AS
r
Quantity of Money
r
Investment
Q Q1
D
Investment
S1S
AE
r
r1
r
Quantity of money
D
C+I+G+(X-M)
45°
FEReal National Income
C+I+G+(X-M)1
PL
AD45°
FEReal National Output (GDP)
AD1
AS
168
Unit 4
ACTIVITY 41 continued
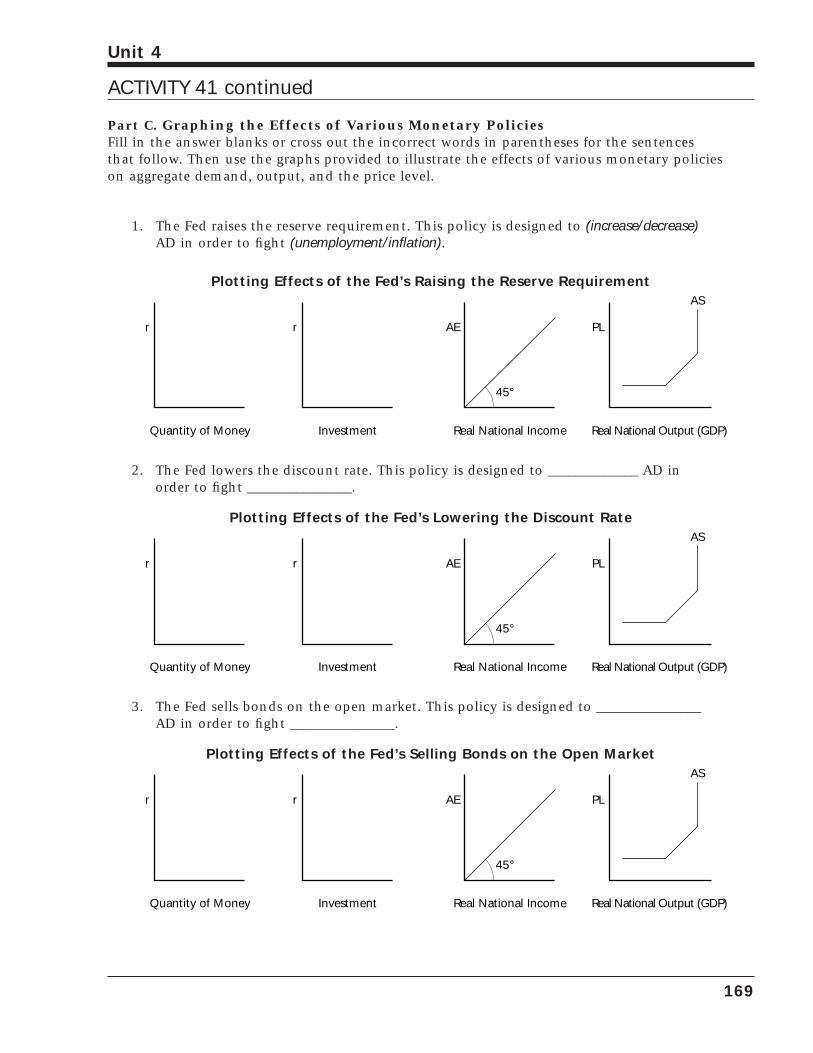
Part C. Graphing the Effects of Various Monetary PoliciesFill in the answer blanks or cross out the incorrect words in parentheses for the sentences that follow. Then use the graphs provided to illustrate the effects of various monetary policies on aggregate demand, output, and the price level.
1. The Fed raises the reserve requirement. This policy is designed to (increase/decrease)AD in order to fight (unemployment/inflation).
Plotting Effects of the Fed’s Raising the Reserve Requirement
2. The Fed lowers the discount rate. This policy is designed to _____________ AD inorder to fight _______________.
Plotting Effects of the Fed’s Lowering the Discount Rate
3. The Fed sells bonds on the open market. This policy is designed to _______________AD in order to fight _______________.
Plotting Effects of the Fed’s Selling Bonds on the Open Market
AE
45°
Real National Income
PL
Real National Output (GDP)
AS
r
Quantity of Money
r
Investment
AE
45°
Real National Income
PL
Real National Output (GDP)
AS
r
Quantity of Money
r
Investment
AE
45°
Real National Income
PL
Real National Output (GDP)
AS
r
Quantity of Money
r
Investment
169
Unit 4
ACTIVITY 41 continued
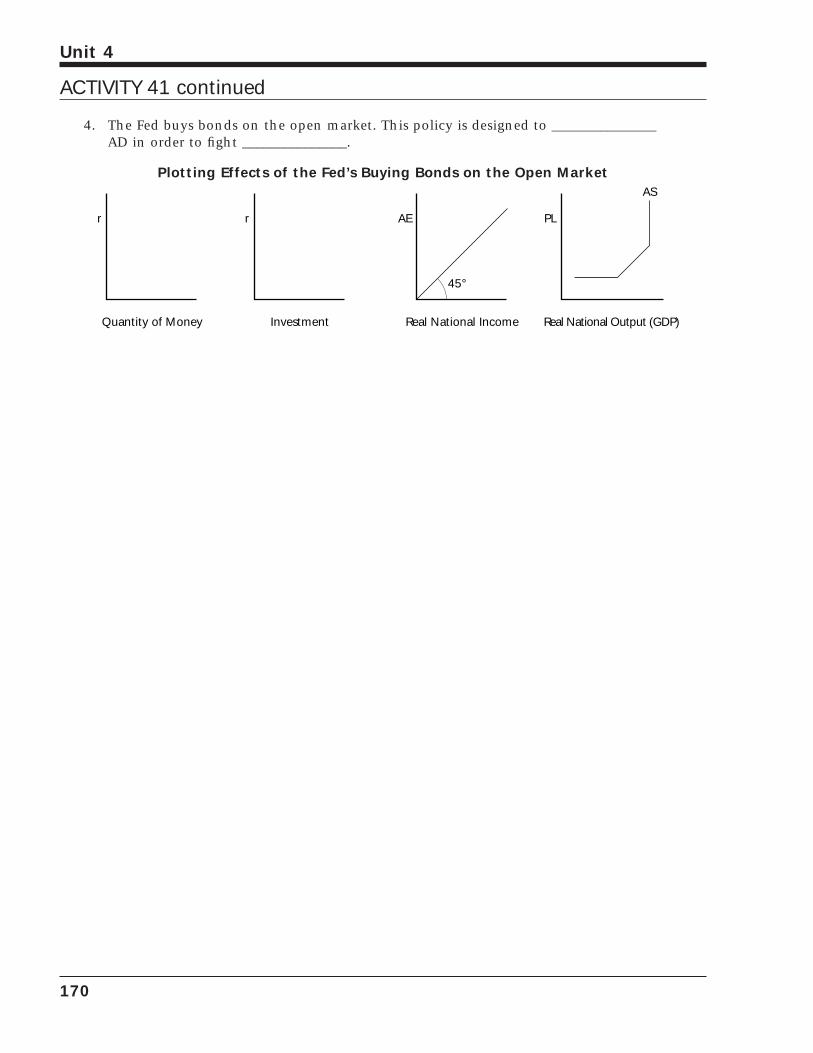
4. The Fed buys bonds on the open market. This policy is designed to _______________AD in order to fight _______________.
Plotting Effects of the Fed’s Buying Bonds on the Open Market
AE
45°
Real National Income
PL
Real National Output (GDP)
AS
r
Quantity of Money
r
Investment
170
Unit 4
ACTIVITY 41 continued
ACTIVITY 42Monetarist Monetary Policy
171
Unit 4
1Excerpt from FREE TO CHOOSE: A PERSONAL STATEMENT, copyright © 1980 by Milton Friedman and Rose D. Friedman, reprintedby permission of Harcourt Brace & Company.2Ibid., p.84.
Part A. Monetarist BeliefsMonetarism is based on the quantity theory ofmoney (MV = PQ). According to the mone-tarists, changing the money supply can havesome short-run effects on aggregate demand,but the only long-run effect is to change theprice level. Full employment is determined bythe level of long-run aggregate supply. Outputcan only increase by three to five percent ayear. Monetarists believe that increasing themoney supply by three to five percent a yearwill allow economic growth to occur; increas-ing the money supply by more than five per-cent will just cause prices to increase; andincreasing the money supply by less than threepercent will cause output to decrease and arecession to result.
Milton Friedman is the intellectual leader ofthe monetarist school. He believes that the onlylong-run cause of inflation is too great anincrease in the money supply. Friedman explainsit this way1:
We return to our basic proposition.Inflation is primarily a monetary phe-nomenon, produced by a more rapidincrease in the quantity of moneythan in output. The behavior of thequantity of money is the senior part-ner; of output, the junior partner.Many phenomena can produce tem-porary fluctuations in the rate ofinflation, but they can have lastingeffects only insofar as they affect therate of monetary growth.
Friedman also feels that the Federal ReserveSystem’s failure to increase the money supplywas the major cause of the Great Depression ofthe 1930s. The depression was not caused by afailure in the private sector but by a failure inthe public sector. The Federal Reserve allowedthe money supply to collapse. According toFriedman2:
The total stock of money showed anequally drastic decline. For every $3of deposits and currency in the handsof the public in 1929, less than $2remained in 1933—a monetary collapse without precedent.
While the Keynesians believe monetary policy plays second fiddle to fiscal policy, mone-tarists believe money is almost all that mattersand that it has a powerful and direct effect onthe economy.
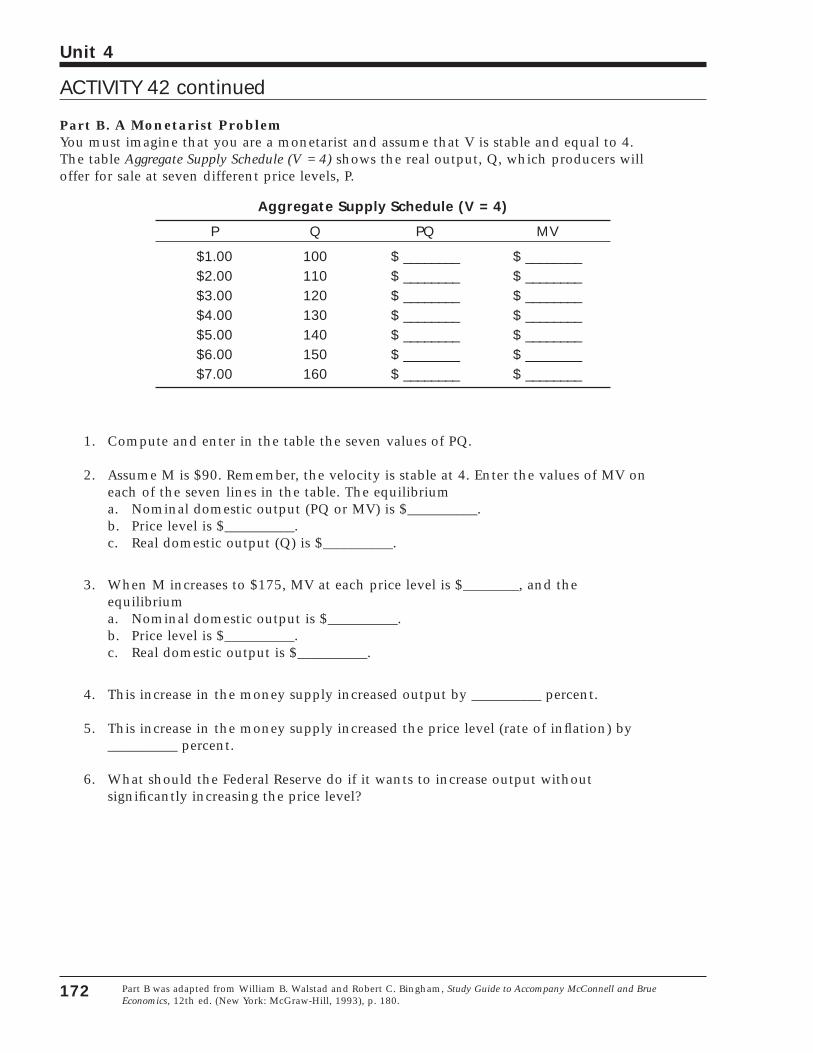
Part B. A Monetarist ProblemYou must imagine that you are a monetarist and assume that V is stable and equal to 4. The table Aggregate Supply Schedule (V = 4) shows the real output, Q, which producers will offer for sale at seven different price levels, P.
Aggregate Supply Schedule (V = 4)
P Q PQ MV
$1.00 100 $ ________ $ ________$2.00 110 $ ________ $ ________$3.00 120 $ ________ $ ________$4.00 130 $ ________ $ ________$5.00 140 $ ________ $ ________$6.00 150 $ ________ $ ________$7.00 160 $ ________ $ ________
1. Compute and enter in the table the seven values of PQ.
2. Assume M is $90. Remember, the velocity is stable at 4. Enter the values of MV oneach of the seven lines in the table. The equilibriuma. Nominal domestic output (PQ or MV) is $__________.b. Price level is $__________.c. Real domestic output (Q) is $__________.
3. When M increases to $175, MV at each price level is $________, and the equilibriuma. Nominal domestic output is $__________.b. Price level is $__________.c. Real domestic output is $__________.
4. This increase in the money supply increased output by __________ percent.
5. This increase in the money supply increased the price level (rate of inflation) by__________ percent.
6. What should the Federal Reserve do if it wants to increase output without significantly increasing the price level?
172
Unit 4
Part B was adapted from William B. Walstad and Robert C. Bingham, Study Guide to Accompany McConnell and BrueEconomics, 12th ed. (New York: McGraw-Hill, 1993), p. 180.
ACTIVITY 42 continued
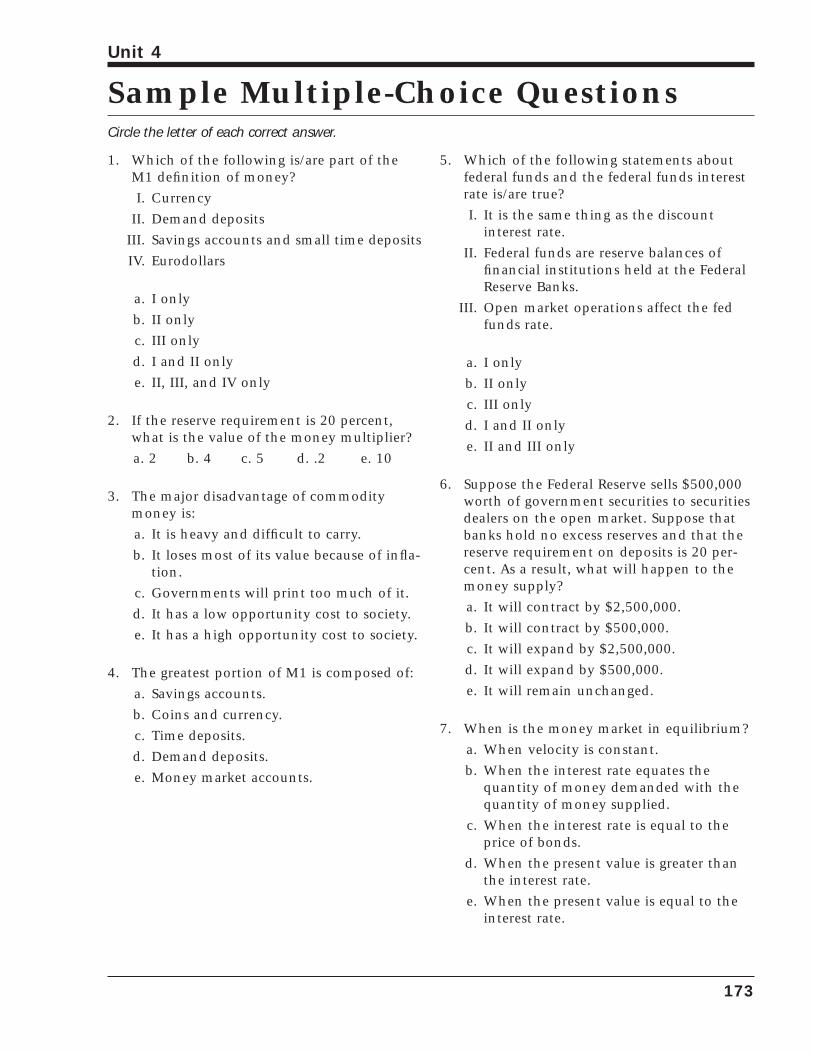
Sample Multiple-Choice QuestionsCircle the letter of each correct answer.
173
Unit 4
1. Which of the following is/are part of theM1 definition of money?
I. Currency
II. Demand deposits
III. Savings accounts and small time deposits
IV. Eurodollars
a. I only
b. II only
c. III only
d. I and II only
e. II, III, and IV only
2. If the reserve requirement is 20 percent,what is the value of the money multiplier?
a. 2 b. 4 c. 5 d. .2 e. 10
3. The major disadvantage of commoditymoney is:
a. It is heavy and difficult to carry.
b. It loses most of its value because of infla-tion.
c. Governments will print too much of it.
d. It has a low opportunity cost to society.
e. It has a high opportunity cost to society.
4. The greatest portion of M1 is composed of:
a. Savings accounts.
b. Coins and currency.
c. Time deposits.
d. Demand deposits.
e. Money market accounts.
5. Which of the following statements aboutfederal funds and the federal funds interestrate is/are true?
I. It is the same thing as the discountinterest rate.
II. Federal funds are reserve balances offinancial institutions held at the FederalReserve Banks.
III. Open market operations affect the fedfunds rate.
a. I only
b. II only
c. III only
d. I and II only
e. II and III only
6. Suppose the Federal Reserve sells $500,000worth of government securities to securitiesdealers on the open market. Suppose thatbanks hold no excess reserves and that thereserve requirement on deposits is 20 per-cent. As a result, what will happen to themoney supply?
a. It will contract by $2,500,000.
b. It will contract by $500,000.
c. It will expand by $2,500,000.
d. It will expand by $500,000.
e. It will remain unchanged.
7. When is the money market in equilibrium?
a. When velocity is constant.
b. When the interest rate equates the quantity of money demanded with thequantity of money supplied.
c. When the interest rate is equal to theprice of bonds.
d. When the present value is greater thanthe interest rate.
e. When the present value is equal to theinterest rate.
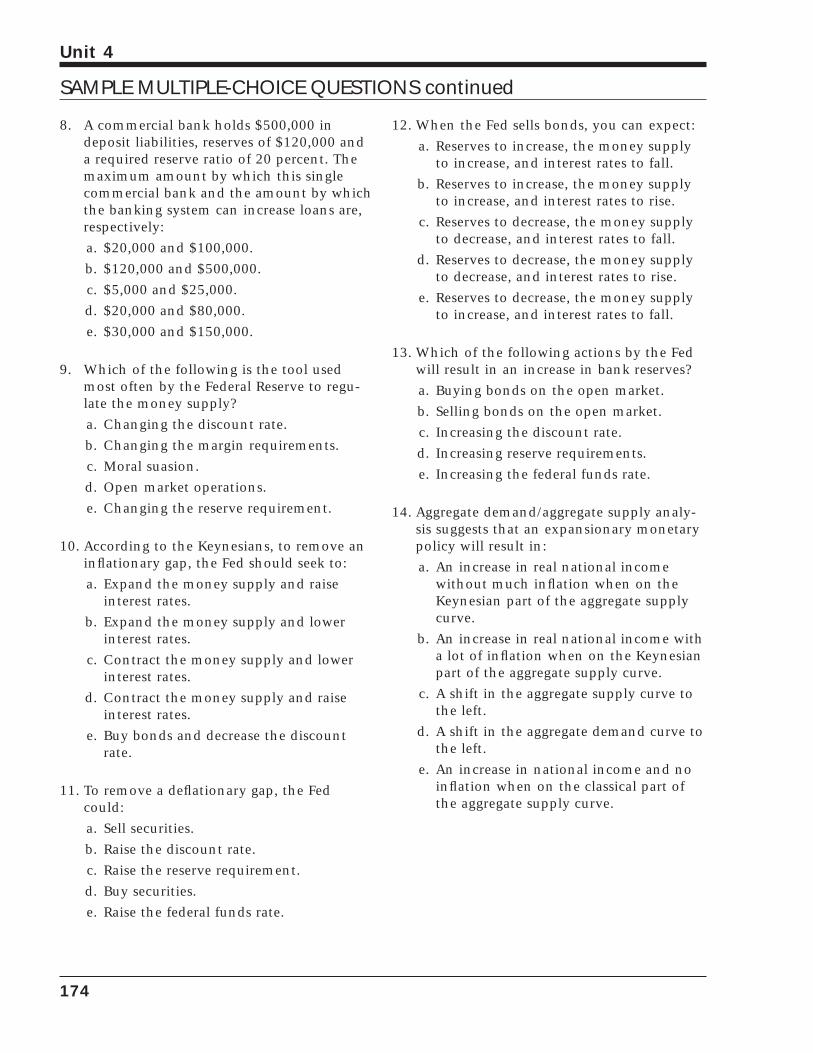
8. A commercial bank holds $500,000 indeposit liabilities, reserves of $120,000 anda required reserve ratio of 20 percent. Themaximum amount by which this singlecommercial bank and the amount by whichthe banking system can increase loans are,respectively:
a. $20,000 and $100,000.
b. $120,000 and $500,000.
c. $5,000 and $25,000.
d. $20,000 and $80,000.
e. $30,000 and $150,000.
9. Which of the following is the tool usedmost often by the Federal Reserve to regu-late the money supply?
a. Changing the discount rate.
b. Changing the margin requirements.
c. Moral suasion.
d. Open market operations.
e. Changing the reserve requirement.
10. According to the Keynesians, to remove aninflationary gap, the Fed should seek to:
a. Expand the money supply and raiseinterest rates.
b. Expand the money supply and lowerinterest rates.
c. Contract the money supply and lowerinterest rates.
d. Contract the money supply and raiseinterest rates.
e. Buy bonds and decrease the discountrate.
11. To remove a deflationary gap, the Fedcould:
a. Sell securities.
b. Raise the discount rate.
c. Raise the reserve requirement.
d. Buy securities.
e. Raise the federal funds rate.
12. When the Fed sells bonds, you can expect:
a. Reserves to increase, the money supplyto increase, and interest rates to fall.
b. Reserves to increase, the money supplyto increase, and interest rates to rise.
c. Reserves to decrease, the money supplyto decrease, and interest rates to fall.
d. Reserves to decrease, the money supplyto decrease, and interest rates to rise.
e. Reserves to decrease, the money supplyto increase, and interest rates to fall.
13. Which of the following actions by the Fedwill result in an increase in bank reserves?
a. Buying bonds on the open market.
b. Selling bonds on the open market.
c. Increasing the discount rate.
d. Increasing reserve requirements.
e. Increasing the federal funds rate.
14. Aggregate demand/aggregate supply analy-sis suggests that an expansionary monetarypolicy will result in:
a. An increase in real national incomewithout much inflation when on theKeynesian part of the aggregate supplycurve.
b. An increase in real national income witha lot of inflation when on the Keynesianpart of the aggregate supply curve.
c. A shift in the aggregate supply curve tothe left.
d. A shift in the aggregate demand curve tothe left.
e. An increase in national income and noinflation when on the classical part ofthe aggregate supply curve.
174
Unit 4
SAMPLE MULTIPLE-CHOICE QUESTIONS continued
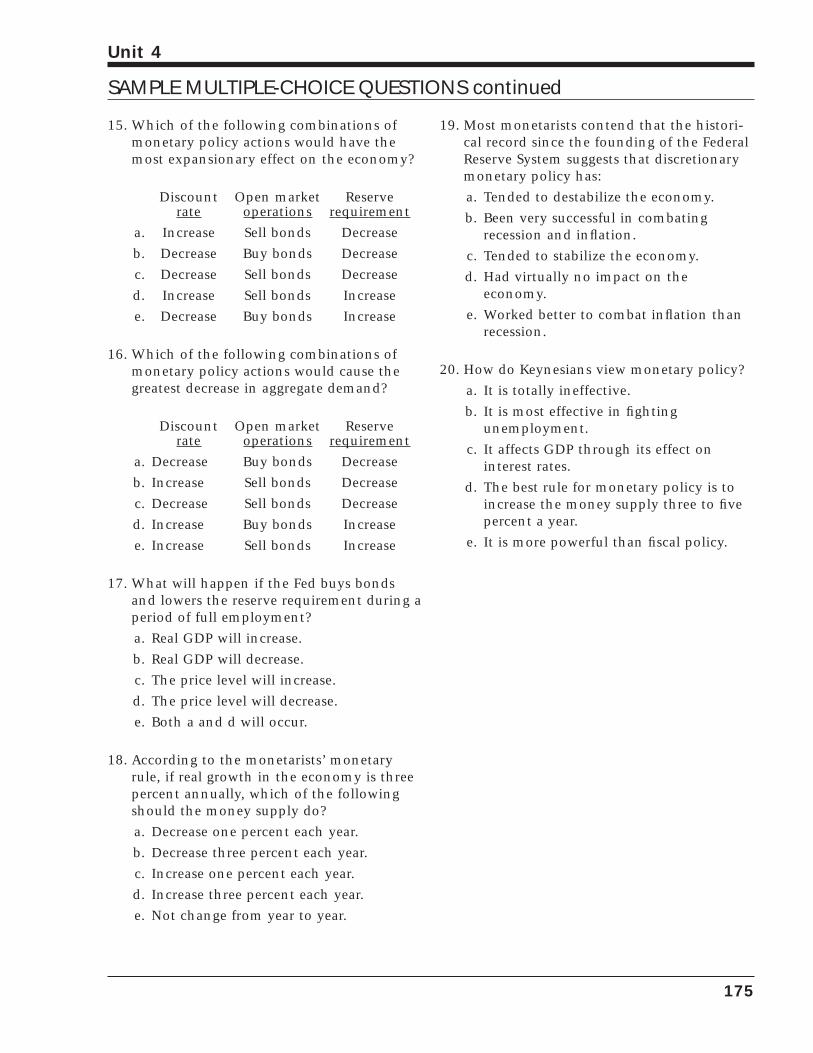
15. Which of the following combinations ofmonetary policy actions would have themost expansionary effect on the economy?
Discount Open market Reserve rate operations requirement
a. Increase Sell bonds Decrease
b. Decrease Buy bonds Decrease
c. Decrease Sell bonds Decrease
d. Increase Sell bonds Increase
e. Decrease Buy bonds Increase
16. Which of the following combinations ofmonetary policy actions would cause thegreatest decrease in aggregate demand?
Discount Open market Reserve rate operations requirement
a. Decrease Buy bonds Decrease
b. Increase Sell bonds Decrease
c. Decrease Sell bonds Decrease
d. Increase Buy bonds Increase
e. Increase Sell bonds Increase
17. What will happen if the Fed buys bondsand lowers the reserve requirement during aperiod of full employment?
a. Real GDP will increase.
b. Real GDP will decrease.
c. The price level will increase.
d. The price level will decrease.
e. Both a and d will occur.
18. According to the monetarists’ monetaryrule, if real growth in the economy is threepercent annually, which of the followingshould the money supply do?
a. Decrease one percent each year.
b. Decrease three percent each year.
c. Increase one percent each year.
d. Increase three percent each year.
e. Not change from year to year.
19. Most monetarists contend that the histori-cal record since the founding of the FederalReserve System suggests that discretionarymonetary policy has:
a. Tended to destabilize the economy.
b. Been very successful in combating recession and inflation.
c. Tended to stabilize the economy.
d. Had virtually no impact on the economy.
e. Worked better to combat inflation thanrecession.
20. How do Keynesians view monetary policy?
a. It is totally ineffective.
b. It is most effective in fighting unemployment.
c. It affects GDP through its effect on interest rates.
d. The best rule for monetary policy is toincrease the money supply three to fivepercent a year.
e. It is more powerful than fiscal policy.
175
Unit 4
SAMPLE MULTIPLE-CHOICE QUESTIONS continued

176
Unit 4
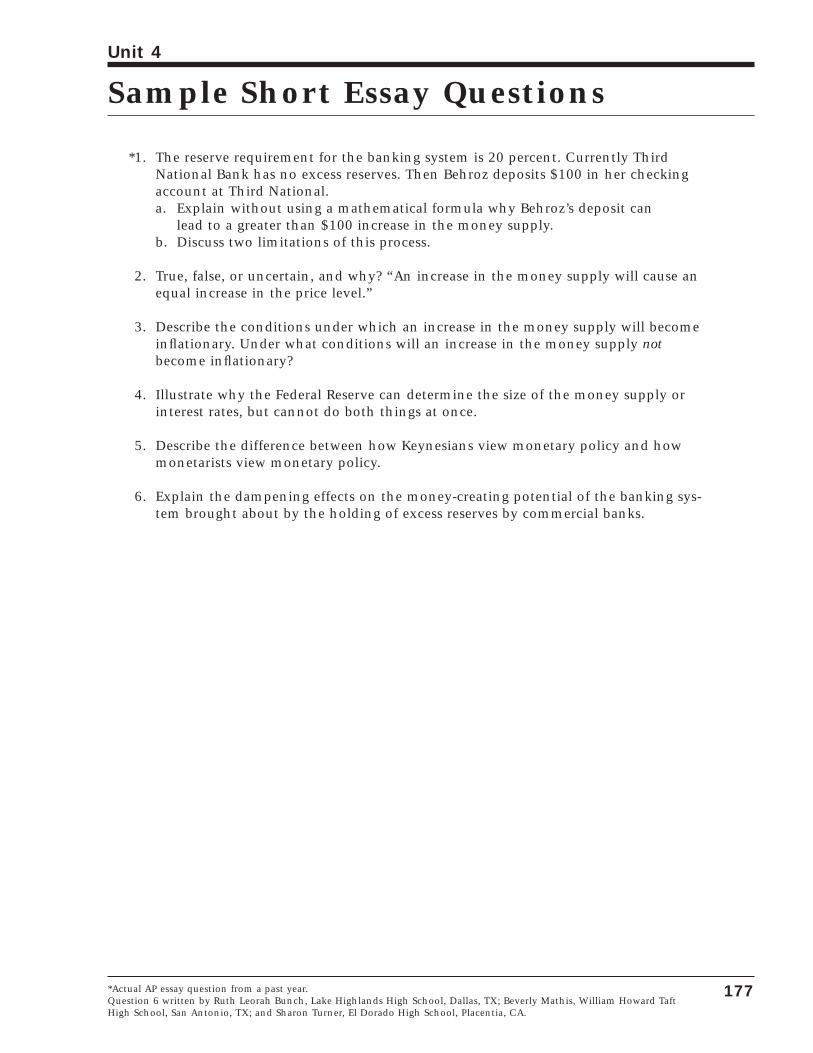
Sample Short Essay Questions
*1. The reserve requirement for the banking system is 20 percent. Currently ThirdNational Bank has no excess reserves. Then Behroz deposits $100 in her checkingaccount at Third National.a. Explain without using a mathematical formula why Behroz’s deposit can
lead to a greater than $100 increase in the money supply.b. Discuss two limitations of this process.
2. True, false, or uncertain, and why? “An increase in the money supply will cause anequal increase in the price level.”
3. Describe the conditions under which an increase in the money supply will becomeinflationary. Under what conditions will an increase in the money supply notbecome inflationary?
4. Illustrate why the Federal Reserve can determine the size of the money supply orinterest rates, but cannot do both things at once.
5. Describe the difference between how Keynesians view monetary policy and howmonetarists view monetary policy.
6. Explain the dampening effects on the money-creating potential of the banking sys-tem brought about by the holding of excess reserves by commercial banks.
177
Unit 4
*Actual AP essay question from a past year.Question 6 written by Ruth Leorah Bunch, Lake Highlands High School, Dallas, TX; Beverly Mathis, William Howard TaftHigh School, San Antonio, TX; and Sharon Turner, El Dorado High School, Placentia, CA.

178
Unit 4
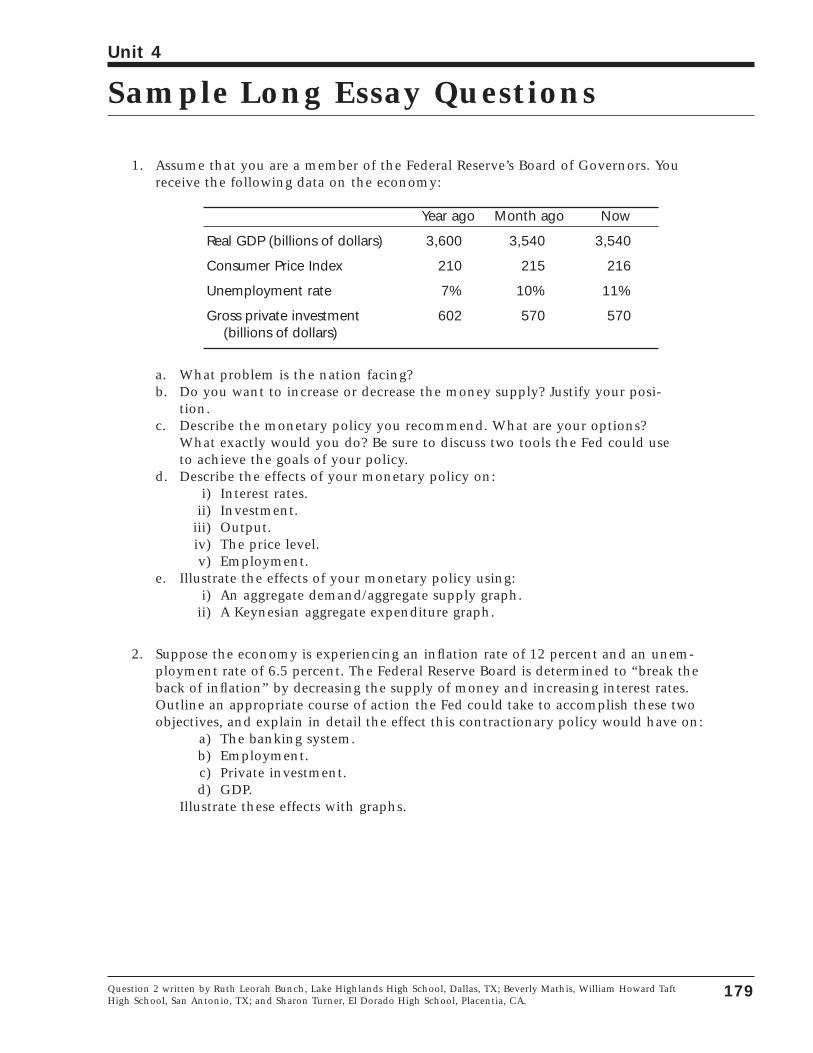
Sample Long Essay Questions
1. Assume that you are a member of the Federal Reserve’s Board of Governors. Youreceive the following data on the economy:
Year ago Month ago Now
Real GDP (billions of dollars) 3,600 3,540 3,540
Consumer Price Index 210 215 216
Unemployment rate 7% 10% 11%
Gross private investment 602 570 570(billions of dollars)
a. What problem is the nation facing?b. Do you want to increase or decrease the money supply? Justify your posi-
tion.c. Describe the monetary policy you recommend. What are your options?
What exactly would you do? Be sure to discuss two tools the Fed could useto achieve the goals of your policy.
d. Describe the effects of your monetary policy on:i) Interest rates.
ii) Investment.iii) Output.iv) The price level.v) Employment.
e. Illustrate the effects of your monetary policy using:i) An aggregate demand/aggregate supply graph.
ii) A Keynesian aggregate expenditure graph.
2. Suppose the economy is experiencing an inflation rate of 12 percent and an unem-ployment rate of 6.5 percent. The Federal Reserve Board is determined to “break theback of inflation” by decreasing the supply of money and increasing interest rates.Outline an appropriate course of action the Fed could take to accomplish these twoobjectives, and explain in detail the effect this contractionary policy would have on:
a) The banking system.b) Employment.c) Private investment.d) GDP.
Illustrate these effects with graphs.
179
Unit 4
Question 2 written by Ruth Leorah Bunch, Lake Highlands High School, Dallas, TX; Beverly Mathis, William Howard TaftHigh School, San Antonio, TX; and Sharon Turner, El Dorado High School, Placentia, CA.

180
Unit 4
Macroeconomics
Unit 5Monetary and FiscalCombinations:Economic Policy inthe Real World
181

182
Unit 5
Key Ideas
183
Unit 5
• Macroeconomic policy involves combinationsof fiscal and monetary policies.
• The interactions between monetary and fiscalpolicies can affect overall aggregate demand. For example, a tight monetary policy combinedwith an expansionary fiscal policy can cause“crowding out.”
• “Crowding out” is the effect of a rise in interestrates caused by increased borrowing by the fed-eral government. The higher interest rates“crowd out” business and consumer borrowing.
• A Phillips curve illustrates the inflation-unemployment tradeoff and how this tradeoffmay differ in the short and long run.
• Both monetary and fiscal policies are primarilyaggregate demand policies, but not all of themacroeconomic problems in the economy areaggregate demand problems.
• If factors other than excess aggregate demandare contributing to inflation, it is difficult formonetary and fiscal policies to deal with them.
• If factors other than insufficient aggregatedemand are contributing to unemployment, itis difficult for monetary and fiscal policies todeal with them.
• Economic growth is concerned with increasingan economy’s total productive capacity at fullemployment or its natural rate of output. Thisoutput is represented by a vertical long-runaggregate supply curve.
• Economic growth is usually measured bychanges in real GDP or by changes in real GDPper capita.
• Economic growth can be shown graphically as arightward shift of a nation’s long-run aggregatesupply curve or a rightward shift of its produc-tion possibilities curve.
• The rate of economic growth is affected by avariety of aggregate supply and demand factors.
• The classical model represents an idealized ver-sion of a private-enterprise economy in the longrun. In terms of aggregate demand and supply,the classical model is characterized by a verticalaggregate supply schedule, which is a functionof tastes, technology, society’s resource base,
and the distribution of economic resources, andan aggregate demand schedule that is a functionof real money balances. Supply-side factorsdetermine real output and employment.Aggregate demand and supply together deter-mine the price level.
• The Keynesian model is based on the belief thatfiscal policy works through aggregate demand.Government fights unemployment by increas-ing aggregate demand and fights inflation bydecreasing aggregate demand. Monetary policyworks through interest rates and investmentand also affects aggregate demand.
• The monetarist model, which is closely relatedto the classical model, focuses on the impor-tance of changes in the money supply on theeconomy. The monetarists’ basic analyticaldevice is MV = PQ. Monetarists favor a mone-tary rule calling for a constant rate of change(usually three to five percent) in the money sup-ply that coincides with changes in real GDP.
• The rational expectations model, which is alsoclosely related to the classical model, maintainsthat economic agents (consumers and business-es) are intelligent decision makers and can beexpected to take the effects of government poli-cy changes into account in deciding theirbehavior. Because agents anticipate changes inpolicies, these policies will have no effect onreal GDP.
• Supply-side economics emphasizes factors thatcause the aggregate supply curve to shift.Supply-side economists argue that inflation andstagflation are caused largely by decreases inaggregate supply—not by changes in aggregatedemand. They recommend microeconomic solu-tions such as improved productivity and lessgovernment regulation.
• Different economic theories are only one reasonwhy economists disagree; other reasons are dis-putes about time periods, different assumptions,and different values.

184
Unit 5
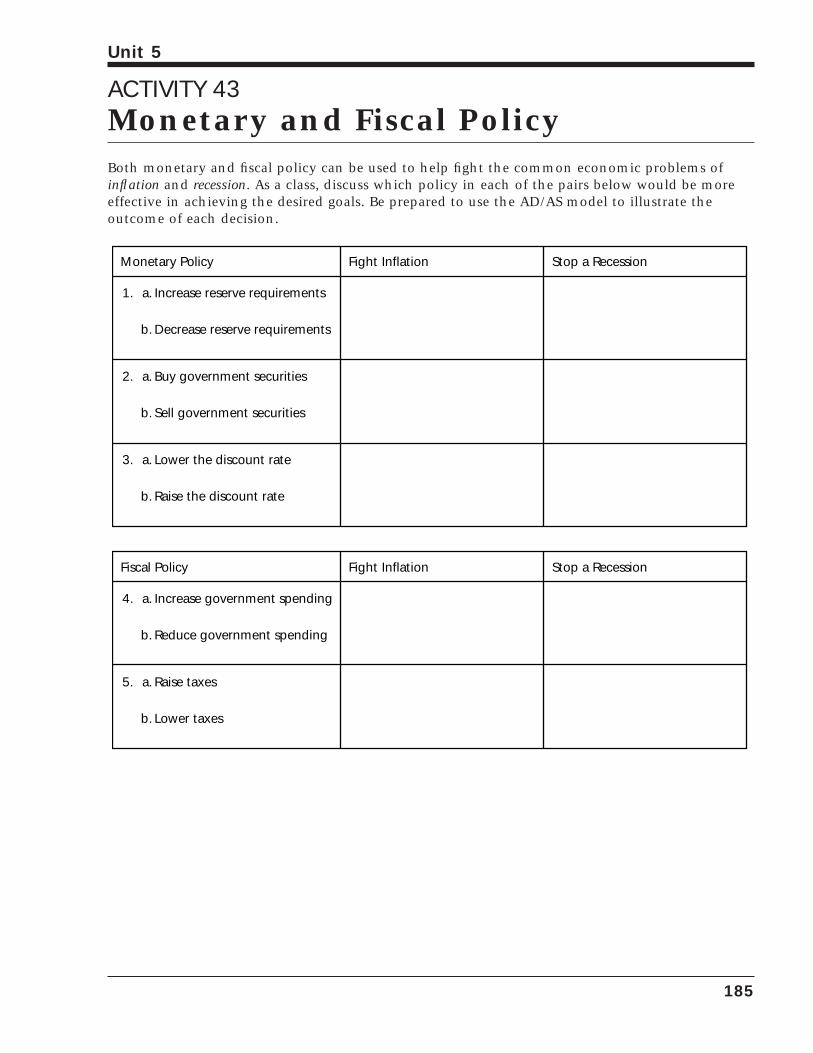
ACTIVITY 43Monetary and Fiscal PolicyBoth monetary and fiscal policy can be used to help fight the common economic problems ofinflation and recession. As a class, discuss which policy in each of the pairs below would be moreeffective in achieving the desired goals. Be prepared to use the AD/AS model to illustrate the outcome of each decision.
Monetary Policy
1.
Fight Inflation Stop a Recession
Increase reserve requirements
Decrease reserve requirements
2. Buy government securities
Sell government securities
3. Lower the discount rate
Raise the discount rate
Fiscal Policy
4.
Fight Inflation Stop a Recession
Increase government spending
Reduce government spending
5. Raise taxes
Lower taxes
a.
b.
a.
b.
a.
b.
a.
b.
a.
b.
185
Unit 5

186
Unit 5
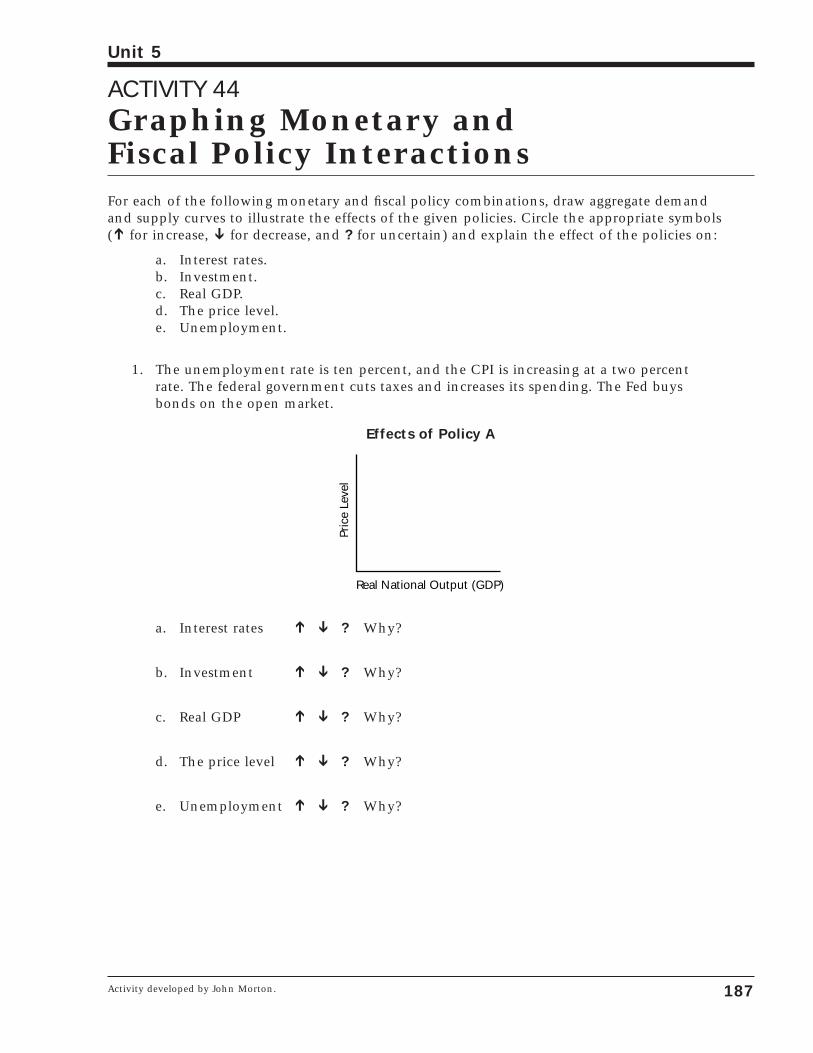
ACTIVITY 44Graphing Monetary and Fiscal Policy InteractionsFor each of the following monetary and fiscal policy combinations, draw aggregate demand and supply curves to illustrate the effects of the given policies. Circle the appropriate symbols (Õ for increase, Ô for decrease, and ? for uncertain) and explain the effect of the policies on:
a. Interest rates.b. Investment.c. Real GDP.d. The price level.e. Unemployment.
1. The unemployment rate is ten percent, and the CPI is increasing at a two percentrate. The federal government cuts taxes and increases its spending. The Fed buysbonds on the open market.
Effects of Policy A
a. Interest rates Õ Ô ? Why?
b. Investment Õ Ô ? Why?
c. Real GDP Õ Ô ? Why?
d. The price level Õ Ô ? Why?
e. Unemployment Õ Ô ? Why?
Pric
e Le
vel
Real National Output (GDP)
187
Unit 5
Activity developed by John Morton.
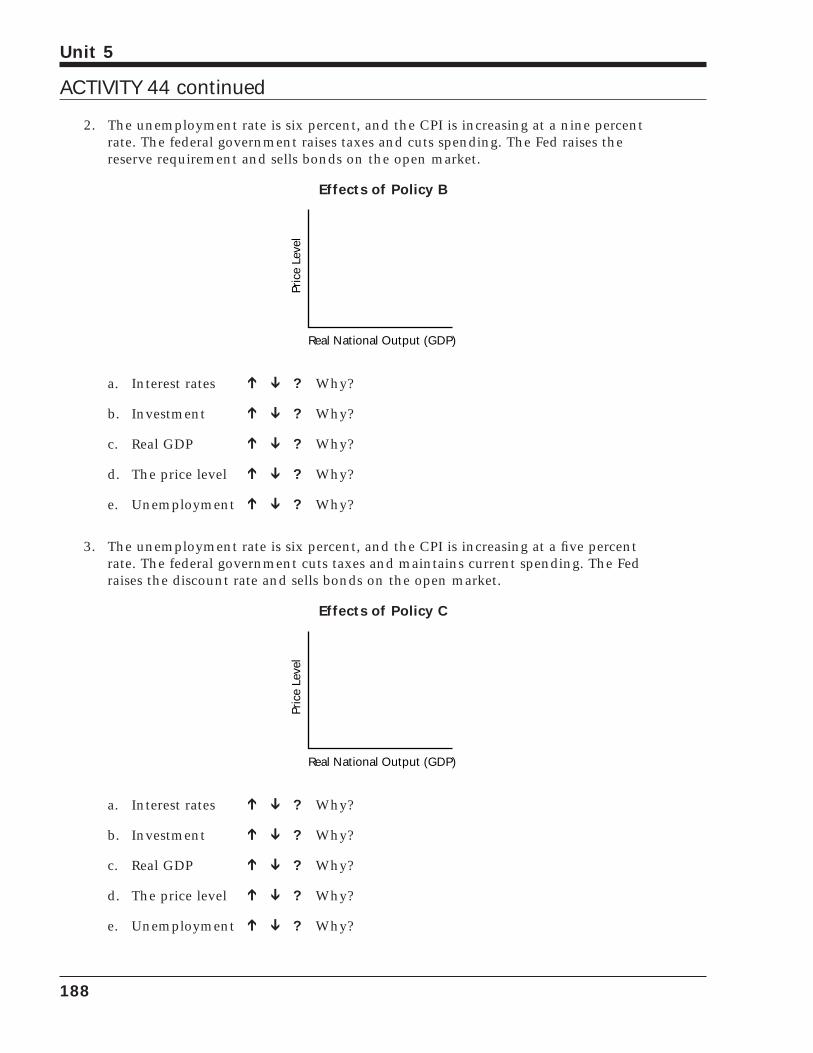
2. The unemployment rate is six percent, and the CPI is increasing at a nine percentrate. The federal government raises taxes and cuts spending. The Fed raises thereserve requirement and sells bonds on the open market.
Effects of Policy B
a. Interest rates Õ Ô ? Why?
b. Investment Õ Ô ? Why?
c. Real GDP Õ Ô ? Why?
d. The price level Õ Ô ? Why?
e. Unemployment Õ Ô ? Why?
3. The unemployment rate is six percent, and the CPI is increasing at a five percentrate. The federal government cuts taxes and maintains current spending. The Fedraises the discount rate and sells bonds on the open market.
Effects of Policy C
a. Interest rates Õ Ô ? Why?
b. Investment Õ Ô ? Why?
c. Real GDP Õ Ô ? Why?
d. The price level Õ Ô ? Why?
e. Unemployment Õ Ô ? Why?
Pric
e Le
vel
Real National Output (GDP)
Pric
e Le
vel
Real National Output (GDP)
188
Unit 5
ACTIVITY 44 continued
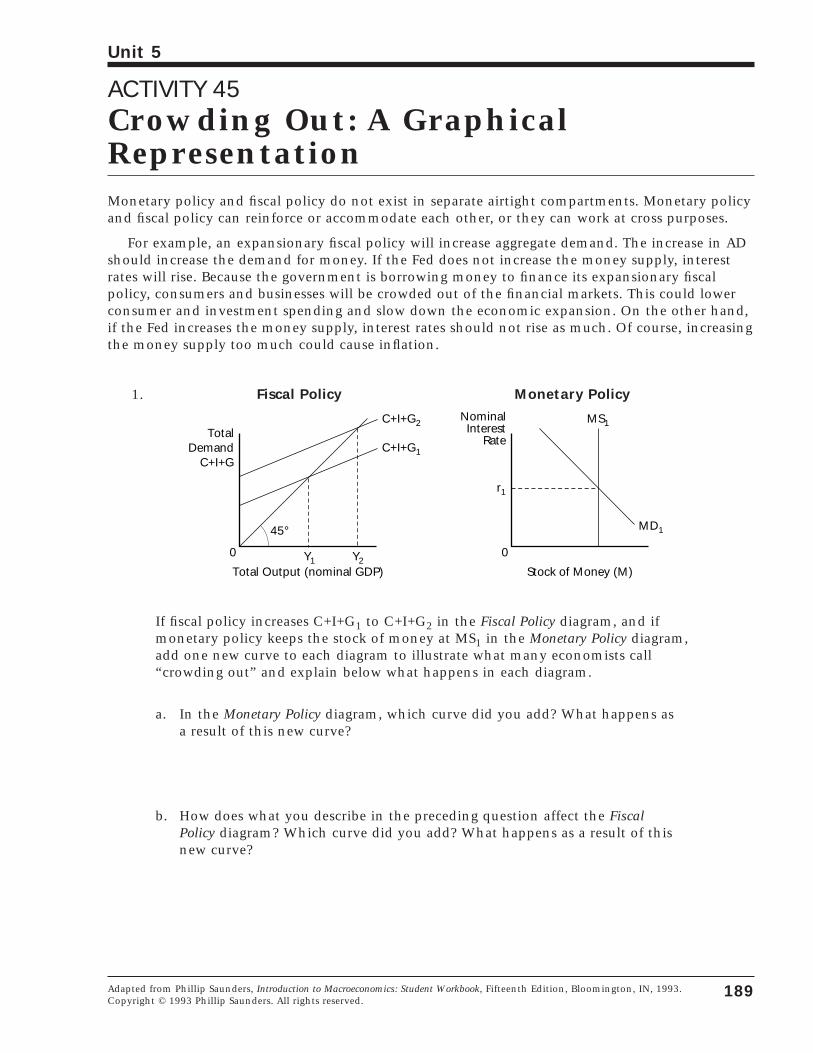
ACTIVITY 45Crowding Out: A GraphicalRepresentationMonetary policy and fiscal policy do not exist in separate airtight compartments. Monetary policyand fiscal policy can reinforce or accommodate each other, or they can work at cross purposes.
For example, an expansionary fiscal policy will increase aggregate demand. The increase in ADshould increase the demand for money. If the Fed does not increase the money supply, interestrates will rise. Because the government is borrowing money to finance its expansionary fiscal policy, consumers and businesses will be crowded out of the financial markets. This could lowerconsumer and investment spending and slow down the economic expansion. On the other hand,if the Fed increases the money supply, interest rates should not rise as much. Of course, increasingthe money supply too much could cause inflation.
1. Fiscal Policy Monetary Policy
If fiscal policy increases C+I+G1 to C+I+G2 in the Fiscal Policy diagram, and if monetary policy keeps the stock of money at MS1 in the Monetary Policy diagram,add one new curve to each diagram to illustrate what many economists call“crowding out” and explain below what happens in each diagram.
a. In the Monetary Policy diagram, which curve did you add? What happens asa result of this new curve?
b. How does what you describe in the preceding question affect the FiscalPolicy diagram? Which curve did you add? What happens as a result of thisnew curve?
TotalDemand
C+I+G
45°
Y1 Y20
Total Output (nominal GDP)
C+I+G2
0
MS1
Stock of Money (M)
MD1
NominalInterest
RateC+I+G1
r1
189
Unit 5
Adapted from Phillip Saunders, Introduction to Macroeconomics: Student Workbook, Fifteenth Edition, Bloomington, IN, 1993.Copyright © 1993 Phillip Saunders. All rights reserved.
c. How could monetary policy prevent what you describe in the preceding ques-tion from happening? Add a new curve to the Monetary Policy diagram andexplain how this would make it unnecessary to change the Fiscal Policy dia-gram. What curve did you add? What happens as a result of this new curve?
2. Indicate whether you agree (A), disagree (D), or are uncertain (?) about the truth ofthe following statements and explain your reasoning.
a. ______ “Exhaustion of excess bank reserves inevitably puts a ceiling on everybusiness boom because without money the boom cannot continue.”
b. ______ “A fiscal policy in which the U.S. Treasury Department increased itsborrowing by selling a new issue of government bonds would be moreexpansionary if the new bonds were sold to the Federal Reserve than ifthey were sold to the general public.”
3. If the independent Federal Reserve Open Market Committee wished to accommo-date or reinforce a contractionary fiscal policy:
a. Would it buy or sell bonds? __________
b. What effect would this have on bond prices and interest rates?
c. What effect would this have on bank reserves and the money supply?
d. What effect would b and c have on aggregate demand?
190
Unit 5
ACTIVITY 45 continued
4. If the independent Federal Reserve Open Market Committee wished to accommo-date or reinforce an expansionary fiscal policy:
a. Would it buy or sell bonds? __________
b. What effect would this have on bond prices and interest rates?
c. What effect would this have on bank reserves and the money supply?
d. What effect would b and c have on aggregate demand?
191
Unit 5
ACTIVITY 45 continued

192
Unit 5
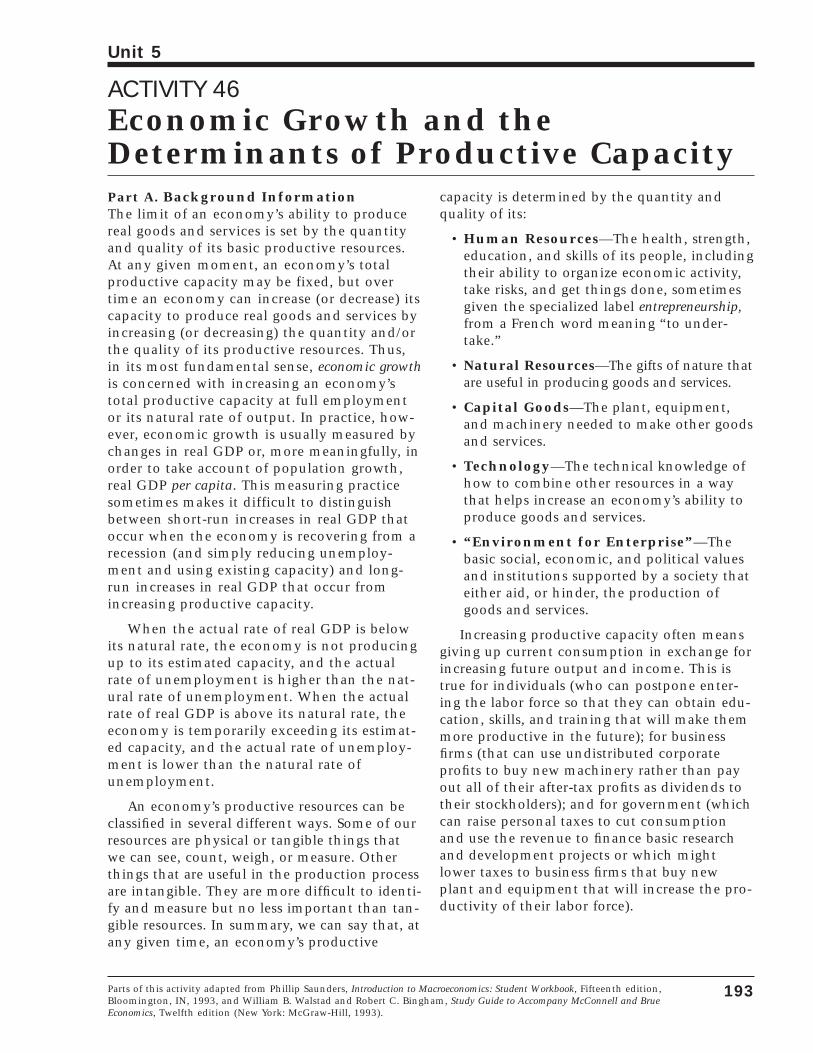
ACTIVITY 46Economic Growth and theDeterminants of Productive Capacity
193
Unit 5
Parts of this activity adapted from Phillip Saunders, Introduction to Macroeconomics: Student Workbook, Fifteenth edition,Bloomington, IN, 1993, and William B. Walstad and Robert C. Bingham, Study Guide to Accompany McConnell and BrueEconomics, Twelfth edition (New York: McGraw-Hill, 1993).
Part A. Background InformationThe limit of an economy’s ability to producereal goods and services is set by the quantityand quality of its basic productive resources.At any given moment, an economy’s totalproductive capacity may be fixed, but overtime an economy can increase (or decrease) itscapacity to produce real goods and services byincreasing (or decreasing) the quantity and/orthe quality of its productive resources. Thus,in its most fundamental sense, economic growthis concerned with increasing an economy’stotal productive capacity at full employmentor its natural rate of output. In practice, how-ever, economic growth is usually measured bychanges in real GDP or, more meaningfully, inorder to take account of population growth,real GDP per capita. This measuring practicesometimes makes it difficult to distinguishbetween short-run increases in real GDP thatoccur when the economy is recovering from arecession (and simply reducing unemploy-ment and using existing capacity) and long-run increases in real GDP that occur fromincreasing productive capacity.
When the actual rate of real GDP is belowits natural rate, the economy is not producingup to its estimated capacity, and the actualrate of unemployment is higher than the nat-ural rate of unemployment. When the actualrate of real GDP is above its natural rate, theeconomy is temporarily exceeding its estimat-ed capacity, and the actual rate of unemploy-ment is lower than the natural rate ofunemployment.
An economy’s productive resources can beclassified in several different ways. Some of ourresources are physical or tangible things thatwe can see, count, weigh, or measure. Otherthings that are useful in the production processare intangible. They are more difficult to identi-fy and measure but no less important than tan-gible resources. In summary, we can say that, atany given time, an economy’s productive
capacity is determined by the quantity andquality of its:
• Human Resources—The health, strength,education, and skills of its people, includingtheir ability to organize economic activity,take risks, and get things done, sometimesgiven the specialized label entrepreneurship,from a French word meaning “to under-take.”
• Natural Resources—The gifts of nature thatare useful in producing goods and services.
• Capital Goods—The plant, equipment,and machinery needed to make other goodsand services.
• Technology—The technical knowledge ofhow to combine other resources in a waythat helps increase an economy’s ability toproduce goods and services.
• “Environment for Enterprise”—Thebasic social, economic, and political valuesand institutions supported by a society thateither aid, or hinder, the production ofgoods and services.
Increasing productive capacity often meansgiving up current consumption in exchange forincreasing future output and income. This istrue for individuals (who can postpone enter-ing the labor force so that they can obtain edu-cation, skills, and training that will make themmore productive in the future); for businessfirms (that can use undistributed corporateprofits to buy new machinery rather than payout all of their after-tax profits as dividends totheir stockholders); and for government (whichcan raise personal taxes to cut consumptionand use the revenue to finance basic researchand development projects or which mightlower taxes to business firms that buy newplant and equipment that will increase the pro-ductivity of their labor force).

Part B. Measuring Economic Growth1. Suppose the real GDP and the population of an economy in seven different years
were those shown in the table Calculating Per Capita Real GDP.
Calculating Per Capita Real GDP
Population, Real GDP, Per capitaYear in millions in billions real GDP
1 30 $9 $3002 60 $24 ______3 90 $45 ______4 120 $66 ______5 150 $90 ______6 180 $99 ______7 210 $105 ______
a. How large would the real per capita GDP of the economy be in each of the other six years? Enter your figures in the table.
b. What was the amount of growth in real GDP between year 1 and year 2? ______
c. What was the rate of growth in real GDP between year 3 and year 4? ______
2. Given the hypothetical data in the table Calculating Average Rates of Growth, calcu-late the average annual rates of growth in real GDP and real per capita GDP overthe period given. Be sure to adjust the rate of growth for the number of years in theperiod so you get average annual rates.
Calculating Average Rates of Growth
Real GDP, Annual growth, Real GDP Annual growth,Year in billions in percent per capita in percent
1970 $2,416 ___- - - - __ $11,785 ___- - - - __
1975 $2,695 __________ $12,593 __________
1980 $3,187 __________ $13,978 __________
1985 $3,618 __________ $15,139 __________
1988 $3,995 __________ $16,240 __________
1991 $4,545 __________ $17,110 __________
194
Unit 5
ACTIVITY 46 continued
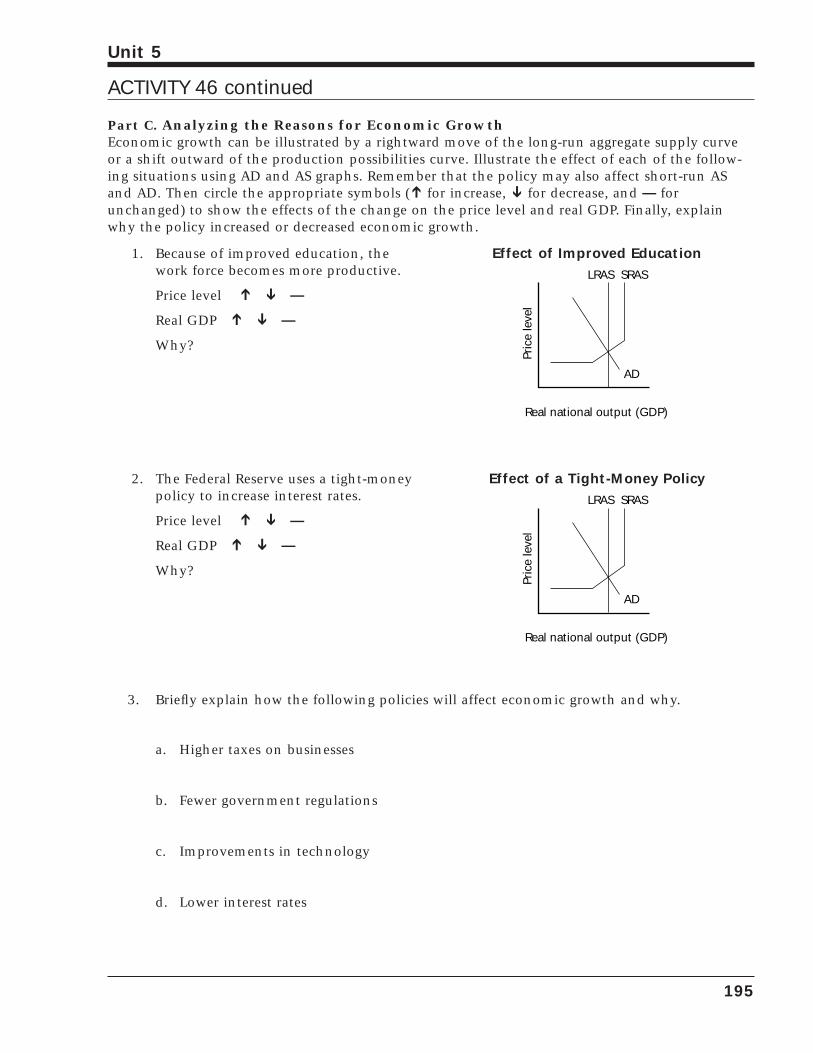
Part C. Analyzing the Reasons for Economic GrowthEconomic growth can be illustrated by a rightward move of the long-run aggregate supply curveor a shift outward of the production possibilities curve. Illustrate the effect of each of the follow-ing situations using AD and AS graphs. Remember that the policy may also affect short-run ASand AD. Then circle the appropriate symbols (Õ for increase, Ô for decrease, and — forunchanged) to show the effects of the change on the price level and real GDP. Finally, explainwhy the policy increased or decreased economic growth.
195
Unit 5
1. Because of improved education, thework force becomes more productive.
Price level Õ Ô —Real GDP Õ Ô —Why?
Effect of Improved Education
Pric
e le
vel
SRASLRAS
Real national output (GDP)
AD
2. The Federal Reserve uses a tight-moneypolicy to increase interest rates.
Price level Õ Ô —Real GDP Õ Ô —Why?
Effect of a Tight-Money Policy
Pric
e le
vel
SRASLRAS
Real national output (GDP)
AD
3. Briefly explain how the following policies will affect economic growth and why.
a. Higher taxes on businesses
b. Fewer government regulations
c. Improvements in technology
d. Lower interest rates
ACTIVITY 46 continued
e. Less savings by people who want to enjoy the good life
f. Higher productivity of labor due to improved management styles
196
Unit 5
ACTIVITY 46 continued
ACTIVITY 47The Expansion of the 1960s
197
Unit 5
* GDP is used for consistency although GNP was the measurement used in the 1960s.Activity developed by Robert Barry, College of William and Mary, Williamsburg, VA.
Someone viewing the U.S. economic terrain in1961 would have seen a relatively sluggisheconomy. Gross domestic product (GDP)* grewat an annual rate of 2.5 percent between 1953and 1961. Potential GDP grew at an annual rateof 3.5 percent during the same period. Thisshortfall of actual GDP growth relative topotential GDP growth resulted in higher unem-ployment. Unemployment, which had been 3.0percent in 1953, was 6.1 percent in 1961. Full-employment unemployment was estimated tobe 4.0 percent during this period, and unem-ployment was more than 4.0 percent from1954 to 1961. Although GDP growth was lowand unemployment was high, inflation waslow during this period. From 1953 to 1961, theConsumer Price Index (CPI) rose by only ninepercentage points (from 80.1 to 89.6), whichmeant that inflation averaged a little over onepercent a year. During this period the federalgovernment’s budget showed a deficit moreoften than not, particularly in recession years,and in 1961 the deficit was $4 billion.
John Kennedy was elected President of theUnited States in 1960. His administration estab-lished the following goals for the economy: (1)more rapid growth in actual GDP in order toreduce unemployment; (2) more rapid growthin potential GDP; and (3) continued low infla-tion. The public debate about whether thesegoals were appropriate and about what policieswould be most appropriate to achieve thesegoals raised some interesting questions. Wasachieving more rapid growth in GDP consistent
with maintaining low inflation? If more rapidgrowth was desirable, what combination ofmonetary and fiscal policies would best achieveit, and to the extent that fiscal policy was used,should it be primarily in the form of tax cuts orexpenditure increases? Some felt that monetarypolicy was not sufficiently potent to achievethe desired increase in growth, and an expan-sionary monetary policy would hurt our bal-ance-of-payments deficit. Others said that anexpansionary monetary policy was the best wayto achieve an increase in growth of potentialGDP, and we couldn’t afford to pursue anexpansionary fiscal policy when we had a bud-get deficit. A response to this last argument wasthat we had a deficit because we had slowgrowth so that faster growth would reduce thedeficit, and balancing the budget was an old-fashioned idea. Concerning the debate abouttax cuts versus expenditure increases, some feltthat we needed the additional public expendi-tures, while others opposed the growth of pub-lic expenditures as a percentage of our GDP.
Although the policy debate started in 1961, amajor policy action was not taken until 1964.Unemployment was lower in 1964 than it hadbeen in 1961, but at 5.5 percent it was still rela-tively high. In 1964 personal income taxes werecut by 20 percent and corporate taxes by 8.0percent. The economy did expand in responseto these measures; unemployment fell to 4.4percent in 1965 and 3.7 percent in 1966, and,as the economy expanded, the Federal Reserveacted to keep the interest rate from rising.
Answer the following questions on a separate sheet of paper.
1. Explain the distinction between growth in actual GDP and growth in potentialGDP. If actual GDP grows more slowly than potential GDP, why does unemploy-ment rise?
2. Were the goals outlined by the Kennedy administration appropriate ones for aneconomy to achieve? Explain.
3. Was the concern that more rapid growth in GDP would cause a problem with infla-tion justified? Use both an aggregate demand and aggregate supply diagram and aPhillips curve to illustrate your answer.
4. Why would the tax cut enacted in 1964 have caused the interest rate to rise with-out Federal Reserve action? What would the Federal Reserve have had to do to keepthe interest rate from rising? Explain and show this with an appropriate graph.
5. Use a total expenditure/45° diagram and an AD/AS diagram to show the effect ofthe tax cut with and without the Fed’s actions to keep the interest rate from rising.
6. What would be the effect of the corporate profits tax cut on investment? Why?What would be the effect of the Fed’s interest rate policy on investment? Why?
7. Why would someone argue that the government’s budget was in deficit because theeconomy was operating below its potential? Is there a conflict between a balanced-budget goal and the goal of achieving full employment with fiscal policy? Explain.
198
Unit 5
ACTIVITY 47 continued
ACTIVITY 48The Inflation of the 1970s
199
Unit 5
Activity developed by Robert Barry, College of William and Mary, Williamsburg, VA.
By 1966, the expansionary policies initiated in1964 had taken the economy below 4 percentunemployment, and unemployment remainedbelow 4 percent until 1970. Using unemploy-ment to gauge when the economy is operatingat potential is a bit tricky. In the early 1960s, 4 percent unemployment was probably full-employment unemployment. By the end of the1960s, full-employment unemployment wasprobably in the range of 4.5–5 percent, and, by the mid 1970s, it was probably close to 5.5percent. Inflation, which had averaged 1.3 per-cent from 1961 through 1965, jumped to 3.4percent in 1966 and continued to rise until itwas 6.1 percent in 1969.
In 1969, taxes were raised and the FederalReserve tightened monetary policy.
Unemployment rose to a peak of 5.8 percent in1971. The lowest rate of unemployment wewere able to achieve in the 1970s was 4.8 per-cent in 1973. Otherwise, the unemploymentrate was never below 5.5 percent and was ashigh as 8.3 percent in 1975. From 1970 to1982, the average rate of unemployment was6.3 percent, yet during the same period infla-tion averaged 8 percent. The recession that wasengineered in reaction to the 6 percent rate ofinflation in 1969 brought inflation down to 3.5percent in 1971, but inflation didn’t stay down.World food prices rose sharply in 1973 as aresult of major crop failures. OPEC raised theworld price of oil sharply in 1974, and prob-lems in Iran caused oil prices to increase signifi-cantly again in 1979.
Answer the following questions on a separate sheet of paper.
1. What would cause the amount of unemployment at full employment to change?
2. Use an aggregate demand and supply (AD/AS) diagram to show the following:
a. The cause of inflation in the late 1960s.
b. The effect on inflation of the food and oil price increases in 1973, 1974, and1979.
3. Use an AD/AS diagram to show the appropriate policy response to the oil priceincreases in the following instances:
a. If unemployment were the main concern of policymakers.
b. If inflation were the main concern of policymakers.
c. If inflation and unemployment were of equal concern.
4. Show the rising inflation of the late 1960s on a Phillips curve. Then show the effectof the food and oil price increases on the Phillips curve. How would the continuinghigh inflation of the 1970s have affected the Phillips curve? Explain.
5. a. It has been argued that the main cause of inflation during this period (and ofhigh inflation at any time) was a high growth rate of the money supply. It is truethat from 1960 to 1966 money growth averaged 3 percent and averaged 6.3 per-cent from 1967 to 1982. Use a Phillips curve to show what would have happenedto inflation and unemployment if money growth had been reduced at any timeduring the 1970s. Given that unemployment was averaging more than 6 percent,does that suggest any idea about why money growth wasn’t reduced?

b. As the inflation continued into the 1970s, it was argued that for a reduction inmoney growth to be fully effective in bringing down inflation, the Federal Reservewould need to convince people that it was serious about reducing money growthand would stick with the lower money growth until inflation was brought down.Why would it be important for the Fed to establish this credibility?
200
Unit 5
ACTIVITY 48 continued
ACTIVITY 49Supply-Side Economics, BudgetDeficits, and Tax Changes
201
Unit 5
When Ronald Reagan took office in January1981, inflation was high (12.4 percent in 1980),and unemployment was high (7 percent in1980). President Reagan argued that we needed anew approach to our economic problems.Because the new approach called for us tochange our focus from the effect tax cuts had ondemand to the effect tax cuts had on supply, thenew approach was labeled supply-side economics.The argument of supply-side economics was thatif the marginal tax rate on income from wages,interest, and profits were reduced, it would stim-ulate work efforts, savings, and investment sothat we would have both an increase in employ-ment and a decrease in inflation. Taxes were cutin 1982, but the Federal Reserve simultaneouslypursued a very contractionary monetary policy.The Fed’s contractionary monetary policy wasstronger than the expansionary fiscal policy, sothe economy experienced a severe recession.Unemployment was 9.5 percent in both 1982and 1983, and it was not until 1985 that unem-ployment returned to its 1980 level of 7 percent.With some help from falling oil prices, thissevere and prolonged recession did bring downinflation; measured by the CPI, inflation was lessthan percent in 1986. When Reagan left office in1988, the unemployment rate was 5.5 percent,and the rate of inflation was 4.4 percent. In1988, real GDP increased by 3.9 percent, risingfor the sixth straight year.
With inflation at a more reasonable level, thefederal budget deficit became the focus of eco-nomic policy. In 1981, the budget deficit was $74billion but rose to over $221 billion by 1986.Some taxes were raised as part of the tax reformpackage in 1986, and by 1989 the budget deficitwas down to $152 billion. By 1990, however, thebudget deficit had grown again to $221 billion.This prompted President George Bush and theDemocratic Congress to raise taxes in 1990.
After eight consecutive years of growth, theeconomy hit the skids. In 1992, real GDPdecreased 1.2 percent; the unemployment rateincreased from 5.5 percent in 1990 to 7.4 per-cent; and the budget deficit rose to $290 bil-lion. Only inflation stayed low, at about 3percent. Low inflation was not good enough.The voters replaced Bush with Bill Clinton.
President Clinton and the Congressincreased taxes and reduced the growth of fed-eral expenditures. By 1994, the budget deficitstood at $234 billion; unemployment had fall-en to 6.1 percent; and real GDP was rising atabout a 4 percent annual rate. Nevertheless, thevoters elected a Republican majority in theHouse of Representatives and the Senate in1994. People wondered, in 1996, wouldClinton join Bush as a one-term President?Would the state of the economy or other issuesdecide the election of 1996?
Answer these questions on a separate sheet of paper.
1. Use an AD/AS diagram to explain the supply-side argument that tax cuts wouldincrease employment and reduce inflation.
2. Explain how an expansionary fiscal policy combined with a contractionary mone-tary policy affects the interest rate. Does this help to explain the argument that thecurrent budget deficit hurts investment and growth? Explain.
3. a. If we consistently use fiscal policy to get the economy out of a recession andmonetary policy to cool the economy down when inflation becomes a problem,what happens to the interest rate over time? to the budget deficit? to growth inpotential output? Explain.
b. Does this make the discipline of a balanced budget more meaningful? Explain.
4. How would a Keynesian explain why the tax increase in 1990 would result in lowerreal GDP, higher unemployment, and a lower rate of inflation? Use an AD/AS dia-gram to illustrate this.
5. Harvard economist Robert Barro believes that President Bush was responsible forthe poor economic performance in the latter half of his administration. Accordingto Barro*:
Free-market policies worked well in the United States in the 1980sand in other places at various times, so we apparently have decidedto try something else.... Bush raised taxes and spending, increasedthe minimum wage rate and unemployment-insurance benefits,intensified the enforcement of regulations, and enacted an array ofnew intrusions in the form of the Americans-with-Disabilities Act,the Clean Air Act, and the Civil Rights Act.
a. Is this a supply-side or a demand-side argument? Explain your answer.
b. Illustrate this with an AD/AS diagram.
c. Barro writes that inflation didn’t increase because of “a monetary policythat remained committed to low inflation.”* What would this monetarypolicy have to be in order to keep inflation low? Would it be a tight moneyor easy money policy?
6. a. Did President Clinton’s policies work? Why or why not?
b. At the time you are reading this, what are the growth rate in real GDP, theunemployment rate, and the inflation rate?
202
Unit 5
*Robert J. Barro, “Issue: Clinton’s First-Year Economic Report Card,” The Senior Economist, Vol. 9, No. 4, Apr. 1994, p. 8.
ACTIVITY 49 continued
ACTIVITY 50Analyzing Short-Run and Long-Run Effects of Monetary and Fiscal PoliciesYou have 25 minutes to answer the following questions. It is suggested that you take a few minutes to plan and outline your answer. Be sure to justify the assumptions on which you basedyour answer. It is not enough to list the outcomes of proposed policies or actions. You shouldemphasize the process by which these outcomes are achieved. Also, be sure to include diagrams in explaining your answer. All diagrams should be clearly labeled.
1. Suppose the following statements describe the current state of the U.S. economy.
a. The annual growth rate of real Gross Domestic Product (GDP) is 5 percent.
b. The unemployment rate is 6 percent.
c. The Consumer Price Index (CPI) is rising at 9.5 percent annually.
2. Indicate which macroeconomic goals of the economy are being met and which are not.
3. Suppose the government pursues a new policy package that includes substantial taxcuts, an increase in government spending, and a decrease in the growth of themoney supply.
a. Assess whether these policies will help the economy meet the goals you outlined.
b. Explain in detail how and why each of these policies, alone and in combi-nation, causes changes in:
(1) Output.(2) The price level.(3) Employment.(4) Economic growth.
203
Unit 5
Adapted from Advanced Placement Course Description, Economics: Microeconomics, Macroeconomics (New York: CollegeBoard, 1988).

204
Unit 5
ACTIVITY 51Why Economists DisagreePart A. Understanding Reasons That Economists Disagree
205
Unit 5
From Master Curriculum Guide in Economics: Teaching Strategies for High School Economics Courses (New York: National Councilon Economic Education, 1985), p.158.
It is not unusual to find “experts” disagreeingwith each other. Experts disagree over all sortsof matters—nuclear power, environmental pro-tection, and who will win the Super Bowl. Whydo experts disagree? How can the average per-son make sense out of the differing viewpointsand recommendations? Here are several impor-tant factors that often lead economists to dif-ferent conclusions.
1. Different Time PeriodsOne economist might state that the present
policy of the government will lead to inflation.Another might disagree. Both could be right ifthey are talking about the effects of the policyon inflation at different times, for example, sixmonths from now as compared to two yearsfrom now.
2. Different AssumptionsBecause an economy is a complex system, it
is often hard to predict the effects of a particu-lar policy or event. Therefore, in order to beable to make predictions, economists usuallymust hold certain assumptions (or beliefs). Buteconomists often differ in their assumptions.For example, one economist might assume (orbelieve) that the federal budget deficit willbecome larger next year; another might not.These different assumptions could be the resultof how much economic growth—and tax rev-enues and government spending—they assume(or believe) will take place.
3. Different Economic TheoriesEconomists agree on many matters, such as,
“If the price of beef goes up and nothing elsechanges, people will buy less beef.” That is aprediction with which nearly all economistswould agree because it rests on the generallyaccepted law of demand. However, economistshave yet to settle a number of important questions, especially those concerning macro-economics. Macroeconomics deals with thebehavior of the economy as a whole or largesubdivisions of it, and how to influence thatbehavior. Economists have several different the-
ories or explanations about what influencesmacroeconomic behavior. Until these theoriesare reconciled or until one of them is widelyagreed on as best, economists will disagree onmacroeconomic questions because they areusing different theories. The same applies tocertain microeconomic questions.Microeconomics concerns specific units or partsof an economic system, such as firms, indus-tries, households, and the relations amongthese units.
4. Different ValuesEconomics is concerned with explaining
what is happening in the economy. It is alsoconcerned with predictions. The economistshould be able to say to the President or toCongress, “If you follow Policy One, then X, Y,and Z will happen. If you follow Policy Two,then Q, R, and S will happen. Pick the policygiving the results you like better.” In practice,such statements by economists often containmore than analysis and the prediction ofresults. Their statements often recommendpolicies they like because the results agree withtheir own values, i.e., the results they prefer.For example, some economists will recommendPolicy One because X, Y, and Z will happen andthey favor achieving X, Y, and Z. Other econo-mists will recommend Policy Two because theyfavor achieving results Q, R, and S. Such dis-agreements are basically about which outcomesare preferred by the economists. The economicpolicies recommended are determined by thepreferred outcomes.
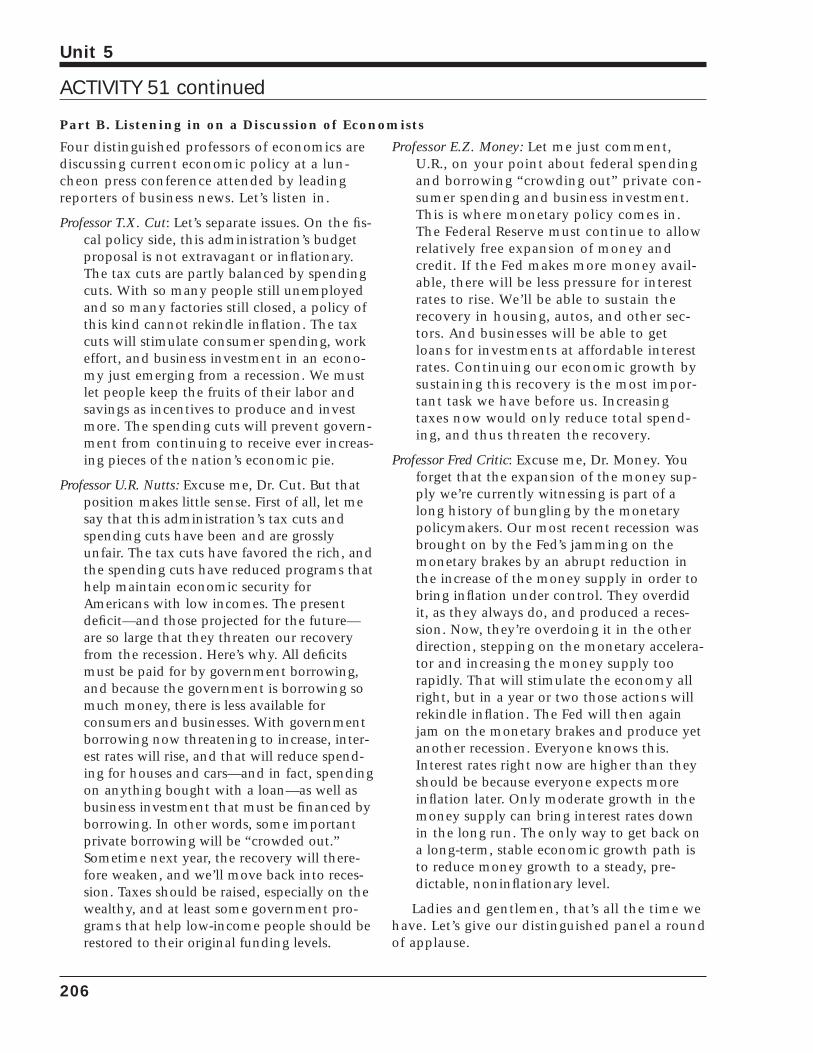
Four distinguished professors of economics arediscussing current economic policy at a lun-cheon press conference attended by leadingreporters of business news. Let’s listen in.
Professor T.X. Cut: Let’s separate issues. On the fis-cal policy side, this administration’s budgetproposal is not extravagant or inflationary.The tax cuts are partly balanced by spendingcuts. With so many people still unemployedand so many factories still closed, a policy ofthis kind cannot rekindle inflation. The taxcuts will stimulate consumer spending, workeffort, and business investment in an econo-my just emerging from a recession. We mustlet people keep the fruits of their labor andsavings as incentives to produce and investmore. The spending cuts will prevent govern-ment from continuing to receive ever increas-ing pieces of the nation’s economic pie.
Professor U.R. Nutts: Excuse me, Dr. Cut. But thatposition makes little sense. First of all, let mesay that this administration’s tax cuts andspending cuts have been and are grosslyunfair. The tax cuts have favored the rich, andthe spending cuts have reduced programs thathelp maintain economic security forAmericans with low incomes. The presentdeficit—and those projected for the future—are so large that they threaten our recoveryfrom the recession. Here’s why. All deficitsmust be paid for by government borrowing,and because the government is borrowing somuch money, there is less available for consumers and businesses. With governmentborrowing now threatening to increase, inter-est rates will rise, and that will reduce spend-ing for houses and cars—and in fact, spendingon anything bought with a loan—as well asbusiness investment that must be financed byborrowing. In other words, some importantprivate borrowing will be “crowded out.”Sometime next year, the recovery will there-fore weaken, and we’ll move back into reces-sion. Taxes should be raised, especially on thewealthy, and at least some government pro-grams that help low-income people should berestored to their original funding levels.
Professor E.Z. Money: Let me just comment,U.R., on your point about federal spendingand borrowing “crowding out” private con-sumer spending and business investment.This is where monetary policy comes in.The Federal Reserve must continue to allowrelatively free expansion of money andcredit. If the Fed makes more money avail-able, there will be less pressure for interestrates to rise. We’ll be able to sustain therecovery in housing, autos, and other sec-tors. And businesses will be able to getloans for investments at affordable interestrates. Continuing our economic growth bysustaining this recovery is the most impor-tant task we have before us. Increasingtaxes now would only reduce total spend-ing, and thus threaten the recovery.
Professor Fred Critic: Excuse me, Dr. Money. Youforget that the expansion of the money sup-ply we’re currently witnessing is part of along history of bungling by the monetarypolicymakers. Our most recent recession wasbrought on by the Fed’s jamming on themonetary brakes by an abrupt reduction inthe increase of the money supply in order tobring inflation under control. They overdidit, as they always do, and produced a reces-sion. Now, they’re overdoing it in the otherdirection, stepping on the monetary accelera-tor and increasing the money supply toorapidly. That will stimulate the economy allright, but in a year or two those actions willrekindle inflation. The Fed will then againjam on the monetary brakes and produce yetanother recession. Everyone knows this.Interest rates right now are higher than theyshould be because everyone expects moreinflation later. Only moderate growth in themoney supply can bring interest rates downin the long run. The only way to get back ona long-term, stable economic growth path isto reduce money growth to a steady, pre-dictable, noninflationary level.
Ladies and gentlemen, that’s all the time wehave. Let’s give our distinguished panel a roundof applause.
206
Unit 5
ACTIVITY 51 continued
Part B. Listening in on a Discussion of Economists
Economists disagree for the following reasons:
1. Because they use different time periods.2. Because they make different assumptions.3. Because they have different theories about how the economy works.4. Because they have different values and ideas about which economic goals are most
important.
Now analyze each professor’s comments in Part B, using the following format:
Name of professor: __________________________________________________________________
Major point:_________________________________________________________________________
_____________________________________________________________________________________
Time period: ________________________________________________________________________
Assumptions: ________________________________________________________________________
_____________________________________________________________________________________
Theoretical Support: _________________________________________________________________
_____________________________________________________________________________________
_____________________________________________________________________________________
_____________________________________________________________________________________
Values: ______________________________________________________________________________
_____________________________________________________________________________________
_____________________________________________________________________________________
_____________________________________________________________________________________
207
Unit 5
ACTIVITY 51 continued
Name of professor: __________________________________________________________________
Major point:_________________________________________________________________________
_____________________________________________________________________________________
Time period: ________________________________________________________________________
Assumptions: ________________________________________________________________________
_____________________________________________________________________________________
Theoretical Support: _________________________________________________________________
_____________________________________________________________________________________
_____________________________________________________________________________________
_____________________________________________________________________________________
Values: ______________________________________________________________________________
_____________________________________________________________________________________
_____________________________________________________________________________________
_____________________________________________________________________________________
208
Unit 5
ACTIVITY 51 continued
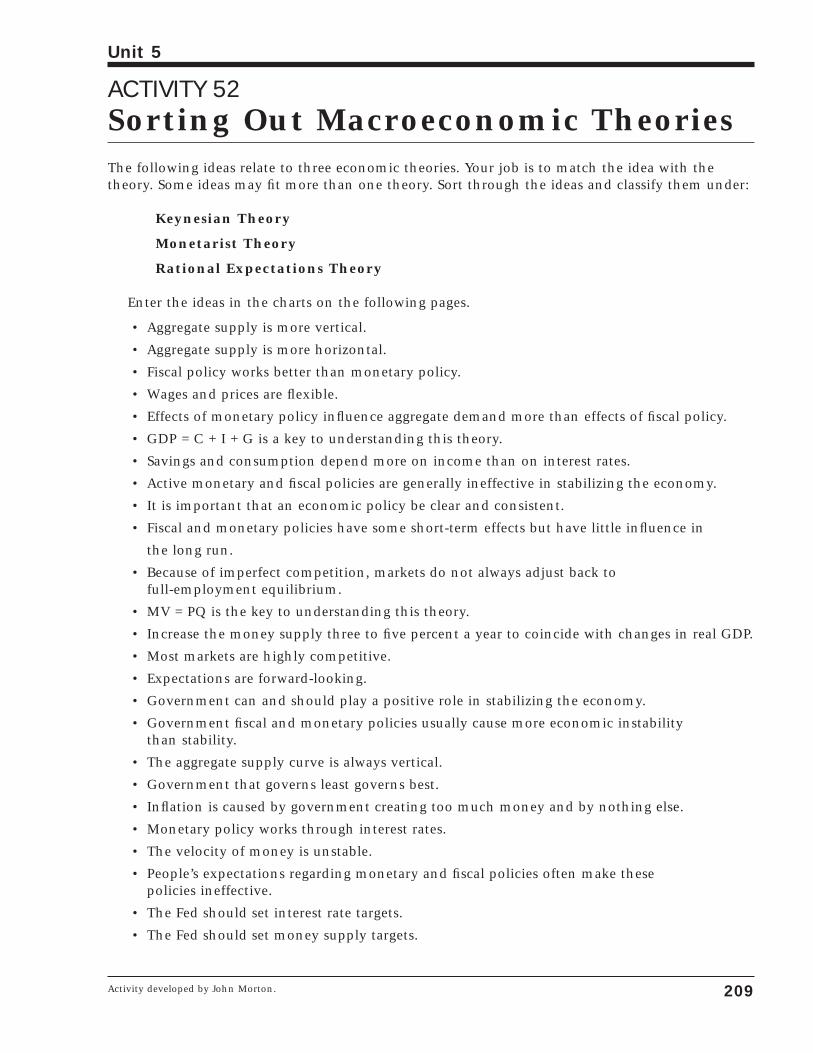
ACTIVITY 52Sorting Out Macroeconomic TheoriesThe following ideas relate to three economic theories. Your job is to match the idea with the theory. Some ideas may fit more than one theory. Sort through the ideas and classify them under:
Keynesian Theory
Monetarist Theory
Rational Expectations Theory
Enter the ideas in the charts on the following pages.
• Aggregate supply is more vertical.
• Aggregate supply is more horizontal.
• Fiscal policy works better than monetary policy.
• Wages and prices are flexible.
• Effects of monetary policy influence aggregate demand more than effects of fiscal policy.
• GDP = C + I + G is a key to understanding this theory.
• Savings and consumption depend more on income than on interest rates.
• Active monetary and fiscal policies are generally ineffective in stabilizing the economy.
• It is important that an economic policy be clear and consistent.
• Fiscal and monetary policies have some short-term effects but have little influence in
the long run.
• Because of imperfect competition, markets do not always adjust back to full-employment equilibrium.
• MV = PQ is the key to understanding this theory.
• Increase the money supply three to five percent a year to coincide with changes in real GDP.
• Most markets are highly competitive.
• Expectations are forward-looking.
• Government can and should play a positive role in stabilizing the economy.
• Government fiscal and monetary policies usually cause more economic instability than stability.
• The aggregate supply curve is always vertical.
• Government that governs least governs best.
• Inflation is caused by government creating too much money and by nothing else.
• Monetary policy works through interest rates.
• The velocity of money is unstable.
• People’s expectations regarding monetary and fiscal policies often make these policies ineffective.
• The Fed should set interest rate targets.
• The Fed should set money supply targets.
209
Unit 5
Activity developed by John Morton.
Keynesian Theory
1. ________________________________________________________________________________
2. ________________________________________________________________________________
3. ________________________________________________________________________________
4. ________________________________________________________________________________
5. ________________________________________________________________________________
6. ________________________________________________________________________________
7. ________________________________________________________________________________
8. ________________________________________________________________________________
9. ________________________________________________________________________________
Monetarist Theory
1. ________________________________________________________________________________
2. ________________________________________________________________________________
3. ________________________________________________________________________________
4. ________________________________________________________________________________
5. ________________________________________________________________________________
6. ________________________________________________________________________________
7. ________________________________________________________________________________
8. ________________________________________________________________________________
9. ________________________________________________________________________________
10. ________________________________________________________________________________
11. ________________________________________________________________________________
12. ________________________________________________________________________________
13. ________________________________________________________________________________
210
Unit 5
ACTIVITY 52 continued
Rational Expectations Theory
1. ________________________________________________________________________________
2. ________________________________________________________________________________
3. ________________________________________________________________________________
4. ________________________________________________________________________________
5. ________________________________________________________________________________
6. ________________________________________________________________________________
7. ________________________________________________________________________________
8. ________________________________________________________________________________
9. ________________________________________________________________________________
211
Unit 5
ACTIVITY 52 continued

212
Unit 5
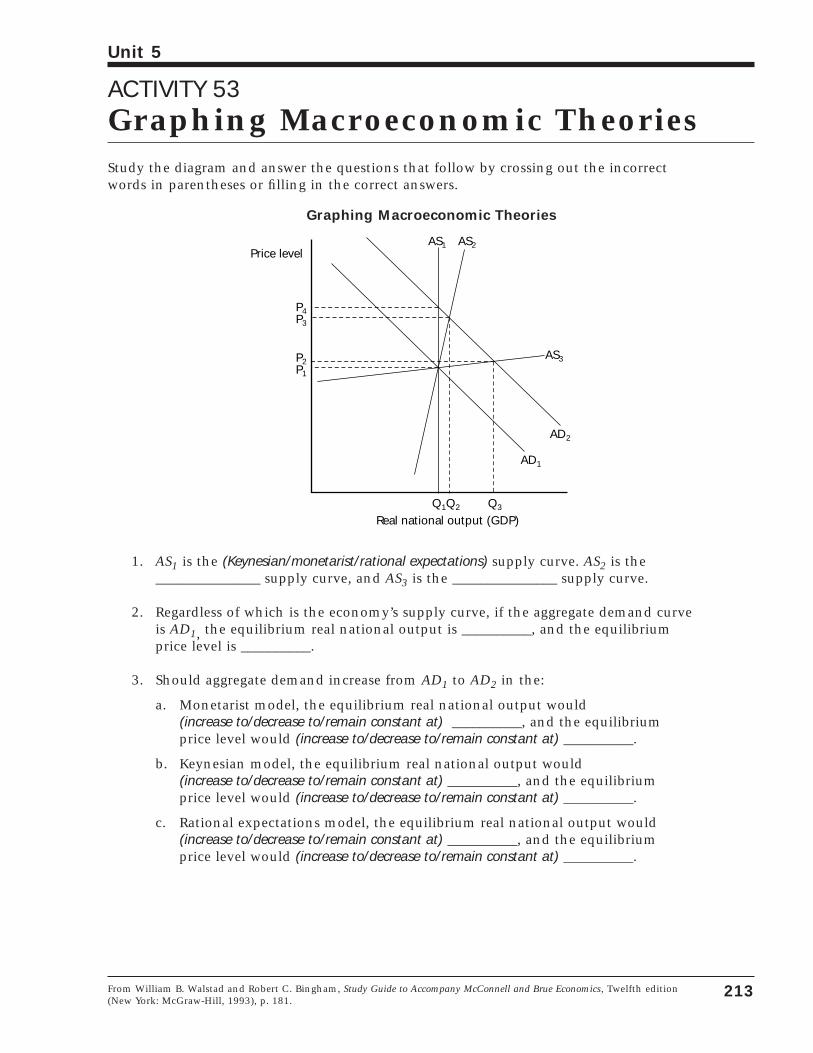
ACTIVITY 53Graphing Macroeconomic TheoriesStudy the diagram and answer the questions that follow by crossing out the incorrect words in parentheses or filling in the correct answers.
Graphing Macroeconomic Theories
1. AS1 is the (Keynesian/monetarist/rational expectations) supply curve. AS2 is the_______________ supply curve, and AS3 is the _______________ supply curve.
2. Regardless of which is the economy’s supply curve, if the aggregate demand curveis AD1, the equilibrium real national output is __________, and the equilibriumprice level is __________.
3. Should aggregate demand increase from AD1 to AD2 in the:
a. Monetarist model, the equilibrium real national output would (increase to/decrease to/remain constant at) __________, and the equilibriumprice level would (increase to/decrease to/remain constant at) __________.
b. Keynesian model, the equilibrium real national output would (increase to/decrease to/remain constant at) __________, and the equilibriumprice level would (increase to/decrease to/remain constant at) __________.
c. Rational expectations model, the equilibrium real national output would(increase to/decrease to/remain constant at) __________, and the equilibriumprice level would (increase to/decrease to/remain constant at) __________.
Price levelAS1
P4P3
P2P1
AS2
AS3
AD2
AD1
Q1Q2 Q3
Real national output (GDP)
213
Unit 5
From William B. Walstad and Robert C. Bingham, Study Guide to Accompany McConnell and Brue Economics, Twelfth edition(New York: McGraw-Hill, 1993), p. 181.

214
Unit 5
ACTIVITY 54What Should the President Do?
215
Unit 5
Activity developed by Elaine Schwartz, Kent Place School, Summit, NJ.
The date is January 1982. The place is theWhite House. Assembled around a large tableare the best economic minds in the nation.Called only days earlier, the economists hadcanceled all other obligations at the President’srequest in order to offer their advice.
Indeed, wise counsel was what the Presidentsought because the nation was in the midst ofa recession.
1. The GDP was currently falling at a 5.2 percentannual rate. The year 1981 had been one ofthe worst years ever for the auto industry; fac-tories had operated at 74.9 percent of capacityduring the month of December; and invento-ry levels of unsold goods were building.
2. Unemployment was at 8.4 percent inDecember.
3. Inflation was still close to 9 percent,although it had dropped during the pasttwo years.
4. Interest rates were high with the primeclose to 16 percent.
5. The budget deficit was steadily rising inspite of presidential promises of a balancedbudget, and 10 percent of the budget wasnecessary to cover interest charges on thefederal debt.
6. The Federal Reserve was pursuing a tightmoney policy.
7. The President and the Congress had agreedto cut taxes by 25 percent over a three-yearperiod.
At the moment, the President wants toknow what to do next. What should the majorthrust of his policy be? Seated around this tableare monetarists, Keynesians, supply-siders, andthose who support the rational expectationspoint of view. The greatest economic minds ofeach persuasion are gathered together.... Andyou are there.
1. Write an outline of a five-minute speech (two-three pages) recommending a policythat concentrates on employment, the inflation rate, and the rate of economicgrowth.
2. In this speech, be sure to indicate whether your policies are based on the classical,Keynesian, monetarist, supply-side, or rational expectations model. You may beflexible and combine parts of each model.
3. In your speech, illustrate the effect of your policies, using aggregate supply anddemand graphs. You will use this neat diagram to show your audience.
4. In your speech, be sure to explain fully the effects of your policy on employment,the inflation rate, interest rates, and the rate of economic growth. Good luck!

216
Unit 5
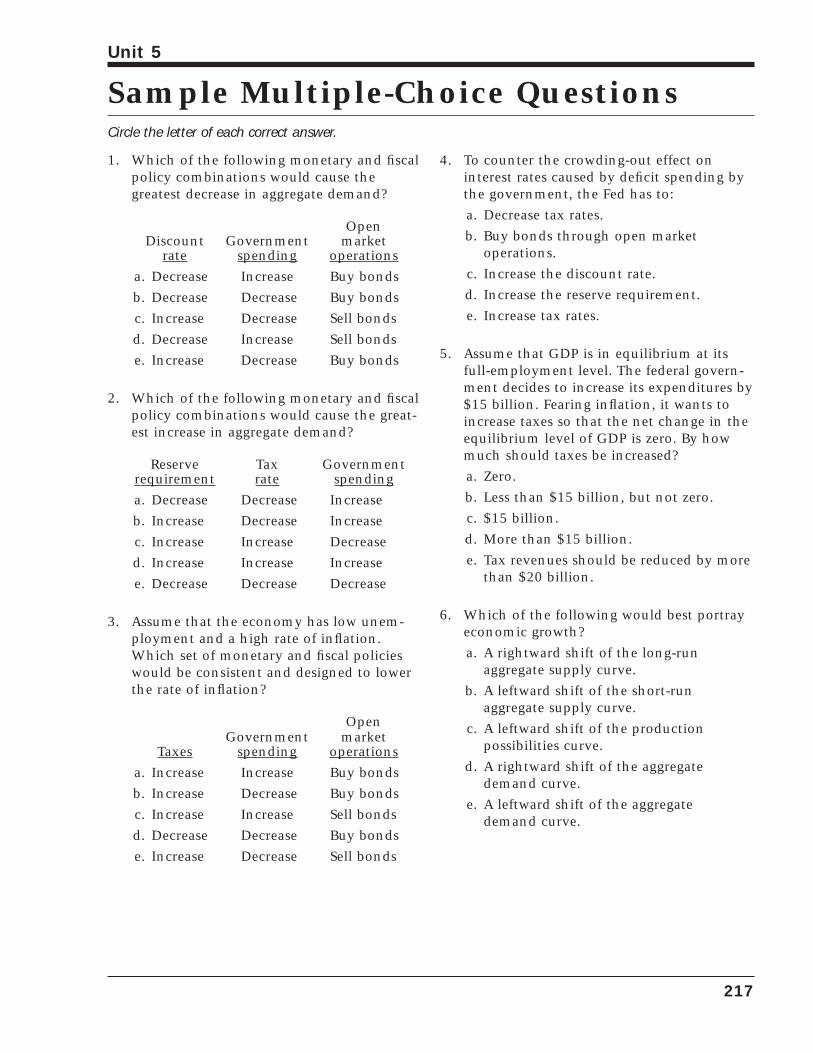
Sample Multiple-Choice QuestionsCircle the letter of each correct answer.
217
Unit 5
1. Which of the following monetary and fiscalpolicy combinations would cause the greatest decrease in aggregate demand?
Open Discount Government market
rate spending operations
a. Decrease Increase Buy bonds
b. Decrease Decrease Buy bonds
c. Increase Decrease Sell bonds
d. Decrease Increase Sell bonds
e. Increase Decrease Buy bonds
2. Which of the following monetary and fiscalpolicy combinations would cause the great-est increase in aggregate demand?
Reserve Tax Governmentrequirement rate spending
a. Decrease Decrease Increase
b. Increase Decrease Increase
c. Increase Increase Decrease
d. Increase Increase Increase
e. Decrease Decrease Decrease
3. Assume that the economy has low unem-ployment and a high rate of inflation.Which set of monetary and fiscal policieswould be consistent and designed to lowerthe rate of inflation?
Open Government market
Taxes spending operations
a. Increase Increase Buy bonds
b. Increase Decrease Buy bonds
c. Increase Increase Sell bonds
d. Decrease Decrease Buy bonds
e. Increase Decrease Sell bonds
4. To counter the crowding-out effect on interest rates caused by deficit spending bythe government, the Fed has to:
a. Decrease tax rates.
b. Buy bonds through open market operations.
c. Increase the discount rate.
d. Increase the reserve requirement.
e. Increase tax rates.
5. Assume that GDP is in equilibrium at itsfull-employment level. The federal govern-ment decides to increase its expenditures by$15 billion. Fearing inflation, it wants toincrease taxes so that the net change in theequilibrium level of GDP is zero. By howmuch should taxes be increased?
a. Zero.
b. Less than $15 billion, but not zero.
c. $15 billion.
d. More than $15 billion.
e. Tax revenues should be reduced by morethan $20 billion.
6. Which of the following would best portrayeconomic growth?
a. A rightward shift of the long-run aggregate supply curve.
b. A leftward shift of the short-run aggregate supply curve.
c. A leftward shift of the production possibilities curve.
d. A rightward shift of the aggregatedemand curve.
e. A leftward shift of the aggregate demand curve.
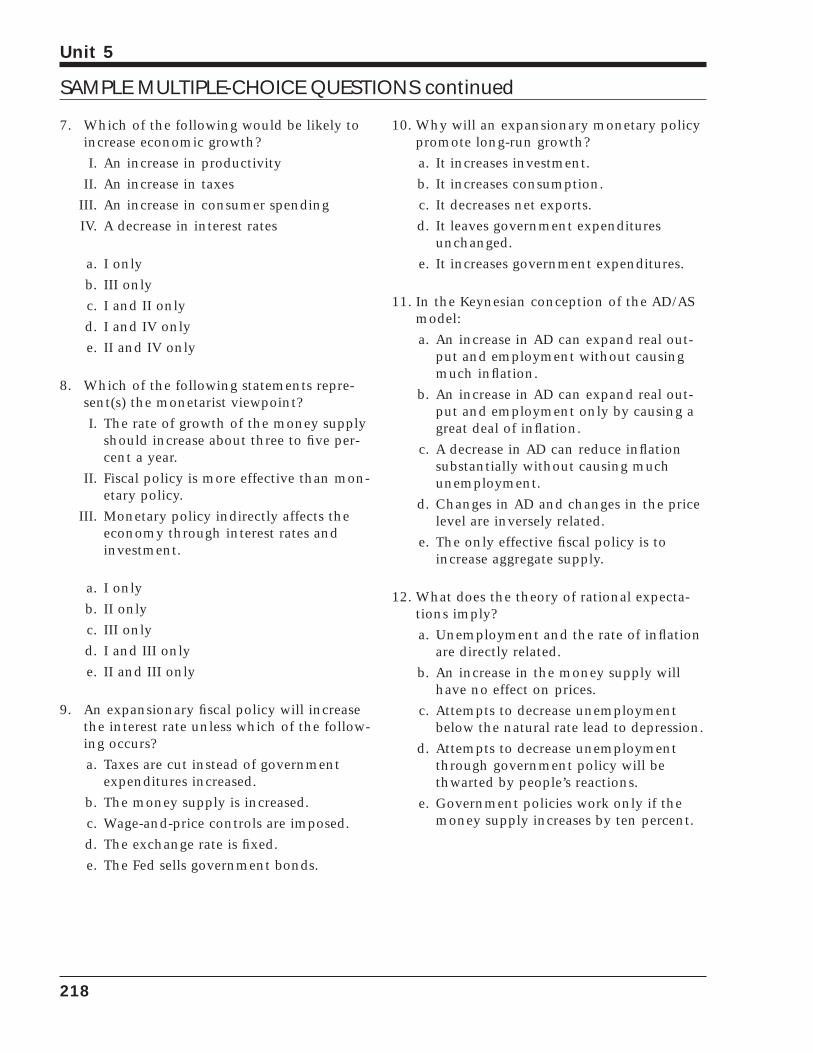
7. Which of the following would be likely toincrease economic growth?
I. An increase in productivity
II. An increase in taxes
III. An increase in consumer spending
IV. A decrease in interest rates
a. I only
b. III only
c. I and II only
d. I and IV only
e. II and IV only
8. Which of the following statements repre-sent(s) the monetarist viewpoint?
I. The rate of growth of the money supplyshould increase about three to five per-cent a year.
II. Fiscal policy is more effective than mon-etary policy.
III. Monetary policy indirectly affects theeconomy through interest rates andinvestment.
a. I only
b. II only
c. III only
d. I and III only
e. II and III only
9. An expansionary fiscal policy will increasethe interest rate unless which of the follow-ing occurs?
a. Taxes are cut instead of governmentexpenditures increased.
b. The money supply is increased.
c. Wage-and-price controls are imposed.
d. The exchange rate is fixed.
e. The Fed sells government bonds.
10. Why will an expansionary monetary policypromote long-run growth?
a. It increases investment.
b. It increases consumption.
c. It decreases net exports.
d. It leaves government expendituresunchanged.
e. It increases government expenditures.
11. In the Keynesian conception of the AD/ASmodel:
a. An increase in AD can expand real out-put and employment without causingmuch inflation.
b. An increase in AD can expand real out-put and employment only by causing agreat deal of inflation.
c. A decrease in AD can reduce inflationsubstantially without causing muchunemployment.
d. Changes in AD and changes in the pricelevel are inversely related.
e. The only effective fiscal policy is toincrease aggregate supply.
12. What does the theory of rational expecta-tions imply?
a. Unemployment and the rate of inflationare directly related.
b. An increase in the money supply willhave no effect on prices.
c. Attempts to decrease unemploymentbelow the natural rate lead to depression.
d. Attempts to decrease unemploymentthrough government policy will bethwarted by people’s reactions.
e. Government policies work only if themoney supply increases by ten percent.
218
Unit 5
SAMPLE MULTIPLE-CHOICE QUESTIONS continued
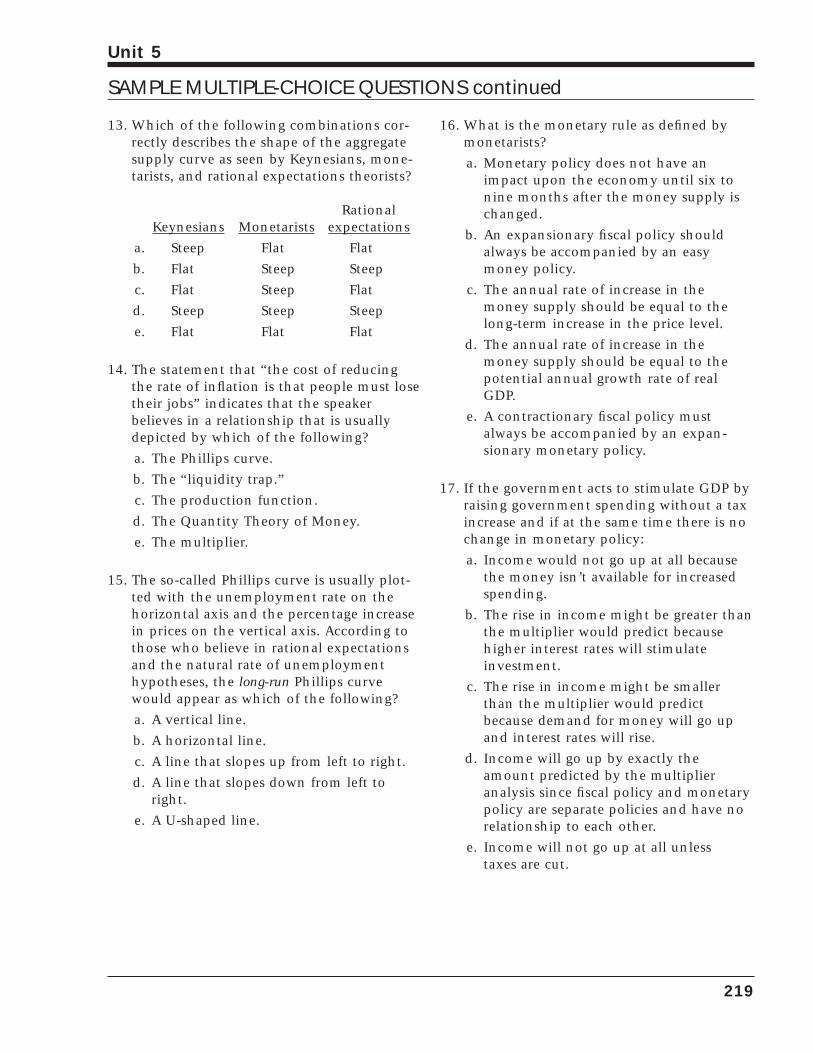
13. Which of the following combinations cor-rectly describes the shape of the aggregatesupply curve as seen by Keynesians, mone-tarists, and rational expectations theorists?
RationalKeynesians Monetarists expectations
a. Steep Flat Flat
b. Flat Steep Steep
c. Flat Steep Flat
d. Steep Steep Steep
e. Flat Flat Flat
14. The statement that “the cost of reducingthe rate of inflation is that people must losetheir jobs” indicates that the speakerbelieves in a relationship that is usuallydepicted by which of the following?
a. The Phillips curve.
b. The “liquidity trap.”
c. The production function.
d. The Quantity Theory of Money.
e. The multiplier.
15. The so-called Phillips curve is usually plot-ted with the unemployment rate on thehorizontal axis and the percentage increasein prices on the vertical axis. According tothose who believe in rational expectationsand the natural rate of unemploymenthypotheses, the long-run Phillips curvewould appear as which of the following?
a. A vertical line.
b. A horizontal line.
c. A line that slopes up from left to right.
d. A line that slopes down from left toright.
e. A U-shaped line.
16. What is the monetary rule as defined bymonetarists?
a. Monetary policy does not have animpact upon the economy until six tonine months after the money supply ischanged.
b. An expansionary fiscal policy shouldalways be accompanied by an easymoney policy.
c. The annual rate of increase in themoney supply should be equal to thelong-term increase in the price level.
d. The annual rate of increase in themoney supply should be equal to thepotential annual growth rate of realGDP.
e. A contractionary fiscal policy mustalways be accompanied by an expan-sionary monetary policy.
17. If the government acts to stimulate GDP byraising government spending without a taxincrease and if at the same time there is nochange in monetary policy:
a. Income would not go up at all becausethe money isn’t available for increasedspending.
b. The rise in income might be greater thanthe multiplier would predict becausehigher interest rates will stimulateinvestment.
c. The rise in income might be smallerthan the multiplier would predictbecause demand for money will go upand interest rates will rise.
d. Income will go up by exactly theamount predicted by the multiplieranalysis since fiscal policy and monetarypolicy are separate policies and have norelationship to each other.
e. Income will not go up at all unless taxes are cut.
219
Unit 5
SAMPLE MULTIPLE-CHOICE QUESTIONS continued
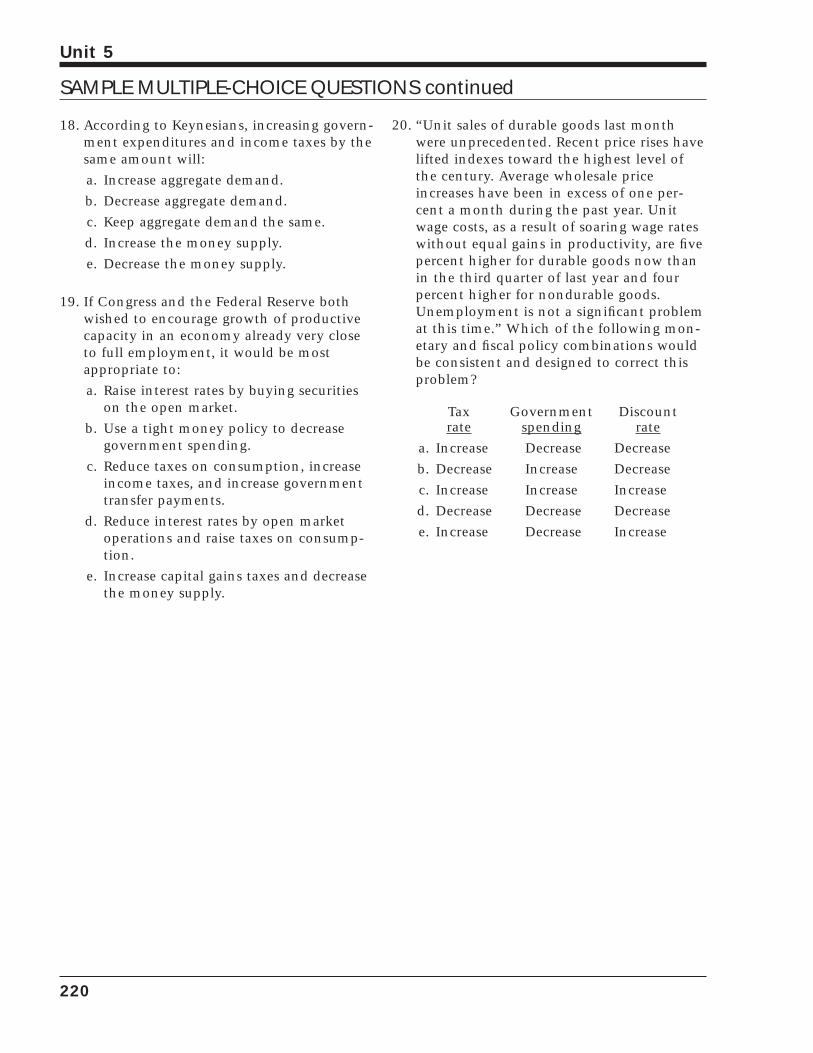
18. According to Keynesians, increasing govern-ment expenditures and income taxes by thesame amount will:
a. Increase aggregate demand.
b. Decrease aggregate demand.
c. Keep aggregate demand the same.
d. Increase the money supply.
e. Decrease the money supply.
19. If Congress and the Federal Reserve bothwished to encourage growth of productivecapacity in an economy already very closeto full employment, it would be mostappropriate to:
a. Raise interest rates by buying securitieson the open market.
b. Use a tight money policy to decreasegovernment spending.
c. Reduce taxes on consumption, increaseincome taxes, and increase governmenttransfer payments.
d. Reduce interest rates by open marketoperations and raise taxes on consump-tion.
e. Increase capital gains taxes and decreasethe money supply.
20. “Unit sales of durable goods last monthwere unprecedented. Recent price rises havelifted indexes toward the highest level ofthe century. Average wholesale priceincreases have been in excess of one per-cent a month during the past year. Unitwage costs, as a result of soaring wage rateswithout equal gains in productivity, are fivepercent higher for durable goods now thanin the third quarter of last year and fourpercent higher for nondurable goods.Unemployment is not a significant problemat this time.” Which of the following mon-etary and fiscal policy combinations wouldbe consistent and designed to correct thisproblem?
Tax Government Discountrate spending rate
a. Increase Decrease Decrease
b. Decrease Increase Decrease
c. Increase Increase Increase
d. Decrease Decrease Decrease
e. Increase Decrease Increase
220
Unit 5
SAMPLE MULTIPLE-CHOICE QUESTIONS continued
Sample Short Essay Questions1. Using monetary and fiscal policies, outline an expansionary policy that would
encourage long-run growth.
2. Republicans want to reduce the deficit by cutting government spending whileDemocrats want to reduce the size of the deficit by increasing taxes. Compare thesetwo programs using aggregate supply and demand analysis. Illustrate the effects ofeach program with AD/AS graphs.
3. Why is there a conflict between the Fed’s attempts to control both the money supply and the interest rate? What is the implication of the Fed’s attempt to control the money supply? Why do monetarists advocate that the Fed concentrateonly on controlling the money supply?
4. What is the tradeoff between unemployment and inflation in the short run? What accounts for it? Why does this tradeoff pose a dilemma for policymakers?What tradeoff exists between inflation and unemployment in the long run?
5. One of the complaints about a growing national debt is the “crowding out” effect.Explain the meaning of this term. Identify two sectors of the economy that areinvolved in this crowding out. Explain the activities of these two sectors and showhow they interact to create a crowding out effect. Use a diagram to illustrate youranswer.
6. Why is using fiscal policy to fight recession and monetary policy to fight inflationbad for long-run economic growth?
* 7. Using the aggregate supply and aggregate demand model, explain how the use ofmonetary policy to promote long-run economic growth will affect each of the following.
a. Short-term interest rates.
b. The composition (mix) of aggregate expenditures.
c. Potential Gross Domestic Product.
8. Why do rational expectations theorists believe that monetary and fiscal policieswill be ineffective?
221
Unit 5
*Actual AP essay question from a past year.

222
Unit 5
Sample Long Essay Questions*1. Suppose that the following statements describe the current state of an economy.
• The unemployment rate is five percent.
• Inflation is at an annual rate of ten percent.
• The prime interest rate is 11.5 percent.
• The annual growth rate of real Gross Domestic Product is five percent.
a. Identify the major problem(s) the economy faces.
b. Describe two fiscal policy actions that could be used to alleviate the prob-lem(s). Using the aggregate supply and aggregate demand model, explainhow the actions you identified will affect each of the following. Illustratewith a graph.
i. Output and employment
ii. The price level.
iii. Nominal interest rates.
c. Instead of using fiscal policy to solve the country’s problem(s), use onlymonetary policy. Describe two monetary policy actions that could be usedto alleviate the problem(s). Using the aggregate supply and aggregatedemand model, explain how the actions you identified would affect each ofthe following. Illustrate with a graph.
i. Nominal interest rates.
ii. Output and employment.
iii. The price level.
*2. Suppose that the following conditions describe the current state of the U.S. economy.
• The unemployment rate is five percent.
• Inflation is two percent.
• Real Gross Domestic Product is growing at the rate of three percent.
a. First, assume that the federal government increases its spending and increas-es taxes so as to maintain a balanced budget. Using aggregate supply anddemand analysis, explain the short-run effects of these policies on each ofthe following.
i. Output and employment.
ii. The price level.
iii. Interest rates.
223
Unit 5
*Actual AP essay question from a past year.
b. Now assume instead that the Federal Reserve buys bonds on the open market. Analyze the impact of this action on each of the following.
i. Interest rates.
ii. Output and employment.
iii. The price level.
c. Using a graph, analyze the combined effect of the two policy actionsdescribed above on each of the following.
i. Output and employment.
ii. The price level.
iii. Interest rates.
3. Contrast the Keynesian and monetarist macroeconomic models as to the fiscal andmonetary policies each of these models would employ. Explain and demonstratewith appropriate graphs for the following conditions.
a. Cure inflation.
b. Cure recession.
c. Cure stagflation.
224
Unit 5
SAMPLE LONG ESSAY QUESTIONS continued
Macroeconomics
Unit 6The United States ina Global Economy
225

226
Unit 6
Key Ideas
227
Unit 6
• People and nations trade in order to improvetheir standard of living.
• Because trade is the voluntary exchange ofgoods and services, the decision to trade willoccur only if both parties to the exchangeexpect to gain from it.
• Voluntary trade promotes economic progressbecause it allows people to specialize in whatthey do best.
• The law of comparative advantage explains whythere are mutual gains from specialization andtrade.
• A nation has an absolute advantage over anoth-er nation in the production of a good when itcan produce more of that good using the sameamount of resources.
• Comparative advantage occurs when a nationcan produce a good at a lower opportunity costthan another nation. Relative costs determinecomparative advantage.
• Trade barriers such as tariffs and quotas limitthe potential gains from trade. Trade barriersgenerally protect domestic sellers at the expenseof domestic buyers. They reduce efficiency inthe allocation of scarce resources and slow downeconomic progress.
• The balance of payments is a broader measureof international transactions than the balanceof trade. The balance of trade considers only anation’s exports and imports of goods while thebalance of payments considers all internationaleconomic transactions including the currentaccount, the capital account, and officialreserves.
• To trade, nations must exchange currencies. Anexchange rate is the price of one currency interms of another and is generally set by supplyand demand.
• Appreciation is an increase in the value of anation’s currency in foreign exchange markets.Appreciation of a nation’s currency tends toreduce exports and increase imports.
• Depreciation is a decrease in the value of anation’s currency in foreign exchange markets.Depreciation of a nation’s currency tends toincrease exports and reduce imports.
• Monetary and fiscal policies can affect exchangerates and the international balance of payments.
• Domestic economic policies affect internationaltrade, and international trade affects the domes-tic economy influencing economic growth,unemployment, and the rate of inflation.

228
Unit 6
ACTIVITY 55The Iowa Car Crop*Read the following essay and answer the questions that follow.
229
Unit 6
Reprinted with the permission of the Free Press, an imprint of Simon & Schuster from THE ARMCHAIR ECONOMIST:Economics and Everyday Life by Steven E. Landsburg. Copyright © 1993 by Steven E. Landsburg.
There are two technologies for producing auto-mobiles in America. One is to manufacturethem in Detroit, and the other is to grow themin Iowa. Everybody knows about the first tech-nology; let me tell you about the second. Firstyou plant seeds, which are the raw materialfrom which automobiles are constructed. Youwait a few months until wheat appears. Thenyou harvest the wheat, load it onto ships, andsail the ships eastward into the Pacific Ocean.After a few months, the ships reappear withToyotas on them.
International trade is nothing but a form oftechnology. The fact that there is a place calledJapan, with people and factories, is quite irrele-vant to Americans’ well-being. To analyze tradepolicies, we might as well assume that Japan isa giant machine with mysterious inner work-ings that convert wheat into cars.
Any policy designed to favor the firstAmerican technology over the second is a poli-cy designed to favor American auto producersin Detroit over American auto producers inIowa. A tax or a ban on “imported” automobilesis a tax or a ban on Iowa-grown automobiles. Ifyou protect Detroit car makers from competi-tion, then you must damage Iowa farmers,because Iowa farmers are the competition.
The task of producing a given fleet of carscan be allocated between Detroit and Iowa in avariety of ways. A competitive price systemselects that allocation that minimizes the totalproduction cost. It would be unnecessarilyexpensive to manufacture all cars in Detroit,unnecessarily expensive to grow all cars inIowa, and unnecessarily expensive to use thetwo production processes in anything otherthan the natural ratio that emerges as a resultof competition.
That means that protection for Detroit doesmore than just transfer income from farmers toautoworkers. It also raises the total cost of pro-viding Americans with a given number of auto-
mobiles. The efficiency loss comes with no off-setting gain; it impoverishes the nation as awhole.
There is much talk about improving theefficiency of American car manufacturing.When you have two ways to make a car, theroad to efficiency is to use both in optimalproportions. The last thing you should want todo is to artificially hobble one of your produc-tion technologies. It is sheer superstition tothink that an Iowa-grown Camry is any less“American” than a Detroit-built Taurus.Policies rooted in superstition do not frequent-ly bear efficient fruit.
In 1817, David Ricardo—the first economistto think with the precision, though not thelanguage, of pure mathematics—laid the foun-dation for all future thought about interna-tional trade. In the intervening 150 years histheory has been much elaborated but its foun-dations remain as firmly established as any-thing in economics. Trade theory predicts firstthat if you protect American producers in oneindustry from foreign competition, then you mustdamage American producers in other industries. Itpredicts second that if you protect American pro-ducers in one industry from foreign competition,there must be a net loss in economic efficiency.Ordinarily, textbooks establish these proposi-tions through graphs, equations, and intricatereasoning. The little story that Ilearned...makes the same propositions blind-ingly obvious with a single compellingmetaphor. That is economics at its best.
1. Why are consumers hurt if government policies favor Detroit car makers ratherthan Iowa farmers?
2. Why does trade result in the most efficient production of goods and services?
3. Why do people and nations gain when they trade?
4. True, false, or uncertain, and why? “The economic goal of international trade is tomaximize our exports and to provide jobs for Americans.”
230
Unit 6
ACTIVITY 55 continued
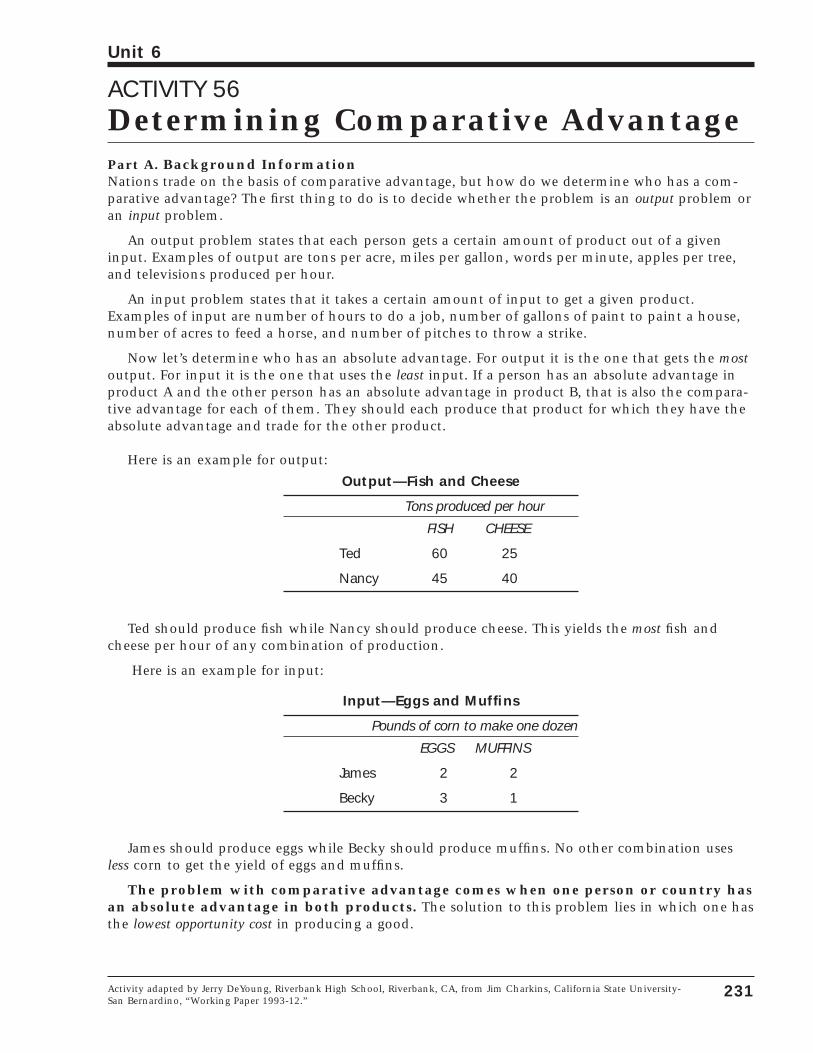
ACTIVITY 56Determining Comparative AdvantagePart A. Background InformationNations trade on the basis of comparative advantage, but how do we determine who has a com-parative advantage? The first thing to do is to decide whether the problem is an output problem oran input problem.
An output problem states that each person gets a certain amount of product out of a giveninput. Examples of output are tons per acre, miles per gallon, words per minute, apples per tree,and televisions produced per hour.
An input problem states that it takes a certain amount of input to get a given product.Examples of input are number of hours to do a job, number of gallons of paint to paint a house,number of acres to feed a horse, and number of pitches to throw a strike.
Now let’s determine who has an absolute advantage. For output it is the one that gets the mostoutput. For input it is the one that uses the least input. If a person has an absolute advantage inproduct A and the other person has an absolute advantage in product B, that is also the compara-tive advantage for each of them. They should each produce that product for which they have theabsolute advantage and trade for the other product.
Here is an example for output:
Output—Fish and Cheese
Tons produced per hour
FISH CHEESE
Ted 60 25
Nancy 45 40
Ted should produce fish while Nancy should produce cheese. This yields the most fish andcheese per hour of any combination of production.
Here is an example for input:
Input—Eggs and Muffins
Pounds of corn to make one dozen
EGGS MUFFINS
James 2 2
Becky 3 1
James should produce eggs while Becky should produce muffins. No other combination usesless corn to get the yield of eggs and muffins.
The problem with comparative advantage comes when one person or country hasan absolute advantage in both products. The solution to this problem lies in which one hasthe lowest opportunity cost in producing a good.
231
Unit 6
Activity adapted by Jerry DeYoung, Riverbank High School, Riverbank, CA, from Jim Charkins, California State University-San Bernardino, “Working Paper 1993-12.”
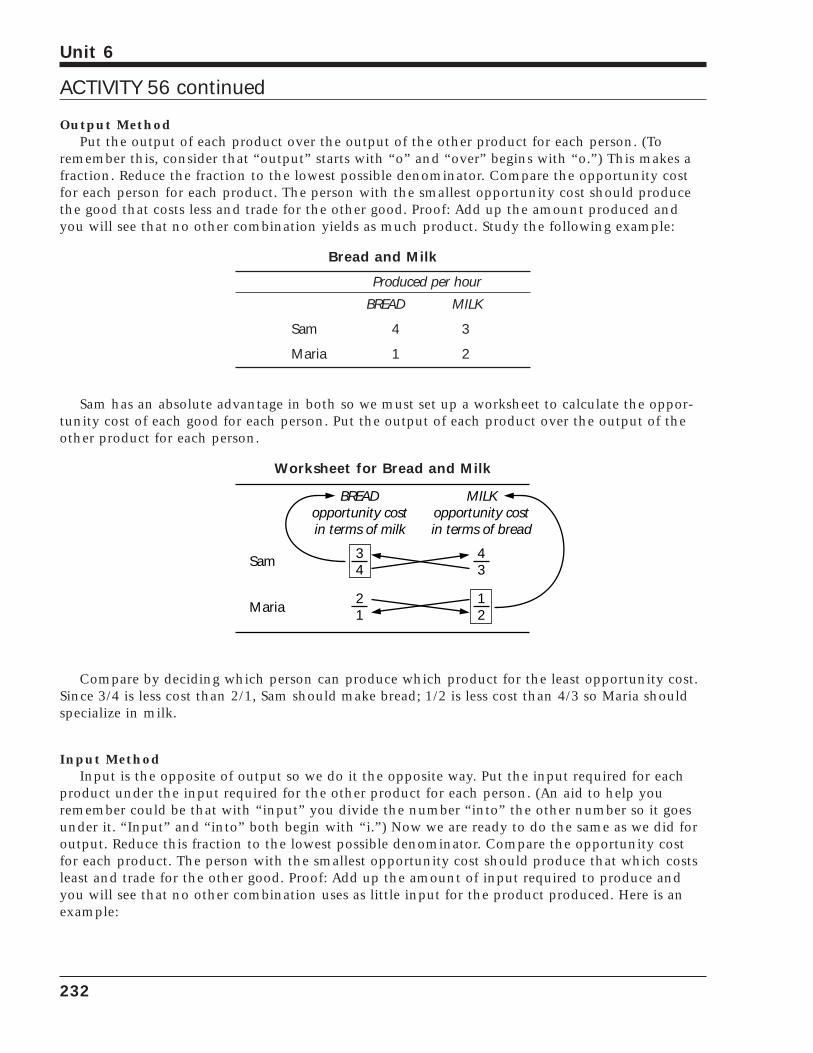
Output MethodPut the output of each product over the output of the other product for each person. (To
remember this, consider that “output” starts with “o” and “over” begins with “o.”) This makes afraction. Reduce the fraction to the lowest possible denominator. Compare the opportunity costfor each person for each product. The person with the smallest opportunity cost should producethe good that costs less and trade for the other good. Proof: Add up the amount produced andyou will see that no other combination yields as much product. Study the following example:
Bread and Milk
Produced per hour
BREAD MILK
Sam 4 3
Maria 1 2
Sam has an absolute advantage in both so we must set up a worksheet to calculate the oppor-tunity cost of each good for each person. Put the output of each product over the output of theother product for each person.
Worksheet for Bread and Milk
Compare by deciding which person can produce which product for the least opportunity cost.Since 3/4 is less cost than 2/1, Sam should make bread; 1/2 is less cost than 4/3 so Maria shouldspecialize in milk.
Input MethodInput is the opposite of output so we do it the opposite way. Put the input required for each
product under the input required for the other product for each person. (An aid to help youremember could be that with “input” you divide the number “into” the other number so it goesunder it. “Input” and “into” both begin with “i.”) Now we are ready to do the same as we did foroutput. Reduce this fraction to the lowest possible denominator. Compare the opportunity costfor each product. The person with the smallest opportunity cost should produce that which costsleast and trade for the other good. Proof: Add up the amount of input required to produce andyou will see that no other combination uses as little input for the product produced. Here is anexample:
BREADopportunity costin terms of milk
MILKopportunity costin terms of bread
Sam
Maria
34
43
21
12
232
Unit 6
ACTIVITY 56 continued
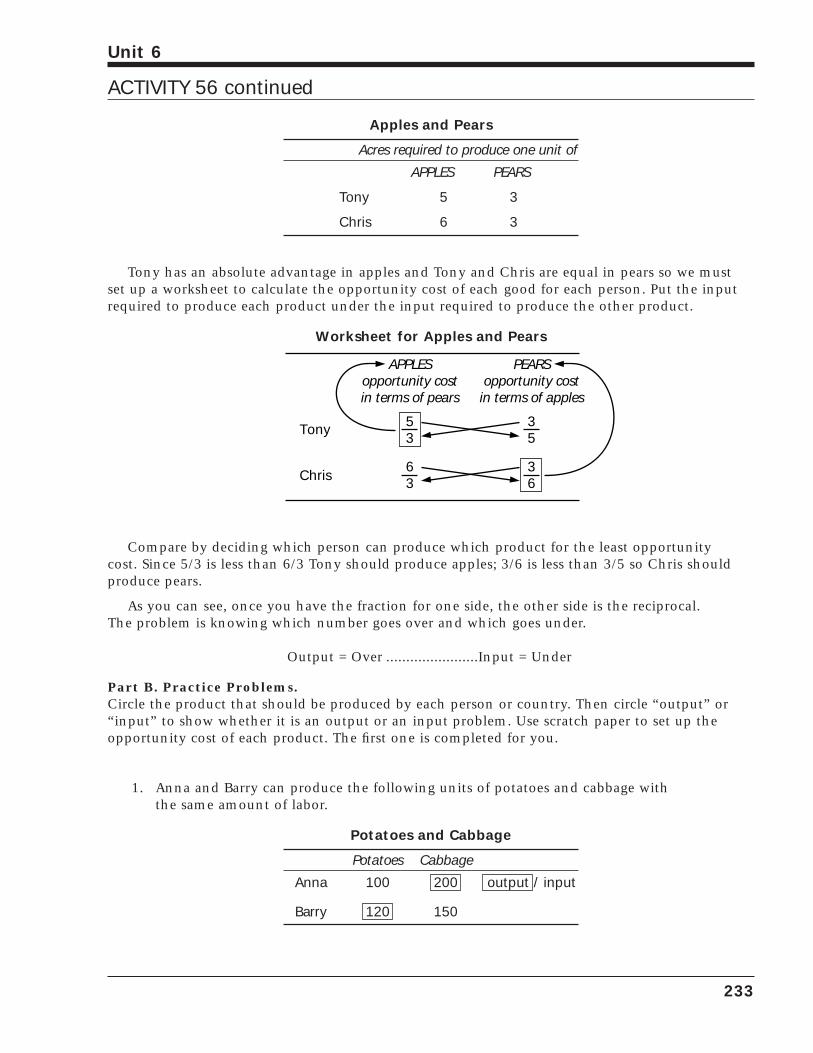
Apples and Pears
Acres required to produce one unit of
APPLES PEARS
Tony 5 3
Chris 6 3
Tony has an absolute advantage in apples and Tony and Chris are equal in pears so we mustset up a worksheet to calculate the opportunity cost of each good for each person. Put the inputrequired to produce each product under the input required to produce the other product.
Worksheet for Apples and Pears
Compare by deciding which person can produce which product for the least opportunity cost. Since 5/3 is less than 6/3 Tony should produce apples; 3/6 is less than 3/5 so Chris shouldproduce pears.
As you can see, once you have the fraction for one side, the other side is the reciprocal. The problem is knowing which number goes over and which goes under.
Output = Over .......................Input = Under
Part B. Practice Problems.Circle the product that should be produced by each person or country. Then circle “output” or“input” to show whether it is an output or an input problem. Use scratch paper to set up theopportunity cost of each product. The first one is completed for you.
1. Anna and Barry can produce the following units of potatoes and cabbage with the same amount of labor.
Potatoes and Cabbage
Potatoes Cabbage
Anna 100 200 output / input
Barry 120 150
APPLESopportunity costin terms of pears
PEARSopportunity cost
in terms of apples
Tony
Chris
53
35
63
36
233
Unit 6
ACTIVITY 56 continued
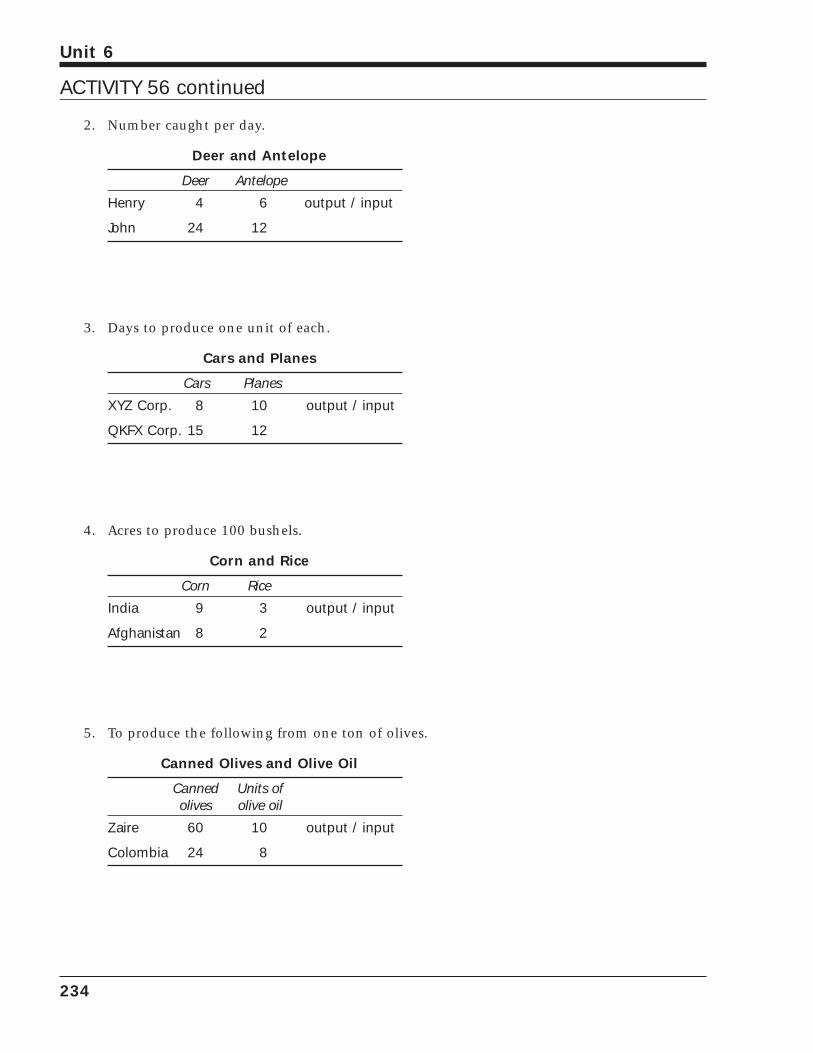
2. Number caught per day.
Deer and Antelope
Deer Antelope
Henry 4 6 output / input
John 24 12
3. Days to produce one unit of each.
Cars and Planes
Cars Planes
XYZ Corp. 8 10 output / input
QKFX Corp. 15 12
4. Acres to produce 100 bushels.
Corn and Rice
Corn Rice
India 9 3 output / input
Afghanistan 8 2
5. To produce the following from one ton of olives.
Canned Olives and Olive Oil
Canned Units of olives olive oil
Zaire 60 10 output / input
Colombia 24 8
234
Unit 6
ACTIVITY 56 continued
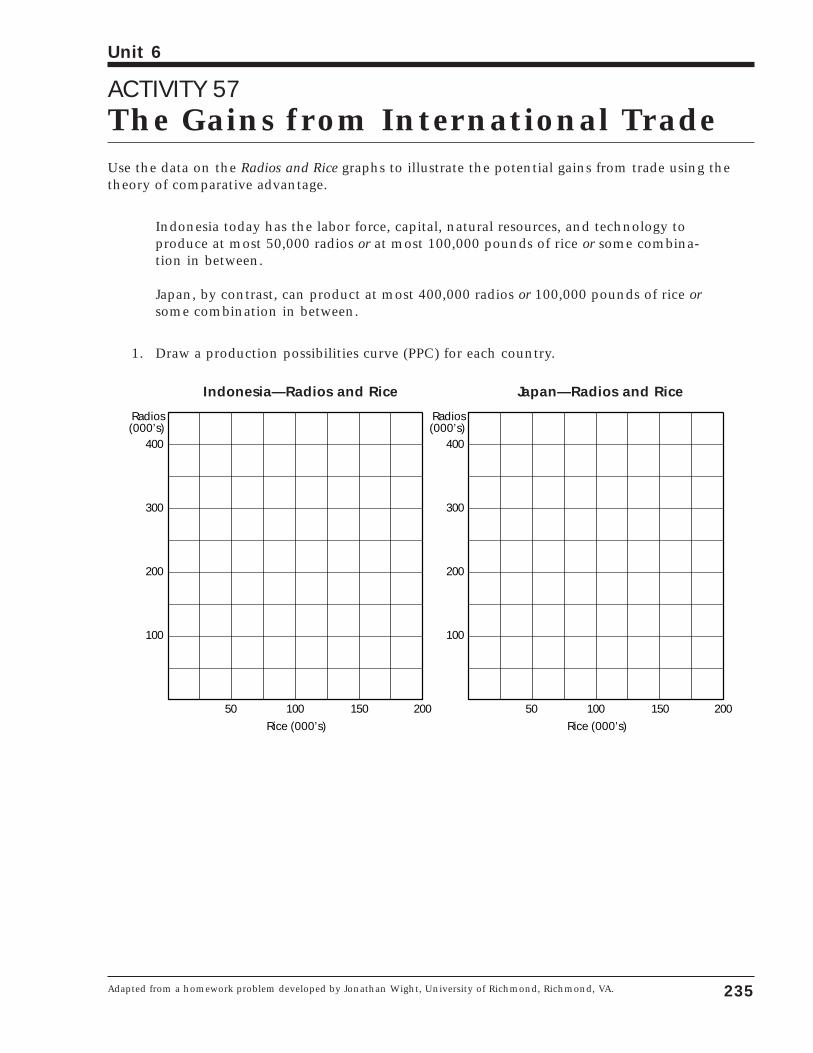
ACTIVITY 57The Gains from International TradeUse the data on the Radios and Rice graphs to illustrate the potential gains from trade using thetheory of comparative advantage.
Indonesia today has the labor force, capital, natural resources, and technology toproduce at most 50,000 radios or at most 100,000 pounds of rice or some combina-tion in between.
Japan, by contrast, can product at most 400,000 radios or 100,000 pounds of rice orsome combination in between.
1. Draw a production possibilities curve (PPC) for each country.
Indonesia—Radios and Rice Japan—Radios and Rice
Radios(000’s)
Radios(000’s)
Rice (000’s)
400
300
200
100
50 100 150 200
Rice (000’s)
400
300
200
100
50 100 150 200
235
Unit 6
Adapted from a homework problem developed by Jonathan Wight, University of Richmond, Richmond, VA.
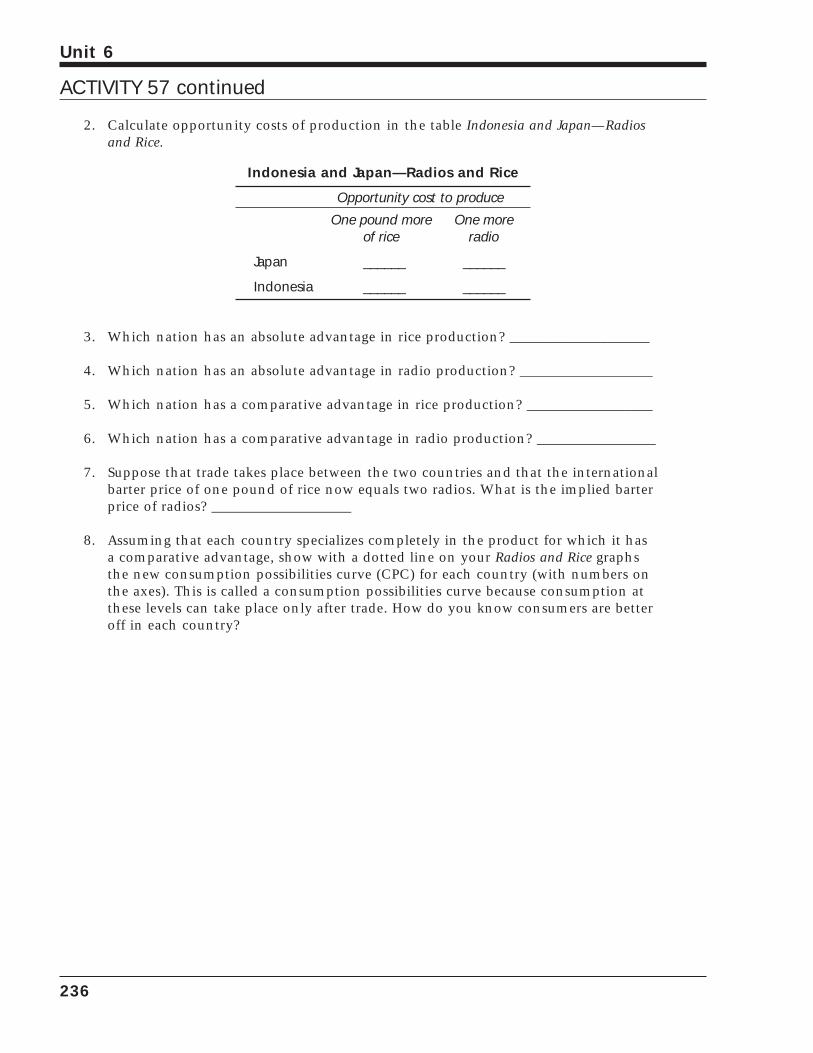
2. Calculate opportunity costs of production in the table Indonesia and Japan—Radiosand Rice.
Indonesia and Japan—Radios and Rice
Opportunity cost to produce
One pound more One moreof rice radio
Japan ______ ______
Indonesia ______ ______
3. Which nation has an absolute advantage in rice production? ____________________
4. Which nation has an absolute advantage in radio production? ___________________
5. Which nation has a comparative advantage in rice production? __________________
6. Which nation has a comparative advantage in radio production? _________________
7. Suppose that trade takes place between the two countries and that the internationalbarter price of one pound of rice now equals two radios. What is the implied barterprice of radios? ____________________
8. Assuming that each country specializes completely in the product for which it hasa comparative advantage, show with a dotted line on your Radios and Rice graphsthe new consumption possibilities curve (CPC) for each country (with numbers onthe axes). This is called a consumption possibilities curve because consumption atthese levels can take place only after trade. How do you know consumers are betteroff in each country?
236
Unit 6
ACTIVITY 57 continued
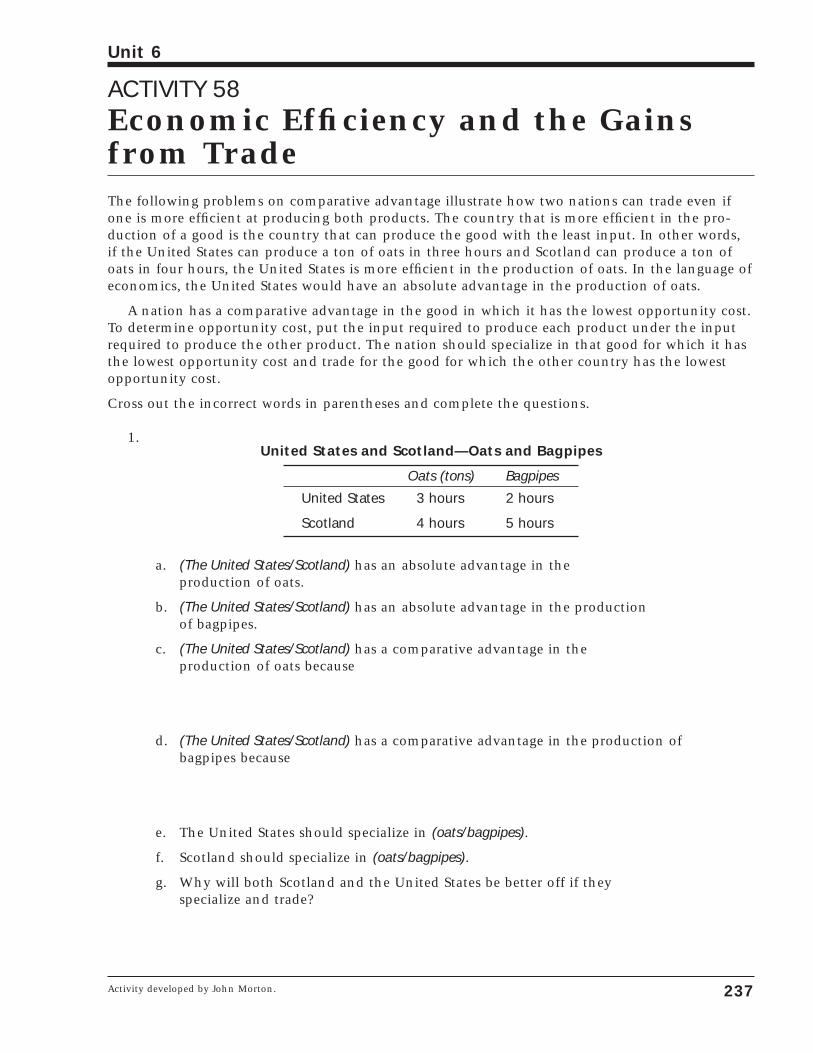
ACTIVITY 58Economic Efficiency and the Gainsfrom TradeThe following problems on comparative advantage illustrate how two nations can trade even ifone is more efficient at producing both products. The country that is more efficient in the pro-duction of a good is the country that can produce the good with the least input. In other words,if the United States can produce a ton of oats in three hours and Scotland can produce a ton ofoats in four hours, the United States is more efficient in the production of oats. In the language ofeconomics, the United States would have an absolute advantage in the production of oats.
A nation has a comparative advantage in the good in which it has the lowest opportunity cost.To determine opportunity cost, put the input required to produce each product under the inputrequired to produce the other product. The nation should specialize in that good for which it hasthe lowest opportunity cost and trade for the good for which the other country has the lowestopportunity cost.
Cross out the incorrect words in parentheses and complete the questions.
1.United States and Scotland—Oats and Bagpipes
Oats (tons) Bagpipes
United States 3 hours 2 hours
Scotland 4 hours 5 hours
a. (The United States/Scotland) has an absolute advantage in the production of oats.
b. (The United States/Scotland) has an absolute advantage in the production of bagpipes.
c. (The United States/Scotland) has a comparative advantage in the production of oats because
d. (The United States/Scotland) has a comparative advantage in the production ofbagpipes because
e. The United States should specialize in (oats/bagpipes).
f. Scotland should specialize in (oats/bagpipes).
g. Why will both Scotland and the United States be better off if they specialize and trade?
237
Unit 6
Activity developed by John Morton.
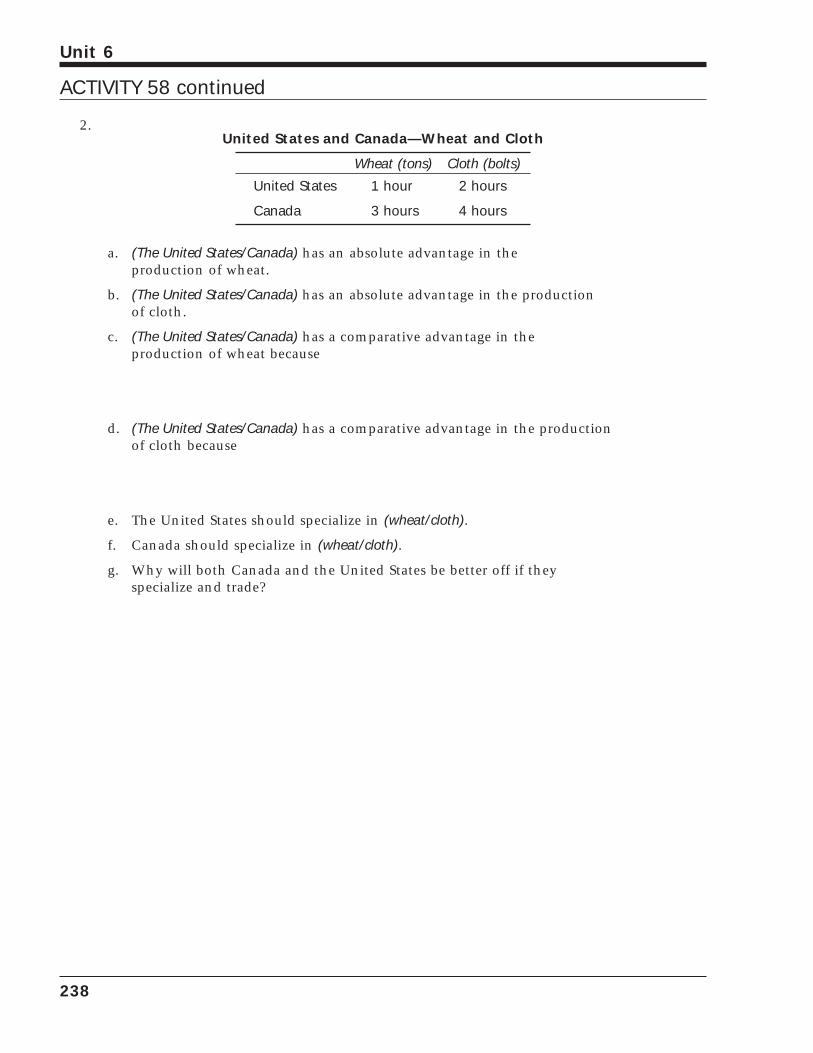
2.United States and Canada—Wheat and Cloth
Wheat (tons) Cloth (bolts)
United States 1 hour 2 hours
Canada 3 hours 4 hours
a. (The United States/Canada) has an absolute advantage in the production of wheat.
b. (The United States/Canada) has an absolute advantage in the production of cloth.
c. (The United States/Canada) has a comparative advantage in the production of wheat because
d. (The United States/Canada) has a comparative advantage in the production of cloth because
e. The United States should specialize in (wheat/cloth).
f. Canada should specialize in (wheat/cloth).
g. Why will both Canada and the United States be better off if they specialize and trade?
238
Unit 6
ACTIVITY 58 continued
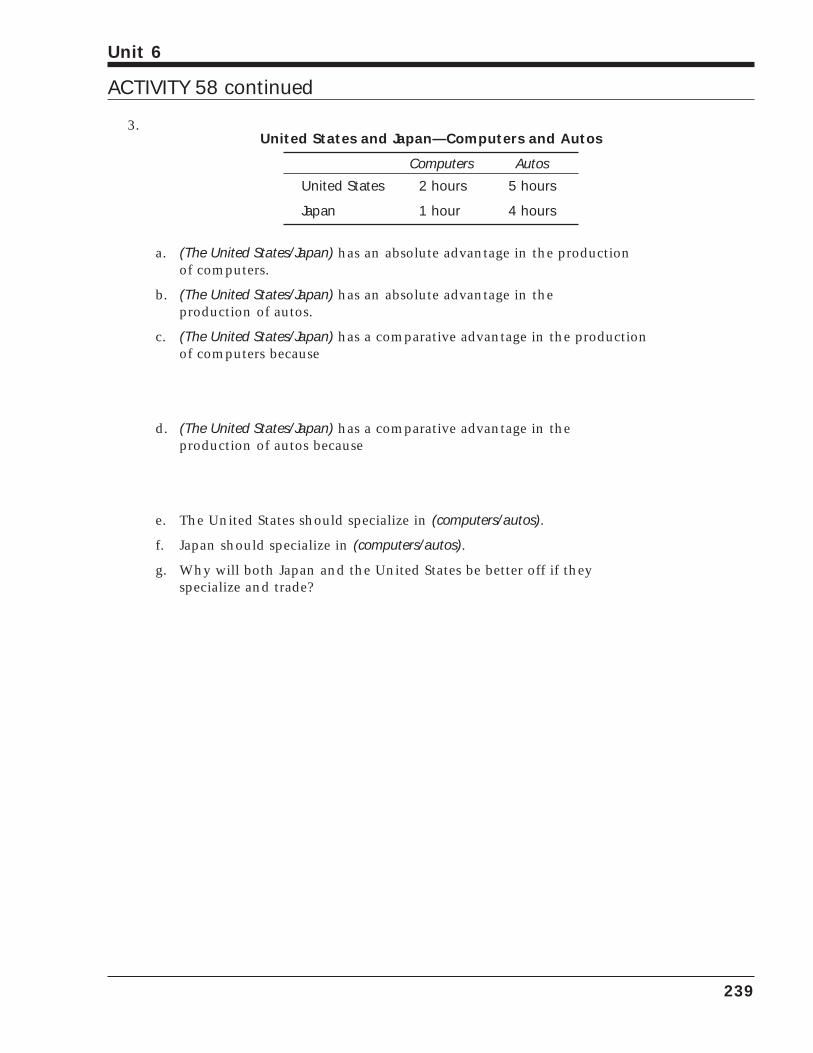
3.United States and Japan—Computers and Autos
Computers Autos
United States 2 hours 5 hours
Japan 1 hour 4 hours
a. (The United States/Japan) has an absolute advantage in the production of computers.
b. (The United States/Japan) has an absolute advantage in the production of autos.
c. (The United States/Japan) has a comparative advantage in the production of computers because
d. (The United States/Japan) has a comparative advantage in the production of autos because
e. The United States should specialize in (computers/autos).
f. Japan should specialize in (computers/autos).
g. Why will both Japan and the United States be better off if they specialize and trade?
239
Unit 6
ACTIVITY 58 continued

240
Unit 6
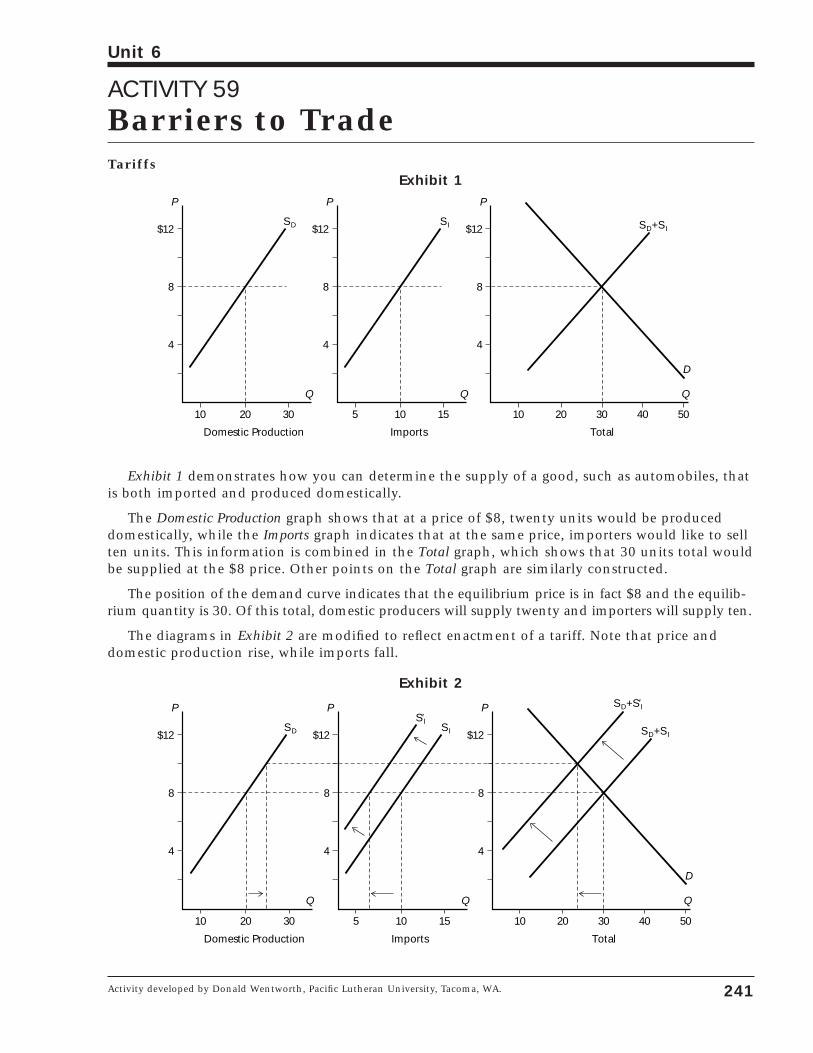
ACTIVITY 59Barriers to TradeTariffs
Exhibit 1
Exhibit 1 demonstrates how you can determine the supply of a good, such as automobiles, thatis both imported and produced domestically.
The Domestic Production graph shows that at a price of $8, twenty units would be produceddomestically, while the Imports graph indicates that at the same price, importers would like to sellten units. This information is combined in the Total graph, which shows that 30 units total wouldbe supplied at the $8 price. Other points on the Total graph are similarly constructed.
The position of the demand curve indicates that the equilibrium price is in fact $8 and the equilib-rium quantity is 30. Of this total, domestic producers will supply twenty and importers will supply ten.
The diagrams in Exhibit 2 are modified to reflect enactment of a tariff. Note that price anddomestic production rise, while imports fall.
Exhibit 2
P
Domestic Production
$12
8
4
10 20 30
Q
S D
P
Imports
$12
8
4
5 10 15
Q
S I
P
Total
$12
8
4
10 20 30
Q
S D+S I
40 50
D
S'I
S D+S'I
P
Domestic Production
$12
8
4
10 20 30
Q
S D
P
Imports
$12
8
4
5 10 15
Q
S I
P
Total
$12
8
4
10 20 30
Q
S D+S I
40 50
D
241
Unit 6
Activity developed by Donald Wentworth, Pacific Lutheran University, Tacoma, WA.
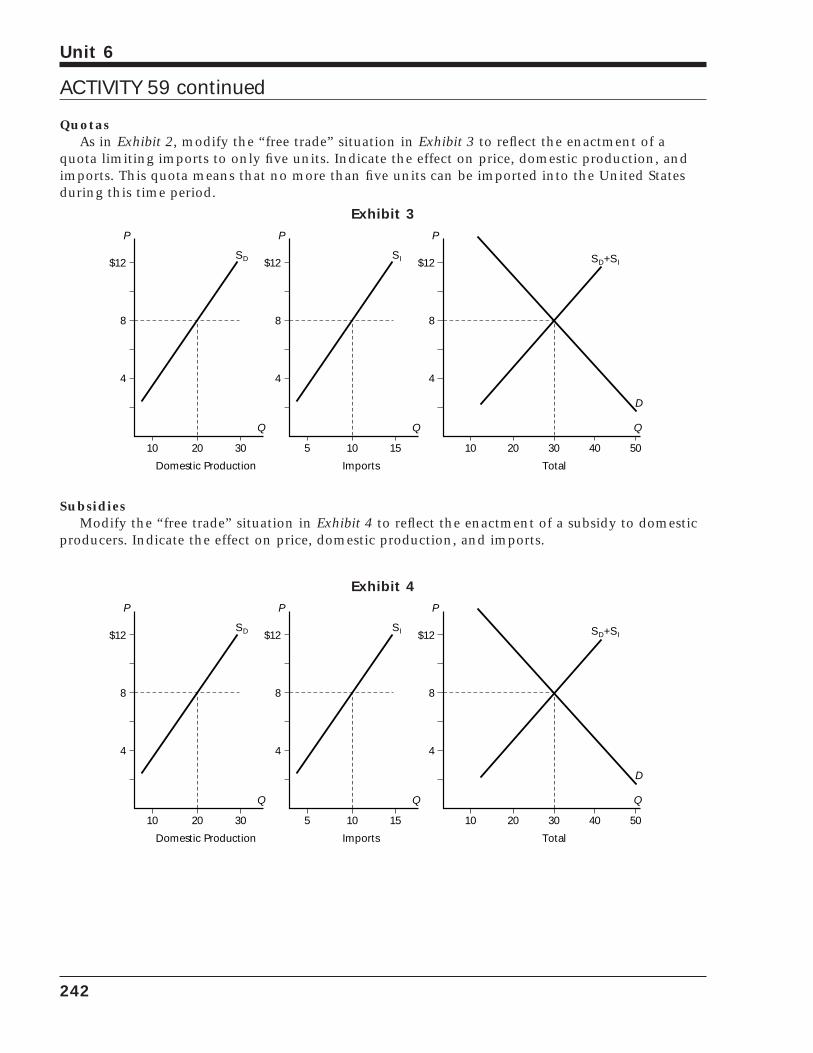
QuotasAs in Exhibit 2, modify the “free trade” situation in Exhibit 3 to reflect the enactment of a
quota limiting imports to only five units. Indicate the effect on price, domestic production, andimports. This quota means that no more than five units can be imported into the United Statesduring this time period.
Exhibit 3
SubsidiesModify the “free trade” situation in Exhibit 4 to reflect the enactment of a subsidy to domestic
producers. Indicate the effect on price, domestic production, and imports.
Exhibit 4P
Domestic Production
$12
8
4
10 20 30
Q
S D
P
Imports
$12
8
4
5 10 15
Q
S I
P
Total
$12
8
4
10 20 30
Q
S D+S I
40 50
D
P
Domestic Production
$12
8
4
10 20 30
Q
S D
P
Imports
$12
8
4
5 10 15
Q
S I
P
Total
$12
8
4
10 20 30
Q
S D+S I
40 50
D
242
Unit 6
ACTIVITY 59 continued
ACTIVITY 60Imbalance of Payments
243
Unit 6
Activity developed by Donald Wentworth, Pacific Lutheran University, Tacoma, WA.Part of the activity adapted from William B. Walstad and Robert C. Bingham, Study Guide to Accompany McConnell and BrueEconomics, Twelfth edition (New York: McGraw-Hill, 1993).
Imagine yourself eating lunch at a poshWashington, DC, restaurant. Seated at the nexttable are Ms. Deficit, a U.S. trade negotiator,and her German counterpart, Sir Plus. Let’s lis-ten in on their conversation as they discuss thetrade problems of their respective countries.
Ms. Deficit: This imbalance in our trade can-not continue. The deficit in our balanceof payments has put many of ourexporters out of business and is pushingus into a recession.
Sir Plus: My country agrees that the situa-tion cannot continue. The surplus inour balance of payments is raising theprice of our imported goods, and ourexports are so high that we are left withfewer products at home.
Ms. Deficit: So we agree that somethingneeds to be done, but what? Some ofour businesses are calling for tariffs, andothers want us to devalue our currency,but neither of those are acceptable poli-cies to our government.
Sir Plus: Likewise, we could raise the valueof our currency, but this action willsurely cost the president his job.
Fortunately, the waiter arrives sparing us therest of their conversation. While the food isbeing prepared, let’s investigate some of theconcepts the two diplomats were discussing.
Just what is a balance of payments? Quitesimply, it is an accounting of all the paymentflows going out of and entering a country,whether from individuals, businesses, or thegovernment. The U.S. Department of
Commerce records international transactions tohelp policymakers make intelligent decisionsconcerning world trade and finance.
These transactions are divided initially intotwo categories: those earning foreign currency(principally exports), called credits, and thoseusing foreign currency (principally imports),called debits.
Determining whether a transaction earns oruses foreign currency is a simple way of keep-ing track of whether it is a credit or debit.Consider the export of an automobile from theUnited States to Canada. The Canadian buyerwill supply the market with Canadian dollarsin order to acquire the U.S. dollars needed topay the U.S. supplier. Likewise, a Mexicantourist in the United States will supply pesos tothe market in exchange for dollars. Both trans-actions are recorded as credit items in the bal-ance of payments.
A U.S. tourist who plans to visit Mexicomust supply U.S. dollars to the market inexchange for pesos. A U.S. film buyer whowishes to acquire film rights to German moviesmust supply U.S. dollars to the market inexchange for marks. Both transactions arerecorded as debit items in the balance of pay-ments.
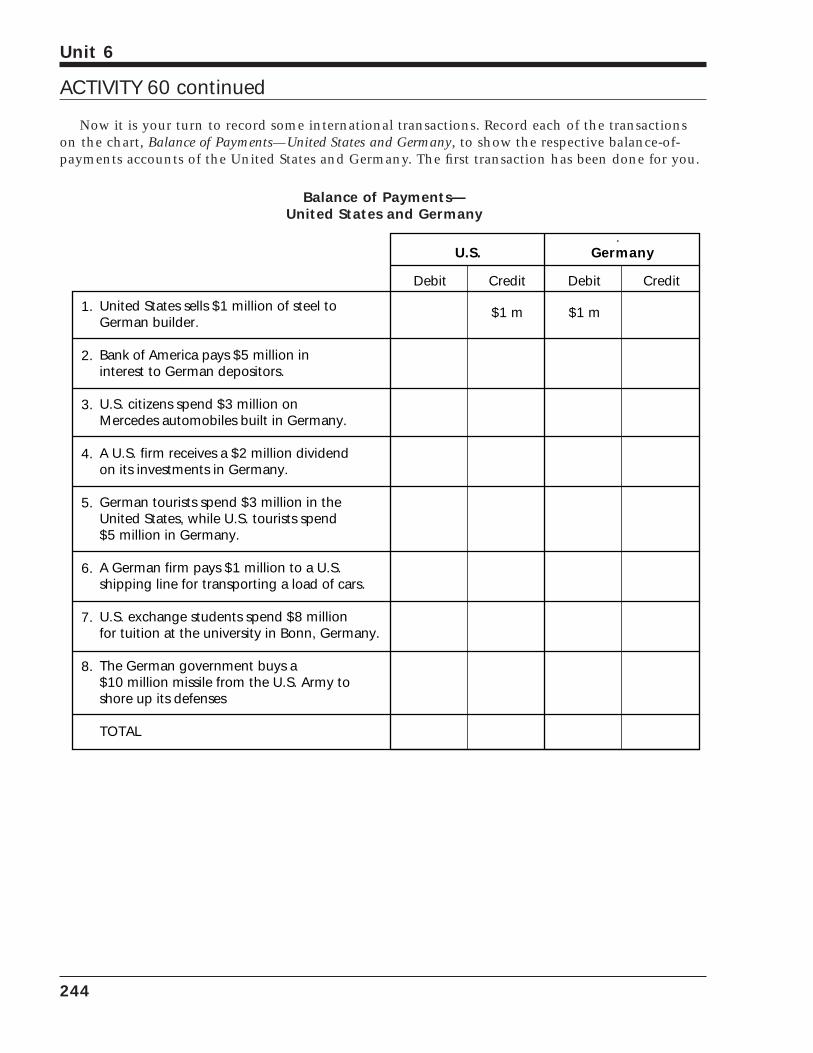
Now it is your turn to record some international transactions. Record each of the transactionson the chart, Balance of Payments—United States and Germany, to show the respective balance-of-payments accounts of the United States and Germany. The first transaction has been done for you.
Balance of Payments—United States and Germany
Debit Credit Debit Credit
$1 m $1 m
U.S. Germany
1.
2.
3.
4.
5.
6.
7.
8.
United States sells $1 million of steel to German builder.
Bank of America pays $5 million in interest to German depositors.
U.S. citizens spend $3 million on Mercedes automobiles built in Germany.
A U.S. firm receives a $2 million dividend on its investments in Germany.
German tourists spend $3 million in the United States, while U.S. tourists spend $5 million in Germany.
A German firm pays $1 million to a U.S. shipping line for transporting a load of cars.
U.S. exchange students spend $8 million for tuition at the university in Bonn, Germany.
The German government buys a $10 million missile from the U.S. Army to shore up its defenses
TOTAL
244
Unit 6
ACTIVITY 60 continued
The transactions in the examples in thechart are all recorded in what is known as thecurrent account and are what most of us think ofas exports and imports. Notice that the UnitedStates has exported less than it has importedand is left with a deficit in the current account(debits exceed credits). Germany has exactlythe opposite problem.
Is this deficit a bad thing for the UnitedStates, or is Germany’s surplus a bad thing forthem? Here we must investigate a bit further. Ah,an international banker has arrived to join thetrade negotiators. Let’s hear what she has to say.
Ms. Money: You two are both missing halfthe story! If the United States is import-ing more than it is exporting, how is itpaying for the imports? By definition,what is acquired in imports must beeither paid for or owed. What you havebeen ignoring is the flow of capital—theso-called capital accounts.
Ms. Deficit: What has that got to do withthis terrible deficit in our accounts?
Sir Plus: Or our surplus?
Ms. Money: Let’s consider your country’s sit-uation, Sir Plus. Your country is earningfar more foreign exchange (especiallyU.S. dollars) on its exports than it isusing for its imports. What is happen-ing to all those funds? Or your country,Ms. Deficit. How is it paying for allthose imported Mercedes?
Sir Plus: I see what you mean. Many of ourbanks have reinvested those dollars backin the U.S. banks and are earning inter-est on them. Other companies areinvesting in buildings and other pro-jects overseas as well.
Ms. Deficit: And I believe we are also obtain-ing funds from your citizens who arebuying U.S. government bonds, helpingto finance our government’s budgetdeficit, and helping to keep our taxesdown.
Ms. Money: Correct. So now you understandthat a current account deficit or surplus
is simply a measure of goods and ser-vices being exchanged, but it does nottell us much about the total amount ofcurrency changing hands. You bothwere talking about an “imbalance” oftrade as if your exchanges were like ateeter-totter with a football player onone end and a ballerina on the other—agame that would end very quicklybecause of dissatisfaction from bothsides. I think now you understand thatevery exchange is beneficial to bothsides, and that the perceived imbalancein your trade is really balanced by other,perhaps less visible, activities. If tradewas truly imbalanced, like the teeter-totter, it would stop very quickly.
Thank goodness that discussion is clearedup. Let’s look closer at the capital account.
Suppose the United States borrows fundsfrom Germany to finance our imports. Is thisborrowing a credit or debit item? To answerthis question, it is easiest to think of the UnitedStates as an exporter of an IOU, and like otherexports, this would be recorded as a credit. Asbefore, this borrowing of funds would gain for-eign currency for the United States, which wasour definition of a credit. Likewise, if a U.S.bank lends money to a German investor tobuild a new skyscraper building, this wouldlead to a debit in our balance-of-payments capi-tal account.
These two accounts, the current and capitalaccounts, record the flows of currency into andout of the United States almost completely. Butlike any measures, they are not completelyaccurate. The accounts include a place for a“statistical discrepancy” to measure unrecordedtransactions, and another account to measuremovements of official intergovernmental settle-ments (principally gold and what are known as“special drawing rights,” a type of internationalcurrency).
245
Unit 6
ACTIVITY 60 continued
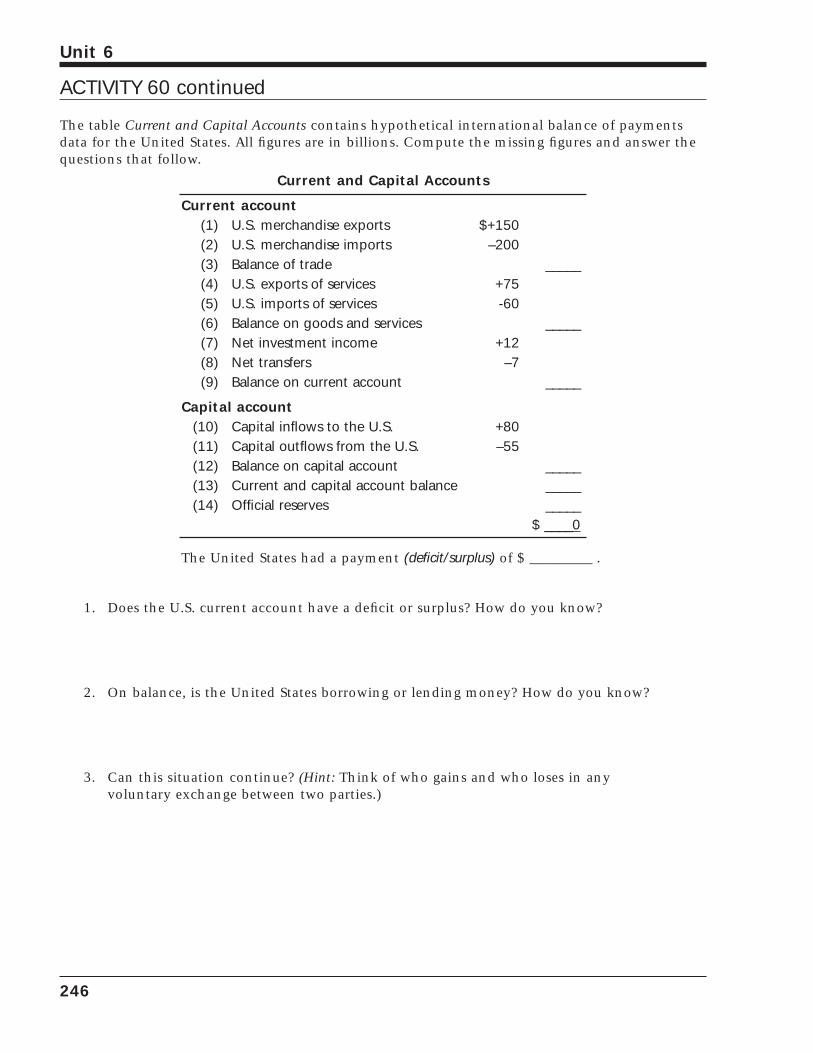
The table Current and Capital Accounts contains hypothetical international balance of paymentsdata for the United States. All figures are in billions. Compute the missing figures and answer thequestions that follow.
Current and Capital Accounts
Current account(1) U.S. merchandise exports $+150(2) U.S. merchandise imports –200(3) Balance of trade _____(4) U.S. exports of services +75(5) U.S. imports of services -60(6) Balance on goods and services _____(7) Net investment income +12(8) Net transfers –7(9) Balance on current account _____
Capital account(10) Capital inflows to the U.S. +80(11) Capital outflows from the U.S. –55(12) Balance on capital account _____(13) Current and capital account balance _____(14) Official reserves _____
$ ____0
The United States had a payment (deficit/surplus) of $ _________ .
1. Does the U.S. current account have a deficit or surplus? How do you know?
2. On balance, is the United States borrowing or lending money? How do you know?
3. Can this situation continue? (Hint: Think of who gains and who loses in any voluntary exchange between two parties.)
246
Unit 6
ACTIVITY 60 continued
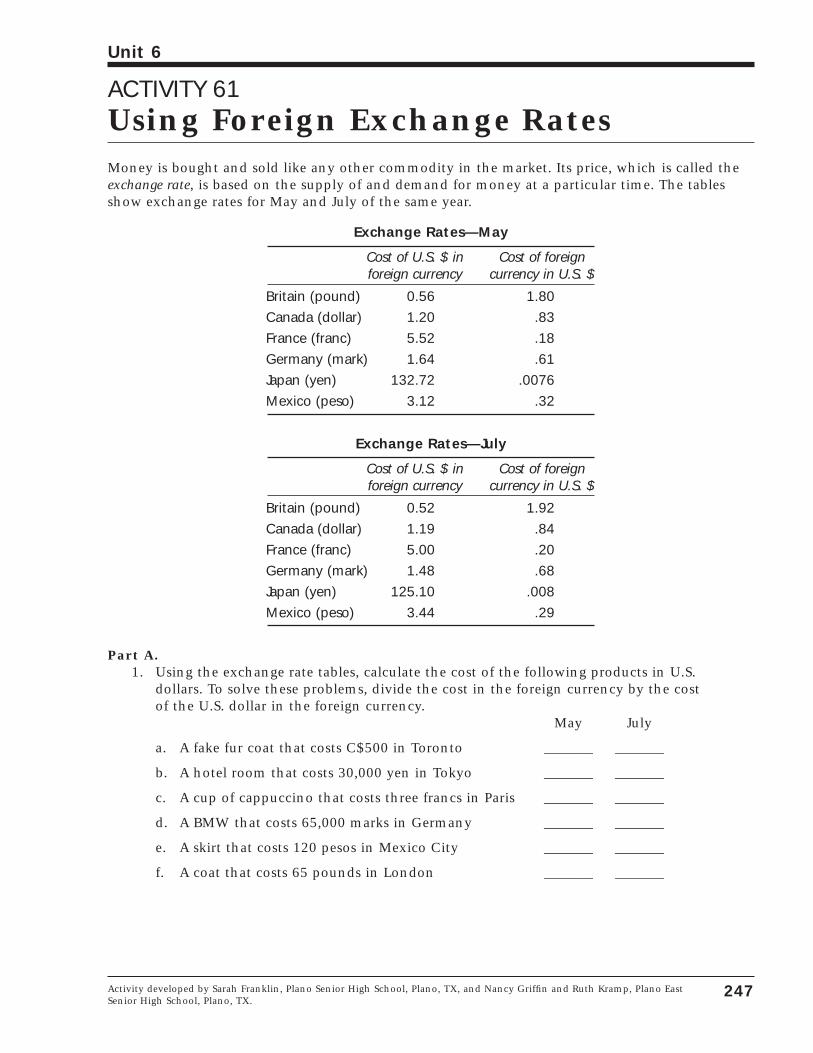
ACTIVITY 61Using Foreign Exchange RatesMoney is bought and sold like any other commodity in the market. Its price, which is called theexchange rate, is based on the supply of and demand for money at a particular time. The tablesshow exchange rates for May and July of the same year.
Exchange Rates—May
Cost of U.S. $ in Cost of foreignforeign currency currency in U.S. $
Britain (pound) 0.56 1.80
Canada (dollar) 1.20 .83
France (franc) 5.52 .18
Germany (mark) 1.64 .61
Japan (yen) 132.72 .0076
Mexico (peso) 3.12 .32
Exchange Rates—July
Cost of U.S. $ in Cost of foreignforeign currency currency in U.S. $
Britain (pound) 0.52 1.92
Canada (dollar) 1.19 .84
France (franc) 5.00 .20
Germany (mark) 1.48 .68
Japan (yen) 125.10 .008
Mexico (peso) 3.44 .29
Part A.1. Using the exchange rate tables, calculate the cost of the following products in U.S.
dollars. To solve these problems, divide the cost in the foreign currency by the costof the U.S. dollar in the foreign currency.
May July
a. A fake fur coat that costs C$500 in Toronto _______ _______
b. A hotel room that costs 30,000 yen in Tokyo _______ _______
c. A cup of cappuccino that costs three francs in Paris _______ _______
d. A BMW that costs 65,000 marks in Germany _______ _______
e. A skirt that costs 120 pesos in Mexico City _______ _______
f. A coat that costs 65 pounds in London _______ _______
247
Unit 6
Activity developed by Sarah Franklin, Plano Senior High School, Plano, TX, and Nancy Griffin and Ruth Kramp, Plano EastSenior High School, Plano, TX.
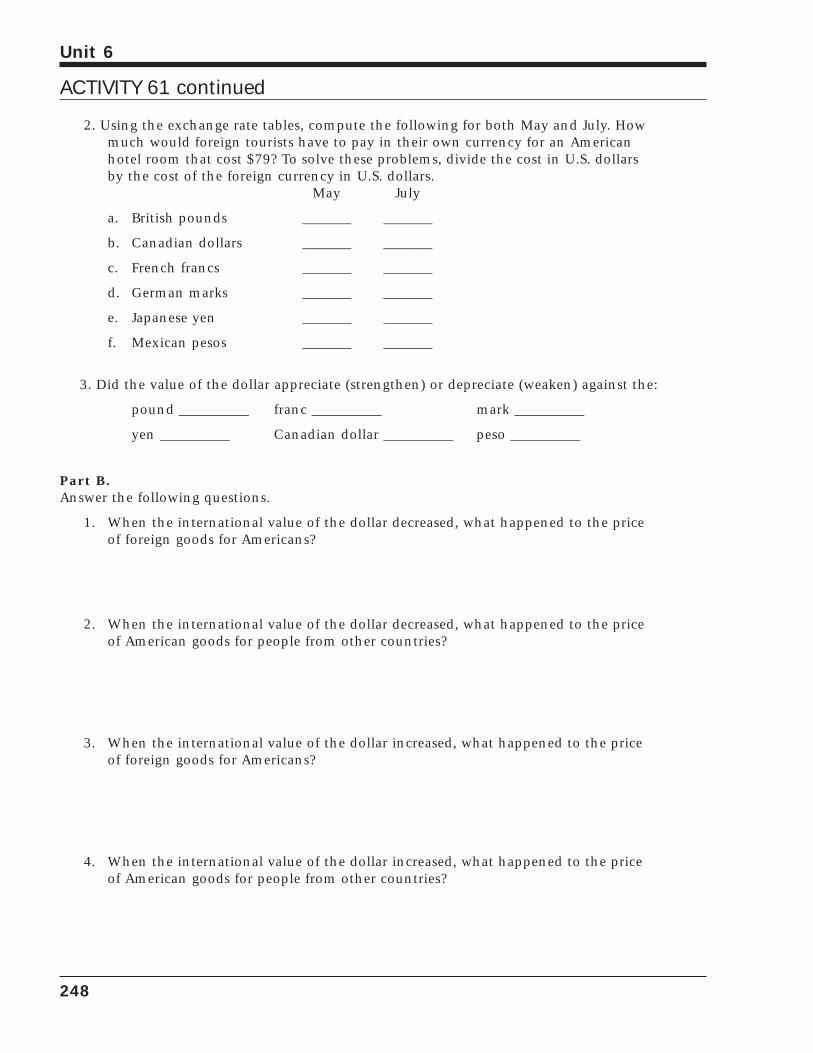
2. Using the exchange rate tables, compute the following for both May and July. Howmuch would foreign tourists have to pay in their own currency for an Americanhotel room that cost $79? To solve these problems, divide the cost in U.S. dollarsby the cost of the foreign currency in U.S. dollars.
May July
a. British pounds _______ _______
b. Canadian dollars _______ _______
c. French francs _______ _______
d. German marks _______ _______
e. Japanese yen _______ _______
f. Mexican pesos _______ _______
3. Did the value of the dollar appreciate (strengthen) or depreciate (weaken) against the:
pound __________ franc __________ mark __________
yen __________ Canadian dollar __________ peso __________
Part B.Answer the following questions.
1. When the international value of the dollar decreased, what happened to the priceof foreign goods for Americans?
2. When the international value of the dollar decreased, what happened to the priceof American goods for people from other countries?
3. When the international value of the dollar increased, what happened to the priceof foreign goods for Americans?
4. When the international value of the dollar increased, what happened to the priceof American goods for people from other countries?
248
Unit 6
ACTIVITY 61 continued
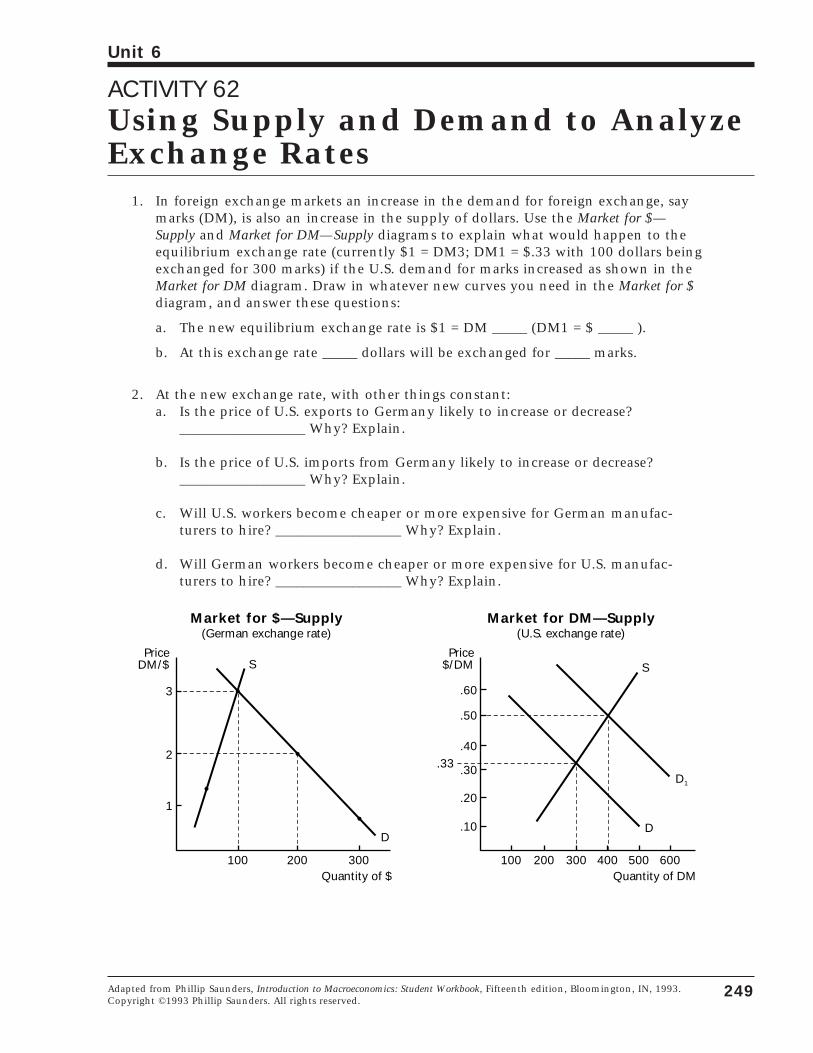
ACTIVITY 62Using Supply and Demand to AnalyzeExchange Rates
1. In foreign exchange markets an increase in the demand for foreign exchange, saymarks (DM), is also an increase in the supply of dollars. Use the Market for $—Supply and Market for DM—Supply diagrams to explain what would happen to theequilibrium exchange rate (currently $1 = DM3; DM1 = $.33 with 100 dollars beingexchanged for 300 marks) if the U.S. demand for marks increased as shown in theMarket for DM diagram. Draw in whatever new curves you need in the Market for $diagram, and answer these questions:
a. The new equilibrium exchange rate is $1 = DM _____ (DM1 = $ _____ ).
b. At this exchange rate _____ dollars will be exchanged for _____ marks.
2. At the new exchange rate, with other things constant:a. Is the price of U.S. exports to Germany likely to increase or decrease?
__________________ Why? Explain.
b. Is the price of U.S. imports from Germany likely to increase or decrease?__________________ Why? Explain.
c. Will U.S. workers become cheaper or more expensive for German manufac-turers to hire? __________________ Why? Explain.
d. Will German workers become cheaper or more expensive for U.S. manufac-turers to hire? __________________ Why? Explain.
3
2
S
D
100 200 300
1
Quantity of $
PriceDM/$
Market for $—Supply(German exchange rate)
S
D1
100 200 300
.10
Quantity of DM
Price$/DM
Market for DM—Supply(U.S. exchange rate)
400 500 600
.20
.30
.40
.50
.60
D
.33
249
Unit 6
Adapted from Phillip Saunders, Introduction to Macroeconomics: Student Workbook, Fifteenth edition, Bloomington, IN, 1993.Copyright ©1993 Phillip Saunders. All rights reserved.
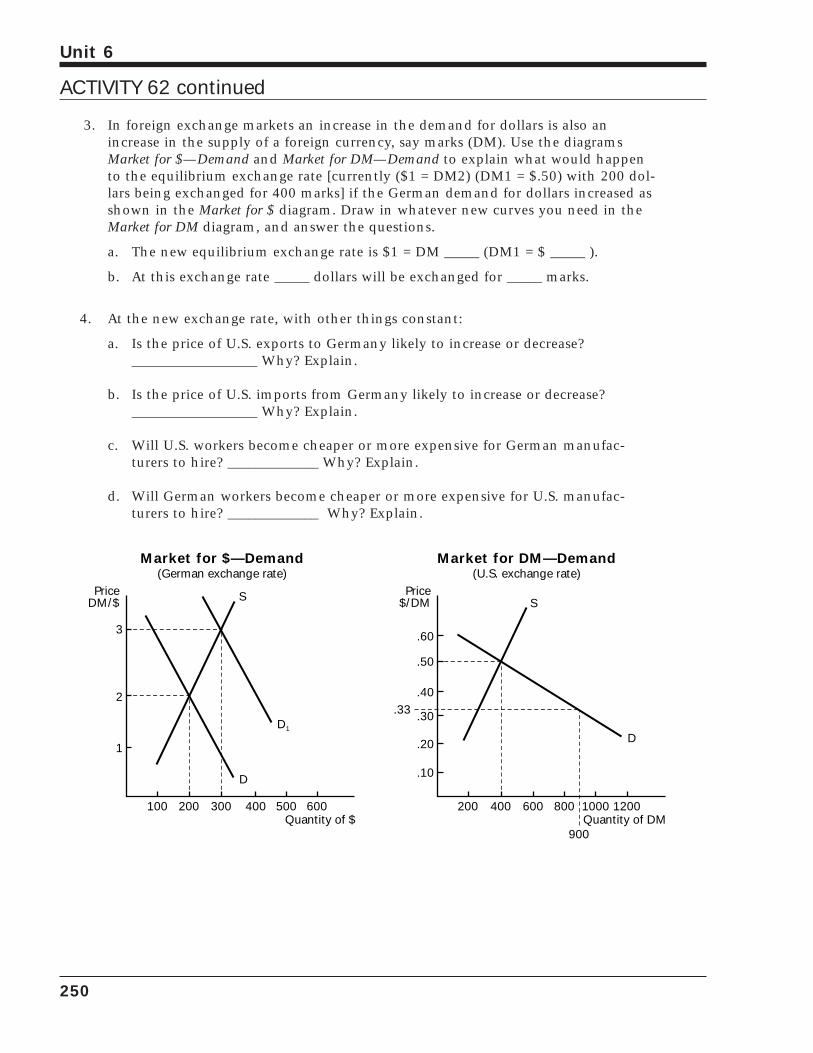
3. In foreign exchange markets an increase in the demand for dollars is also anincrease in the supply of a foreign currency, say marks (DM). Use the diagramsMarket for $—Demand and Market for DM—Demand to explain what would happento the equilibrium exchange rate [currently ($1 = DM2) (DM1 = $.50) with 200 dol-lars being exchanged for 400 marks] if the German demand for dollars increased asshown in the Market for $ diagram. Draw in whatever new curves you need in theMarket for DM diagram, and answer the questions.
a. The new equilibrium exchange rate is $1 = DM _____ (DM1 = $ _____ ).
b. At this exchange rate _____ dollars will be exchanged for _____ marks.
4. At the new exchange rate, with other things constant:
a. Is the price of U.S. exports to Germany likely to increase or decrease?__________________ Why? Explain.
b. Is the price of U.S. imports from Germany likely to increase or decrease?__________________ Why? Explain.
c. Will U.S. workers become cheaper or more expensive for German manufac-turers to hire? _____________ Why? Explain.
d. Will German workers become cheaper or more expensive for U.S. manufac-turers to hire? _____________ Why? Explain.
3
2
S
D
100 200 300
1
Quantity of $
PriceDM/$ S
200 400 600
.10
Quantity of DM
Price$/DM
800 1000 1200
.20
.30
.40
.50
.60
D
.33D1
400 500 600
900
Market for $—Demand(German exchange rate)
Market for DM—Demand(U.S. exchange rate)
250
Unit 6
ACTIVITY 62 continued
ACTIVITY 63The International Effects of Monetaryand Fiscal PoliciesMonetary and fiscal policies affect exchange rates, and the change in exchange rates affects thebalance of trade. Changes in exchange rates can also affect the level of aggregate demand in anation. This means that the international effects of monetary and fiscal policies affect exchangerates which, in turn, affect a country’s interest rates, inflation rate, unemployment rate, and levelof output. In other words, domestic policy actions affect international finance and trade, andinternational exchange rates affect domestic policy goals. Domestic monetary and fiscal policiescannot be conducted today without considering their international effects.
For each of the situations below:
• Evaluate the expected effects on the exchange rates of the United States and Japan,all other things equal.
• Describe the impact on the U.S. economy, including the effects for U.S. importersand exporters and the probable effect on the balance of trade.
Use sound economic reasoning and appropriate economic models to support your answers.The use of supply and demand graphs and of aggregate supply and aggregate demand graphs willimprove your answer in several of the problems.
1. An easy money policy is adopted by the U.S. Federal Reserve while Japan’s interestrates are increasing.
2. Relative interest rates in Japan increase because of increased government spendingon defense.
3. The U.S. federal budget deficit increases.
251
Unit 6
Activity developed by Sarah Franklin, Plano Senior High School, Plano, TX, and Nancy Griffin and Ruth Kramp, Plano EastSenior High School, Plano, TX.

4. There is a rapid increase in the Japanese price level while the price level in theUnited States remains relatively constant.
5. The Japanese economy is expanding while the U.S. economy is stagnating.
6. U.S. jeans become very fashionable among Japanese teenagers.
252
Unit 6
ACTIVITY 63 continued
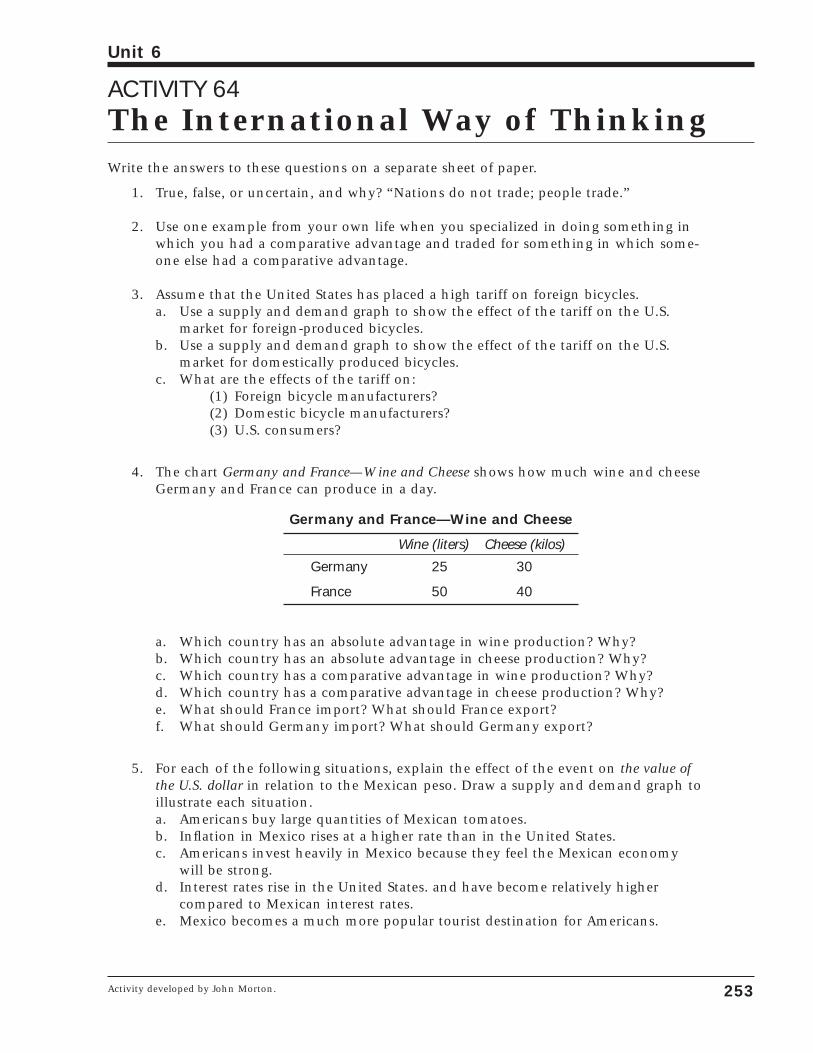
ACTIVITY 64The International Way of ThinkingWrite the answers to these questions on a separate sheet of paper.
1. True, false, or uncertain, and why? “Nations do not trade; people trade.”
2. Use one example from your own life when you specialized in doing something inwhich you had a comparative advantage and traded for something in which some-one else had a comparative advantage.
3. Assume that the United States has placed a high tariff on foreign bicycles. a. Use a supply and demand graph to show the effect of the tariff on the U.S.
market for foreign-produced bicycles.b. Use a supply and demand graph to show the effect of the tariff on the U.S.
market for domestically produced bicycles.c. What are the effects of the tariff on:
(1) Foreign bicycle manufacturers?(2) Domestic bicycle manufacturers?(3) U.S. consumers?
4. The chart Germany and France—Wine and Cheese shows how much wine and cheeseGermany and France can produce in a day.
Germany and France—Wine and Cheese
Wine (liters) Cheese (kilos)
Germany 25 30
France 50 40
a. Which country has an absolute advantage in wine production? Why?b. Which country has an absolute advantage in cheese production? Why?c. Which country has a comparative advantage in wine production? Why?d. Which country has a comparative advantage in cheese production? Why?e. What should France import? What should France export?f. What should Germany import? What should Germany export?
5. For each of the following situations, explain the effect of the event on the value ofthe U.S. dollar in relation to the Mexican peso. Draw a supply and demand graph toillustrate each situation.a. Americans buy large quantities of Mexican tomatoes.b. Inflation in Mexico rises at a higher rate than in the United States.c. Americans invest heavily in Mexico because they feel the Mexican economy
will be strong.d. Interest rates rise in the United States. and have become relatively higher
compared to Mexican interest rates.e. Mexico becomes a much more popular tourist destination for Americans.
253
Unit 6
Activity developed by John Morton.
6. Explain three effects of a new law that would forbid U.S. citizens and businessesfrom trading with any other country.
7. Assume that the United States has large federal budget deficits that cause interestrates to rise.a. What would be the effect of this on the international value of the dollar?
Why?b. What would be the effect of this on the U.S. balance of trade? Why?c. Would the budget deficit and higher interest rates tend to increase or
decrease aggregate demand? Why?
8. How could a nation have a negative balance of trade and still not have a deficit inits balance of payments?
254
Unit 6
ACTIVITY 64 continued
Sample Multiple-Choice QuestionsCircle the letter of each correct answer.
255
Unit 6
1. When does the law of comparative advan-tage indicate that mutually beneficial inter-national trade can take place?
a. When tariffs are eliminated.
b. When transportation costs are almostzero.
c. When relative costs of production differbetween nations.
d. When a country can produce more ofsome product than other nations can.
e. When a country can produce a productin less time than another country can.
2. According to the principle of comparativeadvantage, worldwide output and consump-tion levels will be highest when goods areproduced in nations where which of thefollowing is true?
a. Opportunity costs are lowest.
b. Absolute advantages are highest.
c. The balance of trade is in a surplus position.
d. The exchange rate is falling.
e. The exchange rate is rising.
3. Which of the following is not a commonlyheard argument for protectionism?
a. A strong national defense requires thatsome military products be produceddomestically.
b. Infant industries need short-run, but notlong-run, protection from foreign com-petition.
c. Specialization along the lines of compar-ative advantage can lead to a lower stan-dard of living.
d. When other nations’ economies grow,the nations typically import fewer goodsand services.
e. If a nation does not protect its indus-tries, jobs will go to people in othercountries.
4. What does a balance-of-trade surplusimply?
a. Merchandise exports exceed merchandiseimports.
b. Merchandise imports exceed merchandiseexports.
c. Exports of services exceed imports of services.
d. Imports of services exceed exports of services.
e. Investment by foreigners exceeds domestic investment in other countries.
5. Which of the following transactions represents a deficit on the current accountsection of the U.S. balance of payments?
a. The Arab Capital InvestmentCorporation makes a loan to a U.S. firm.
b. A U.S. subsidiary exports raw materialsto its Canadian parent company.
c. U.S. firms and individuals receive dividends on U.S. investments in LatinAmerica.
d. U.S. tourists in Great Britain purchasepounds sterling.
e. Foreigners purchase U.S. securities.
6. What can an increase in U.S. interest ratesbe expected to do?
a. Adversely affect U.S. importers.
b. Encourage investment spending by U.S.firms.
c. Decrease the international value of thedollar.
d. Cause a net outflow of foreign capitalfrom the United States.
e. Increase the international value of thedollar.
7. What happens if a nation does not have anabsolute advantage in producing anything?
a. It has no comparative advantage either.
b. It will have a comparative advantage inthe activity in which it has a loweropportunity cost.
c. It will try to get along without trade.
d. It will export raw materials and importfinished products.
e. The international value of its currencywill rise.
8. How would an expansionary monetary policyaffect foreign investment in the United Statesand the international value of the dollar?
Foreign investment Value of the dollara. Decrease Appreciateb. Decrease Depreciatec. Increase Appreciated. Increase Depreciate
e. No change Depreciate
9. The following data show the quantities ofsoda and cheese that can be produced inthe United States and France with one unitof resources.
Soda Cheese (bottles) (pounds)
United States 20 60France 10 40
Which of the following statements is/are true?
I. France has an absolute advantage insoda.
II. The United States has a comparativeadvantage in soda.
III. The United States has an absolute advan-tage in cheese.
IV. The United States has a comparativeadvantage in cheese.
a. I only
b. II only
c. II and III only
d. II and IV only
e. I, II, and III only
10. If a contractionary monetary policy raisesinterest rates in the United States, what willhappen to the value of the U.S. dollar, thevalue of the Japanese yen, and the U.S. balance of trade?
Dollar Yen Balance of trade
a. Appreciate Depreciate Toward deficit
b. Appreciate Appreciate Toward deficit
c. Appreciate Depreciate Toward surplus
d. Appreciate Depreciate Toward surplus
e. No change Appreciate Toward deficit
11. What will be the effect of depreciating anation’s currency on net exports and aggregate demand?
Net exports Aggregate demand
a. Decrease Increase
b. Decrease Decrease
c. Increase Increase
d. Increase Decrease
e. No change Decrease
12. What would happen to interest rates,exports, and imports if the United Statesfollowed an expansionary fiscal policy anda contractionary monetary policy so thatthere was no net change in aggregatedemand?
Interest rate Exports Imports
a. Increase Decrease Decrease
b. Decrease Increase Decrease
c. Decrease Decrease Increase
d. No change Decrease Increase
e. Increase Decrease Increase
256
Unit 6
SAMPLE MULTIPLE-CHOICE QUESTIONS continued
13. The value of the U. S. dollar will rise in relation to the French franc if:
a. The U.S. demand for French wineincreases.
b. The Federal Reserve buys governmentsecurities.
c. Prices rise faster in France than in theUnited States.
d. The French demand for Kentucky bour-bon decreases.
e. Many Americans decide to visit France.
14. If exchange rates are allowed to fluctuatefreely and the U.S. demand for Japaneseyen increases, which of the following willhappen?
a. The U.S. balance-of-trade deficit willincrease in the long run.
b. Americans will have to pay more forJapanese goods.
c. The dollar will appreciate.
d. The Japanese will have to pay more forAmerican goods.
e. It will be more expensive for theJapanese to buy American real estate.
15. If a nation chooses to specialize and trade,which of the following situations could beexpected to occur as a result?
I. Increased standard of living
II. Increased resource availability
III. Increased quantity and quality of products
IV. Lower prices
V. Fewer domestic jobs
a. I only
b. I, II, and III only
c. I, II, III, and IV only
d. I, II, IV, and V only
e. V only
Use the information in the following chart to answerQuestions 16 and 17.
Corn Cotton (per acre) (per acre)
Egypt 400 bushels 500 bushels
Venezuela 300 bushels 200 bushels
16. In the absence of international trade, inEgypt the opportunity cost of production of one bushel of cotton is:
a. One bushel of corn.
b. 1.25 bushels of corn.
c. 0.8 bushels of corn.
d. 400 bushels of corn.
e. Impossible to determine from the information given.
17. If Egypt and Venezuela begin to engage ininternational trade, then:
a. Egypt will export corn and import cotton.
b. Egypt will import both corn and cotton.
c. Egypt will export both corn and cotton.
d. Egypt will import corn and export cotton.
e. It is impossible to determine whichcountry will import and export whichproduct.
257
Unit 6
SAMPLE MULTIPLE-CHOICE QUESTIONS continued
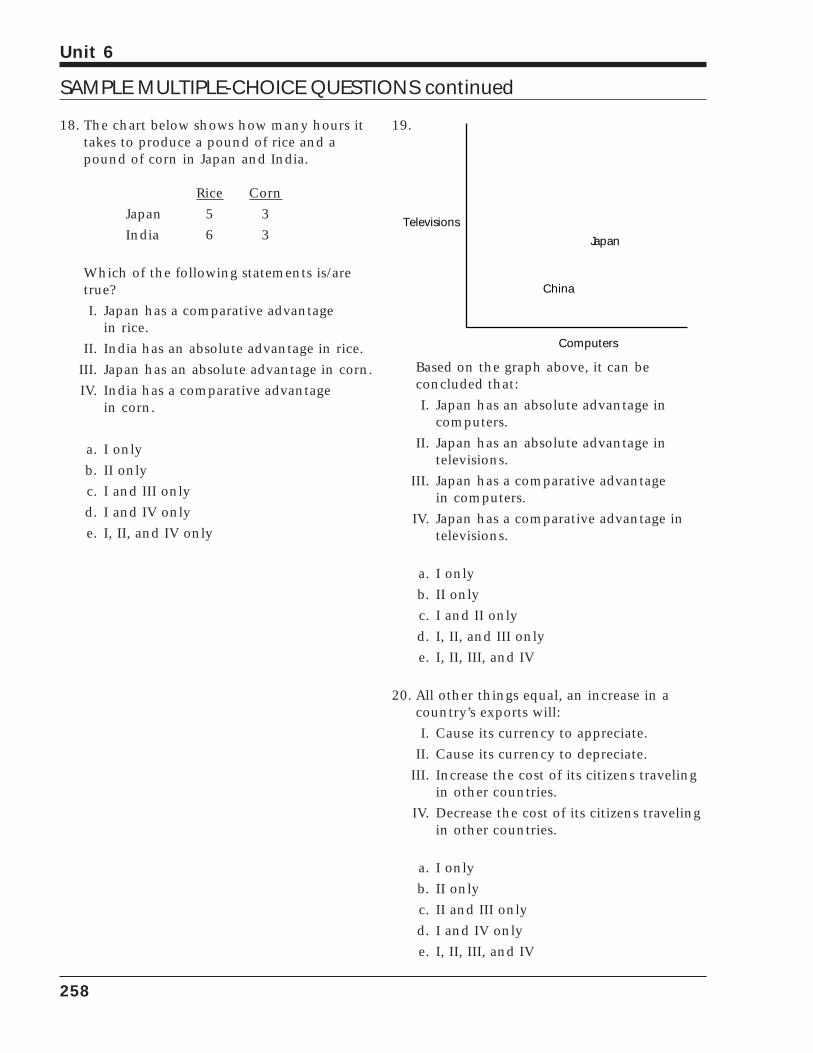
18. The chart below shows how many hours ittakes to produce a pound of rice and apound of corn in Japan and India.
Rice Corn
Japan 5 3
India 6 3
Which of the following statements is/aretrue?
I. Japan has a comparative advantage in rice.
II. India has an absolute advantage in rice.
III. Japan has an absolute advantage in corn.
IV. India has a comparative advantage in corn.
a. I only
b. II only
c. I and III only
d. I and IV only
e. I, II, and IV only
19.
Based on the graph above, it can be concluded that:
I. Japan has an absolute advantage in computers.
II. Japan has an absolute advantage in televisions.
III. Japan has a comparative advantage in computers.
IV. Japan has a comparative advantage intelevisions.
a. I only
b. II only
c. I and II only
d. I, II, and III only
e. I, II, III, and IV
20. All other things equal, an increase in acountry’s exports will:
I. Cause its currency to appreciate.
II. Cause its currency to depreciate.
III. Increase the cost of its citizens travelingin other countries.
IV. Decrease the cost of its citizens travelingin other countries.
a. I only
b. II only
c. II and III only
d. I and IV only
e. I, II, III, and IV
Televisions
Computers
China
Japan
258
Unit 6
SAMPLE MULTIPLE-CHOICE QUESTIONS continued
Sample Short Essay Questions1. In a recent year, the United States had a huge balance-of-trade deficit. Comment on
the following policies designed to correct the balance-of-trade deficit.a. Limit foreign investment by U.S. firms in other countries.b. Sell dollars so the value of the dollar goes down.c. Put high tariffs on autos, steel, and consumer electronics.
2. True, false, or uncertain, and why? “Tariffs actually increase domestic employmentby reducing foreign competition and creating more jobs for American workers.Furthermore, more jobs mean higher incomes with which Americans can buymore goods from abroad. Hence, instead of reducing foreign trade, tariffs tend toincrease it.”
3. Assume that Liechtenstein and Andorra, with equal (and very few) resources, canproduce the following:
Grapes (kilos) Wool (kilos)
Liechtenstein 100,000 100,000
Andorra 50,000 100,000
a. Which nation has an absolute advantage in grapes? Why?b. Which nation has a comparative advantage in grapes? Why?c. Should Liechtenstein specialize in grapes or wool? Why?d. Should Andorra specialize in grapes or wool? Why?
4. True, false, or uncertain, and why? “If a nation has an expansionary fiscal policyand a contractionary monetary policy, the international value of its currency willappreciate.”
*5. Assume that United States labor becomes more productive because of major tech-nological changes.
a. Using the aggregate supply and aggregate demand model, explain how theincreased productivity will affect each of the following for the United States.
i. Output
ii. Price level
iii. Exports
b. Explain how the change in exports you identified in iii. will affect the inter-national value of the dollar.
259
Unit 6
*Actual AP essay question from a past year.
*6. Assume that in the United States, nominal wage rates rise faster than labor produc-tivity. Analyze the short-run effects of this situation on each of the following.a. The general price levelb. The level of exportsc. The international value of the dollar
7. If the rate of inflation is higher in the United States than in other countries, analyze what will happen to:a. Exports.b. Imports.c. The international value of the dollar.
8. Assume that a worker can produce the following goods in the number of hoursshown below.
Mexico Canada
Wheat 5 hours 3 hours
Oil 3 hours 2 hours
Why would Canada and Mexico trade with each other when one nation has an absolute advantage in the production of both wheat and oil? Be specific indescribing what each country should import or export.
260
Unit 6
*Actual AP essay question from a past year.
SAMPLE SHORT ESSAY QUESTIONS continued
Sample Long Essay Questions1. The exchange rate between the Canadian dollar and other currencies has been free
to fluctuate since the mid-1960s. For each of the following (in some cases hypo-thetical) events, indicate whether the value of the Canadian dollar in terms of theU.S. dollar will tend to appreciate, depreciate, or remain unchanged. Explain youranswer. Use a supply and demand graph to illustrate each situation.a. Montreal hosts the Olympics.b. The rate of inflation in Canada increases relative to the U.S. inflation rate.c. Investors in Quebec purchase substantial real estate in nearby New England
and New York.d. A consortium of U.S. oil companies constructs a pipeline in Canada to
transport natural gas to the United States.e. Interest rates rise in the United States relative to those in Canada.f. New York and New England utilities contract to buy electricity from
Canada’s James River hydroelectric facility.
*2. The United States experiences an increase in exports due to changes in the tastesand preferences of foreigners for United States goods. As a result, the followingoccur.• The real Gross Domestic Product rises by three percent.• The inflation rate rises from five percent annually to ten percent annually.• The level of unemployment drops from seven percent to five percent.
a. Use aggregate demand and supply analysis to explain what has happened inthe economy.
b. Suppose the Federal Reserve decides to sell bonds in the open market.Analyze the short-run effects of this action on each of the following.
i. Interest ratesii. Output and employment
iii. Prices
c. Explain the effects of the change in interest rates caused by the FederalReserve’s action in b on each of the following.
i. The international value of the dollarii. Imports
iii. Exports
d. Now the federal government increases taxes while keeping its expendituresunchanged. Analyze the short-run effects of this action on each of the fol-lowing.
i. Output and employmentii. Prices
iii. Interest rates
261
Unit 6
*Actual AP essay question from a past year.
*3. A series of natural disasters occur that cause the following changes in the UnitedStates economy.• The real Gross Domestic Product drops by four percent.• The inflation rate rises from five percent to ten percent.• Unemployment increases from six percent to ten percent.
a. Use aggregate demand and supply analysis to explain what has happened inthe economy.
b. Suppose that the federal government, holding taxes constant, increases itsspending and the Federal Reserve increases its purchases of bonds. Explainin detail the short-run effects of these actions on each of the following.
i. Output and employmentii. Prices
iii. Interest rate
c. Explain how exports and imports will be affected by the changes in outputand prices resulting from the policies described in question b.
4. Suppose the European Union (EU) has decided to impose trade restrictions on agriculture and some specific manufacturing industries. In fact, the EU had decidedto reverse its decision to eliminate subsidies on some agricultural products of smallfarmers and to increase tariffs and quotas on the following key industries: steel,telecommunications, electronics, machine tools, computers, and aerospace producers. The EU hopes these actions will make Europe less dependent on foreignproducers for these essential goods.a. Which groups will gain and which will lose from these proposed
restrictions?b. What goals do governments intend to accomplish by imposing trade
restrictions?c. What are some of the costs that result from trade restrictions?d. What would be the likely impact of restrictive trade policies on the total
amount of trade between the EU and the rest of the world?e. Show graphically how subsidies, tariffs, and quotas restrict trade.
262
Unit 6
*Actual AP essay question from a past year.
SAMPLE LONG ESSAY QUESTIONS continued