aper 1 focus p - financial sector deepening zambia · women and financial inclusion in zambia focus...
TRANSCRIPT
Women and Financial Inclusion in Zambia
FOC
US
Pap
er 1
January, 2016Linda Jones andIrma Grundling

January 2016
Linda Jones is a globally recognised expert on women's empowerment in market systems and financial sectors. Sheis a hands-on consultant who advises on programmes in Africa and Asia, and contributes to the development fieldthrough training, publications and associations.
Irma Grundling is a development research consultant with more than 30 years of experience. She has managed researchprojects in 16 African countries.
This report was commissioned by FSD Zambia. The findings, interpretations andconclusions are those of the authors and do not necessarily represent those
of FSD Zambia and partner organisations.
Women and Financial Inclusion in Zambia
Linda Jones and Irma Grundling

About the FinScope FOCUS Series
The FinScope FOCUS series consolidates and synthesises data and information from the FinScope 2015 survey conducted in Zambia inMarch 2015. It is then combined with other data and information, much of it qualitative, to share in-depth findings and analysis on varioustopics related to financial inclusion. The papers are aimed at policy makers, financial service providers, and other stakeholders who cancontribute to the necessary changes that will result in greater financial inclusion for women.
Papers in the FinScope FOCUS series include:
FOCUS Paper 1: Women and Financial Inclusion in Zambia examines the state of women’s financial inclusion, compares their financialinclusion to that experienced by male counterparts, and highlights how women’s more generally disadvantaged situationleads to greater exclusion in access to and usage of financial services.
FOCUS Paper 2: Woman Smallholder Farmers: Managing their Financial Lives is intended to deepen our understanding of current andpotential financial inclusion of women smallholder farmers in Zambia from their own experience and perspective.
Future papers in the FinScope FOCUS series include:
FOCUS Paper 3: SME Financial Inclusion in Zambia
FOCUS Paper 4: Understanding the Insurance Market in Zambia
ATM Automated Teller Machine
FSDP Financial Sector Development Plan
FSDZ Financial Sector Deepening Zambia
HDI Human Development Index
MFI Microfinance Institution
MPI Multidimensional Poverty Index
PPI Progress out of Poverty Index
PPP Purchasing Power Parity
SACCO Savings and Credit Cooperative
UNDP United Nations Development Programme
USD United States Dollar
ZMW Zambian Kwacha
Acronyms
Cover photograph: Martin Alsop

Table of Contents
INTRODUCTION 1
ABOUT FINSCOPE ZAMBIA 2015 1
DEMOGRAPHIC BACKGROUND 2
Population distribution 2Education 2Poverty/incomes 2
CURRENT FINANCIAL INCLUSION STATISTICS 5
Use of formal services 6
Banking services 7Non-bank microfinance services 8Insurance services 9Money transfer/payment services 9Utility bills 9Remittances 10
Use of informal services 10
Chilimba – saving 11Savings groups 12Kaloba – borrowing 12
FINANCIAL SERVICE NEEDS 13
Cash flow management 14Risk management 14Investing in building assets and productive activities 16
MAIN DRIVERS OF FINANCIAL BEHAVIOUR AND CHOICE OF FINANCIAL SERVICES 17
Access to financial services 17
Eligibility for formal services 17Perceived proximity 18
Financial behaviour 19
Saving 19Borrowing 21Sending and receiving money 24
IMPLICATIONS FOR STAKEHOLDERS 25
Recommendations for financial service providers 25Recommendations for policy makers 26Recommendations for other stakeholders including NGOS 26

List of TablesTable 1: PPI quintile and monthly/daily income by gender 3Table 2: Sources of money most relied upon by men and women 4Table 3: Barriers to banking – main reasons for not having a bank account 7Table 4: Barriers to uptake of microfinance services 8Table 5: Reported barriers to uptake of insurance services 9Table 6: Percentage of women and men using electronic payments for goods and services 9Table 7: Percentage of men and women using electronic payments for utilities 9Table 8: Money transfer channels mostly used for remittances 10Table 9: Barriers to usage of Chilimba 11Table 10: Women and men's financial capacity and empowerment 13Table 11: Investing to generate income 16Table 12: Strategies for future planning 16Table 13: Saving or borrowing for investing in assets and productive activities 16Table 14: Percentage of adults in possession of key documents disaggregated by sex 17Table 15: Percentage of adults in possession of key documents taking skewing variables into account 18Table 16: Percentage of adults who know the nearest financial service access point (by type) 18Table 17: Definition of saving 19Table 18: Main drivers of savings behaviour 20Table 19: Most important criteria for choosing a savings mechanism 20Table 20: Savings mechanisms used by those who save 21Table 21: Main drivers of borrowing behaviour 22Table 22: Most important criteria for choosing a lender 22Table 23: Lenders used by those who borrowed money 23Table 24: Repayment method for goods on credit 23
List of FiguresFigure 1: Gendered population for 16 years and older 2Figure 2: Gendered education distribution of adult population 2Figure 3: Distribution of Zambian adult population by PPI Quintile 3Figure 4: Levels of financial inclusion 5Figure 5: Financial access strand 5Figure 6: Income generating activities of excluded females 6Figure 7: Women and men's use of formal and informal services across PPI levels 6Figure 8: Percentage of rural/urban women and men using formal services 6Figure 9: Percentage of banked women and men 7Figure 10: Percentage of women and men who use non-bank microfinance services 8Figure 11: Women and men's use of informal services according to PPI level 10Figure 12: Women and men’s use of informal services by rural and urban domicile 10Figure 13: Percentage of women and men using Chilimba 11Figure 14: Percentage of women and men using savings groups 12Figure 15: Percentage of women and men using Kaloba 12Figure 16: Percentage of adults who have fallen behind or are struggling financially 13Figure 17: Financial risks experienced in the 12 months prior to the FinScope survey 14Figure 18: Perception regarding responsibility for funeral costs 15Figure 19: Percentage of adults who save money 19Figure 20: Percentage of women and men who borrowed in the prior 12 months 21Figure 21: Use of remittances 24

1
IntroductionThe purpose of FinScope FOCUS: Women and Financial Inclusion in Zambia is to examine the state of women’s financial inclusion, tocompare their financial inclusion to that experienced by male counterparts and to highlight how women’s more generally disadvantagedsituation leads to greater exclusion in access to and usage of financial services.
In our analysis we recognise that women and men are not homogenous groups, and thus other variables must be considered: specifically,the rural-urban divide and levels of poverty. For the most part, we do not make an effort to compare women and men in Zambia to theirequivalents in other countries, but analyse and describe financial inclusion across variables within the country. As FinScope Zambia 2015is based on women and men’s responses about their financial lives, this paper reports on the perspective of individuals, primarily women,rather than that of financial institutions.
The objectives of the paper are to examine:
n Current financial inclusion statistics as they pertain to women and menn The different types of financial management that women and men undertake for day-to-day cash flow management, risk
management, and investing in asset building and productive activities;n The ability of women and men to access available financial services as a result of eligibility, perceived proximity, and
awareness/knowledge of available services;n Women and men’s use of financial services – money transfer, savings, credit and insurance and how they differ; n Women and men’s financial behaviour and where/how they access financial services
About Finscope Zambia 2015FinScope Zambia 2015 is the third FinScope survey implemented in Zambia. Financial Sector Deepening Zambia (FSDZ), in partnershipwith the Bank of Zambia (as coordinators of the Government's Financial Sector Development Plan – FSDP), and with advisory support fromFinMark Trust, implemented FinScope Zambia 2015 with the following objectives:
n To track overall trends in financial inclusion over time in terms of:
o Changes in the levels of inclusion – both formal and informal inclusiono Changes in terms of the type of financial services being used and the type of providers
n To assess whether Zambia is on track in terms of achieving national financial inclusion targets
The FinScope Zambia 2015 sample was drawn by the Central Statistical Office (CSO) of Zambia using the sample frame of the 2010population census; the sample comprised 866 enumerator areas (EAs) within which the survey was conducted. The sample is representativeat national and provincial levels, as well as representative of urban and rural districts within provinces. CSO's definitions of urban andrural were used for the survey. The objective was to conduct 8,660 interviews; 8,570 were achieved representing a response rate of98.96 percent. Slightly over half of this total (approximately 4500) was female and 23.9 percent were farmers. FinScope examinesfinancial inclusion from the consumer’s perspective, exploring issues of access, usage and outcomes (demand-side) and does not mapthe supply side1.
Data analysis was conducted specifically to disaggregate for women and men within the entire FinScope Zambia 2015 dataset. Thisenabled reporting on women and men both in general as well as according to urban or rural residence and level of poverty.
1 For more information on the FinScope Zambia 2015 survey and topline findings please refer to Bank of Zambia and Financial Sector Deepening Zambia (2015)) FinScopeZambia 2015 Topline Findings; Bank of Zambia and Financial Sector Deepening Zambia (2015) FinScope Zambia 2015 Brochure.

2
EducationAs shown in Figure 2, the education profile of women and men is also skewed: the majority of women have left school by grade nine orlower, with only 26 percent of women continuing to secondary or post-secondary compared to over 38 percent of men who have continuedtheir schooling after grade nine.
These age and education findings do not bode well for women’s financial inclusion since other FinScope surveys2 conducted in variousAfrican countries have demonstrated that adults younger than 35 years of age and adults with lower levels of education are more likely tobe financially excluded. Therefore, based on the demographic and educational profile of women in Zambia, we would expect lower levelsof financial inclusion.
Poverty/IncomesDespite the middle-income status assigned to Zambia, the majority of Zambians are poor. The UNDP multidimensional poverty index3
reports that between 2002 and 2012, 74.5 percent of the population earned less than USD1.25 per day Purchasing Power Parity or PPP4
(‘absolute poverty’).
Demographic BackgroundPopulation DistributionWithin the adult population we see significant differences in terms of the demographic profile of women and men. There are more womenthan men over 16 years of age – 51 percent to 49 percent respectively. However, the female adult population is much younger than themale adult population, with over 65 percent of women in the 16 to 35 year range compared to 55 percent of their male counterparts. Onthe other hand, in the adult population, men that are 35 years and older represent approximately 45 percent of total men, while only 34percent of the adult female population are in this age group. Figure 1 divides the gendered age distribution into ten-year intervals from16 years and up.
2 e.g. FinScope Rwanda 2012, FinScope Tanzania 2013, FinScope Mozambique 2014, Access to Financial Services Survey Nigeria 2014, FinAccess Kenya 2014.3 Consolidated from tables in UNDP Human Development Report 2014. http://hdr.undp.org/sites/default/files/hdr14-report-en-1.pdf Viewed on September 12, 2015.4 PPP = Purchasing Power Parity equalises the purchasing power of different currencies by eliminating the differences in price levels between countries. The $1.25
poverty line is calculated for a basket of goods that would cost USD1.25 in the US. See for example http://smallbusiness.chron.com/define-purchasing-power-parity-807.html
16 to 25 years
26 to 35 years
36 to 45 years
46 to 55 years
56 to 65 years
66 or older
%26.4
32.5
28.230.4
19.417.2
12.98.1
7.15.6
6.13.5
Figure 1: Gendered Population For 16 Years And Older
n Malen Female
No formal education
Grade 1 – 4
Grade 5 – 7
Grade 8 – 9
Grade 10 – 12 (O-level)
Grade 12 (A-level)/Certificate/Diploma (undergraduate)
Degree (postgraduate) & above
%4.8
8.1
7.610.6
27.130.2
22.524.8
24.118.0
12.47.7
1.70.6
Figure 2: Gendered education distribution of adult population
n Malen Female

3
The FinScope survey utilises the well-established and widely used Progress out of Poverty Index (PPI), an approach that was developed bythe Grameen Foundation to determine levels of poverty within a country. The PPI asks 10 non-income questions about a household’scharacteristics and asset ownership and scores answers, converting the total score per household to the likelihood of the household fallinginto a specific poverty level. These questions and scores are developed on a country-by-country basis, and Zambia has created astandardised set of questions, scoring and PPI categories (five levels or quintiles). Thus, in the FinScope survey, standardised PPI scoresare used to allocate households to a level of poverty. Each of the five PPI levels indicates a poverty range and does not represent an equalproportion of the population; for example, over 60% of households in Zambia are found in the lowest two quintiles. Note that PPI 1represents the poorest households, and PPI 5, the most well-off. Many of the findings in this paper are correlated to PPI levels.
According to the FinScope Zambia 2015 findings, women and men are fairly equally represented across PPI quintiles. Figure 3 showsthat almost 20% of the population falls into the lowest quintile while a mere 0.9 percent are found in PPI 5. The largest cluster of adults(42.1%) are from households in PPI 2.
There is no significant difference between male and female adults in terms of PPI distribution; of the 62 percent of adults in the lowest 2PPI quintiles, 61.8 percent of women are represented in these quintiles while 62.2 percent of men are represented (showing no statisticallysignificant difference according to gender). However, as Table 1 indicates, women in each quintile earn less on average than their malecounterparts5. The income amount is based on the actual figure reported by individuals and is then correlated to their standardisedhousehold PPI level. (Note that the USD conversion is actual and not based on a PPP conversion described above as it is a complexcalculation beyond the scope of this paper)6.
5 Because the highest PPI category (PPI 5) is so small, this sub-category in the FinScope data is not representative of this segment of the adult population. Furtheranalysis is therefore not done for this segment.
6 A historical conversion rate of ZMW 6.651 to USD 1 for mid-February 2015 is used as that was the rate at the time of the FinScope survey. However, at the time ofwriting this paper in January 2016, the exchange rate was around ZMW 11 to USD 1 with no indication of change in the near future meaning the conversion would bemuch less at around USD 3.54 per day. See http://www.oanda.com/currency/historical-rates/
Figure 3: Distribution of Zambian adult population by PPI Quintile
n 19.9% PPI 1 n 42.1% PPI 2 n 26.5% PPI 3 n 10.5% PPI 4 n 0.5% PPI 5
19.9%
42.1%
26.5%
10.5%
0.5%
Average & median monthly (Kwacha) Average & median per day @ 6.651(Feb 2015)
Mean Median Mean Median
PPI 1
Male 532 300 2.7 1.5
Female 336 150 1.7 0.8
Total 450 208 2.3 1.0
PPI 2
Male 1098 500 5.5 2.5
Female 543 200 2.7 1.0
Total 867 400 4.3 2.0
PPI 3
Male 1667 800 8.4 4.0
Female 1004 500 5.0 2.5
Total 1363 600 6.8 3.0
PPI 4
Male 4225 2000 21.2 10.0
Female 2190 1300 11.0 6.5
Total 3365 1800 16.9 9.0
Total
Male 1515 583 7.6 2.9
Female 853 400 4.3 2.0
Total 1232 500 6.2 2.5
Table 1: PPI Quintile and monthly/daily income by gender

4
There is also a gendered difference in sources of income that are most relied upon by men and women. Table 2 shows that both womenand men (17.7% and 25.5% respectively) are more likely to earn income from agriculture than receive money from another source.Following this however there are differences in sources of income: that is, women are more inclined to depend on a family member forcash or be self-employed, while men participate more in ‘piece work’ (day labour) or salaried jobs. And, 11 percent of women versus 15percent of men have more than one income source.
Once again, the story for women is less encouraging than that for men; financial inclusion surveys across Africa7 have illustrated thoseadults relying on salaries/wages are more likely to be financially included than adults relying on inconsistent sources of income or who aredependent on others for money to pay their expenses.
7 e.g. FinScope Rwanda 2012, FinScope Tanzania 2013, FinScope Mozambique 2014, Access to Financial Services Survey Nigeria 2014, FinAccess Kenya 2014
Table 2: Sources of money most relied upon by men and women
Male Female
Income from own farm produce/agricultural activities – crops 25.5% 17.7%
Piece work/day labour 17.4% 10.2%
Self-employed in own business 11.7% 13.9%
Salaries / wages from a company / business 14.3% 9.0%
Receive money from household member 2.5% 14.7%
Household member pays all my expenses 4.1% 11.6%
Salaries/wages from government 4.1% 2.4%
Trading – buy goods and sell it again to others 2.3% 3.6%
Salaries / wages from a farm business (farm worker) 3.5% 1.3%
Money from family who are not part of the household 1.3% 3.0%
Trading products collected from nature 1.7% 1.2%
Rental income 1.1% 1.6%

5
The FinScope 2015 access strand9, in Figure 5 below, illustrates that women are more likely than men to be financially excluded acrossformal and informal services. Women who are financially included, are significantly less likely than men to take up formal financial servicesand more likely to rely on informal services. In fact, Figure 5 illustrates that 38.2 percent of women and men use formal financial services,with men (43.2%) experiencing much greater formal inclusion than women (33.3%). (This calculation combines those that use only formalfinancial services as well as those that use both formal and informal services.)
There is some overlap between those that use both formal and informal financial services with 17.5 percent of men and 16.1 percent ofwomen utilising both formal and informal services. This percentage is skewed towards urban men and women and higher PPI levels; aswomen and men go up the PPI scale to greater affluence, their use of informal services increases suggesting a more varied use of financesince individuals in PPI 3 and PPI 4 also show greater utilization of formal services.
Current financial inclusion statisticsFinancial inclusion in Zambia is growing. FinScope 2009 found that 37.3 percent of adults were financially included, while today almost60 percent of Zambian women and men experience some level of financial inclusion. As Figure 4 indicates, men have an advantage overwomen as 61.2 percent of men are included versus 57.6 percent of women, and women are more excluded then men in every category:of the 42.6 percent of women who are financially excluded, 62.2 percent are in rural areas and 75.7 percent are found in PPI levels 1 and2. This means that poor rural women are the most excluded group in Zambia – which has been reinforced by recent qualitative research8.
8 Jones and Grundling (2015) Women Farmers’ Financial Inclusion in Zambia. FSDZ.p The FinScope access strand delves deeper into the financial inclusion statistics – disaggregating uptake of formal and informal financial services and at the same time
highlighting the proportion of adults using both formal and informal services. It also illustrates the proportion of adults that are financially excluded per populationsegment.
All adults
Rural
Urban
PPI 1
PPI 2
PPI 3
PPI 4
% of adults included61.2
57.4
52.147.9
74.667.0
46.140.5
54.551.3
70.567.4
90.885.0
Figure 4: Levels of financial inclusion
n Malen Female
All adults
Male
Female
21.4 16.8 21.1 40.7
% of adults
n Have/use financial services – formal services onlyn Have/use formal services AND informal services
n Have/use financial services – informal services onlyn Financially excluded
25.8 17.5 18.0 38.8
17.2 16.1 24.1 42.6
Figure 5: Financial Access Strand

6
The sources of income for women who are financially excluded show that a significant percentage (27.8%) are dependent on a householdmember to pay expenses or get money from a household member, while 21.7 percent of financially excluded women rely on farmingactivities for their income. Just 13.1 percent depend on piece work (day labour) and 11.2 percent on income from small businesses asillustrated Figure 6.
Money from agricultural activities
Dependent on household member to pay expenses
Get money from household member
Piece work
Self-employed in own business
%
21.7
14.0
13.8
13.1
11.2
Figure 6: Income generating activities of excluded females
Use of Formal Services Focusing in on formal financial services and gender differences, Figure 7 shows that women use formal financial services less than menacross all PPI levels, and that the difference in usage increases as we move down the PPI spectrum. In PPI 1, for example, women areabout half as likely as men to use any kind of formal financial service.
Figure 7: Women and men's use of formal and informal services across PPI levels
All adults
PPI 1
PPI 2
PPI 3
PPI 4
%43.2
33.3
23.512.3
34.222.3
53.747.7
86.275.8
n Malen Female
Of those men and women who access formal financial services, urban women and men are both twice as likely as rural equivalents to useformal financial services, with men 50% more likely than women to do so (see Figure 8):
Figure 8: Percentage of rural/urban women and men using formal services
All adults
Rural
Urban
%43.2
33.3
30.522.2
62.144.5
n Malen Female
7
In this section, the formal services discussed are banking services, non-bank microfinance services, insurance and moneytransfers/payments.
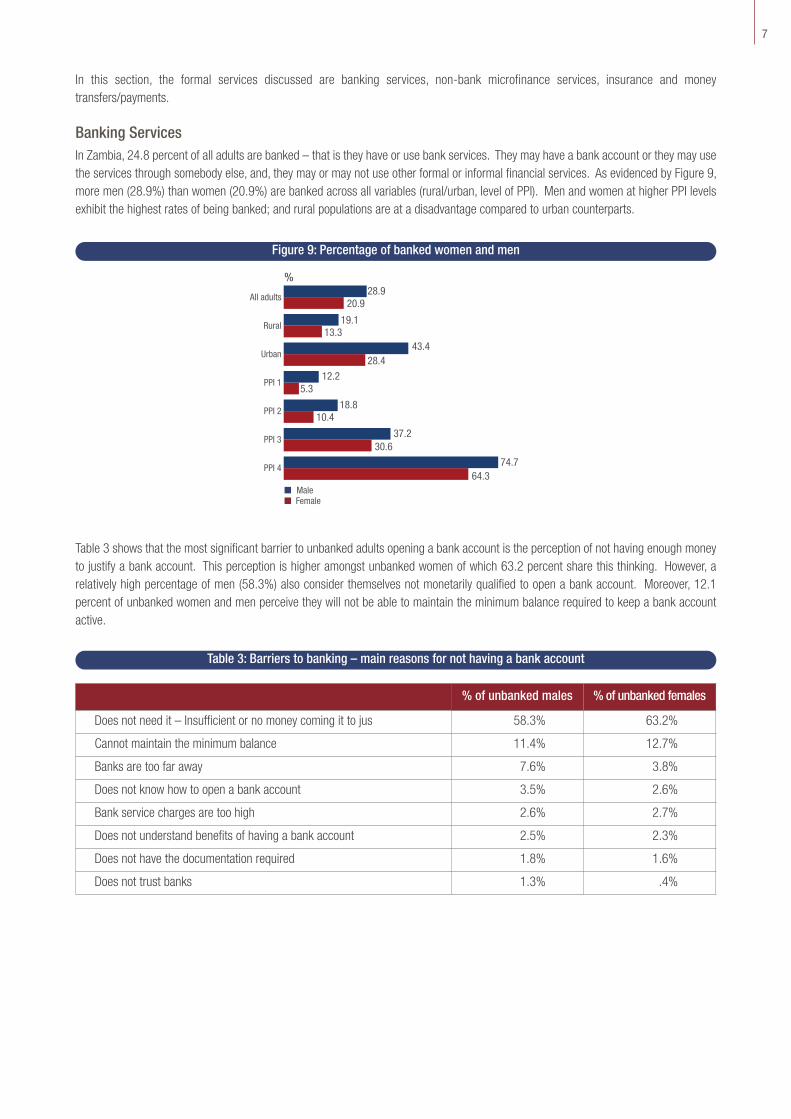
Banking ServicesIn Zambia, 24.8 percent of all adults are banked – that is they have or use bank services. They may have a bank account or they may usethe services through somebody else, and, they may or may not use other formal or informal financial services. As evidenced by Figure 9,more men (28.9%) than women (20.9%) are banked across all variables (rural/urban, level of PPI). Men and women at higher PPI levelsexhibit the highest rates of being banked; and rural populations are at a disadvantage compared to urban counterparts.
Table 3 shows that the most significant barrier to unbanked adults opening a bank account is the perception of not having enough moneyto justify a bank account. This perception is higher amongst unbanked women of which 63.2 percent share this thinking. However, arelatively high percentage of men (58.3%) also consider themselves not monetarily qualified to open a bank account. Moreover, 12.1percent of unbanked women and men perceive they will not be able to maintain the minimum balance required to keep a bank accountactive.
All adults
Rural
Urban
PPI 1
PPI 2
PPI 3
PPI 4
%28.9
20.9
19.113.3
43.428.4
12.25.3
18.810.4
37.230.6
74.764.3
n Malen Female
Figure 9: Percentage of banked women and men
Table 3: Barriers to banking – main reasons for not having a bank account
% of unbanked males % of unbanked females
Does not need it – Insufficient or no money coming it to jus 58.3% 63.2%
Cannot maintain the minimum balance 11.4% 12.7%
Banks are too far away 7.6% 3.8%
Does not know how to open a bank account 3.5% 2.6%
Bank service charges are too high 2.6% 2.7%
Does not understand benefits of having a bank account 2.5% 2.3%
Does not have the documentation required 1.8% 1.6%
Does not trust banks 1.3% .4%

8
Figure 10: Percentage of women and men who use non-bank microfinance services
Non-bank microfinance servicesThere is extremely low use of non-bank microfinance services in Zambia including from microfinance institutions (MFIs), Savings and CreditCooperatives (SACCOs) and microlenders. In most cases, usage is under two percent of adults, with some higher levels of usage in theupper PPI levels. Figure 10 shows that:
n for MFI services, use by only 1.25 percent of the adult populations, uptake is very slightly skewed to women except at the lowestpoverty level;
n Of the 1.4 percent of adults who use SACCO services, there is a skewing towards men in urban and rural contexts as well as atall PPI levels. This is especially so in highest PPI level where men are three times as likely to be involved in a SACCO;
n While just 1.7 percent of all adults use microlender services, uptake is much more significant in urban populations and amongthose at higher PPI levels 3 and 4 – and particularly in PPI level 4. Moreover, men are much more likely to use microlender servicesthan women (1.7% of men vs. 0.9% of women) with increases as poverty levels decrease.
All adults
Rural
Urban
PPI 1
PPI 2
PPI 3
PPI 4
%4.6
3.0
4.32.8
5.13.2
2.91.6
3.52.3
5.63.8
9.46.8
n Malen Female
The percentages in Table 4 indicate that the most significant barrier to uptake of non-bank microfinance services (among those who don’tuse these services) is the perception of not having enough money to justify an account. This reason is offered considerably more formicrofinance than for bank services (see Table 3 above).
Table 4: Barriers to uptake of microfinance services
Male Female
Insufficient money to justify it 73.0% 84.8%
Cannot maintain the minimum balance 17.9% 22.2%
Institutions are too far away 21.6% 14.1%
Does not know how to open an account 11.9% 9.3%
Service charges are too high 11.5% 8.3%
Does not understand benefits of having a account 10.4% 9.0%
Does not have the documentation required 7.5% 7.0%
Does not trust microfinance institutions 7.0% 6.6%
Can get the same services elsewhere in the community 2.8% 2.9%

9
Insurance servicesThere is a very low usage of insurance services amongst women and men in Zambia – only 2.8% of Zambians are insured with men(4.0%) more often insured than women (1.7%). Of those women that do get insurance, they are most likely to have life assurance, motorvehicles insurance (third party insurance), funeral insurance, medical insurance or health coverage.
The low uptake of insurance services in Zambia is caused predominantly by a lack of awareness regarding insurance. In fact, the vastmajority of men and women have never heard of insurance. Other barriers reported by women and men and summarised in Table 5include a perception that insurance services are not affordable, and a general lack of knowledge about insurance, how it works, its benefitsand from where it is available.
Table 5: Reported barriers to uptake of insurance services
Male Female
Has never heard of insurance 86.9% 89.6%
Cannot afford it 3.5% 2.5%
Does not know how it works 2.0% 2.6%
Does not know the benefits of insurance 1.2% 1.0%
Does not know how to get it/where to get it 1.0% 0.7%
Money transfer/payment servicesPurchasing goods and services
Zambia is largely a cash-based society with electronic payments picking up slowly. Despite a middle income status and growing middleclass, in the 12 months prior to the FinScope survey, only 14.4 percent of adults used electronic payment channels for purchasing goodsand services. Moreover, 50 percent more men used electronic payments than women in the time period (17.5% to 11.5%). The electronicpayment channels most used by participating women and men were ATM/debit card and/or mobile money services (see Table 6).
Table 6: Percentage of women and men using electronic payments for goods and services
Male Female
ATM/debit card 12.4% 8.0%
Mobile money services 8.0% 4.8%
Bank transfer 5.5% 3.2%
Credit card 1.7% 1.2%
Table 7: Percentage of men and women using electronic payments for utilities
Male Female
ATM/debit card 12.5% 8.1%
Credit card 2.9% 2.9%
Bank transfer 9.8% 4.2%
Mobile money services 14.3% 7.2%
Utility billsSurprisingly, only 24.5 percent of adults had utility bills to pay during the 12-month period prior to the FinScope survey with a strongskewing towards urban areas (41.1% urban vs 10.9% of adults in rural areas). Of those who did pay utility bills in the 12 months prior tothe FinScope survey, 19.5 percent of women and men took advantage of electronic channels to do so (that is about 5 percent of the adultpopulation). Table 7 breaks this out for the percentages of men and women paying utility bills via electronic channels.
As Table 7 illustrates, the electronic payment of utility bills has been adopted more widely by men who pay in this way almost twice asoften as women: that is, of those that pay utility bills electronically, 25.8 percent of men do so while only 14 percent of women (much lessthan 1% of all women) follow suit. Furthermore, women who pay electronically are much more likely to be in PPI 3 and PPI 4 (14.6% and22.5% respectively) versus less than 5 percent of females who pay bills in PPI 1 and PPI 2.

10
RemittancesRemittances are sent or received by a significant number of Zambian men and women. Over 38 percent of adults (35.9% females; 40.5%of males) sent money or received money during the 12-month period prior to the FinScope survey. As shown in Table 8, of those whoremit money, a majority of both men (65.5%) and women (58.2%) use only formal money transfer channels to do so. However, women(6.1%) who send/receive money are more inclined than males (5.6%) to use informal channels.
Figure 11: Women and Men's Use of Informal Services according to PPI Level
Table 8: Money transfer channels mostly used for remittances
Channels used by those who sent money Male Female
Through the Post Office 25.8% 18.1%
Through mobile phone 22.0% 22.1%
Bank transfer/Pay into bank account 16.7% 17.5%
Friends or family takes it there 18.6% 13.9%
Bus/taxi driver takes it there 4.6% 5.6%
Through Western Union/Money gram/Swift cash 5.2% 4.4%
Channels used by those who received money Male Female
Through the Post Office 25.5% 19.1%
Through mobile phone 19.0% 17.3%
Bank transfer/Pay into bank account 16.2% 14.5%
Friends or family bring it 11.6% 14.9%
Through Western Union/Money gram/Swift cash 5.6% 6.8%
Bus/taxi driver brings it 4.6% 4.2%
Use of Informal Services In Zambia, even the use of informal services is not high, decreasing at the lower PPI level. Unlike formal financial services, Figure 11shows that women use informal financial services more than men across all PPI levels, with the difference between women and men’susage never being more than 10 percent.
All adults
PPI 1
PPI 2
PPI 3
PPI 4
%35.5
40.3
31.034.734.9
39.0
38.543.4
37.946.7
n Malen Female
The disparity in usage of informal versus formal services is also less between rural and urban populations (less than 5%), and this remainswhen we compare women to men (see Figure 12).
Figure 12: Women and men’s use of informal services by rural and urban domicile
All adults
Rural
Urban
%35.5
40.3
35.037.0
36.143.5
n Malen Female

11
The informal services that are examined in this section are chilimba, savings groups and kaloba. Other informal services such as savingwith community members, informal shop credit and informal remittances exist on a more ad hoc basis.
Chilimba – SavingA chilimba is a traditional merry-go-round mechanism where a group of trusted individuals pool an agreed upon sum of money at regularintervals, each receiving a pay-out in turn. In Zambia, 12.4 percent of adults use chilimba services, the main driver being to save andaccess a lump sum of money. Figure 13 illustrates that Chilimba membership is significantly skewed towards women (16.0% of womenare members vs. 8.8% of men), with the most pronounced skewing at PPI levels 3 and 4.
The most significant barrier to Chilimba membership for both women and men is the lack of groups in the community followed by nothaving enough money to participate.
All adults
Rural
Urban
PPI 1
PPI 2
PPI 3
PPI 4
%8.8
16.0
7.411.8
10.720.1
5.86.6
7.214.5
12.120.0
12.428.4
n Malen Female
Figure 13: Percentage of women and men using Chilimba
Table 9: Barriers to usage of Chilimba
Male Female
There are no such groups in the community 24.1% 18.9%
Don’t have any money to save 13.8% 24.5%
Don’t have enough money to save 12.8% 17.0%
Don’t trust them 16.3% 10.7%
Don’t see benefits in what they have to offer 7.4% 4.5%

In summary, women in Zambia experience greater financial exclusion than men at all income levels, whether rural or urban, and regardlessof the type of financial services. Women in particular are excluded from formal financial services and are much more apt to use informalservices and continue to do so even when access to formal services is achieved. Individuals of both genders are more likely to bedisadvantaged in terms of financial inclusion if they are:
n Rural rather than urbann Living in a household with a lower PPI
Therefore, poor rural women are the most excluded segment of the population in terms of financial services. And yet, it is these womenthat most need services to move their way out of poverty.
12
Savings GroupsThere is relatively low usage of Savings Group services in Zambia, with only 6.5 percent of adults belonging to a Savings Group. The maindriver is to save (usually for a pre-determined time of shareout) while a secondary driver is to have someone to turn to when in financialneed. (Note that although this driver is far less significant than the need to save, it is mentioned here as it is more significant driver ofSavings Group membership than for Chilimba membership). Women are more likely than men to be members of a Savings Group in urbanareas as well as in the lower two PPI levels. Figure 14 provides details on the breakdown of women and men using Savings Groupsaccording to rural/urban and PPI level variables.
The most significant barrier to Savings Group membership is not having enough money to participate with non-availability of such groupsbeing the second most significant barrier.
Kaloba – Borrowing Kaloba is the traditional moneylender in Zambian society. Only 4.1 percent of adults use Kaloba. And, although there are no significantgender differences in the lower PPIs, urban males and males in PPI 4 are more likely than females to use these services as shown inFigure 15.
Figure 14: Percentage of women and men using savings groups
All adults
Rural
Urban
PPI 1
PPI 2
PPI 3
PPI 4
%6.36.7
7.57.4
4.46.0
6.97.9
6.17.4
5.44.5
7.77.2
n Malen Female
Figure 15: Percentage of women and men using Kaloba
All adults
Rural
Urban
PPI 1
PPI 2
PPI 3
PPI 4
%4.43.83.94.1
5.23.54.44.4
4.94.2
4.03.8
3.41.2
n Malen Female

13
All adults
Rural
Urban
PPI 1
PPI 2
PPI 3
PPI 4
All adults
Rural
Urban
PPI 1
PPI 2
PPI 3
PPI 4
%25.925.5
28.931.3
21.419.6
37.334.9
27.729.4
19.219.0
14.39.4
31.431.9
32.836.4
29.227.5
37.741.3
34.136.1
26.826.2
21.713.8
n Malen Female
Financial service needsWomen and men in Zambia require financial services to manage day-to-day cash flow, handle and mitigate the risk of unexpected events,and invest in asset building and productive activities. Before we turn to these, it is interesting to note that the FinScope data points to thefact that women in general have lower financial capability and empowerment than men in areas of decision-making, seeking advice, andrecord keeping or tracking cash flow. This information, along with the demographic background above set the stage for understanding thechallenges that result in lower financial inclusion for women versus men.
Table 10: Women and men's financial capacity and empowerment
Male Female
% adults involved in financial decision making in the household 88.8% 84.2%
% adults who don’t know who to turn to if they needed financial advice 10.3% 15.6%
% of adults keeping track of money received and spent 62.0% 58.9%
% of adults who know how much money they spent previous week 57.7% 47.7%
% of adults who adjust expenses according to money they have 87.7% 86.3%
Figure 16: Percentage of adults who have fallen behind or are struggling financially
Figure 16 shows that a significant proportion of adults in Zambia feel they cannot manage their financial lives effectively. In terms of day-to-day cash flow management, a quarter of all adults reported that they had fallen behind or that they were always struggling to keep upwith regular expenses. And, although there is no significant difference between men and women in this regard, women in PPI 1 and PPI2 as well as those residing in rural areas tend more than other women and men to have fallen behind or are struggling to stay on top ofregular expenses. As with regular expenditures, a significant proportion of the adult population have fallen behind or always feel they arestruggling to keep up with unexpected expenses (31.7%). In particular, women in rural areas and those in PPI 1 and 2 are more likely thanmales in these categories to struggle or fall behind, while women in PPI 4 are less likely than corresponding males to have done so.

The following sections describe the three primary financial service needs of women and men – cash flow management, risk management,and investing in assets and productive activities – and how women and men differ in terms of how they cope.
Cash flow ManagementFor the most part, income for poor men and women does not come in on a regular basis: that is, those living on USD1.25 per day do notreceive USD1.25 per day on a regular basis. There is therefore a significant need for poor women and men to manage cash inflows andoutputs to manage both regular expected expenses – i.e. day-to-day (e.g. food, clothing, income generation) as well as periodic (e.g. rentand school fees), as well as irregular unexpected expenses. While cash flow management is a challenge for many women and men inZambia, they utilise a number of strategies to cope.
The main expense for households is food and clothing10 followed by: school expenses, rent, fuel (charcoal/wood/paraffin) and/or electricity,and telephone bills/talk time. For all women in rural areas and those in the lower two PPI quintiles in urban areas, school/tuition fees aremost likely to be highest priority for periodic expenditures. In fact, education is regarded as the most costly life event by 61.5 percent ofthe population. In order to cover this cost, women are more inclined to rely on family and friends for contributions to provide for children’seducation.
Risk ManagementZambian adults are affected by a range of unexpected expenses that represent financial risks since extra money is not usually availableas many households are already struggling to meet day-to-day expenses.
Figure 17 describes the financial risks experienced by respondents in the 12 months prior to the FinScope survey. Interestingly, inflation– represented by the rise of prices of goods such as groceries – was reported by over 73 percent of the male and female population,followed by illness, unforeseen school expenses, farming losses (for men) and death of a family member (for women).
14
10 Not measured in FinScope 2015 because in previous studies it was included and everybody irrespective of gender just said food and clothes was their top expense.
Unexpected rise in the price of goods such as groceries etc.
Illness in your household that required medical expenses
Unforeseen school expenses
Harvest/crop failure/loss of livestock
Death of a household or family member resulting inunexpected costs for you/your household
Loss of income as a result of an unexpected drop in theprice you get for produce/harvest/ products you sell
Loss of the income of an income earner of the household
% of adults included73.773.2
59.762.1
40.940.5
38.431.8
34.637.0
27.021.3
26.128.4
n Malen Female
Figure 17: Financial risks experienced in the 12 months prior to the FinScope survey
Certain unexpected events tend to affect women more than men, and especially women in rural areas and in the two lowest PPI levels. Asillustrated above, these events are:
n Illness in the household that required medical expensesn Death of a household/family member n Loss of income of income earner in the household
When these risk events occur, women and men use three main strategies to cover the expense: saving, borrowing or cutting down onexpenses. As we saw above, there is very low awareness of insurance in Zambia, and rather than insurance, saving and borrowing arethe most significant risk mitigation strategies for Zambians.

15
Of the 29.1 percent of adults who had made provision for unexpected expenses, men (33.9%) were more likely to do so than women(24.5%). And, women in PPI categories PPI 3 (26.8%) and PPI 4 (40.3%) were much more prone to do so than women in lower PPIs(21.4% PPI 1; 20.6% PPI 2).
Overall, saving is the most common strategy to provide for unexpected events with 62.2 percent of adults who make provision for unexpectedexpenses using savings to cope at these times. Among those that utilise saving as a coping mechanism for unexpected expenses thefollowing describes differences between men and women in accessing formal services:
n Men are more likely to use formal mechanisms (34.6 %) than women (24.8 %)n If formal savings are used, bank savings are the most likely formal service; (22.1 percent of women who save to cope use bank
services, while 31.5 percent of male counterparts do son Women are slightly more likely to use informal than formal mechanisms (25.5% informal, 24.8% informal), and the most likely
informal mechanism is Chilimba (18.5% of females who save to cope with unexpected expenses use Chilimba versus 9.2% ofmales)
n Women are more likely to use informal services (25.5 %) than men (17.2 %)n Women are more likely to keep money at home than men: women savers (45.1%) in contract to men savers (40.4%).
However, using saving to deal with an unexpected event is skewed to women in urban areas and those in PPI 3, borrowing is skewed tothose in rural areas, and PPI 1 and 2. In addition, women in PPI 4 both use savings more and borrow more, although there is a differencebetween borrowing in the two lower PPIs and two higher PPI levels in terms of the type of lender used. That is, for those who borrow inPPI 1 and 2, lenders tend to be family, friends and kaloba (moneylender), but for those in PPI 3 and 4, who are less poor, the lender is moreoften a formal financial institution, typically a bank or a micro-lending organisation. Buying livestock to sell, farming and trading/smallbusiness activities are also regarded as significant coping strategies – more so for males than females though.
Funeral costs were identified by 18.8 percent of adults as the most costly life event. However, in this case, men and women differ in termsof their perceptions regarding who covers funeral costs. While both more women and men overall consider family members to be responsiblefor funerals, a higher percentage of women regard this to be the case than men as illustrated in Figure 18. Conversely, whereas thecommunity rates second among men and women, men are more inclined to perceive this as the responsibility of the community. Moreover,men (61.2%) are more likely than women (56.9%) to feel that they have someone in their community that they can turn to if they needsupport, and 50 percent more women than men do not know to whom they should turn for support with regard to funeral costs. Figure18 illustrates the perceived responsibility for funeral costs broken down by gender.
Figure 18: Perception regarding responsibility for funeral costs
The family members
The community
Do not know
The household
%48.1
51.7
36.530.5
5.17.5
3.14.5
n Malen Female

16
Investing in building assets and productive activitiesInvesting in asset building and productive activities – beyond the day-to-day expenditures on the farm or in the household – is not commonlypracticed by either women or men. For example, Table 11 shows that when asked if they had bought, built or started anything with theintention to sell in future for a profit or to earn income, only about one fifth of the adult population responded in the affirmative to bothquestions.
Respondent gender
Male Female Total Adults
Respondents who have bought/built/started something with the intention to sell in the future for a profit
Yes 22.6% 16.1% 19.3%
No 77.4% 83.9% 80.7%
Respondents who have bought/built/started something with the intention of using it to earn an income
Yes 22.4% 16.4% 19.3%
No 77.6% 83.6% 80.7%
Table 11: Investing to generate income
Moreover, when asked if they are doing anything to make sure they have money for things they want in the future, 48.2 percent of menanswered “yes” while only 32.4 percent of women did so. Among those who are making such provision, Table 12 shows that saving,followed by business and then farming are the three key strategies for future planning.
With specific regard to investing in assets or productive activities, the percentage of men and women who report financial managementbehaviours declines dramatically. As we see in Table 13, extremely low percentages of women or men – three percent or fewer – save orborrow to invest in assets and productive activities.
Table 12: Strategies for future planning
Male Female
Saving/putting money aside 30.5% 31.3%
Bought/started a business to generate money 21.1% 26.7%
Farming activities/growing something to sell/selling livestock 22.2% 16.3%
Table 13: Saving or borrowing for investing in assets and productive activities
Saving for investments in assets and productive activities Male Female
Buying or building a house to live in 3.0% 3.0%
Buying household appliances, goods or furniture 1.2% 1.9%
Starting or expanding business 1.7% 1.9%
Buying land 1.3% 1.5%
Borrowing for investment in assets and productive activities Male Female
Buying or building a house to live in 3.0% 1.4%
Starting or expanding business 2.7% 3.0%
Buying farming equipment or implements/fishing equipment 1.1% 1.2%
Buying a bicycle, motorcycle, car, truck or other transport 2.0% .3%
Based on the above, we see that women and men in Zambia employ various strategies to manage their financial lives. Depending on theneed to manage day-to-day expenses, cover the cost of emergencies or invest in building assets and productive activities, these strategiescan vary. Furthermore, there are differences between women and men, and variation in these differences depending on rural/urbanresidence and level of poverty.
17
Main drivers of financial behaviour and choice of financial servicesBefore discussing in greater detail financial services poor women and men use and who supplies these services, it is useful to brieflyexamine differences between women and men in terms of access to financial services as this can significantly affect women’s financialinclusion.
Access to Financial ServicesAccess to financial services is a prerequisite for uptake and usage of services. To analyse the issue of access to financial services, it isnecessary to have a working definition of access. There are various dimensions to access – such as physical access to points of service,eligibility to take services offered as well as the suitability, affordability and awareness of services for example – which makes it a complexconcept to measure. In terms of access this paper will focus only on the dimensions measured by the FinScope 2015 survey:
n Eligibility to take up servicesn Perceived physical access to points of service
Eligibility for Formal ServicesIn order to provide access to finance in Zambia, formal service providers often implement what is commonly called ‘KYC’ – know yourclient. This requires two items:
n Proof of identityn Proof of residence
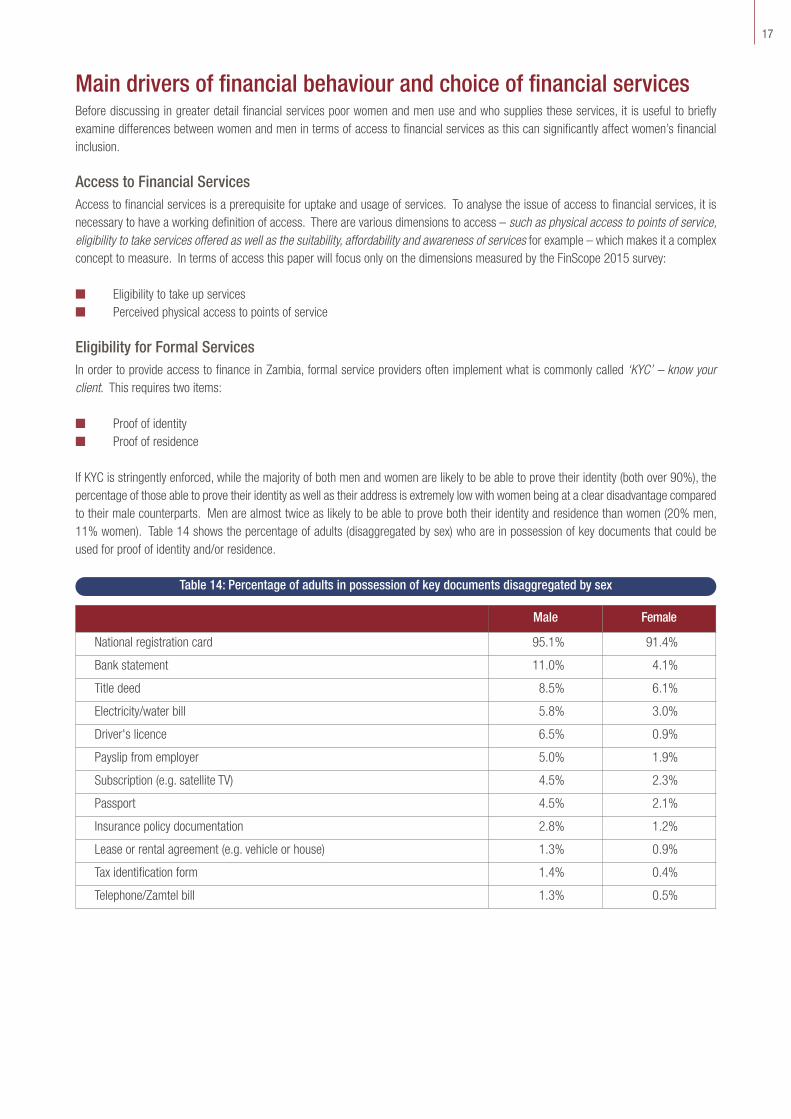
If KYC is stringently enforced, while the majority of both men and women are likely to be able to prove their identity (both over 90%), thepercentage of those able to prove their identity as well as their address is extremely low with women being at a clear disadvantage comparedto their male counterparts. Men are almost twice as likely to be able to prove both their identity and residence than women (20% men,11% women). Table 14 shows the percentage of adults (disaggregated by sex) who are in possession of key documents that could beused for proof of identity and/or residence.
Table 14: Percentage of adults in possession of key documents disaggregated by sex
Male Female
National registration card 95.1% 91.4%
Bank statement 11.0% 4.1%
Title deed 8.5% 6.1%
Electricity/water bill 5.8% 3.0%
Driver's licence 6.5% 0.9%
Payslip from employer 5.0% 1.9%
Subscription (e.g. satellite TV) 4.5% 2.3%
Passport 4.5% 2.1%
Insurance policy documentation 2.8% 1.2%
Lease or rental agreement (e.g. vehicle or house) 1.3% 0.9%
Tax identification form 1.4% 0.4%
Telephone/Zamtel bill 1.3% 0.5%

18
Having the appropriate documentation to meet KYC requirements is further skewed towards urban dwellers and individuals in higher PPIquintiles resulting in greater exclusion among rural and poorer households. Table 15 illustrates how these two variables skew results forthe possession of key documents and the differences between women and men.
Table 15: Percentage of adults in possession of key documents taking skewing variables into account
Skewing Variable Document Type Male Female
RuralProof of ID & residence 13.1% 5.7%
Proof of identity 95.3% 91.1%
UrbanProof of ID & residence 40.0% 23.5%
Proof of identity 95.9% 92.4%
PPI 1Proof of ID & residence 7.4% 3.5%
Proof of identity 95.6% 92.0%
PPI 2Proof of ID & residence 16.6% 6.0%
Proof of identity 95.3% 91.2%
PPI 3Proof of ID & residence 32.9% 23.1%
Proof of identity 94.6% 90.1%
PPI 4Proof of ID & residence 66.5% 62.3%
Proof of identity 98.3% 97.2%
Perceived Proximity FinScope 2015 reports on perceived proximity – that is respondents’ awareness of a financial service access point. Table 16 itemisesdifferent financial services access points and reveals that women are significantly less likely than men to know where the nearest financialservice access point is (with surprisingly low knowledge from both men and women on the location of microfinance institutions).
Table 16: Percentage of adults who know the nearest financial service access point (by type)
Male Female
Post Office 85.3% 73.5%
Bank branch/ATM 84.1% 71.4%
MFI 50.2% 36.0%
Mobile money agent 45.6% 43.4%
Bank agent 60.2% 44.5%
Access to financial services can therefore be constrained by rules (proof of identity and address, or regulation to prove the same) or by alack of knowledge/information about available services, and an inability to access a point of service.

19
Financial BehaviourAs we see from above, women and men have various financial service needs (cash flow management, risk management, and investmentin assets and productive activities), and access to various financial service providers. These are important characteristics in understandingthe overall situation of financial inclusion in Zambia as well as how these influence the financial behaviour of women and men – how theysave, borrow and transfer money. This is covered below.
Saving Although ‘saving’ seems to be a straightforward concept, there are a variety of ways poor people save. Most women and men definesaving as putting money somewhere so that it will not be spent, however there are differences in how this is done as evidenced in Table17.
Figure 19: Percentage of adults who save money
Table 17: Definition of Saving
Male Female
Putting money somewhere to stop you from spending it 32.1% 32.2%
Putting money somewhere to keep it safe 18.9% 20.0%
Putting money away so that the total amount increases over time as it earns interest 18.7% 15.1%
Putting money aside for you to use later for something special 10.7% 10.1%
Putting money away so that the total amount increases over time as you put more away 9.7% 9.5%
Savings is the money that is left over from your income after expenses 5.8% 6.1%
Don’t know 4.1% 7.0%
Saving is a relatively common practice in Zambia, with 61.1 percent of adults indicating they save with a lower percentages of womensaving (58.9%) than men (67.5%). Figure 19 shows that while there are some differences among urban and rural women and men, thegreatest difference in saving behaviour occurs as we move up the PPI levels to PPI 4 where 84.4 percent of men and 77.6 percent ofwomen save.
All adults
Rural
Urban
PPI 1
PPI 2
PPI 3
PPI 4
%67.5
58.9
63.555.5
73.562.4
64.451.4
61.555.2
71.862.5
84.877.6
n Malen Female

20
Table 18 shows that Zambian adults save for two primary reasons – for cash flow management or to manage risk; this influences theirselection of a savings mechanism. Investing in assets and productive activities is the least significant driver of savings behaviour amongstZambian adults, with men more disposed than women to save for this purpose. Most adults who save do so to smooth cash flow, withwomen even more likely than men to save for this purpose (with low gender difference regarding other drivers of savings behaviour).
Purpose Drivers Male Female
Cash flow management
Living expenses for when you do not have money 29.1% 36.1%
Education or school fees 15.8% 15.4%
Farming expenses such as seeds or fertiliser 5.5% 3.8%
Business expenses such as additional stock 2.2% 2.2%
Risk managementAn emergency other than medical 21.7% 19.8%
Medical expenses 4.7% 4.9%
Investing in assets and productive activities
Buying or building a house to live in 3.0% 3.0%
Buying household appliances, goods or furniture 1.2% 1.9%
Starting or expanding business 1.7% 1.9%
Buying land 1.3% 1.5%
Table 18: Main drivers of savings behaviour
For most savers, quick access to their savings and keeping their savings safe from theft/fire are the most significant criteria for choosinga savings mechanism. Women are more likely than men to choose a savings mechanisms based on their being able to get quick accessto their money, while men tend to choose a savings mechanisms based on the safety factor. This variation between men and women’scriteria for choosing savings mechanisms is illustrated in Table 19.
Table 19: Most important criteria for choosing a savings mechanism
Male Female
Quick access 20.1% 22.5%
Money safe from theft/fire 18.8% 15.8%
Proximity – convenient access 13.0% 14.0%
Easy/simple to use 11.6% 13.1%
Earn good interest 12.5% 10.1%
Trust 9.1% 10.1%
Nobody/a particular person should not know about it .8% 1.3%
Other family members/friends use it .7% 1.3%
As saving is a significant risk mitigation strategy for Zambian adults, mainly driven by the need to smooth cash flow and the need to havequick access to money, many adults (42.7%) who save keep cash at home. Women are more likely to keep cash at home and saveinformally, while men make greater use of formal saving services:
n Women savers (45.1%) are more likely than males (40.4%) to keep cash at homen Men savers (38.2%) use formal savings services more than women do (28.2%) which includes saving through a bank, MFI, SACCO,
pension, or mobile phonen Women savers (29.9%) tend to use informal savings services more than men (19.6%) such as Chilimba, Savings Groups, other
community groups or requesting an employer or community member to keep money for them.

21
Table 20 specifies the different savings mechanisms used by women and men that save and to what extent.
BorrowingA high percentage of Zambian adults (75.3%) report that they avoid borrowing if they can, while an even greater number (83.9%) prefersaving for something rather than borrowing to obtain it. Men (37.4%) are more likely to borrow than women (27.2%), with women in PPI4 more apt to borrow than other women (29.2%). Variations amongst women/men, rural/urban, and PPI levels 1 to 4 are illustrated inFigure 20.
A key constraint to borrowing is concern over repayment; of those adults who didn’t borrow in the 12 months prior to FinScope, 48 percentdid not do so because they were worried they would not be able to meet repayment requirements. For women, this is a bigger obstaclethan for men, with 53.3 percent of women not borrowing for this reason as compared to 42.2 percent of men. This aversion to risk (andprobably well-founded) is even more pronounced amongst rural females and those in PPI 1 and PPI 2.
Table 20: Savings mechanisms used by those who save
Male Female
Cash at home 40.4% 45.1%
Bank 34.7% 25.3%
Chilimba 10.4% 20.9%
Family members/friends keep money safe 13.1% 11.1%
Buy farming/fishing inputs in advance 12.5% 6.6%
Carry cash on person 5.3% 10.0%
Buy business stock or materials 8.0% 5.8%
Pension/NAPSA 8.3% 3.4%
Savings Group 4.0% 5.8%
Keep on mobile phone 4.9% 2.8%
Buy building materials to use later 3.7% 2.4%
Community group or church 2.3% 3.3%
Employer 2.6% 1.2%
Give to someone in community for safe keeping 1.9% 1.5%
Savings and credit cooperative (SACCO) 2.1% 1.1%
Figure 20: Percentage of women and men who borrowed in the prior 12 months
All adults
Rural
Urban
PPI 1
PPI 2
PPI 3
PPI 4
%32.4
27.2
32.826.6
32.027.7
33.526.5
31.127.0
31.027.6
38.129.2
n Malen Female

22
Table 21 sets out the drivers for Zambian women and men to borrow. For women, living expenses is by far the main reason, while menare more or less equally motivated by living expenses and education/school fees.
Purpose Drivers Male Female
Cash flowmanagement
Living expenses for when you do not have money 17.7% 27.3%
Education or school fees 16.8% 14.8%
Buying household goods 1.3% 1.8%
Farming expenses such as seeds or fertiliser 8.3% 3.4%
Business expenses such as additional stock 4.6% 5.6%
Unexpectedexpense
Emergency other than medical 7.5% 5.4%
Medical expenses/emergencies 8.7% 8.8%
Funeral expenses 3.7% 3.2%
Investing inassets andproductiveactivities
Buying or building a house to live in 3.0% 1.4%
Starting or expanding business 2.7% 3.0%
Buying farming equipment or implements/fishing equipment 1.1% 1.2%
Buying a bicycle, motorcycle, car, truck or other transport 2.0% .3%
Table 21: Main drivers of borrowing behaviour
Most adults who borrowed money in the 12 months prior to the FinScope survey did so to cover living expenses and school fees. Women,in particular, show a greater tendency to borrow for day-to-day living expenses. Men who borrowed in the 12 months prior to FinScope,while still borrowing mainly for cash flow management, are somewhat more prone than women to borrow for the purpose of investing inproductivity as well as asset building.
For most borrowers, quick access to money and trust in the lender are the most significant criteria for choosing a lender which needs tobe interpreted within the context of borrowing being a risk mitigation strategy (see Table 19 below) as well as the general fear of borrowingdiscussed above.
Table 22: Most important criteria for choosing a lender
Male Female
Quickest access to the money 25.3% 25.0%
Trust 21.6% 23.0%
Proximity – convenient access 15.1% 15.1%
Easy/simple to use 12.7% 10.1%
Repayment terms suits me 10.1% 11.9%
Interest rates are low 3.7% 3.2%

23
Buying goods/services on credit also takes place to some degree; 16.6 percent of adults received goods/service on credit in the 12 monthsperiod prior to FinScope. This behaviour is somewhat skewed towards women (17.5% of whom received goods/service on credit duringthis period vs. 15.7% of males) except in PPI level 4 where more men than women receive goods/services on credit (21.2% of males vs.17.4% of females). FinScope data also reveals that urban women get goods/services on credit more than rural women – that is, 19.6percent of women in urban areas versus 15.3 percent of women in rural areas.
The main purpose for acquiring goods/service on credit is for personal or household use with 96.4 percent of adults reporting this reason.Of the women who obtain goods/service on credit 98.1 percent receive personal or household items, while 94.2 percent of men do so.However, of men utilizing advance credit, more of them tend to invest in productivity than women (8.8% of males vs. 3.3% of females whoreceived goods/services on credit invest in productivity).
The main method of repayment for goods/service on credit is to pay instalments over time; 61.4% of adults who got goods/services oncredit paid for these in instalments over time whilst 41.6% got the goods/services and then paid the full amount at a later time. Table 24provides gender disaggregated data for method of repayment. Showing that women pay in instalments more often than men. While thisis the first choice for men, they are more likely than women to repay the full amount at a later time.
Borrowing money is mainly driven by the need to smooth cash flow for regular expenses and for risk management – underpinning theneed to have quick access to money and trust with the lender – therefore, borrowers (76.9%) have a preference to borrow from family andfriends. To a much lesser extent, other informal and formal lenders are used for borrowing. Men borrowers (11.4%) are more likely thanwomen (7.4%) to borrow from formal lenders such as banks, microlenders, MFIs and employers, while women borrowers exhibit a greatertendency than men (almost twice the number) to use the services of kaloba (moneylenders) as the data shows in Table 23.
Table 23: Lenders used by those who borrowed money
Male Female
Family/friends – had to pay back 65.9% 64.6%
Family/friends – did not have to pay back 11.4% 11.8%
Kaloba 7.6% 13.6%
Bank 8.0% 4.6%
Microlender 6.4% 2.8%
Employer 6.1% 1.9%
Microfinance Institution 2.7% 4.0%
Savings Group 1.3% 4.0%
Community based org 1.4% 2.2%
Table 24: Repayment method for goods on credit
Male Female
You got … and then paid in instalments 56.7% 66.1%
You got … and then paid the full amount at a later time 47.0% 37.3%
You got … and used it to generate money sold it and paid back 0.6% 0.5%
You paid back in kind 2.2% 2.0%

24
Sending and Receiving MoneySending money to someone is significantly skewed towards males while receiving money is slightly skewed towards females. Amongthose who send money, most send to family members not in the household (49.5%): parents (25.1%), spouses (17.8%) and children(4.8%). There is also a significant difference between male and female beneficiaries of remittances in terms of what remittances are usedfor – female beneficiaries (52.0%) are significantly more likely than males (44.0%) to use it for household purposes whilst male beneficiariesare significantly more likely than females to use remittances to cover educational, farming, business and building/renovation expenses.Figure 21 illustrates the priority areas for remittance receipts, and the differences between women and men in spending.
Remittances in Zambia is an important service for financial management.
Figure 21: Use of remittances
Household use
Education
Farming expenses
Business expenses
Hospital/medical expenses
Building/renovation/expansion
%44.0
52.0
21.720.0
9.77.2
5.84.0
3.02.9
2.71.2
n Malen Female

25
Implications for stakeholdersWomen are a viable and interested market segment who could benefit from a range of financial services while offering providers opportunitiesto expand their offerings. For individual solutions, deeper analysis will be required to understand the specifics of the case and to determinethe best design for a service or initiative.
Recommendations for financial service providersUnderstanding the market for a specific service: Women may need different financial services (savings, credit, insurance, moneytransfer) according to the level of poverty, rural or urban location, productive activity, household economy, socio-cultural norms, and so on.Before designing a service, various markets need to be researched and analysed. In some cases, this can be quick, but in other instancesthis could require more nuanced and robust research across different contexts.
Designing a service for a targeted market segment: Once information gathering and analysis are completed, financial services shouldbe designed that can meet the requirements of the targeted market segment while still be profitable for the financial institution. Forexample, in the case of loan products, what size of loan, term of repayment, type of repayment would be viable for both borrowers andlenders.
Recognizing that finance is often not enough: In order to create healthy clients, finance (credit, savings, insurance, money transfer) isoften not enough. For example, illiterate women might need literacy training; women microentrepreneurs often have to develop or improvecash management and bookkeeping skills; in agriculture, knowledge of inputs, access to new techniques and technologies and marketinformation can all be critical to successful production and sales. Providing such non-financial services to clients can be handled throughreferrals to government programmes, connections to civil society organisations or engaging with private sector partners.
Leveraging the knowledge of others in the system: In Zambia, there are a host of local and international NGOs as well as associationsand government agencies who work closely with women and have a deep understanding of their financial and non-financial access,challenges and opportunities with regard to running a household or a business. This knowledge can be leveraged through informationexchanges or more formalised partnerships and utilised in developing a sustainable service offering for women (see FSDZ’s 2016 catalogueof Women-Serving Organisations).
Assessing and mitigating risks: The risks associated with a target market segment and the financial services can be assessed, and amitigation strategy developed. For example, if school fees need to be paid at a low-income time of year, how can finance be made availableso that households are able to repay when income is more plentiful. Mitigation strategies such as communication, monitoring andenforcement can be put in place to reduce any identified risks.
Recommendations for policy makersSharing information on women’s financial needs: Policy makers can make information – national and regional statistics, researchstudies, reports, etc. – available to the financial industry on women’s financial needs. Such information can be useful to support theassessment of financial needs, to determine market size and location, and to design appropriate services for women according to theircontext (e.g. poverty level, rural or urban location, productive activities).
Creating supportive regulations: Regulations may not be appropriate for women and their financial needs (at the household and businesslevel). For example: are women able to access needed inputs and technologies for income generation once they have credit to do so? Or,are there regulations that hamper the design of appropriate financial services – e.g. interest rates, loan terms, pricing of productive outputs?Developing infrastructure: Primary challenges for women and men, particularly in rural areas of Zambia, are the distance to markets andservices, and the supporting infrastructure to overcome these distances. Infrastructure needs include: financial access points, moneytransfer agents, affordable energy and telecommunications, roads and transportation, marketplaces, and electricity.

26
Delivering training / technical information suitable for women in business: On average, women have much lower access to trainingthan men. This can be due to women’s lack of visibility in a sector (e.g. unpaid family labour in rural areas), the appropriateness of trainingfor women, delivery approaches and timing and so on. When training services are provided, we witness good uptake by women. However,the training service has to meet the needs of women and government programmes can fall short of this goal.
Promoting partnerships and joint actions: Policy makers can promote or participate in partnerships that lead to greater financial inclusionfor women: for example – aligning government strategies with the needs of the private sector or civil society who engage with women;providing support to initiatives from information and expertise to financial support and programme funding.
Recommendations for other stakeholders including NGOsSupporting non-financial services: Other stakeholders – private sector and civil society – are often the best placed to deliver sustainablenon-financial services to women. For example, a business membership organisation can provide business training, information on standards,and marketing opportunities. Private sector actors – e.g. suppliers, retailers, buyers, contractors – can inform women on the needs in amarket system. While in some instances, businesses recognise the need and benefit to offer such ‘embedded’ services to women, at othertimes, this support has to be facilitated by other organisations and programmes.
Supporting the development of savings groups in target regions and sectors: Once information gathering and analysis are completed,savings group services, organised or delivered by NGOs, should be flexible so that they can be adapted to meet the requirements of thetargeted market segment. For example, what levels of saving can be expected, how would payouts be timed, will lending saved capitalback to the group make sense, and if so what would appropriate terms be?
Making information available to women on services and opportunities: Even when a service is available, women may not be awarethat it is available, where it is available, what its characteristics are or how it can be useful to them, etc. Further, women need informationon government and civil society programmes, business opportunities, and financing options. Service providers, civil society organisationsand government programmes can all be sources of such information in a well-functioning system.
Women’s groups, associations and networks: Opportunities for women to join together offer a whole host of benefits: e.g. informationsharing, access to services including financial services, access to information and programmes, mentoring/coaching, confidence buildingand advocacy. Grassroots organisations may spring up independently but outside organisations (public and civil society) often have a roleto play in supporting group formation and development (see FSDZ catalogue on Women-Serving Organisations).
Collaboration amongst stakeholders: Stakeholders in a market or financial system can collaborate to encourage the participation ofwomen. Joint public-private initiatives, can develop, promote and deliver support and services to women. For example, if suppliers areprepared to offer inputs on credit to women, they may require government backing to launch the service and raise women’s awarenessabout this option. Once established, a viable business solution can often persist without further government intervention.

27
Notes

28
Notes


Financial Sector Deepening Zambia Incito II Office Park
Kabulonga Road KabulongaLusaka Zambia
+260 211 848 065/6 +260 96 797 0316 mobile