apparent osl ages of modern deposits from fa ... · had their luminescence signal fully reset...
TRANSCRIPT

Apparent OSL ages of modern deposits fromFabergstølsdalen, Norway: implications for samplingglacial sediments
G. E. KING,y* R. A. J. ROBINSON and A. A. FINCHDepartment of Earth & Environmental Sciences, University of St Andrews, Irvine Building, North Street, St Andrews,Fife KY16 9AL, Scotland, UK
Received 22 May 2013; Revised 8 September 2013; Accepted 13 September 2013
ABSTRACT: The application of optically stimulated luminescence (OSL) dating within glacial settings can belimited where sediments have not had their OSL signal fully reset by sunlight exposure. Heterogeneous bleachingcan result in age overestimations, and although it is recognized that certain depositional settings are more likely tohave experienced sufficient sunlight exposure to bleach the OSL signal, no comprehensive study has empiricallyinvestigated the processes of sediment bleaching, or the variability in bleaching between deposits of the same typeand within the same glacial catchment. A suite of modern glacial and glaciofluvial sediments from Fabergstølsda-len, southern Norway, have been analysed to explore the controls that sedimentary processes and depositionalsetting have on bleaching of the OSL signal of quartz. There is considerable variability in the residual OSL ages ofsimilar modern deposits, which reflects high sensitivity of the OSL signal to sediment source, sedimentary process,transport distance and depositional setting. Overdispersion values are greatest for the sediments which have beenmost heterogeneously bleached and these sediments have the lowest residual ages. Sampling strategies thatincorporate sufficient consideration of the depositional framework of sample settings can minimize the effects ofunbleached residuals on OSL age determinations. Copyright # 2013 The Authors. Journal of Quaternary Sciencepublished by John Wiley & Sons Ltd on behalf of Quaternary Research Association
KEYWORDS: glacial environments; Norway; optically stimulated luminescence dating; sediment bleaching; transport and
depositional processes.
Introduction
A major challenge to optically stimulated luminescence(OSL) dating within glacial environments is identifying sedi-ments that have been fully exposed to sunlight, and so havehad their luminescence signal fully reset (bleached). Althoughthe effects of partial bleaching can be overcome, for examplethrough the use of age models (e.g. Thrasher et al., 2009a),understanding how depositional processes influence bleach-ing opportunities for sediments may enable more informedsample selection within glacial settings. Sediments have thepotential to be bleached following erosion when grains areexposed to sunlight at the surface, and during waterborne andaeolian transport and deposition. Fuchs and Owen (2008)have made recommendations on the likely bleaching historyof glacial and associated sediments, drawing on the literatureof previous OSL applications in glacial settings. However,beyond the early work of Gemmell (1988, 1997) on thebleaching of suspended sediments from meltwater streams,only a few studies have explored the processes of sedimentbleaching in glacial environments empirically (e.g.Alexanderson, 2007; Alexanderson and Murray, 2012). Alex-anderson (2007) measured the OSL of six bed-load samplesof ripple-laminated, sandy, longitudinal- and side-bar depos-its from five different, ice-distal Greenlandic rivers. Sherecorded unbleached residual doses of 0.1–1 Gy for riversdraining perennial snowfields of �2 km distance from hersampling sites, which equate to residual ages of between 50
and 500 years and are similar to those reported for modernfluvial sediments (e.g. Wallinga, 2002). Alexanderson (2007)observed no variation in unbleached residuals between riversof different channel width, depth, discharge, sediment load orsediment transport distance, but acknowledged that analysisof a downstream transect throughout a catchment would berequired to elucidate the effects on sediment bleaching ofthese individual factors. Alexanderson and Murray (2012)sampled ice-proximal, glaciofluvial and ice-distal glaciomar-ine sediments; they recorded residual doses of up to 12 Gyfor quartz OSL of ice-proximal deposits, whereas ice-proxi-mal glaciomarine sediments were completely bleached.Partial bleaching of a sediment results in a distribution of
De values beyond that explained by random and systematicuncertainties, which is called the sample overdispersion (sd,Galbraith et al., 1999). Overdispersion can have a range ofcauses (cf. Murray and Roberts, 1997; Nathan et al., 2003;Olley et al., 1997), but key to this research is partial orheterogeneous bleaching (Murray et al., 1995). Because OSLDe distributions are controlled by the amount of bleachingthat mineral grains have been exposed to, source sedimentDe distributions are modified by the processes of erosion andsedimentation that they experience. If the De distributions ofsource sediments (e.g. subglacial or paraglacial sediments)can be well constrained, then the De distributions of samplesfrom different depositional environments (e.g. glaciofluvialbars) should encode information about the bleaching thatoccurs during transport and depositional processes.In the present study, the residual luminescence signals of a
suite of complementary glacial sediments are investigated ina transect along a single glacial meltwater channel. Appropri-ate sample selection is key to obtaining accurate and preciseOSL ages for glacial sediments, and this study makes severalrecommendations for successful sampling strategies and theidentification of sediments which have been most effectivelybleached.
�Correspondence: G. E. King, as above.Email: [email protected] address: Institute of Earth Sciences, University of Lausanne, Ch-1015,Lausanne, SwitzerlandCopyright line and license statement updated online on January 20th.This is an open access article under the terms of the Creative CommonsAttribution License, which permits use, distribution and reproduction in anymedium, provided the original work is properly cited.
Copyright # 2013 The Authors. Journal of Quaternary Science published by John Wiley & Sons Ltd on behalf of Quaternary Research Association
JOURNAL OF QUATERNARY SCIENCE (2013) 28(7) 673–682 ISSN 0267-8179. DOI: 10.1002/jqs.2666

Study area and geomorphological setting
Fabergstølsbreen is an outlet glacier from the Jostedalsbreenice cap, the largest body of ice in mainland Europe (Fig. 1).Fabergstølsdalen is thought to have completely deglaciatedby �8 ka cal BP (Nesje et al., 1991; original 9 ka agecalibrated using IntCal09 (Reimer et al., 2009) assuming anuncertainty of 100 years in OxCal v.4.2 (Bronk Ramsey,2009)), and the Jostedalsbre Plateau by 7.9–5.3 ka cal BP(Matthews et al., 2000). Jostedalen has experienced signifi-cant Neoglaciation since �5 ka cal BP and substantialadvances occurred from �3 ka (Shakesby et al., 2004). TheLittle Ice Age (LIA, �1750 AD) advance has been the most
substantial of the Neoglacial period, and the various glaciersfed by the Jostedalsbreen ice cap have a multitude of retreatmoraines related to the LIA (Dahl et al., 2002). Jostedalen iswithin the Western Gneiss region of Norway (Bryhni andSturt, 1985), and is underlain by bedrock of Precambriangranitic to granodioritic gneiss (Holtedahl, 1960; Holtedahland Dons, 1960). Fabergstølsdalen is underlain by a quartzdiorite.Fabergstølsdalen is an E–SE-trending valley with a catch-
ment area of �3 km2; vegetation is established only in thelower reaches of the catchment (Figs 2 and 3). A singlemeltwater stream drains Fabergstølsbreen, which anastomo-ses in the lower catchment as the channel gradient reduces.The catchment is asymmetrical, with a steep (�60˚) rock facecomprising the north-facing valley side, whereas the south-facing valley side is less steep (�37˚) and comprises largevolumes of paraglacial and till deposits (Ballantyne andBenn, 1994). The paraglacial deposits are formed fromsubglacial material which has undergone modification in theform of debris flows and slides, and are remobilized bysheetwash processes and avalanching. These deposits areactively reworked and characterize the sediment transportand depositional processes in Fabergstølsdalen. Debris flowsare a common paraglacial process within this region (e.g.Curry and Ballantyne, 1999) and Ballantyne and Benn (1994)ascribed spring snowmelt as the key driver of paraglacialmodification in Fabergstølsdalen, in contrast to high precipi-tation events which have been suggested as the dominantdriver for other areas of Norway (e.g. Matthews et al., 1997;Sletten and Blikra, 2007).The optical exposure history of the different subglacial and
paraglacial source sediments in Fabergstølsdalen varies, andconsequently they have a range of potential residual lumines-cence doses. Modern material derived from paraglacial debrisflows is anticipated to have high residual luminescencedoses, as the rapid transit time and turbulent properties ofdebris flows afford limited opportunity for light exposure.Similarly, translational debris slides will only provide sunlightexposure for the sediment at the surface, and the interior partof the main slide body may see no light exposure at all. The
Figure 1. Map of the study area. Inset shows the location ofJostedalen in southern Norway and the dashed box shows thelocation of Fabergstølsdalen. This figure is available in colour onlineat wileyonlinelibrary.com.
Figure 2. Geomorphological map of Fabergstølsdalen adapted from Ballantyne and Benn (1994).
Copyright # 2013 The Authors. Journal of Quaternary Science published by John Wiley & Sons Ltd J. Quaternary Sci., Vol. 28(7) 673–682 (2013)on behalf of Quaternary Research Association
674 JOURNAL OF QUATERNARY SCIENCE

glaciofluvial bars in Fabergstølsdalen are sourced directlyfrom both subglacial and paraglacial sediments, and thisresearch will enable evaluation of the influence of sourcesediment optical exposure histories and processes of deposi-tion on the luminescence properties of the resultant deposits.
Sampling strategy and methods
Sample selection
A high-resolution suite of modern glacial sediments fromFabergstølsdalen, southern Norway, have been investigated.The study of modern sediments allows the unbleachedresidual luminescence signals and bleaching properties of
depositional processes to be investigated. Two subglacial andfour paraglacial source deposits, and 11 modern glaciofluvialbar deposits were sampled throughout the catchment for OSLand grain size analyses (GSA, Table 1). Increasing transportdistances have been shown to result in increased sedimentbleaching in glaciofluvial environments (Gemmell, 1997).Investigation of a transect of samples throughout the catch-ment enables quantification of the influence of increasingtransport distances on sediment bleaching in this proximalglacial setting (<2 km from ice front).Sample modernity was determined by stratigraphic location
and depositional context. Sample sites were covered with anopaque, plastic bag and a horizontal face of at least 20mm of
Table 1. Sample depositional context and sedimentology.
Sample Description & location Facies� Texture BeddingScale
(thickness)
SubglacialFAB_SUB1 Subglacial material from beneath
glacier snoutDmm Silt - boulders, angular -
subangular, consolidatedMassive >1 m
FAB_SUB2
ParaglacialFAB41 Sheet wash sampled adjacent to a
meltwater streamSh Medium to coarse sand Horizontal to low-angle
bedding>15 cm
FAB42 Snow avalanche debris Dmm Poorly sorted, coarse sand tosubangular pebbles
Massive <5 cm
FAB85 Sheet wash deposit collected 5mabove the main channel
Sh:Fl Well-sorted sand Horizonal bedding, units <0.5cm
5 cm
FAB86 Sheet wash deposit collected fromthe confluence of a valley sidetributary and the main meltwaterchannel
Sr Fine to medium sand Ripple cross bedding 5 cm
Glaciofluvial BarFAB79 Bar deposit sampled adjacent to a
meltwater tributary stream, northof the glacier snout
Sh Fine to medium and medium tocoarse sand layers
Low-angle cross lamination,units 1 cm thick
10 cm
FAB80 Bar deposit collected 100m fromglacier snout
Fl Fine sand to silt, overlayingmedium sand
Low-angle cross lamination,units 1 cm thick
10 cm
FAB84 Bar deposit collected from mainmeltwater channel
Sr Well sorted Ripple cross bedding, units1 cm to 6 cm
30 cm
FAB90 Bar deposit from the lee side of aboulder adjacent to the mainmeltwater channel
Sh Fine sand - silt, looselyconsolidated, well sorted
Horizontal bedding, units1 cm to 3 cm
30 cm
FAB91 Bar deposit collected from mainmeltwater channel
Sr Moderately sorted, fine sand -coarse gravel
Ripple cross bedding, unitsvary in clast size fromgravels to sands and are1 cm to 3 cm thick
15 cm
FAB92 Bar deposit collected from mainmeltwater channel
Sh Moderately sorted fine sand togravel
Horizontal bedding,1-cm-thick veneer of finesand overlying coarse sandand gravel
15 cm
FAB94 Bar deposit collected from theconfluence of a valley side streamand the main meltwater channel
Sh:Fl Moderately sorted fine sand to silt Horizontal bedding,5-cm-thick layer of finesand to silt overlying coarsesand and gravel
10 cm
FAB95 Bar deposit from the lee side of aboulder adjacent to the mainmeltwater channel
Sr Well-sorted medium to coarsesand
Interbedded medium andcoarse sand units, 2–3 cmthick
30 cm
FAB98 Bar deposit from the lee side of aboulder adjacent to the mainmeltwater channel
Sh Well-sorted, medium sand Interbedded medium andcoarse sand units,2–3 cm thick
30 cm
FAB99 Bar deposit from the main meltwaterchannel at the point where thevalley widens and the riveranastomoses.
Sh Well-sorted, medium sand Massive 30 cm
FAB100 Bar deposit collected from the mainmeltwater channel at the widestpart of the valley
Sh Well-sorted, medium sand Massive 30 cm
�Dmm, diamicton; Sh, horizontally bedded sand; Sr, ripple bedded sand; Fl, fine laminations of sand–silt.
Copyright # 2013 The Authors. Journal of Quaternary Science published by John Wiley & Sons Ltd J. Quaternary Sci., Vol. 28(7) 673–682 (2013)on behalf of Quaternary Research Association
OSL AGES OF MODERN DEPOSITS FROM F�ABERGSTØLSDALEN, NORWAY 675

sediment was cleared to remove bleached surface materialbefore sampling. Light penetration has been shown to reduceto 0.05% for coarse sand (4mm Ø) after 7-mm depth,irrespective of wavelength (Ollerhead, 2001), and the addi-tional �13mm of material removed here will account for anyadditional light penetration associated with loose sedimentcompaction. Surplus material was used for grain size analy-ses, which can be used to make inferences about the degreeof sediment sorting throughout transport and deposition.
Luminescence sample preparation
Samples were prepared using standard OSL procedures.Material was desiccated at 50 ˚C to enable calculation ofwater content, and was sieved to extract the 180–212mmgrain size fraction. Approximately 10 g of the selected grainsize was treated with 30% HCl for 30min to remove CaCO3.Samples were then treated with 30% H2O2 at room tempera-ture to remove organic material. Quartz was extracted fromthe polymineral sample through density two separations(r1¼ 2.68 g cm�3, r2¼2.58 g cm�3). The 2.58–2.68 g cm�3
fraction was etched with 40% HF for 40min to remove anycontaminating feldspar and most of the alpha-irradiatedportion of the grains. The etched quartz was treated with30% HCl for 30min to remove any carbonates producedduring HF etching.
Luminescence measurements
All OSL measurements were carried out using either a TL-DA-15 (Bøtter-Jensen et al., 2003) or TL-DA-20 Risø reader,equipped with an EMI 9235QA photomultiplier and 7.5-mmHoya U-340 filter. Blue (470�20 nm) and infrared(�870nm) diodes were used for stimulation, and irradiationwas achieved using a 90Sr/90Y beta source; dose rates were0.1 and 0.01 Gy s�1 dependent on instrument. The instru-ments were calibrated using quartz prepared at the RisøNational Laboratory in Denmark and measurements wereplotted using Analyst v.3.22b (Duller, 2005). Quartz wasdeposited in monolayer onto stainless steel discs (9.8mm Ø)using silicon grease; aliquot size was regulated using either amedium (5mm Ø, �250) or large (7mm Ø, �400 grain)mask.It is not unusual for quartz from glacial environments to
exhibit low luminescence sensitivity (e.g. Lukas et al., 2007;Rhodes and Bailey, 1997; Richards, 2000) and the quartzanalysed from Fabergstølsdalen is dim (Fig. 4). Single-grainmeasurements on 400 grains of sample FAB80 carried out byProfessor Geoff Duller at the Aberystwyth LuminescenceResearch Laboratory showed that only one grain in 400produced a dose–response curve from which a De could beinterpolated. The low luminescence sensitivity of thesesamples renders single-grain analyses unfeasible. Consequent-ly, it is necessary for these samples to be analysed usingsingle aliquots, although it is acknowledged that for aliquotswhere multiple grains contribute to the total light sum, the De
value may be affected by averaging effects (Duller, 2008).
Luminescence analysis protocol optimization
Sample OSL signals were measured in a single aliquotregenerative dose (SAR) protocol (Murray and Wintle, 2000,Table S1, inset to Fig. 4). The temperature of preheats used inthe SAR protocol was determined empirically through adose–recovery preheat-plateau experiment on glaciofluvialbar sample FAB95. Partially bleached sediments exhibit arange of De values, which could mask the effects of differentthermal regimes on De measurements. Investigation of adose–recovery preheat-plateau test, rather than changes innatural De values in response to different preheating regimes,allows the challenges of partial bleaching to be circum-vented. Aliquots were bleached for 60min in direct sunlightin Lausanne on 27 July 2013, and were then given a dose of9.5 Gy. The given dose was then measured (recovered) using
Figure 3. (a) Photograph of Fabergstølsdalen looking up-valley(west) towards the glacier, and (b) looking down valley (east). Notethe paraglacial material being reworked on the North valley side(right of photo a). This figure is available in colour online atwileyonlinelibrary.com.
Figure 4. Natural luminescence signal decay curve of an aliquot ofsample FAB85. The inset shows the luminescence dose–responsecurve for the same aliquot.
Copyright # 2013 The Authors. Journal of Quaternary Science published by John Wiley & Sons Ltd J. Quaternary Sci., Vol. 28(7) 673–682 (2013)on behalf of Quaternary Research Association
676 JOURNAL OF QUATERNARY SCIENCE
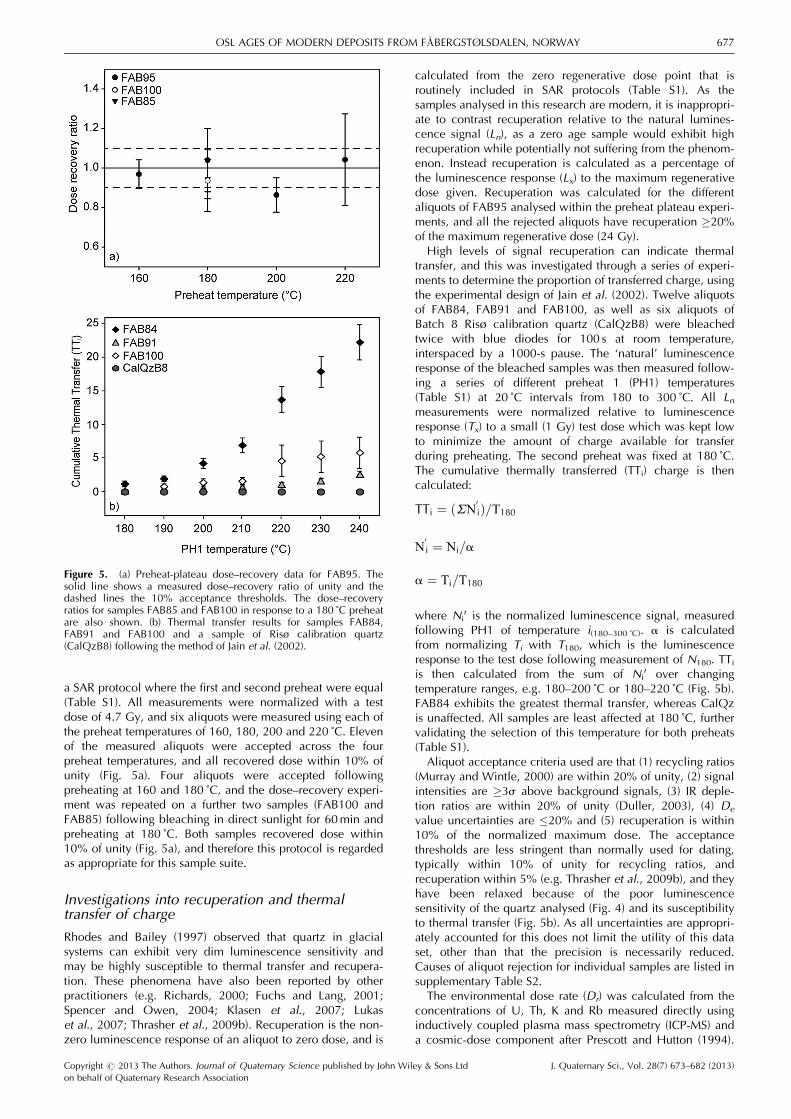
a SAR protocol where the first and second preheat were equal(Table S1). All measurements were normalized with a testdose of 4.7 Gy, and six aliquots were measured using each ofthe preheat temperatures of 160, 180, 200 and 220 ˚C. Elevenof the measured aliquots were accepted across the fourpreheat temperatures, and all recovered dose within 10% ofunity (Fig. 5a). Four aliquots were accepted followingpreheating at 160 and 180 ˚C, and the dose–recovery experi-ment was repeated on a further two samples (FAB100 andFAB85) following bleaching in direct sunlight for 60min andpreheating at 180 ˚C. Both samples recovered dose within10% of unity (Fig. 5a), and therefore this protocol is regardedas appropriate for this sample suite.
Investigations into recuperation and thermaltransfer of charge
Rhodes and Bailey (1997) observed that quartz in glacialsystems can exhibit very dim luminescence sensitivity andmay be highly susceptible to thermal transfer and recupera-tion. These phenomena have also been reported by otherpractitioners (e.g. Richards, 2000; Fuchs and Lang, 2001;Spencer and Owen, 2004; Klasen et al., 2007; Lukaset al., 2007; Thrasher et al., 2009b). Recuperation is the non-zero luminescence response of an aliquot to zero dose, and is
calculated from the zero regenerative dose point that isroutinely included in SAR protocols (Table S1). As thesamples analysed in this research are modern, it is inappropri-ate to contrast recuperation relative to the natural lumines-cence signal (Ln), as a zero age sample would exhibit highrecuperation while potentially not suffering from the phenom-enon. Instead recuperation is calculated as a percentage ofthe luminescence response (Lx) to the maximum regenerativedose given. Recuperation was calculated for the differentaliquots of FAB95 analysed within the preheat plateau experi-ments, and all the rejected aliquots have recuperation �20%of the maximum regenerative dose (24 Gy).High levels of signal recuperation can indicate thermal
transfer, and this was investigated through a series of experi-ments to determine the proportion of transferred charge, usingthe experimental design of Jain et al. (2002). Twelve aliquotsof FAB84, FAB91 and FAB100, as well as six aliquots ofBatch 8 Risø calibration quartz (CalQzB8) were bleachedtwice with blue diodes for 100 s at room temperature,interspaced by a 1000-s pause. The ‘natural’ luminescenceresponse of the bleached samples was then measured follow-ing a series of different preheat 1 (PH1) temperatures(Table S1) at 20 ˚C intervals from 180 to 300 ˚C. All Lnmeasurements were normalized relative to luminescenceresponse (Tx) to a small (1 Gy) test dose which was kept lowto minimize the amount of charge available for transferduring preheating. The second preheat was fixed at 180 ˚C.The cumulative thermally transferred (TTi) charge is thencalculated:
TTi ¼ ðSN0iÞ=T180
N0i ¼ Ni=a
a ¼ Ti=T180
where Ni0 is the normalized luminescence signal, measured
following PH1 of temperature i(180–300 ˚C). a is calculatedfrom normalizing Ti with T180, which is the luminescenceresponse to the test dose following measurement of N180. TTiis then calculated from the sum of Ni
0 over changingtemperature ranges, e.g. 180–200 ˚C or 180–220 ˚C (Fig. 5b).FAB84 exhibits the greatest thermal transfer, whereas CalQzis unaffected. All samples are least affected at 180 ˚C, furthervalidating the selection of this temperature for both preheats(Table S1).Aliquot acceptance criteria used are that (1) recycling ratios
(Murray and Wintle, 2000) are within 20% of unity, (2) signalintensities are �3s above background signals, (3) IR deple-tion ratios are within 20% of unity (Duller, 2003), (4) De
value uncertainties are �20% and (5) recuperation is within10% of the normalized maximum dose. The acceptancethresholds are less stringent than normally used for dating,typically within 10% of unity for recycling ratios, andrecuperation within 5% (e.g. Thrasher et al., 2009b), and theyhave been relaxed because of the poor luminescencesensitivity of the quartz analysed (Fig. 4) and its susceptibilityto thermal transfer (Fig. 5b). As all uncertainties are appropri-ately accounted for this does not limit the utility of this dataset, other than that the precision is necessarily reduced.Causes of aliquot rejection for individual samples are listed insupplementary Table S2.The environmental dose rate (Dr) was calculated from the
concentrations of U, Th, K and Rb measured directly usinginductively coupled plasma mass spectrometry (ICP-MS) anda cosmic-dose component after Prescott and Hutton (1994).
Figure 5. (a) Preheat-plateau dose–recovery data for FAB95. Thesolid line shows a measured dose–recovery ratio of unity and thedashed lines the 10% acceptance thresholds. The dose–recoveryratios for samples FAB85 and FAB100 in response to a 180 ˚C preheatare also shown. (b) Thermal transfer results for samples FAB84,FAB91 and FAB100 and a sample of Risø calibration quartz(CalQzB8) following the method of Jain et al. (2002).
Copyright # 2013 The Authors. Journal of Quaternary Science published by John Wiley & Sons Ltd J. Quaternary Sci., Vol. 28(7) 673–682 (2013)on behalf of Quaternary Research Association
OSL AGES OF MODERN DEPOSITS FROM F�ABERGSTØLSDALEN, NORWAY 677

External alpha dose rates were ignored and no internal alphadose contribution has been incorporated (Table 2). It was notpossible to calculate Dr for four samples and instead theradioisotope values of all the Fabergstølsdalen samples havebeen averaged to provide their approximate residual ages(Table 2).
Determination of residual luminescence ages
The samples analysed display heterogeneous bleaching andthe De distributions are over-dispersed (Fig. 6). A singleresidual De value has been calculated through age modellingto make comparisons between the different samples. Themodel selection criteria of Bailey and Arnold (2006), withrevised critical values from Arnold (2006) after Thrasher et al.(2009b), have been used, and all samples are modelled withthe three-component minimum age model (MAM-3, assumedsd 10%; Galbraith et al., 1999) in R 2.14.1 (R DevelopmentCore Team, 2011). Deriving residual De estimates frommodern samples allows potential OSL age overestimations tobe evaluated for the different glacial and paraglacial deposits.Sample acceptance rates vary and three samples with n< 20have been rejected (King, 2012; Table 2; Table S2).
Grain size analyses
Grain size analyses were done using a Coulter LS230 lasergranulometer. Bulk material was not available for all sampleseither due to low sediment availability for dating, or where
all bulk material had been prepared for ICP-MS analysis.Material sufficient to result in 8–9% obscuration of the laser(0.5–1 g) was analysed, and duplicate analyses were made ofall samples. Where deviation between initial and secondaryanalyses was observed, the sample was analysed a third timeand particle size data were averaged. Statistics were calculat-ed using GRADISTAT (Blott and Pye, 2001 after Folk andWard, 1957) and the results are given in Table S3.
Results
Source deposits: subglacial and paraglacialmaterial
The two subglacial till samples (FABSUB1 and FABSUB2)comprise diamicton, and were sampled in situ from beneaththe snout of Fabergstølsbreen (Table 1). Both samples have anoverdispersion of �70� 10% (Fig. 7), residual ages of0.81�0.39 ka and 1.72�0.77 ka, and positively skewed De
distributions, indicative of partial bleaching (Fig. 6a; Table 2).Grain size analyses indicate that the subglacial deposits arepoorly sorted and skewed towards coarser material(Table S3).The paraglacial sediments investigated comprise subglacial
till deposits which have been modified by paraglacialprocesses following the retreat of Fabergstølsbreen after theLIA (Dahl et al., 2002). Consequently, the paraglacial depositswithin the catchment should have ages younger than�1750 AD. The residual ages of the paraglacial deposits are
Table 2. Age-modelled De values, Dr values and calculated ages. The conversion factors of Adamiec and Aitken (1998) and beta particleattenuation factors after Mejdahl (1979) and Readhead (2002a, 2002b) have been used in Dr calculations; overdispersion (sd) values and sampleskewness (c) values are also listed. All samples are modelled using the MAM-3 model with the exception of FAB92 which, due to the presence ofmultiple negative values, was modelled using an unlogged version of the MAM-3. An assumed Rb concentration of 100�5.00 p.p.m was alsoincluded in Dr calculations. Water content uncertainties are assumed to be 5%. The central age model (CAM) ages (Galbraith et al., 1999) areprovided for comparative purposes.
Sample n De (Gy)
Water
content
(%) K (%) Th (p.p.m.) U (p.p.m.)
Wet dose
rate
(Gy ka�1)
CAM age
(ka) Age (ka) sd (%) c
Subglacial
FABSUB1 27 2.86�1.35 10 2.85�0.17 7.68�0.38 1.69�0.09 3.51�0.21 3.45�0.70 0.81�0.39 79�12 0.57
FABSUB2 27 6.76�2.99 10 3.00�0.18 10.13�0.51 2.33�0.12 3.92�0.21 2.81�0.48 1.72�0.77 68�10 2.01
Paraglacial
FAB41�,† 14 11.57�0.48 15 3.25�0.26 8.39�0.93 3.28�0.70 3.31�0.24 3.50�0.55 3.31�0.24 � 0.00
FAB42 32 0.74�0.24 28 3.59�0.21 14.44�0.72 2.71�0.14 3.63�0.22 0.80�0.15 0.20�0.07 91�11 3.10
FAB85 25 1.44�0.61 11 2.91�0.19 10.83�0.54 3.85�0.22 3.75�0.22 1.35�0.26 0.39�0.16 87�12 1.69
FAB86 36 2.84�1.99 21 3.00�0.18 7.65�0.38 3.03�0.18 3.18�0.19 3.91�0.77 0.89�0.63 91�12 0.69
Glaciofluvial bar
FAB79 28 13.41�3.32 17 2.77�0.16 8.02�0.47 3.89�0.20 3.30�0.19 7.66�0.88 4.06�1.04 47�5 4.00
FAB80�,† 19 5.56�1.46 22 3.25�0.26 8.39�0.93 3.28�0.70 3.39�0.25 3.42�0.48 1.64�0.45 – 0.74
FAB84 21 4.22�1.25 13 3.22�0.19 8.47�0.42 3.47�0.17 3.72�0.23 5.75�1.08 1.13�0.34 84�13 0.95
FAB90� 19 10.31�3.89 14 3.04�0.01 8.65�0.12 4.15�0.09 3.66�0.22 5.38�0.75 2.82�1.08 – 0.13
FAB91 33 5.25�1.02 8 3.53�0.02 7.03�0.13 2.64�0.03 3.93�0.25 2.77�0.40 1.34�0.28 67�7 0.28
FAB92‡,† 29 0.00�0.37 11 3.25�0.26 8.39�0.93 3.28�0.70 3.73�0.28 1.03�0.19 0.00�0.10 0�0 �0.37
FAB94 43 5.69�1.42 20 3.14�0.18 7.87�0.39 4.06�0.46 3.48�0.21 4.55�0.56 1.64�0.42 64�6 2.61
FAB95† 57 8.52�2.17 16 3.25�0.26 8.39�0.93 3.28�0.70 3.61�0.27 6.12�0.72 2.36�0.63 61�5 0.94
FAB98 43 3.13�0.80 12 3.16�0.1 8.63�0.13 3.41�0.07 3.72�0.22 5.73�2.11 0.84�0.22 77�8 0.95
FAB99 32 5.96�2.11 9 3.37�0.05 7.50�0.01 3.68�0.07 3.99�0.24 2.75�0.40 1.50�0.54 50�7 0.74
FAB100 28 2.24�0.98 20 3.22�0.05 8.62�0.02 3.22�0.01 3.46�0.29 2.60�0.45 0.65�0.29 83�11 1.12
Gamma dose rates have been adjusted to account for the surface proximal location of all the samples with the exception of FABSUB1 andFABSUB2. The factors presented in table H.1 of Aitken (1985) have been used assuming a sample depth below the surface of 3 cm (i.e. the mid-point of the sample) and a soil density of 2 g cm�3. �sd has not been calculated where n<20. †Average Dr used; see text for details. ‡6.0 Gy wasadded to each De value, to remove all negative values to calculate sample sd.
Copyright # 2013 The Authors. Journal of Quaternary Science published by John Wiley & Sons Ltd J. Quaternary Sci., Vol. 28(7) 673–682 (2013)on behalf of Quaternary Research Association
678 JOURNAL OF QUATERNARY SCIENCE

generally younger than the subglacial deposits (Fig. 8a) andare broadly similar to one another, ranging from200� 70 years for FAB42 (avalanche) to 890� 630 years forFAB86 (sheetwash). The increased bleaching of the para-glacial deposits relative to the subglacial sediments isreflected in their grain size analysis characteristics: althoughthe paraglacial sediments remain poorly sorted (Table S3),they are better sorted than the subglacial deposits, exempli-fied by mesokurtic, rather than leptokurtic, grain sizedistributions.In contrast to the subglacial sediments, the three para-
glacial samples with n> 20 have overdispersion values of90� 10% which is consistent for material reworked bydifferent slope failure processes; for example, FAB42 com-prises avalanche debris whereas FAB85 and FAB86 aresheetwash deposits (Table 1).
Glaciofluvial bar deposits
Within Fabergstølsdalen, the glacial meltwater streamaccesses both subglacial and paraglacial sediments, and bothdeposit types are source sediments for the glaciofluvial bars
formed within the catchment. As the paraglacial sedimentscomprise modified subglacial material, it may be difficult todifferentiate between bar sediments sourced from in situsubglacial deposits, and paraglacial deposits from the south-facing valley side (Fig. 7) using either their luminescence orGSA properties. Eleven samples were taken from bar depositsat increasing distances from the glacial snout (Fig. 7) and ninehave aliquot acceptance rates of n> 20.All samples with the exception of FAB79 were taken from
similar scale bar features along the main meltwater channel.The facies of the bar deposits range from ripple (Sr) andhorizontally bedded (Sh) sands, to finely laminated sands andsilts (Sh:Fl), and further information on their specific sedimen-tology and depositional settings is given in Table 1. All thesamples have GSA characteristics similar to the paraglacialdeposits (Table S3), which is a consequence of the highhillslope-channel connectivity of Fabergstølsdalen (Fig. 2).FAB79 has a slightly different depositional setting from the
other bar samples analysed: it is sampled from a tributarymeltwater channel to the north of Fabergstølsbreen, whichdirectly accesses subglacial material and recently exposed till(Fig. 7). In comparison with the other bar deposits sampledfrom the main meltwater channel, FAB79 has similar GSAproperties but higher residual age (4.06�1.04 ka) andreduced overdispersion (sd¼47� 5%). These attributes aresimilar to the in situ subglacial sediments sampled, and reflectthat this deposit is predominantly sourced from subglacialmaterial (inferred from its sample location) which has beenonly moderately reworked during fluvial transportation over alimited distance of tens of metres.The remainder of the glaciofluvial bar samples are all
derived from similar scale features along the main Faberg-stølsdalen meltwater channel. Sediments are sourced from amixture of subglacial and paraglacial sediments, which willcontribute to deposits in different proportions dependingupon the specific sampling location. FAB91, FAB95 andFAB94 are all sampled from the same locality (Fig. 7), andhave similar residual ages ranging from 1.34�0.28 to2.36� 0.63 ka, similar overdispersion values ranging from61�5 to 67� 7% and similar De distributions (Fig. 9). Thesimilarities between these samples suggest common sourcesediments and processes of transport and deposition; how-ever, FAB92 is also sampled from a bar feature betweenFAB91 and FAB95, and is the only sample which is almostcompletely bleached (Fig. 9). This sample has zero over-dispersion and 30% of aliquots for FAB92 have negative De
values. FAB92 is also the only negatively skewed sample(Table 2), which may relate to a different controllinginfluence on the De distribution, such as the bleaching limitof the quartz. As the depositional location of this sample issimilar to that of FAB91, FAB95 and FAB94, it is surprisingthat the luminescence properties are so different. FAB92comprises a thin veneer of fine sand overlying gravels(Table 1), and thus material deposited at this site may havebeen exposed to sunlight for longer, resulting in morecomplete bleaching before covering by additional sedimentsduring subsequent high flow phases.FAB100 is the glaciofluvial bar sample taken farthest from
the glacial snout (1.5 km) and has no direct subglacial orparaglacial inputs (Fig. 7). It has one of the youngest residualages of the bar deposits: 0.65� 0.29 ka. It is interesting thatdespite the longer transport distance for material depositedat the FAB100 sample location, its overdispersion is high(sd¼83�11%) in comparison with many of the other bardeposits analysed within the lower catchment (e.g. FAB91,sd¼ 67� 7%; Fig. 7). Sample FAB100 is located 250m fromthe nearest potential paraglacial source sediment input into
Figure 6. De values and probability density functions of (a)subglacial samples FABSUB1 and 2, and (b) paraglacial samplesFAB42 (avalanche), FAB85 and FAB86 (sheetwash). This figure isavailable in colour online at wileyonlinelibrary.com.
Copyright # 2013 The Authors. Journal of Quaternary Science published by John Wiley & Sons Ltd J. Quaternary Sci., Vol. 28(7) 673–682 (2013)on behalf of Quaternary Research Association
OSL AGES OF MODERN DEPOSITS FROM F�ABERGSTØLSDALEN, NORWAY 679
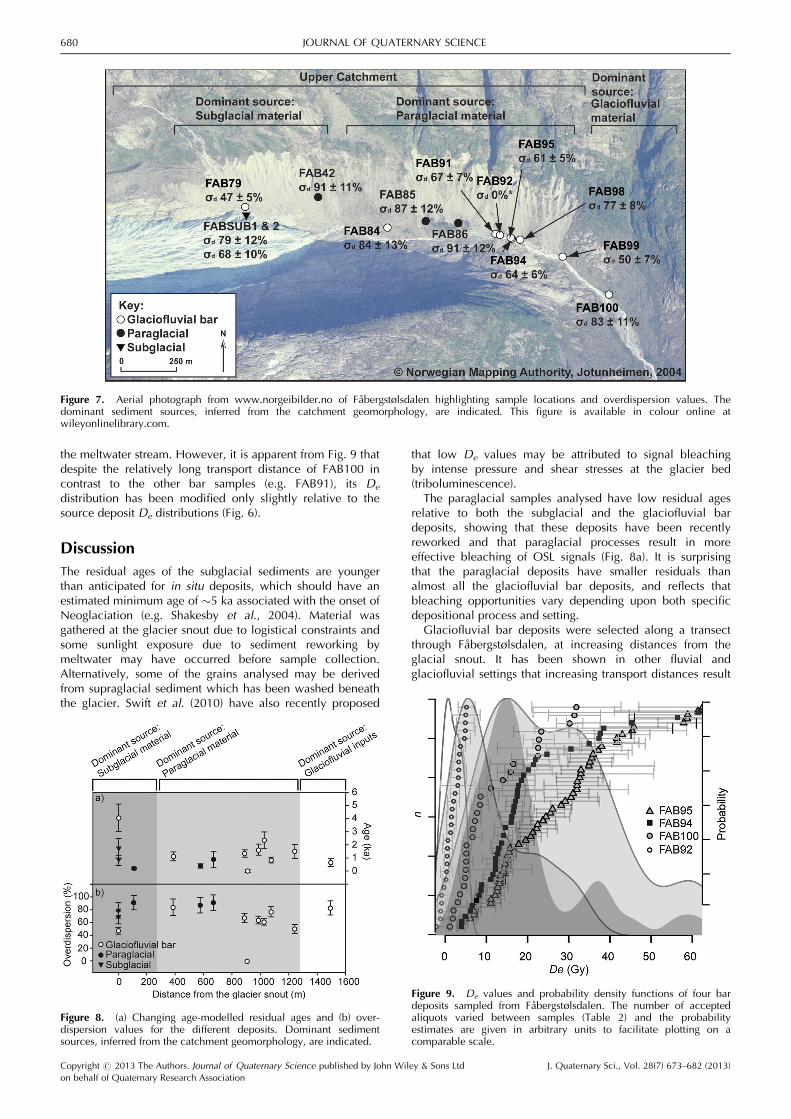
the meltwater stream. However, it is apparent from Fig. 9 thatdespite the relatively long transport distance of FAB100 incontrast to the other bar samples (e.g. FAB91), its De
distribution has been modified only slightly relative to thesource deposit De distributions (Fig. 6).
Discussion
The residual ages of the subglacial sediments are youngerthan anticipated for in situ deposits, which should have anestimated minimum age of �5 ka associated with the onset ofNeoglaciation (e.g. Shakesby et al., 2004). Material wasgathered at the glacier snout due to logistical constraints andsome sunlight exposure due to sediment reworking bymeltwater may have occurred before sample collection.Alternatively, some of the grains analysed may be derivedfrom supraglacial sediment which has been washed beneaththe glacier. Swift et al. (2010) have also recently proposed
that low De values may be attributed to signal bleachingby intense pressure and shear stresses at the glacier bed(triboluminescence).The paraglacial samples analysed have low residual ages
relative to both the subglacial and the glaciofluvial bardeposits, showing that these deposits have been recentlyreworked and that paraglacial processes result in moreeffective bleaching of OSL signals (Fig. 8a). It is surprisingthat the paraglacial deposits have smaller residuals thanalmost all the glaciofluvial bar deposits, and reflects thatbleaching opportunities vary depending upon both specificdepositional process and setting.Glaciofluvial bar deposits were selected along a transect
through Fabergstølsdalen, at increasing distances from theglacial snout. It has been shown in other fluvial andglaciofluvial settings that increasing transport distances result
Figure 9. De values and probability density functions of four bardeposits sampled from Fabergstølsdalen. The number of acceptedaliquots varied between samples (Table 2) and the probabilityestimates are given in arbitrary units to facilitate plotting on acomparable scale.
Figure 7. Aerial photograph from www.norgeibilder.no of Fabergstølsdalen highlighting sample locations and overdispersion values. Thedominant sediment sources, inferred from the catchment geomorphology, are indicated. This figure is available in colour online atwileyonlinelibrary.com.
Figure 8. (a) Changing age-modelled residual ages and (b) over-dispersion values for the different deposits. Dominant sedimentsources, inferred from the catchment geomorphology, are indicated.
Copyright # 2013 The Authors. Journal of Quaternary Science published by John Wiley & Sons Ltd J. Quaternary Sci., Vol. 28(7) 673–682 (2013)on behalf of Quaternary Research Association
680 JOURNAL OF QUATERNARY SCIENCE

in improved opportunities for sediment bleaching (e.g. For-man and Ennis, 1992; Stokes et al., 2001). However, althougha slight reduction in residual ages is recorded for theglaciofluvial bar deposits after 900m distance from the glacialsnout (Fig. 8a), the residual ages of the bar deposits are stillwithin uncertainties of the subglacial source sediments andrange from zero to 2.82� 1.08 ka. Contrasting the De
distributions of the bar deposits with the subglacial andparaglacial source sediment De distributions (Figs 6 and 9)shows that similar ranges of De values are retained betweenthe different deposit types. The properties of the sourcesubglacial and paraglacial sediments are therefore retainedover short (<2 km) transport distances, demonstrating thatwhen sampling for conventional OSL dating applications,consideration of the source sediment properties as well asdepositional processes and specific depositional setting arecrucial in evaluating whether a sediment is likely to havebeen fully bleached. This is especially important wheredeposits are sampled within 2 km of the ice margin.The subglacial source deposits have overdispersion values
of �70%, which are similar to the bar deposits but lowerthan the paraglacial sediments (Fig. 8b). If the residual ages ofthe different deposits are also considered, as the paraglacialdeposits analysed have the smallest residual ages, it can beinferred that higher overdispersion values indicate improved(but incomplete) sediment bleaching. If the overdispersionvalues of the different subglacial, paraglacial and bar depositsare plotted relative to their residual ages (excluding sampleFAB92, which is completely bleached), a correlation with r2
of 0.69 is obtained (Fig. 10), demonstrating that for thesesediments, high overdispersion values indicate the greatestdegree of signal resetting. This has implications for datingglacial sediments as overdispersion values encode informa-tion of the degree of sediment bleaching, providing anadditional tool through which the suitability of a sample canbe assessed. Further work is required to investigate the rangeof overdispersion values recorded for other glacial depositsand depositional processes from a range of different glacialenvironments to understand this relationship more fully.
Conclusions
The luminescence properties of a suite of glacial sedimentswithin 2 km of the ice margin from a single glacial catchmentfrom southern Norway have been characterized to quantifyresidual ages and investigate the processes of sediment
bleaching. The subglacial and paraglacial sediments investi-gated form the source sediments of the glaciofluvial bardeposits analysed, and the paraglacial sediments have thesmallest residual ages but the greatest overdispersion values.The residual ages of most of the glaciofluvial bar depositsrange from zero to 2.82�1.08 ka and are within uncertain-ties of the subglacial sediment residual ages. Changing over-dispersion values between the different deposits indicates thattransport and depositional processes modify overdispersionbecause of sediment bleaching, and deposits with the greatestoverdispersion values have experienced the greatest bleach-ing (while remaining partially reset). Grains transported bythe same processes of sedimentation have different residualages dependent upon the duration of transport, the sedimentsource and specific depositional setting. This has implicationsfor studies reliant on the use of a single modern analoguedeposit, which may underestimate or overestimate likelyresidual doses. The analysis of multiple modern analoguedeposits, while time-consuming, would enable better con-straint of the range of residual doses, which vary by almost3 ka for the glaciofluvial bar deposits analysed in this study.Consideration of the depositional framework of an OSLsample should also be used to reduce the risk of sampling adeposit which suffers from partial bleaching.
Supporting Information
Additional supporting information can be found in the onlineversion of this article:Table S1. Quartz SAR protocol.Table S2. Causes of aliquot rejection for individual samples.Table S3. Moment particle size analysis results after Folk andWard (1957) calculated in GRADISTAT (Blott and Pye, 2001).
Acknowledgements. G. E. K. was supported by NERC studentshipF008589/1 and was affiliated to SAGES. R. Galbraith is thanked forproviding the R code for the age models. R. Sommerville, A. Calderand D. Herd (University of St Andrews) and L. Carmichael and S. Fisk(SUERC) are thanked for laboratory assistance. D. Sanderson (SUERC)is thanked for useful discussions, and for access to facilities. D. Lowry(University of St Andrews), E. Harris (Swansea University), L. BaekNielsen, C. Caballero and A. Cullens (IceTroll) are thanked forfieldwork assistance. A New Workers Research Award is acknowl-edged from the QRA. P. Abbott (Swansea University), A. Rowan and R.Smedley (Aberystwyth University) and two anonymous reviewers arethanked for comments on an earlier version of this manuscript.
Abbreviations. GSA, grain size analysis; ICP-MS, inductively coupledplasma mass spectrometry; LIA, Little Ice Age; OSL, opticallystimulated luminescence; SAR, single aliquot regenerative dose
References
Adamiec G, Aitken MJ. 1998. Dose-rate conversion factors: update.Ancient TL 16: 37–46.
Aitken MJ. 1985. Thermoluminescence Dating. Academic Press:London.
Alexanderson H. 2007. Residual OSL signals from modern Green-landic river sediments. Geochronometria 26: 1–9.
Alexanderson H, Murray AS. 2012. Luminescence signals frommodern sediments in a glaciated bay, NW Svalbard. QuaternaryGeochronology 10: 250–256.
Arnold LJ. 2006. Optical dating and computer modelling of arroyoepicycles in the American Southwest. DPhil Thesis, St Peter’sCollege, University of Oxford.
Bailey RM, Arnold LJ. 2006. Statistical modelling of single grainquartz D-e distributions and an assessment of procedures forestimating burial dose. Quaternary Science Reviews 25: 2475–2502.
Figure 10. Correlation of residual age and overdispersion for allsamples, except FAB92 which has zero age and zero overdispersion.Fitting the data with a linear regression results in an r2 value of 0.69.The 95 and 99% confidence limits of the fit are shown.
Copyright # 2013 The Authors. Journal of Quaternary Science published by John Wiley & Sons Ltd J. Quaternary Sci., Vol. 28(7) 673–682 (2013)on behalf of Quaternary Research Association
OSL AGES OF MODERN DEPOSITS FROM F�ABERGSTØLSDALEN, NORWAY 681

Ballantyne CK, Benn DI. 1994. Paraglacial slope adjustment andresedimentation following recent glacier retreat, Fabergstølsdalen,Norway. Arctic and Alpine Research 26: 255–269.
Blott SJ, Pye K. 2001. GRADISTAT: a grain size distribution andstatistics package for the analysis of unconsolidated sediments.Earth Surface Processes and Landforms 26: 1237–1248.
Bøtter-Jensen L, Andersen CE, Duller GAT, et al. 2003. Developmentsin radiation, stimulation and observation facilities in luminescencemeasurements. Radiation Measurements 37: 535–541.
Bronk Ramsey C. 2009. Bayesian analysis of radiocarbon dates.Radiocarbon 51: 337–360.
Bryhni I, Sturt BA. 1985. Caledonides of southwestern Norway. InThe Caledonide Orogen, Gee DE, Sturt BA (eds). John Wiley &Sons: Chichester; 619.
Curry AM, Ballantyne CK. 1999. Paraglacial modification of glaci-genic sediment. Geografiska Annaler, Series A: Physical Geography81: 409–419.
Dahl SO, Nesje A, Lie Ø, et al. 2002. Timing, equilibrium-linealtitudes and climatic implications of two early-Holocene glacierreadvances during the Erdalen Event at Jostedalsbreen, westernNorway. Holocene 12: 17–25.
Duller GAT. 2003. Distinguishing quartz and feldspar in single grainluminescence measurements. Radiation Measurements 37: 161–165.
Duller GAT. 2005. Luminescence Analyst. University of Wales:Aberystwyth.
Duller GAT. 2008. Single-grain optical dating of Quaternary sedi-ments: why aliquot size matters in luminescence dating. Boreas37: 589–612.
Folk RL, Ward WC. 1957. Brazos River bar: a study in the significanceof grain size parameters. Journal of Sedimentary Petrology 27: 3–26.
Forman SL, Ennis G. 1992. Limitations of thermoluminescence to datewaterlain sediments from glaciated fiord environments of westernSpitsbergen, Svalbard. Quaternary Science Reviews 11: 61–70.
Fuchs M, Lang A. 2001. OSL dating of coarse-grain fluvial quartzusing single-aliquot protocols on sediments from NE Peloponnese,Greece. Quaternary Science Reviews 20: 783–787.
Fuchs M, Owen LA. 2008. Luminescence dating of glacial andassociated sediments: review, recommendations and future direc-tions. Boreas 37: 636–659.
Galbraith RF, Roberts RG, Laslett GM, et al. 1999. Optical dating ofsingle and multiple grains of quartz from jinmium rock shelter,northern Australia, Part 1, Experimental design and statisticalmodels. Archaeometry 41: 339–364.
Gemmell AMD. 1988. Thermoluminescence dating of glacially trans-ported sediments � some considerations. Quaternary ScienceReviews 7: 277–285.
Gemmell AMD. 1997. Fluctuations in the thermoluminescence signalof suspended sediment in an Alpine glacial meltwater stream.Quaternary Science Reviews 16: 281–290.
Holtedahl O. 1960. Geology of Norway. I Kommisjon Hos H.Aschehoug, & Co.: Oslo.
Holtedahl O, Dons JA. 1960. Geologisk kart over Norge Berggrunn-skart. Norges Geologiske Undersøkelse Nr. 208: Oslo.
Jain M, Bøtter-Jensen L, Murray AS, et al. 2002. Retrospectivedosimetry: dose evaluation using unheated and heated quartz froma radioactive waste storage building. Radiation Protection Dosime-try 101: 525–530.
King GE. 2012. Fundamental and Sedimentalogical Controls on theLuminescence of Quartz and Feldspar. PhD Thesis, University of StAndrews.
Klasen N, Fiebig M, Preusser F, et al. 2007. Luminescence dating ofproglacial sediments from the Eastern Alps. Quaternary Internation-al 164–165: 21–32.
Lukas S, Spencer JQG, Robinson RAJ, et al. 2007. Problems associatedwith luminescence dating of Late Quaternary glacial sediments inthe NW Scottish Highlands. Quaternary Geochronology 2: 243–248.
Matthews JA, Dahl SO, Nesje A, et al. 2000. Holocene glaciervariations in central Jotunheimen, southern Norway based on distalglaciolacustrine sediment cores. Quaternary Science Reviews 19:1625–1647.
Matthews JA, Dahl SO, Berrisford MS, et al. 1997. A preliminaryhistory of Holocene colluvial (debris-flow) activity, Leirdalen,Jotunheimen, Norway. Journal of Quaternary Science 12: 117–129.
Mejdahl V. 1979. Thermoluminescence dating: beta-dose attenuationin quartz grains. Archaeometry 21: 61–72.
Murray AS, Olley JM, Caitcheon GG. 1995. Measurement ofequivalent doses in quartz from contemporary water-lain sedimentsusing optically stimulated luminescence. Quaternary ScienceReviews 14: 365–371.
Murray AS, Roberts RG. 1997. Determining the burial time of singlegrains of quartz using optically stimulated luminescence. Earth andPlanetary Sciences Letters 152: 163–180.
Murray AS, Wintle AG. 2000. Luminescence dating of quartz usingan improved single-aliquot regenerative-dose protocol. RadiationMeasurements 32: 57–73.
Nathan RP, Thomas PJ, Jain M, et al. 2003. Environmental dose rateheterogeneity of beta radiation and its implications for lumines-cence dating: Monte Carlo modelling and experimental validation.Radiation Measurements 37: 305–313.
Nesje A, Kvamme M, Rye N, et al. 1991. Holocene glacial andclimate history of the Jostedalsbreen region, Western Norway;evidence from lake sediments and terrestrial deposits. QuaternaryScience Reviews 10: 87–114.
Ollerhead J. 2001. Light transmittance through dry, sieved sand:some test results. Ancient TL 19: 13–17.
Olley JM, Roberts RG, Murray AS. 1997. Disequilibria in the uraniumdecay series in sedimentary deposits at Allen’s Cave, NullarborPlain, Australia: implications for dose rate determinations. Radia-tion Measurements 27: 433–443.
Prescott JR, Hutton JT. 1994. Cosmic ray contributions to dose ratesfor luminescence and ESR dating: Large depths and long-term timevariations. Radiation Measurements 23: 497–500.
R Development Core Team. 2011. R: A language and environmentfor statistical computing. R Foundation for Statistical Computing:Vienna.
Readhead ML. 2002a. Absorbed dose fraction for 87Rb b particles.Ancient TL 20: 25–28.
Readhead ML. 2002b. Addendum to ‘absorbed dose fraction for 87Rbb particles’. Ancient TL 20: 47.
Reimer PJ, Baillie MGL, Bard E, et al. 2009. IntCal09 and Marine09radiocarbon age calibration curves, 0–50,000 years cal BP.Radiocarbon 51: 1111–1150.
Rhodes EJ, Bailey RM. 1997. The effect of thermal transfer on thezeroing of the luminescence of quartz from recent glaciofluvialsediments. Quaternary Science Reviews 16: 291–298.
Richards BWM. 2000. Luminescence dating of Quaternary sedimentsin the Himalaya and High Asia: a practical guide to its use andlimitations for constraining the timing of glaciation. QuaternaryInternational 65–66: 49–61.
Shakesby RA, Matthews JA, Winkler S. 2004. Glacier variations inBreheimen, southern Norway: relative-age dating of Holocenemoraine complexes at six high-altitude glaciers. Holocene 14:899–910.
Sletten K, Blikra LH. 2007. Holocene colluvial (debris-flow andwater-flow) processes in eastern Norway: stratigraphy, chronologyand palaeoenvironmental implications. Journal of QuaternaryScience 22: 619–635.
Spencer JQ, Owen LA. 2004. Optically stimulated luminescencedating of Late Quaternary glaciogenic sediments in the upperHunza valley: validating the timing of glaciation and assessingdating methods. Quaternary Science Reviews 23: 175–191.
Stokes S, Bray HE, Blum MD. 2001. Optical resetting in largedrainage basins: tests of zeroing assumptions using single-aliquotprocedures. Quaternary Science Reviews 20: 879–885.
Swift DA, Sanderson DCW, Nienow PW, et al. 2010. Anomalousluminescence of subglacial sediment at Haut Glacier d’arolla,Switzerland – a consequence of resetting at the glacier bed? Boreas40: 446–458.
Thrasher IM, Mauz B, Chiverrell RC, et al. 2009a. Luminescencedating of glaciofluvial deposits: a review. Earth-Science Reviews97: 145–158.
Thrasher IM, Mauz B, Chiverrell RC, et al. 2009b. Testing anapproach to OSL dating of Late Devensian glaciofluvial sedimentsof the British Isles. Journal of Quaternary Science 24: 785–801.
Wallinga J. 2002. Optically stimulated luminescence dating of fluvialdeposits: a review. Boreas 31: 303–322.
Copyright # 2013 The Authors. Journal of Quaternary Science published by John Wiley & Sons Ltd J. Quaternary Sci., Vol. 28(7) 673–682 (2013)on behalf of Quaternary Research Association
682 JOURNAL OF QUATERNARY SCIENCE