appendix 6 - cchcs – california correctional health … · blood test (fobt) performed in the...
TRANSCRIPT

APPENDIX 6

Goal
Support continuous program evaluation and positive change in order to: Improve quality, cost effectiveness, and safety of care delivery Improve cost-efficiencies and value-added work, and reduce waste Improve patient outcomes
Objectives Access to Health Care Services
By June 30, 2010, greater than eighty-five percent of patients at each institutions will have timely access to health care services, as defined by policy timeframes, in the following areas:
Episodic care requests Chronic care evaluation High-priority specialty services Routine specialty services Return from a higher level of care (community hospital/ED setting)
Quality, Value and Outcomes By December 31, 2010, greater than 85% of diabetic patients who have been under treatment for at least 6
months will have most recent HbA1c result less than 8%.* By December 31, 2010, greater than 85% of diabetic patients will have most recent LDL-C result within
the past twelve months lower than 100 mg/dL.* By December 31, 2010, greater than 85% of diabetic patients who are not prescribed ACEI or ARB
therapy will have had microalbuminuria screening in the past 12 months. By December 31, 2010, greater than 75% of a sample of diabetic patients will have most recent blood
pressure result within the past three months lower than 130/80 mmHg. By December 31, 2010, greater than 85% of a sample of diabetic patients will have had a dilated retinal
exam in the past 12 months.
By December 31, 2010, greater than 85% of eligible inmates 50 years and older will have a fecal occult blood test (FOBT) performed in the preceding 12 months.
By December 31, 2010, greater than 85% of a sample of female inmates 50 years and older will have a mammogram performed in the preceding 24 months.
By December 31, 2010 the ratio of SABA to ICS prescription for asthmatic patients will be less than 2:1. By June 30, 2010, non-formulary medications including OTC medications will comprise 3% or less of
prescriptions per month. By June 30, 2010, annual medication costs PMPM will be reduced by at least 10% compared to fiscal year
2008-2009. By June 30, 2010, average number of medications PMPM will be reduced by at least 10%.
By June 30, 2010, average number approved routine requests for specialty services will be less than 65 per
thousand members per year.* By December 31, 2010, average number of bed days will be less than 550 per thousand members per year.*
* If an institution is unable to achieve this objective, it is expected it will achieve at least a 25% improvement in performance compared to baseline status.
California Prison Health Care Services
Quality Management Plan 2010

2010 Strategies and Initiatives Strategy 1: Establish organizational structures and processes to manage system performance, in order to identify and address improvement opportunities at statewide, regional, and institution levels. 1A Implement a system-wide Quality Management Program. Coordinate the activities of
committees/subcommittees with programmatic responsibility for prioritizing, planning, developing, implementing, and evaluating clinical initiatives through central office and institution Quality Management Committees and Health Care Operations Committee. (Turnaround Plan Objective 4.2)
1B Sentinel Event Review Redesign. Consolidate and coordinate the process for reviewing and acting
upon different types of sentinel events, including emergency medical response, death reviews, contract network issues, and other significant health care events. (Turnaround Plan Objective 4.1)
Strategy 2: Redesign the clinical service delivery system to reflect national standards of care and to promote proven methods of care management and primary care. 2A National Accreditation. Collaborate with stakeholders to examine the option of modifying Plata
program requirements to be more consistent with national standards within a correctional environment and transitioning from the current medico-legal inspection process to a nationally recognized accreditation process.
2B Primary Care and Care Management. Through the Integrated Leadership Team, continue to redesign
the delivery system processes including reception, medical classification, episodic care, specialty services, urgent care, planned primary care and chronic care. (Turnaround Plan Objectives 1.1, 2.1, 2.2, 2.4)
Strategy 3: Establish an organization-wide balanced scorecard to accurately measure and analyze progress towards performance objectives related to access, quality, utilization, cost, and outcomes. 3A CPHCS Dashboard. Examine, validate and improve existing methods and requirements for data
collection and reporting to include the Plata metrics and Key Indicator Report and Office of Inspector General medical inspections in order to recommend areas where measures and reporting can be consolidated, eliminated or modified. (Turnaround Plan Objective 4.1)
3B Patient Outcome Measures. Establish access to laboratory, pharmacy, and other data necessary for
measuring and reporting patient outcomes for the highest-priority health care conditions. (Turnaround Plan Objective 4.1)
Strategy 4: Cultivate workforce capacity to effectively manage change and an organizational culture that promotes team-based care, and continuous learning and quality improvement. 4A Clinical Outcomes Initiative. Establish system-wide and targeted strategies and tools to be leveraged
by institution teams for improving outcomes in patients with high priority conditions using change packages that include specific major and incremental objectives; meeting forums, schedules, performance and patient outcome measures; exception and progress reports; provider and nursing practice self-assessments, evidence-based decision support and self-management support; ongoing mentoring and modeling, and training, evaluation and feedback. (Turnaround Plan Objectives 2.1, 2.2, 4.1, 4.2)

Measurement and Evaluation Unit Quality Improvement and Utilization Management Section 501 J Street, Suite 310 Sacramento, CA 95814 Report Issued: March 2010
Clinical Outcomes Initiative 2010 Cardiovascular Risk Reduction, Part One: Diabetes
Diabetes Outcomes Report An analysis of diabetic patient outcomes during calendar year 2009
California Prison Health Care Services

Diabetes Outcomes Report Issued March 2010 Page 1 of 20
California Prison Health Care Services
Diabetes Outcomes Report
March 2010 An analysis of diabetic patient outcomes during calendar year 2009
INTRODUCTION
As part of a new organizational approach to quality improvement, California Prison Health Care Services (CPHCS) will introduce a Clinical Outcomes Initiative each year to support the system and individual behavioral changes that will enhance the quality and value of health care services. Under the Clinical Outcomes Initiative, CPHCS identifies a priority patient population each year for a series of coordinated interventions, including staff decision-support and professional development activities, patient education and self-management support, patient outcomes reports, and technical assistance and training. These coordinated interventions are designed to reinforce team-based primary care, build quality improvement capacity and improve patient outcomes. The first Clinical Outcomes Initiative, implemented during calendar year 2010, focuses on patients with cardiovascular risk and diabetes. This patient population was selected for a number of reasons:
• These conditions are associated with significant patient morbidity and mortality as well as significant cost to the overall healthcare system,
• Potential to make significant positive impacts on patient outcomes, • The opportunity to continue the progress many institutions have already made in
developing diabetes treatment initiatives, • Ability to collect data for this condition, and • Recognition within the broader health care community of diabetes as a condition to
strengthen primary care model implementation, among other factors. The 2010 Clinical Outcomes Initiative will be implemented in three parts. Part One emphasizes reduction of cardiovascular risk for patients with diabetes. Part Two addresses hypertension and hyperlipidemia. Part Three examines patients with metabolic syndrome. As each part of the initiative is introduced, institutions will receive technical assistance, training and an implementation package with support tools and strategies that assist in system improvements. Reports are a critical component of the Clinical Outcomes Initiative. Each institution will receive regular exception reports, which indicate which patients have not received services per guidelines or who have abnormal values. Primary care teams will use the exception reports to make necessary modifications to the care of individual patients and to improve clinical practice and patient outcomes. Institutions will receive quarterly performance data from headquarters, showing institutional, regional, and statewide progress towards patient outcome objectives. This is the first of quarterly performance reports, which provides a clinical snapshot of patient outcomes for the diabetic population based on nationally accepted measures.

Diabetes Outcomes Report Issued March 2010 Page 2 of 20
DATA SOURCES AND METHODOLOGY
For calendar year 2009, data from Quest and Foundation Laboratories were merged with Maxor pharmacy and DDPS data through March 2010 in order to obtain clinical information regarding the diabetic patient population in California adult institutions. As of early March 2010, of 33 adult institutions, 11 were using Quest Laboratory, 22 were using Foundation Laboratory, and 30 were using Maxor/Guardian pharmacy data systems (see Table 1 in Appendix). CPHCS is in the process of implementing the Maxor pharmacy data system to the remaining three adult institutions in California. Estimating the number of diabetes mellitus patients for 30 institutions was based on an inmate patient being on one or more medications to treat diabetes at any time through December 2009 or having a Hemoglobin A1c (HbA1c) greater than or equal to 6.5 percent from July 2009 through December 2009. The remaining three institutions sent lists of their diabetes patients to headquarters since these institutions have not yet implemented the new pharmacy system. This is the first statewide report, which includes estimates of the prevalence of diabetes, and quality of care and patient outcomes for the diabetic population in California’s adult inmate population based on pharmacy and laboratory data. However, these estimates have limitations. Specifically:
• Well controlled diabetic patients not on medications were not included. • The variation in patient population needs to be considered when looking at these results.
Certain comorbid conditions including, but not limited to, the use of certain psychiatric and antiretroviral medications may predispose a patient to developing metabolic syndrome. Institutions with higher prevalence of inmates on these medications may have higher rates of diabetes.
• These estimates come from a variety of data sources gathered during different times, such as laboratory data from 2009, but current Guardian pharmacy data and current DDPS inmate location. Recently incarcerated diabetic patients, identified by 2010 pharmacy records, may be incorrectly identified as lacking laboratory data because 2010 laboratory results were not captured.
• This report does not include laboratory data from outside medical facilities, such as testing that occurred during inpatient hospitalizations, data from community laboratories that were not processed through Quest or Foundation or testing performed at the point-of-care within institutions. Many institutions (most notably CIM, CMC, CMF, COR, KVSP, NKSP, PVSP, SATF, and WSP) operate an internal reference laboratory, data from which was not captured in this report. These omissions may result in under-reporting of both diabetes prevalence and the rate of HbA1c and/or LDL testing.
• The data in this report were not restricted to patients who had been at an institution at least six months for HbA1c testing or 12 months for LDL testing or microalbumin testing. Patient location of residence is listed as of March 2010. Results may not be entirely reflective of the practices of the clinician who is currently caring for the patient if a transfer recently took place from another prison or from the community.

Diabetes Outcomes Report Issued March 2010 Page 3 of 20
• The Guardian pharmacy tracking system had not yet been implemented at CMF, RJD and SOL. Thus, the standardized method developed to obtain medication data to identify patients with diabetes could not be used. Self-reported data from these three institutions were obtained to determine prevalence, and those self-reported datasets were then used to measure the remaining performance and outcome indicators. The Guardian system will be implemented at these three locations within the next few months. Therefore, future outcomes reports will be better able to include accurate data regarding the performance at these three institutions and to generate exception reports.
• For ten institutions (PBSP, SCC, CTF, WSP, CAL, CCI, CEN, CIM, CRC), pharmacy data was not available for all twelve months of 2009, because of the staggered implementation of the Guardian system across the state. For these institutions, there may be under-reporting of diabetes prevalence, although this was partly mitigated by the use of laboratory data.
MAJOR FINDINGS
• Diabetes mellitus (DM) prevalence statewide was approximately 4.6 percent or 7167 of 154,345 inmates in the 33 institutions. There was considerable variation in diabetes prevalence among the institutions.
• Of diabetic patients who had an HbA1c test from July through December 2009 statewide, 76 percent or 4160 of 5495 inmates had an HbA1c less than eight percent for their most recent test.
• Of the diabetes mellitus population who received an LDL-C test in from January through December 2009, 66 percent or 3335 of 5061 patients had their most recent LDL-C less than 100 mg/dL.
• Among patients with diabetes, 57 percent or 4071 of 7167 had received microalbumin testing between January and December 2009. Of patients who did receive the test, 77 percent or 3151 of 4071 had test results less than 30 mg/dL. It should be noted that for this first report, diabetic patients who already are prescribed an ACEI or ARB medication were not excluded. In future reports, this analysis will be performed.
EXPECTATIONS FOR FOLLOW-UP
It is expected that institutions will widely disseminate this report and discuss the findings at Quality Management Committee and Medical Program Subcommittee meetings and with primary care team members during different forums, including monthly all-team meetings and staff meetings. In April 2010, primary care teams will receive exception reports that identify individual patients who have not received the services discussed in this report or who have abnormally high values. Primary care teams are expected to use the exception reports to make necessary modifications to the care of individual patients to improve patient outcomes. Institutions should contact their regional leadership team for clarification or technical assistance.
Diabetes Outcomes Report Issued March 2010 Page 4 of 20
Outcome Findings by Category
PREVALENCE
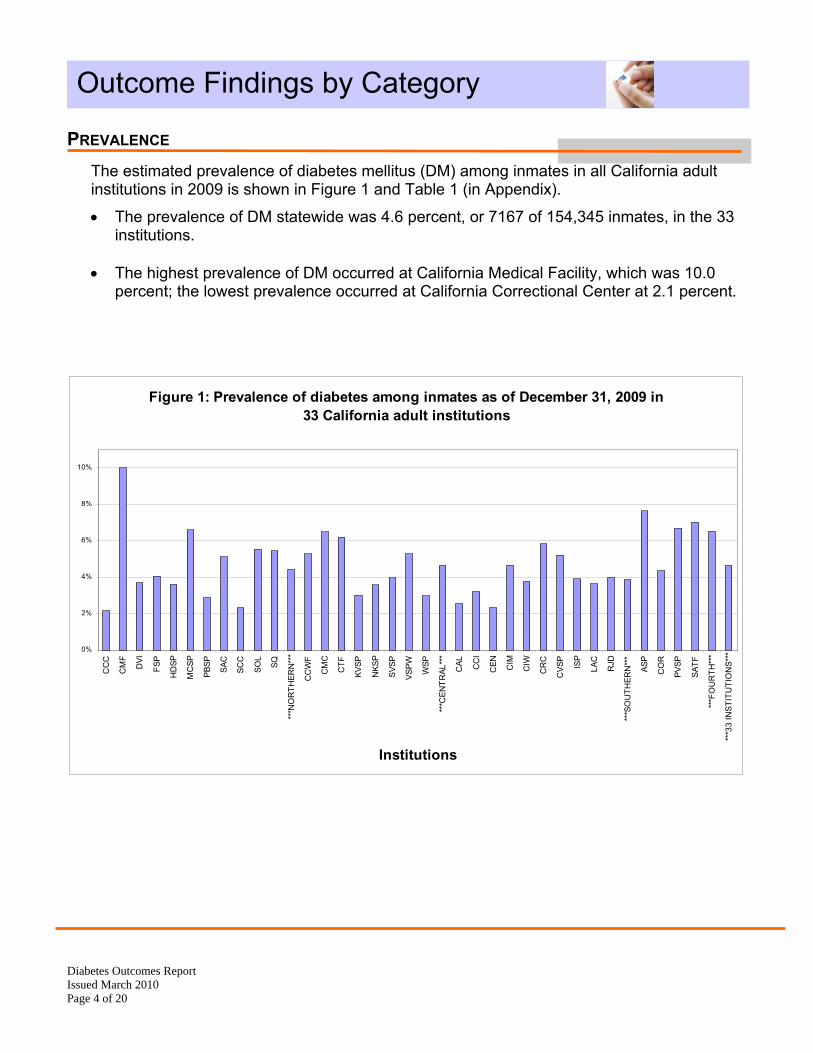
The estimated prevalence of diabetes mellitus (DM) among inmates in all California adult institutions in 2009 is shown in Figure 1 and Table 1 (in Appendix).
• The prevalence of DM statewide was 4.6 percent, or 7167 of 154,345 inmates, in the 33 institutions.
• The highest prevalence of DM occurred at California Medical Facility, which was 10.0
percent; the lowest prevalence occurred at California Correctional Center at 2.1 percent.
Figure 1: Prevalence of diabetes among inmates as of December 31, 2009 in 33 California adult institutions
0%
2%
4%
6%
8%
10%
CC
C
CM
F
DVI
FSP
HD
SP
MC
SP
PBSP
SAC
SCC
SOL
SQ
***N
OR
THER
N**
*
CC
WF
CM
C
CTF
KVSP
NKS
P
SVSP
VSPW WSP
***C
ENTR
AL**
*
CAL CC
I
CEN CIM
CIW
CR
C
CVS
P
ISP
LAC
RJD
***S
OU
THER
N**
*
ASP
CO
R
PVSP
SATF
***F
OU
RTH
***
***3
3 IN
STIT
UTI
ON
S***
Institutions
Diabetes Outcomes Report Issued March 2010 Page 5 of 20
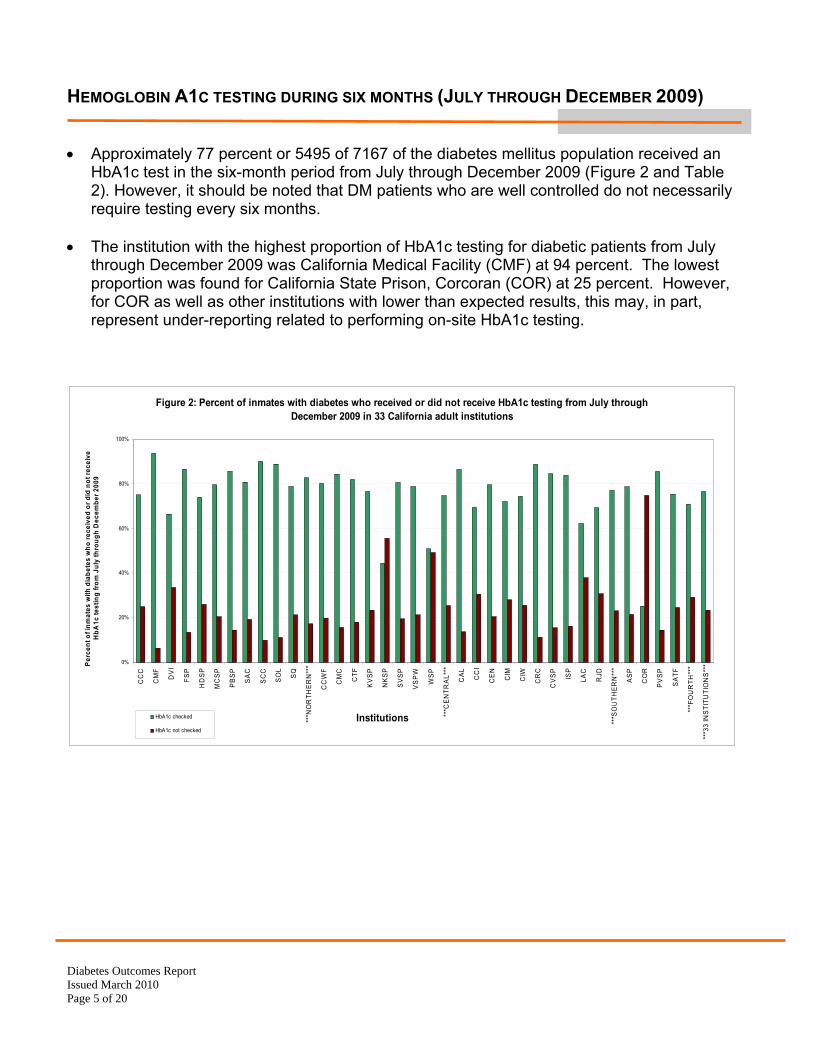
HEMOGLOBIN A1C TESTING DURING SIX MONTHS (JULY THROUGH DECEMBER 2009) • Approximately 77 percent or 5495 of 7167 of the diabetes mellitus population received an
HbA1c test in the six-month period from July through December 2009 (Figure 2 and Table 2). However, it should be noted that DM patients who are well controlled do not necessarily require testing every six months.
• The institution with the highest proportion of HbA1c testing for diabetic patients from July
through December 2009 was California Medical Facility (CMF) at 94 percent. The lowest proportion was found for California State Prison, Corcoran (COR) at 25 percent. However, for COR as well as other institutions with lower than expected results, this may, in part, represent under-reporting related to performing on-site HbA1c testing.
Figure 2: Percent of inmates with diabetes who received or did not receive HbA1c testing from July through December 2009 in 33 California adult institutions
0%
20%
40%
60%
80%
100%
CC
C
CM
F
DV
I
FSP
HD
SP
MC
SP
PB
SP
SA
C
SC
C
SO
L
SQ
***N
OR
THE
RN
***
CC
WF
CM
C
CTF
KV
SP
NK
SP
SV
SP
VS
PW
WS
P
***C
EN
TRA
L***
CA
L
CC
I
CE
N
CIM
CIW
CR
C
CV
SP
ISP
LAC
RJD
***S
OU
THE
RN
***
AS
P
CO
R
PV
SP
SA
TF
***F
OU
RTH
***
***3
3 IN
STI
TUTI
ON
S**
*
Institutions
Perc
ent o
f inm
ates
with
dia
bete
s w
ho re
ceiv
ed o
r did
not
rece
ive
HbA
1c te
stin
g fro
m J
uly
thro
ugh
Dec
embe
r 200
9
HbA1c checked
HbA1c not checked
*

Diabetes Outcomes Report Issued March 2010 Page 6 of 20
HEMOGLOBIN A1C < 8 PERCENT AND ≥ 8 PERCENT
Of diabetic patients who had an HbA1c test from July through December 2009, 76 percent or
4160 of 5495 inmates had an HbA1c less than eight percent for their most recent test (Figure 3 and Table 3).
• The institution with the largest proportion of diabetic patients with an HbA1c less than 8
percent from July through December 2009 was California Institution for Women (CIW) at 90 percent. The lowest proportions occurred at COR, Deuel Vocational Institution (DVI), and California State Prison, Solano (SOL), each between 60 and 61 percent.
• Only CIW met the 2010 quality improvement objective set by the executive staff of the
Quality Improvement Committee of having 85 percent or more patients with an HbA1c of eight percent or less, although California State Prison, Sacramento (SAC) was close at 84 percent.
Figure 3: Percent of inmates with diabetes whose HbA1c <8% or ≥8% from July through December 2009 in 33 California adult institutions
0%
20%
40%
60%
80%
100%
CC
C
CM
F
DV
I
FSP
HD
SP
MC
SP
PB
SP
SA
C
SC
C
SO
L
SQ
***N
OR
THE
RN
***
CC
WF
CM
C
CTF
KV
SP
NK
SP
SV
SP
VS
PW
WS
P
***C
EN
TRA
L***
CA
L
CC
I
CE
N
CIM
CIW
CR
C
CV
SP
ISP
LAC
RJD
***S
OU
THE
RN
***
AS
P
CO
R
PV
SP
SA
TF
***F
OU
RTH
***
***3
3 IN
STI
TUTI
ON
S**
*
Institutions
Per
cent
of i
nmat
es w
ith d
iabe
tes
who
se H
bA1c
<8%
and
≥8%
from
Ju
ly th
roug
h D
ecem
ber 2
009
HbA1c <8%
HbA1c ≥8%
85% QI Goal

Diabetes Outcomes Report Issued March 2010 Page 7 of 20
HEMOGLOBIN A1C < 9 PERCENT AND ≥ 9 PERCENT • Of diabetic patients who had an HbA1c test from July through December 2009, 87 percent or
4760 of 5495 had an HbA1c of less than 9 percent for their most recent test (Figure 4 and Table 4).
• The highest proportion of patients with diabetes with HbA1c less than nine percent from
January through December 2009 was CIW at 97 percent. The lowest proportions occurred at COR with 77 percent and SOL at 78 percent.
Figure 4: Percent of inmates with diabetes whose HbA1c<9% or ≥9% from July through December 2009 in 33
California adult institutions
0%
20%
40%
60%
80%
100%
CC
C
CM
F
DV
I
FSP
HD
SP
MC
SP
PB
SP
SA
C
SC
C
SO
L
SQ
***N
OR
THE
RN
***
CC
WF
CM
C
CTF
KV
SP
NK
SP
SV
SP
VS
PW
WS
P
***C
EN
TRA
L***
CA
L
CC
I
CE
N
CIM
CIW
CR
C
CV
SP
ISP
LAC
RJD
***S
OU
THE
RN
***
AS
P
CO
R
PV
SP
SA
TF
***F
OU
RTH
***
***3
3 IN
STI
TUTI
ON
S**
*
Institutions
Perc
ent o
f inm
ates
with
dia
bete
s w
hose
HbA
1c <
9% a
nd ≥
9% fr
om
July
thro
ugh
Dec
embe
r 200
9
HbA1c<9%
HbA1c≥9%

Diabetes Outcomes Report Issued March 2010 Page 8 of 20
LDL-C TESTING DURING 12 MONTHS • Approximately 71 percent or 5061 of 7167 of the total diabetes mellitus population in
institutions had an LDL-C test from January through December 2009 (Figure 5 and Table 5). • The highest proportion of LDL-C testing from January through December 2009 occurred at
Folsom State Prison at 94 percent. The lowest proportions occurred at North Kern State Prison at 13 percent and California Medical Facility at 16 percent. Again, these figures do not reflect the onsite laboratory assessments that are performed at many institutions; therefore, some results may be falsely depressed. In addition, it should be noted that preventive service testing such as lipid analysis may be lower at Reception Centers, as the abbreviated length of stay at a Reception Center may prevent the clinician from completing all assessments prior to permanent endorsement and transfer of the inmate.
Figure 5: Percent of inmates with diabetes who received or did not receive LDL-C screening from January through December 2009 in 33 California adult institutions
0%
20%
40%
60%
80%
100%
CC
C
CM
F
DV
I
FSP
HD
SP
MC
SP
PB
SP
SA
C
SC
C
SO
L
SQ
***N
OR
THE
RN
***
CC
WF
CM
C
CTF
KV
SP
NK
SP
SV
SP
VS
PW
WS
P
***C
EN
TRA
L***
CA
L
CC
I
CE
N
CIM
CIW
CR
C
CV
SP
ISP
LAC
RJD
***S
OU
THE
RN
***
AS
P
CO
R
PV
SP
SA
TF
***F
OU
RTH
***
***3
3 IN
STI
TUTI
ON
S**
*
Institutions
Perc
ent o
f inm
ates
with
dia
bete
s w
ho re
ceiv
ed o
r did
not
rece
ive
LDL-
C s
cree
ning
from
Jan
uary
thro
ugh
Dec
embe
r 200
9
LDL-C done
No LDL-C done

Diabetes Outcomes Report Issued March 2010 Page 9 of 20
LDL-C < 100 AND ≥ 100 MG/DL
• Of the diabetes mellitus population who received an LDL-C test from January through December 2009, 66 percent or 3335 of 5061 had their most recent LDL-C measure less than 100 mg/dL (Figure 6 and Table 6).
• The highest proportion of LDL-C less than 100 mg/dL from January through December 2009
occurred at Folsom State Prison with 81 percent. The lowest proportion occurred at North Kern State Prison at 50 percent.
• None of the institutions have yet met the 2010 quality improvement objective set by the
executive staff of the Quality Improvement Committee of having greater than 85 percent of diabetes mellitus patients with a LDL-C less than 100 mg/dL.
Figure 6: Percent of inmates with diabetes whose LDL-C < 100 and ≥100 mg/dL from January through December 2009 in 33 California adult institutions
0%
20%
40%
60%
80%
100%
CC
C
CM
F
DV
I
FSP
HD
SP
MC
SP
PB
SP
SA
C
SC
C
SO
L
SQ
***N
OR
THE
RN
***
CC
WF
CM
C
CTF
KV
SP
NK
SP
SV
SP
VS
PW
WS
P
***C
EN
TRA
L***
CA
L
CC
I
CE
N
CIM
CIW
CR
C
CV
SP
ISP
LAC
RJD
***S
OU
THE
RN
***
AS
P
CO
R
PV
SP
SA
TF
***F
OU
RTH
***
***3
3 IN
STI
TUTI
ON
S**
*Institutions
Perc
ent o
f inm
ates
with
dia
bete
s w
hose
LD
L-C
< a
nd ≥
100
mg/
dL
from
Jan
uary
thro
ugh
Dec
embe
r 200
9
LDL-C<100 mg/dL
LDL-C≥100 mg/dL
85% QI Goal
Diabetes Outcomes Report Issued March 2010 Page 10 of 20
MICROALBUMIN TESTING DURING 12 MONTHS
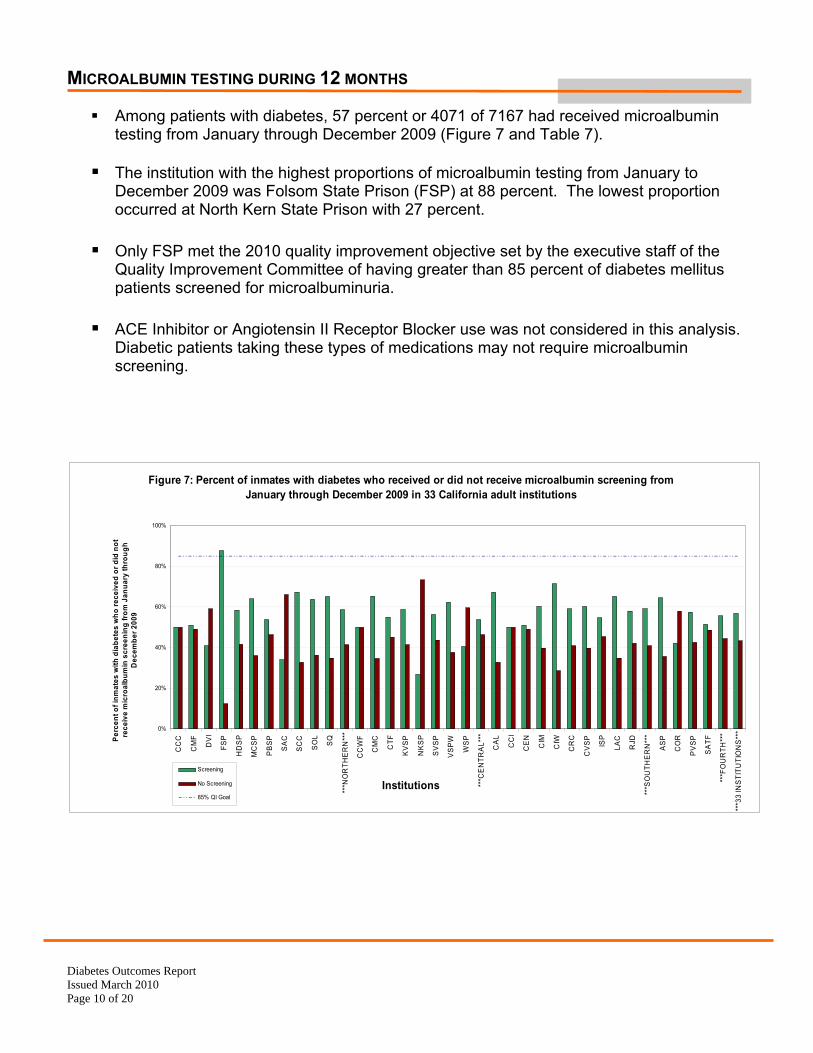
Among patients with diabetes, 57 percent or 4071 of 7167 had received microalbumin testing from January through December 2009 (Figure 7 and Table 7).
The institution with the highest proportions of microalbumin testing from January to
December 2009 was Folsom State Prison (FSP) at 88 percent. The lowest proportion occurred at North Kern State Prison with 27 percent.
Only FSP met the 2010 quality improvement objective set by the executive staff of the
Quality Improvement Committee of having greater than 85 percent of diabetes mellitus patients screened for microalbuminuria.
ACE Inhibitor or Angiotensin II Receptor Blocker use was not considered in this analysis.
Diabetic patients taking these types of medications may not require microalbumin screening.
Figure 7: Percent of inmates with diabetes who received or did not receive microalbumin screening from January through December 2009 in 33 California adult institutions
0%
20%
40%
60%
80%
100%
CC
C
CM
F
DV
I
FSP
HD
SP
MC
SP
PB
SP
SA
C
SC
C
SO
L
SQ
***N
OR
THE
RN
***
CC
WF
CM
C
CTF
KV
SP
NK
SP
SV
SP
VS
PW
WS
P
***C
EN
TRA
L***
CA
L
CC
I
CE
N
CIM
CIW
CR
C
CV
SP
ISP
LAC
RJD
***S
OU
THE
RN
***
AS
P
CO
R
PV
SP
SA
TF
***F
OU
RTH
***
***3
3 IN
STI
TUTI
ON
S**
*
Institutions
Perc
ent o
f inm
ates
with
dia
bete
s w
ho re
ceiv
ed o
r did
not
re
ceiv
e m
icro
albu
min
scr
eeni
ng fr
om J
anua
ry th
roug
h D
ecem
ber 2
009
Screening
No Screening
85% QI Goal

Diabetes Outcomes Report Issued March 2010 Page 11 of 20
MICROALBUMIN < 30 AND ≥ 30 MG/L
Of patients who had received testing for microalbumin, 77 percent or 3151 of 4071 had lower than 30 mg/L at their last test (Figure 8 and Table 8).
Calipatria State Prison (CAL) and California Institution for Women (CIW) had the highest proportion, 89 percent, of diabetes patients with microalbumin testing at lower than 30 mg/L. The institution with the lowest proportion was California Rehabilitation Center (CRC) at 66 percent.
Figure 8: Percent of inmates with diabetes whose last microalbumin < 30 and ≥30 mg/L from January through December 2009 in 33 California adult institutions
0%
20%
40%
60%
80%
100%
CC
C
CM
F
DV
I
FSP
HD
SP
MC
SP
PB
SP
SA
C
SC
C
SO
L
SQ
***N
OR
THE
RN
***
CC
WF
CM
C
CTF
KV
SP
NK
SP
SV
SP
VS
PW
WS
P
***C
EN
TRA
L***
CA
L
CC
I
CE
N
CIM
CIW
CR
C
CV
SP
ISP
LAC
RJD
***S
OU
THE
RN
***
AS
P
CO
R
PV
SP
SA
TF
***F
OU
RTH
***
***3
3 IN
STI
TUTI
ON
S**
*
Institutions
Perc
ent o
f inm
ates
with
dia
bete
s w
hose
last
m
icro
albu
min
<30
or ≥
30 fr
om J
anua
ry th
roug
h D
ecem
ber 2
009
MA <30 mg/L
MA≥30 mg/L

Diabetes Outcomes Report Issued March 2010 Page 12 of 20
Appendix Table 1: Number and prevalence of inmates with diabetes as of December 31, 2009 in 33 California adult institutions
Region Diabetes Population (n)
Inmate Population on Dec 31 2009 (n)
Diabetes Prevalence
CCC 120 5,596 2.1% CMF 287 2,873 10.0% DVI 134 3,627 3.7% FSP 155 3,819 4.1%
HDSP 161 4,484 3.6% MCSP 250 3,797 6.6% PBSP 97 3,370 2.9% SAC 156 3,058 5.1% SCC 131 5,614 2.3% SOL 281 5,082 5.5% SQ 269 4,946 5.4%
NORTHERN 2,041 46,266 4.4% CCWF 202 3,833 5.3% CMC 421 6,497 6.5% CTF 376 6,064 6.2%
KVSP 145 4,804 3.0% NKSP 191 5,333 3.6% SVSP 144 3,622 4.0% VSPW 202 3,821 5.3% WSP 175 5,871 3.0%
CENTRAL 1,856 39,845 4.7% CAL 110 4,311 2.6% CCI 190 5,938 3.2% CEN 108 4,676 2.3% CIM 246 5,295 4.6% CIW 98 2,593 3.8% CRC 256 4,393 5.8%
CVSP 181 3,483 5.2% ISP 165 4,237 3.9% LAC 166 4,571 3.6% RJD 188 4,710 4.0%
SOUTHERN 1,708 44,207 3.7% ASP 517 6,786 7.6% COR 238 5,480 4.3% PVSP 325 4,868 6.7% SATF 482 6,893 7.0%
FOURTH 1,562 24,027 6.5% 33 INSTITUTIONS 7,167 154,345 4.6%

Diabetes Outcomes Report Issued March 2010 Page 13 of 20
Table 2: Number and percent of inmates with diabetes who received Hemoglobin A1c testing from July through December 2009 in 33 California adult institutions
Region
Diabetes Population
(n)
Received Hemoglobin A1c
test in last 6 months (July -
Dec 2009) (n)
A1c test in last 6 months (July -
Dec 2009) (%)
CCC 120 90 75% CMF 287 269 94% DVI 134 89 66% FSP 155 134 86%
HDSP 161 119 74% MCSP 250 199 80% PBSP 97 83 86% SAC 156 126 81% SCC 131 118 90% SOL 281 250 89% SQ 269 212 79%
NORTHERN 2,041 1,689 83% CCWF 202 162 80% CMC 421 355 84% CTF 376 308 82%
KVSP 145 111 77% NKSP 191 85 45% SVSP 144 116 81% VSPW 202 159 79% WSP 175 89 51%
CENTRAL 1,856 1,385 75% CAL 110 95 86% CCI 190 132 69% CEN 108 86 80% CIM 246 177 72% CIW 98 73 74% CRC 256 227 89%
CVSP 181 153 85% ISP 165 138 84% LAC 166 103 62% RJD 188 130 69%
SOUTHERN 1,708 1,314 77% ASP 517 406 79% COR 238 60 25% PVSP 325 278 86% SATF 482 363 75%
FOURTH 1,562 1,107 71% 33 INSTITUTIONS 7,167 5,495 77%

Diabetes Outcomes Report Issued March 2010 Page 14 of 20
Table 3: Number and percent of inmates with diabetes whose latest Hemoglobin A1c < 8% from July through December 2009 in 33 California adult institutions
Region
A1c test in last 6 months (July -
Dec 2009) (n)
Latest A1C < 8% (n)
Latest A1C < 8% (%)
CCC 90 63 70% CMF 269 208 77% DVI 89 54 61% FSP 134 104 78%
HDSP 119 93 78% MCSP 199 165 83% PBSP 83 69 83% SAC 126 106 84% SCC 118 94 80% SOL 250 152 61% SQ 212 152 72%
NORTHERN 1,689 1,260 75% CCWF 162 128 79% CMC 355 290 82% CTF 308 243 79%
KVSP 111 81 73% NKSP 85 64 75% SVSP 116 89 77% VSPW 159 123 77% WSP 89 64 72%
CENTRAL 1,385 1,082 78% CAL 95 66 69% CCI 132 95 72% CEN 86 63 73% CIM 177 129 73% CIW 73 66 90% CRC 227 156 69%
CVSP 153 120 78% ISP 138 108 78% LAC 103 74 72% RJD 130 98 75%
SOUTHERN 1,314 975 74% ASP 406 323 80% COR 60 36 60% PVSP 278 219 79% SATF 363 265 73%
FOURTH 1,107 843 76% 33 INSTITUTIONS 5,495 4,160 76%

Diabetes Outcomes Report Issued March 2010 Page 15 of 20
Table 4: Number and percent of inmates with diabetes whose latest Hemoglobin A1c < 9% from July through December 2009 in 33 California adult institutions
Region
A1c test in last 6 months (July - Dec 2009)
(n)
Latest A1c <9%
(n)
Latest A1c < 9%
(%) CCC 90 73 81% CMF 269 231 86% DVI 89 71 80% FSP 134 119 89%
HDSP 119 106 89% MCSP 199 181 91% PBSP 83 73 88% SAC 126 116 92% SCC 118 106 90% SOL 250 195 78% SQ 212 178 84%
NORTHERN 1,689 1,449 86% CCWF 162 145 89% CMC 355 316 89% CTF 308 267 87%
KVSP 111 99 89% NKSP 85 73 86% SVSP 116 104 90% VSPW 159 139 87% WSP 89 74 83%
CENTRAL 1,385 1,217 88% CAL 95 78 82% CCI 132 113 86% CEN 86 76 88% CIM 177 153 86% CIW 73 71 97% CRC 227 182 80%
CVSP 153 136 89% ISP 138 123 89% LAC 103 88 85% RJD 130 117 90%
SOUTHERN 1,314 1,137 87% ASP 406 359 88% COR 60 46 77% PVSP 278 242 87% SATF 363 310 85%
FOURTH 1,107 957 86% 33 INSTITUTIONS 5,495 4,760 87%

Diabetes Outcomes Report Issued March 2010 Page 16 of 20
Table 5: Number and percent of inmates with diabetes who received LDL testing from January through December 2009 in 33 California adult institutions
Region Diabetes Population
(n)
LDL test in last 12 months (Jan -
Dec 2009) (n)
LDL test in last 12 months (Jan -
Dec 2009) (%)
CCC 120 94 78% CMF 287 47 16% DVI 134 79 59% FSP 155 146 94%
HDSP 161 132 82% MCSP 250 231 92% PBSP 97 80 82% SAC 156 133 85% SCC 131 121 92% SOL 281 239 85% SQ 269 200 74%
NORTHERN 2,041 1502 74% CCWF 202 161 80% CMC 421 359 85% CTF 376 306 81%
KVSP 145 50 34% NKSP 191 24 13% SVSP 144 92 64% VSPW 202 169 84% WSP 175 109 62%
CENTRAL 1,856 1270 68% CAL 110 96 87% CCI 190 146 77% CEN 108 88 81% CIM 246 184 75% CIW 98 90 92% CRC 256 223 87%
CVSP 181 159 88% ISP 165 137 83% LAC 166 127 77% RJD 188 143 76%
SOUTHERN 1,708 1393 82% ASP 517 431 83% COR 238 62 26% PVSP 325 275 85% SATF 482 128 27%
FOURTH 1,562 896 57% 33 INSTITUTIONS 7,167 5061 71%

Diabetes Outcomes Report Issued March 2010 Page 17 of 20
Table 6: Number and percent of inmates with diabetes whose latest LDL < 100 mg/dL from January through December 2009 in 33 California adult institutions
Region
LDL test in last 12 months (Jan - Dec
2009) (n)
Latest LDL < 100 mg/dL
(n)
Latest LDL < 100 mg/dL
(%) CCC 94 62 66% CMF 47 28 60% DVI 79 52 66% FSP 146 118 81%
HDSP 132 87 66% MCSP 231 162 70% PBSP 80 54 68% SAC 133 101 76% SCC 121 82 68% SOL 239 177 74% SQ 200 145 73%
NORTHERN 1,502 1,068 71% CCWF 161 101 63% CMC 359 242 67% CTF 306 202 66%
KVSP 50 35 70% NKSP 24 12 50% SVSP 92 58 63% VSPW 169 97 57% WSP 109 68 62%
CENTRAL 1,270 815 64% CAL 96 66 69% CCI 146 90 62% CEN 88 53 60% CIM 184 116 63% CIW 90 58 64% CRC 223 132 59%
CVSP 159 95 60% ISP 137 90 66% LAC 127 71 56% RJD 143 89 62%
SOUTHERN 1,393 860 62% ASP 431 297 69% COR 62 41 66% PVSP 275 174 63% SATF 128 80 63%
FOURTH 896 592 66% 33 INSTITUTIONS 5,061 3,335 66%

Diabetes Outcomes Report Issued March 2010 Page 18 of 20
Table 7: Number and percent of inmates with diabetes who received microalbumin testing from January through December 2009 in 33 California adult institutions
Region Diabetes Population
(n)
Microalbumin testing in last 12 months (Jan-
Dec 2009) (n)
Microalbumin testing in last 12 months (Jan-Dec 2009)
(%) CCC 120 60 50% CMF 287 146 51% DVI 134 55 41% FSP 155 136 88%
HDSP 161 94 58% MCSP 250 160 64% PBSP 97 52 54% SAC 156 53 34% SCC 131 88 67% SOL 281 179 64% SQ 269 175 65%
NORTHERN 2041 1198 59% CCWF 202 101 50% CMC 421 275 65% CTF 376 206 55%
KVSP 145 85 59% NKSP 191 51 27% SVSP 144 81 56% VSPW 202 126 62% WSP 175 71 41%
CENTRAL 1856 996 54% CAL 110 74 67% CCI 190 95 50% CEN 108 55 51% CIM 246 148 60% CIW 98 70 71% CRC 256 151 59%
CVSP 181 109 60% ISP 165 90 55% LAC 166 108 65% RJD 188 109 58%
SOUTHERN 1708 1009 59% ASP 517 333 64% COR 238 100 42% PVSP 325 187 58% SATF 482 248 51%
FOURTH 1562 868 56% 33 INSTITUTIONS 7167 4071 57%

Diabetes Outcomes Report Issued March 2010 Page 19 of 20
Table 8: Number and percent of inmates with diabetes whose latest microalbumin < 30 mg/L from January through December 2009 in 33 California adult institutions
Region
Microalbumin testing in last 12 months (Jan-Dec
2009) (n)
Latest microalbumin
< 30 mg/L (n)
Latest microalbumin
< 30 mg/L (%)
CCC 60 49 82% CMF 146 107 73% DVI 55 39 71% FSP 136 113 83%
HDSP 94 66 70% MCSP 160 128 80% PBSP 52 43 83% SAC 53 46 87% SCC 88 67 76% SOL 179 130 73% SQ 175 144 82%
NORTHERN 1198 932 78% CCWF 101 75 74% CMC 275 217 79% CTF 206 166 81%
KVSP 85 71 84% NKSP 51 40 78% SVSP 81 61 75% VSPW 126 100 79% WSP 71 58 82%
CENTRAL 996 788 79% CAL 74 66 89% CCI 95 68 72% CEN 55 44 80% CIM 148 113 76% CIW 70 62 89% CRC 151 100 66%
CVSP 109 79 72% ISP 90 73 81% LAC 108 82 76% RJD 109 89 82%
SOUTHERN 1009 776 77% ASP 333 266 80% COR 100 81 81% PVSP 187 131 70% SATF 248 177 71%
FOURTH 868 655 75% 33 INSTITUTIONS 4071 3151 77%

Diabetes Outcomes Report Issued March 2010 Page 20 of 20
Table 9: California Adult Institutions that use Quest Laboratories, Foundation Laboratories, Maxor Pharmacy, or Patient Pharmacy Tracking System (PPTS), February 2010
Laboratory Pharmacy
Quest Foundation Maxor PPTS Northern Region
CCC
CMF
DVI
FSP
HDSP
MCSP
PBSP
SAC
SCC
SOL
SQ
Central Region CCWF
CMC
CTF
KVSP
NKSP
SVSP
VSPW
WSP
Southern Region CAL
CCI
CEN
CIM
CIW
CRC
CVSP
ISP
LAC
RJD
Fourth Region ASP
COR
PVSP
SATF