appendix 6 - ipart.nsw.gov.au · this report has been prepared for auburn city council. sgs...
TRANSCRIPT
FIT FOR THE FUTURE SUBMISSION . TEMPLATE 1
Appendix 6.2
FIT FOR THE FUTURE: URBAN STRUCTURE OF AUBURN, MAY 2015– PREPARED FOR AUBURN CITY COUNCIL BY SGS ECONOMICS AND PLANNING
SUBMITTED ON 30 JUNE 2015 BY AUBURN CITY COUNCIL, BURWOOD COUNCIL AND CITY OF CANADA BAY COUNCIL


150053-Final report-150415_Draft
Fit for the Future: Urban structure of Auburn Final report Auburn City Council May 2015

This report has been prepared for Auburn City Council. SGS Economics and Planning has taken all due care in the preparation of this report. However, SGS and its associated consultants are not liable to any person or entity for any damage or loss that has occurred, or may occur, in relation to that person or entity taking or not taking action in respect of any representation, statement, opinion or advice referred to herein.
SGS Economics and Planning Pty Ltd ACN 007 437 729 www.sgsep.com.au Offices in Canberra, Hobart, Melbourne and Sydney
150053-Final report-150415_Draft

Urban structure of Auburn 1
TABLE OF CONTENTS
EXECUTIVE SUMMARY 2 Background 2 Options 3 Metropolitan Planning 4 Auburn’s positioning in the emerging three cities of Sydney 4 Functional linkages of options 6 Comparison of options 9
1 INTRODUCTION 10 1.1 Fit for the Future reform package 10 1.2 Scope of works and structure of report 12 1.3 Options 13
2 AUBURN IN FIT FOR FUTURE CONTEXT 14 2.1 Overall rationale of agenda 14 2.2 Relevance to Auburn City Council 15 2.3 Fit for the Future assessment criteria 19
3 OPTIONS 20 3.1 Options in detail 20
Base case: Auburn stand-alone 21 Option 1: Panel’s augmented option: Parramatta and Auburn 22 Option 2: Alternative option: Auburn, Burwood, Canada Bay and Strathfield 23
4 URBAN STRUCTURE AND ECONOMIC GEOGRAPHY 24 4.1 The metropolitan planning and growth context 25
Strategy context 25 Growth prospects 30
4.2 Auburn’s economic profile in context 31 4.3 Sydney’s emerging economic geography 34
The geography of disadvantage 34 Accessibility to jobs and agglomeration economies 35 Auburn’s positioning in the emerging three cities of Sydney 36
4.4 Summary and implications for local government boundary reform 38
5 FUNCTIONAL REGIONS ANALYSIS 39 5.1 Spatial analysis of functional linkages 40 5.2 Functional region composite index 45
Results 46
6 COMPARISON OF OPTIONS 48

Urban structure of Auburn 2
LIST OF FIGURES
F IGURE 1 . OP T IONS FO R AU BUR N 3 F IGURE 2 . SY DNEY ’ S EME RGI NG ECO NO MIC GEO GRAP H Y 5 F IGURE 3 . AUBUR N’ S FUN CT IONA L REGI ON I NDEX ( COMP OS I T E ) 7 F IGURE 4 . F I T FO R FUT U RE – CRIT E RIA AND BENCHMA R KS 11 F IGURE 5 . OP T IONS FO R AU BUR N 13 F IGURE 6 . INCENT IVES FO R REFO RM 14 F IGURE 7 . P ROP OSE D BOU NDARY AD JUST MENT S 16 F IGURE 8 . CHARACT ERIST ICS OF S Y D NEY MET ROP OL I TAN C OUNCI LS 17 F IGURE 9 . KEY MILESTON ES FOR L OCAL GOVE RNME NT RE FO RM 18 F IGURE 10 . BASE CASE 21 F IGURE 11 . OP T ION 1 22 F IGURE 12 . OP T ION 2 23 F IGURE 13 . C I T Y OF C I T I ES CO NCE P T, 200 5 MET ROP O L I TA N ST RAT EGY 25 F IGURE 14 . A P LAN FO R G ROW IN G S Y D NE Y – CON NECT IN G JO BS AN D H OMES, MAP 26 F IGURE 15 . GREAT ER PA RRA MAT TA 27 F IGURE 16 . GREAT ER PA RRA MAT TA TO OLY MP IC P ENINSULA G ROW T H AREA 28 F IGURE 17 . SY DNEY ’ S SUB REG IONS 29 F IGURE 18 . INDUST RY I NCO ME SHAR E OF SY DNEY ’ S GDP FO R SELECT E D SECTO RS 31 F IGURE 19 . EMP LOY MENT SHA RE IN SELECT ED AREAS AND S ECTO RS, 2 001 & 201 1 32 F IGURE 20 . JO B D EST INAT IONS FO R AU BU RN RESI DENT WO RKERS, 2001 , 2006 & 2011 33 F IGURE 21 . SEIFA INDEX 2011 34 F IGURE 22 . SY DNEY EFFECT IVE J OB DENSI T Y 35 F IGURE 23 . SY DNEY ’ S EME RGI NG ECO NO MIC GEO GRAP HY 36 F IGURE 24 . NET WORK C I T Y F UT URE 37 F IGURE 25 . P OT ENT IAL ST RAT EGIC CHOICES 38 F IGURE 26 . I LG RP CONSI DERAT IO NS FOR BOU NDAR I ES 20 13 39 F IGURE 27 . AUBUR N’ S FUN CT IONA L REGI ON I NDEX ( HOUSI N G MIG RAT ION ) 40 F IGURE 28 . AUBUR N’ S FUN CT IONA L REGI ON I NDEX - J OUR NEY TO WO RK 41 F IGURE 29 . AUBUR N’ S FUN CT IONA L REGI ON I NDEX ( CAR T R AVEL ) 42 F IGURE 30 . AUBUR N’ S FUN CT IONA L REGI ON I NDEX ( P UB L IC T RANSP O RT T RAVEL ) 42 F IGURE 31 . AUBUR N’ S FUN CT IONA L REGI ON I NDEX ( SHOP P I N G T R I P S ) 43 F IGURE 32 . AUBUR N’ S FUN CT IONA L REGI ON I NDEX ( SOCIA L AN D EDUC AT ION T RIP S ) 44 F IGURE 33 . AUBUR N’ S FUN CT IONA L REGI ON I NDE X ( COMP OSIT E ) 46
LIST OF TABLES
TABLE 1 . CO MP OSIT E R ANK- I NDEX SCORES ( UNW E IGHT ED) 7 TABLE 2 . F I T FOR T HE FUT UR E CRIT ERIA 19 TABLE 3 . BASE CAS E – P OP UL AT ION AN D EMP LOY MENT 21 TABLE 4 . OP T ION 1 – P OP U LAT ION AN D EMP LOY MENT 22 TABLE 5 . OP T ION 2 – P OP U LAT ION AN D EMP LOY MENT 23 TABLE 6 . E MP LOY MENT TARG ET S FOR SELECT ED ST RAT EGIC CENT RES FR OM DRAFT MET ROP OLITA N
ST RAT EGY TO 2031 30 TABLE 7 . A LT ERNAT IVE P ROJ EC T IONS FO R S OP P RECI N CT A ND GREAT ER PARRA MAT TA TO OLY MP IC
P ENINSULA CO RRI DO R 2 01 1 - 2031 30 TABLE 8 . CO MP OSIT E R ANK- I NDEX SCORES ( U NW E IGHT ED) 46

Urban structure of Auburn 1

Urban structure of Auburn 2
EXECUTIVE SUMMARY Background
The Independent Local Government Review Panel (ILGRP) released its final report titled “Revitalising Local Government” in October 2013. This report identified a package of local government reforms to reshape metropolitan governance arrangements and consolidate local government in the Sydney metropolitan area.
The objective for local government reform is to:
“Create strategic and Fit for the Future councils – Councils that are financially sustainable, efficient, with the capacity to effectively manage infrastructure and deliver services; the scale, resources and ‘strategic capacity’ to govern effectively and partner with the State; and has the capacity to reduce red tape and bureaucracy for business and of a scale and structure that is broadly in line with the Panel’s recommendations.”
According to the NSW State Government program, to become “Fit for the Future”, Councils must perform a self-assessment of their financial management, service delivery, and scale of operations and submit a proposal on how they plan to become “Fit for the Future” by June 2015.
The four criteria to assess whether a Council is “Fit for the Future” are:
− Financial sustainability − Effective infrastructure and service management − Efficiency − Scale and capacity
SGS Economics and Planning Pty Ltd (SGS) was engaged by Auburn City Council to provide advice on Auburn’s urban geography and implications of different local government amalgamation options. This study is purely from a ‘scale and capacity’ perspective (as outlined in the Independent Local Government Review Panel and Fit for the Future documentation). It does not consider financial aspects of merger options.
The ILGRP has suggested that Auburn, Parramatta and Holroyd LGAs could be an amalgamation option for further consideration. Auburn Council is of the view that Auburn, Canada Bay, Strathfield, and Burwood LGAs might also be an option for further consideration. At Council’s request the following options are tested from a strategic-capacity perspective, in line with the Fit for the Future assessment criteria:
− Base case: Auburn stands alone − Option 1: Panel’s augmented option: Parramatta and Auburn − Option 2 Alternative option: Auburn, Burwood, Canada Bay and Strathfield
This SGS study examines scale and capacity considerations by:
− examining the urban geography of Auburn in a metropolitan context, and − analysing the functional links of each merger option.

Urban structure of Auburn 3
Base case: Auburn stands alone Option 1: Auburn + Parramatta
Options
On Auburn Council’s recommendation, this report tests the functional linkages and connections between Auburn and Parramatta (Option 1), or between Auburn and its neighbouring councils to the east (Option 2), as shown in the figure below. These options are tested from strategic perspectives, in line with the Fit for the Future assessment criteria. Financial implications of these options are not considered in in this study.
The base case of a stand-alone Auburn Council is also tested.
FIGURE 1 . OPTIONS FOR AUBURN
Source: SGS, 2015. Options were provided by Auburn Council for testing.
Option 2: Auburn + Burwood + Canada Bay + Strathfield
Urban structure of Auburn 4
Metropolitan Planning
In the NSW Government’s A Plan for Growing Sydney (December 2014) the Parramatta CBD is reconceived as ‘Greater Parramatta’ to include surrounding precincts such as Westmead, Camellia and Rydalmere. This geographic definition of Greater Parramatta is contained within the existing boundaries of the Parramatta local government area, except for ‘Auto Alley’ (south Church Street) which is in Holroyd LGA.
Planning for this area would ideally include Holroyd, but is not necessarily made any stronger by the inclusion of Auburn. The State could be much more interventionist with economic development initiatives, directed investment and greater thinking around planning controls to achieve the objectives for the region.
The Plan for Growing Sydney also highlights the Greater Parramatta to Olympic Park peninsula as a new growth area. This extends from Westmead in the west through to Parramatta, Camellia, Silverwater, Sydney Olympic Park (SOP) and Rhodes in the east. This development corridor covers the three local government areas of Parramatta, Holroyd, Auburn and Canada Bay.
It could be argued that all of this corridor should be in one area which would involve a merger of Auburn at least with Parramatta. However, one council might not plan effectively for this area – it might be that advocacy for Parramatta ends up being greater than SOP for example. A strong planning framework established by the State Government – including, for example, a partnership approach between Councils with a role for land owners, may be more effective.
Auburn’s positioning in the emerging three cities of Sydney
Figure 2 provides a simple characterisation of the emerging economic geography of metropolitan Sydney which is relevant to thinking about directions for local government reform and amalgamations.
In the eastern half of the metropolitan area where the benefits of agglomeration are concentrated, a network of connected centres is emerging, with central Sydney the dominant node (this might be characterised as the first or ‘network city’). Immediately to the west, Parramatta and other centres in the central western parts of Sydney are increasingly connected to the eastern metropolitan complex of centres. This will be further enhanced via the upgrade provided by WestConnex (though enhanced public transport connections through the western corridor are also required). This increasingly ‘linked’ region might be described as the ‘second’ city. There are areas of disadvantage in this second city but property prices are rising and it is benefitting from its increasing links to job concentrations in the east. The third ‘city’ or area is outer western Sydney which up to now has been less connected, and has few strong economic concentrations.

Urban structure of Auburn 5
FIGURE 2 . SYDNEY’ S EMERGING ECONOMIC GEOGRAPHY
Source: SGS Economics and Planning 2015
The proposed second Sydney airport at Badgery’s Creek offers the prospect of an economic hub that will begin to address the economic stress and alienation that outer western Sydney or the ‘third city’, might have been confronting.
For the ‘first and second’ cities the direction must be about much greater connectivity and ‘freeing’ up the potential for multiple centres and nodes in the eastern half of the metropolitan area to be better connected. In this schema Auburn, Burwood, SOP/Rhodes and other nodes could all grow to provide access to employment as part of a ‘networked’ city. No particular priority is given to their relationship to Parramatta or central Sydney or Macquarie Park. They should be highly connected to all in the same way that nodes within metropolitan London or other European cities are highly connected by dense transport connections.
Given this understanding of the emerging economic geography of metropolitan Sydney a different strategic planning perspective is suggested by each of the options.
− Base Case: Auburn stands alone: Focus on growing SOP as major node linked both east and west − Option 1 Auburn and Parramatta: Focus on growing as part of Greater Parramatta − Option 2 Auburn, Canada Bay, Strathfield, Burwood: Developing additional strong node at
SOP/Rhodes as part of planning for the Greater Parramatta to Olympic Peninsular Corridor and the eastern metropolitan ‘network’ city.

Urban structure of Auburn 6
Functional linkages of options
In response to the ILGRP criteria, a number of spatial linkages are examined (local and metro wide) to assess the three options for Auburn. Flows to and from each LGA are assessed. The spatial analysis of linkages includes - housing sub-markets, journey to work patterns and labour markets, public and private transport accessibility, retail expenditure, and communities of interest (social and education trips).
The analysis of these dimensions is a spatial interpretation of the ILGRP’s scale and strategic capacity criterion, and assists in the understanding of how the region functions. This has implications for the Fit for the Future program since the organisation of administrative boundaries along the lines of functional regions is likely to enhance the strategic capacity of a future organisation in the region.
Using the multi-dimensional spatial analysis of linkages (described above), SGS derived a functional region composite index to measure Auburn’s functional connectivity with other LGAs by exploring its functional links under each option. The composite index examines each LGA’s connectivity to other LGAs in the options considered, by taking into account the connectivity of a region not only for economic purposes, but also for social, recreational and civic purposes.
Connectivity is calculated by analysing the origin-destination patterns of applicable functional linkages within a quantitative framework. That is, origin destination data from the spatial analysis is used to generate an index value to represent the extent to which each LGA is connected to Auburn. The composite index –as suggested by the name; is an un-weighted aggregation of the index scores. The aim of this index is to quantitatively measure the functional connectivity of each option being considered in this study.
The figure below is a visual representation of the composite index scores calculated across the region treating Auburn as the centre of the region (Figure 33). The numerical representation of these composite index scores are shown for each option in Table 1.

Urban structure of Auburn 7
FIGURE 3 . AUBURN’ S FUNCTIONAL REGION INDEX ( COMPOS ITE)
Source: SGS Economics and Planning 2015
A rank-index score of one represents highest functional connectivity amongst all options, and scores less than one represent decaying connectivity relative to the best performing option. Given the nature of the index, the scores captures absolute connectivity, but relative to the best performing option. As such, these are rank-index scores. The composite total index is un-weighted, which implies that the six spatial factors are treated equally.
TABLE 1 . COMPOSITE RANK- INDEX SCORES ( UNWEIGHTED)
Auburn
Auburn + Parramatta
Auburn + Burwood + Canada B ay + Strathfie ld
Base case Option 1 Option 2 Resident journey to work 0.71 0.85 1.00 Housing sub markets 1.00 0.83 0.91 Shopping trips 0.85 1.00 0.71 Travel time by car 1.00 0.62 0.66 Travel time by public transport 1.00 0.86 0.95 Trips by communities of interest 0.73 0.88 1.00
Composite total index score 5.29 5.03 5.22 Source: SGS Economics and Planning, 2015 Notes: the base case is based on intra-LGA flows using SA2 data, while the Options are based on inter-LGA flows.

Urban structure of Auburn 8
Overall, the base case scenario has the highest composite index of the three options. This is because the flows (or connectivity) to and from SA2s (ABS spatial units smaller than the LGA) in Auburn LGA are already high. In other words, the majority of the activity originating from the LGA, is contained within the LGA, and the accessibility within the LGA (public and private transport travel times in the context of the GMA) is strong. This supports anecdotal evidence that Auburn residents carry out their daily activities within the LGA and stems from the fact that key areas such as Auburn town centre, Lidcombe town centre and Sydney Olympic Park are all well serviced by public transport and support infrastructure. In other words, the rank-order index score for the base case captures the fact that the Auburn LGA as a local centre of activity is performing well, and this results in a significant share of activity occurring within the LGA.
In terms of merger options, Option 2 shows better functional connectivity than Option 1. The larger merger option (Option 2) represents a larger and more diverse range of populations interacting with each other. This also translates to a greater jobs and dwellings offer within the region resulting in stronger employment and housing functional linkages. This is evident in the strong scores for labour markets (journey to work) and communities of interest. Strathfield in particular has strong linkages to Auburn due to proximity and accessibility and there are a large number of social and education trips between the two LGAs. The results suggests that Auburn’s connectivity is slightly more east than it is west, though its geographical positioning implies that it sits at the threshold of where east meets west.

Urban structure of Auburn 9
Comparison of options
Based on the urban geography analysis, and analysis of functional linkages, this section concludes the study by identifying high-level pros and cons of each merger option. Note that this analysis is purely from a strategic capacity and scale point of view only. Financial considerations, and community issues are not discussed.
Base Case: Auburn stands alone Advantages Disadvantages Recognises and maintains strong existing internal functional linkages.
SOP and surrounding precinct to grow strongly as a major node ‘in its own right’ – which will be a major management and infrastructure servicing task in any case.
‘Misses’ the opportunity to develop a linked centre with Rhodes and develop even stronger hub in complex of centres.
Option 1 Auburn and Parramatta Advantages Disadvantages Strong retail linkages to Parramatta.
Reinforces the idea of a Greater Parramatta with a large hinterland which includes Auburn.
Doesn’t sufficiently recognise the growing industry and economic links which Auburn LGA has to the north and east.
Splits prospect of integrated SOP/Rhodes and raises possibility that SOP/Rhodes won’t get sufficient attention because of the inevitable focus on Parramatta; difficult to serve multiple major hubs.
Option 2 Auburn, Canada Bay, Strathfield, Burwood Advantages Disadvantages Builds on strong journey to work and social/educational trip relationships
Provides for maximum focus on growing SOP/Rhodes as a major economic node within the networked eastern metropolitan area.
Builds on strengthening existing industry and economic connections between Auburn LGA and locations to the east.
May dilute prospects for truly integrated planning for Greater Parramatta which is a key metropolitan strategic planning focus.

Urban structure of Auburn 10
1 INTRODUCTION 1.1 Fit for the Future reform package
The Independent Local Government Review Panel (ILGRP) released its final report titled “Revitalising Local Government” in October 2013. This report identified a package of local government reforms to reshape metropolitan governance arrangements and consolidate local government in the Sydney metropolitan area.
The objective for local government reform is to:
“Create strategic and Fit for the Future councils – Councils that are financially sustainable, efficient, with the capacity to effectively manage infrastructure and deliver services; the scale, resources and ‘strategic capacity’ to govern effectively and partner with the State; and has the capacity to reduce red tape and bureaucracy for business and of a scale and structure that is broadly in line with the Panel’s recommendations.”
Then in September 2014, the State Government announced a “Fit for the Future” package of local government reforms, responding to the recommendations of the ILGRP.
The NSW Government is “committed to rebuilding NSW” and the package states that the ILGRP final report shows that “the system of local government is not working as well as it should be”. Therefore, the package incentivises local governments to develop the scale and capacity necessary to provide quality services and infrastructure.
The State Government provided a blueprint to assist in the reform of local government. Key elements are:
− $258m to help councils who have decided to merge make the transition and provide services and
facilities communities need − $13m to support local transition committees and ensure elected representatives are involved in the
merger process − $5.3m to get new regional Joint Organisations up and running, and − Up to $600m potential savings from cheaper finance for Fit for the Future councils to invest in local
infrastructure.
In addition access to expert assistance, access to the Office of Local Government (OLG) One Stop Shop for local government reform, facilitators and technical support are offered.

Urban structure of Auburn 11
The OLG prepared a set of criteria and benchmarks as a guideline for assessing merger options.
FIGURE 4 . FIT FOR FUTURE – CRITERIA AND BENCHMA RKS
Source: NSW Government, p.8.

Urban structure of Auburn 12
1.2 Scope of works and structure of report
SGS Economics and Planning Pty Ltd (SGS) was engaged by Auburn City Council to provide advice on Auburn’s urban geography and implications of different local government amalgamation options. This study is purely from a ‘scale and capacity’ perspective (as outlined in the Independent Local Government Review Panel and Fit for the Future documentation). It does not consider financial aspects of merger options.
The ILGRP has suggested that Auburn, Parramatta and Holroyd LGAs could be an amalgamation option for further consideration. Auburn Council are of the view that Auburn, Canada Bay, Strathfield, and Burwood LGAs might also be an option for further consideration.
This SGS study examines scale and capacity considerations by:
− examining the urban geography of Auburn in a metropolitan context, and − analysing the functional links of each merger option.
The report is set out as follows:
Chapter 1: Introduction – this provides an overview of this study, its aims, structure, and objectives. Options being tested are also discussed.
Chapter 2: Auburn in Fit for the Future context – this provides an overview of the Fit for the Future program, its relevance to Auburn.
Chapter 3: Options – this provides a high level discussion of each option, including population and employment estimates.
Chapter 4: Urban structure and economic geography – this provides a strategic analysis of patterns and trends and changes in economic geography and approaches to economic development in the region.
Chapter 5: Functional regions analysis – this chapter considers the strategic importance and functional linkages of each option, and the latter models potential financial savings under each option. These aspects address scale and capacity criteria in the Fit for the Future program.
Chapter 6: Comparison of options– this concludes the study by noting the pros and cons of each merger option from a scale and strategic capacity point of view.

Urban structure of Auburn 13
1.3 Options
The ILGRP put forward a merger option of Parramatta, Holroyd and Auburn LGAs. It is the view of Council that this does not reflect the economic and social linkages that Auburn share with its neighbouring LGAs.
Instead, Auburn Council wished to test the functional linkages and connections between Auburn and Parramatta (Option 1), and between Auburn and its neighbouring councils to the east (Option 2), as shown in the figure below.
These options are tested from strategic perspectives, in line with the Fit for the Future assessment criteria. Financial implications of these options are not considered in in this study.
FIGURE 5 . OPTIONS FOR AUBURN
Source: SGS, 2015.
Option 2: Auburn + Burwood + Canada Bay + Strathfield
Option 1: Auburn + Parramatta Base case: Auburn stands alone

Urban structure of Auburn 14
2 AUBURN IN FIT FOR FUTURE CONTEXT
This section examines the policy context of the Fit for the Future program, as outlined by the State Government. Policy directions and aspects relating to Auburn are drawn out and discussed.
2.1 Overall rationale of agenda
In September 2014, the Office of Local Government (OLG) released the Fit for the Future package for local government reform in NSW. The Fit for the Future package highlights the incentives for voluntary mergers or the establishment of Regional Joint Organisations (refer to Figure below). The main rationale identified is that a stronger and more connected local government system is needed to cope with managing the growth of Sydney and NSW.
A Fit for the Future council is considered to be one that is sustainable, efficient, effectively manages infrastructure and delivers services for communities and has the scale and capacity to engage effectively across community, industry and government. The Panel recommends that scale and capacity should be resolved before assessing other Fit for the Future criteria.
FIGURE 6 . INCENTIVES FOR REFOR M
Source: Office of Local Government, 2014
Urban structure of Auburn 15
The Fit for the Future package highlights that the OLG endorses the recommendations of the ILGRP stating that they welcome proposals for reform from councils which are in line with the recommendations of the ILGRP.
The ILGRP’s final report Revitalising Local Government (2013) identified the following recommendations for metropolitan Sydney:
− Strengthen arrangements within state government for coordinated metropolitan planning and
governance, and to ensure more effective collaboration with local government. − Seek evidence-based responses from metropolitan councils to the Panel’s proposals for mergers
and major boundary changes, and refer both the proposals and responses to the proposed Ministerial Advisory Group for review, with the possibility of subsequent referrals to the Boundaries Commission.
− Prioritise assessments of potential changes to the boundary of the cities of Sydney and Parramatta and retain a separate City of Sydney Act to recognises its capital city role
− Establish state-local city partnership committees for Sydney and Parramatta along the lines of Adelaide’s capital city committee.
− Pending any future action on mergers, establish Joint organisations of councils for the purposes of strategic sub-regional planning.
− Maximise utilisation of the available local government revenue base in order to free-up State resources for support to councils in less advantaged areas.
− Continue to monitor the sustainability and appropriateness in their current form of the Hawkesbury, Blue Mountains and Wollondilly local government areas.
− Promote the establishment of a metropolitan Council of Mayors. 2.2 Relevance to Auburn City Council
In terms of the Auburn LGA, the ILGRP proposed the following merger and boundary change options for Auburn, Parramatta, Holroyd, Ryde (part), The Hills (part).
− Amalgamate (eastern two-thirds of Ryde to be included with North Shore group), and − Move northern boundary of Parramatta to the M2 (balance of The Hills to remain an individual
council), or − Adjust Parramatta’s boundaries to include parts of Ryde and The Hills and combine Auburn,
Holroyd and Parramatta as a strong Joint Organisation
The preferred option of the ILGRP is that Auburn amalgamate with the above councils and move Parramatta’s northern boundary to the M2.
The rationale in the report for these recommendations include:
− projected 2031 population approximately 558,500, including about one-third population of Ryde
and without other boundary adjustments − close functional interaction and economic/social links between these councils − need for stronger unified local government to develop Parramatta as second CBD − Parramatta’s northern boundary is very close to its CBD; relocation to M2 would facilitate planning
and improve socio-economic mix and community linkages, and; − incorporation of part of Ryde would strengthen link between Parramatta and ‘Global Sydney
Corridor’ and improve scope for integrated planning around Epping station.

Urban structure of Auburn 16
The ILGRP further highlighted the importance of Parramatta as a regional city and the need to promote and strengthen its capacity through better leadership and governance; “Looking ahead, it will be important to ensure that the centres of both Parramatta and Liverpool are governed by councils with considerably greater capacity and strength in sub-regional leadership than has been the case” (ILGRP 2013, p.99).
In terms of adjacent councils, the ILGRP provided a range of recommendations. The ILGRP recommended that Bankstown remain as is because the proposed sub-regional boundaries effectively rules out an amalgamation of Bankstown.
Canada Bay and Strathfield were recommended to amalgamate with Ashfield, Burwood, Leichhardt, and Marrickville or combine as a strong Joint Organisation. The eastern two-thirds of Ryde was recommended to amalgamate with Hunters Hill, Lane Cove, Willoughby, North Sydney and Mosman or combine as a strong Joint Organisation.
An overview of the proposed boundary adjustments is provided in Figure 7.
FIGURE 7 . PROPOSED BOUNDARY ADJUSTMENTS
Source: Independent Local Government Review Panel, 2013

Urban structure of Auburn 17
The ILGRP provided an overview of all Sydney metropolitan councils (and regional NSW councils) in terms of their TCorp Financial Sustainability Rating (FSR) and outlook. The FSR ranges from very strong to distressed, with a moderate rating indicating that a Council has an adequate capacity to meet its financial obligations in the short to medium term (being the next five years), and to manage risks to its business. The Outlook rating for each Council is based on the perception of the likely future movement in the FSR rating of each Council over the next three years.
Auburn is highlighted as a sound-negative (refer to Figure 8) which means it is currently sustainable but this is likely to decrease over the next three years. Councils adjacent to Auburn generally had moderate results.
FIGURE 8 . CHARACTERISTICS OF SYDNEY METROPOLITAN COUNCILS
Source: Independent Local Government Review Panel, 2013
Urban structure of Auburn 18
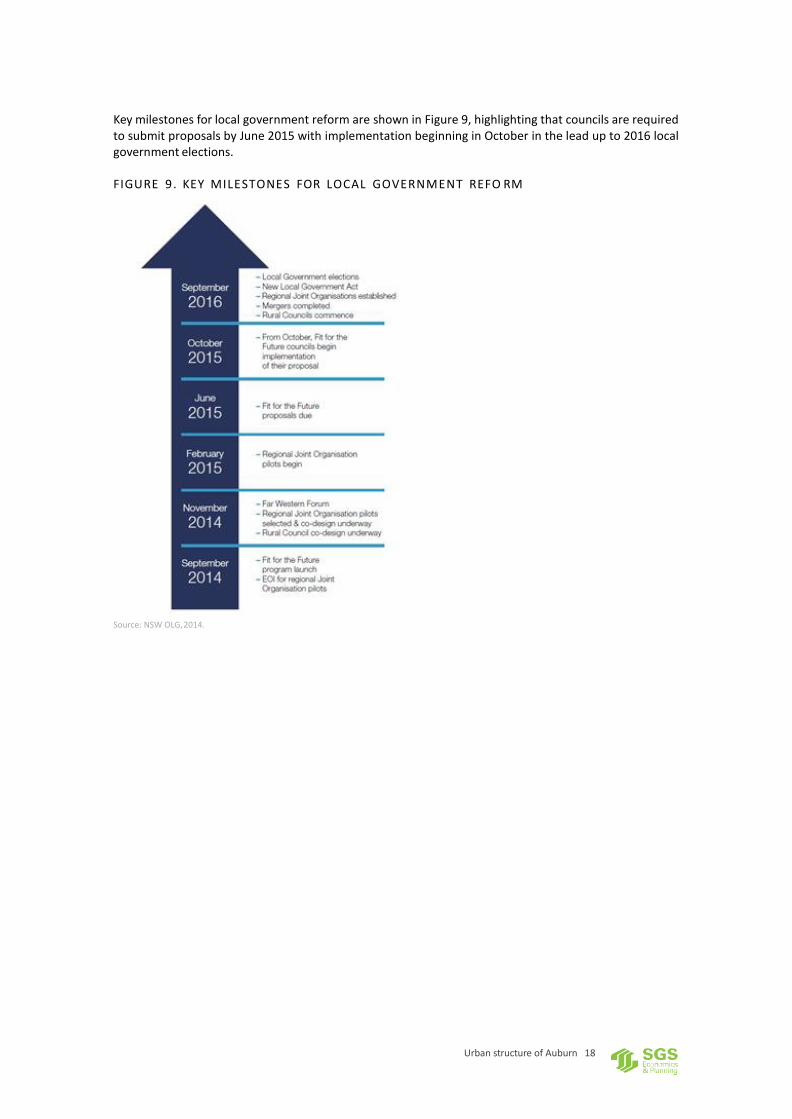
Key milestones for local government reform are shown in Figure 9, highlighting that councils are required to submit proposals by June 2015 with implementation beginning in October in the lead up to 2016 local government elections.
FIGURE 9 . KEY MILESTONES FOR LOCAL GOVERNMENT REFO RM
Source: NSW OLG, 2014.
Urban structure of Auburn 19
2.3 Fit for the Future assessment criteria
According to the NSW State Government program, to become “Fit for the Future”, Councils must perform a self-assessment of their financial management, service delivery, and scale of operations and submit a proposal on how they plan to become “Fit for the Future” by June 2015.
The four draft criteria to assess whether a Council is “Fit for the Future” are:
− Financial sustainability − Effective infrastructure and service management − Efficiency − Scale and capacity
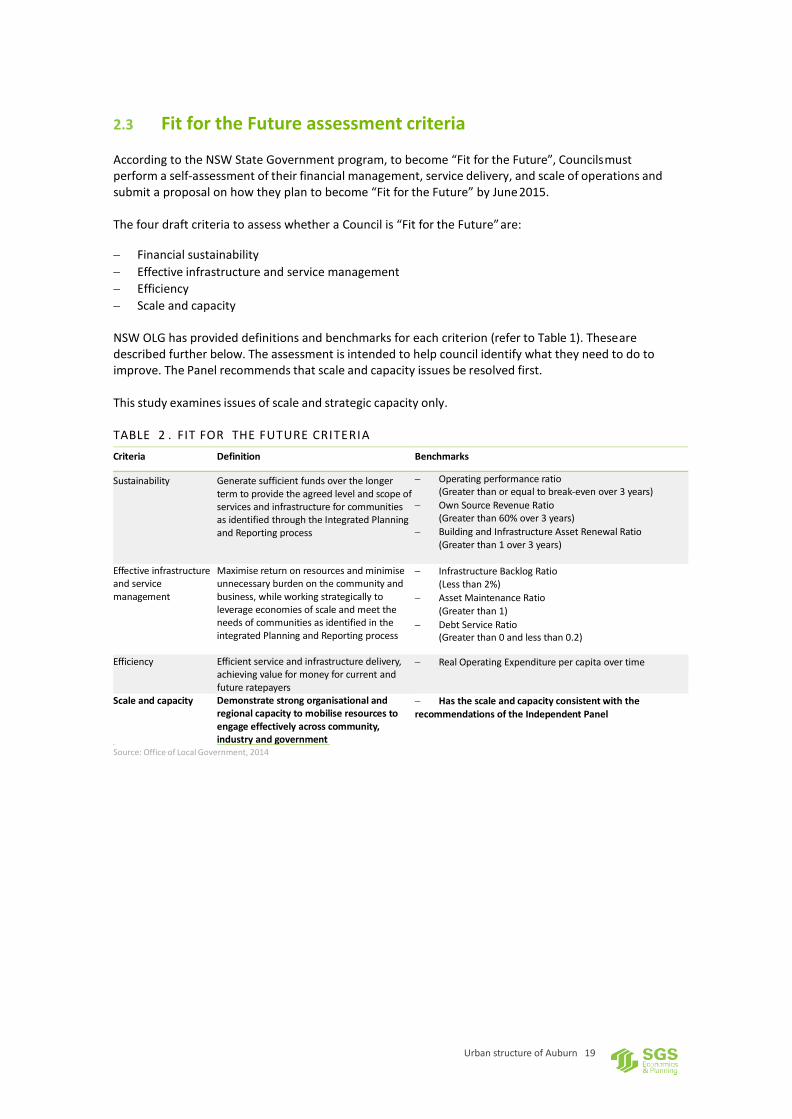
NSW OLG has provided definitions and benchmarks for each criterion (refer to Table 1). These are described further below. The assessment is intended to help council identify what they need to do to improve. The Panel recommends that scale and capacity issues be resolved first.
This study examines issues of scale and strategic capacity only.
TABLE 2 . FIT FOR THE FUTURE CRITERIA
Source: Office of Local Government, 2014
Criteria Definition Benchmarks
Sustainability Generate sufficient funds over the longer term to provide the agreed level and scope of services and infrastructure for communities as identified through the Integrated Planning and Reporting process
− Operating performance ratio (Greater than or equal to break-even over 3 years)
− Own Source Revenue Ratio (Greater than 60% over 3 years)
− Building and Infrastructure Asset Renewal Ratio (Greater than 1 over 3 years)
Effective infrastructure and service management
Maximise return on resources and minimise unnecessary burden on the community and business, while working strategically to leverage economies of scale and meet the needs of communities as identified in the integrated Planning and Reporting process
− Infrastructure Backlog Ratio (Less than 2%)
− Asset Maintenance Ratio (Greater than 1)
− Debt Service Ratio (Greater than 0 and less than 0.2)
Efficiency Efficient service and infrastructure delivery, achieving value for money for current and future ratepayers
− Real Operating Expenditure per capita over time
Scale and capacity
Demonstrate strong organisational and regional capacity to mobilise resources to engage effectively across community, industr y and gove rnme nt
− Has the scale and capacity consistent with the recommendations of the Independent Panel

Urban structure of Auburn 20
3 OPTIONS
The following chapter provides detail on the options assessed in this report.
Council advised SGS that they wished to explore an augmented version of the ILGRP recommendation of Auburn, Parramatta, and Holroyd.
It is the view of Council that the options tested in this study better reflect the economic and social linkages that Auburn share with its neighbouring LGAs. This report provides an opportunity to test the socio-economic links of these options and ascertain the value of a merger between either Parramatta and Auburn or Auburn and its neighbouring councils to the east.
3.1 Options in detail
The following options are tested from a strategic-capacity perspective, in line with the Fit for the Future assessment criteria:
− Base case: Auburn stands alone − Option 1 Panel’s augmented option: Parramatta and Auburn − Option 2 Alternative option: Auburn, Burwood, Canada Bay and Strathfield
The projected population and employment estimates for each merger option is discussed below.
Though there is no explicit reference to an optimal population size in the ILGRP report (2013), of the recommended amalgamation options, the maximum population is 558,000 at 2031 (Parramatta option). Though a special case, it is worth noting that the Sydney LGA option has a forecast population of 669,000 at 20311.
1 NSW ILGRP, Revitalising Local Government, 2013; page 104, table 8.

Urban structure of Auburn 21
Base case: Auburn stand-alone Strong population and employment growth is projected for the current Auburn LGA (Figure 7). This option has the highest rate of population growth and an equal rate of employment growth with Option 1 (Table 2).
FIGURE 10 . BASE CASE
Source: SGS, 2014
TABLE 3 . BASE CASE – POPULATION AND EMPLOYMENT
Base case 2011 2031 Growth AAGR Population 77,800 130,600 52,800 2.62% Employment 58,157 77,513 19,356 1.45%
Source: DP&E and BTS, 2014
Urban structure of Auburn 22
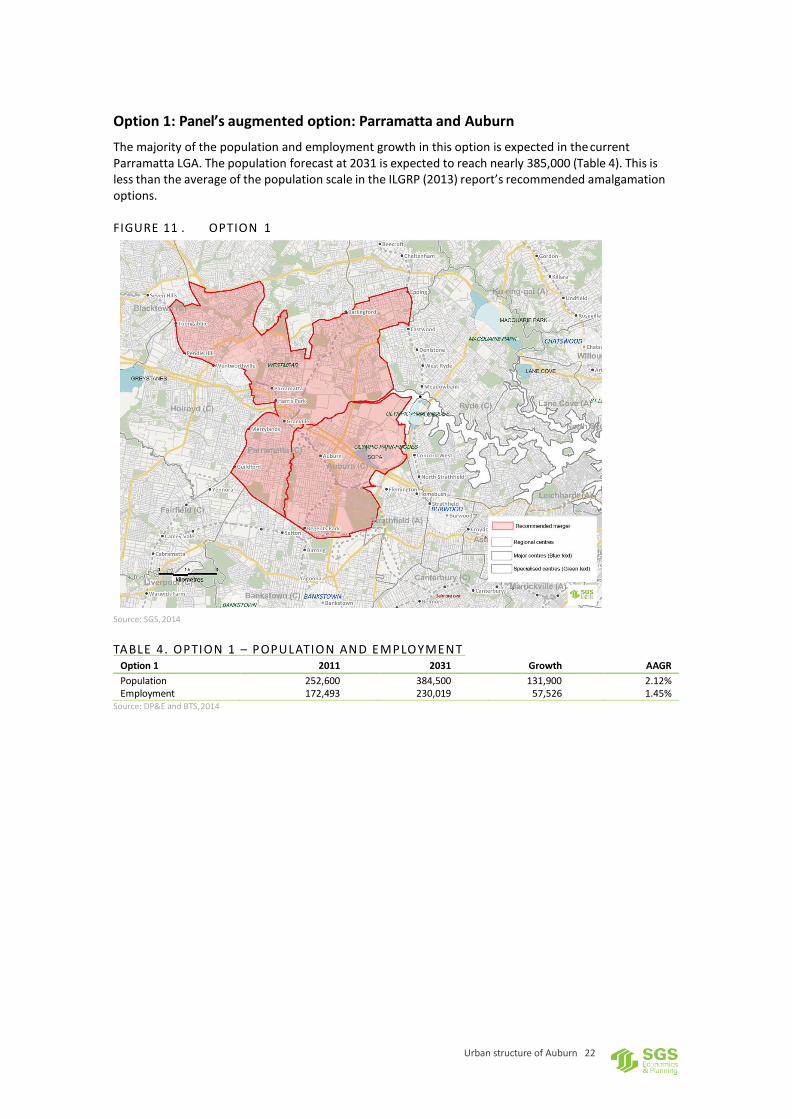
Option 1: Panel’s augmented option: Parramatta and Auburn The majority of the population and employment growth in this option is expected in the current Parramatta LGA. The population forecast at 2031 is expected to reach nearly 385,000 (Table 4). This is less than the average of the population scale in the ILGRP (2013) report’s recommended amalgamation options.
FIGURE 11 . OPTION 1
Source: SGS, 2014
T A B L E 4 . O P T I O N 1 – P O P U L A T I O N A N D E M P L O Y M E N T
Source: DP&E and BTS, 2014
Option 1 2011 2031 Growth AAGR Population 252,600 384,500 131,900 2.12% Employment 172,493 230,019 57,526 1.45%
Urban structure of Auburn 23
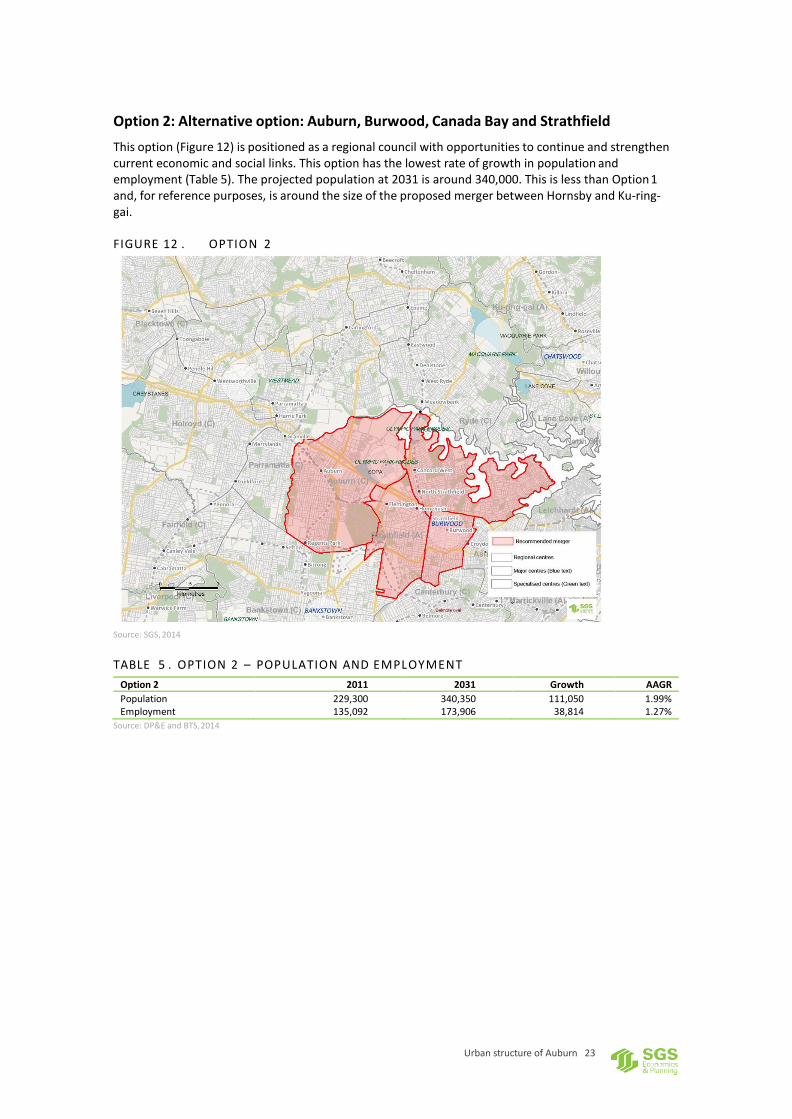
Option 2: Alternative option: Auburn, Burwood, Canada Bay and Strathfield This option (Figure 12) is positioned as a regional council with opportunities to continue and strengthen current economic and social links. This option has the lowest rate of growth in population and employment (Table 5). The projected population at 2031 is around 340,000. This is less than Option 1 and, for reference purposes, is around the size of the proposed merger between Hornsby and Ku-ring- gai.
FIGURE 12 . OPTION 2
Source: SGS, 2014
TABLE 5 . OPTION 2 – POPULATION AND EMPLOYMENT
Option 2 2011 2031 Growth AAGR Population 229,300 340,350 111,050 1.99% Employment 135,092 173,906 38,814 1.27%
Source: DP&E and BTS, 2014

Urban structure of Auburn 24
4 URBAN STRUCTURE AND ECONOMIC GEOGRAPHY
This chapter provides a strategic analysis of Sydney’s changing economic geography and urban planning trends at a metropolitan context, and relates these trends to Auburn.
The OLG argues that scale is a key component of strategic capacity – both in creating individual councils with the resources and skills to provide leadership on regional planning issues and, to advocate on behalf of communities by creating a system of local government where State and Local Government partner effectively. They also suggest that scale and capacity issues be resolved first, before the other criteria are addressed.
According to the OLG, a council with appropriate scale and capacity can:
− save money on bureaucracy and administration, freeing up funds for front line services and
community facilities − contribute to projects and tackle issues that impact on its residents and extend beyond the council
boundary, and − have credibility and influence across different levels of government, and industry.
Though there is no explicit reference to an optimal population size in the ILGRP report (2013), of the recommended amalgamation options, the maximum population is 558,000 at 2031 (Parramatta option). Though a special case, it is worth noting that the Sydney LGA option has a forecast population of 669,000 at 20312.
The assessment of strategic ‘choices’ in this chapter relates to the scale and capacity criteria in the Fit for the Future program and show the considerations that may be relevant to the merger options. The strategic analysis uses economic geography to assess strong organisational and regional capacity. The functional relationships underlying the economic geography of Auburn and its surrounds are discussed in the next chapter.
2 NSW ILGRP, Revitalising Local Government, 2013; page 104, table 8.

Urban structure of Auburn 25
4.1 The metropolitan planning and growth context
Strategy context The 2005 Metropolitan Strategy subtitled ‘A City of Cities’, was based on the promotion of a polycentric or multi-centred city. The idea was that each major subregion in the metropolitan area would achieve greater self-containment – with more jobs, retail, leisure and daily activities being satisfied locally or within the subregion - meaning reduced travel costs and less stress from travel. A broad aim was to increase the share of the population able to get access to services and jobs within a drive of 30 minutes to one hour per day.
There was an emphasis on three strong regional cities in western Sydney ‘serving’ their own subregions – with Liverpool in the south west, Penrith in the outer west and linking to the north west and Parramatta at the heart of a west central subregion but also taking a pre-eminent role in western Sydney as a whole. Figure 13 is the map from the 2005 Strategy which illustrates this concept.
FIGURE 13 . CITY OF CITIES CONCE PT, 2005 METROPOLITAN STRATEGY
Source: Department of Planning 2005

Urban structure of Auburn 26
The new 2014 metropolitan plan for Sydney (‘A Plan for Growing Sydney’) adds Campbelltown- Macarthur as a ‘regional city centre’, along with Penrith and Liverpool (which carry over from the previous strategies) but gives greater prominence to Parramatta as metropolitan Sydney’s ‘second CBD’. One of the key maps is shown in Figure 14.
While the conception of the metropolitan region as a City of Cities is no longer explicit the strategy map certainly indicates a ‘bi-centred’ city at the very least with central Sydney and Parramatta at the heart of their regions. Outer western Sydney’s future status and role is less clear in this particular graphic though the three regional city centres, 2nd Sydney airport, Broader Western Sydney Employment Area and proposed transport corridors at least provide a framework for future growth.
The continued designation of Sydney Olympic Park and Rhodes as strategic centres in the corridor between Parramatta and Sydney should also be noted. Burwood is also a strategic centre in this corridor.
FIGURE 14 . A PLAN FOR GROWING SYDNEY – CONNECTING JOBS AND HOMES, MAP
Source: Department of Planning and Infrastructure 2014

Urban structure of Auburn 27
The second CBD is reconceived as ‘Greater Parramatta’ to include surrounding precincts such as Westmead, Camellia and Rydalmere (Figure 15). This geographic definition of Greater Parramatta is contained within the existing boundaries of the Parramatta local government area, except for ‘Auto Alley’ (south Church Street) which is in Holroyd LGA.
Planning for this area would ideally include Holroyd but is not necessarily made any stronger by the inclusion of Auburn. The state could be much more interventionist with economic development initiatives, directed investment and greater thinking around planning controls to achieve the objectives.
FIGURE 15 . GREATER PARRAMATTA
Source: Department of Planning and Infrastructure 2014

Urban structure of Auburn 28
The Plan for Growing Sydney also highlights the Greater Parramatta to Olympic Park peninsula as a new growth area (Figure 16). This extends from Westmead in the west through Parramatta, Camellia, Silverwater, Sydney Olympic Park and Rhodes in the east.
This development corridor covers the three local government areas of Parramatta, Holroyd, Auburn and Canada Bay.
FIGURE 16 . GREATER PARRAMATTA TO OLYMPIC PENINSULA GROWTH AREA
Source: Department of Planning and Infrastructure 2014
It could be argued that all of this corridor should be in one area which would involve a merger of Auburn at least with Parramatta. However, one council might not plan effectively for this area – it might be that advocacy for Parramatta ends up being greater than SOP for example. A strong planning framework established by the State Government – including, for example, a partnership approach between Councils with a role for land owners, may be more effective.

Urban structure of Auburn 29
The new metropolitan strategy includes six subregions proposed as the focus for subregional planning, as shown in Figure 17. Auburn LGA is included in the West Central subregion with Parramatta, Holroyd, Blacktown, Bankstown and the Hills. Of note here is the long western limb of the Central subregion containing Burwood, Strathfield and Canada Bay.
FIGURE 17 . SYDNEY’ S SUBREGIONS
Source: Department of Planning and Infrastructure 2014

Urban structure of Auburn 30
Growth prospects The new Plan for Growing Sydney does not identify employment targets for strategic centres. However, the 2013 Draft Strategy identified targets for the strategic centres of Parramatta and SOP/Rhodes (Table 6). This shows a 70,000 employment target for Parramatta and a 35,000 target for the combined SOP/Rhodes (which, to provide an indication, is similar to the current size of St Leonards and Crows Nest including the RNS hospital).
TABLE 6 . EMPLOYMENT TARGETS FOR SELECTED STRATEGIC CENTRES FROM DRAFT
METROPOLITAN STRATEGY TO 2031
Parramatta Sydney Olympic
Park
Rhodes
TOTAL SOP/Rhodes
TOTAL Parra/SOP/
Rhodes 2011 49,000 7,000 12,000 19,000 68,000 2031 70,000 21,000 14,000 35,000 105,000 Change 11-31 21,000 14,000 2,000 16,000 37,000 Source: Department of Planning and Infrastructure, 2013 Draft Metropolitan Strategy
Given the potential of the Parramatta to Rhodes corridor, and the designation of it as a growth area in the new Plan, these figures appear conservative, and also don’t provide an indication of the extent of growth in the wider corridor. Using the Bureau of Transport Statistics forecasts as a base (Table 7) shows a possible alternative forecast which puts the Sydney Olympic Park centre and immediate precinct in the growth context of the corridor as a whole. SGS’s estimate is that in the immediate SOP precinct employment could increase by 22,000 to about 37,000 while population could grow by an additional 26,500 to about 35,000 by 2031. In the wider corridor between Westmead and Rhodes there is potential for more than 150,000 additional people and almost 80,000 jobs by 2031. By 2031 a ‘city’ the same size as Canberra, but with many more jobs, could be achieved in this corridor.
TABLE 7 . ALTERNATIVE PROJECTIONS FOR SOP PRECINCT AND GREATER PARRAMAT TA
TO OLYMPIC PENINSULA CORRIDOR 2011 - 2031
SOP precinct Corridor Year 2011 2031 2011 2031 Population 9,190 35,638 263,658 418,743 Employment 14,739 37,138 217,140 294,989 Source: SGS Economics and Planning
The respective roles of Parramatta as a major hub for western Sydney and of SOP and Rhodes for the west central area need to be thought through, including appropriate governance arrangements. While there is an argument for a single local authority to ensure effective integrated governance in the dual centred corridor, an alternative view is that the prospects of both centres will be enhanced if they are administered by separate local governments. This latter perspective implies that it will be too difficult for a single authority to effectively promote the interests of both centres, nor service both effectively.

Urban structure of Auburn 31
4.2 Auburn’s economic profile in context
Australia’s economy has transitioned from one built on manufacturing to one predominately supplying services. Economic advantage is now generally achieved through demonstrating a genuine comparative advantage, and specialising in activities higher up the value chain, such as in advanced business services in the finance and insurance, as well as professional, scientific and technical service industries, though also in advanced manufacturing. The growing significance of these service industries and the relative decline of traditional manufacturing in Sydney as a whole is evident in Figure 18.
FIGURE 18 . INDUSTRY INCOME SHAR E OF SYDNEY’ S GDP FO R SELECTED SECTORS
Source: SGS Economics & Planning
Auburn LGA is in some ways an archetypal area where these forces are playing out. The old industrial base of the area focussed on Silverwater and industrial areas along Parramatta Road, and formerly at Homebush prior to its redevelopment for the Olympic Games, is transitioning to a service focussed economy. This is strongly represented by new higher order office development at Sydney Olympic Park but also evident in the changing nature of economic activity in the older industrial areas and in strong population related jobs growth in bulky goods retailing, health and services in the lively town centres of Lidcombe and Auburn.
Figure 19 shows this quite starkly. In 2001 well over 20 percent of the Auburn LGA’s employment was in manufacturing and the employment profile overall in key sectors was highly divergent from the immediate ‘region’ (defined by Auburn, Parramatta, Canada Bay, Burwood and Strathfield). For example only two percent of Auburn LGA’s employment was in financial and insurance services compared to about seven percent in the ‘region’. By 2011 manufacturing had shrunk to just over 15 percent of Auburn’s employment but other service sectors had grown strongly and the employment profile of the LGA, though still dominated by manufacturing, was much closer to that of the ‘region’ as a whole with a ‘balance’ of employment across key sectors.

Urban structure of Auburn 32
FIGURE 19 . EMPLOYMENT SHARE IN SELECTED AREAS AND SECTORS, 2001 & 2011
Source: SGS Economics & Planning
A recent draft Employment Lands Study for Auburn Council3 makes the following points about economic prospects for the LGA.
The central position of Auburn within metropolitan Sydney makes it an excellent proposition from a service perspective, this and good quality stock of employment floorspace provides it with a strong foundation for renewal to accommodate future employment growth.
…Auburn LGA has an existing specialisation across a range of sectors including manufacturing, wholesale trade and transport postal and warehousing as well as more business and service based industries such as finance and insurance, electricity, gas, water and waste services and information media and telecommunications.
…The diversity of the local manufacturing sector and the high-value add nature of these industries suggest that manufacturing is beneficial to the local LGA.
…while manufacturing is a low growth area, it is nevertheless an opportunity for Auburn given that it is already highly represented by this industry. This sector is further supported by the wholesale trade and transport, postal and warehousing sectors.
…more knowledge-based, high technology and specialised industries will seek to leverage knowledge and labour by locating in a central metropolitan location.
In recent years there has been an acceleration of the centralisation of professional and business services jobs in metropolitan Sydney, where ‘agglomeration’ economies are in evidence. Highly connected inner Sydney areas have benefitted but areas such as the Auburn LGA which are geographically central to the metropolitan area are also benefitting. Connections to growing employment centres such as Parramatta, Macquarie Park, Sydney Olympic Park (in the Auburn LGA) and inner Sydney are increasing, as the resident professional workforce increases. In fact as Figure 20 shows, for Auburn’s resident
3 AEC Group/AECOM (2014), Auburn Employment Lands Strategy Draft, Auburn City Council, October
25%
20% 'Region' includes LGAs of Auburn, Parramatta, Strathfield, Canada Bay, Burwood and Strathfield
15%
10%
5%
0% Auburn 2001
Manufacturing
'Region 2001' Auburn 2011
Retail Trade
'Region 2011'
Financial and Insurance Services Professional, Scientific and Technical Services
Health Care and Social Assistance

Urban structure of Auburn 33
workforce job destinations within Auburn, Canada Bay (principally Rhodes), Ryde (principally Macquarie Park) and the so-called ‘Global Economic Corridor’ (including Chatswood, St Leonards, North Sydney, the City of Sydney, UNSW and the airport and port), are becoming increasingly important. Connections east and north have grown at a much faster rate than connections to Parramatta or to the rest of Sydney (even though these remain important destinations).
FIGURE 20 . JOB DESTINATIONS FOR AUBURN RESIDENT WORKERS, 2001 , 2006 &
2011
Source: SGS Economics & Planning, using ABS data (2001 – 2011)
10,000 180%
9,000 156% 160%
8,000 140%
7,000 121% 120%
6,000 100%
5,000 80%
4,000 76%
60% 60% 3,000 53% 56%
2,000 40%
1,000 23% 20%
- 0% Auburn Parramatta Canada Bay Rest of inner Ryde Rest of Global Rest of Sydney
west Economic Corridor
2001 2006 2011 % change 2001-11
Num
ber o
f Job
Des
tinat
ions

Urban structure of Auburn 34
4.3 Sydney’s emerging economic geography
The geography of disadvantage The index of socio-economic advantage, mapped for Sydney based on the 2011 census, highlights the geographic socio-economic divide in Sydney, with higher relative advantage in harbour-side, beachside and north shore areas and relative disadvantage concentrated in south west Sydney around Fairfield and Liverpool and in the western corridor from Blacktown to Penrith (see Figure 21). Auburn sits on the edge of these two distinctive areas.
FIGURE 21 . SEIFA INDEX 2011
Source: SGS Economics & Planning, original data from ABS Census 2011.
Urban structure of Auburn 35
Accessibility to jobs and agglomeration economies The density and accessibility of jobs in central Sydney feeds ‘agglomeration economies’ and is at the heart of patterns and trends related to socio-economic advantage and disadvantage.
Agglomeration is a term used in spatial economics to describe the benefits which flow to firms from locating in areas which have a higher density of economic activity. These benefits, while experienced by all firms and residents, are particularly beneficial to knowledge intensive service based sectors (i.e. those higher up the global value chain). Knowledge intensive jobs have, and are projected to represent an increasing share of the economy in the future. Furthermore, these knowledge intensive service sectors are leading productivity gains in the Australian economy.
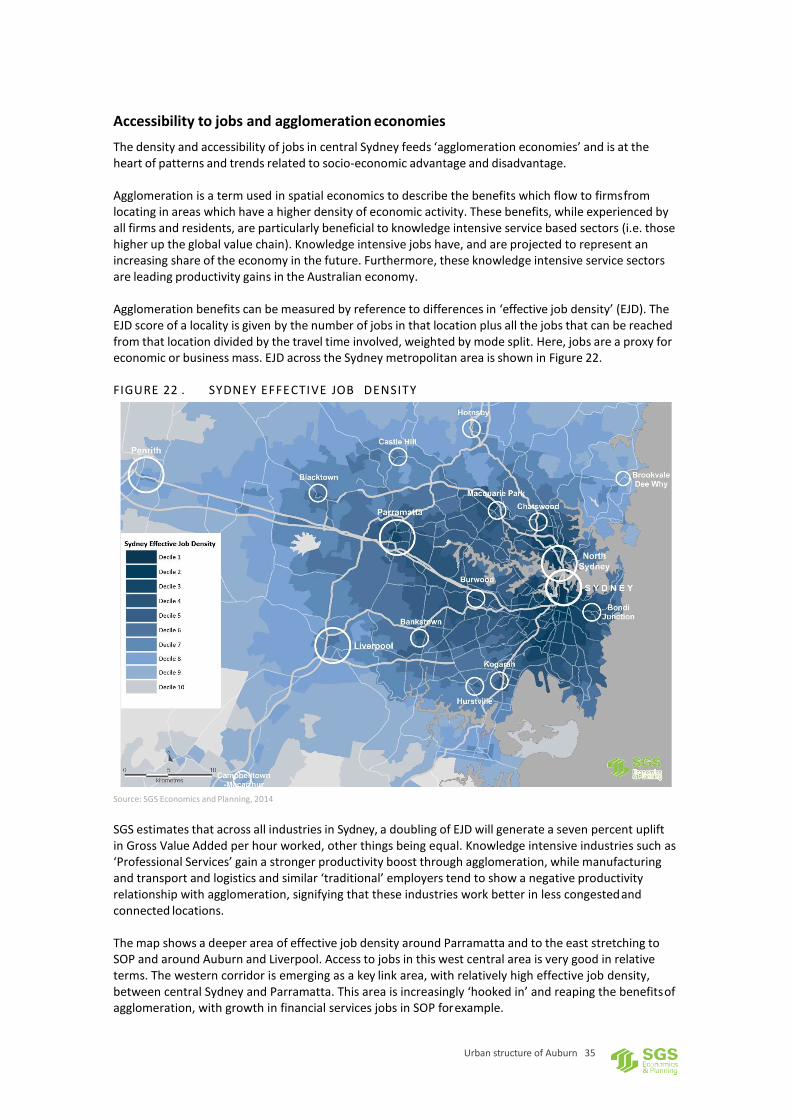
Agglomeration benefits can be measured by reference to differences in ‘effective job density’ (EJD). The EJD score of a locality is given by the number of jobs in that location plus all the jobs that can be reached from that location divided by the travel time involved, weighted by mode split. Here, jobs are a proxy for economic or business mass. EJD across the Sydney metropolitan area is shown in Figure 22.
FIGURE 22 . SYDNEY EFFECTIVE JOB DENSITY
Source: SGS Economics and Planning, 2014
SGS estimates that across all industries in Sydney, a doubling of EJD will generate a seven percent uplift in Gross Value Added per hour worked, other things being equal. Knowledge intensive industries such as ‘Professional Services’ gain a stronger productivity boost through agglomeration, while manufacturing and transport and logistics and similar ‘traditional’ employers tend to show a negative productivity relationship with agglomeration, signifying that these industries work better in less congested and connected locations.
The map shows a deeper area of effective job density around Parramatta and to the east stretching to SOP and around Auburn and Liverpool. Access to jobs in this west central area is very good in relative terms. The western corridor is emerging as a key link area, with relatively high effective job density, between central Sydney and Parramatta. This area is increasingly ‘hooked in’ and reaping the benefits of agglomeration, with growth in financial services jobs in SOP for example.
Urban structure of Auburn 36
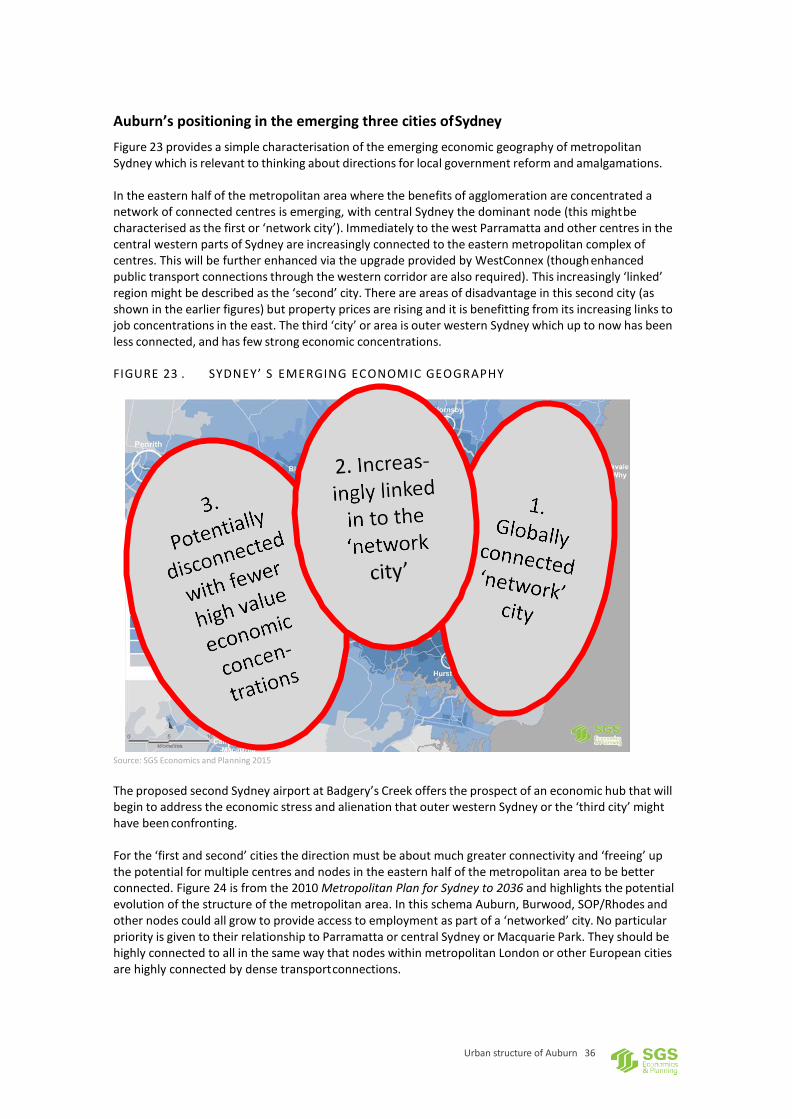
Auburn’s positioning in the emerging three cities of Sydney Figure 23 provides a simple characterisation of the emerging economic geography of metropolitan Sydney which is relevant to thinking about directions for local government reform and amalgamations.
In the eastern half of the metropolitan area where the benefits of agglomeration are concentrated a network of connected centres is emerging, with central Sydney the dominant node (this might be characterised as the first or ‘network city’). Immediately to the west Parramatta and other centres in the central western parts of Sydney are increasingly connected to the eastern metropolitan complex of centres. This will be further enhanced via the upgrade provided by WestConnex (though enhanced public transport connections through the western corridor are also required). This increasingly ‘linked’ region might be described as the ‘second’ city. There are areas of disadvantage in this second city (as shown in the earlier figures) but property prices are rising and it is benefitting from its increasing links to job concentrations in the east. The third ‘city’ or area is outer western Sydney which up to now has been less connected, and has few strong economic concentrations.
FIGURE 23 . SYDNEY’ S EMERGING ECONOMIC GEOGRAPHY
Source: SGS Economics and Planning 2015
The proposed second Sydney airport at Badgery’s Creek offers the prospect of an economic hub that will begin to address the economic stress and alienation that outer western Sydney or the ‘third city’ might have been confronting.
For the ‘first and second’ cities the direction must be about much greater connectivity and ‘freeing’ up the potential for multiple centres and nodes in the eastern half of the metropolitan area to be better connected. Figure 24 is from the 2010 Metropolitan Plan for Sydney to 2036 and highlights the potential evolution of the structure of the metropolitan area. In this schema Auburn, Burwood, SOP/Rhodes and other nodes could all grow to provide access to employment as part of a ‘networked’ city. No particular priority is given to their relationship to Parramatta or central Sydney or Macquarie Park. They should be highly connected to all in the same way that nodes within metropolitan London or other European cities are highly connected by dense transport connections.

Urban structure of Auburn 37
FIGURE 24 . NETWORK CITY FUTURE
Source: NSW Government 2010 Metropolitan Strategy for Sydney to 2036

Urban structure of Auburn 38
4.4 Summary and implications for local government boundary reform
Given the above analysis Figure 25 shows the strategic ‘choices’ that might be relevant to decisions about local government boundary reform for Auburn given the options being assessed.
FIGURE 25 . POTENTIAL STRATEGIC CHOICES
Source: SGS Economics and Planning 2015
Base Case: Auburn stands alone
Focus on growing SOP as major node linked both east and west Builds on strong role at the ‘crossroads’ of metropolitan Sydney. SOP and surrounding precinct to grow strongly as a major node ‘in its own right’ – which will be a major management and infrastructure servicing task in any case. But ‘misses’ the opportunity to develop a linked centre with Rhodes.
Option 1 Auburn and Parramatta
Focus on growing as part of Greater Parramatta Reinforces the idea of a Greater Parramatta with a large hinterland which includes Auburn. Doesn’t sufficiently recognise the rapidly growing links which Auburn LGA has to the north and east. Splits prospect of integrated SOP/Rhodes and raises possibility that SOP/Rhodes won’t get sufficient attention because of the inevitable focus on Parramatta. Option 2 Auburn, Canada Bay, Strathfield, Burwood
Develop additional strong node at SOP/Rhodes as part of ‘network’ city Provides for maximum focus on growing SOP/Rhodes as a major economic node within the networked eastern metropolitan area. Builds on strengthening connections between Auburn LGA and eastern areas. May dilute prospects for truly integrated planning for Greater Parramatta to Olympic Peninsula corridor.

Urban structure of Auburn 39
5 FUNCTIONAL REGIONS ANALYSIS
The Independent Local Government Review Panel (2013) suggested a number of criteria that would allow council boundary changes to be more outcome focused (Figure 26).
FIGURE 26 . ILGRP CONSIDERATIONS FOR BOUNDARIES 2013
Sustainability and Strategic Capacity Councils need a strong base to ensure their long-term sustainability; to achieve economies of scale and scope; to deliver quality services; to provide a pool of talented councillor candidates; to attract skilled staff; and to develop strategic capacity in governance, advocacy, planning, and management.
Efficiency and Effectiveness Councils should be able to operate efficiently and effectively within the limits imposed by their location, geography and the characteristics of the communities they serve. They should be able to provide ‘value for money’ to their ratepayers and external funding agencies.
Integrated Planning LGA boundaries should not unnecessarily divide areas with strong economic and social inter-relationships; they should facilitate integrated planning, coordinated service delivery, and regional development.
Local Identity and Sense of Place Consistent with the need for integrated planning, boundaries should reflect a sense of identity and place, including important historical and traditional values. (However, other mechanisms available to maintain local identity should be taken into account.)
Population Growth The boundaries of a local government area (LGA) should be able to accommodate projected population growth generated by the LGA over at least the next 25 years.
Accessibility As a general rule, it should be possible to drive to the boundaries of a LGA from a main administration centre within 60-90 minutes in country areas, and within 30 to 45 minutes in metropolitan areas.
Strong Centre Each LGA should have a substantial population centre that can provide higher order commercial, administrative, education, health and other services.
Key Infrastructure As far as possible, key transport infrastructure such as airports and ports, and those nearby urban and regional centres that are principal destination points, should be within the same LGA.
Combining Existing Municipalities Wherever practicable, amalgamations should combine the whole of two or more existing LGAs without the additional cost and disruption of associated boundary adjustments.
Source: Final Report of the NSW Independent Local Government Review Panel October 2013

Urban structure of Auburn 40
5.1 Spatial analysis of functional linkages
In response to the ILGRP criteria, a number of spatial linkages are examined (local and metro wide) to assess the three options for Auburn. A summary of the spatial analysis of housing sub-markets, journey to work patterns and labour markets, accessibility, retail expenditure and communities of interest are described and mapped in the following sections.
It should be noted that the analysis of these dimensions is a spatial interpretation of the ILGRP’s scale and strategic capacity criterion, and assists in the understanding of how the region functions. This has implications for the Fit for the Future program since the organisation of administrative boundaries along the lines of functional regions is likely to enhance the strategic capacity of a future organisation.
Housing sub-markets
Housing submarkets is one of the keys to good integrated planning. An understanding of spatially clustered housing markets enables government to plan for the needs of residents. This analysis looked at people who moved their place of residence between the 2006 to 2011 Census period and identifies housing sub-markets inherent within the metropolitan region. An algorithm is used (similar to functional labour markets) by incrementally grouping Statistical Area 2 geographies to form the most self-contained market possible.
Auburn’s functional linkages with its surrounding LGAs in terms of housing migration (Figure 27) reveals a strong link with Strathfield. There are also strong links to the other two adjacent LGAs of Parramatta and Bankstown.
FIGURE 27 . AUBURN’ S FUNCTIONAL REGION INDEX ( HOUSIN G MIGRATION)
Source: SGS Economics and Planning 2015

Urban structure of Auburn 41
Journey to work travel patterns and functional labour markets
Functional labour markets are defined using an algorithm which incrementally groups together Statistical Area 2 geographies to form the most self-contained labour market possible. The result is not determined by political boundaries but rather functional economies reflecting where people live and work. A merged council encompassing a functional labour market is able to advance as a strong centre for employment and has capacity to provide higher order services.
Journey to Work (JTW) data were derived from the five-yearly Census of Population and Housing and shows where people live and work (trip origins and destinations) by BTS travel zone geographies. The findings from this analysis models functional labour markets and are useful to understand communities of interest.
The analysis reveals Auburn’s functional linkages with its surrounding LGAs in terms of work trips. Strathfield and Bankstown have the strongest connections to Auburn in journey works trips – both to and from these LGAs, followed by Parramatta and Canada Bay (Figure 28).
FIGURE 28 . AUBURN’ S FUNCTIONA L REGION INDEX - JOURNEY TO WORK
Source: SGS Economics and Planning 2015
Accessibility – travel time by car and public transport
Travel time mapping was illustrates the relationship between centres and major employment areas and access from the surrounding areas to centres. This was completed for both car and public transport travel times.
Auburn’s functional linkages with its surrounding LGAs in terms of car travel show strong links with Parramatta, Bankstown, Strathfield, Burwood and Canada Bay. These LGAs are all well connected to and from Auburn by private transport in relation to its broad accessibility.

Urban structure of Auburn 42
FIGURE 29 . AUBURN’ S FUNCTIONAL REGION INDEX ( CAR TR AVEL)
Source: SGS Economics and Planning 2015
When accessibility is assessed by public transport, the pattern changes. Holroyd, Strathfield and Burwood reveal strong connections to and from Auburn through public transport access in relation to its broad accessibility. This is largely driven by the accessibility provided by the T2 inner west rail corridor providing Holroyd LGA with greater connectivity to Auburn than Parramatta LGA.
FIGURE 30 . AUBURN’ S FUNCTIONAL REGION INDEX ( PUBLIC TRANSPORT TRAVEL)
Source: SGS Economics and Planning 2015

Urban structure of Auburn 43
Retail expenditure patterns
The current retail environment in Auburn was simulated using a Gravity Model that looks at where people live and what people spend their money on. Using an attracting and detracting force model, the simulated retail environment then specifies the market share of each retail centre (that is, how much of the resident retail expenditure in each BTS Travel Zone is spent at each centre), which is then used to draw the retail catchment of Auburn.
The travel time mapping is an indicator of the potential service catchments and the accessibility of centres, which assists in developing an understanding of functional regions. The ILGRP (2012) suggested that in the metropolitan area a travel time of 30-45 minutes from the administrative centre of an LGA was a suitable scale to consider for ‘local’ government.
The map below shows Auburn’s functional linkages with its surrounding LGAs in terms of shopping trips. Parramatta and Strathfield exhibit strong connections to Auburn for shopping trips – both to and from these LGAs. In particular, this shows that retail expenditure links between Parramatta are Auburn are strong, given the regional role played by Parramatta.
FIGURE 31 . AUBURN’ S FUNCTIONAL REGION INDEX ( SHOPPING TRIPS)
Source: SGS Economics and Planning 2015

Urban structure of Auburn 44
Household Travel Survey – Communities of Interest
Apart from factors considered in functional regions relating to housing and employment, Councils are responsible for developing a shared vision and plan, understanding the diversity of its community and ensuring equitable distribution of services across the area through the study of communities of interest. This analysis examined the relationship between where people live and do their shopping and other local activities (education and social trips). The data was sourced from Sydney Household Travel survey, conducted by the Bureau of Transport Statistics. This aggregation method was applied to determine the non-work travel patterns of residents living in these LGAs, which are otherwise not indicated in the Journey to Work analysis.
Auburn’s functional linkages with its surrounding LGAs in terms of social and educational trips shows Strathfield as having strong connections to Auburn for social and education trips – both to and from these LGAs. This shows strong links directly to the East (Figure 32). The next strongest relationships are south to Bankstown, east to Canada Bay and west to Holroyd.
FIGURE 32 . AUBURN’ S FUNCTIONAL REGION INDEX ( SOCIAL AND EDUCATION
TRIPS)
Source: SGS Economics and Planning 2015

Urban structure of Auburn 45
5.2 Functional region composite index
Connectivity is calculated by analysing the origin-destination patterns of applicable functional linkages within a quantitative framework. That is, origin destination data from the spatial analysis is used to generate an index value to represent the extent to which each LGA is connected to Auburn. The composite index –as suggested by the name; is an un-weighted aggregation of the index scores. The aim of this index is to quantitatively measure the functional connectivity of each merger option being considered in this study.
Using relevant aspects of the multi-dimension spatial analysis of functional regions, SGS derived a functional region composite index to measure Auburn’s functional connectivity with other LGAs by exploring its functional links under each option. The composite index examines each LGA’s connectivity to other LGAs in the options considered, by taking into account the connectivity of a region not only for economic purposes, but also for social, recreational and civic purposes. The results of these calculations are show in Table 7.
Technical description
The composite index operates by analysing the origin-destination patterns of six factors: housing markets, labour markets, accessibility (public and private transport), retail expenditure, and communities of interest. These are spatial representations of the ILGRP boundary considerations. The goal of this index is to describe the extent to which one region is connected to another, by analysing people movements (and travel time) between, and within LGAs. The final index score, which incorporates six attributes related to functional regions, can then be used to provide an unbiased ranking of the options, in terms of functionality.
The sections below outline the necessary steps for calculating the composite index:
Step 1: Strength of interaction (F) score
The following equation is used to calculate the strength of interaction between two geographic units
F = Tij / (Oi × Dj) + Tji / (Oj × Di)
Where;
Tij = the interaction between origin location i and destination location j Oi = Σj Tij sum of all trips originating from originating location i Dj = Σi Tij sum of all trips arriving at destination location j
The goal is to measure how well two locations interact with one another, in relation to their overall incoming and outgoing flows. A higher strength of interact (F) value indicates stronger interaction between two or more geographic units, and vice versa.
It should be noted that the strength of interaction (F) score accounts for the interaction between a host unit (Auburn as the centre) and its anchored units for each merger option. The intra-zone interactions between non-host units (LGAs that are not Auburn) are not taken into account in this calculation. For options with more than two Councils, LGAs other than Auburn are aggregated and treated as one unit, and their collective interaction with Auburn is assessed.
Step 2: Composite index
The derived F value for each merger option is then used to produce a score in sequential order. The option with the highest F value would be awarded the highest rank-score. This rank-score procedure is applied to the six factors: housing markets, labour markets, accessibility, retail expenditure, and communities of interest, and summed to produce an overall composite index for each option.
Urban structure of Auburn 46
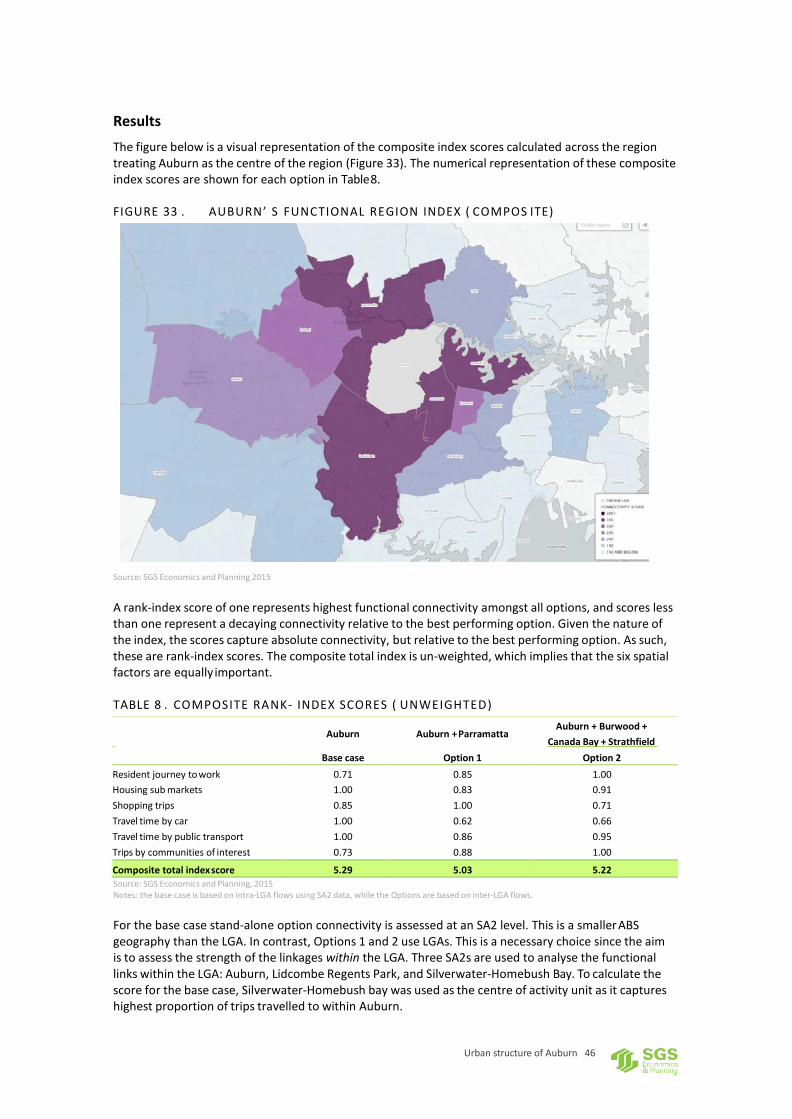
Results The figure below is a visual representation of the composite index scores calculated across the region treating Auburn as the centre of the region (Figure 33). The numerical representation of these composite index scores are shown for each option in Table 8.
FIGURE 33 . AUBURN’ S FUNCTIONAL REGION INDEX ( COMPOS ITE)
Source: SGS Economics and Planning 2015
A rank-index score of one represents highest functional connectivity amongst all options, and scores less than one represent a decaying connectivity relative to the best performing option. Given the nature of the index, the scores capture absolute connectivity, but relative to the best performing option. As such, these are rank-index scores. The composite total index is un-weighted, which implies that the six spatial factors are equally important.
TABLE 8 . COMPOSITE RANK- INDEX SCORES ( UNWEIGHTED)
Auburn
Auburn + Parramatta
Auburn + Burwood + Canada B ay + Strathfie ld
Base case Option 1 Option 2 Resident journey to work 0.71 0.85 1.00 Housing sub markets 1.00 0.83 0.91 Shopping trips 0.85 1.00 0.71 Travel time by car 1.00 0.62 0.66 Travel time by public transport 1.00 0.86 0.95 Trips by communities of interest 0.73 0.88 1.00
Composite total index score 5.29 5.03 5.22 Source: SGS Economics and Planning, 2015 Notes: the base case is based on intra-LGA flows using SA2 data, while the Options are based on inter-LGA flows.
For the base case stand-alone option connectivity is assessed at an SA2 level. This is a smaller ABS geography than the LGA. In contrast, Options 1 and 2 use LGAs. This is a necessary choice since the aim is to assess the strength of the linkages within the LGA. Three SA2s are used to analyse the functional links within the LGA: Auburn, Lidcombe Regents Park, and Silverwater-Homebush Bay. To calculate the score for the base case, Silverwater-Homebush bay was used as the centre of activity unit as it captures highest proportion of trips travelled to within Auburn.

Urban structure of Auburn 47
It should be noted that the scores for the base case of a stand-alone Auburn are comparable to the scores for Options 1 and 2. Even though the base case uses SA2 flows (to understand flows within the LGA), the magnitude of these flows are assessed relative to total flows at the LGA-level. That is, flows within the LGA (intra-LGA), are assessed relative to total flows in and out of the LGA. Similarly, for merger Options 1 and 2, flows between LGAs (inter-LGA), are assessed relative to total flows in and out of the collective LGAs. Since the base case and options have a comparable denominator, the computed rank- index scores are comparable.
Overall, the base case scenario has the highest composite index of the three options. This is because the flows (or connectivity) to and from SA2s in Auburn LGA are already high. In other words, the majority of the activity originating from the LGA, is contained within the LGA, and the accessibility within the LGA (public and private transport travel times in the context of the GMA) is strong. This supports anecdotal evidence that Auburn residents carry out their daily activities within the LGA and stems from the fact that key areas such as Auburn Town Centre, Lidcombe town centre and Sydney Olympic Park are all well serviced by public transport and support infrastructure. In other words, the rank-order index score for the base case captures the fact that the Auburn LGA as a local centre of activity is performing well, and this results in a significant share of activity occurring within the LGA. The source of this activity is from both within and outside the LGA.
In terms of merger options, Option 2 shows a better functional connectivity than Option 1. The larger merger option (Option 2) represents a larger and more diverse range of populations interacting with each other. This also translates to a greater jobs and dwellings offer within the region resulting in stronger employment and housing functional linkages. This is evident in the strong scores for labour markets (journey to work) and communities of interest. Strathfield in particular has strong linkages to Auburn due to proximity and accessibility and there are a large number of social and education trips between the two LGAs. The results suggests that Auburn’s connectivity is slightly more east than it is west, though its geographical positioning implies that it sits at the threshold of where east meets west.
It is worth noting that, retail expenditure connectivity between Auburn and Parramatta (Option 1), is stronger than the Option 2. This supports Parramatta’s role as regional centre which attracts higher commercial activity in the region, including Auburn. Train lines connecting Auburn, Lidcombe and Parramatta CBD and are able to accommodate large number of residents commuting between the two LGAs. This strong transport link is also evident in the strong labour market score, which again reaffirms Parramatta’s regional role.

Urban structure of Auburn 48
6 COMPARISON OF OPTIONS
Based on the urban geography analysis, and analysis of functional linkages, this section concludes the study by identifying high-level pros and cons of each merger option. Note that this analysis is purely from a strategic capacity and scale point of view only. Financial considerations, and community issues are not discussed.
Base Case: Auburn stands alone Advantages Disadvantages Recognises and maintains strong existing internal functional linkages.
SOP and surrounding precinct to grow strongly as a major node ‘in its own right’ – which will be a major management and infrastructure servicing task in any case.
‘Misses’ the opportunity to develop a linked centre with Rhodes and develop even stronger hub in complex of centres.
Option 1 Auburn and Parramatta Advantages Disadvantages Strong retail linkages to Parramatta.
Reinforces the idea of a Greater Parramatta with a large hinterland which includes Auburn.
Doesn’t sufficiently recognise the growing industry and economic links which Auburn LGA has to the north and east.
Splits prospect of integrated SOP/Rhodes and raises possibility that SOP/Rhodes won’t get sufficient attention because of the inevitable focus on Parramatta; difficult to serve multiple major hubs.
Option 2 Auburn, Canada Bay, Strathfield, Burwood Advantages Disadvantages Builds on strong journey to work and social/educational trip relationships
Provides for maximum focus on growing SOP/Rhodes as a major economic node within the networked eastern metropolitan area.
Builds on strengthening existing industry and economic connections between Auburn LGA and locations to the east.
May dilute prospects for truly integrated planning for Greater Parramatta which is a key metropolitan strategic planning focus.

Urban structure of Auburn 49

Urban structure of
Auburn 50
Contact us CANBERRA Level 1, 55 Woolley Street Dickson ACT 2602 +61 2 6262 7603 [email protected]
HOBART Unit 2, 5 King Street Bellerive TAS 7018 +61 (0)439 941 934 [email protected]
MELBOURNE Level 5, 171 La Trobe Street Melbourne VIC 3000 +61 3 8616 0331 [email protected]
SYDNEY 209/50 Holt Street Surry Hills NSW 2010 +61 2 8307 0121 [email protected]