appendix 7 - mini-frac test - pengrowth energy · mini-frac tests in pengrowth, well 13-13 3 bitcan...
TRANSCRIPT

Appendix 7
Mini-Frac Test

MINI-FRAC TESTS AT PENGROWTH LNDBRGH WELL 13-13-58-5W4
Y. Yuan and Jeffrey Tailleur
BitCan Geosciences & Engineering Inc.268 Edgebank Circle, N.W., Calgary, Alberta T3A 4W1
APEGGA Permit of Practice #07814
March 27, 2011
On behalf of Pengrowth Energy Corp., BitCan conducted 4 Mini-Frac tests on Well 13-13-58-5W4:
1) GP zone #3 at 476 m TVD,2) GP zone #2 at 484 m,3) GP zone #1 at 493 m,4) Lloyd at 512 m.
The test locations are denoted on the well log as shown in Figure 1. Objectives of the tests wereto assess the in-situ stress conditions. This report will illustrate how the in-situ minimum stresswas estimated as well as include a summary of the results.
1. General test procedure
Our tests employ new advancements and improvements to the mini-/micro-hydraulic fracturingstress test protocol currently used in the petroleum industry. Our testing procedure containsmodifications tailored specifically for use in the oil sands and heavy oil development.
Before commencing testing, the target interval was perforated. Water was then injected directlydown into the casing. Testing began at the lowest depth and a packer was set between twoadjacent perforation intervals. Multiple injection and shut-in cycles were used during each test.The injection pressures were monitored on-site via two surface pressure sensors: one close to thepumps and the other at the wellhead.
The current mini-/micro-hydraulic fracturing tests are the most reliable method to assess the in-situ minimum stress. Via controlled well injection, it creates a fracture and propagates it to asufficient distance from the injection well and into the formation. This ensures the fracturesenses the far-field stress condition. Multiple cycles are run to verify the data consistency. Thepressure data is analyzed to estimate the fracture closure pressure. The fracture closure pressurecan then be equated to the in-situ minimum stress acting perpendicular to the fracture. Figures 2 -5 plot the recorded pressure and rate history during each of the tests.
A flow-back procedure was also used during each test. For the flow-back, a certain volume ofwater is manually withdrawn from the injection system (wellbore plus the fracture) during theshut-in period. The fracture is thus able to close quickly and properly due to the manually

Mini-frac tests in Pengrowth, Well 13-13 2 BitCan 01-79
Confidential BitCan G&E Inc.
Pengrowth 1AB/13-13-58-5W4
TVD, m Stress regime
MPa kPa/m MPa kPa/m
Loydminster 512.0 5.94 11.60 10.74 20.98 V. frac
GP zone #1 493.0 7.48 15.17 10.34 20.97 V. frac
GP zone #2 484.0 7.55 15.60 10.15 20.97 V. frac
GP zone #3 476.0 6.80 14.29 9.97 20.95 V. frac
Min. stress Vert. stress
reduced pressure drop. A plot of BHP vs. cumulative injected volume (called compliance plot),can be used to detect the fracture closure. It is generally agreed that a properly executed andaccurately metered flow-back yields better constrained data on the minimum stress. BitCan’smini-frac test system can accurately control and meter the flown-back volume and rate. Figure 6illustrates an example compliance plot and its interpreted fracture closure pressure.
2. Depth profile of the in-situ minimum stress
The interpreted in-situ minimum stresses (Smin) at the tested depths of Well 13-13 are shown inFigure 1. Their specific values are summarized in the following table:
In all the test intervals from 476 to 512 m depths, including the Loydminster reservoir sands andits overlying GP caprock, the measured in-situ minimum stress is smaller than the verticaloverburden stress. Thus, at these depths, a vertical fracture stress regime is expected. However,all the immediate caprock zones are stressed more horizontally than the underlying reservoirs.For example, GP zone #1 (493 m TVD) as the caprock to the underlying Loyd sands (512 m) hasa Smin=7.48 MPa compared to Smin=5.94 at the 512-m depth. This is beneficial to maintainingthe caprock integrity.
3. Analysis of field data
It is BitCan’s practices to place great deal of emphasis on acquiring high quality data duringtesting. As shown in Figures 2 to 5, multiple injection/shut-in cycles were used in each test. In allthe tests, obvious formation breakdown occurred in the first injection cycle (Figure 2 to 5), i.e., afracture was formed. In the subsequent injection cycles during each test, the pressure declined orstayed relatively flat, signalling the continuous fracture propagation.
For each injection/shut-in cycle, the fracture closure pressure was interpreted by a linear flow (orsqrt(t)) plot. A system compliance plot was also used for the interpretations if the flow-backprocedure was used. A good compliance plot, such as the one shown in Figure 6, should havetwo different slopes. Intersection of these two slopes denotes the fracture closure pressure. Theinitial slope, corresponding to before the fracture closes, is steeper while the second slope,reflecting the post-closure system compliance, is less inclined.

Mini-frac tests in Pengrowth, Well 13-13 3 BitCan 01-79
Confidential BitCan G&E Inc.
The fracture closure pressures, interpreted as described above, are reconciled in Figures 7 to 10between the different cycles in each test. In general, a consistent closure pressure is seen in eachtest among the different cycles. Moreover, different interpretation methods, sqrt(t) or complianceplots, all give a similar closure pressure. Combining these methods serves to enhance theinterpretation accuracy. The cycles without the flow-back procedures generally registered ahigher closure pressure than the ones flown back. Better clarity can be seen on the flow-backcycles and therefore, their interpreted closure pressures are used to estimate the in-situ stress.

Mini-frac tests in Pengrowth, Well 13-13 4 BitCan 01-79
Confidential BitCan G&E Inc.
Figure 1: Summary of the in-situ minimum stresses measured from Well 13-13. Red dotted lines on thegamma log denote the mini-frac test intervals. “Sv” denotes the vertical overburden stress calculated fromthe density log. “Smin” in squares is the interpreted minimum stress from the mini-frac tests.

Mini-frac tests in Pengrowth, Well 13-13 5 BitCan 01-79
Confidential BitCan G&E Inc.
Figure 2: Recorded pressure history during the injection test in the GP zone #3 at 476 m TVD. Thebottomhole pressures (“BHP”) were calculated from a surface pressure sensor at the pump plus thehydraulic head (“Hydrostatic”) from the water column weight. The overburden weight (“Sv”) wascalculated from the density log. “SHmin” was the in-situ minimum horizontal stress or fracture closurepressure interpreted from the pressure data. Similar conventions are used below unless otherwisespecified.

Mini-frac tests in Pengrowth, Well 13-13 6 BitCan 01-79
Confidential BitCan G&E Inc.
Figure 3: Pressure history during the injection test in the GP zone #2 at 484 m TVD.
Figure 4: Pressure history during the injection test in the GP zone #1 at 493 m TVD.

Mini-frac tests in Pengrowth, Well 13-13 7 BitCan 01-79
Confidential BitCan G&E Inc.
Figure 5: Pressure history during the injection test in the Lloyd sands at 512 m TVD.
Figure 6: Fracture closure pressure interpreted from the compliance plot for Cycle #6 in the Lyod sandtest at 512 m. The negative volume on the x-axis denotes the flown-back volume.
1st complianceslope=85 L/MPa
2nd complianceslope=23 L/MPa

Mini-frac tests in Pengrowth, Well 13-13 8 BitCan 01-79
Confidential BitCan G&E Inc.
Figure 7: Various characteristic pressures interpreted from the test at 476 m in the GP zone #3.“P_reopen” denotes the fracture reopening pressure where the fracture starts to re-open during thesubsequent injection. “ISIP” is the Instantaneous Shut-In Pressure. “Pc, sqrt” refers to the fracture closurepressure extracted by the sqrt(dt)-plot. “Pc, compliance” is the fracture closure pressure extracted by thecompliance plot from the flow-back tests. “Cb, inj (Cf, back or Cb, back)” refers to the initial systemcompliance during the injection (the system compliance before or after the fracture closure during theflowback). Similar convention for the legends holds in this report unless otherwise specified.

Mini-frac tests in Pengrowth, Well 13-13 9 BitCan 01-79
Confidential BitCan G&E Inc.
Figure 8: Various characteristic pressures interpreted from the test in the GP formation at 484 m TVD.

Mini-frac tests in Pengrowth, Well 13-13 10 BitCan 01-79
Confidential BitCan G&E Inc.
Figure 9: Various characteristic pressures interpreted from the test in the GP formation at 493 m TVD.

Mini-frac tests in Pengrowth, Well 13-13 11 BitCan 01-79
Confidential BitCan G&E Inc.
Figure 10: Various characteristic pressures interpreted from the test in the Lloyd formation at 512 mTVD.

Pengrowth 1AB/13-13-58-5W4
TVD, m Stress regime
MPa kPa/m MPa kPa/m
Lloydminster 512.0 5.94 11.60 10.74 20.98 V. frac
GP zone #1 493.0 7.48 15.17 10.34 20.97 V. frac
GP zone #2 484.0 7.55 15.60 10.15 20.97 V. frac
GP zone #3 476.0 6.80 14.29 9.97 20.95 V. frac
Min. stress Vert. stress
MINI-FRAC TESTS AT PENGROWTH LNDBRGH WELL 13-13-58-5W4
--- A supplement to the summary report ---
Y. Yuan and J. Tailleur
BitCan Geosciences & Engineering Inc.268 Edgebank Circle, N.W., Calgary, Alberta T3A 4W1
APEGGA Permit of Practice #07814
March 27, 2011
Upon completion of the mini-frac tests, a summary report was written highlighting the testresults and discussing their importance to understanding the caprock integrity. The present reportdescribes additional test details including the analysis plots for each of the test cycles in each ofthe test intervals. It will also describe how to fully utilize the mini-frac test results for designingthe field operation. In essence, the mini-frac tests are not merely to satisfy ERCB’s requirements.It can be designed, executed and used as a cost-effective geomechanical field test, proactivelyguiding the field operation.
1. Applications of the test results to the field operation
The interpreted in-situ minimum stresses (Smin) are summarized in the following table:
As the first-order engineering design, the above measurements can be used to guide the fieldoperation designs as follows.
1.1. Operating pressures for Lyod reservoir towards the caprock integrity
Ideally the operating pressures should stay low enough to ensure the caprock integrity. TheSmin measured in the caprock provides the first-order engineering design towards thisobjective. The GP zone #1 caprock shale at 493 m has a Smin=7.48 MPa. Based on thismeasurement, the margin of safety for various operating pressures in the underlying Lyodreservoir sands is listed below:

Mini-frac tests in Lindbergh, Pengrowth 2 BitCan 01-80
Confidential BitCan G&E Inc.
OP, MPa Margin of Safety % of Smin@cap
3.74 100% 50%
4.49 67% 60%
5.24 43% 70%
5.98 25% 80%
6.73 11% 90%
The Margin of Safety (M.S.) for an Operating Pressure (OP) is defined as follows:
M.S. = Smin@cap/OP - 1
where Smin@cap represents the in-situ minimum stress in the Clwt caprock shale, i.e., equalto 7.48 MPa. It is assumed here that it is unsafe to allow OP to reach Smin in the caprock.This is reasonable for designing the operation against the hydraulically-driven fracturepropagation from the reservoir into the caprock. Therefore, a M.S. at zero means failure andlarger than zero means no failure. The greater the M.S. the safer the caprock is from failure.
Sometimes, a simple percentage of the Smin in the caprock is used to guide the operationpressure design. At 80%, OP can be 5.98 MPa and its associated M.S. is 25%. At 90%, OPcan be 6.73 MPa and its M.S. is 11%.
1.2. Dilation pressures, Llyod reservoir
To promote the geomechanical dilation effect, the reservoir recovery processes shouldoperate at pressures as high as possible. The in-situ minimum stress in the reservoir plays animportant role in the dilation. The Lyod reservoir has a Smin=5.94 MPa. The first-orderengineering analysis normally suggests that significant dilation should occur if the reservoiroperating pressure is close to its Smin, i.e., 5.94 MPa in our situation. At this operatingpressure, the Margin of Safety for the caprock integrity is about 25%. This pressure is 79% ofthe Smin=7.48 MPa in the GP zone #1. These safety measures are favorable for the caprockintegrity. Therefore, at the tested well, there is a rare “luxury” where an operating pressure,that is 5.94 MPa, exists which has a M.S. at about 25% for the caprock integrity andmeanwhile, promotes dilation in the reservoir.
1.3. A word of caution
It should be noted that caprock integrity as well as reservoir dilation is a very complex issue.For example, many factors contribute and therefore, many mechanisms can potentiallycompromise the caprock integrity (Yuan, 2008)1. The above observations in 1.1 to 1.2 referto a situation involving hydraulically-driven fracture propagation controlled by high fluidpressures inside the fracture and acting against the original in-situ stresses. It does notconsider the mode of shear failure which can potentially compromise the caprock integrity.Dilation is very much shear-controlled. The above discussions do not address impact of
1 Yuan, Y., 2008, Overburden/casing integrity in SAGD without high operating pressures. Presented at CanadianInternational Petroleum Conference in June, 2008 in Calgary. Paper # CIPC-2008-206.

Mini-frac tests in Lindbergh, Pengrowth 3 BitCan 01-80
Confidential BitCan G&E Inc.
reservoir deformation on the caprock. It does not consider thermal stresses. The thermalstresses and reservoir deformation may be significant during the thermal stimulations andshould be considered. These issues should be investigated by geomechanical laboratory testsand simulation program.
Furthermore, the above discussions assume that the measured stress condition holds acrossthe region. It may not be true if complex geology is present. Examples include post-depositional collapse structures and large faults. If these conditions are present, cautionshould be exercised and more tests are warranted.
2. Compilation of the analysis plots
Various appendices to this report compile all the analysis plots for the tests. Each plot occupies apage. They are first organized according to the test intervals. Plots are then grouped according tothe test cycles sequentially from the first to the last. For each cycle, the following sequence ofplots is arranged:
(1). “BHP and Injection Rate” plots the pressure/rate history, “Relative time” on the x-axis iscalculated from the start of the cycle.
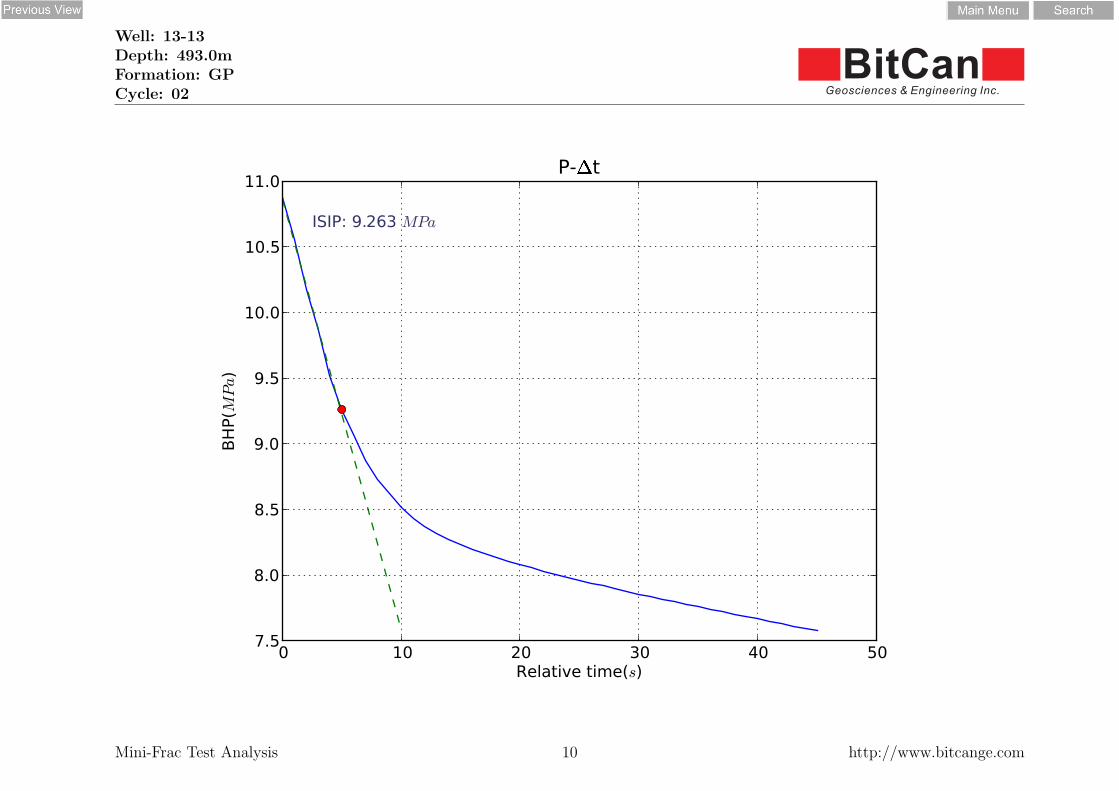
(2).“P-V” plot for the pressure vs. injection volume plot to identify “P_reopen”.(3).“P-Δt” plots the pressure decline during the shut-in. “Relative time” on the x-axis is
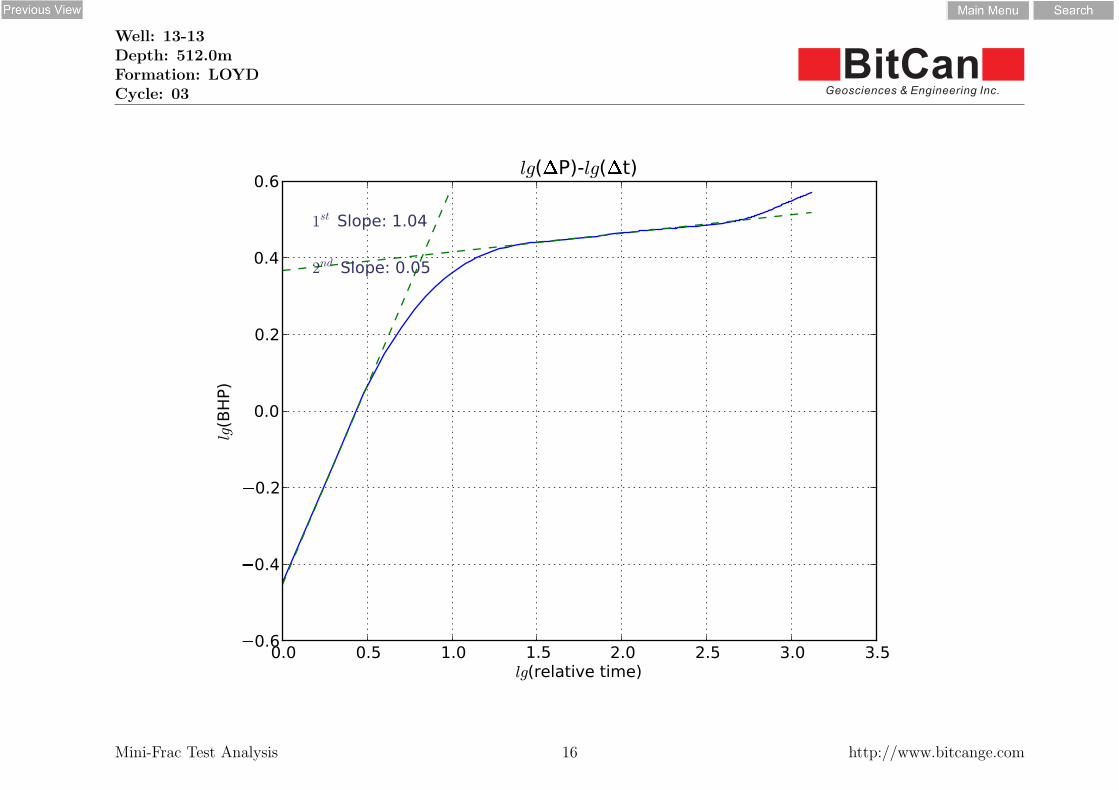
calculated with respect to the start of the shut-in period. This plot determines ISIP.(4).“lg(ΔP)-lg(Δt)” plots the pressure drop during the shut-in (ongoing pressure minus the
pressure at the start of the shut-in) against the shut-in time on the log-log plot. It is usedto identify two slopes whose magnitudes are denoted. The 1st or 2nd slopes are countedfrom the origin to the right.
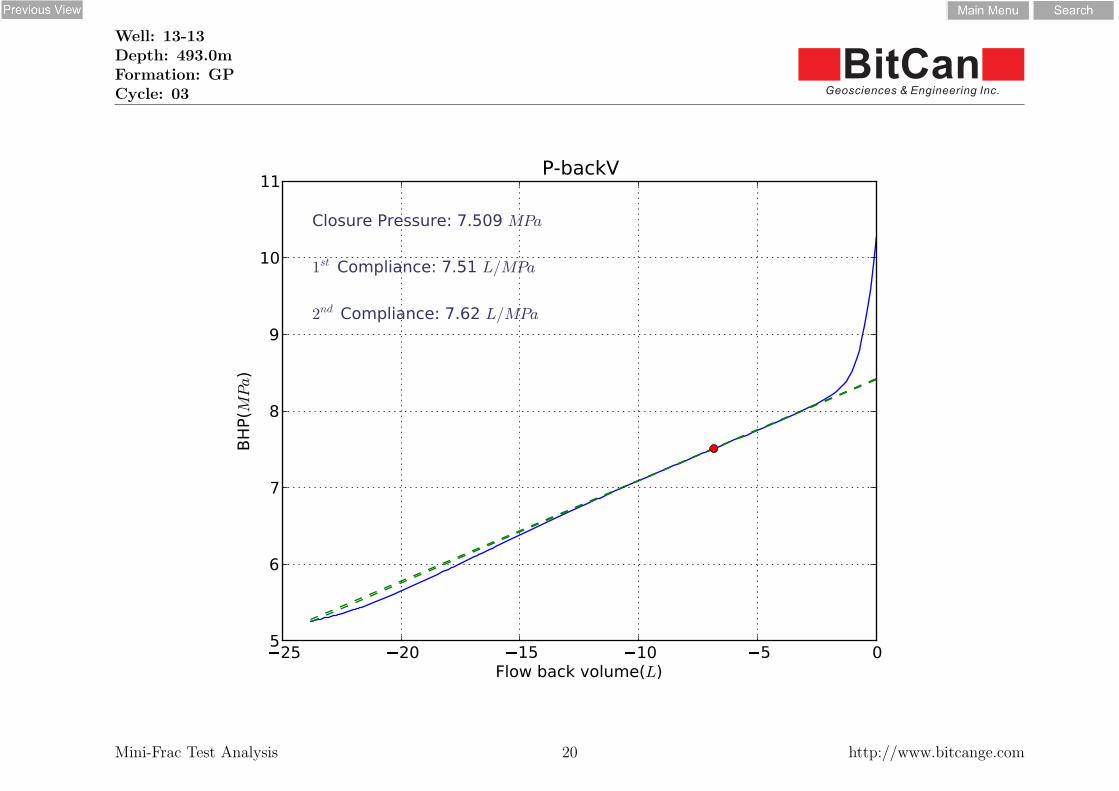
(5).“P-√Δt” for the p-sqrt(t) plot to identify “Pc, sqrt”. (6).“P-backV” is made only if the flow-back is executed during the test. It plots the pressure
vs. fluid volume being flown back. 2 slopes are identified and their intersection is thefracture closure pressure, “Pc, compliance”. The slopes are denoted on the plot. The 1st
and 2nd slopes are counted from the “0” point on the axis, i.e. the right-hand side end, tothe left.
(7).“lg(Δt*dP/dΔt)-lg(Δt)” means the pressure derivative plot on the log-log scale. The y-axis lg(Δt*dP/dΔt) is actually the derivative with respect to the natural log of the incremental time after the shut-in starts, i.e. dP/d(ln(Δt)). 3 slopes are identified to show the flow regimes. They are identified in the legend by “1st” to “3rd” corresponding respectively tofitted lines from the left-most to the right-most. The linear flow period should have aslope of 0.5 while the radial flow has a zero slope.
There are two summary pages after all the cycles are presented: the first plots the characteristicpressures according to the cycle sequences and the second lists their numeric values in a table.The compliance values are also listed: “Cb, inj” refers to the initial system compliance during theinjection. “Cf, back or Cb, back” is the system compliance before or after the fracture closure during theflowback.

ANALYSIS PLOTS
WELL: PENGROWTH LINDBERGHWELL 13-13-58-5W4
Test 1: Lloydminster Reservoir Sand at 446 m

Mini-Frac Test
pres
sure
(MP
a)
-1
0
1
2
3
4
5
6
flow rate(L/m
in)
-20
0
20
40
60
80
100
120
140
time(s)1,000 2,000 3,000 4,000 5,000 6,000 7,000
0 1 2 3 4 5
Pump Preussure Well Head Preussure High Flow Rate Low Flow Rate Flow Back Rate
BitCanGeosciences & Engineering Inc. www.bitcange.com
Client:Well:Depth:
Formation:Start @:
Pengrowth Energy Corp.1AB/13-13-58-5W4512
loydThu Mar 3 11:00:36 2011
Generated by MiniMonitor

Mini-Frac Test
pres
sure
(MP
a)
-1
0
1
2
3
4
5
6
volume(L)
-200
0
200
400
600
800
1,000
1,200
time(s)1,000 2,000 3,000 4,000 5,000 6,000 7,000
0 1 2 3 4 5
Pump Preussure Well Head Preussure Volume Injected
BitCanGeosciences & Engineering Inc. www.bitcange.com
Client:Well:Depth:
Formation:Start @:
Pengrowth Energy Corp.1AB/13-13-58-5W4512
loydThu Mar 3 11:00:36 2011
Generated by MiniMonitor

Well: 13-13Depth: 512.0mFormation: LOYDCycle: 01
BitCanGeosciences & Engineering Inc.
0 100 200 300 400 500 600 700 800 900Relative time(s)
5
6
7
8
9
10
11
BH
P(M
Pa)
BHP and Injection Rate
�10
0
10
20
30
40
50
60
70
Inje
ctio
n r
ate
(L/min
)
BHPInjection rate
Mini-Frac Test Analysis 1 http://www.bitcange.com

Well: 13-13Depth: 512.0mFormation: LOYDCycle: 01
BitCanGeosciences & Engineering Inc.
�10 0 10 20 30 40 50 60 70 80Injection volume(L)
5
6
7
8
9
10
11
BH
P(MPa)
Reopen Pressure: 9.18 MPa
P-V
Mini-Frac Test Analysis 2 http://www.bitcange.com

Well: 13-13Depth: 512.0mFormation: LOYDCycle: 01
BitCanGeosciences & Engineering Inc.
0 20 40 60 80 100 120 140 160Relative time(s)
6.0
6.5
7.0
7.5
8.0
8.5
9.0
9.5
10.0
BH
P(M
Pa)
ISIP: 8.094 MPa
P-�t
Mini-Frac Test Analysis 3 http://www.bitcange.com

Well: 13-13Depth: 512.0mFormation: LOYDCycle: 01
BitCanGeosciences & Engineering Inc.
0.0 0.5 1.0 1.5 2.0 2.5 3.0lg(relative time)
�1.0
�0.8
�0.6
�0.4
�0.2
0.0
0.2
0.4
0.6
0.8
lg(B
HP)
1st Slope: 1.58
2nd Slope: 0.06
lg(�P)-lg(�t)
Mini-Frac Test Analysis 4 http://www.bitcange.com

Well: 13-13Depth: 512.0mFormation: LOYDCycle: 01
BitCanGeosciences & Engineering Inc.
0 5 10 15 20 25Sqrt(relative time)
5
6
7
8
9
10
BH
P(M
Pa)
Closure Pressure: 5.881 MPa
P-�
�t
Mini-Frac Test Analysis 5 http://www.bitcange.com

Well: 13-13Depth: 512.0mFormation: LOYDCycle: 01
BitCanGeosciences & Engineering Inc.
0.0 0.5 1.0 1.5 2.0 2.5 3.0lg(�t)
�1.0
�0.8
�0.6
�0.4
�0.2
0.0
0.2
0.4
0.6
0.8
lg(�
tdP/d
�
t)1st Slope: -1.03
2nd Slope: 0.52
3rd Slope: 0.07
lg(�tdP/d�t)-lg(�t)
Mini-Frac Test Analysis 6 http://www.bitcange.com

Well: 13-13Depth: 512.0mFormation: LOYDCycle: 02
BitCanGeosciences & Engineering Inc.
0 200 400 600 800 1000 1200Relative time(s)
5
6
7
8
9
10
BH
P(M
Pa)
BHP and Injection Rate
�10
0
10
20
30
40
50
60
70
80
Inje
ctio
n r
ate
(L/min
)
BHPInjection rate
Mini-Frac Test Analysis 7 http://www.bitcange.com

Well: 13-13Depth: 512.0mFormation: LOYDCycle: 02
BitCanGeosciences & Engineering Inc.
0 10 20 30 40 50 60 70 80Injection volume(L)
5
6
7
8
9
10
BH
P(MPa)
Reopen Pressure: 7.927 MPa
P-V
Mini-Frac Test Analysis 8 http://www.bitcange.com

Well: 13-13Depth: 512.0mFormation: LOYDCycle: 02
BitCanGeosciences & Engineering Inc.
0 50 100 150 200 250Relative time(s)
5.5
6.0
6.5
7.0
7.5
8.0
8.5
9.0
9.5
BH
P(M
Pa)
ISIP: 8.072 MPa
P-�t
Mini-Frac Test Analysis 9 http://www.bitcange.com

Well: 13-13Depth: 512.0mFormation: LOYDCycle: 02
BitCanGeosciences & Engineering Inc.
0.0 0.5 1.0 1.5 2.0 2.5 3.0lg(relative time)
�0.6
�0.4
�0.2
0.0
0.2
0.4
0.6
lg(B
HP)
1st Slope: 1.16
2nd Slope: 0.57
lg(�P)-lg(�t)
Mini-Frac Test Analysis 10 http://www.bitcange.com

Well: 13-13Depth: 512.0mFormation: LOYDCycle: 02
BitCanGeosciences & Engineering Inc.
0 5 10 15 20 25 30Sqrt(relative time)
5.0
5.5
6.0
6.5
7.0
7.5
8.0
8.5
9.0
9.5
BH
P(M
Pa)
Closure Pressure: 5.872 MPa
P-�
�t
Mini-Frac Test Analysis 11 http://www.bitcange.com

Well: 13-13Depth: 512.0mFormation: LOYDCycle: 02
BitCanGeosciences & Engineering Inc.
0.0 0.5 1.0 1.5 2.0 2.5 3.0lg(�t)
�1.0
�0.8
�0.6
�0.4
�0.2
0.0
0.2
0.4
0.6
lg(�
tdP/d
�
t)1st Slope: 0.38
2nd Slope: 0.5
3rd Slope: 0.03
lg(�tdP/d�t)-lg(�t)
Mini-Frac Test Analysis 12 http://www.bitcange.com

Well: 13-13Depth: 512.0mFormation: LOYDCycle: 03
BitCanGeosciences & Engineering Inc.
0 200 400 600 800 1000 1200 1400 1600Relative time(s)
5
6
7
8
9
10
11
BH
P(M
Pa)
BHP and Injection Rate
�20
0
20
40
60
80
100
Inje
ctio
n r
ate
(L/min
)
BHPInjection rate
Mini-Frac Test Analysis 13 http://www.bitcange.com

Well: 13-13Depth: 512.0mFormation: LOYDCycle: 03
BitCanGeosciences & Engineering Inc.
0 20 40 60 80 100 120 140 160Injection volume(L)
5
6
7
8
9
10
11
BH
P(MPa)
Reopen Pressure: 8.489 MPa
P-V
Mini-Frac Test Analysis 14 http://www.bitcange.com

Well: 13-13Depth: 512.0mFormation: LOYDCycle: 03
BitCanGeosciences & Engineering Inc.
0 20 40 60 80 100Relative time(s)
6.0
6.5
7.0
7.5
8.0
8.5
9.0
9.5
BH
P(M
Pa)
ISIP: 7.397 MPa
P-�t
Mini-Frac Test Analysis 15 http://www.bitcange.com
Well: 13-13Depth: 512.0mFormation: LOYDCycle: 03
BitCanGeosciences & Engineering Inc.
0.0 0.5 1.0 1.5 2.0 2.5 3.0 3.5lg(relative time)
�0.6
�0.4
�0.2
0.0
0.2
0.4
0.6
lg(B
HP)
1st Slope: 1.04
2nd Slope: 0.05
lg(�P)-lg(�t)
Mini-Frac Test Analysis 16 http://www.bitcange.com

Well: 13-13Depth: 512.0mFormation: LOYDCycle: 03
BitCanGeosciences & Engineering Inc.
0 5 10 15 20 25 30 35 40Sqrt(relative time)
5.0
5.5
6.0
6.5
7.0
7.5
8.0
8.5
9.0
9.5
BH
P(M
Pa)
Closure Pressure: 5.909 MPa
P-�
�t
Mini-Frac Test Analysis 17 http://www.bitcange.com

Well: 13-13Depth: 512.0mFormation: LOYDCycle: 03
BitCanGeosciences & Engineering Inc.
0.0 0.5 1.0 1.5 2.0 2.5 3.0 3.5lg(�t)
�1.0
�0.5
0.0
0.5lg
(�
tdP/d
�
t)1st Slope: 0.18
2nd Slope: 0.51
3rd Slope: -0.08
lg(�tdP/d�t)-lg(�t)
Mini-Frac Test Analysis 18 http://www.bitcange.com

Well: 13-13Depth: 512.0mFormation: LOYDCycle: 04
BitCanGeosciences & Engineering Inc.
0 200 400 600 800 1000 1200Relative time(s)
5.0
5.5
6.0
6.5
7.0
7.5
8.0
8.5
9.0
9.5
BH
P(M
Pa)
BHP and Injection Rate
�20
0
20
40
60
80
100
120
140
Inje
ctio
n r
ate
(L/min
)
BHPInjection rate
Mini-Frac Test Analysis 19 http://www.bitcange.com

Well: 13-13Depth: 512.0mFormation: LOYDCycle: 04
BitCanGeosciences & Engineering Inc.
�10 0 10 20 30 40 50 60 70Injection volume(L)
5.0
5.5
6.0
6.5
7.0
7.5
8.0
8.5
9.0
9.5
BH
P(MPa)
Reopen Pressure: 7.222 MPa
P-V
Mini-Frac Test Analysis 20 http://www.bitcange.com

Well: 13-13Depth: 512.0mFormation: LOYDCycle: 04
BitCanGeosciences & Engineering Inc.
0 20 40 60 80 100 120Relative time(s)
6.0
6.2
6.4
6.6
6.8
7.0
7.2
7.4
BH
P(M
Pa)
ISIP: 6.616 MPa
P-�t
Mini-Frac Test Analysis 21 http://www.bitcange.com

Well: 13-13Depth: 512.0mFormation: LOYDCycle: 04
BitCanGeosciences & Engineering Inc.
0.0 0.5 1.0 1.5 2.0 2.5 3.0lg(relative time)
�1.2
�1.0
�0.8
�0.6
�0.4
�0.2
0.0
0.2
0.4
lg(B
HP)
1st Slope: 0.81
2nd Slope: 0.51
lg(�P)-lg(�t)
Mini-Frac Test Analysis 22 http://www.bitcange.com

Well: 13-13Depth: 512.0mFormation: LOYDCycle: 04
BitCanGeosciences & Engineering Inc.
0 5 10 15 20 25 30Sqrt(relative time)
5.0
5.5
6.0
6.5
7.0
7.5
BH
P(M
Pa)
Closure Pressure: 5.94 MPa
P-�
�t
Mini-Frac Test Analysis 23 http://www.bitcange.com

Well: 13-13Depth: 512.0mFormation: LOYDCycle: 04
BitCanGeosciences & Engineering Inc.
�45 �40 �35 �30 �25 �20 �15 �10 �5 0Flow back volume(L)
5.0
5.2
5.4
5.6
5.8
6.0
6.2
6.4
6.6
6.8
BH
P(M
Pa)
Closure Pressure: 5.836 MPa
1st Compliance: 56.57 L/MPa
2nd Compliance: 22.55 L/MPa
P-backV
Mini-Frac Test Analysis 24 http://www.bitcange.com

Well: 13-13Depth: 512.0mFormation: LOYDCycle: 04
BitCanGeosciences & Engineering Inc.
0.0 0.5 1.0 1.5 2.0 2.5 3.0lg(�t)
�1.4
�1.2
�1.0
�0.8
�0.6
�0.4
�0.2
0.0
0.2
lg(�
tdP/d
�
t)1st Slope: 0.41
2nd Slope: 0.53
3rd Slope: 0.0
lg(�tdP/d�t)-lg(�t)
Mini-Frac Test Analysis 25 http://www.bitcange.com

Well: 13-13Depth: 512.0mFormation: LOYDCycle: 05
BitCanGeosciences & Engineering Inc.
0 100 200 300 400 500 600 700 800Relative time(s)
5.0
5.5
6.0
6.5
7.0
7.5
8.0
8.5
9.0
BH
P(M
Pa)
BHP and Injection Rate
�20
0
20
40
60
80
100
120
Inje
ctio
n r
ate
(L/min
)
BHPInjection rate
Mini-Frac Test Analysis 26 http://www.bitcange.com

Well: 13-13Depth: 512.0mFormation: LOYDCycle: 05
BitCanGeosciences & Engineering Inc.
�20 0 20 40 60 80 100 120Injection volume(L)
5.0
5.5
6.0
6.5
7.0
7.5
8.0
8.5
9.0
BH
P(MPa)
Reopen Pressure: 7.624 MPa
P-V
Mini-Frac Test Analysis 27 http://www.bitcange.com

Well: 13-13Depth: 512.0mFormation: LOYDCycle: 05
BitCanGeosciences & Engineering Inc.
0 10 20 30 40 50 60Relative time(s)
6.0
6.5
7.0
7.5
8.0
8.5
BH
P(M
Pa)
ISIP: 7.019 MPa
P-�t
Mini-Frac Test Analysis 28 http://www.bitcange.com

Well: 13-13Depth: 512.0mFormation: LOYDCycle: 05
BitCanGeosciences & Engineering Inc.
0.0 0.5 1.0 1.5 2.0 2.5 3.0lg(relative time)
�0.6
�0.4
�0.2
0.0
0.2
0.4
0.6
lg(B
HP)
1st Slope: 1.38
2nd Slope: 0.04
lg(�P)-lg(�t)
Mini-Frac Test Analysis 29 http://www.bitcange.com

Well: 13-13Depth: 512.0mFormation: LOYDCycle: 05
BitCanGeosciences & Engineering Inc.
0 5 10 15 20 25 30Sqrt(relative time)
5.0
5.5
6.0
6.5
7.0
7.5
8.0
8.5
BH
P(M
Pa)
Closure Pressure: 6.017 MPa
P-�
�t
Mini-Frac Test Analysis 30 http://www.bitcange.com

Well: 13-13Depth: 512.0mFormation: LOYDCycle: 05
BitCanGeosciences & Engineering Inc.
�60 �50 �40 �30 �20 �10 0Flow back volume(L)
5.0
5.5
6.0
6.5
7.0
7.5
BH
P(M
Pa)
Closure Pressure: 5.928 MPa
1st Compliance: 93.86 L/MPa
2nd Compliance: 21.11 L/MPa
P-backV
Mini-Frac Test Analysis 31 http://www.bitcange.com

Well: 13-13Depth: 512.0mFormation: LOYDCycle: 05
BitCanGeosciences & Engineering Inc.
0.0 0.5 1.0 1.5 2.0 2.5 3.0lg(�t)
�1.2
�1.0
�0.8
�0.6
�0.4
�0.2
0.0
0.2
0.4
lg(�
tdP/d
�
t)1st Slope: -0.1
2nd Slope: 0.59
3rd Slope: -0.06
lg(�tdP/d�t)-lg(�t)
Mini-Frac Test Analysis 32 http://www.bitcange.com

Well: 13-13Depth: 512.0mFormation: LOYDCycle: 06
BitCanGeosciences & Engineering Inc.
0 100 200 300 400 500 600 700 800Relative time(s)
5.0
5.5
6.0
6.5
7.0
7.5
8.0
8.5
BH
P(M
Pa)
BHP and Injection Rate
�20
0
20
40
60
80
100
120
Inje
ctio
n r
ate
(L/min
)
BHPInjection rate
Mini-Frac Test Analysis 33 http://www.bitcange.com

Well: 13-13Depth: 512.0mFormation: LOYDCycle: 06
BitCanGeosciences & Engineering Inc.
0 20 40 60 80Injection volume(L)
5.0
5.5
6.0
6.5
7.0
7.5
8.0
8.5
BH
P(MPa)
Reopen Pressure: 7.635 MPa
P-V
Mini-Frac Test Analysis 34 http://www.bitcange.com

Well: 13-13Depth: 512.0mFormation: LOYDCycle: 06
BitCanGeosciences & Engineering Inc.
0 10 20 30 40 50 60Relative time(s)
6.2
6.4
6.6
6.8
7.0
7.2
7.4
7.6
7.8
8.0
BH
P(M
Pa)
ISIP: 6.907 MPa
P-�t
Mini-Frac Test Analysis 35 http://www.bitcange.com

Well: 13-13Depth: 512.0mFormation: LOYDCycle: 06
BitCanGeosciences & Engineering Inc.
0.0 0.5 1.0 1.5 2.0 2.5 3.0lg(relative time)
�0.3
�0.2
�0.1
0.0
0.1
0.2
0.3
0.4
0.5
lg(B
HP)
1st Slope: 0.53
2nd Slope: 0.08
lg(�P)-lg(�t)
Mini-Frac Test Analysis 36 http://www.bitcange.com

Well: 13-13Depth: 512.0mFormation: LOYDCycle: 06
BitCanGeosciences & Engineering Inc.
0 5 10 15 20 25 30Sqrt(relative time)
5.0
5.5
6.0
6.5
7.0
7.5
8.0
BH
P(M
Pa)
Closure Pressure: 6.032 MPa
P-�
�t
Mini-Frac Test Analysis 37 http://www.bitcange.com

Well: 13-13Depth: 512.0mFormation: LOYDCycle: 06
BitCanGeosciences & Engineering Inc.
�60 �50 �40 �30 �20 �10 0Flow back volume(L)
5.0
5.5
6.0
6.5
7.0
7.5
BH
P(M
Pa)
Closure Pressure: 5.945 MPa
1st Compliance: 85.29 L/MPa
2nd Compliance: 22.99 L/MPa
P-backV
Mini-Frac Test Analysis 38 http://www.bitcange.com

Well: 13-13Depth: 512.0mFormation: LOYDCycle: 06
BitCanGeosciences & Engineering Inc.
0.0 0.5 1.0 1.5 2.0 2.5 3.0lg(�t)
�1.2
�1.0
�0.8
�0.6
�0.4
�0.2
0.0
0.2
lg(�
tdP/d
�
t)1st Slope: 0.01
2nd Slope: 0.61
3rd Slope: 0.07
lg(�tdP/d�t)-lg(�t)
Mini-Frac Test Analysis 39 http://www.bitcange.com

Well: 13-13Depth: 512.0mFormation: LOYDCycle: 1 to 6
BitCanGeosciences & Engineering Inc.
0 1 2 3 4 5 6 7Cycle
0
2
4
6
8
10
Pre
ssure
(MPa)
Summary
P_reopen
ISIPPc, sqrtPc, compliance
Mini-Frac Test Analysis 40 http://www.bitcange.com

Well: 13-13Depth: 512.0mFormation: LOYDCycle: 1 to 6
BitCanGeosciences & Engineering Inc.
Characteristic Pressures and Compliances
Cycle # P reopen ISIP Pc, sqrt Pc, compliance Cb, inj Cf, back Cb, back
(MPa) (MPa) (MPa) (MPa) (L/MPa) (L/MPa) (L/MPa)
1 9.180 8.094 5.881 0.000 2.57 0.00 0.00
2 7.927 8.072 5.872 0.000 2.88 0.00 0.00
3 8.489 7.397 5.909 0.000 3.27 0.00 0.00
4 7.222 6.616 5.940 5.836 3.07 56.57 22.55
5 7.624 7.019 6.017 5.928 3.55 93.86 21.11
6 7.635 6.907 6.032 5.945 3.74 85.29 22.99
Mini-Frac Test Analysis 41 http://www.bitcange.com

ANALYSIS PLOTS
WELL: PENGROWTH LNDBRGHWELL 13-13-58-5W4
Test 2: GP Zone #1 at 493 m

Mini-Frac Test
pres
sure
(MP
a)
-2
0
2
4
6
8
10
flow rate(L/m
in)
-20
0
20
40
60
80
100
120
140
time(s)1,000 2,000 3,000 4,000
0 1 2 3 4 5
Pump Preussure Well Head Preussure High Flow Rate Low Flow Rate Flow Back Rate
BitCanGeosciences & Engineering Inc. www.bitcange.com
Client:Well:Depth:
Formation:Start @:
Pengrowth Energy Corp13-13-58-5W4494
GPThu Mar 3 14:16:18 2011
Generated by MiniMonitor

Mini-Frac Test
pres
sure
(MP
a)
-2
0
2
4
6
8
10
volume(L)
-100
0
100
200
300
400
500
600
700
800
time(s)1,000 2,000 3,000 4,000
0 1 2 3 4 5
Pump Preussure Well Head Preussure Volume Injected
BitCanGeosciences & Engineering Inc. www.bitcange.com
Client:Well:Depth:
Formation:Start @:
Pengrowth Energy Corp13-13-58-5W4494
GPThu Mar 3 14:16:18 2011
Generated by MiniMonitor

Well: 13-13Depth: 493.0mFormation: GPCycle: 01
BitCanGeosciences & Engineering Inc.
0 200 400 600 800 1000 1200Relative time(s)
4
6
8
10
12
14
BH
P(M
Pa)
BHP and Injection Rate
�10
0
10
20
30
40
50
60
70
Inje
ctio
n r
ate
(L/min
)
BHPInjection rate
Mini-Frac Test Analysis 1 http://www.bitcange.com

Well: 13-13Depth: 493.0mFormation: GPCycle: 01
BitCanGeosciences & Engineering Inc.
0 10 20 30 40 50 60 70Injection volume(L)
6
7
8
9
10
11
12
13
14
BH
P(MPa)
Reopen Pressure: 12.326 MPa
P-V
Mini-Frac Test Analysis 2 http://www.bitcange.com

Well: 13-13Depth: 493.0mFormation: GPCycle: 01
BitCanGeosciences & Engineering Inc.
0 20 40 60 80 100 120Relative time(s)
7.5
8.0
8.5
9.0
9.5
10.0
10.5
11.0
11.5
BH
P(M
Pa)
ISIP: 9.198 MPa
P-�t
Mini-Frac Test Analysis 3 http://www.bitcange.com

Well: 13-13Depth: 493.0mFormation: GPCycle: 01
BitCanGeosciences & Engineering Inc.
0.0 0.5 1.0 1.5 2.0 2.5 3.0lg(relative time)
�0.8
�0.6
�0.4
�0.2
0.0
0.2
0.4
0.6
0.8
lg(B
HP)
1st Slope: 1.27
2nd Slope: 0.08
lg(�P)-lg(�t)
Mini-Frac Test Analysis 4 http://www.bitcange.com

Well: 13-13Depth: 493.0mFormation: GPCycle: 01
BitCanGeosciences & Engineering Inc.
0 5 10 15 20 25 30Sqrt(relative time)
5
6
7
8
9
10
11
12
BH
P(M
Pa)
Closure Pressure: 7.635 MPa
P-�
�t
Mini-Frac Test Analysis 5 http://www.bitcange.com

Well: 13-13Depth: 493.0mFormation: GPCycle: 01
BitCanGeosciences & Engineering Inc.
�14 �12 �10 �8 �6 �4 �2 0Flow back volume(L)
6.5
7.0
7.5
8.0
8.5
9.0
9.5
10.0
BH
P(M
Pa)
Closure Pressure: 7.73 MPa
1st Compliance: 9.02 L/MPa
2nd Compliance: 8.11 L/MPa
P-backV
Mini-Frac Test Analysis 6 http://www.bitcange.com

Well: 13-13Depth: 493.0mFormation: GPCycle: 01
BitCanGeosciences & Engineering Inc.
0.0 0.5 1.0 1.5 2.0 2.5 3.0lg(�t)
�0.8
�0.6
�0.4
�0.2
0.0
0.2
0.4
0.6
0.8
lg(�
tdP/d
�
t)1st Slope: -1.88
2nd Slope: 0.48
3rd Slope: 0.04
lg(�tdP/d�t)-lg(�t)
Mini-Frac Test Analysis 7 http://www.bitcange.com

Well: 13-13Depth: 493.0mFormation: GPCycle: 02
BitCanGeosciences & Engineering Inc.
0 50 100 150 200 250 300 350 400 450Relative time(s)
5
6
7
8
9
10
11
12
BH
P(M
Pa)
BHP and Injection Rate
�10
0
10
20
30
40
50
60
70
Inje
ctio
n r
ate
(L/min
)
BHPInjection rate
Mini-Frac Test Analysis 8 http://www.bitcange.com

Well: 13-13Depth: 493.0mFormation: GPCycle: 02
BitCanGeosciences & Engineering Inc.
0 5 10 15 20 25 30 35Injection volume(L)
5
6
7
8
9
10
11
12
BH
P(MPa)
Reopen Pressure: 10.279 MPa
P-V
Mini-Frac Test Analysis 9 http://www.bitcange.com
Well: 13-13Depth: 493.0mFormation: GPCycle: 02
BitCanGeosciences & Engineering Inc.
0 10 20 30 40 50Relative time(s)
7.5
8.0
8.5
9.0
9.5
10.0
10.5
11.0
BH
P(M
Pa)
ISIP: 9.263 MPa
P-�t
Mini-Frac Test Analysis 10 http://www.bitcange.com

Well: 13-13Depth: 493.0mFormation: GPCycle: 02
BitCanGeosciences & Engineering Inc.
0.0 0.5 1.0 1.5 2.0 2.5lg(relative time)
�0.6
�0.4
�0.2
0.0
0.2
0.4
0.6
0.8
lg(B
HP)
1st Slope: 1.11
2nd Slope: 0.2
lg(�P)-lg(�t)
Mini-Frac Test Analysis 11 http://www.bitcange.com

Well: 13-13Depth: 493.0mFormation: GPCycle: 02
BitCanGeosciences & Engineering Inc.
0 2 4 6 8 10 12 14 16 18Sqrt(relative time)
5
6
7
8
9
10
11
BH
P(M
Pa)
Closure Pressure: 7.353 MPa
P-�
�t
Mini-Frac Test Analysis 12 http://www.bitcange.com

Well: 13-13Depth: 493.0mFormation: GPCycle: 02
BitCanGeosciences & Engineering Inc.
�25 �20 �15 �10 �5 0Flow back volume(L)
5
6
7
8
9
10
11
BH
P(M
Pa)
Closure Pressure: 7.536 MPa
1st Compliance: 6.04 L/MPa
2nd Compliance: 6.13 L/MPa
P-backV
Mini-Frac Test Analysis 13 http://www.bitcange.com

Well: 13-13Depth: 493.0mFormation: GPCycle: 02
BitCanGeosciences & Engineering Inc.
0.0 0.5 1.0 1.5 2.0 2.5lg(�t)
�0.6
�0.4
�0.2
0.0
0.2
0.4
0.6
0.8
lg(�
tdP/d
�
t)1st Slope: -1.05
2nd Slope: 0.52
3rd Slope: 0.03
lg(�tdP/d�t)-lg(�t)
Mini-Frac Test Analysis 14 http://www.bitcange.com

Well: 13-13Depth: 493.0mFormation: GPCycle: 03
BitCanGeosciences & Engineering Inc.
0 100 200 300 400 500Relative time(s)
4
5
6
7
8
9
10
11
12
BH
P(M
Pa)
BHP and Injection Rate
�10
0
10
20
30
40
50
60
70
Inje
ctio
n r
ate
(L/min
)
BHPInjection rate
Mini-Frac Test Analysis 15 http://www.bitcange.com

Well: 13-13Depth: 493.0mFormation: GPCycle: 03
BitCanGeosciences & Engineering Inc.
0 5 10 15 20 25 30 35 40Injection volume(L)
5
6
7
8
9
10
11
12
BH
P(MPa)
Reopen Pressure: 9.865 MPa
P-V
Mini-Frac Test Analysis 16 http://www.bitcange.com

Well: 13-13Depth: 493.0mFormation: GPCycle: 03
BitCanGeosciences & Engineering Inc.
0 10 20 30 40 50 60Relative time(s)
7.5
8.0
8.5
9.0
9.5
10.0
10.5
11.0
BH
P(M
Pa)
ISIP: 9.579 MPa
P-�t
Mini-Frac Test Analysis 17 http://www.bitcange.com

Well: 13-13Depth: 493.0mFormation: GPCycle: 03
BitCanGeosciences & Engineering Inc.
0.0 0.5 1.0 1.5 2.0 2.5lg(relative time)
�0.6
�0.4
�0.2
0.0
0.2
0.4
0.6
0.8
lg(B
HP)
1st Slope: 0.95
2nd Slope: 0.17
lg(�P)-lg(�t)
Mini-Frac Test Analysis 18 http://www.bitcange.com

Well: 13-13Depth: 493.0mFormation: GPCycle: 03
BitCanGeosciences & Engineering Inc.
0 5 10 15 20Sqrt(relative time)
5
6
7
8
9
10
11
BH
P(M
Pa)
Closure Pressure: 7.479 MPa
P-�
�t
Mini-Frac Test Analysis 19 http://www.bitcange.com
Well: 13-13Depth: 493.0mFormation: GPCycle: 03
BitCanGeosciences & Engineering Inc.
�25 �20 �15 �10 �5 0Flow back volume(L)
5
6
7
8
9
10
11
BH
P(M
Pa)
Closure Pressure: 7.509 MPa
1st Compliance: 7.51 L/MPa
2nd Compliance: 7.62 L/MPa
P-backV
Mini-Frac Test Analysis 20 http://www.bitcange.com

Well: 13-13Depth: 493.0mFormation: GPCycle: 03
BitCanGeosciences & Engineering Inc.
0.0 0.5 1.0 1.5 2.0 2.5 3.0lg(�t)
�0.6
�0.4
�0.2
0.0
0.2
0.4
0.6
0.8
lg(�
tdP/d
�
t)1st Slope: 0.34
2nd Slope: 0.52
3rd Slope: 0.07
lg(�tdP/d�t)-lg(�t)
Mini-Frac Test Analysis 21 http://www.bitcange.com

Well: 13-13Depth: 493.0mFormation: GPCycle: 04
BitCanGeosciences & Engineering Inc.
0 100 200 300 400 500Relative time(s)
5
6
7
8
9
10
11
12
BH
P(M
Pa)
BHP and Injection Rate
�20
0
20
40
60
80
100
120
140
Inje
ctio
n r
ate
(L/min
)
BHPInjection rate
Mini-Frac Test Analysis 22 http://www.bitcange.com

Well: 13-13Depth: 493.0mFormation: GPCycle: 04
BitCanGeosciences & Engineering Inc.
0 10 20 30 40 50 60 70 80 90Injection volume(L)
8.0
8.5
9.0
9.5
10.0
10.5
11.0
11.5
12.0
BH
P(MPa)
Reopen Pressure: 10.316 MPa
P-V
Mini-Frac Test Analysis 23 http://www.bitcange.com

Well: 13-13Depth: 493.0mFormation: GPCycle: 04
BitCanGeosciences & Engineering Inc.
0 10 20 30 40 50 60 70 80Relative time(s)
7.0
7.5
8.0
8.5
9.0
9.5
10.0
BH
P(M
Pa)
ISIP: 8.91 MPa
P-�t
Mini-Frac Test Analysis 24 http://www.bitcange.com

Well: 13-13Depth: 493.0mFormation: GPCycle: 04
BitCanGeosciences & Engineering Inc.
0.0 0.5 1.0 1.5 2.0 2.5 3.0lg(relative time)
�0.8
�0.6
�0.4
�0.2
0.0
0.2
0.4
0.6
0.8
lg(B
HP)
1st Slope: 1.18
2nd Slope: 0.23
lg(�P)-lg(�t)
Mini-Frac Test Analysis 25 http://www.bitcange.com

Well: 13-13Depth: 493.0mFormation: GPCycle: 04
BitCanGeosciences & Engineering Inc.
0 5 10 15 20Sqrt(relative time)
5
6
7
8
9
10
BH
P(M
Pa)
Closure Pressure: 7.468 MPa
P-�
�t
Mini-Frac Test Analysis 26 http://www.bitcange.com

Well: 13-13Depth: 493.0mFormation: GPCycle: 04
BitCanGeosciences & Engineering Inc.
�30 �25 �20 �15 �10 �5 0Flow back volume(L)
5
6
7
8
9
10
BH
P(M
Pa)
Closure Pressure: 7.405 MPa
1st Compliance: 7.57 L/MPa
2nd Compliance: 7.24 L/MPa
P-backV
Mini-Frac Test Analysis 27 http://www.bitcange.com

Well: 13-13Depth: 493.0mFormation: GPCycle: 04
BitCanGeosciences & Engineering Inc.
0.0 0.5 1.0 1.5 2.0 2.5lg(�t)
�0.8
�0.6
�0.4
�0.2
0.0
0.2
0.4
0.6
lg(�
tdP/d
�
t)1st Slope: -0.88
2nd Slope: 0.51
3rd Slope: 0.05
lg(�tdP/d�t)-lg(�t)
Mini-Frac Test Analysis 28 http://www.bitcange.com

Well: 13-13Depth: 493.0mFormation: GPCycle: 05
BitCanGeosciences & Engineering Inc.
0 100 200 300 400 500 600Relative time(s)
5
6
7
8
9
10
11
12
BH
P(M
Pa)
BHP and Injection Rate
�20
0
20
40
60
80
100
120
Inje
ctio
n r
ate
(L/min
)
BHPInjection rate
Mini-Frac Test Analysis 29 http://www.bitcange.com

Well: 13-13Depth: 493.0mFormation: GPCycle: 05
BitCanGeosciences & Engineering Inc.
0 20 40 60 80 100Injection volume(L)
5
6
7
8
9
10
11
12
BH
P(MPa)
Reopen Pressure: 10.472 MPa
P-V
Mini-Frac Test Analysis 30 http://www.bitcange.com

Well: 13-13Depth: 493.0mFormation: GPCycle: 05
BitCanGeosciences & Engineering Inc.
0 20 40 60 80 100 120 140 160 180Relative time(s)
6
7
8
9
10
11
12
BH
P(M
Pa)
ISIP: 8.802 MPa
P-�t
Mini-Frac Test Analysis 31 http://www.bitcange.com

Well: 13-13Depth: 493.0mFormation: GPCycle: 05
BitCanGeosciences & Engineering Inc.
0.0 0.5 1.0 1.5 2.0 2.5 3.0lg(relative time)
�0.6
�0.4
�0.2
0.0
0.2
0.4
0.6
0.8
lg(B
HP)
1st Slope: 1.08
2nd Slope: 0.12
lg(�P)-lg(�t)
Mini-Frac Test Analysis 32 http://www.bitcange.com

Well: 13-13Depth: 493.0mFormation: GPCycle: 05
BitCanGeosciences & Engineering Inc.
0 5 10 15 20 25Sqrt(relative time)
5
6
7
8
9
10
11
12
BH
P(M
Pa)
Closure Pressure: 7.503 MPa
P-�
�t
Mini-Frac Test Analysis 33 http://www.bitcange.com

Well: 13-13Depth: 493.0mFormation: GPCycle: 05
BitCanGeosciences & Engineering Inc.
�30 �25 �20 �15 �10 �5 0Flow back volume(L)
5
6
7
8
9
10
BH
P(M
Pa)
Closure Pressure: 7.248 MPa
1st Compliance: 9.48 L/MPa
2nd Compliance: 7.93 L/MPa
P-backV
Mini-Frac Test Analysis 34 http://www.bitcange.com

Well: 13-13Depth: 493.0mFormation: GPCycle: 05
BitCanGeosciences & Engineering Inc.
0.0 0.5 1.0 1.5 2.0 2.5 3.0lg(�t)
�0.6
�0.4
�0.2
0.0
0.2
0.4
0.6
0.8
lg(�
tdP/d
�
t)1st Slope: -1.62
2nd Slope: 0.63
3rd Slope: 0.05
lg(�tdP/d�t)-lg(�t)
Mini-Frac Test Analysis 35 http://www.bitcange.com

Well: 13-13Depth: 493.0mFormation: GPCycle: 06
BitCanGeosciences & Engineering Inc.
0 200 400 600 800 1000 1200 1400Relative time(s)
5
6
7
8
9
10
11
12
BH
P(M
Pa)
BHP and Injection Rate
�20
0
20
40
60
80
100
120
140
Inje
ctio
n r
ate
(L/min
)
BHPInjection rate
Mini-Frac Test Analysis 36 http://www.bitcange.com

Well: 13-13Depth: 493.0mFormation: GPCycle: 06
BitCanGeosciences & Engineering Inc.
0 10 20 30 40 50 60 70Injection volume(L)
7.0
7.5
8.0
8.5
9.0
9.5
10.0
10.5
11.0
11.5
BH
P(MPa)
Reopen Pressure: 10.202 MPa
P-V
Mini-Frac Test Analysis 37 http://www.bitcange.com

Well: 13-13Depth: 493.0mFormation: GPCycle: 06
BitCanGeosciences & Engineering Inc.
0 20 40 60 80 100 120 140 160Relative time(s)
7.5
8.0
8.5
9.0
9.5
10.0
10.5
BH
P(M
Pa)
ISIP: 8.76 MPa
P-�t
Mini-Frac Test Analysis 38 http://www.bitcange.com

Well: 13-13Depth: 493.0mFormation: GPCycle: 06
BitCanGeosciences & Engineering Inc.
0.0 0.5 1.0 1.5 2.0 2.5 3.0 3.5lg(relative time)
�0.2
�0.1
0.0
0.1
0.2
0.3
0.4
0.5
0.6
0.7
lg(B
HP)
1st Slope: 0.8
2nd Slope: 0.1
lg(�P)-lg(�t)
Mini-Frac Test Analysis 39 http://www.bitcange.com

Well: 13-13Depth: 493.0mFormation: GPCycle: 06
BitCanGeosciences & Engineering Inc.
0 5 10 15 20 25 30 35Sqrt(relative time)
5
6
7
8
9
10
11
BH
P(M
Pa)
Closure Pressure: 7.463 MPa
P-�
�t
Mini-Frac Test Analysis 40 http://www.bitcange.com

Well: 13-13Depth: 493.0mFormation: GPCycle: 06
BitCanGeosciences & Engineering Inc.
0.0 0.5 1.0 1.5 2.0 2.5 3.0 3.5lg(�t)
�0.8
�0.6
�0.4
�0.2
0.0
0.2
0.4
0.6
lg(�
tdP/d
�
t)1st Slope: -1.09
2nd Slope: 0.52
3rd Slope: 0.02
lg(�tdP/d�t)-lg(�t)
Mini-Frac Test Analysis 41 http://www.bitcange.com

Well: 13-13Depth: 493.0mFormation: GPCycle: 1 to 6
BitCanGeosciences & Engineering Inc.
0 1 2 3 4 5 6 7Cycle
0
2
4
6
8
10
12
14
Pre
ssure
(MPa)
Summary
P_reopen
ISIPPc, sqrtPc, compliance
Mini-Frac Test Analysis 42 http://www.bitcange.com

Well: 13-13Depth: 493.0mFormation: GPCycle: 1 to 6
BitCanGeosciences & Engineering Inc.
Characteristic Pressures and Compliances
Cycle # P reopen ISIP Pc, sqrt Pc, compliance Cb, inj Cf, back Cb, back
(MPa) (MPa) (MPa) (MPa) (L/MPa) (L/MPa) (L/MPa)
1 12.326 9.198 7.635 7.730 2.54 9.02 8.11
2 10.279 9.263 7.353 7.536 2.66 6.04 6.13
3 9.865 9.579 7.479 7.509 2.68 7.51 7.62
4 10.316 8.910 7.468 7.405 3.35 7.57 7.24
5 10.472 8.802 7.503 7.248 2.77 9.48 7.93
6 10.202 8.760 7.463 0.000 2.73 0.00 0.00
Mini-Frac Test Analysis 43 http://www.bitcange.com

ANALYSIS PLOTS
WELL: PENGROWTH LNDBRGHWELL 13-13-58-5W4
Test 3: GP Zone #2 at 484 m

Mini-Frac Test
pres
sure
(MP
a)
0
1
2
3
4
5
6
7
8
flow rate(L/m
in)
-20
0
20
40
60
80
100
120
140
time(s)1,000 2,000 3,000 4,000 5,000
0 1 2 3 4 5 6
Pump Preussure Well Head Preussure High Flow Rate Low Flow Rate Flow Back Rate
BitCanGeosciences & Engineering Inc. www.bitcange.com
Client:Well:Depth:
Formation:Start @:
Pengrowth Energy Corp.13-13-58-5W4484
GPThu Mar 3 16:49:34 2011
Generated by MiniMonitor

Mini-Frac Test
pres
sure
(MP
a)
0
1
2
3
4
5
6
7
8
volume(L)
0
200
400
600
800
1,000
1,200
1,400
time(s)1,000 2,000 3,000 4,000 5,000
0 1 2 3 4 5 6
Pump Preussure Well Head Preussure Volume Injected
BitCanGeosciences & Engineering Inc. www.bitcange.com
Client:Well:Depth:
Formation:Start @:
Pengrowth Energy Corp.13-13-58-5W4484
GPThu Mar 3 16:49:34 2011
Generated by MiniMonitor

Well: 13-13Depth: 484.0mFormation: GPCycle: 01
BitCanGeosciences & Engineering Inc.
0 100 200 300 400 500 600Relative time(s)
4
5
6
7
8
9
10
11
12
BH
P(M
Pa)
BHP and Injection Rate
�10
0
10
20
30
40
50
Inje
ctio
n r
ate
(L/min
)
BHPInjection rate
Mini-Frac Test Analysis 1 http://www.bitcange.com

Well: 13-13Depth: 484.0mFormation: GPCycle: 01
BitCanGeosciences & Engineering Inc.
0 5 10 15 20Injection volume(L)
7.5
8.0
8.5
9.0
9.5
10.0
10.5
11.0
11.5
12.0
BH
P(MPa)
Reopen Pressure: 11.413 MPa
P-V
Mini-Frac Test Analysis 2 http://www.bitcange.com

Well: 13-13Depth: 484.0mFormation: GPCycle: 01
BitCanGeosciences & Engineering Inc.
0 20 40 60 80 100 120 140 160 180Relative time(s)
5
6
7
8
9
10
11
12
BH
P(M
Pa)
ISIP: 9.496 MPa
P-�t
Mini-Frac Test Analysis 3 http://www.bitcange.com

Well: 13-13Depth: 484.0mFormation: GPCycle: 01
BitCanGeosciences & Engineering Inc.
0.0 0.5 1.0 1.5 2.0 2.5 3.0lg(relative time)
�0.6
�0.4
�0.2
0.0
0.2
0.4
0.6
0.8
1.0
lg(B
HP)
1st Slope: 1.14
2nd Slope: 0.25
lg(�P)-lg(�t)
Mini-Frac Test Analysis 4 http://www.bitcange.com

Well: 13-13Depth: 484.0mFormation: GPCycle: 01
BitCanGeosciences & Engineering Inc.
0 5 10 15 20Sqrt(relative time)
4
5
6
7
8
9
10
11
12
BH
P(M
Pa)
Closure Pressure: 7.994 MPa
P-�
�t
Mini-Frac Test Analysis 5 http://www.bitcange.com

Well: 13-13Depth: 484.0mFormation: GPCycle: 01
BitCanGeosciences & Engineering Inc.
�8 �7 �6 �5 �4 �3 �2 �1 0Flow back volume(L)
4
5
6
7
8
9
10
11
12
BH
P(M
Pa)
Closure Pressure: 6.908 MPa
1st Compliance: 2.13 L/MPa
2nd Compliance: 2.56 L/MPa
P-backV
Mini-Frac Test Analysis 6 http://www.bitcange.com

Well: 13-13Depth: 484.0mFormation: GPCycle: 01
BitCanGeosciences & Engineering Inc.
0.0 0.5 1.0 1.5 2.0 2.5 3.0lg(�t)
�0.6
�0.4
�0.2
0.0
0.2
0.4
0.6
0.8
lg(�
tdP/d
�
t)1st Slope: 0.29
2nd Slope: 0.49
3rd Slope: 0.01
lg(�tdP/d�t)-lg(�t)
Mini-Frac Test Analysis 7 http://www.bitcange.com

Well: 13-13Depth: 484.0mFormation: GPCycle: 02
BitCanGeosciences & Engineering Inc.
0 100 200 300 400 500 600Relative time(s)
4
5
6
7
8
9
10
11
12
BH
P(M
Pa)
BHP and Injection Rate
�10
0
10
20
30
40
50
60
Inje
ctio
n r
ate
(L/min
)
BHPInjection rate
Mini-Frac Test Analysis 8 http://www.bitcange.com

Well: 13-13Depth: 484.0mFormation: GPCycle: 02
BitCanGeosciences & Engineering Inc.
0 5 10 15 20 25Injection volume(L)
4
5
6
7
8
9
10
11
12
BH
P(MPa)
Reopen Pressure: 9.802 MPa
P-V
Mini-Frac Test Analysis 9 http://www.bitcange.com

Well: 13-13Depth: 484.0mFormation: GPCycle: 02
BitCanGeosciences & Engineering Inc.
0 20 40 60 80 100 120 140Relative time(s)
6.5
7.0
7.5
8.0
8.5
9.0
9.5
10.0
10.5
11.0
BH
P(M
Pa)
ISIP: 9.578 MPa
P-�t
Mini-Frac Test Analysis 10 http://www.bitcange.com

Well: 13-13Depth: 484.0mFormation: GPCycle: 02
BitCanGeosciences & Engineering Inc.
0.0 0.5 1.0 1.5 2.0 2.5lg(relative time)
�0.6
�0.4
�0.2
0.0
0.2
0.4
0.6
0.8
lg(B
HP)
1st Slope: 0.93
2nd Slope: 0.19
lg(�P)-lg(�t)
Mini-Frac Test Analysis 11 http://www.bitcange.com

Well: 13-13Depth: 484.0mFormation: GPCycle: 02
BitCanGeosciences & Engineering Inc.
0 5 10 15 20Sqrt(relative time)
5
6
7
8
9
10
11
BH
P(M
Pa)
Closure Pressure: 8.04 MPa
P-�
�t
Mini-Frac Test Analysis 12 http://www.bitcange.com

Well: 13-13Depth: 484.0mFormation: GPCycle: 02
BitCanGeosciences & Engineering Inc.
0.0 0.5 1.0 1.5 2.0 2.5 3.0lg(�t)
�0.6
�0.4
�0.2
0.0
0.2
0.4
0.6
0.8
lg(�
tdP/d
�
t)1st Slope: 0.38
2nd Slope: 0.69
3rd Slope: 0.0
lg(�tdP/d�t)-lg(�t)
Mini-Frac Test Analysis 13 http://www.bitcange.com

Well: 13-13Depth: 484.0mFormation: GPCycle: 03
BitCanGeosciences & Engineering Inc.
0 200 400 600 800 1000 1200 1400Relative time(s)
5
6
7
8
9
10
11
12
13
BH
P(M
Pa)
BHP and Injection Rate
0
20
40
60
80
Inje
ctio
n r
ate
(L/min
)
BHPInjection rate
Mini-Frac Test Analysis 14 http://www.bitcange.com

Well: 13-13Depth: 484.0mFormation: GPCycle: 03
BitCanGeosciences & Engineering Inc.
0 10 20 30 40 50 60Injection volume(L)
5
6
7
8
9
10
11
12
13
BH
P(MPa)
Reopen Pressure: 9.558 MPa
P-V
Mini-Frac Test Analysis 15 http://www.bitcange.com

Well: 13-13Depth: 484.0mFormation: GPCycle: 03
BitCanGeosciences & Engineering Inc.
0 20 40 60 80 100Relative time(s)
7.0
7.5
8.0
8.5
9.0
9.5
10.0
10.5
11.0
11.5
BH
P(M
Pa)
ISIP: 9.66 MPa
P-�t
Mini-Frac Test Analysis 16 http://www.bitcange.com

Well: 13-13Depth: 484.0mFormation: GPCycle: 03
BitCanGeosciences & Engineering Inc.
0.0 0.5 1.0 1.5 2.0 2.5 3.0lg(relative time)
�0.4
�0.2
0.0
0.2
0.4
0.6
0.8
lg(B
HP)
1st Slope: 0.92
2nd Slope: 0.54
lg(�P)-lg(�t)
Mini-Frac Test Analysis 17 http://www.bitcange.com

Well: 13-13Depth: 484.0mFormation: GPCycle: 03
BitCanGeosciences & Engineering Inc.
0 5 10 15 20 25 30 35Sqrt(relative time)
5
6
7
8
9
10
11
12
BH
P(M
Pa)
Closure Pressure: 7.579 MPa
P-�
�t
Mini-Frac Test Analysis 18 http://www.bitcange.com

Well: 13-13Depth: 484.0mFormation: GPCycle: 03
BitCanGeosciences & Engineering Inc.
0.0 0.5 1.0 1.5 2.0 2.5 3.0 3.5lg(�t)
�0.6
�0.4
�0.2
0.0
0.2
0.4
0.6
0.8
lg(�
tdP/d
�
t)1st Slope: 0.34
2nd Slope: 0.43
3rd Slope: 0.06
lg(�tdP/d�t)-lg(�t)
Mini-Frac Test Analysis 19 http://www.bitcange.com

Well: 13-13Depth: 484.0mFormation: GPCycle: 04
BitCanGeosciences & Engineering Inc.
0 100 200 300 400 500 600Relative time(s)
5
6
7
8
9
10
11
12
BH
P(M
Pa)
BHP and Injection Rate
�20
0
20
40
60
80
100
120
140
Inje
ctio
n r
ate
(L/min
)
BHPInjection rate
Mini-Frac Test Analysis 20 http://www.bitcange.com

Well: 13-13Depth: 484.0mFormation: GPCycle: 04
BitCanGeosciences & Engineering Inc.
�5 0 5 10 15 20Injection volume(L)
5
6
7
8
9
10
11
BH
P(MPa)
Reopen Pressure: 9.94 MPa
P-V
Mini-Frac Test Analysis 21 http://www.bitcange.com

Well: 13-13Depth: 484.0mFormation: GPCycle: 04
BitCanGeosciences & Engineering Inc.
0 20 40 60 80 100Relative time(s)
6.5
7.0
7.5
8.0
8.5
9.0
9.5
BH
P(M
Pa)
ISIP: 8.516 MPa
P-�t
Mini-Frac Test Analysis 22 http://www.bitcange.com

Well: 13-13Depth: 484.0mFormation: GPCycle: 04
BitCanGeosciences & Engineering Inc.
0.0 0.5 1.0 1.5 2.0 2.5lg(relative time)
�0.8
�0.6
�0.4
�0.2
0.0
0.2
0.4
0.6
0.8
lg(B
HP)
1st Slope: 1.07
2nd Slope: 0.17
lg(�P)-lg(�t)
Mini-Frac Test Analysis 23 http://www.bitcange.com

Well: 13-13Depth: 484.0mFormation: GPCycle: 04
BitCanGeosciences & Engineering Inc.
0 2 4 6 8 10 12 14 16 18Sqrt(relative time)
5.0
5.5
6.0
6.5
7.0
7.5
8.0
8.5
9.0
9.5
BH
P(M
Pa)
Closure Pressure: 7.342 MPa
P-�
�t
Mini-Frac Test Analysis 24 http://www.bitcange.com

Well: 13-13Depth: 484.0mFormation: GPCycle: 04
BitCanGeosciences & Engineering Inc.
�12 �10 �8 �6 �4 �2 0Flow back volume(L)
5.0
5.5
6.0
6.5
7.0
7.5
8.0
8.5
9.0
BH
P(M
Pa)
Closure Pressure: 7.37 MPa
1st Compliance: 4.57 L/MPa
2nd Compliance: 4.13 L/MPa
P-backV
Mini-Frac Test Analysis 25 http://www.bitcange.com

Well: 13-13Depth: 484.0mFormation: GPCycle: 04
BitCanGeosciences & Engineering Inc.
0.0 0.5 1.0 1.5 2.0 2.5lg(�t)
�0.8
�0.6
�0.4
�0.2
0.0
0.2
0.4
0.6
0.8
lg(�
tdP/d
�
t)1st Slope: -1.21
2nd Slope: 0.62
3rd Slope: 0.03
lg(�tdP/d�t)-lg(�t)
Mini-Frac Test Analysis 26 http://www.bitcange.com

Well: 13-13Depth: 484.0mFormation: GPCycle: 05
BitCanGeosciences & Engineering Inc.
0 50 100 150 200 250 300 350 400 450Relative time(s)
4
5
6
7
8
9
10
11
12
BH
P(M
Pa)
BHP and Injection Rate
�20
0
20
40
60
80
100
120
Inje
ctio
n r
ate
(L/min
)
BHPInjection rate
Mini-Frac Test Analysis 27 http://www.bitcange.com

Well: 13-13Depth: 484.0mFormation: GPCycle: 05
BitCanGeosciences & Engineering Inc.
0 10 20 30 40 50 60 70Injection volume(L)
6
7
8
9
10
11
12
BH
P(MPa)
Reopen Pressure: 10.519 MPa
P-V
Mini-Frac Test Analysis 28 http://www.bitcange.com

Well: 13-13Depth: 484.0mFormation: GPCycle: 05
BitCanGeosciences & Engineering Inc.
0 5 10 15 20 25 30 35Relative time(s)
7.6
7.8
8.0
8.2
8.4
8.6
8.8
9.0
9.2
9.4
BH
P(M
Pa)
ISIP: 8.588 MPa
P-�t
Mini-Frac Test Analysis 29 http://www.bitcange.com

Well: 13-13Depth: 484.0mFormation: GPCycle: 05
BitCanGeosciences & Engineering Inc.
0.0 0.5 1.0 1.5 2.0 2.5lg(relative time)
�0.4
�0.2
0.0
0.2
0.4
0.6
lg(B
HP)
1st Slope: 0.13
2nd Slope: 0.0
lg(�P)-lg(�t)
Mini-Frac Test Analysis 30 http://www.bitcange.com

Well: 13-13Depth: 484.0mFormation: GPCycle: 05
BitCanGeosciences & Engineering Inc.
0 2 4 6 8 10 12 14 16 18Sqrt(relative time)
5.0
5.5
6.0
6.5
7.0
7.5
8.0
8.5
9.0
9.5
BH
P(M
Pa)
Closure Pressure: 7.493 MPa
P-�
�t
Mini-Frac Test Analysis 31 http://www.bitcange.com

Well: 13-13Depth: 484.0mFormation: GPCycle: 05
BitCanGeosciences & Engineering Inc.
�14 �12 �10 �8 �6 �4 �2 0 2Flow back volume(L)
5.0
5.5
6.0
6.5
7.0
7.5
8.0
8.5
9.0
9.5
BH
P(M
Pa)
Closure Pressure: 7.395 MPa
1st Compliance: 4.66 L/MPa
2nd Compliance: 4.05 L/MPa
P-backV
Mini-Frac Test Analysis 32 http://www.bitcange.com

Well: 13-13Depth: 484.0mFormation: GPCycle: 05
BitCanGeosciences & Engineering Inc.
0.0 0.5 1.0 1.5 2.0 2.5lg(�t)
�0.8
�0.6
�0.4
�0.2
0.0
0.2
0.4
lg(�
tdP/d
�
t)1st Slope: -0.76
2nd Slope: 0.45
3rd Slope: 0.04
lg(�tdP/d�t)-lg(�t)
Mini-Frac Test Analysis 33 http://www.bitcange.com

Well: 13-13Depth: 484.0mFormation: GPCycle: 06
BitCanGeosciences & Engineering Inc.
0 50 100 150 200 250 300 350 400 450Relative time(s)
5
6
7
8
9
10
11
12
BH
P(M
Pa)
BHP and Injection Rate
�20
0
20
40
60
80
100
120
Inje
ctio
n r
ate
(L/min
)
BHPInjection rate
Mini-Frac Test Analysis 34 http://www.bitcange.com

Well: 13-13Depth: 484.0mFormation: GPCycle: 06
BitCanGeosciences & Engineering Inc.
0 10 20 30 40 50 60 70 80Injection volume(L)
5
6
7
8
9
10
11
12
BH
P(MPa)
Reopen Pressure: 10.058 MPa
P-V
Mini-Frac Test Analysis 35 http://www.bitcange.com

Well: 13-13Depth: 484.0mFormation: GPCycle: 06
BitCanGeosciences & Engineering Inc.
0 5 10 15 20Relative time(s)
7.5
8.0
8.5
9.0
9.5
10.0
BH
P(M
Pa)
ISIP: 8.838 MPa
P-�t
Mini-Frac Test Analysis 36 http://www.bitcange.com

Well: 13-13Depth: 484.0mFormation: GPCycle: 06
BitCanGeosciences & Engineering Inc.
0.0 0.5 1.0 1.5 2.0 2.5lg(relative time)
�0.4
�0.2
0.0
0.2
0.4
0.6
0.8
lg(B
HP)
1st Slope: 1.02
2nd Slope: 0.1
lg(�P)-lg(�t)
Mini-Frac Test Analysis 37 http://www.bitcange.com

Well: 13-13Depth: 484.0mFormation: GPCycle: 06
BitCanGeosciences & Engineering Inc.
0 2 4 6 8 10 12 14 16 18Sqrt(relative time)
5
6
7
8
9
10
BH
P(M
Pa)
Closure Pressure: 7.537 MPa
P-�
�t
Mini-Frac Test Analysis 38 http://www.bitcange.com

Well: 13-13Depth: 484.0mFormation: GPCycle: 06
BitCanGeosciences & Engineering Inc.
�18 �16 �14 �12 �10 �8 �6 �4 �2 0Flow back volume(L)
5.0
5.5
6.0
6.5
7.0
7.5
8.0
8.5
9.0
BH
P(M
Pa)
Closure Pressure: 7.298 MPa
1st Compliance: 7.48 L/MPa
2nd Compliance: 4.46 L/MPa
P-backV
Mini-Frac Test Analysis 39 http://www.bitcange.com

Well: 13-13Depth: 484.0mFormation: GPCycle: 06
BitCanGeosciences & Engineering Inc.
0.0 0.5 1.0 1.5 2.0 2.5lg(�t)
�1.0
�0.8
�0.6
�0.4
�0.2
0.0
0.2
0.4
0.6
0.8
lg(�
tdP/d
�
t)1st Slope: -1.46
2nd Slope: 0.49
3rd Slope: 0.07
lg(�tdP/d�t)-lg(�t)
Mini-Frac Test Analysis 40 http://www.bitcange.com

Well: 13-13Depth: 484.0mFormation: GPCycle: 07
BitCanGeosciences & Engineering Inc.
0 100 200 300 400 500Relative time(s)
5
6
7
8
9
10
11
BH
P(M
Pa)
BHP and Injection Rate
�20
0
20
40
60
80
100
120
140
Inje
ctio
n r
ate
(L/min
)
BHPInjection rate
Mini-Frac Test Analysis 41 http://www.bitcange.com

Well: 13-13Depth: 484.0mFormation: GPCycle: 07
BitCanGeosciences & Engineering Inc.
�20 0 20 40 60 80 100Injection volume(L)
5
6
7
8
9
10
11
BH
P(MPa)
Reopen Pressure: 10.221 MPa
P-V
Mini-Frac Test Analysis 42 http://www.bitcange.com

Well: 13-13Depth: 484.0mFormation: GPCycle: 07
BitCanGeosciences & Engineering Inc.
0 5 10 15 20 25 30 35Relative time(s)
8.0
8.5
9.0
9.5
BH
P(M
Pa)
ISIP: 8.357 MPa
P-�t
Mini-Frac Test Analysis 43 http://www.bitcange.com

Well: 13-13Depth: 484.0mFormation: GPCycle: 07
BitCanGeosciences & Engineering Inc.
0.0 0.5 1.0 1.5 2.0 2.5lg(relative time)
�0.6
�0.4
�0.2
0.0
0.2
0.4
0.6
0.8
lg(B
HP)
1st Slope: 1.14
2nd Slope: 0.08
lg(�P)-lg(�t)
Mini-Frac Test Analysis 44 http://www.bitcange.com

Well: 13-13Depth: 484.0mFormation: GPCycle: 07
BitCanGeosciences & Engineering Inc.
0 2 4 6 8 10 12 14 16 18Sqrt(relative time)
5.5
6.0
6.5
7.0
7.5
8.0
8.5
9.0
9.5
10.0
BH
P(M
Pa)
Closure Pressure: 7.68 MPa
P-�
�t
Mini-Frac Test Analysis 45 http://www.bitcange.com

Well: 13-13Depth: 484.0mFormation: GPCycle: 07
BitCanGeosciences & Engineering Inc.
�16 �14 �12 �10 �8 �6 �4 �2 0Flow back volume(L)
5.0
5.5
6.0
6.5
7.0
7.5
8.0
8.5
9.0
BH
P(M
Pa)
Closure Pressure: 7.477 MPa
1st Compliance: 8.6 L/MPa
2nd Compliance: 4.06 L/MPa
P-backV
Mini-Frac Test Analysis 46 http://www.bitcange.com

Well: 13-13Depth: 484.0mFormation: GPCycle: 07
BitCanGeosciences & Engineering Inc.
0.0 0.5 1.0 1.5 2.0 2.5lg(�t)
�1.5
�1.0
�0.5
0.0
0.5
1.0
lg(�
tdP/d
�
t)1st Slope: -3.22
2nd Slope: 0.56
3rd Slope: 0.08
lg(�tdP/d�t)-lg(�t)
Mini-Frac Test Analysis 47 http://www.bitcange.com

Well: 13-13Depth: 484.0mFormation: GPCycle: 1 to 7
BitCanGeosciences & Engineering Inc.
0 1 2 3 4 5 6 7 8Cycle
0
2
4
6
8
10
12
Pre
ssure
(MPa)
Summary
P_reopen
ISIPPc, sqrtPc, compliance
Mini-Frac Test Analysis 48 http://www.bitcange.com

Well: 13-13Depth: 484.0mFormation: GPCycle: 1 to 7
BitCanGeosciences & Engineering Inc.
Characteristic Pressures and Compliances
Cycle # P reopen ISIP Pc, sqrt Pc, compliance Cb, inj Cf, back Cb, back
(MPa) (MPa) (MPa) (MPa) (L/MPa) (L/MPa) (L/MPa)
1 11.413 9.496 7.994 6.908 2.50 2.13 2.56
2 9.802 9.578 8.040 0.000 2.47 0.00 0.00
3 9.558 9.660 7.579 0.000 2.37 0.00 0.00
4 9.940 8.516 7.342 7.370 2.28 4.57 4.13
5 10.519 8.588 7.493 7.395 2.40 4.66 4.05
6 10.058 8.838 7.537 7.298 2.40 7.48 4.46
7 10.221 8.357 7.680 7.477 2.47 8.60 4.06
Mini-Frac Test Analysis 49 http://www.bitcange.com

ANALYSIS PLOTS
WELL: PENGROWTH LNDBRGHWELL 13-13-58-5W4
Test 4: GP Zone #3 at 476 m

Mini-Frac Test
pres
sure
(MP
a)
0
2
4
6
8
10
flow rate(L/m
in)
-20
0
20
40
60
80
100
120
time(s)2,000 3,000 4,000 5,000
0 1 2 3 4 5
Pump Preussure Well Head Preussure High Flow Rate Low Flow Rate Flow Back Rate
BitCanGeosciences & Engineering Inc. www.bitcange.com
Client:Well:Depth:
Formation:Start @:
Pengrowth Energy Corp13-13-58-5W4476
unknown shaleFri Mar 4 07:30:08 2011
Generated by MiniMonitor

Mini-Frac Test
pres
sure
(MP
a)
0
2
4
6
8
10
volume(L)
0
200
400
600
800
1,000
1,200
time(s)2,000 3,000 4,000 5,000
0 1 2 3 4 5
Pump Preussure Well Head Preussure Volume Injected
BitCanGeosciences & Engineering Inc. www.bitcange.com
Client:Well:Depth:
Formation:Start @:
Pengrowth Energy Corp13-13-58-5W4476
unknown shaleFri Mar 4 07:30:08 2011
Generated by MiniMonitor

Well: 13-13Depth: 476.0mFormation: Unknown ShaleCycle: 01
BitCanGeosciences & Engineering Inc.
0 100 200 300 400 500 600 700 800 900Relative time(s)
4
6
8
10
12
14
16
BH
P(M
Pa)
BHP and Injection Rate
�10
0
10
20
30
40
50
60
70
Inje
ctio
n r
ate
(L/min
)
BHPInjection rate
Mini-Frac Test Analysis 1 http://www.bitcange.com

Well: 13-13Depth: 476.0mFormation: Unknown ShaleCycle: 01
BitCanGeosciences & Engineering Inc.
�10 0 10 20 30 40 50Injection volume(L)
6
7
8
9
10
11
12
13
14
15
BH
P(MPa)
Reopen Pressure: 13.515 MPa
P-V
Mini-Frac Test Analysis 2 http://www.bitcange.com

Well: 13-13Depth: 476.0mFormation: Unknown ShaleCycle: 01
BitCanGeosciences & Engineering Inc.
0 50 100 150 200Relative time(s)
5.0
5.5
6.0
6.5
7.0
7.5
8.0
8.5
9.0
9.5
BH
P(M
Pa)
ISIP: 7.671 MPa
P-�t
Mini-Frac Test Analysis 3 http://www.bitcange.com

Well: 13-13Depth: 476.0mFormation: Unknown ShaleCycle: 01
BitCanGeosciences & Engineering Inc.
0.0 0.5 1.0 1.5 2.0 2.5lg(relative time)
�0.6
�0.4
�0.2
0.0
0.2
0.4
0.6
lg(B
HP)
1st Slope: 0.93
2nd Slope: 0.22
lg(�P)-lg(�t)
Mini-Frac Test Analysis 4 http://www.bitcange.com

Well: 13-13Depth: 476.0mFormation: Unknown ShaleCycle: 01
BitCanGeosciences & Engineering Inc.
0 5 10 15 20 25Sqrt(relative time)
4
5
6
7
8
9
10
BH
P(M
Pa)
Closure Pressure: 7.165 MPa
P-�
�t
Mini-Frac Test Analysis 5 http://www.bitcange.com

Well: 13-13Depth: 476.0mFormation: Unknown ShaleCycle: 01
BitCanGeosciences & Engineering Inc.
�0.9 �0.8 �0.7 �0.6 �0.5 �0.4 �0.3 �0.2 �0.1 0.0Flow back volume(L)
6.5
7.0
7.5
8.0
8.5
9.0
BH
P(M
Pa)
Closure Pressure: 6.953 MPa
1st Compliance: 0.93 L/MPa
2nd Compliance: 1.66 L/MPa
P-backV
Mini-Frac Test Analysis 6 http://www.bitcange.com

Well: 13-13Depth: 476.0mFormation: Unknown ShaleCycle: 01
BitCanGeosciences & Engineering Inc.
0.0 0.5 1.0 1.5 2.0 2.5 3.0lg(�t)
�0.6
�0.4
�0.2
0.0
0.2
lg(�
tdP/d
�
t)1st Slope: -0.49
2nd Slope: 0.57
3rd Slope: 0.02
lg(�tdP/d�t)-lg(�t)
Mini-Frac Test Analysis 7 http://www.bitcange.com

Well: 13-13Depth: 476.0mFormation: Unknown ShaleCycle: 02
BitCanGeosciences & Engineering Inc.
0 100 200 300 400 500 600 700 800 900Relative time(s)
4
5
6
7
8
9
10
BH
P(M
Pa)
BHP and Injection Rate
�10
0
10
20
30
40
50
60
70
Inje
ctio
n r
ate
(L/min
)
BHPInjection rate
Mini-Frac Test Analysis 8 http://www.bitcange.com

Well: 13-13Depth: 476.0mFormation: Unknown ShaleCycle: 02
BitCanGeosciences & Engineering Inc.
0 10 20 30 40 50 60Injection volume(L)
4
5
6
7
8
9
10
BH
P(MPa)
Reopen Pressure: 9.369 MPa
P-V
Mini-Frac Test Analysis 9 http://www.bitcange.com

Well: 13-13Depth: 476.0mFormation: Unknown ShaleCycle: 02
BitCanGeosciences & Engineering Inc.
0 10 20 30 40 50 60 70Relative time(s)
6.8
7.0
7.2
7.4
7.6
7.8
8.0
8.2
BH
P(M
Pa)
ISIP: 7.576 MPa
P-�t
Mini-Frac Test Analysis 10 http://www.bitcange.com

Well: 13-13Depth: 476.0mFormation: Unknown ShaleCycle: 02
BitCanGeosciences & Engineering Inc.
0.0 0.5 1.0 1.5 2.0 2.5 3.0lg(relative time)
�0.6
�0.4
�0.2
0.0
0.2
0.4
0.6
lg(B
HP)
1st Slope: 0.7
2nd Slope: 0.13
lg(�P)-lg(�t)
Mini-Frac Test Analysis 11 http://www.bitcange.com

Well: 13-13Depth: 476.0mFormation: Unknown ShaleCycle: 02
BitCanGeosciences & Engineering Inc.
0 5 10 15 20 25 30Sqrt(relative time)
5.0
5.5
6.0
6.5
7.0
7.5
8.0
8.5
BH
P(M
Pa)
Closure Pressure: 6.664 MPa
P-�
�t
Mini-Frac Test Analysis 12 http://www.bitcange.com

Well: 13-13Depth: 476.0mFormation: Unknown ShaleCycle: 02
BitCanGeosciences & Engineering Inc.
0.0 0.5 1.0 1.5 2.0 2.5 3.0lg(�t)
�1.0
�0.8
�0.6
�0.4
�0.2
0.0
0.2
0.4
lg(�
tdP/d
�
t)1st Slope: -0.94
2nd Slope: 0.8
3rd Slope: 0.02
lg(�tdP/d�t)-lg(�t)
Mini-Frac Test Analysis 13 http://www.bitcange.com

Well: 13-13Depth: 476.0mFormation: Unknown ShaleCycle: 03
BitCanGeosciences & Engineering Inc.
0 100 200 300 400 500 600Relative time(s)
4
5
6
7
8
9
10
BH
P(M
Pa)
BHP and Injection Rate
�10
0
10
20
30
40
50
60
Inje
ctio
n r
ate
(L/min
)
BHPInjection rate
Mini-Frac Test Analysis 14 http://www.bitcange.com

Well: 13-13Depth: 476.0mFormation: Unknown ShaleCycle: 03
BitCanGeosciences & Engineering Inc.
0 5 10 15 20 25 30Injection volume(L)
5
6
7
8
9
10
BH
P(MPa)
Reopen Pressure: 8.602 MPa
P-V
Mini-Frac Test Analysis 15 http://www.bitcange.com

Well: 13-13Depth: 476.0mFormation: Unknown ShaleCycle: 03
BitCanGeosciences & Engineering Inc.
0 5 10 15 20 25 30 35 40Relative time(s)
6.6
6.8
7.0
7.2
7.4
7.6
7.8
8.0
8.2
8.4
BH
P(M
Pa)
ISIP: 7.676 MPa
P-�t
Mini-Frac Test Analysis 16 http://www.bitcange.com

Well: 13-13Depth: 476.0mFormation: Unknown ShaleCycle: 03
BitCanGeosciences & Engineering Inc.
0.0 0.5 1.0 1.5 2.0 2.5 3.0lg(relative time)
�0.6
�0.4
�0.2
0.0
0.2
0.4
0.6
lg(B
HP)
1st Slope: 0.98
2nd Slope: 0.18
lg(�P)-lg(�t)
Mini-Frac Test Analysis 17 http://www.bitcange.com

Well: 13-13Depth: 476.0mFormation: Unknown ShaleCycle: 03
BitCanGeosciences & Engineering Inc.
0 5 10 15 20Sqrt(relative time)
4.5
5.0
5.5
6.0
6.5
7.0
7.5
8.0
8.5
BH
P(M
Pa)
Closure Pressure: 6.498 MPa
P-�
�t
Mini-Frac Test Analysis 18 http://www.bitcange.com

Well: 13-13Depth: 476.0mFormation: Unknown ShaleCycle: 03
BitCanGeosciences & Engineering Inc.
�6 �5 �4 �3 �2 �1 0Flow back volume(L)
5.5
6.0
6.5
7.0
7.5
8.0
8.5
BH
P(M
Pa)
Closure Pressure: 6.488 MPa
1st Compliance: 4.42 L/MPa
2nd Compliance: 3.69 L/MPa
P-backV
Mini-Frac Test Analysis 19 http://www.bitcange.com

Well: 13-13Depth: 476.0mFormation: Unknown ShaleCycle: 03
BitCanGeosciences & Engineering Inc.
0.0 0.5 1.0 1.5 2.0 2.5 3.0lg(�t)
�0.8
�0.6
�0.4
�0.2
0.0
0.2
0.4
0.6
lg(�
tdP/d
�
t)1st Slope: -0.52
2nd Slope: 0.51
3rd Slope: 1.06
lg(�tdP/d�t)-lg(�t)
Mini-Frac Test Analysis 20 http://www.bitcange.com
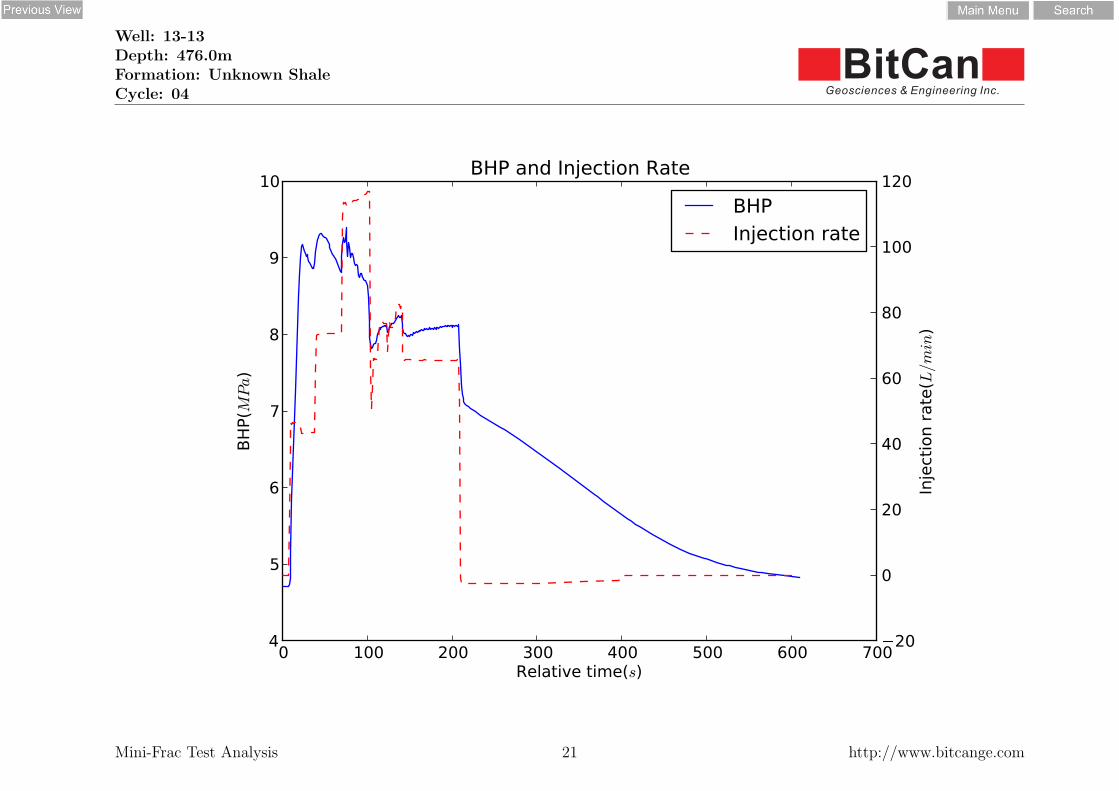
Well: 13-13Depth: 476.0mFormation: Unknown ShaleCycle: 04
BitCanGeosciences & Engineering Inc.
0 100 200 300 400 500 600 700Relative time(s)
4
5
6
7
8
9
10
BH
P(M
Pa)
BHP and Injection Rate
�20
0
20
40
60
80
100
120
Inje
ctio
n r
ate
(L/min
)
BHPInjection rate
Mini-Frac Test Analysis 21 http://www.bitcange.com
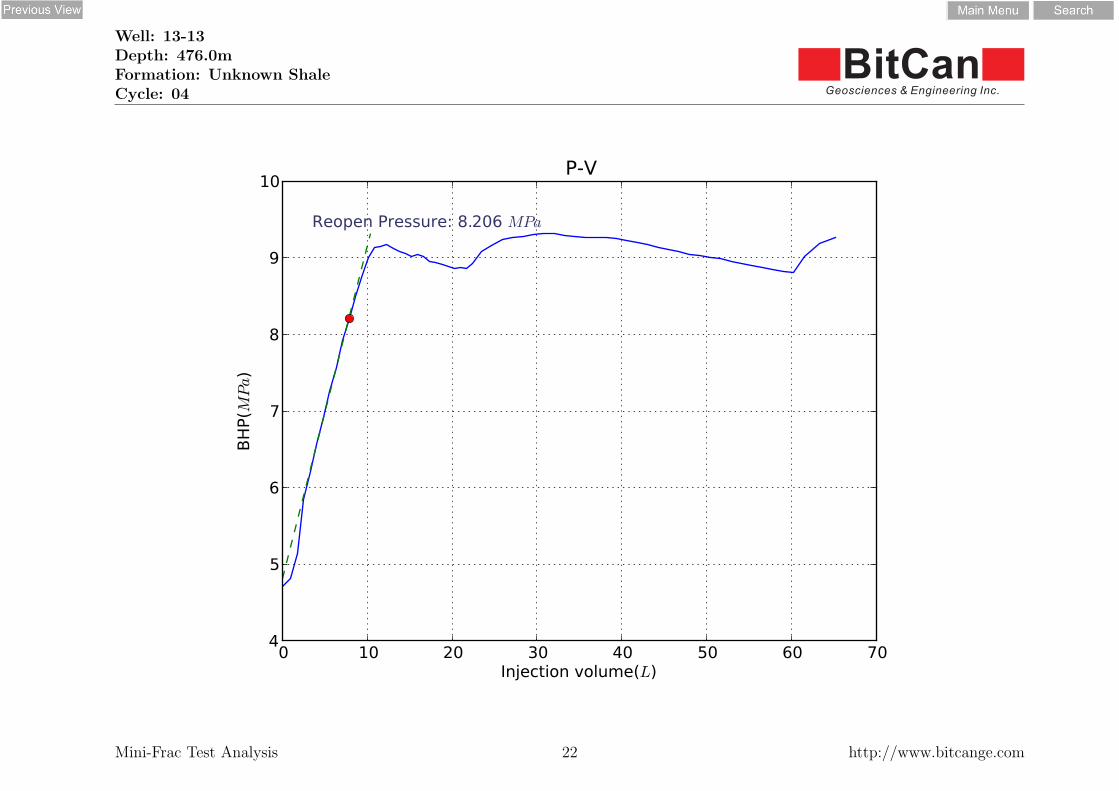
Well: 13-13Depth: 476.0mFormation: Unknown ShaleCycle: 04
BitCanGeosciences & Engineering Inc.
0 10 20 30 40 50 60 70Injection volume(L)
4
5
6
7
8
9
10
BH
P(MPa)
Reopen Pressure: 8.206 MPa
P-V
Mini-Frac Test Analysis 22 http://www.bitcange.com

Well: 13-13Depth: 476.0mFormation: Unknown ShaleCycle: 04
BitCanGeosciences & Engineering Inc.
0 20 40 60 80 100 120Relative time(s)
6.2
6.4
6.6
6.8
7.0
7.2
7.4
7.6
7.8
8.0
BH
P(M
Pa)
ISIP: 7.331 MPa
P-�t
Mini-Frac Test Analysis 23 http://www.bitcange.com

Well: 13-13Depth: 476.0mFormation: Unknown ShaleCycle: 04
BitCanGeosciences & Engineering Inc.
0.0 0.5 1.0 1.5 2.0 2.5 3.0lg(relative time)
�0.8
�0.6
�0.4
�0.2
0.0
0.2
0.4
0.6
lg(B
HP)
1st Slope: 1.19
2nd Slope: 0.14
lg(�P)-lg(�t)
Mini-Frac Test Analysis 24 http://www.bitcange.com

Well: 13-13Depth: 476.0mFormation: Unknown ShaleCycle: 04
BitCanGeosciences & Engineering Inc.
0 5 10 15 20 25Sqrt(relative time)
4.5
5.0
5.5
6.0
6.5
7.0
7.5
8.0
BH
P(M
Pa)
Closure Pressure: 6.717 MPa
P-�
�t
Mini-Frac Test Analysis 25 http://www.bitcange.com

Well: 13-13Depth: 476.0mFormation: Unknown ShaleCycle: 04
BitCanGeosciences & Engineering Inc.
�8 �7 �6 �5 �4 �3 �2 �1 0Flow back volume(L)
5.5
6.0
6.5
7.0
7.5
8.0
BH
P(M
Pa)
Closure Pressure: 6.505 MPa
1st Compliance: 6.63 L/MPa
2nd Compliance: 4.01 L/MPa
P-backV
Mini-Frac Test Analysis 26 http://www.bitcange.com

Well: 13-13Depth: 476.0mFormation: Unknown ShaleCycle: 04
BitCanGeosciences & Engineering Inc.
0.0 0.5 1.0 1.5 2.0 2.5 3.0lg(�t)
�1.0
�0.5
0.0
0.5lg
(�
tdP/d
�
t)1st Slope: -1.1
2nd Slope: 0.67
3rd Slope: 1.22
lg(�tdP/d�t)-lg(�t)
Mini-Frac Test Analysis 27 http://www.bitcange.com

Well: 13-13Depth: 476.0mFormation: Unknown ShaleCycle: 05
BitCanGeosciences & Engineering Inc.
0 100 200 300 400 500 600Relative time(s)
4
5
6
7
8
9
10
BH
P(M
Pa)
BHP and Injection Rate
�20
0
20
40
60
80
100
120
Inje
ctio
n r
ate
(L/min
)
BHPInjection rate
Mini-Frac Test Analysis 28 http://www.bitcange.com

Well: 13-13Depth: 476.0mFormation: Unknown ShaleCycle: 05
BitCanGeosciences & Engineering Inc.
�5 0 5 10 15 20 25 30Injection volume(L)
4
5
6
7
8
9
10
BH
P(MPa)
Reopen Pressure: 8.708 MPa
P-V
Mini-Frac Test Analysis 29 http://www.bitcange.com

Well: 13-13Depth: 476.0mFormation: Unknown ShaleCycle: 05
BitCanGeosciences & Engineering Inc.
0 5 10 15 20 25Relative time(s)
7.0
7.2
7.4
7.6
7.8
8.0
8.2
8.4
BH
P(M
Pa)
ISIP: 7.52 MPa
P-�t
Mini-Frac Test Analysis 30 http://www.bitcange.com

Well: 13-13Depth: 476.0mFormation: Unknown ShaleCycle: 05
BitCanGeosciences & Engineering Inc.
0.0 0.5 1.0 1.5 2.0 2.5 3.0lg(relative time)
�0.4
�0.2
0.0
0.2
0.4
0.6
lg(B
HP)
1st Slope: 0.93
2nd Slope: 0.09
lg(�P)-lg(�t)
Mini-Frac Test Analysis 31 http://www.bitcange.com

Well: 13-13Depth: 476.0mFormation: Unknown ShaleCycle: 05
BitCanGeosciences & Engineering Inc.
0 5 10 15 20Sqrt(relative time)
4.5
5.0
5.5
6.0
6.5
7.0
7.5
8.0
8.5
BH
P(M
Pa)
Closure Pressure: 6.844 MPa
P-�
�t
Mini-Frac Test Analysis 32 http://www.bitcange.com

Well: 13-13Depth: 476.0mFormation: Unknown ShaleCycle: 05
BitCanGeosciences & Engineering Inc.
�8 �7 �6 �5 �4 �3 �2 �1 0 1Flow back volume(L)
5.5
6.0
6.5
7.0
7.5
8.0
BH
P(M
Pa)
Closure Pressure: 6.582 MPa
1st Compliance: 6.3 L/MPa
2nd Compliance: 3.95 L/MPa
P-backV
Mini-Frac Test Analysis 33 http://www.bitcange.com

Well: 13-13Depth: 476.0mFormation: Unknown ShaleCycle: 05
BitCanGeosciences & Engineering Inc.
0.0 0.5 1.0 1.5 2.0 2.5 3.0lg(�t)
�1.0
�0.5
0.0
0.5lg
(�
tdP/d
�
t)1st Slope: -2.19
2nd Slope: 0.51
3rd Slope: 1.17
lg(�tdP/d�t)-lg(�t)
Mini-Frac Test Analysis 34 http://www.bitcange.com

Well: 13-13Depth: 476.0mFormation: Unknown ShaleCycle: 06
BitCanGeosciences & Engineering Inc.
0 100 200 300 400 500 600 700 800Relative time(s)
4
5
6
7
8
9
10
BH
P(M
Pa)
BHP and Injection Rate
�20
0
20
40
60
80
100
120
Inje
ctio
n r
ate
(L/min
)
BHPInjection rate
Mini-Frac Test Analysis 35 http://www.bitcange.com

Well: 13-13Depth: 476.0mFormation: Unknown ShaleCycle: 06
BitCanGeosciences & Engineering Inc.
�50 0 50 100 150 200Injection volume(L)
4
5
6
7
8
9
10
BH
P(MPa)
Reopen Pressure: 8.903 MPa
P-V
Mini-Frac Test Analysis 36 http://www.bitcange.com

Well: 13-13Depth: 476.0mFormation: Unknown ShaleCycle: 06
BitCanGeosciences & Engineering Inc.
0 20 40 60 80 100 120Relative time(s)
6.8
7.0
7.2
7.4
7.6
7.8
8.0
8.2
BH
P(M
Pa)
ISIP: 7.541 MPa
P-�t
Mini-Frac Test Analysis 37 http://www.bitcange.com

Well: 13-13Depth: 476.0mFormation: Unknown ShaleCycle: 06
BitCanGeosciences & Engineering Inc.
0.0 0.5 1.0 1.5 2.0 2.5 3.0lg(relative time)
�0.3
�0.2
�0.1
0.0
0.1
0.2
0.3
0.4
0.5
lg(B
HP)
1st Slope: 0.26
2nd Slope: 0.08
lg(�P)-lg(�t)
Mini-Frac Test Analysis 38 http://www.bitcange.com

Well: 13-13Depth: 476.0mFormation: Unknown ShaleCycle: 06
BitCanGeosciences & Engineering Inc.
0 5 10 15 20 25Sqrt(relative time)
5.0
5.5
6.0
6.5
7.0
7.5
8.0
8.5
BH
P(M
Pa)
Closure Pressure: 6.935 MPa
P-�
�t
Mini-Frac Test Analysis 39 http://www.bitcange.com

Well: 13-13Depth: 476.0mFormation: Unknown ShaleCycle: 06
BitCanGeosciences & Engineering Inc.
�7 �6 �5 �4 �3 �2 �1 0Flow back volume(L)
6.2
6.4
6.6
6.8
7.0
7.2
7.4
7.6
BH
P(M
Pa)
Closure Pressure: 6.771 MPa
1st Compliance: 8.57 L/MPa
2nd Compliance: 4.46 L/MPa
P-backV
Mini-Frac Test Analysis 40 http://www.bitcange.com

Well: 13-13Depth: 476.0mFormation: Unknown ShaleCycle: 06
BitCanGeosciences & Engineering Inc.
0.0 0.5 1.0 1.5 2.0 2.5 3.0lg(�t)
�1.4
�1.2
�1.0
�0.8
�0.6
�0.4
�0.2
0.0
0.2
0.4
lg(�
tdP/d
�
t)1st Slope: -0.61
2nd Slope: 0.5
3rd Slope: 0.12
lg(�tdP/d�t)-lg(�t)
Mini-Frac Test Analysis 41 http://www.bitcange.com

Well: 13-13Depth: 476.0mFormation: Unknown ShaleCycle: 1 to 6
BitCanGeosciences & Engineering Inc.
0 1 2 3 4 5 6 7Cycle
0
2
4
6
8
10
12
14
Pre
ssure
(MPa)
Summary
P_reopen
ISIPPc, sqrtPc, compliance
Mini-Frac Test Analysis 42 http://www.bitcange.com
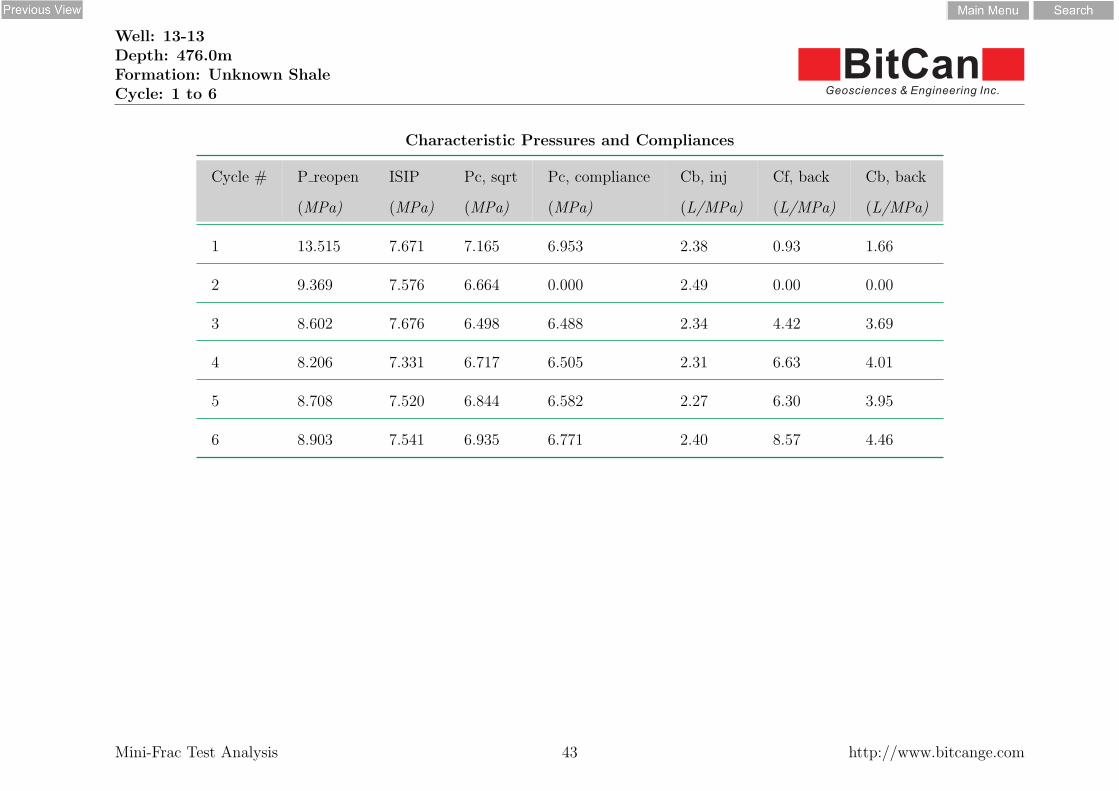
Well: 13-13Depth: 476.0mFormation: Unknown ShaleCycle: 1 to 6
BitCanGeosciences & Engineering Inc.
Characteristic Pressures and Compliances
Cycle # P reopen ISIP Pc, sqrt Pc, compliance Cb, inj Cf, back Cb, back
(MPa) (MPa) (MPa) (MPa) (L/MPa) (L/MPa) (L/MPa)
1 13.515 7.671 7.165 6.953 2.38 0.93 1.66
2 9.369 7.576 6.664 0.000 2.49 0.00 0.00
3 8.602 7.676 6.498 6.488 2.34 4.42 3.69
4 8.206 7.331 6.717 6.505 2.31 6.63 4.01
5 8.708 7.520 6.844 6.582 2.27 6.30 3.95
6 8.903 7.541 6.935 6.771 2.40 8.57 4.46
Mini-Frac Test Analysis 43 http://www.bitcange.com

MINI-FRAC TESTS AT PENGROWTH WELL: LNDBRGH 13-24-58-5W41 --- Summary of the tests and analysis results ---
Bin Xu and Y. Yuan2
BitCan Geosciences & Engineering Inc. Bay 8, 3200 - 14 Ave NE, Calgary, Alberta T2A 6J4
APEGGA Permit of Practice #07814
March 23, 2012
On behalf of Pengrowth, BitCan has conducted 3 mini-frac tests on Well: LNDBRGH 13-24-58-5W4:
1) General Petroleum (GP) caprock at 504 m TVD, 2) GP caprock at 514 m, 3) Lloydminster payzone at 530 m.
The test locations are denoted on the well log as shown in Figure 1. Objectives of the tests were to assess the in-situ stress conditions. This report will illustrate how the in-situ minimum stress was estimated as well as include a summary of the results.
1 DISCLAIMER: This report was prepared by BitCan Geosciences & Engineering Inc. (BitCan G&E) for the customer to whom it is addressed. It is confidential and may not be used by nor distributed among any third parties without permission from BitCan G&E. Information contained in this report, including any interpretation, research, analysis, data, results, estimates, conclusions, observations, recommendations, inferences, deductions and opinions made herein or otherwise communicated by BitCan G&E to customer at any time in connection with the services, reflects the best judgment by BitCan G&E at the time of the report, on available information. It is obtained after examining, studying, analyzing or testing, with reasonable diligence, various data collected via field tests, laboratory tests, historical databases in BitCan G&E or the public domain or provided by the customer. Assumptions are inevitably made as a basis for conclusions, recommendations or opinions expressed in the report. Assumptions may turn out to be incorrect, or the data on which the report is made may contain inaccuracies or omissions. Accordingly, BitCan G&E cannot and does not make any representation or warranty, either express or implied, as to any matter whatsoever, including, without limitation, the accuracy, completeness and correctness of the information contained in this report. Customer acknowledges that any action taken based on the information contained in this report shall be at its own sole risk and responsibility and no claims shall be made against BitCan G&E for any damages, including but not limited to injury to person or property, loss of life, loss of properties, loss of profit, loss of business, costs, expenses or other financial loss which may be caused, directly or indirectly, by the use of or reliance on the information contained in this report by the customer or third parties. 2 Responsible member under APEGGA rules.

Mini-frac tests Pengrowth 2 BitCan 01-121
Confidential BitCan G&E Inc.
1. General test procedure
The current mini-/micro-hydraulic fracturing tests are regarded as the most reliable method to assess the in-situ minimum stress. Via controlled well injection, it creates a fracture and propagates it to a sufficient distance from the injection well and into the formation. This ensures the fracture senses the far-field stress condition. Multiple cycles are run to verify the data consistency. The pressure data is analyzed to estimate the fracture closure pressure. The fracture closure pressure can then be equated to the in-situ minimum stress acting perpendicular to the fracture. Figures 2 - 4 plot the recorded pressure and rate history during each of the tests. Our tests employ new advancements and improvements to the mini-/micro-hydraulic fracturing stress test protocol currently used in the petroleum industry. Our testing procedure contains modifications tailored specifically for use in the oil sands and heavy oil development. Before commencing testing, the target interval was perforated. Water was then injected directly down into the casing. Testing began at the lowest depth and a packer was set between two adjacent perforation intervals. Multiple injection and shut-in cycles were used during each test. The injection pressures were monitored on-site via two surface pressure sensors: one close to the pumps and the other at the wellhead. A flow-back procedure was also used during each test. For the flow-back, a certain volume of water is manually withdrawn from the injection system (wellbore plus the fracture) during the shut-in period. The fracture closure is thus managed by the manually reduced pressure drop. A plot of BHP vs. cumulative injected volume (called compliance plot), can be used to detect the fracture closure. It is generally agreed that a properly executed and accurately metered flow-back yields better constrained data on the minimum stress. BitCan’s mini-frac test system can accurately control and meter the flown-back volume and rate. Figure 5 illustrates an example compliance plot and its interpreted fracture closure pressure.
2. Depth profile of the in-situ minimum stress
The interpreted in-situ minimum stresses (Smin) at the tested depths of Well 13-24 are shown in Figure 1. Their specific values are summarized in the following table: Pengrowth LNDBRGH 13-24-58-5W4
TVD, m Stress regimeMPag kPag/m MPa kPa/m
Lloydminster 530.0 6.164 to 7.228 11.63 to 13.64 11.342 21.40 V. fracGP #1 514.0 8.144 15.84 11.011 21.42 V. fracGP #2 504.0 7.057 14.00 10.796 21.42 V. frac
Min. stress Vert. stress
The range of Smin values for the Lloydminster test represents the lower and upper bounds. All the tests showed a vertical fracture stress regime ("V. frac") where the measured Smin is smaller than the vertical overburden stress and a vertical fracture is expected at these depths. However, the stress barrier effect still exists in which, the caprock has a larger Smin than the underlying

Mini-frac tests Pengrowth 3 BitCan 01-121
Confidential BitCan G&E Inc.
reservoir. This is favorable to the caprock integrity. A vertical fracture, if it is formed in the reservoir, requires a higher pressure to propagate upwards into the caprock. The hydraulic fracturing stimulation in the hard rock formations relies on such a stress contrast to contain the created fracture from propagating out of the target zone.
3. Analysis of field data
It is BitCan’s practices to place great deal of emphasis on acquiring high quality data during testing. As shown in Figures 2 to 4, multiple injection/shut-in cycles were used in each test. In all the tests, obvious formation breakdown occurred in the first injection cycle, i.e., a fracture was formed. In the subsequent injection cycles during each test, the pressure declined or stayed relatively flat, signalling the continuous fracture propagation. For each injection/shut-in cycle, the fracture closure pressure was interpreted by a linear flow (or sqrt(t)) plot. A system compliance plot was also used for the interpretations if the flow-back procedure was used. A good compliance plot, such as the one shown in Figure 5, should have two different slopes. Intersection of these two slopes denotes the fracture closure pressure. The initial slope, corresponding to before the fracture closes, is steeper while the second slope, reflecting the post-closure system compliance, is less inclined. The fracture closure pressures, interpreted as described above, are reconciled in Figures 6 to 8 between the different cycles in each test. In general, a consistent closure pressure is seen in each test among the different cycles. Moreover, different interpretation methods, sqrt(t) or compliance plots, all give a similar closure pressure. Combining these methods serves to enhance the interpretation accuracy. The pressure declined very fast during the shut-in period in the Lloydminster reservoir test at 530 mTVD (Figure 4). The lower bound fracture closure pressure is interpreted from the sqrt(t) plot while the Instantaneous Shut-in Pressure (ISIP) or fracture re-opening pressure (P_reopen) yields the upper bound (Figure 8). The GP caprock test at 504 m shows multiple linear slope intervals. The Smin value given in this report at this depth was taken as the average of the lower interpreted fracture closure pressures as shown in Figure 6. This is reasonable for the following two reasons: One is based on the conventional conservative engineering design principal. A Maximum Operating Pressure (MOP) based on a lower Smin value is inherently smaller or safer than MOP based on a higher Smin. Moreover, those shut-in cycles showing a lower closure pressure tend to have a better-defined fracture closure moment.

Mini-frac tests Pengrowth 4 BitCan 01-121
Confidential BitCan G&E Inc.
400
420
440
460
480
500
520
540
1500 2000 2500 3000
RHO, Kg/m^3
400
420
440
460
480
500
520
540
0 100 200
Dep
th, m
GR, GAPI
400
420
440
460
480
500
520
540
0 2 4 6 8 10 12 14
Stresses, MPa
Sv
Smin data measured
Figure 1: Summary of the in-situ minimum stresses measured from Well 13-24. Red dotted lines on the gamma log denote the mini-frac test intervals. “Sv” denotes the vertical overburden stress calculated from the density log. “Smin” in squares is the interpreted minimum stress from the mini-frac tests.

Mini-frac tests Pengrowth 5 BitCan 01-121
Confidential BitCan G&E Inc.
Figure 2: Recorded pressure history during the injection test in Pengrowth Well 13-24 at 504 m TVD. The bottomhole pressures (“BHP”) were calculated from a surface pressure sensor at the pump plus the hydraulic head (“Hydrostatic”) from the water column weight. The overburden weight (“Sv”) was calculated from the density log. “SHmin” was the in-situ minimum horizontal stress or fracture closure pressure interpreted from the pressure data. Similar conventions are used below unless otherwise specified.

Mini-frac tests Pengrowth 6 BitCan 01-121
Confidential BitCan G&E Inc.
Figure 3: Pressure history during the injection test in Pengrowth Well 13-24 at 514 m TVD.
Figure 4: Pressure history during the injection test in Pengrowth Well 13-24 at 530 m TVD.

Mini-frac tests Pengrowth 7 BitCan 01-121
Confidential BitCan G&E Inc.
Figure 5: Fracture closure pressure interpreted from the compliance plot for Cycle #4 in the GP #1 test at 514 mTVD. The negative volume on the x-axis denotes the flown-back volume.
1st compliance slope=11.4 L/MPa
2nd compliance slope=2.4 L/MPa

Mini-frac tests Pengrowth 8 BitCan 01-121
Confidential BitCan G&E Inc.
Figure 6: Various characteristic pressures interpreted from the test at 504 m, Well 13-24. “P_reopen” denotes the fracture reopening pressure where the fracture starts to re-open during the subsequent injection. “ISIP” is the Instantaneous Shut-In Pressure. “Pc, sqrt” refers to the fracture closure pressure extracted by the sqrt(dt)-plot. “Pc, compliance” is the fracture closure pressure extracted by the compliance plot from the flow-back tests. “Cb, inj (Cf, back or Cb, back)” refers to the initial system compliance during the injection (the system compliance before or after the fracture closure during the flowback). Similar convention for the legends holds in this report unless otherwise specified.
Fracture closure pressure=7.057 MPa

Mini-frac tests Pengrowth 9 BitCan 01-121
Confidential BitCan G&E Inc.
Figure 7: Various characteristic pressures interpreted from the test at 514 m.
Fracture closure pressure=8.144 MPa

Mini-frac tests Pengrowth 10 BitCan 01-121
Confidential BitCan G&E Inc.
Figure 8: Various characteristic pressures interpreted from the test at 530 m.
Lower-bound fracture closure pressure=6.164 MPa
Upper-bound fracture closure pressure=7.228 MPa

MINI-FRAC TESTS AT PENGROWTH WELL: LNDBRGH 13-24-58-5W41 --- Discussions on the tests, interpretation and results ---
Y. Yuan2 and Bin Xu
BitCan Geosciences & Engineering Inc. Bay 8, 3200 - 14 Ave NE, Calgary, Alberta T2A 6J4
APEGGA Permit of Practice #07814
March 23, 2012
3 mini-frac tests were completed on Well: LNDBRGH 13-24-58-5W4. An earlier report summarizes the general test procedure and presents the pressure/rate history and a summary of the interpreted fracture closure pressures from each test3. Another report compiles all the relevant analysis plots for each cycle in all of the tests4. The present report offers a further discussion on the tests and their interpretations. It will begin by describing an attempt to assess the relative error in the tests and their interpretations. It will then describe how to fully utilize the mini-frac test results for designing the field operation. In essence, the mini-frac tests are not merely to satisfy ERCB’s requirements. It can be designed, executed and used as a cost-effective geomechanical field test, proactively guiding the field operation.
1 DISCLAIMER: This report was prepared by BitCan Geosciences & Engineering Inc. (BitCan G&E) for the customer to whom it is addressed. It is confidential and may not be used by nor distributed among any third parties without permission from BitCan G&E. Information contained in this report, including any interpretation, research, analysis, data, results, estimates, conclusions, observations, recommendations, inferences, deductions and opinions made herein or otherwise communicated by BitCan G&E to customer at any time in connection with the services, reflects the best judgment by BitCan G&E at the time of the report, on available information. It is obtained after examining, studying, analyzing or testing, with reasonable diligence, various data collected via field tests, laboratory tests, historical databases in BitCan G&E or the public domain or provided by the customer. Assumptions are inevitably made as a basis for conclusions, recommendations or opinions expressed in the report. Assumptions may turn out to be incorrect, or the data on which the report is made may contain inaccuracies or omissions. Accordingly, BitCan G&E cannot and does not make any representation or warranty, either express or implied, as to any matter whatsoever, including, without limitation, the accuracy, completeness and correctness of the information contained in this report. Customer acknowledges that any action taken based on the information contained in this report shall be at its own sole risk and responsibility and no claims shall be made against BitCan G&E for any damages, including but not limited to injury to person or property, loss of life, loss of properties, loss of profit, loss of business, costs, expenses or other financial loss which may be caused, directly or indirectly, by the use of or reliance on the information contained in this report by the customer or third parties. 2 Responsible member under APEGGA rules. 3 Mini-frac tests at Pengrowth Well: LNDBRGH 13-24-58-5W4 --- Summary of the tests and analysis results --- BitCan report 01-121. 10 p. 4 Mini-frac tests at Pengrowth Well: LNDBRGH 13-24-58-5W4 --- Compilation of analysis plots. BitCan report 01-121 (3). 182 p.

Mini-frac tests Pengrowth 2 BitCan 01-121 (2)
Confidential BitCan G&E Inc.
1. Consistency check as an error analysis measure
As one of its quality control measures, BitCan uses multiple test cycles in each mini-frac test. In general, these cycles vary in the operating condition, being it with or without flow-back, different flow-back rates, or the flow-back rate being managed constant or variable as an outcome of the decreasing pressure difference. If a consistent fracture closure pressure can be derived despite these different operating conditions, it is normally a good indication of good quality tests and interpretations5. Therefore, a statistical analysis on the variation between the different cycles can offer a quantitative error analysis. Take the test at 530 m for example. The following table summarizes the fracture closure pressures interpreted from each cycle of the test using the sqrt(t) plot. The corresponding mean and standard deviation ("std dev") are calculated as shown below. The mean pressure is reported as the in-situ minimum stress in all of our communications and reports. For all the tests for all of BitCan's clients, the first two cycles are taken out of the analysis. The initial cycles may have not propagated the fracture far away enough from the injection well and thus, the near-wellbore complexities obscure the interpretations. Cycle Pc_sqrt
(MPa)
1 7.456
2 7.61
3 6.256
4 6.187
5 6.255
6 6.256
7 6.031
8 5.971
9 6.194
mean 6.164286
std dev 0.116601
rel. error 1.89% The relative error, "rel. error", in the above table is calculated by dividing "mean" by "std dev". A small percentage of relative error certainly supports the consistency in the interpreted closure pressures and thus, a good measure of the interpretation accuracy in general.
5 Some exceptions do occur. These will be discussed on the individual basis.

Mini-frac tests Pengrowth 3 BitCan 01-121 (2)
Confidential BitCan G&E Inc.
2. Comparison with the density-derived vertical stress Another effort to assess the interpretation accuracy is to compare the fracture closure pressure interpreted from the mini-frac tests with the vertical overburden stress, Sv that can be calculated independently from the density log. Assuming that such calculated vertical stress is indeed the in-situ minimum stress and thus should be measured by the mini-frac tests, one can obtain another measure on the relative error in the mini-frac tests. It is generally recognized that in the caprock shales at shallow depths, the above assumption holds true. Our experience has certainly supported this assumption. For the other tests, the above-stated assumption may not hold, i.e., Sv is inherently not the in-situ minimum stress and thus, should not be measured by the mini-frac tests. This normally happens in the oilsands payzone or tests at deep depths such as all the tests on the current Well 13-24. In this case, the comparison with the density-derived Sv can tell about the stress regime When the fracture closure pressure which is often equated to the in-situ minimum stress, Smin, is smaller than Sv, it means a vertical fracture is formed and the closure pressure represents the in-situ minimum horizontal stress, SHmin. In this case, the vertical fracture stress regime, "V. frac", is present. In BitCan's terminologies, if Smin is smaller than Sv by more than 10%, the "V. frac" stress regime is assigned. If Smin is smaller than Sv by 5 to 10%, a near vertical fracture stress regime, "~V. frac", is assigned. If Smin differs from Sv by less than 5%, a horizontal fracture stress regime, "H. frac", is assigned. In the latter, the measured fracture closure pressure is close to Sv, i.e., a horizontal fracture is formed. Note that it is possible that the in-situ minimum horizontal stress is close to Sv. In this case, the preferred fracture direction is not certain between vertical and horizontal directions.
3. Summary on the error analysis
The above-described approach is extended for all the tests and their relevant details are summarized below: Pengrowth LNDBRGH 13-24-58-5W4 Std dev --- Standard deviation.
TVD, m Stress regime Statistics measures Relative errorMPag kPag/m MPa kPa/m Mean, MPa Std dev, MPa Sv std/mean
Lloydminster 530.0 6.164 11.63 11.342 21.40 V. frac 6.164 0.117 -45.7% 1.9%GP #1 514.0 8.144 15.84 11.011 21.42 V. frac 8.144 0.305 -26.0% 3.7%GP #2 504.0 7.057 14.00 10.796 21.42 V. frac 7.057 0.081 -34.6% 1.1%
Min. stress Vert. stress
Therefore, the relative error is smaller than 5% for all the tests if estimated by standard deviation vs. mean. This is a satisfactory evidence to support the accuracy of our mini-frac tests and interpretations. Moreover, Smin measured from each mini-frac test is all smaller than Sv by a margin of 26 to 46%. Thus, a vertical fracture stress regime, "V. frac", is present at all the test intervals. This is expected given their relative deep depths.

Mini-frac tests Pengrowth 4 BitCan 01-121 (2)
Confidential BitCan G&E Inc.
4. Uncertainty in the interpretations for the reservoir test
The low fracture pressure gradient near 11.6 kPa/m interpreted from the reservoir test should be regarded with caution. It is too low close to the hydrostatic gradient. The in-situ reservoir mobility is significant as shown by the fast pressure decline during the shut-in. As a result, the fracture closed rapidly, perhaps in seconds, after the shut-in. The fracture closure pressure was interpreted using the linear flow or sqrt(t) plot. This linear flow regime may be mixed with the wellbore storage effect and/or disappearing near-wellbore friction, which makes it difficult to detect the true fracture closure. Obvious breakdown was seen in the first cycle as shown by the large pressure drop during the injection (Figure 1). In the subsequent injection, the pressure decreased somewhat or remained flat, all of which point out the fracture propagation behaviour. A secondary breakdown event was seen in Cycle #3 (Figure 1). Correspondingly, the fracture closure pressure dropped in Cycle #3 and remained low since then (Figure 2). The fracture re-opening pressure, P_reopen, or Instantaneous Shut-in Pressure, ISIP, can provide the upper bound to the fracture closure pressure. Their corresponding statistical mean and deviation are calculated below:
Cycle P‐reopen ISIP Pc_sqrt
(MPa) (MPa) (MPa)
1 15.327 9.136 7.456
2 8.346 10.09 7.61
3 8.145 7.12 6.256
4 6.556 7.814 6.187
5 7.207 8.219 6.255
6 7.589 7.358 6.256
7 7.91 6.862 6.031
8 6.527 6.433 5.971
9 6.946 6.504 6.194
mean 7.268571 7.187143 6.164286
std dev 0.638718 0.662384 0.116601
rel. error 8.79% 9.22% 1.89% Therefore, an upper bound to the fracture closure pressure in the Lloydminster reservoir sands at 530 mTVD is 7.187 to 7.268 MPa (average at 7.228 MPa) or 13.6 to 13.7 kPa/m in gradient.

Mini-frac tests Pengrowth 5 BitCan 01-121 (2)
Confidential BitCan G&E Inc.
Smin@cap 15.84 kPa/mMOP, kPa/m MOP at 518 m, MPa Margin of Safety % of Smin@cap
7.92 4.10 100% 50%9.50 4.92 67% 60%11.09 5.74 43% 70%12.67 6.56 25% 80%14.26 7.38 11% 90%
5. Applications of the test results to the field operation
The interpreted in-situ minimum stresses (Smin) are summarized in the following table: Pengrowth LNDBRGH 13-24-58-5W4
TVD, m Stress regimeMPag kPag/m MPa kPa/m
Lloydminster 530.0 6.164 to 7.228 11.63 to 13.64 11.342 21.40 V. fracGP #1 514.0 8.144 15.84 11.011 21.42 V. fracGP #2 504.0 7.057 14.00 10.796 21.42 V. frac
Min. stress Vert. stress
The stress barrier between the Lloydminster reservoir and GP (General Petroleum) caprock is obvious in the above measurements. The reservoir has a fracture pressure gradient at 11.63 to 13.64 kPa/m while the gradient in its immediate caprock is 15.84 kPa/m. As the first-order engineering design, this contrast can be used to guide the field operation designs as follows. 4.1. Operating pressures
The immediate GP caprock has a Smin=15.84 kPa/m. Based on this measurement, the margin of safety for various operating pressures in the underlying Lloydminster reservoir is listed below:
The Margin of Safety (M.S.) for a Maximum Operating Pressure (MOP) is defined as follows: M.S. = Smin@cap/MOP - 1 where Smin@cap represents the in-situ minimum stress in the GP #1, i.e., equal to 8.144 MPa or 15.84 kPa/m. It is assumed here that it is unsafe to allow MOP to reach Smin in the caprock. This is reasonable to design the operation against the hydraulically-driven fracture propagation from the reservoir into the caprock. Therefore, a M.S. at zero means failure and larger than zero means no failure. The greater the M.S. the safer the caprock is from failure.

Mini-frac tests Pengrowth 6 BitCan 01-121 (2)
Confidential BitCan G&E Inc.
Sometimes, a simple percentage of the Smin in the caprock is used to guide the operation pressure design. At 80%, MOP can be 6.56 MPa and its associated M.S. is 25%. At 90%, MOP can be 7.38 MPa and its M.S. is 11%.
4.2. Dilation pressures for the Lloydminster reservoir
To promote the geomechanical dilation effect, the reservoir recovery processes should operate at pressures as high as possible. The in-situ minimum stress in the reservoir plays an important role in the dilation. The reservoir has a upper bound Smin=13.64 kPa/m. If this is true, the first-order engineering analysis normally suggests that significant dilation should occur if the reservoir operating pressure is close to this Smin. At this operating pressure, the Margin of Safety for the caprock integrity is 16% --- a significant margin favorable for the caprock integrity. Therefore, on the tested well, optimization can be sought in the MOP so that it is safe for the caprock integrity and meanwhile, promotes dilation in the reservoir.
4.3. A word of caution
It should be noted that caprock integrity is a very complex issue. Many factors contribute and therefore, many mechanisms can potentially compromise the caprock integrity (Yuan, 20086). The above observations in 4.1 and 4.2 refer to a situation involving hydraulically-driven fracture propagation controlled by high fluid pressure inside the fracture and acting against the original in-situ stresses. It does not consider the mode of shear failure which can potentially compromise the caprock integrity. It does not address impact of reservoir deformation on the caprock. It does not consider thermal stresses. The thermal stresses and reservoir deformation may be significant during the thermal stimulations and should be considered. The ongoing geomechanical laboratory tests and simulations will investigate these issues.
Furthermore, the above discussions in 4.1 and 4.2 assume that the measured stress condition holds across the region. It may not be true if complex geology is present. Examples include post-depositional collapse structures and large faults. These and other factors should be considered in dedicated efforts.
6 Yuan, Y., 2008, Overburden/casing integrity in SAGD without high operating pressures. Presented at Canadian International Petroleum Conference in June, 2008 in Calgary. Paper # CIPC-2008-206.

Mini-frac tests Pengrowth 7 BitCan 01-121 (2)
Confidential BitCan G&E Inc.
Figure 1: Recorded pressure history during the injection test in the reservoir sands at 530 m TVD, Pengrowth Well 13-24. The bottomhole pressures (“BHP”) were calculated from a surface pressure sensor at the pump plus the hydraulic head (“Hydrostatic”) from the water column weight. The overburden weight (“Sv”) was calculated from the density log. “SHmin” was the in-situ minimum horizontal stress or fracture closure pressure interpreted from the pressure data. Similar conventions are used below unless otherwise specified.

Mini-frac tests Pengrowth 8 BitCan 01-121 (2)
Confidential BitCan G&E Inc.
Figure 2: Various characteristic pressures interpreted from the test at 530 m. “P_reopen” denotes the fracture reopening pressure where the fracture starts to re-open during the subsequent injection. “ISIP” is
the Instantaneous Shut-In Pressure. “Pc, sqrt” refers to the fracture closure pressure extracted by the sqrt(dt)-plot. “Pc, compliance” is the fracture closure pressure extracted by the compliance plot from the
flow-back tests. “Cb, inj (Cf, back or Cb, back)” refers to the initial system compliance during the injection (the system compliance before or after the fracture closure during the flowback).
Lower-bound fracture closure pressure=6.164 MPa
Upper-bound fracture closure pressure=7.228 MPa

MINI-FRAC TESTS AT PENGROWTH WELL: LNDBRGH 13-24-58-5W41
--- Compilation of analysis plots ---
Y. Yuan2 and Bin Xu
BitCan Geosciences & Engineering Inc. Bay 8, 3200 – 14 Ave, N.E., Calgary, Alberta T2A 6J4
APEGGA Permit of Practice #07814
March 23, 2012 In various appendices, this report compiles all the analysis plots for the tests. Each plot occupies a page. They are first organized according to the test intervals. Plots are then grouped according to the test cycles sequentially from the first to the last. For each cycle, the following sequence of plots is arranged:
(1). “BHP and Injection Rate” plots the pressure/rate history, “Relative time” on the x-axis is calculated from the start of the cycle.
(2). “P-V” plot for the pressure vs. injection volume plot to identify “P_reopen”. (3). “P-Δt” plots the pressure decline during the shut-in. “Relative time” on the x-axis is
calculated with respect to the start of the shut-in period. This plot determines ISIP. (4). “lg(ΔP)-lg(Δt)” plots the pressure drop during the shut-in (ongoing pressure minus the
pressure at the start of the shut-in) against the shut-in time on the log-log plot. It is used to identify two slopes whose magnitudes are denoted. The 1st or 2nd slopes are counted from the origin to the right.
(5). “P-√Δt” for the p-sqrt(t) plot to identify “Pc, sqrt”.
1 DISCLAIMER: This report was prepared by BitCan Geosciences & Engineering Inc. (BitCan G&E) for the customer to whom it is addressed. It is confidential and may not be used by nor distributed among any third parties without permission from BitCan G&E. Information contained in this report, including any interpretation, research, analysis, data, results, estimates, conclusions, observations, recommendations, inferences, deductions and opinions made herein or otherwise communicated by BitCan G&E to customer at any time in connection with the services, reflects the best judgment by BitCan G&E at the time of the report, on available information. It is obtained after examining, studying, analyzing or testing, with reasonable diligence, various data collected via field tests, laboratory tests, historical databases in BitCan G&E or the public domain or provided by the customer. Assumptions are inevitably made as a basis for conclusions, recommendations or opinions expressed in the report. Assumptions may turn out to be incorrect, or the data on which the report is made may contain inaccuracies or omissions. Accordingly, BitCan G&E cannot and does not make any representation or warranty, either express or implied, as to any matter whatsoever, including, without limitation, the accuracy, completeness and correctness of the information contained in this report. Customer acknowledges that any action taken based on the information contained in this report shall be at its own sole risk and responsibility and no claims shall be made against BitCan G&E for any damages, including but not limited to injury to person or property, loss of life, loss of properties, loss of profit, loss of business, costs, expenses or other financial loss which may be caused, directly or indirectly, by the use of or reliance on the information contained in this report by the customer or third parties. 2 Responsible member under APEGGA rules.

Mini-frac tests Pengrowth 2 BitCan 01-121 (3)
Confidential BitCan G&E Inc.
(6). “P-backV” is made only if the flow-back is executed during the test. It plots the pressure vs. fluid volume being flown back. 2 slopes are identified and their intersection is the fracture closure pressure, “Pc, compliance”. The slopes are denoted on the plot. The 1st and 2nd slopes are counted from the “0” point on the axis, i.e. the right-hand side end, to the left.
(7). “lg(Δt*dP/dΔt)-lg(Δt)” means the semi-log pressure derivative plot on the log-log scale. The y-axis lg(Δt*dP/dΔt) is actually the derivative with respect to the natural log of the incremental time after the shut-in starts, i.e. dP/d(ln(Δt)). 3 slopes are identified to show the flow regimes. They are identified in the legend by “1st” to “3rd” corresponding respectively to fitted lines from the left-most to the right-most. The linear flow period should have a slope of close to 0.5.
There are two summary pages after all the cycles are presented: the first plots the characteristic pressures according to the cycle sequences and the second lists their numeric values in a table. The compliance values are also listed: “Cb, inj” refers to the initial system compliance during the injection. “Cf, back or Cb, back” is the system compliance before or after the fracture closure during the flowback.

ANALYSIS PLOTS
WELL: LNDBRGH 13-24-58-5W4
Test 1: General Petroleum (GP) caprock at 504 m TVD

Mini-Frac Test
pres
sure
(MP
a)
0
2
4
6
8
10
flow rate(L/m
in)
-20
0
20
40
60
80
100
120
140
time(s)1,000 2,000 3,000 4,000
0 1 2 3 4 5 6 7 8
Pump Preussure Well Head Preussure High Flow Rate Low Flow Rate Flow Back Rate
BitCanGeosciences & Engineering Inc. www.bitcange.com
Client:Well:Depth:
Formation:Start @:
PenGrowth
504
CapRockTue Jan 3 10:21:02 2012
Generated by MiniMonitor

Mini-Frac Test
pres
sure
(MP
a)
0
2
4
6
8
10
volume(L)
0
200
400
600
800
1,000
1,200
1,400
time(s)1,000 2,000 3,000 4,000
0 1 2 3 4 5 6 7 8
Pump Preussure Well Head Preussure Volume Injected
BitCanGeosciences & Engineering Inc. www.bitcange.com
Client:Well:Depth:
Formation:Start @:
PenGrowth
504
CapRockTue Jan 3 10:21:02 2012
Generated by MiniMonitor

Well: Pengrowth LNDBRGH 13-24-58-5W4Depth: 504.0mFormation: General PetroleumCycle: 01
BitCanGeosciences & Engineering Inc.
0 100 200 300 400 500Relative time(s)
6
7
8
9
10
11
12
13
14
15
BH
P(M
Pa)
BHP and Injection Rate
�10
0
10
20
30
40
50
Inje
ctio
n r
ate
(L/min
)
BHPInjection rate
Mini-Frac Test Analysis 1 http://www.bitcange.com

Well: Pengrowth LNDBRGH 13-24-58-5W4Depth: 504.0mFormation: General PetroleumCycle: 01
BitCanGeosciences & Engineering Inc.
0 5 10 15 20 25 30 35Injection volume(L)
7
8
9
10
11
12
13
14
15
BH
P(MPa)
Reopen Pressure: 13.598 MPa
P-V
Mini-Frac Test Analysis 2 http://www.bitcange.com

Well: Pengrowth LNDBRGH 13-24-58-5W4Depth: 504.0mFormation: General PetroleumCycle: 01
BitCanGeosciences & Engineering Inc.
0 10 20 30 40 50 60 70Relative time(s)
7.5
8.0
8.5
9.0
9.5
10.0
BH
P(M
Pa)
ISIP: 9.373 MPa
P-�t
Mini-Frac Test Analysis 3 http://www.bitcange.com

Well: Pengrowth LNDBRGH 13-24-58-5W4Depth: 504.0mFormation: General PetroleumCycle: 01
BitCanGeosciences & Engineering Inc.
0.0 0.5 1.0 1.5 2.0 2.5lg(relative time)
�0.8
�0.6
�0.4
�0.2
0.0
0.2
0.4
0.6
lg(B
HP)
1st Slope: 0.81
2nd Slope: 0.62
lg(�P)-lg(�t)
Mini-Frac Test Analysis 4 http://www.bitcange.com

Well: Pengrowth LNDBRGH 13-24-58-5W4Depth: 504.0mFormation: General PetroleumCycle: 01
BitCanGeosciences & Engineering Inc.
0 2 4 6 8 10 12 14 16 18Sqrt(relative time)
6.5
7.0
7.5
8.0
8.5
9.0
9.5
10.0
BH
P(M
Pa)
Closure Pressure: 7.571 MPa
P-�
�t
Mini-Frac Test Analysis 5 http://www.bitcange.com

Well: Pengrowth LNDBRGH 13-24-58-5W4Depth: 504.0mFormation: General PetroleumCycle: 01
BitCanGeosciences & Engineering Inc.
0.0 0.5 1.0 1.5 2.0 2.5lg(�t)
�0.8
�0.6
�0.4
�0.2
0.0
0.2
0.4
0.6
lg(�
tdP/d
�
t)1st Slope: 0.94
2nd Slope: 0.26
3rd Slope: -0.09
lg(�tdP/d�t)-lg(�t)
Mini-Frac Test Analysis 6 http://www.bitcange.com

Well: Pengrowth LNDBRGH 13-24-58-5W4Depth: 504.0mFormation: General PetroleumCycle: 02
BitCanGeosciences & Engineering Inc.
0 50 100 150 200 250 300 350 400 450Relative time(s)
5
6
7
8
9
10
11
BH
P(M
Pa)
BHP and Injection Rate
�10
0
10
20
30
40
50
60
Inje
ctio
n r
ate
(L/min
)
BHPInjection rate
Mini-Frac Test Analysis 7 http://www.bitcange.com

Well: Pengrowth LNDBRGH 13-24-58-5W4Depth: 504.0mFormation: General PetroleumCycle: 02
BitCanGeosciences & Engineering Inc.
0 5 10 15 20 25 30 35 40Injection volume(L)
5
6
7
8
9
10
11
BH
P(MPa)
Reopen Pressure: 10.247 MPa
P-V
Mini-Frac Test Analysis 8 http://www.bitcange.com

Well: Pengrowth LNDBRGH 13-24-58-5W4Depth: 504.0mFormation: General PetroleumCycle: 02
BitCanGeosciences & Engineering Inc.
0 20 40 60 80 100 120 140Relative time(s)
7.0
7.5
8.0
8.5
9.0
9.5
10.0
BH
P(M
Pa)
ISIP: 8.805 MPa
P-�t
Mini-Frac Test Analysis 9 http://www.bitcange.com

Well: Pengrowth LNDBRGH 13-24-58-5W4Depth: 504.0mFormation: General PetroleumCycle: 02
BitCanGeosciences & Engineering Inc.
0.0 0.5 1.0 1.5 2.0 2.5lg(relative time)
�0.8
�0.6
�0.4
�0.2
0.0
0.2
0.4
0.6
lg(B
HP)
1st Slope: 1.08
2nd Slope: 0.67
lg(�P)-lg(�t)
Mini-Frac Test Analysis 10 http://www.bitcange.com
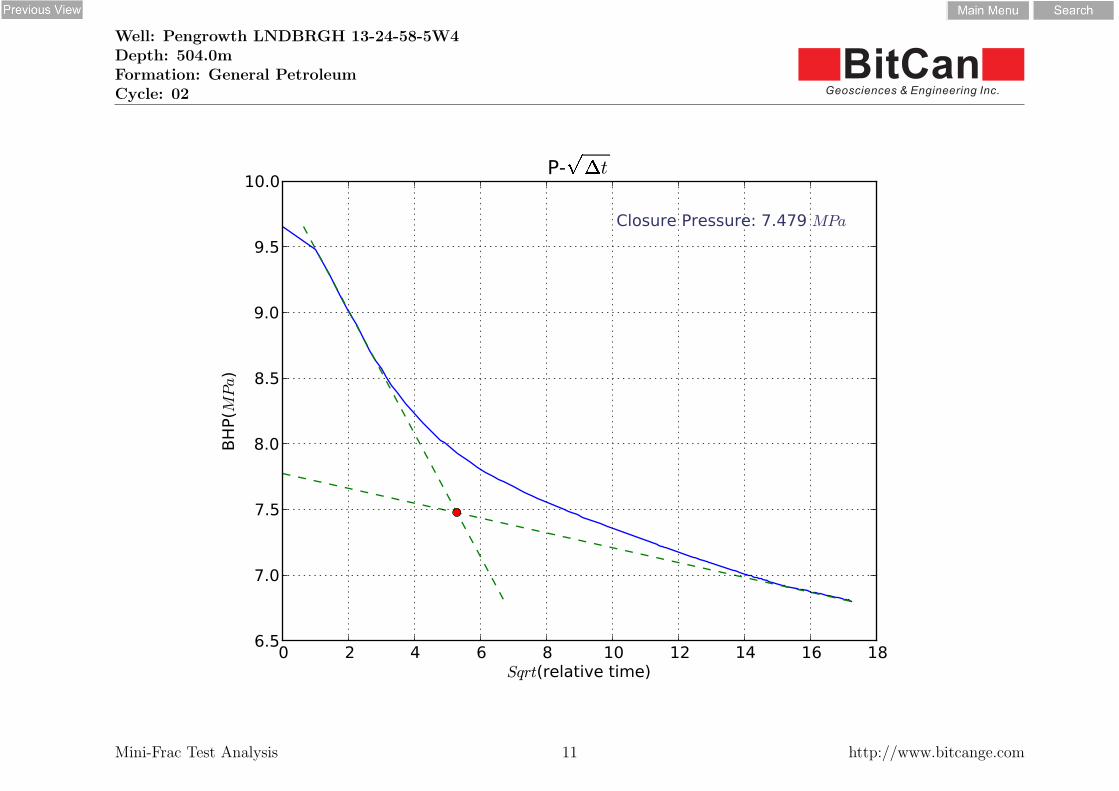
Well: Pengrowth LNDBRGH 13-24-58-5W4Depth: 504.0mFormation: General PetroleumCycle: 02
BitCanGeosciences & Engineering Inc.
0 2 4 6 8 10 12 14 16 18Sqrt(relative time)
6.5
7.0
7.5
8.0
8.5
9.0
9.5
10.0
BH
P(M
Pa)
Closure Pressure: 7.479 MPa
P-�
�t
Mini-Frac Test Analysis 11 http://www.bitcange.com

Well: Pengrowth LNDBRGH 13-24-58-5W4Depth: 504.0mFormation: General PetroleumCycle: 02
BitCanGeosciences & Engineering Inc.
0.0 0.5 1.0 1.5 2.0 2.5lg(�t)
�0.8
�0.6
�0.4
�0.2
0.0
0.2
0.4
0.6
lg(�
tdP/d
�
t)1st Slope: 0.43
2nd Slope: 0.17
3rd Slope: 0.23
lg(�tdP/d�t)-lg(�t)
Mini-Frac Test Analysis 12 http://www.bitcange.com

Well: Pengrowth LNDBRGH 13-24-58-5W4Depth: 504.0mFormation: General PetroleumCycle: 03
BitCanGeosciences & Engineering Inc.
0 50 100 150 200 250Relative time(s)
5
6
7
8
9
10
11
BH
P(M
Pa)
BHP and Injection Rate
0
20
40
60
80
Inje
ctio
n r
ate
(L/min
)
BHPInjection rate
Mini-Frac Test Analysis 13 http://www.bitcange.com

Well: Pengrowth LNDBRGH 13-24-58-5W4Depth: 504.0mFormation: General PetroleumCycle: 03
BitCanGeosciences & Engineering Inc.
0 10 20 30 40 50Injection volume(L)
5
6
7
8
9
10
11
BH
P(MPa)
Reopen Pressure: 10.254 MPa
P-V
Mini-Frac Test Analysis 14 http://www.bitcange.com

Well: Pengrowth LNDBRGH 13-24-58-5W4Depth: 504.0mFormation: General PetroleumCycle: 03
BitCanGeosciences & Engineering Inc.
0 5 10 15 20 25 30 35 40Relative time(s)
6.5
7.0
7.5
8.0
8.5
9.0
9.5
BH
P(M
Pa)
ISIP: 8.857 MPa
P-�t
Mini-Frac Test Analysis 15 http://www.bitcange.com

Well: Pengrowth LNDBRGH 13-24-58-5W4Depth: 504.0mFormation: General PetroleumCycle: 03
BitCanGeosciences & Engineering Inc.
0.0 0.5 1.0 1.5 2.0lg(relative time)
�0.6
�0.4
�0.2
0.0
0.2
0.4
0.6
lg(B
HP)
1st Slope: 0.89
2nd Slope: 0.45
lg(�P)-lg(�t)
Mini-Frac Test Analysis 16 http://www.bitcange.com

Well: Pengrowth LNDBRGH 13-24-58-5W4Depth: 504.0mFormation: General PetroleumCycle: 03
BitCanGeosciences & Engineering Inc.
0 1 2 3 4 5 6 7 8 9Sqrt(relative time)
5.5
6.0
6.5
7.0
7.5
8.0
8.5
9.0
9.5
BH
P(M
Pa)
Closure Pressure: 6.965 MPa
P-�
�t
Mini-Frac Test Analysis 17 http://www.bitcange.com

Well: Pengrowth LNDBRGH 13-24-58-5W4Depth: 504.0mFormation: General PetroleumCycle: 03
BitCanGeosciences & Engineering Inc.
�3.0 �2.5 �2.0 �1.5 �1.0 �0.5 0.0Flow back volume(L)
6.0
6.5
7.0
7.5
8.0
8.5
9.0
9.5
BH
P(M
Pa)
Closure Pressure: 8.048 MPa
1st Compliance: 0.23 L/MPa
2nd Compliance: 1.07 L/MPa
P-backV
Mini-Frac Test Analysis 18 http://www.bitcange.com

Well: Pengrowth LNDBRGH 13-24-58-5W4Depth: 504.0mFormation: General PetroleumCycle: 03
BitCanGeosciences & Engineering Inc.
0.0 0.5 1.0 1.5 2.0lg(�t)
�0.6
�0.4
�0.2
0.0
0.2
lg(�
tdP/d
�
t)1st Slope: 0.47
2nd Slope: 0.33
3rd Slope: -0.04
lg(�tdP/d�t)-lg(�t)
Mini-Frac Test Analysis 19 http://www.bitcange.com

Well: Pengrowth LNDBRGH 13-24-58-5W4Depth: 504.0mFormation: General PetroleumCycle: 04
BitCanGeosciences & Engineering Inc.
0 50 100 150 200 250 300 350 400Relative time(s)
5
6
7
8
9
10
11
BH
P(M
Pa)
BHP and Injection Rate
�10
0
10
20
30
40
50
60
70
Inje
ctio
n r
ate
(L/min
)
BHPInjection rate
Mini-Frac Test Analysis 20 http://www.bitcange.com

Well: Pengrowth LNDBRGH 13-24-58-5W4Depth: 504.0mFormation: General PetroleumCycle: 04
BitCanGeosciences & Engineering Inc.
0 5 10 15 20 25 30 35Injection volume(L)
5
6
7
8
9
10
11
BH
P(MPa)
Reopen Pressure: 9.673 MPa
P-V
Mini-Frac Test Analysis 21 http://www.bitcange.com

Well: Pengrowth LNDBRGH 13-24-58-5W4Depth: 504.0mFormation: General PetroleumCycle: 04
BitCanGeosciences & Engineering Inc.
0 50 100 150 200 250 300Relative time(s)
6.5
7.0
7.5
8.0
8.5
9.0
9.5
10.0
BH
P(M
Pa)
ISIP: 8.493 MPa
P-�t
Mini-Frac Test Analysis 22 http://www.bitcange.com

Well: Pengrowth LNDBRGH 13-24-58-5W4Depth: 504.0mFormation: General PetroleumCycle: 04
BitCanGeosciences & Engineering Inc.
0.0 0.5 1.0 1.5 2.0 2.5lg(relative time)
�0.6
�0.4
�0.2
0.0
0.2
0.4
0.6
lg(B
HP)
1st Slope: 0.67
2nd Slope: 0.57
lg(�P)-lg(�t)
Mini-Frac Test Analysis 23 http://www.bitcange.com

Well: Pengrowth LNDBRGH 13-24-58-5W4Depth: 504.0mFormation: General PetroleumCycle: 04
BitCanGeosciences & Engineering Inc.
0 2 4 6 8 10 12 14 16 18Sqrt(relative time)
6.5
7.0
7.5
8.0
8.5
9.0
9.5
10.0
BH
P(M
Pa)
Closure Pressure: 7.743 MPa
P-�
�t
Mini-Frac Test Analysis 24 http://www.bitcange.com

Well: Pengrowth LNDBRGH 13-24-58-5W4Depth: 504.0mFormation: General PetroleumCycle: 04
BitCanGeosciences & Engineering Inc.
0.0 0.5 1.0 1.5 2.0 2.5lg(�t)
�0.6
�0.4
�0.2
0.0
0.2
0.4
0.6
lg(�
tdP/d
�
t)1st Slope: 0.58
2nd Slope: -0.07
3rd Slope: 0.53
lg(�tdP/d�t)-lg(�t)
Mini-Frac Test Analysis 25 http://www.bitcange.com

Well: Pengrowth LNDBRGH 13-24-58-5W4Depth: 504.0mFormation: General PetroleumCycle: 05
BitCanGeosciences & Engineering Inc.
0 50 100 150 200 250Relative time(s)
5
6
7
8
9
10
11
12
BH
P(M
Pa)
BHP and Injection Rate
�20
0
20
40
60
80
100
120
140
Inje
ctio
n r
ate
(L/min
)
BHPInjection rate
Mini-Frac Test Analysis 26 http://www.bitcange.com

Well: Pengrowth LNDBRGH 13-24-58-5W4Depth: 504.0mFormation: General PetroleumCycle: 05
BitCanGeosciences & Engineering Inc.
0 5 10 15 20 25Injection volume(L)
5
6
7
8
9
10
11
12
BH
P(MPa)
Reopen Pressure: 10.227 MPa
P-V
Mini-Frac Test Analysis 27 http://www.bitcange.com

Well: Pengrowth LNDBRGH 13-24-58-5W4Depth: 504.0mFormation: General PetroleumCycle: 05
BitCanGeosciences & Engineering Inc.
0 5 10 15 20 25 30 35 40Relative time(s)
6.5
7.0
7.5
8.0
8.5
9.0
BH
P(M
Pa)
ISIP: 8.282 MPa
P-�t
Mini-Frac Test Analysis 28 http://www.bitcange.com

Well: Pengrowth LNDBRGH 13-24-58-5W4Depth: 504.0mFormation: General PetroleumCycle: 05
BitCanGeosciences & Engineering Inc.
0.0 0.5 1.0 1.5 2.0lg(relative time)
�0.8
�0.6
�0.4
�0.2
0.0
0.2
0.4
0.6
lg(B
HP)
1st Slope: 0.77
2nd Slope: 0.45
lg(�P)-lg(�t)
Mini-Frac Test Analysis 29 http://www.bitcange.com

Well: Pengrowth LNDBRGH 13-24-58-5W4Depth: 504.0mFormation: General PetroleumCycle: 05
BitCanGeosciences & Engineering Inc.
0 1 2 3 4 5 6 7 8 9Sqrt(relative time)
5.5
6.0
6.5
7.0
7.5
8.0
8.5
9.0
BH
P(M
Pa)
Closure Pressure: 7.088 MPa
P-�
�t
Mini-Frac Test Analysis 30 http://www.bitcange.com

Well: Pengrowth LNDBRGH 13-24-58-5W4Depth: 504.0mFormation: General PetroleumCycle: 05
BitCanGeosciences & Engineering Inc.
�2.5 �2.0 �1.5 �1.0 �0.5 0.0Flow back volume(L)
5.5
6.0
6.5
7.0
7.5
8.0
8.5
9.0
BH
P(M
Pa)
Closure Pressure: 7.725 MPa
1st Compliance: 0.28 L/MPa
2nd Compliance: 0.98 L/MPa
P-backV
Mini-Frac Test Analysis 31 http://www.bitcange.com

Well: Pengrowth LNDBRGH 13-24-58-5W4Depth: 504.0mFormation: General PetroleumCycle: 05
BitCanGeosciences & Engineering Inc.
0.0 0.5 1.0 1.5 2.0lg(�t)
�0.6
�0.4
�0.2
0.0
0.2lg
(�
tdP/d
�
t)1st Slope: 0.43
2nd Slope: 0.47
3rd Slope: 0.57
lg(�tdP/d�t)-lg(�t)
Mini-Frac Test Analysis 32 http://www.bitcange.com

Well: Pengrowth LNDBRGH 13-24-58-5W4Depth: 504.0mFormation: General PetroleumCycle: 06
BitCanGeosciences & Engineering Inc.
0 50 100 150 200 250 300Relative time(s)
5
6
7
8
9
10
11
BH
P(M
Pa)
BHP and Injection Rate
�20
0
20
40
60
80
100
120
Inje
ctio
n r
ate
(L/min
)
BHPInjection rate
Mini-Frac Test Analysis 33 http://www.bitcange.com

Well: Pengrowth LNDBRGH 13-24-58-5W4Depth: 504.0mFormation: General PetroleumCycle: 06
BitCanGeosciences & Engineering Inc.
0 5 10 15 20 25 30 35Injection volume(L)
5
6
7
8
9
10
11
BH
P(MPa)
Reopen Pressure: 9.844 MPa
P-V
Mini-Frac Test Analysis 34 http://www.bitcange.com

Well: Pengrowth LNDBRGH 13-24-58-5W4Depth: 504.0mFormation: General PetroleumCycle: 06
BitCanGeosciences & Engineering Inc.
0 10 20 30 40 50 60 70 80Relative time(s)
7.0
7.5
8.0
8.5
9.0
9.5
BH
P(M
Pa)
ISIP: 8.312 MPa
P-�t
Mini-Frac Test Analysis 35 http://www.bitcange.com

Well: Pengrowth LNDBRGH 13-24-58-5W4Depth: 504.0mFormation: General PetroleumCycle: 06
BitCanGeosciences & Engineering Inc.
0.0 0.5 1.0 1.5 2.0 2.5lg(relative time)
�0.5
�0.4
�0.3
�0.2
�0.1
0.0
0.1
0.2
0.3
0.4
lg(B
HP)
1st Slope: 0.69
2nd Slope: 0.5
lg(�P)-lg(�t)
Mini-Frac Test Analysis 36 http://www.bitcange.com

Well: Pengrowth LNDBRGH 13-24-58-5W4Depth: 504.0mFormation: General PetroleumCycle: 06
BitCanGeosciences & Engineering Inc.
0 2 4 6 8 10 12 14Sqrt(relative time)
6.5
7.0
7.5
8.0
8.5
9.0
9.5
BH
P(M
Pa)
Closure Pressure: 7.527 MPa
P-�
�t
Mini-Frac Test Analysis 37 http://www.bitcange.com

Well: Pengrowth LNDBRGH 13-24-58-5W4Depth: 504.0mFormation: General PetroleumCycle: 06
BitCanGeosciences & Engineering Inc.
0.0 0.5 1.0 1.5 2.0 2.5lg(�t)
�0.5
�0.4
�0.3
�0.2
�0.1
0.0
0.1
0.2
0.3
0.4
lg(�
tdP/d
�
t)1st Slope: 0.41
2nd Slope: 0.25
3rd Slope: 0.36
lg(�tdP/d�t)-lg(�t)
Mini-Frac Test Analysis 38 http://www.bitcange.com
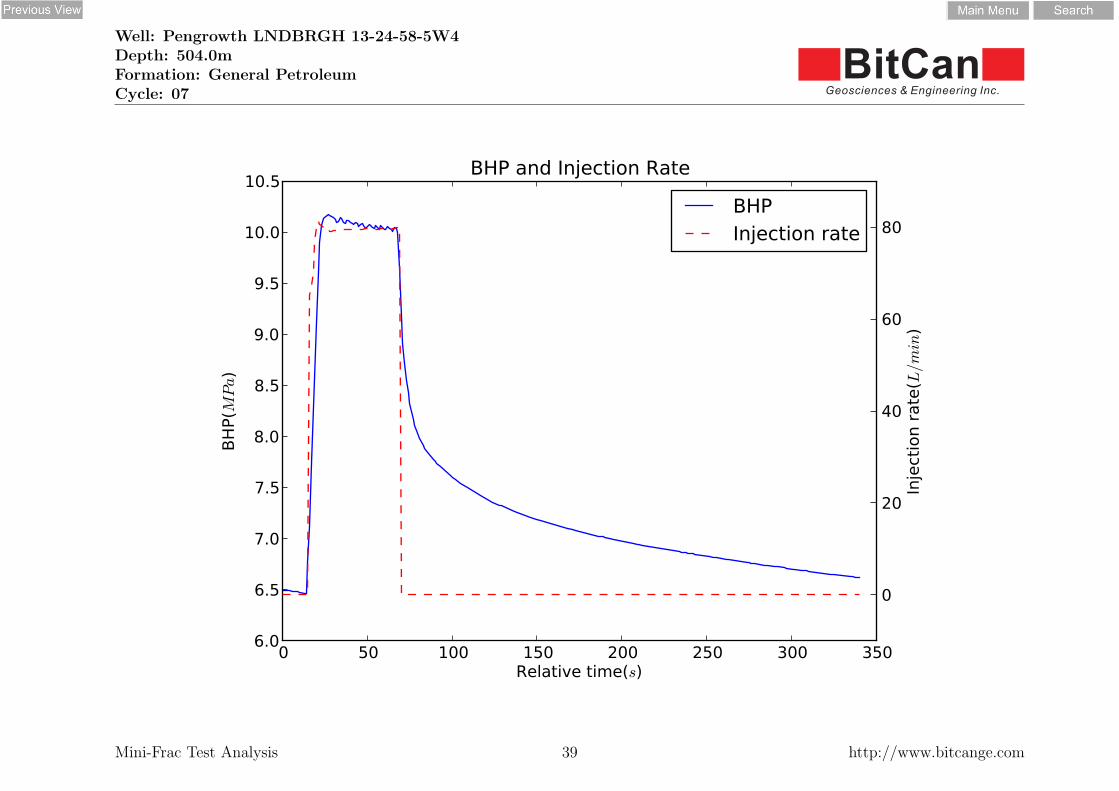
Well: Pengrowth LNDBRGH 13-24-58-5W4Depth: 504.0mFormation: General PetroleumCycle: 07
BitCanGeosciences & Engineering Inc.
0 50 100 150 200 250 300 350Relative time(s)
6.0
6.5
7.0
7.5
8.0
8.5
9.0
9.5
10.0
10.5
BH
P(M
Pa)
BHP and Injection Rate
0
20
40
60
80
Inje
ctio
n r
ate
(L/min
)
BHPInjection rate
Mini-Frac Test Analysis 39 http://www.bitcange.com

Well: Pengrowth LNDBRGH 13-24-58-5W4Depth: 504.0mFormation: General PetroleumCycle: 07
BitCanGeosciences & Engineering Inc.
0 2 4 6 8 10 12 14 16Injection volume(L)
6.0
6.5
7.0
7.5
8.0
8.5
9.0
9.5
10.0
10.5
BH
P(MPa)
Reopen Pressure: 9.604 MPa
P-V
Mini-Frac Test Analysis 40 http://www.bitcange.com

Well: Pengrowth LNDBRGH 13-24-58-5W4Depth: 504.0mFormation: General PetroleumCycle: 07
BitCanGeosciences & Engineering Inc.
0 20 40 60 80 100Relative time(s)
7.0
7.5
8.0
8.5
9.0
9.5
BH
P(M
Pa)
ISIP: 8.427 MPa
P-�t
Mini-Frac Test Analysis 41 http://www.bitcange.com

Well: Pengrowth LNDBRGH 13-24-58-5W4Depth: 504.0mFormation: General PetroleumCycle: 07
BitCanGeosciences & Engineering Inc.
0.0 0.5 1.0 1.5 2.0 2.5lg(relative time)
�0.6
�0.4
�0.2
0.0
0.2
lg(B
HP)
1st Slope: 0.8
2nd Slope: 0.59
lg(�P)-lg(�t)
Mini-Frac Test Analysis 42 http://www.bitcange.com

Well: Pengrowth LNDBRGH 13-24-58-5W4Depth: 504.0mFormation: General PetroleumCycle: 07
BitCanGeosciences & Engineering Inc.
0 2 4 6 8 10 12 14 16Sqrt(relative time)
6.5
7.0
7.5
8.0
8.5
9.0
9.5
BH
P(M
Pa)
Closure Pressure: 7.564 MPa
P-�
�t
Mini-Frac Test Analysis 43 http://www.bitcange.com

Well: Pengrowth LNDBRGH 13-24-58-5W4Depth: 504.0mFormation: General PetroleumCycle: 07
BitCanGeosciences & Engineering Inc.
0.0 0.5 1.0 1.5 2.0 2.5lg(�t)
�0.6
�0.4
�0.2
0.0
0.2
0.4
0.6
lg(�
tdP/d
�
t)1st Slope: 0.41
2nd Slope: 0.19
3rd Slope: 0.55
lg(�tdP/d�t)-lg(�t)
Mini-Frac Test Analysis 44 http://www.bitcange.com

Well: Pengrowth LNDBRGH 13-24-58-5W4Depth: 504.0mFormation: General PetroleumCycle: 08
BitCanGeosciences & Engineering Inc.
0 50 100 150 200 250 300Relative time(s)
6.5
7.0
7.5
8.0
8.5
9.0
9.5
10.0
BH
P(M
Pa)
BHP and Injection Rate
�10
0
10
20
30
40
50
Inje
ctio
n r
ate
(L/min
)
BHPInjection rate
Mini-Frac Test Analysis 45 http://www.bitcange.com

Well: Pengrowth LNDBRGH 13-24-58-5W4Depth: 504.0mFormation: General PetroleumCycle: 08
BitCanGeosciences & Engineering Inc.
�5 0 5 10 15 20 25Injection volume(L)
6.5
7.0
7.5
8.0
8.5
9.0
9.5
10.0
BH
P(MPa)
Reopen Pressure: 8.886 MPa
P-V
Mini-Frac Test Analysis 46 http://www.bitcange.com

Well: Pengrowth LNDBRGH 13-24-58-5W4Depth: 504.0mFormation: General PetroleumCycle: 08
BitCanGeosciences & Engineering Inc.
0 20 40 60 80 100Relative time(s)
7.0
7.5
8.0
8.5
9.0
9.5
BH
P(M
Pa)
ISIP: 8.46 MPa
P-�t
Mini-Frac Test Analysis 47 http://www.bitcange.com
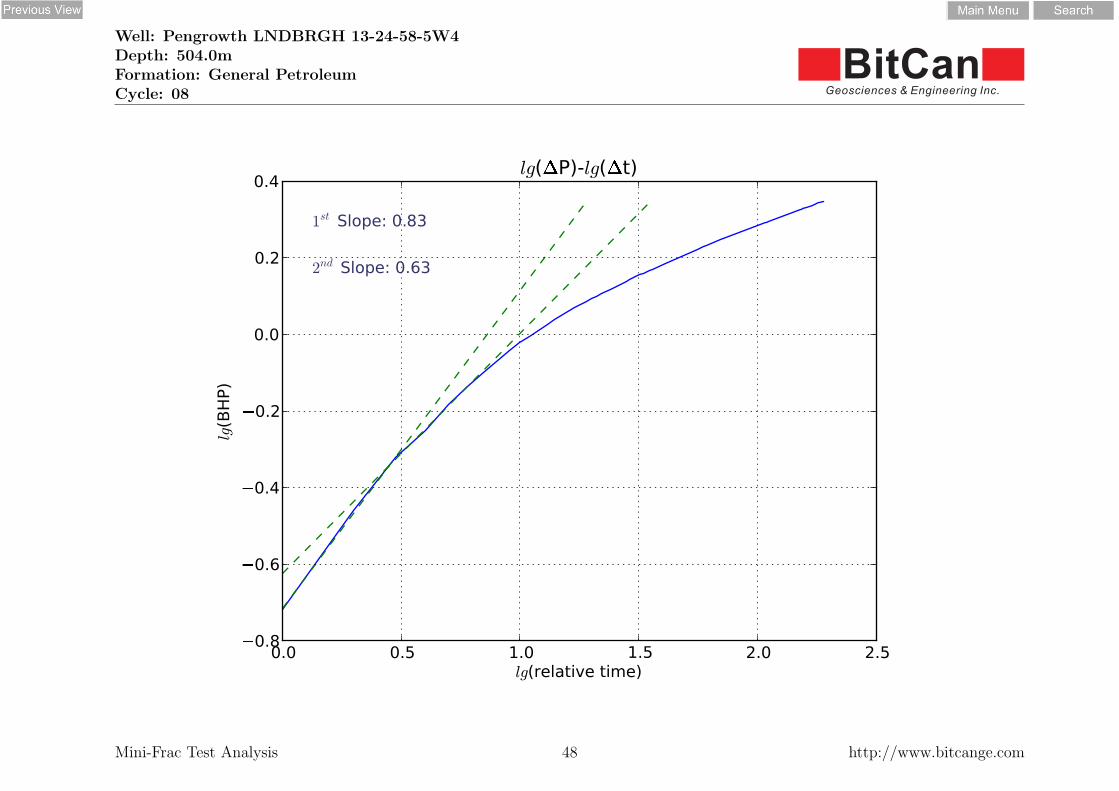
Well: Pengrowth LNDBRGH 13-24-58-5W4Depth: 504.0mFormation: General PetroleumCycle: 08
BitCanGeosciences & Engineering Inc.
0.0 0.5 1.0 1.5 2.0 2.5lg(relative time)
�0.8
�0.6
�0.4
�0.2
0.0
0.2
0.4
lg(B
HP)
1st Slope: 0.83
2nd Slope: 0.63
lg(�P)-lg(�t)
Mini-Frac Test Analysis 48 http://www.bitcange.com

Well: Pengrowth LNDBRGH 13-24-58-5W4Depth: 504.0mFormation: General PetroleumCycle: 08
BitCanGeosciences & Engineering Inc.
0 2 4 6 8 10 12 14Sqrt(relative time)
6.5
7.0
7.5
8.0
8.5
9.0
9.5
BH
P(M
Pa)
Closure Pressure: 7.734 MPa
P-�
�t
Mini-Frac Test Analysis 49 http://www.bitcange.com

Well: Pengrowth LNDBRGH 13-24-58-5W4Depth: 504.0mFormation: General PetroleumCycle: 08
BitCanGeosciences & Engineering Inc.
0.0 0.5 1.0 1.5 2.0 2.5lg(�t)
�0.8
�0.6
�0.4
�0.2
0.0
0.2
0.4
lg(�
tdP/d
�
t)1st Slope: 0.44
2nd Slope: 0.08
3rd Slope: 0.3
lg(�tdP/d�t)-lg(�t)
Mini-Frac Test Analysis 50 http://www.bitcange.com

Well: Pengrowth LNDBRGH 13-24-58-5W4Depth: 504.0mFormation: General PetroleumCycle: 09
BitCanGeosciences & Engineering Inc.
0 50 100 150 200Relative time(s)
5
6
7
8
9
10
11
BH
P(M
Pa)
BHP and Injection Rate
�20
0
20
40
60
80
100
120
Inje
ctio
n r
ate
(L/min
)
BHPInjection rate
Mini-Frac Test Analysis 51 http://www.bitcange.com

Well: Pengrowth LNDBRGH 13-24-58-5W4Depth: 504.0mFormation: General PetroleumCycle: 09
BitCanGeosciences & Engineering Inc.
0 5 10 15 20 25Injection volume(L)
6.5
7.0
7.5
8.0
8.5
9.0
9.5
10.0
10.5
11.0
BH
P(MPa)
Reopen Pressure: 9.614 MPa
P-V
Mini-Frac Test Analysis 52 http://www.bitcange.com

Well: Pengrowth LNDBRGH 13-24-58-5W4Depth: 504.0mFormation: General PetroleumCycle: 09
BitCanGeosciences & Engineering Inc.
0 5 10 15 20 25 30 35 40 45Relative time(s)
6.5
7.0
7.5
8.0
8.5
9.0
BH
P(M
Pa)
ISIP: 8.38 MPa
P-�t
Mini-Frac Test Analysis 53 http://www.bitcange.com

Well: Pengrowth LNDBRGH 13-24-58-5W4Depth: 504.0mFormation: General PetroleumCycle: 09
BitCanGeosciences & Engineering Inc.
0.0 0.5 1.0 1.5 2.0lg(relative time)
�0.6
�0.4
�0.2
0.0
0.2
0.4
0.6
lg(B
HP)
1st Slope: 0.83
2nd Slope: 0.37
lg(�P)-lg(�t)
Mini-Frac Test Analysis 54 http://www.bitcange.com

Well: Pengrowth LNDBRGH 13-24-58-5W4Depth: 504.0mFormation: General PetroleumCycle: 09
BitCanGeosciences & Engineering Inc.
0 1 2 3 4 5 6 7 8Sqrt(relative time)
5.5
6.0
6.5
7.0
7.5
8.0
8.5
9.0
BH
P(M
Pa)
Closure Pressure: 7.118 MPa
P-�
�t
Mini-Frac Test Analysis 55 http://www.bitcange.com

Well: Pengrowth LNDBRGH 13-24-58-5W4Depth: 504.0mFormation: General PetroleumCycle: 09
BitCanGeosciences & Engineering Inc.
�3.0 �2.5 �2.0 �1.5 �1.0 �0.5 0.0Flow back volume(L)
5.5
6.0
6.5
7.0
7.5
8.0
8.5
9.0
BH
P(M
Pa)
Closure Pressure: 7.869 MPa
1st Compliance: 0.19 L/MPa
2nd Compliance: 1.24 L/MPa
P-backV
Mini-Frac Test Analysis 56 http://www.bitcange.com

Well: Pengrowth LNDBRGH 13-24-58-5W4Depth: 504.0mFormation: General PetroleumCycle: 09
BitCanGeosciences & Engineering Inc.
0.0 0.2 0.4 0.6 0.8 1.0 1.2 1.4 1.6 1.8lg(�t)
�0.6
�0.4
�0.2
0.0
0.2
lg(�
tdP/d
�
t)1st Slope: 0.14
2nd Slope: 0.56
3rd Slope: 1.18
lg(�tdP/d�t)-lg(�t)
Mini-Frac Test Analysis 57 http://www.bitcange.com

Well: Pengrowth LNDBRGH 13-24-58-5W4Depth: 504.0mFormation: General PetroleumCycle: 1 to 9
BitCanGeosciences & Engineering Inc.
0 2 4 6 8 10Cycle
0
2
4
6
8
10
12
14
Pre
ssure
(MPa)
Summary
P_reopen
ISIPPc, sqrtPc, compliance
Mini-Frac Test Analysis 58 http://www.bitcange.com
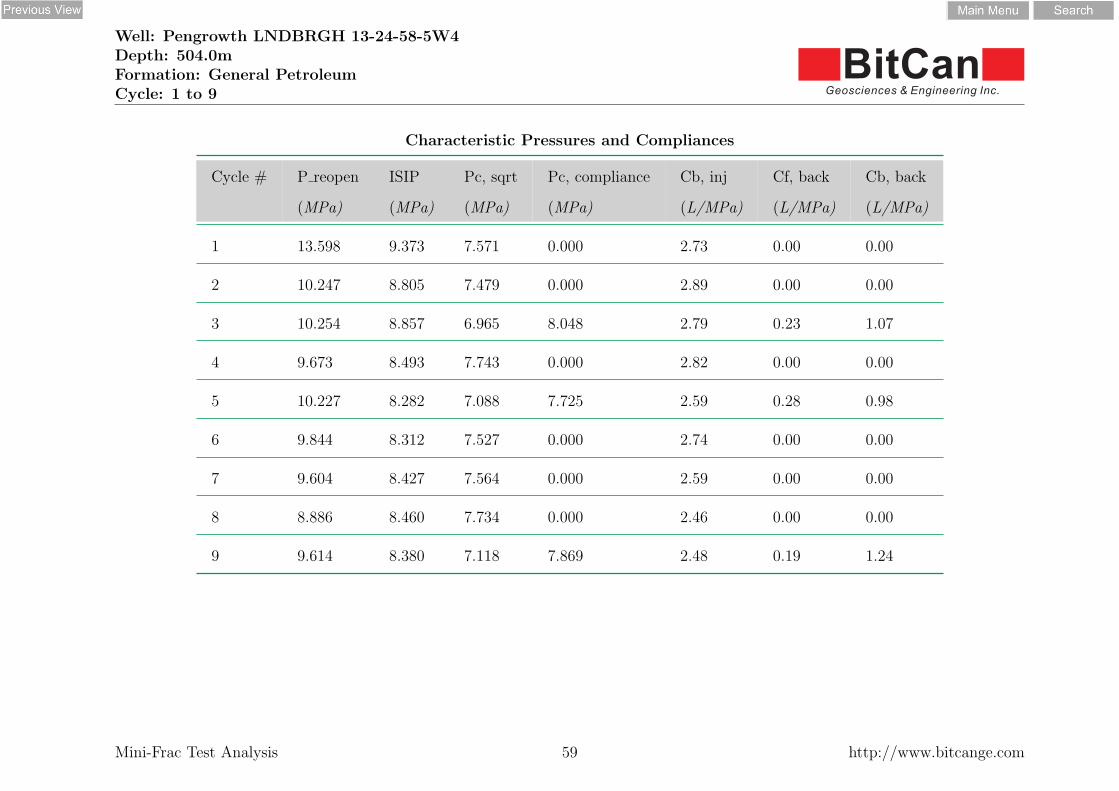
Well: Pengrowth LNDBRGH 13-24-58-5W4Depth: 504.0mFormation: General PetroleumCycle: 1 to 9
BitCanGeosciences & Engineering Inc.
Characteristic Pressures and Compliances
Cycle # P reopen ISIP Pc, sqrt Pc, compliance Cb, inj Cf, back Cb, back
(MPa) (MPa) (MPa) (MPa) (L/MPa) (L/MPa) (L/MPa)
1 13.598 9.373 7.571 0.000 2.73 0.00 0.00
2 10.247 8.805 7.479 0.000 2.89 0.00 0.00
3 10.254 8.857 6.965 8.048 2.79 0.23 1.07
4 9.673 8.493 7.743 0.000 2.82 0.00 0.00
5 10.227 8.282 7.088 7.725 2.59 0.28 0.98
6 9.844 8.312 7.527 0.000 2.74 0.00 0.00
7 9.604 8.427 7.564 0.000 2.59 0.00 0.00
8 8.886 8.460 7.734 0.000 2.46 0.00 0.00
9 9.614 8.380 7.118 7.869 2.48 0.19 1.24
Mini-Frac Test Analysis 59 http://www.bitcange.com

ANALYSIS PLOTS
WELL: LNDBRGH 13-24-58-5W4
Test 2: General Petroleum (GP) caprock at 514 m TVD

Mini-Frac Test
pres
sure
(MP
a)
0
2
4
6
8
10
12
14
flow rate(L/m
in)
-20
0
20
40
60
80
100
120
time(s)1,000 2,000 3,000 4,000 5,000 6,000
0 1 2 3 4 5 6 7
Pump Preussure Well Head Preussure High Flow Rate Low Flow Rate Flow Back Rate
BitCanGeosciences & Engineering Inc. www.bitcange.com
Client:Well:Depth:
Formation:Start @:
Pengrowtg
514
CaprockMon Jan 2 17:07:22 2012
Generated by MiniMonitor

Mini-Frac Test
pres
sure
(MP
a)
0
2
4
6
8
10
12
14
volume(L)
0
200
400
600
800
1,000
1,200
time(s)1,000 2,000 3,000 4,000 5,000 6,000
0 1 2 3 4 5 6 7
Pump Preussure Well Head Preussure Volume Injected
BitCanGeosciences & Engineering Inc. www.bitcange.com
Client:Well:Depth:
Formation:Start @:
Pengrowtg
514
CaprockMon Jan 2 17:07:22 2012
Generated by MiniMonitor

Well: Pengrowth 13-24-58-5W4Depth: 514.0mFormation: General PetroleumCycle: 01
BitCanGeosciences & Engineering Inc.
0 50 100 150 200 250Relative time(s)
6
8
10
12
14
16
18
20
BH
P(M
Pa)
BHP and Injection Rate
�10
0
10
20
30
40
50
60
Inje
ctio
n r
ate
(L/min
)
BHPInjection rate
Mini-Frac Test Analysis 1 http://www.bitcange.com

Well: Pengrowth 13-24-58-5W4Depth: 514.0mFormation: General PetroleumCycle: 01
BitCanGeosciences & Engineering Inc.
�10 0 10 20 30 40 50Injection volume(L)
6
8
10
12
14
16
18
20
BH
P(MPa)
Reopen Pressure: 16.97 MPa
P-V
Mini-Frac Test Analysis 2 http://www.bitcange.com

Well: Pengrowth 13-24-58-5W4Depth: 514.0mFormation: General PetroleumCycle: 01
BitCanGeosciences & Engineering Inc.
0 10 20 30 40 50 60 70 80 90Relative time(s)
8.55
8.60
8.65
8.70
8.75
8.80
8.85
8.90
8.95
9.00
BH
P(M
Pa)
ISIP: 8.833 MPa
P-�t
Mini-Frac Test Analysis 3 http://www.bitcange.com

Well: Pengrowth 13-24-58-5W4Depth: 514.0mFormation: General PetroleumCycle: 01
BitCanGeosciences & Engineering Inc.
0.0 0.5 1.0 1.5 2.0lg(relative time)
�1.2
�1.0
�0.8
�0.6
�0.4lg
(BH
P)
1st Slope: 0.51
2nd Slope: 0.27
lg(�P)-lg(�t)
Mini-Frac Test Analysis 4 http://www.bitcange.com

Well: Pengrowth 13-24-58-5W4Depth: 514.0mFormation: General PetroleumCycle: 01
BitCanGeosciences & Engineering Inc.
0 2 4 6 8 10Sqrt(relative time)
8.55
8.60
8.65
8.70
8.75
8.80
8.85
8.90
8.95
9.00
BH
P(M
Pa)
Closure Pressure: 8.65 MPa
P-�
�t
Mini-Frac Test Analysis 5 http://www.bitcange.com

Well: Pengrowth 13-24-58-5W4Depth: 514.0mFormation: General PetroleumCycle: 01
BitCanGeosciences & Engineering Inc.
0.0 0.5 1.0 1.5 2.0lg(�t)
�1.30
�1.25
�1.20
�1.15
�1.10
�1.05
�1.00
�0.95
�0.90
lg(�
tdP/d
�
t)1st Slope: 0.15
2nd Slope: 0.25
3rd Slope: 0.43
lg(�tdP/d�t)-lg(�t)
Mini-Frac Test Analysis 6 http://www.bitcange.com

Well: Pengrowth 13-24-58-5W4Depth: 514.0mFormation: General PetroleumCycle: 02
BitCanGeosciences & Engineering Inc.
0 50 100 150 200 250 300 350 400Relative time(s)
5
6
7
8
9
10
11
12
BH
P(M
Pa)
BHP and Injection Rate
�10
0
10
20
30
40
50
60
Inje
ctio
n r
ate
(L/min
)
BHPInjection rate
Mini-Frac Test Analysis 7 http://www.bitcange.com

Well: Pengrowth 13-24-58-5W4Depth: 514.0mFormation: General PetroleumCycle: 02
BitCanGeosciences & Engineering Inc.
0 5 10 15 20 25 30Injection volume(L)
5
6
7
8
9
10
11
12
BH
P(MPa)
Reopen Pressure: 10.024 MPa
P-V
Mini-Frac Test Analysis 8 http://www.bitcange.com

Well: Pengrowth 13-24-58-5W4Depth: 514.0mFormation: General PetroleumCycle: 02
BitCanGeosciences & Engineering Inc.
0 10 20 30 40 50 60 70 80 90Relative time(s)
8.1
8.2
8.3
8.4
8.5
8.6
8.7
8.8
8.9
BH
P(M
Pa)
ISIP: 8.789 MPa
P-�t
Mini-Frac Test Analysis 9 http://www.bitcange.com

Well: Pengrowth 13-24-58-5W4Depth: 514.0mFormation: General PetroleumCycle: 02
BitCanGeosciences & Engineering Inc.
0.0 0.5 1.0 1.5 2.0 2.5lg(relative time)
�1.5
�1.0
�0.5
0.0
0.5
lg(B
HP)
1st Slope: 0.63
2nd Slope: 0.6
lg(�P)-lg(�t)
Mini-Frac Test Analysis 10 http://www.bitcange.com

Well: Pengrowth 13-24-58-5W4Depth: 514.0mFormation: General PetroleumCycle: 02
BitCanGeosciences & Engineering Inc.
0 2 4 6 8 10 12 14Sqrt(relative time)
6.0
6.5
7.0
7.5
8.0
8.5
9.0
BH
P(M
Pa)
Closure Pressure: 8.323 MPa
P-�
�t
Mini-Frac Test Analysis 11 http://www.bitcange.com

Well: Pengrowth 13-24-58-5W4Depth: 514.0mFormation: General PetroleumCycle: 02
BitCanGeosciences & Engineering Inc.
�12 �10 �8 �6 �4 �2 0Flow back volume(L)
6.0
6.5
7.0
7.5
8.0
8.5
9.0
9.5
BH
P(M
Pa)
Closure Pressure: 8.019 MPa
1st Compliance: 8.04 L/MPa
2nd Compliance: 2.05 L/MPa
P-backV
Mini-Frac Test Analysis 12 http://www.bitcange.com

Well: Pengrowth 13-24-58-5W4Depth: 514.0mFormation: General PetroleumCycle: 02
BitCanGeosciences & Engineering Inc.
0.0 0.5 1.0 1.5 2.0 2.5lg(�t)
�2.0
�1.5
�1.0
�0.5
0.0
0.5
1.0
lg(�
tdP/d
�
t)1st Slope: 0.7
2nd Slope: 0.6
3rd Slope: 2.41
lg(�tdP/d�t)-lg(�t)
Mini-Frac Test Analysis 13 http://www.bitcange.com

Well: Pengrowth 13-24-58-5W4Depth: 514.0mFormation: General PetroleumCycle: 03
BitCanGeosciences & Engineering Inc.
0 50 100 150 200 250 300 350 400 450Relative time(s)
6
7
8
9
10
11
12
BH
P(M
Pa)
BHP and Injection Rate
�10
0
10
20
30
40
50
60
70
Inje
ctio
n r
ate
(L/min
)
BHPInjection rate
Mini-Frac Test Analysis 14 http://www.bitcange.com

Well: Pengrowth 13-24-58-5W4Depth: 514.0mFormation: General PetroleumCycle: 03
BitCanGeosciences & Engineering Inc.
0 5 10 15 20 25 30Injection volume(L)
7.0
7.5
8.0
8.5
9.0
9.5
10.0
10.5
11.0
11.5
BH
P(MPa)
Reopen Pressure: 9.791 MPa
P-V
Mini-Frac Test Analysis 15 http://www.bitcange.com

Well: Pengrowth 13-24-58-5W4Depth: 514.0mFormation: General PetroleumCycle: 03
BitCanGeosciences & Engineering Inc.
0 20 40 60 80 100Relative time(s)
8.0
8.1
8.2
8.3
8.4
8.5
8.6
8.7
8.8
BH
P(M
Pa)
ISIP: 8.727 MPa
P-�t
Mini-Frac Test Analysis 16 http://www.bitcange.com

Well: Pengrowth 13-24-58-5W4Depth: 514.0mFormation: General PetroleumCycle: 03
BitCanGeosciences & Engineering Inc.
0.0 0.5 1.0 1.5 2.0 2.5lg(relative time)
�2.0
�1.5
�1.0
�0.5
0.0
0.5
lg(B
HP)
1st Slope: 0.84
2nd Slope: 0.75
lg(�P)-lg(�t)
Mini-Frac Test Analysis 17 http://www.bitcange.com

Well: Pengrowth 13-24-58-5W4Depth: 514.0mFormation: General PetroleumCycle: 03
BitCanGeosciences & Engineering Inc.
0 2 4 6 8 10 12 14 16Sqrt(relative time)
6.0
6.5
7.0
7.5
8.0
8.5
9.0
BH
P(M
Pa)
Closure Pressure: 8.175 MPa
P-�
�t
Mini-Frac Test Analysis 18 http://www.bitcange.com

Well: Pengrowth 13-24-58-5W4Depth: 514.0mFormation: General PetroleumCycle: 03
BitCanGeosciences & Engineering Inc.
�12 �10 �8 �6 �4 �2 0Flow back volume(L)
6.0
6.5
7.0
7.5
8.0
8.5
9.0
BH
P(M
Pa)
Closure Pressure: 7.969 MPa
1st Compliance: 8.62 L/MPa
2nd Compliance: 2.33 L/MPa
P-backV
Mini-Frac Test Analysis 19 http://www.bitcange.com

Well: Pengrowth 13-24-58-5W4Depth: 514.0mFormation: General PetroleumCycle: 03
BitCanGeosciences & Engineering Inc.
0.0 0.5 1.0 1.5 2.0 2.5lg(�t)
�2.0
�1.5
�1.0
�0.5
0.0
0.5
1.0
lg(�
tdP/d
�
t)1st Slope: 0.62
2nd Slope: 0.74
3rd Slope: 2.45
lg(�tdP/d�t)-lg(�t)
Mini-Frac Test Analysis 20 http://www.bitcange.com

Well: Pengrowth 13-24-58-5W4Depth: 514.0mFormation: General PetroleumCycle: 04
BitCanGeosciences & Engineering Inc.
0 50 100 150 200 250 300 350 400 450Relative time(s)
6
7
8
9
10
11
12
BH
P(M
Pa)
BHP and Injection Rate
�20
0
20
40
60
80
100
Inje
ctio
n r
ate
(L/min
)
BHPInjection rate
Mini-Frac Test Analysis 21 http://www.bitcange.com

Well: Pengrowth 13-24-58-5W4Depth: 514.0mFormation: General PetroleumCycle: 04
BitCanGeosciences & Engineering Inc.
0 10 20 30 40 50Injection volume(L)
7.5
8.0
8.5
9.0
9.5
10.0
10.5
11.0
11.5
12.0
BH
P(MPa)
Reopen Pressure: 10.347 MPa
P-V
Mini-Frac Test Analysis 22 http://www.bitcange.com

Well: Pengrowth 13-24-58-5W4Depth: 514.0mFormation: General PetroleumCycle: 04
BitCanGeosciences & Engineering Inc.
0 20 40 60 80 100 120Relative time(s)
8.0
8.2
8.4
8.6
8.8B
HP(M
Pa)
ISIP: 8.811 MPa
P-�t
Mini-Frac Test Analysis 23 http://www.bitcange.com

Well: Pengrowth 13-24-58-5W4Depth: 514.0mFormation: General PetroleumCycle: 04
BitCanGeosciences & Engineering Inc.
0.0 0.5 1.0 1.5 2.0 2.5lg(relative time)
�2.0
�1.5
�1.0
�0.5
0.0
0.5
lg(B
HP)
1st Slope: 0.61
2nd Slope: 0.68
lg(�P)-lg(�t)
Mini-Frac Test Analysis 24 http://www.bitcange.com

Well: Pengrowth 13-24-58-5W4Depth: 514.0mFormation: General PetroleumCycle: 04
BitCanGeosciences & Engineering Inc.
0 2 4 6 8 10 12 14 16Sqrt(relative time)
6.0
6.5
7.0
7.5
8.0
8.5
9.0
BH
P(M
Pa)
Closure Pressure: 8.265 MPa
P-�
�t
Mini-Frac Test Analysis 25 http://www.bitcange.com

Well: Pengrowth 13-24-58-5W4Depth: 514.0mFormation: General PetroleumCycle: 04
BitCanGeosciences & Engineering Inc.
�14 �12 �10 �8 �6 �4 �2 0 2Flow back volume(L)
6.0
6.5
7.0
7.5
8.0
8.5
9.0
9.5
BH
P(M
Pa)
Closure Pressure: 7.979 MPa
1st Compliance: 11.35 L/MPa
2nd Compliance: 2.44 L/MPa
P-backV
Mini-Frac Test Analysis 26 http://www.bitcange.com

Well: Pengrowth 13-24-58-5W4Depth: 514.0mFormation: General PetroleumCycle: 04
BitCanGeosciences & Engineering Inc.
0.0 0.5 1.0 1.5 2.0 2.5lg(�t)
�2.0
�1.5
�1.0
�0.5
0.0
0.5
1.0
lg(�
tdP/d
�
t)1st Slope: 0.48
2nd Slope: 0.45
3rd Slope: 2.32
lg(�tdP/d�t)-lg(�t)
Mini-Frac Test Analysis 27 http://www.bitcange.com

Well: Pengrowth 13-24-58-5W4Depth: 514.0mFormation: General PetroleumCycle: 05
BitCanGeosciences & Engineering Inc.
0 500 1000 1500 2000Relative time(s)
5
6
7
8
9
10
11
12
BH
P(M
Pa)
BHP and Injection Rate
�20
0
20
40
60
80
100
Inje
ctio
n r
ate
(L/min
)
BHPInjection rate
Mini-Frac Test Analysis 28 http://www.bitcange.com

Well: Pengrowth 13-24-58-5W4Depth: 514.0mFormation: General PetroleumCycle: 05
BitCanGeosciences & Engineering Inc.
�10 0 10 20 30 40 50 60 70 80Injection volume(L)
7.5
8.0
8.5
9.0
9.5
10.0
10.5
11.0
11.5
12.0
BH
P(MPa)
Reopen Pressure: 10.642 MPa
P-V
Mini-Frac Test Analysis 29 http://www.bitcange.com

Well: Pengrowth 13-24-58-5W4Depth: 514.0mFormation: General PetroleumCycle: 05
BitCanGeosciences & Engineering Inc.
0 100 200 300 400 500 600Relative time(s)
7.2
7.4
7.6
7.8
8.0
8.2
8.4
8.6
8.8
9.0
BH
P(M
Pa)
ISIP: 8.689 MPa
P-�t
Mini-Frac Test Analysis 30 http://www.bitcange.com

Well: Pengrowth 13-24-58-5W4Depth: 514.0mFormation: General PetroleumCycle: 05
BitCanGeosciences & Engineering Inc.
0.0 0.5 1.0 1.5 2.0 2.5 3.0 3.5lg(relative time)
�2.0
�1.5
�1.0
�0.5
0.0
0.5
lg(B
HP)
1st Slope: 0.68
2nd Slope: 0.74
lg(�P)-lg(�t)
Mini-Frac Test Analysis 31 http://www.bitcange.com

Well: Pengrowth 13-24-58-5W4Depth: 514.0mFormation: General PetroleumCycle: 05
BitCanGeosciences & Engineering Inc.
0 5 10 15 20 25 30 35 40 45Sqrt(relative time)
5.5
6.0
6.5
7.0
7.5
8.0
8.5
9.0
BH
P(M
Pa)
Closure Pressure: 7.715 MPa
P-�
�t
Mini-Frac Test Analysis 32 http://www.bitcange.com

Well: Pengrowth 13-24-58-5W4Depth: 514.0mFormation: General PetroleumCycle: 05
BitCanGeosciences & Engineering Inc.
�16 �14 �12 �10 �8 �6 �4 �2 0 2Flow back volume(L)
5.5
6.0
6.5
7.0
7.5
8.0
8.5
9.0
9.5
10.0
BH
P(M
Pa)
Closure Pressure: 7.774 MPa
1st Compliance: 11.43 L/MPa
2nd Compliance: 2.51 L/MPa
P-backV
Mini-Frac Test Analysis 33 http://www.bitcange.com

Well: Pengrowth 13-24-58-5W4Depth: 514.0mFormation: General PetroleumCycle: 05
BitCanGeosciences & Engineering Inc.
0.0 0.5 1.0 1.5 2.0 2.5 3.0 3.5lg(�t)
�3.0
�2.5
�2.0
�1.5
�1.0
�0.5
0.0
0.5
1.0
lg(�
tdP/d
�
t)1st Slope: 0.73
2nd Slope: 0.94
3rd Slope: -0.6
lg(�tdP/d�t)-lg(�t)
Mini-Frac Test Analysis 34 http://www.bitcange.com

Well: Pengrowth 13-24-58-5W4Depth: 514.0mFormation: General PetroleumCycle: 06
BitCanGeosciences & Engineering Inc.
0 50 100 150 200 250 300 350 400Relative time(s)
5
6
7
8
9
10
11
12
BH
P(M
Pa)
BHP and Injection Rate
�20
0
20
40
60
80
100
120
Inje
ctio
n r
ate
(L/min
)
BHPInjection rate
Mini-Frac Test Analysis 35 http://www.bitcange.com

Well: Pengrowth 13-24-58-5W4Depth: 514.0mFormation: General PetroleumCycle: 06
BitCanGeosciences & Engineering Inc.
0 10 20 30 40 50 60Injection volume(L)
6
7
8
9
10
11
12
BH
P(MPa)
Reopen Pressure: 10.591 MPa
P-V
Mini-Frac Test Analysis 36 http://www.bitcange.com

Well: Pengrowth 13-24-58-5W4Depth: 514.0mFormation: General PetroleumCycle: 06
BitCanGeosciences & Engineering Inc.
0 5 10 15 20 25 30 35 40Relative time(s)
8.4
8.5
8.6
8.7
8.8
8.9
9.0
BH
P(M
Pa)
ISIP: 8.906 MPa
P-�t
Mini-Frac Test Analysis 37 http://www.bitcange.com

Well: Pengrowth 13-24-58-5W4Depth: 514.0mFormation: General PetroleumCycle: 06
BitCanGeosciences & Engineering Inc.
0.0 0.5 1.0 1.5 2.0 2.5lg(relative time)
�1.5
�1.0
�0.5
0.0
0.5
1.0
lg(B
HP)
1st Slope: 0.52
2nd Slope: 0.63
lg(�P)-lg(�t)
Mini-Frac Test Analysis 38 http://www.bitcange.com

Well: Pengrowth 13-24-58-5W4Depth: 514.0mFormation: General PetroleumCycle: 06
BitCanGeosciences & Engineering Inc.
0 2 4 6 8 10 12 14 16Sqrt(relative time)
5.5
6.0
6.5
7.0
7.5
8.0
8.5
9.0
BH
P(M
Pa)
Closure Pressure: 8.045 MPa
P-�
�t
Mini-Frac Test Analysis 39 http://www.bitcange.com

Well: Pengrowth 13-24-58-5W4Depth: 514.0mFormation: General PetroleumCycle: 06
BitCanGeosciences & Engineering Inc.
�20 �15 �10 �5 0 5Flow back volume(L)
5.5
6.0
6.5
7.0
7.5
8.0
8.5
9.0
BH
P(M
Pa)
Closure Pressure: 7.768 MPa
1st Compliance: 10.78 L/MPa
2nd Compliance: 3.43 L/MPa
P-backV
Mini-Frac Test Analysis 40 http://www.bitcange.com

Well: Pengrowth 13-24-58-5W4Depth: 514.0mFormation: General PetroleumCycle: 06
BitCanGeosciences & Engineering Inc.
0.0 0.5 1.0 1.5 2.0 2.5lg(�t)
�1.5
�1.0
�0.5
0.0
0.5
1.0
lg(�
tdP/d
�
t)1st Slope: 0.72
2nd Slope: 0.61
3rd Slope: 2.18
lg(�tdP/d�t)-lg(�t)
Mini-Frac Test Analysis 41 http://www.bitcange.com

Well: Pengrowth 13-24-58-5W4Depth: 514.0mFormation: General PetroleumCycle: 07
BitCanGeosciences & Engineering Inc.
0 100 200 300 400 500Relative time(s)
6.0
6.5
7.0
7.5
8.0
8.5
9.0
9.5
10.0
10.5
BH
P(M
Pa)
BHP and Injection Rate
�20
0
20
40
60
80
100
Inje
ctio
n r
ate
(L/min
)
BHPInjection rate
Mini-Frac Test Analysis 42 http://www.bitcange.com

Well: Pengrowth 13-24-58-5W4Depth: 514.0mFormation: General PetroleumCycle: 07
BitCanGeosciences & Engineering Inc.
�2 0 2 4 6 8 10 12Injection volume(L)
8.5
9.0
9.5
10.0
BH
P(MPa)
Reopen Pressure: 9.281 MPa
P-V
Mini-Frac Test Analysis 43 http://www.bitcange.com

Well: Pengrowth 13-24-58-5W4Depth: 514.0mFormation: General PetroleumCycle: 07
BitCanGeosciences & Engineering Inc.
0 5 10 15 20 25 30Relative time(s)
8.4
8.5
8.6
8.7
8.8
8.9
9.0
BH
P(M
Pa)
ISIP: 8.842 MPa
P-�t
Mini-Frac Test Analysis 44 http://www.bitcange.com

Well: Pengrowth 13-24-58-5W4Depth: 514.0mFormation: General PetroleumCycle: 07
BitCanGeosciences & Engineering Inc.
0.0 0.5 1.0 1.5 2.0 2.5lg(relative time)
�1.4
�1.2
�1.0
�0.8
�0.6
�0.4
�0.2
0.0
0.2
lg(B
HP)
1st Slope: 0.61
2nd Slope: 0.58
lg(�P)-lg(�t)
Mini-Frac Test Analysis 45 http://www.bitcange.com

Well: Pengrowth 13-24-58-5W4Depth: 514.0mFormation: General PetroleumCycle: 07
BitCanGeosciences & Engineering Inc.
0 2 4 6 8 10 12 14Sqrt(relative time)
6.0
6.5
7.0
7.5
8.0
8.5
9.0
BH
P(M
Pa)
Closure Pressure: 8.027 MPa
P-�
�t
Mini-Frac Test Analysis 46 http://www.bitcange.com

Well: Pengrowth 13-24-58-5W4Depth: 514.0mFormation: General PetroleumCycle: 07
BitCanGeosciences & Engineering Inc.
�20 �15 �10 �5 0Flow back volume(L)
6.0
6.5
7.0
7.5
8.0
8.5
9.0
9.5
BH
P(M
Pa)
Closure Pressure: 7.97 MPa
1st Compliance: 17.25 L/MPa
2nd Compliance: 3.96 L/MPa
P-backV
Mini-Frac Test Analysis 47 http://www.bitcange.com

Well: Pengrowth 13-24-58-5W4Depth: 514.0mFormation: General PetroleumCycle: 07
BitCanGeosciences & Engineering Inc.
0.0 0.5 1.0 1.5 2.0 2.5lg(�t)
�1.5
�1.0
�0.5
0.0
0.5
1.0
lg(�
tdP/d
�
t)1st Slope: 0.73
2nd Slope: 0.4
3rd Slope: 1.63
lg(�tdP/d�t)-lg(�t)
Mini-Frac Test Analysis 48 http://www.bitcange.com

Well: Pengrowth 13-24-58-5W4Depth: 514.0mFormation: General PetroleumCycle: 08
BitCanGeosciences & Engineering Inc.
0 50 100 150 200 250 300 350 400 450Relative time(s)
8.0
8.5
9.0
9.5
10.0
10.5
BH
P(M
Pa)
BHP and Injection Rate
�10
0
10
20
30
40
50
Inje
ctio
n r
ate
(L/min
)
BHPInjection rate
Mini-Frac Test Analysis 49 http://www.bitcange.com

Well: Pengrowth 13-24-58-5W4Depth: 514.0mFormation: General PetroleumCycle: 08
BitCanGeosciences & Engineering Inc.
�5 0 5 10 15 20 25Injection volume(L)
8.0
8.5
9.0
9.5
10.0
10.5
BH
P(MPa)
Reopen Pressure: 9.719 MPa
P-V
Mini-Frac Test Analysis 50 http://www.bitcange.com

Well: Pengrowth 13-24-58-5W4Depth: 514.0mFormation: General PetroleumCycle: 08
BitCanGeosciences & Engineering Inc.
0 20 40 60 80 100 120 140 160 180Relative time(s)
8.55
8.60
8.65
8.70
8.75
8.80
8.85
8.90
BH
P(M
Pa)
ISIP: 8.83 MPa
P-�t
Mini-Frac Test Analysis 51 http://www.bitcange.com

Well: Pengrowth 13-24-58-5W4Depth: 514.0mFormation: General PetroleumCycle: 08
BitCanGeosciences & Engineering Inc.
0.0 0.5 1.0 1.5 2.0 2.5lg(relative time)
�1.8
�1.6
�1.4
�1.2
�1.0
�0.8
�0.6
�0.4
�0.2
lg(B
HP)
1st Slope: 0.82
2nd Slope: 0.52
lg(�P)-lg(�t)
Mini-Frac Test Analysis 52 http://www.bitcange.com

Well: Pengrowth 13-24-58-5W4Depth: 514.0mFormation: General PetroleumCycle: 08
BitCanGeosciences & Engineering Inc.
0 2 4 6 8 10 12 14 16 18Sqrt(relative time)
8.45
8.50
8.55
8.60
8.65
8.70
8.75
8.80
8.85
8.90
BH
P(M
Pa)
Closure Pressure: 8.635 MPa
P-�
�t
Mini-Frac Test Analysis 53 http://www.bitcange.com

Well: Pengrowth 13-24-58-5W4Depth: 514.0mFormation: General PetroleumCycle: 08
BitCanGeosciences & Engineering Inc.
0.0 0.5 1.0 1.5 2.0 2.5 3.0lg(�t)
�1.8
�1.6
�1.4
�1.2
�1.0
�0.8
�0.6
lg(�
tdP/d
�
t)1st Slope: 0.46
2nd Slope: 0.5
3rd Slope: 0.25
lg(�tdP/d�t)-lg(�t)
Mini-Frac Test Analysis 54 http://www.bitcange.com

Well: Pengrowth 13-24-58-5W4Depth: 514.0mFormation: General PetroleumCycle: 1 to 8
BitCanGeosciences & Engineering Inc.
0 1 2 3 4 5 6 7 8 9Cycle
0
2
4
6
8
10
12
14
16
18
Pre
ssure
(MPa)
Summary
P_reopen
ISIPPc, sqrtPc, compliance
Mini-Frac Test Analysis 55 http://www.bitcange.com
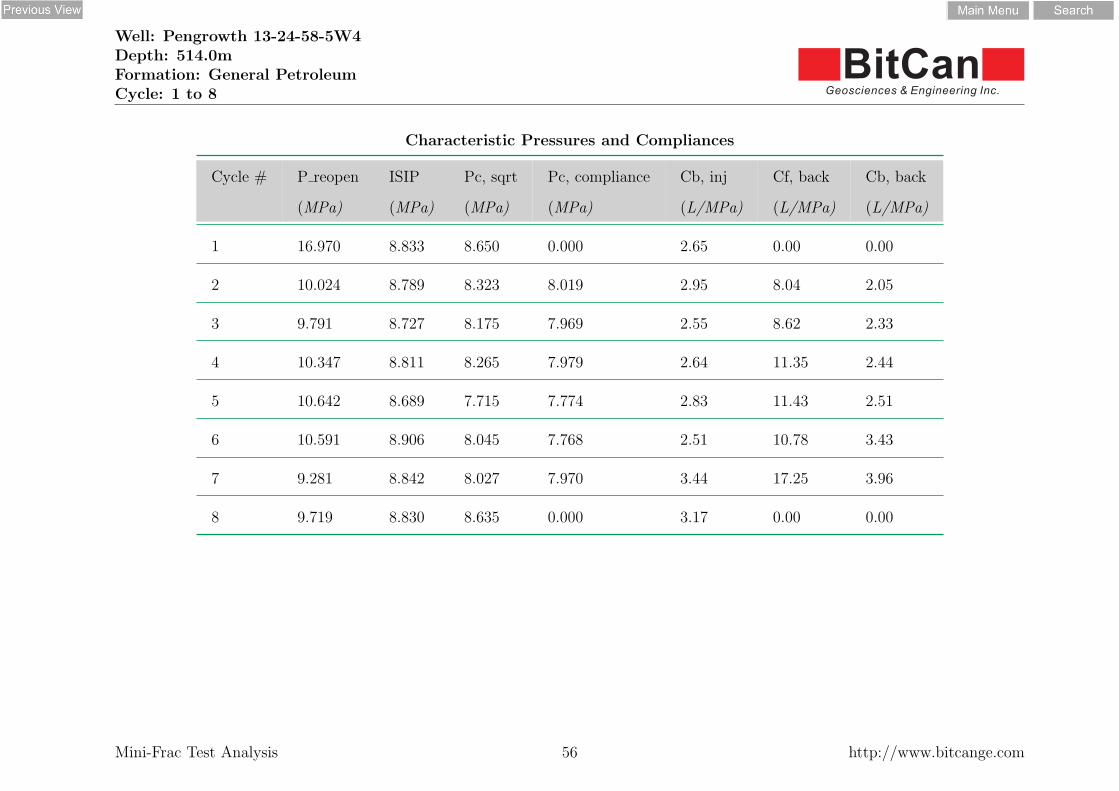
Well: Pengrowth 13-24-58-5W4Depth: 514.0mFormation: General PetroleumCycle: 1 to 8
BitCanGeosciences & Engineering Inc.
Characteristic Pressures and Compliances
Cycle # P reopen ISIP Pc, sqrt Pc, compliance Cb, inj Cf, back Cb, back
(MPa) (MPa) (MPa) (MPa) (L/MPa) (L/MPa) (L/MPa)
1 16.970 8.833 8.650 0.000 2.65 0.00 0.00
2 10.024 8.789 8.323 8.019 2.95 8.04 2.05
3 9.791 8.727 8.175 7.969 2.55 8.62 2.33
4 10.347 8.811 8.265 7.979 2.64 11.35 2.44
5 10.642 8.689 7.715 7.774 2.83 11.43 2.51
6 10.591 8.906 8.045 7.768 2.51 10.78 3.43
7 9.281 8.842 8.027 7.970 3.44 17.25 3.96
8 9.719 8.830 8.635 0.000 3.17 0.00 0.00
Mini-Frac Test Analysis 56 http://www.bitcange.com

ANALYSIS PLOTS
WELL: LNDBRGH 13-24-58-5W4
Test 3: Lloydminster payzone at 530 m

Mini-Frac Test
pres
sure
(MP
a)
-2
0
2
4
6
8
10
12
14
16
flow rate(L/m
in)
-20
0
20
40
60
80
100
120
time(s)1,000 2,000 3,000 4,000
0 1 2 3 4 5 6 7 8
Pump Preussure Well Head Preussure High Flow Rate Low Flow Rate Flow Back Rate
BitCanGeosciences & Engineering Inc. www.bitcange.com
Client:Well:Depth:
Formation:Start @:
PenGrowth5-17530
OilsandsMon Jan 2 12:42:15 2012
Generated by MiniMonitor

Mini-Frac Test
pres
sure
(MP
a)
-2
0
2
4
6
8
10
12
14
16
volume(L)
-200
0
200
400
600
800
1,000
1,200
1,400
time(s)1,000 2,000 3,000 4,000
0 1 2 3 4 5 6 7 8
Pump Preussure Well Head Preussure Volume Injected
BitCanGeosciences & Engineering Inc. www.bitcange.com
Client:Well:Depth:
Formation:Start @:
PenGrowth5-17530
OilsandsMon Jan 2 12:42:15 2012
Generated by MiniMonitor

Well: Pengrowth 13-24-58-5W4Depth: 530.0mFormation: LloydminsterCycle: 01
BitCanGeosciences & Engineering Inc.
0 50 100 150 200 250 300 350Relative time(s)
4
6
8
10
12
14
16
18
20
22
BH
P(M
Pa)
BHP and Injection Rate
�10
0
10
20
30
40
50
60
Inje
ctio
n r
ate
(L/min
)
BHPInjection rate
Mini-Frac Test Analysis 1 http://www.bitcange.com

Well: Pengrowth 13-24-58-5W4Depth: 530.0mFormation: LloydminsterCycle: 01
BitCanGeosciences & Engineering Inc.
0 10 20 30 40 50 60 70Injection volume(L)
4
6
8
10
12
14
16
18
20
22
BH
P(MPa)
Reopen Pressure: 15.327 MPa
P-V
Mini-Frac Test Analysis 2 http://www.bitcange.com

Well: Pengrowth 13-24-58-5W4Depth: 530.0mFormation: LloydminsterCycle: 01
BitCanGeosciences & Engineering Inc.
0 10 20 30 40 50 60Relative time(s)
5
6
7
8
9
10
11
BH
P(M
Pa)
ISIP: 9.136 MPa
P-�t
Mini-Frac Test Analysis 3 http://www.bitcange.com

Well: Pengrowth 13-24-58-5W4Depth: 530.0mFormation: LloydminsterCycle: 01
BitCanGeosciences & Engineering Inc.
0.0 0.5 1.0 1.5 2.0lg(relative time)
�0.6
�0.4
�0.2
0.0
0.2
0.4
0.6
0.8
lg(B
HP)
1st Slope: 1.05
2nd Slope: 0.78
lg(�P)-lg(�t)
Mini-Frac Test Analysis 4 http://www.bitcange.com

Well: Pengrowth 13-24-58-5W4Depth: 530.0mFormation: LloydminsterCycle: 01
BitCanGeosciences & Engineering Inc.
0 1 2 3 4 5 6 7 8 9Sqrt(relative time)
5
6
7
8
9
10
11
BH
P(M
Pa)
Closure Pressure: 7.456 MPa
P-�
�t
Mini-Frac Test Analysis 5 http://www.bitcange.com

Well: Pengrowth 13-24-58-5W4Depth: 530.0mFormation: LloydminsterCycle: 01
BitCanGeosciences & Engineering Inc.
0.0 0.5 1.0 1.5 2.0lg(�t)
�0.6
�0.4
�0.2
0.0
0.2
0.4
0.6
0.8
lg(�
tdP/d
�
t)1st Slope: 0.85
2nd Slope: 0.56
3rd Slope: -0.01
lg(�tdP/d�t)-lg(�t)
Mini-Frac Test Analysis 6 http://www.bitcange.com

Well: Pengrowth 13-24-58-5W4Depth: 530.0mFormation: LloydminsterCycle: 02
BitCanGeosciences & Engineering Inc.
0 50 100 150 200 250 300Relative time(s)
5
6
7
8
9
10
11
12
13
BH
P(M
Pa)
BHP and Injection Rate
�10
0
10
20
30
40
50
60
Inje
ctio
n r
ate
(L/min
)
BHPInjection rate
Mini-Frac Test Analysis 7 http://www.bitcange.com

Well: Pengrowth 13-24-58-5W4Depth: 530.0mFormation: LloydminsterCycle: 02
BitCanGeosciences & Engineering Inc.
0 10 20 30 40 50Injection volume(L)
5
6
7
8
9
10
11
12
13
BH
P(MPa)
Reopen Pressure: 8.346 MPa
P-V
Mini-Frac Test Analysis 8 http://www.bitcange.com

Well: Pengrowth 13-24-58-5W4Depth: 530.0mFormation: LloydminsterCycle: 02
BitCanGeosciences & Engineering Inc.
0 5 10 15 20 25 30 35 40Relative time(s)
6
7
8
9
10
11
12
BH
P(M
Pa)
ISIP: 10.09 MPa
P-�t
Mini-Frac Test Analysis 9 http://www.bitcange.com

Well: Pengrowth 13-24-58-5W4Depth: 530.0mFormation: LloydminsterCycle: 02
BitCanGeosciences & Engineering Inc.
0.0 0.5 1.0 1.5 2.0 2.5lg(relative time)
�0.6
�0.4
�0.2
0.0
0.2
0.4
0.6
0.8
lg(B
HP)
1st Slope: 0.92
2nd Slope: 0.78
lg(�P)-lg(�t)
Mini-Frac Test Analysis 10 http://www.bitcange.com

Well: Pengrowth 13-24-58-5W4Depth: 530.0mFormation: LloydminsterCycle: 02
BitCanGeosciences & Engineering Inc.
0 2 4 6 8 10 12Sqrt(relative time)
5
6
7
8
9
10
11
12
BH
P(M
Pa)
Closure Pressure: 7.61 MPa
P-�
�t
Mini-Frac Test Analysis 11 http://www.bitcange.com

Well: Pengrowth 13-24-58-5W4Depth: 530.0mFormation: LloydminsterCycle: 02
BitCanGeosciences & Engineering Inc.
0.0 0.5 1.0 1.5 2.0 2.5lg(�t)
�0.8
�0.6
�0.4
�0.2
0.0
0.2
0.4
0.6
0.8
lg(�
tdP/d
�
t)1st Slope: 0.84
2nd Slope: 0.49
3rd Slope: -0.04
lg(�tdP/d�t)-lg(�t)
Mini-Frac Test Analysis 12 http://www.bitcange.com

Well: Pengrowth 13-24-58-5W4Depth: 530.0mFormation: LloydminsterCycle: 03
BitCanGeosciences & Engineering Inc.
0 50 100 150 200Relative time(s)
5
6
7
8
9
10
11
12
13
14
BH
P(M
Pa)
BHP and Injection Rate
�20
0
20
40
60
80
100
Inje
ctio
n r
ate
(L/min
)
BHPInjection rate
Mini-Frac Test Analysis 13 http://www.bitcange.com

Well: Pengrowth 13-24-58-5W4Depth: 530.0mFormation: LloydminsterCycle: 03
BitCanGeosciences & Engineering Inc.
0 20 40 60 80 100Injection volume(L)
5
6
7
8
9
10
11
12
13
14
BH
P(MPa)
Reopen Pressure: 8.145 MPa
P-V
Mini-Frac Test Analysis 14 http://www.bitcange.com

Well: Pengrowth 13-24-58-5W4Depth: 530.0mFormation: LloydminsterCycle: 03
BitCanGeosciences & Engineering Inc.
0 5 10 15 20 25 30 35 40Relative time(s)
5.5
6.0
6.5
7.0
7.5
8.0
8.5
BH
P(M
Pa)
ISIP: 7.12 MPa
P-�t
Mini-Frac Test Analysis 15 http://www.bitcange.com

Well: Pengrowth 13-24-58-5W4Depth: 530.0mFormation: LloydminsterCycle: 03
BitCanGeosciences & Engineering Inc.
0.0 0.2 0.4 0.6 0.8 1.0 1.2 1.4 1.6 1.8lg(relative time)
�0.4
�0.2
0.0
0.2
0.4lg
(BH
P)
1st Slope: 1.07
2nd Slope: 0.76
lg(�P)-lg(�t)
Mini-Frac Test Analysis 16 http://www.bitcange.com

Well: Pengrowth 13-24-58-5W4Depth: 530.0mFormation: LloydminsterCycle: 03
BitCanGeosciences & Engineering Inc.
0 1 2 3 4 5 6 7 8Sqrt(relative time)
5.5
6.0
6.5
7.0
7.5
8.0
8.5
BH
P(M
Pa)
Closure Pressure: 6.256 MPa
P-�
�t
Mini-Frac Test Analysis 17 http://www.bitcange.com

Well: Pengrowth 13-24-58-5W4Depth: 530.0mFormation: LloydminsterCycle: 03
BitCanGeosciences & Engineering Inc.
0.0 0.2 0.4 0.6 0.8 1.0 1.2 1.4 1.6 1.8lg(�t)
�2.0
�1.5
�1.0
�0.5
0.0
0.5
lg(�
tdP/d
�
t)1st Slope: 0.56
2nd Slope: 0.46
3rd Slope: 0.04
lg(�tdP/d�t)-lg(�t)
Mini-Frac Test Analysis 18 http://www.bitcange.com

Well: Pengrowth 13-24-58-5W4Depth: 530.0mFormation: LloydminsterCycle: 04
BitCanGeosciences & Engineering Inc.
0 50 100 150 200Relative time(s)
5.0
5.5
6.0
6.5
7.0
7.5
8.0
8.5
9.0
9.5
BH
P(M
Pa)
BHP and Injection Rate
�20
0
20
40
60
80
100
Inje
ctio
n r
ate
(L/min
)
BHPInjection rate
Mini-Frac Test Analysis 19 http://www.bitcange.com

Well: Pengrowth 13-24-58-5W4Depth: 530.0mFormation: LloydminsterCycle: 04
BitCanGeosciences & Engineering Inc.
0 5 10 15 20 25 30Injection volume(L)
5.0
5.5
6.0
6.5
7.0
7.5
8.0
8.5
9.0
9.5
BH
P(MPa)
Reopen Pressure: 6.556 MPa
P-V
Mini-Frac Test Analysis 20 http://www.bitcange.com

Well: Pengrowth 13-24-58-5W4Depth: 530.0mFormation: LloydminsterCycle: 04
BitCanGeosciences & Engineering Inc.
0 2 4 6 8 10 12 14Relative time(s)
5.5
6.0
6.5
7.0
7.5
8.0
8.5
BH
P(M
Pa)
ISIP: 7.814 MPa
P-�t
Mini-Frac Test Analysis 21 http://www.bitcange.com

Well: Pengrowth 13-24-58-5W4Depth: 530.0mFormation: LloydminsterCycle: 04
BitCanGeosciences & Engineering Inc.
0.0 0.2 0.4 0.6 0.8 1.0 1.2 1.4 1.6 1.8lg(relative time)
�0.4
�0.3
�0.2
�0.1
0.0
0.1
0.2
0.3
0.4
0.5
lg(B
HP)
1st Slope: 0.85
2nd Slope: 0.72
lg(�P)-lg(�t)
Mini-Frac Test Analysis 22 http://www.bitcange.com

Well: Pengrowth 13-24-58-5W4Depth: 530.0mFormation: LloydminsterCycle: 04
BitCanGeosciences & Engineering Inc.
0 1 2 3 4 5 6Sqrt(relative time)
5.5
6.0
6.5
7.0
7.5
8.0
8.5
BH
P(M
Pa)
Closure Pressure: 6.187 MPa
P-�
�t
Mini-Frac Test Analysis 23 http://www.bitcange.com

Well: Pengrowth 13-24-58-5W4Depth: 530.0mFormation: LloydminsterCycle: 04
BitCanGeosciences & Engineering Inc.
0.0 0.2 0.4 0.6 0.8 1.0 1.2 1.4 1.6 1.8lg(�t)
�2.5
�2.0
�1.5
�1.0
�0.5
0.0
0.5
lg(�
tdP/d
�
t)1st Slope: 0.62
2nd Slope: 0.56
3rd Slope: -0.02
lg(�tdP/d�t)-lg(�t)
Mini-Frac Test Analysis 24 http://www.bitcange.com

Well: Pengrowth 13-24-58-5W4Depth: 530.0mFormation: LloydminsterCycle: 05
BitCanGeosciences & Engineering Inc.
0 50 100 150 200Relative time(s)
5.5
6.0
6.5
7.0
7.5
8.0
8.5
9.0
9.5
10.0
BH
P(M
Pa)
BHP and Injection Rate
�20
0
20
40
60
80
100
120
Inje
ctio
n r
ate
(L/min
)
BHPInjection rate
Mini-Frac Test Analysis 25 http://www.bitcange.com

Well: Pengrowth 13-24-58-5W4Depth: 530.0mFormation: LloydminsterCycle: 05
BitCanGeosciences & Engineering Inc.
0 5 10 15 20 25 30 35Injection volume(L)
5.5
6.0
6.5
7.0
7.5
8.0
8.5
9.0
9.5
BH
P(MPa)
Reopen Pressure: 7.207 MPa
P-V
Mini-Frac Test Analysis 26 http://www.bitcange.com

Well: Pengrowth 13-24-58-5W4Depth: 530.0mFormation: LloydminsterCycle: 05
BitCanGeosciences & Engineering Inc.
0 2 4 6 8 10Relative time(s)
5.5
6.0
6.5
7.0
7.5
8.0
8.5
9.0
BH
P(M
Pa)
ISIP: 8.219 MPa
P-�t
Mini-Frac Test Analysis 27 http://www.bitcange.com

Well: Pengrowth 13-24-58-5W4Depth: 530.0mFormation: LloydminsterCycle: 05
BitCanGeosciences & Engineering Inc.
0.0 0.2 0.4 0.6 0.8 1.0 1.2 1.4 1.6 1.8lg(relative time)
�0.2
�0.1
0.0
0.1
0.2
0.3
0.4
0.5
0.6
lg(B
HP)
1st Slope: 0.84
2nd Slope: 0.7
lg(�P)-lg(�t)
Mini-Frac Test Analysis 28 http://www.bitcange.com

Well: Pengrowth 13-24-58-5W4Depth: 530.0mFormation: LloydminsterCycle: 05
BitCanGeosciences & Engineering Inc.
0 1 2 3 4 5 6 7 8 9Sqrt(relative time)
5.5
6.0
6.5
7.0
7.5
8.0
8.5
9.0
BH
P(M
Pa)
Closure Pressure: 6.255 MPa
P-�
�t
Mini-Frac Test Analysis 29 http://www.bitcange.com

Well: Pengrowth 13-24-58-5W4Depth: 530.0mFormation: LloydminsterCycle: 05
BitCanGeosciences & Engineering Inc.
0.0 0.5 1.0 1.5 2.0lg(�t)
�2.0
�1.5
�1.0
�0.5
0.0
0.5
1.0
lg(�
tdP/d
�
t)1st Slope: 0.62
2nd Slope: 0.54
3rd Slope: -0.04
lg(�tdP/d�t)-lg(�t)
Mini-Frac Test Analysis 30 http://www.bitcange.com

Well: Pengrowth 13-24-58-5W4Depth: 530.0mFormation: LloydminsterCycle: 06
BitCanGeosciences & Engineering Inc.
0 20 40 60 80 100 120Relative time(s)
5.5
6.0
6.5
7.0
7.5
8.0
8.5
9.0
9.5
BH
P(M
Pa)
BHP and Injection Rate
�20
0
20
40
60
80
100
120
Inje
ctio
n r
ate
(L/min
)
BHPInjection rate
Mini-Frac Test Analysis 31 http://www.bitcange.com

Well: Pengrowth 13-24-58-5W4Depth: 530.0mFormation: LloydminsterCycle: 06
BitCanGeosciences & Engineering Inc.
0 5 10 15 20 25 30 35 40Injection volume(L)
5.5
6.0
6.5
7.0
7.5
8.0
8.5
9.0
9.5
BH
P(MPa)
Reopen Pressure: 7.589 MPa
P-V
Mini-Frac Test Analysis 32 http://www.bitcange.com
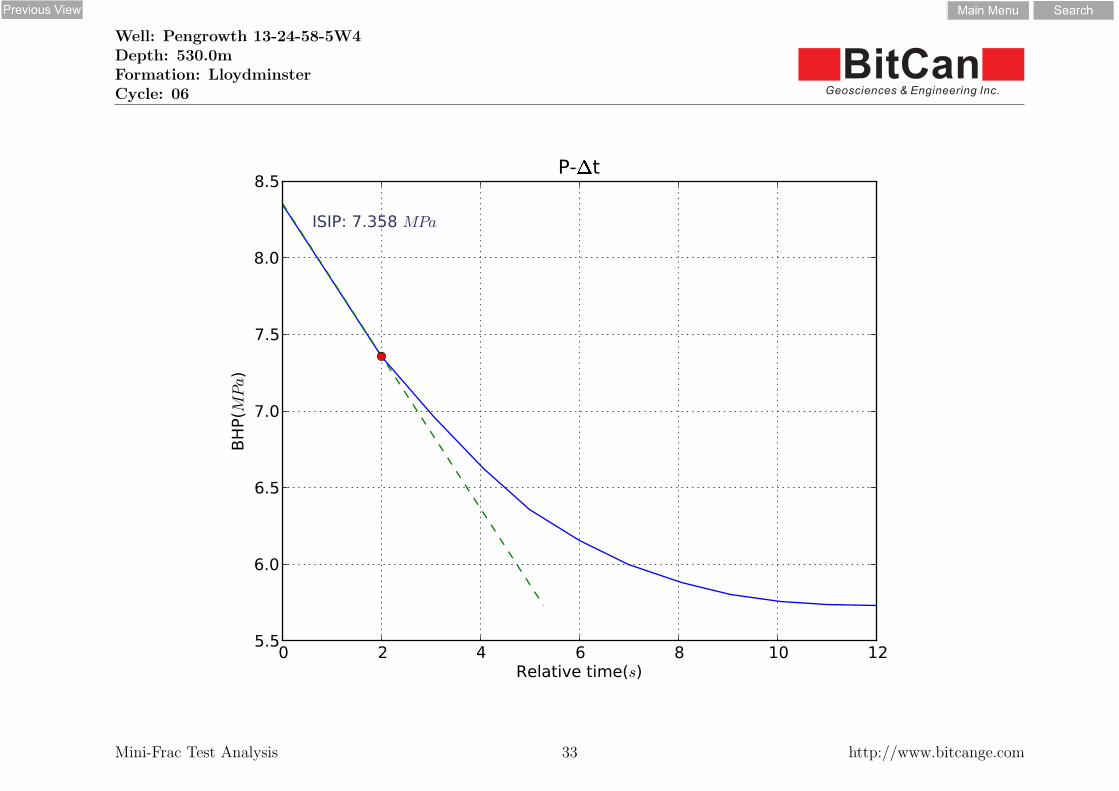
Well: Pengrowth 13-24-58-5W4Depth: 530.0mFormation: LloydminsterCycle: 06
BitCanGeosciences & Engineering Inc.
0 2 4 6 8 10 12Relative time(s)
5.5
6.0
6.5
7.0
7.5
8.0
8.5
BH
P(M
Pa)
ISIP: 7.358 MPa
P-�t
Mini-Frac Test Analysis 33 http://www.bitcange.com

Well: Pengrowth 13-24-58-5W4Depth: 530.0mFormation: LloydminsterCycle: 06
BitCanGeosciences & Engineering Inc.
0.0 0.2 0.4 0.6 0.8 1.0 1.2 1.4 1.6lg(relative time)
�0.4
�0.3
�0.2
�0.1
0.0
0.1
0.2
0.3
0.4
0.5
lg(B
HP)
1st Slope: 1.14
2nd Slope: 0.76
lg(�P)-lg(�t)
Mini-Frac Test Analysis 34 http://www.bitcange.com

Well: Pengrowth 13-24-58-5W4Depth: 530.0mFormation: LloydminsterCycle: 06
BitCanGeosciences & Engineering Inc.
0 1 2 3 4 5 6Sqrt(relative time)
5.5
6.0
6.5
7.0
7.5
8.0
8.5
BH
P(M
Pa)
Closure Pressure: 6.256 MPa
P-�
�t
Mini-Frac Test Analysis 35 http://www.bitcange.com

Well: Pengrowth 13-24-58-5W4Depth: 530.0mFormation: LloydminsterCycle: 06
BitCanGeosciences & Engineering Inc.
0.0 0.2 0.4 0.6 0.8 1.0 1.2 1.4 1.6lg(�t)
�2.0
�1.5
�1.0
�0.5
0.0
0.5
lg(�
tdP/d
�
t)1st Slope: 0.56
2nd Slope: 0.47
3rd Slope: -0.17
lg(�tdP/d�t)-lg(�t)
Mini-Frac Test Analysis 36 http://www.bitcange.com

Well: Pengrowth 13-24-58-5W4Depth: 530.0mFormation: LloydminsterCycle: 07
BitCanGeosciences & Engineering Inc.
0 20 40 60 80 100 120Relative time(s)
5.5
6.0
6.5
7.0
7.5
8.0
8.5
9.0
9.5
BH
P(M
Pa)
BHP and Injection Rate
�20
0
20
40
60
80
100
120
Inje
ctio
n r
ate
(L/min
)
BHPInjection rate
Mini-Frac Test Analysis 37 http://www.bitcange.com

Well: Pengrowth 13-24-58-5W4Depth: 530.0mFormation: LloydminsterCycle: 07
BitCanGeosciences & Engineering Inc.
0 5 10 15 20 25 30 35 40Injection volume(L)
6.0
6.5
7.0
7.5
8.0
8.5
9.0
9.5
BH
P(MPa)
Reopen Pressure: 7.91 MPa
P-V
Mini-Frac Test Analysis 38 http://www.bitcange.com

Well: Pengrowth 13-24-58-5W4Depth: 530.0mFormation: LloydminsterCycle: 07
BitCanGeosciences & Engineering Inc.
0 2 4 6 8 10Relative time(s)
5.5
6.0
6.5
7.0
7.5
8.0
BH
P(M
Pa)
ISIP: 6.862 MPa
P-�t
Mini-Frac Test Analysis 39 http://www.bitcange.com

Well: Pengrowth 13-24-58-5W4Depth: 530.0mFormation: LloydminsterCycle: 07
BitCanGeosciences & Engineering Inc.
0.0 0.2 0.4 0.6 0.8 1.0 1.2 1.4lg(relative time)
�0.4
�0.3
�0.2
�0.1
0.0
0.1
0.2
0.3
lg(B
HP)
1st Slope: 0.81
2nd Slope: 0.67
lg(�P)-lg(�t)
Mini-Frac Test Analysis 40 http://www.bitcange.com
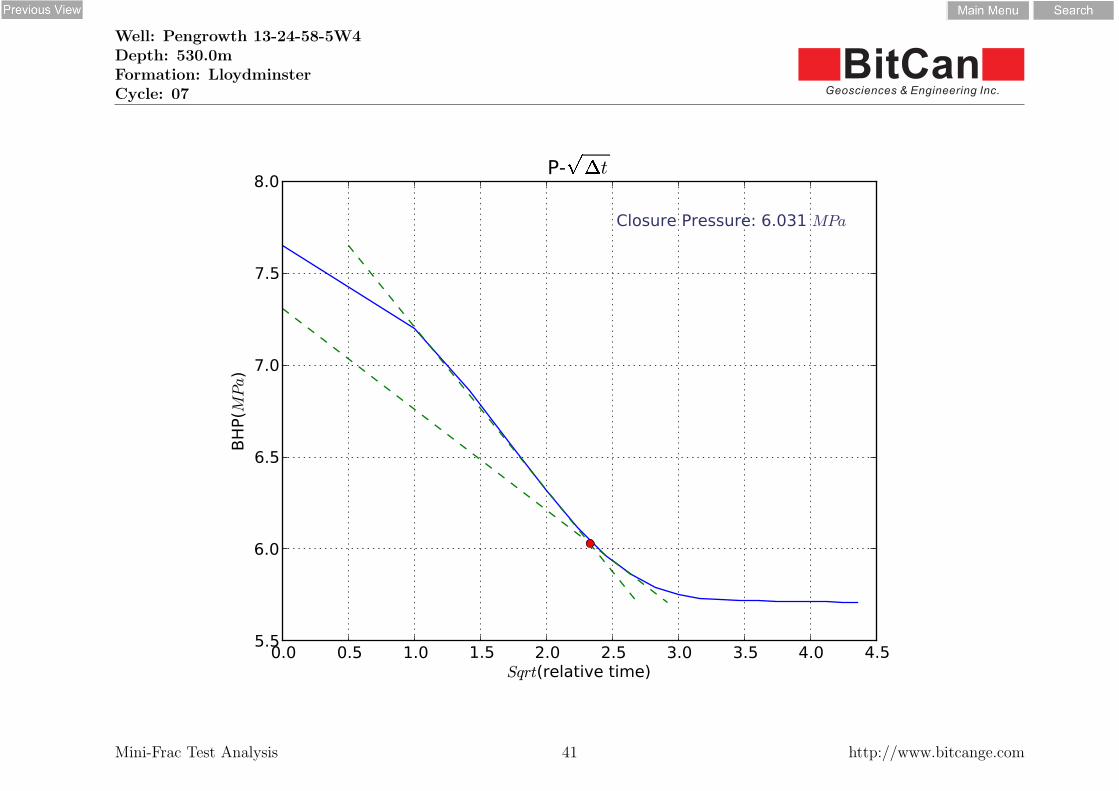
Well: Pengrowth 13-24-58-5W4Depth: 530.0mFormation: LloydminsterCycle: 07
BitCanGeosciences & Engineering Inc.
0.0 0.5 1.0 1.5 2.0 2.5 3.0 3.5 4.0 4.5Sqrt(relative time)
5.5
6.0
6.5
7.0
7.5
8.0
BH
P(M
Pa)
Closure Pressure: 6.031 MPa
P-�
�t
Mini-Frac Test Analysis 41 http://www.bitcange.com

Well: Pengrowth 13-24-58-5W4Depth: 530.0mFormation: LloydminsterCycle: 07
BitCanGeosciences & Engineering Inc.
0.0 0.2 0.4 0.6 0.8 1.0 1.2 1.4lg(�t)
�2.0
�1.5
�1.0
�0.5
0.0
0.5
lg(�
tdP/d
�
t)1st Slope: 0.53
2nd Slope: 0.3
3rd Slope: -0.01
lg(�tdP/d�t)-lg(�t)
Mini-Frac Test Analysis 42 http://www.bitcange.com

Well: Pengrowth 13-24-58-5W4Depth: 530.0mFormation: LloydminsterCycle: 08
BitCanGeosciences & Engineering Inc.
0 20 40 60 80 100Relative time(s)
5.5
6.0
6.5
7.0
7.5
8.0
BH
P(M
Pa)
BHP and Injection Rate
�10
0
10
20
30
40
50
60
70
80
Inje
ctio
n r
ate
(L/min
)
BHPInjection rate
Mini-Frac Test Analysis 43 http://www.bitcange.com

Well: Pengrowth 13-24-58-5W4Depth: 530.0mFormation: LloydminsterCycle: 08
BitCanGeosciences & Engineering Inc.
0 2 4 6 8 10 12 14 16Injection volume(L)
5.5
6.0
6.5
7.0
7.5
8.0
BH
P(MPa)
Reopen Pressure: 6.527 MPa
P-V
Mini-Frac Test Analysis 44 http://www.bitcange.com

Well: Pengrowth 13-24-58-5W4Depth: 530.0mFormation: LloydminsterCycle: 08
BitCanGeosciences & Engineering Inc.
0 2 4 6 8 10 12 14 16Relative time(s)
5.6
5.8
6.0
6.2
6.4
6.6
6.8
7.0
7.2
7.4
BH
P(M
Pa)
ISIP: 6.433 MPa
P-�t
Mini-Frac Test Analysis 45 http://www.bitcange.com

Well: Pengrowth 13-24-58-5W4Depth: 530.0mFormation: LloydminsterCycle: 08
BitCanGeosciences & Engineering Inc.
0.0 0.2 0.4 0.6 0.8 1.0 1.2 1.4 1.6lg(relative time)
�0.7
�0.6
�0.5
�0.4
�0.3
�0.2
�0.1
0.0
0.1
0.2
lg(B
HP)
1st Slope: 0.87
2nd Slope: 0.0
lg(�P)-lg(�t)
Mini-Frac Test Analysis 46 http://www.bitcange.com

Well: Pengrowth 13-24-58-5W4Depth: 530.0mFormation: LloydminsterCycle: 08
BitCanGeosciences & Engineering Inc.
0 1 2 3 4 5 6Sqrt(relative time)
5.6
5.8
6.0
6.2
6.4
6.6
6.8
7.0
7.2
7.4
BH
P(M
Pa)
Closure Pressure: 5.971 MPa
P-�
�t
Mini-Frac Test Analysis 47 http://www.bitcange.com

Well: Pengrowth 13-24-58-5W4Depth: 530.0mFormation: LloydminsterCycle: 08
BitCanGeosciences & Engineering Inc.
0.0 0.2 0.4 0.6 0.8 1.0 1.2 1.4 1.6lg(�t)
�2.5
�2.0
�1.5
�1.0
�0.5
0.0
0.5
lg(�
tdP/d
�
t)1st Slope: 0.61
2nd Slope: 0.41
3rd Slope: -0.85
lg(�tdP/d�t)-lg(�t)
Mini-Frac Test Analysis 48 http://www.bitcange.com

Well: Pengrowth 13-24-58-5W4Depth: 530.0mFormation: LloydminsterCycle: 09
BitCanGeosciences & Engineering Inc.
0 20 40 60 80 100 120Relative time(s)
5.5
6.0
6.5
7.0
7.5
8.0
BH
P(M
Pa)
BHP and Injection Rate
�10
0
10
20
30
40
50
60
70
80
Inje
ctio
n r
ate
(L/min
)
BHPInjection rate
Mini-Frac Test Analysis 49 http://www.bitcange.com

Well: Pengrowth 13-24-58-5W4Depth: 530.0mFormation: LloydminsterCycle: 09
BitCanGeosciences & Engineering Inc.
0 2 4 6 8 10 12 14 16Injection volume(L)
6.0
6.2
6.4
6.6
6.8
7.0
7.2
7.4
7.6
7.8
BH
P(MPa)
Reopen Pressure: 6.946 MPa
P-V
Mini-Frac Test Analysis 50 http://www.bitcange.com

Well: Pengrowth 13-24-58-5W4Depth: 530.0mFormation: LloydminsterCycle: 09
BitCanGeosciences & Engineering Inc.
0 2 4 6 8 10 12Relative time(s)
5.5
6.0
6.5
7.0
7.5
8.0
BH
P(M
Pa)
ISIP: 6.504 MPa
P-�t
Mini-Frac Test Analysis 51 http://www.bitcange.com

Well: Pengrowth 13-24-58-5W4Depth: 530.0mFormation: LloydminsterCycle: 09
BitCanGeosciences & Engineering Inc.
0.0 0.2 0.4 0.6 0.8 1.0 1.2lg(relative time)
�0.5
�0.4
�0.3
�0.2
�0.1
0.0
0.1
0.2
0.3
0.4
lg(B
HP)
1st Slope: 0.96
2nd Slope: 0.7
lg(�P)-lg(�t)
Mini-Frac Test Analysis 52 http://www.bitcange.com

Well: Pengrowth 13-24-58-5W4Depth: 530.0mFormation: LloydminsterCycle: 09
BitCanGeosciences & Engineering Inc.
0.0 0.5 1.0 1.5 2.0 2.5 3.0 3.5 4.0 4.5Sqrt(relative time)
5.5
6.0
6.5
7.0
7.5
8.0
BH
P(M
Pa)
Closure Pressure: 6.194 MPa
P-�
�t
Mini-Frac Test Analysis 53 http://www.bitcange.com

Well: Pengrowth 13-24-58-5W4Depth: 530.0mFormation: LloydminsterCycle: 09
BitCanGeosciences & Engineering Inc.
0.0 0.2 0.4 0.6 0.8 1.0 1.2 1.4 1.6lg(�t)
�2.5
�2.0
�1.5
�1.0
�0.5
0.0
0.5
lg(�
tdP/d
�
t)1st Slope: 0.91
2nd Slope: 0.35
3rd Slope: -0.11
lg(�tdP/d�t)-lg(�t)
Mini-Frac Test Analysis 54 http://www.bitcange.com

Well: Pengrowth 13-24-58-5W4Depth: 530.0mFormation: LloydminsterCycle: 1 to 9
BitCanGeosciences & Engineering Inc.
0 2 4 6 8 10Cycle
0
2
4
6
8
10
12
14
16
Pre
ssure
(MPa)
Summary
P_reopen
ISIPPc, sqrtPc, compliance
Mini-Frac Test Analysis 55 http://www.bitcange.com

Well: Pengrowth 13-24-58-5W4Depth: 530.0mFormation: LloydminsterCycle: 1 to 9
BitCanGeosciences & Engineering Inc.
Characteristic Pressures and Compliances
Cycle # P reopen ISIP Pc, sqrt Pc, compliance Cb, inj Cf, back Cb, back
(MPa) (MPa) (MPa) (MPa) (L/MPa) (L/MPa) (L/MPa)
1 15.327 9.136 7.456 0.000 2.66 0.00 0.00
2 8.346 10.090 7.610 0.000 3.47 0.00 0.00
3 8.145 7.120 6.256 0.000 2.96 0.00 0.00
4 6.556 7.814 6.187 0.000 3.53 0.00 0.00
5 7.207 8.219 6.255 0.000 3.99 0.00 0.00
6 7.589 7.358 6.256 0.000 4.78 0.00 0.00
7 7.910 6.862 6.031 0.000 6.74 0.00 0.00
8 6.527 6.433 5.971 0.000 4.08 0.00 0.00
9 6.946 6.504 6.194 0.000 7.44 0.00 0.00
Mini-Frac Test Analysis 56 http://www.bitcange.com