appendix a memorandum: results of additional sampling at ... · zinc using epa method 6020a....
TRANSCRIPT

Appendix A
Memorandum: Results of Additional Sampling at Trailer Disposal and Former Debris Areas,
Moss Beach Ranch Rancho Corral de Tierra, San Mateo County, California
19 October 2012
MEMORANDUM
To: Meghan Scanlon (Peninsula Open Space Trust)
From: Kat Wuelfing (Erler & Kalinowski, Inc.)
Michelle King, Ph.D. (Erler & Kalinowski, Inc.)
Subject: Results of Additional Sampling at Trailer Disposal and Former Debris
Areas, Moss Beach Ranch
Rancho Corral de Tierra, San Mateo County, California
(EKI B10014.01)
cc: Viktoriya Sirova (National Park Service)
Introduction
This memorandum presents the results of the February 2012 soil sampling conducted by
Erler & Kalinowski, Inc. (“EKI”) at the Trailer Disposal and Former Debris Areas at
Moss Beach Ranch of the Rancho Corral de Tierra property, located in San Mateo
County, California (these areas are referred to as the “Site” and are shown on Figures 1
and 2). EKI collected subsurface soil samples from exploratory trenches at the Site in
accordance with our Independent Consultant Agreement with Peninsula Open Space
Trust (“POST”), dated 7 March 2011 and Work Authorization No. 2, dated
10 January 2012 (collectively, the “Agreement”). EKI understands that the ownership of
the Rancho Corral de Tierra property was recently transferred to the National Park
Service (“NPS”) and that POST has retained responsibility for the removal of
contaminated soil at the Site per the First Amendment to Corporate Offer to Purchase
Real Property, dated 19 October 2011.
The objectives of the sampling conducted in February 2012 were to:
1) Conduct exploratory trenching and collect additional soil samples to characterize
the extent of impact identified during previous sampling at the Site;
2) Collect additional zinc data to be used to calculate a representative background
concentration for zinc in soil at the Site; and
3) Characterize the particle size distribution of Site soil for purposes of selecting
compatible fill material.
The forthcoming Removal Action Workplan for the Site will use the analytical data
presented in this memorandum to determine the extents of the remedial excavation.

Technical Memorandum
Rancho Corral de Tierra
19 October 2012
Page 2 of 8
Background
EKI performed sampling investigations of the Rancho Corral de Tierra property in 2011
to identify potential environmental liabilities. The potential environmental liabilities
identified during the 2011 sampling event are referred to as “recognized environmental
conditions” (“RECs”) (EKI, 2011). During the 2011 sampling event, soil samples were
collected from multiple areas across the Rancho Corral de Tierra property and analyzed
for a variety of chemical constituents, including total petroleum hydrocarbons (“TPH”),
metals, organochlorine pesticides, and volatile organic compounds. Surface water
samples were collected during the 2011 sampling event from several creeks on the
property and analyzed for fecal indicator bacteria, pesticides, and common water quality
parameters. Groundwater samples were collected from several domestic supply wells on
the property and analyzed for TPH, BTEX compounds1, and pesticides. As a result of
this investigation, the 2011 Sampling Investigation Report (EKI, 2011) identified RECs
at the Trailer Disposal and Former Debris Areas requiring further investigation and/or
remediation.
Three discrete and one multi-increment (“MI”) soil samples were collected from the
Trailer Disposal Area in April 2011 (see Figure 3 and Table 1). TPH-diesel, TPH-motor
oil, endrin and zinc were detected in the soil samples at concentrations above respective
San Francisco Regional Water Quality Control Board (“RWQCB”) residential
Environmental Screening Levels (“ESLs”). The maximum detected concentrations of
TPH-diesel, TPH-motor oil, endrin, and zinc in soil were 42,500 milligrams per kilogram
(“mg/kg”), 60,300 mg/kg, 0.00511 mg/kg, and 1,130 mg/kg, respectively. One MI
surface soil sample was collected from the Former Debris Area and contained TPH-diesel
and TPH-motor oil at concentrations of 1,880 mg/kg and 3,060 mg/kg, respectively (see
Figure 4 and Table 1).
The soil sampling and exploratory trenching conducted in February 2012, reported
herein, was conducted in order to further evaluate the lateral and vertical extent of the
contamination identified in the 2011 Sampling Investigation Report.
February 2012 Sampling Approach
Exploratory trenching was conducted at the Trailer Disposal and Former Debris Areas
over three days between 22 February 2012 and 24 February 2012. Cornerstone
Environmental Contractors of Lafayette, California (“Cornerstone”) was retained by EKI
to perform the exploratory backhoe trenching. Trench locations were selected with the
goal of characterizing the extent of soil contamination and presence of debris in the areas
identified in the 2011 Sampling Investigation Report. Trenches were dug near the areas
of the MI samples collected in 2011 and in areas extending outward from the MI sample
location, within the limits of accessibility. All trenches were approximately 1 foot wide
1 Benzene, toluene, ethylbenzene and xylenes.

Technical Memorandum
Rancho Corral de Tierra
19 October 2012
Page 3 of 8
by 4 feet long and were up to 5 feet deep. In addition, discrete soil samples were
collected from shallow boreholes in the mechanical shed and from or near the creek bank
at the Trailer Disposal Area. The trench, discrete soil, and MI sample locations are
shown on Figures 3 and 4.
Soil samples from each location at the Site were analyzed by K-Prime, Inc. (“K-Prime”)
in Santa Rosa, California for one or more of the following chemical constituents:
TPH reported as diesel fuel and motor oil using U.S. EPA Method 8015m (with silica
gel cleanup applied to the samples prior to analysis);
Endrin using U.S. EPA Method 8081A;
Lead using EPA Method 6020A; and
Zinc using EPA Method 6020A.
Specific laboratory analysis performed for each sample is discussed in further detail
below.
In addition, soil samples from the Site (and from stockpiled material at the Denniston
Creek Valley) were sent to the geotechnical laboratory, Cooper Testing Laboratory
(“Cooper”) in Palo Alto, California for grain size distribution analysis. Analytical
laboratory reports from both K-Prime and Cooper, including grain size distribution
figures are provided in Attachment A.
Site-Specific Zinc Background Concentration
Thirty-five soil samples collected in February 2012 and five soil samples collected in
April 2011 from the site were used to calculate a site-specific zinc background
concentration. The 95% upper tolerance limit (“UTL”) of the 95th
percentile of this
population (not including data determined to be outliers) is 138 mg/kg and is proposed to
be used as the primary site-specific background concentration for zinc. The methodology
used to calculate this background concentration is described in a technical memorandum
provided as Attachment B. The methodology for applying this background concentration
to confirmation sample results in order to determine whether remedial excavation is
complete will be included in the forthcoming Removal Action Workplan.
Trailer Disposal Area
A total of 34 soil samples were collected from the Trailer Disposal Area (Figure 3).
Twenty-five soil samples were collected from 11 trenches, generally centered around the
MI sample and stained sample collected in April 2011 (samples MBRTRS and
MBRTR1). Five additional surface soil samples were collected from along the western
bank of San Vicente Creek and four samples were collected from two locations within the
mechanical shed. Samples results are presented in Table 1.

Technical Memorandum
Rancho Corral de Tierra
19 October 2012
Page 4 of 8
All soil samples from the Trailer Disposal Area were analyzed for TPH-diesel and TPH-
motor oil. In addition, all trench and creek bank samples were also analyzed for endrin
and zinc. Following discussions with POST and NPS, one sample from trench TRE and
two from nearby trench TRF were analyzed for lead to evaluate potential impact from
lead paint associated with corrugated metal found in trench TRE (see below for
discussion).
Sample Results and Observations
Trench Samples
Twenty-five soil samples were collected from 11 trenches from depths ranging from
0.5 feet below ground surface (“ft bgs”) to 4.5 ft bgs. All samples were analyzed for
TPH-diesel, TPH-motor oil, endrin and zinc. One sample from trench TRE and two from
trench TRF were also analyzed for lead. One sample from trench TRH was additionally
submitted for particle size distribution.
Shallow soil samples up to 1 ft bgs from four trenches (TRA, TRB, TRE, and TRI)
contained TPH-diesel at concentrations above the Preliminary Cleanup Goal (“PCG”) of
115 mg/kg2 (Figure 3). The maximum detected concentration of TPH-diesel was
242 mg/kg, from 0.5 ft bgs in trench TRB.
TPH-motor oil was detected above the PCG of 144 mg/kg in two shallow soil trench
samples at concentrations of 165 mg/kg and 223 mg/kg at trenches TRI and TRE,
respectively.
Endrin was not detected in any of the samples. In all cases, the reporting limits were
below the PCG of 0.004 mg/kg, ranging from 0.00216 mg/kg to 0.00298 mg/kg.
Buried corrugated metal was discovered in the northern end of trench TRE approximately
1 to 2 ft bgs. In addition, the edge of buried corrugated metal was exposed in the western
end of trench TRG at the Trailer Disposal Area, also at a depth of approximately 1 to 2 ft
bgs. Photographs of the debris from trench TRE are provided in Attachment C (Photos 1
through 3). The metal had been painted and the paint was observed to be flaking off into
the soil at trench TRE. EKI collected a sample of the flaking paint and submitted it for
lead analysis. The paint sample contained lead at a concentration of 4,430 mg/kg (Table
2). A soil sample collected from beneath the corrugated metal debris was also analyzed
for lead and was found to contain lead at a concentration of 18.8 mg/kg (TRE-3). Two
2 The PCG for petroleum hydrocarbons are based on cleanup levels being used at the Presidio of San
Francisco (BBL, 2004; EKI, 2002). More specifically, EKI is applying the Freshwater Ecological
Protection Zone goal of 115 mg/kg for TPH-diesel contamination in soil where depth to groundwater is less
than 5 feet. The Presidio Goal where groundwater is greater than 5 feet is 144 mg/kg. Because of the close
proximity to San Vicente Creek and the likely variable depth to groundwater in this area, the more
conservative PCG of 115 mg/kg is used at the Trailer Disposal Area.
Technical Memorandum
Rancho Corral de Tierra
19 October 2012
Page 5 of 8
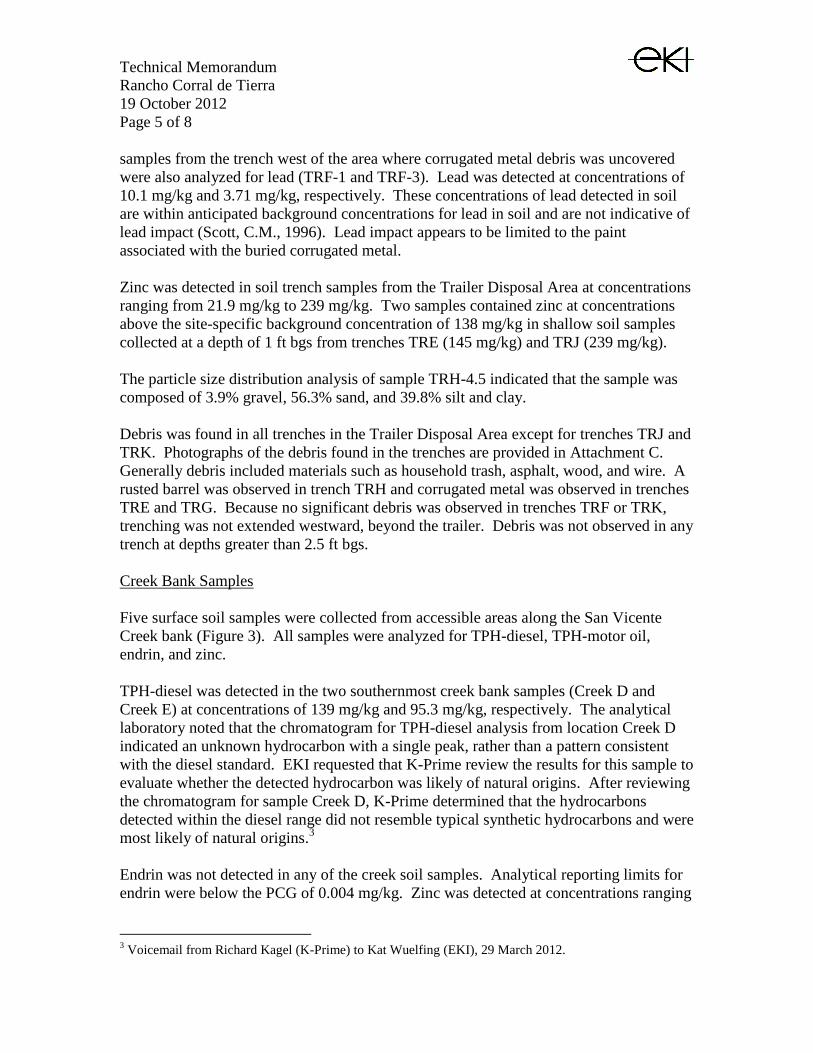
samples from the trench west of the area where corrugated metal debris was uncovered
were also analyzed for lead (TRF-1 and TRF-3). Lead was detected at concentrations of
10.1 mg/kg and 3.71 mg/kg, respectively. These concentrations of lead detected in soil
are within anticipated background concentrations for lead in soil and are not indicative of
lead impact (Scott, C.M., 1996). Lead impact appears to be limited to the paint
associated with the buried corrugated metal.
Zinc was detected in soil trench samples from the Trailer Disposal Area at concentrations
ranging from 21.9 mg/kg to 239 mg/kg. Two samples contained zinc at concentrations
above the site-specific background concentration of 138 mg/kg in shallow soil samples
collected at a depth of 1 ft bgs from trenches TRE (145 mg/kg) and TRJ (239 mg/kg).
The particle size distribution analysis of sample TRH-4.5 indicated that the sample was
composed of 3.9% gravel, 56.3% sand, and 39.8% silt and clay.
Debris was found in all trenches in the Trailer Disposal Area except for trenches TRJ and
TRK. Photographs of the debris found in the trenches are provided in Attachment C.
Generally debris included materials such as household trash, asphalt, wood, and wire. A
rusted barrel was observed in trench TRH and corrugated metal was observed in trenches
TRE and TRG. Because no significant debris was observed in trenches TRF or TRK,
trenching was not extended westward, beyond the trailer. Debris was not observed in any
trench at depths greater than 2.5 ft bgs.
Creek Bank Samples
Five surface soil samples were collected from accessible areas along the San Vicente
Creek bank (Figure 3). All samples were analyzed for TPH-diesel, TPH-motor oil,
endrin, and zinc.
TPH-diesel was detected in the two southernmost creek bank samples (Creek D and
Creek E) at concentrations of 139 mg/kg and 95.3 mg/kg, respectively. The analytical
laboratory noted that the chromatogram for TPH-diesel analysis from location Creek D
indicated an unknown hydrocarbon with a single peak, rather than a pattern consistent
with the diesel standard. EKI requested that K-Prime review the results for this sample to
evaluate whether the detected hydrocarbon was likely of natural origins. After reviewing
the chromatogram for sample Creek D, K-Prime determined that the hydrocarbons
detected within the diesel range did not resemble typical synthetic hydrocarbons and were
most likely of natural origins.3
Endrin was not detected in any of the creek soil samples. Analytical reporting limits for
endrin were below the PCG of 0.004 mg/kg. Zinc was detected at concentrations ranging
3 Voicemail from Richard Kagel (K-Prime) to Kat Wuelfing (EKI), 29 March 2012.
Technical Memorandum
Rancho Corral de Tierra
19 October 2012
Page 6 of 8
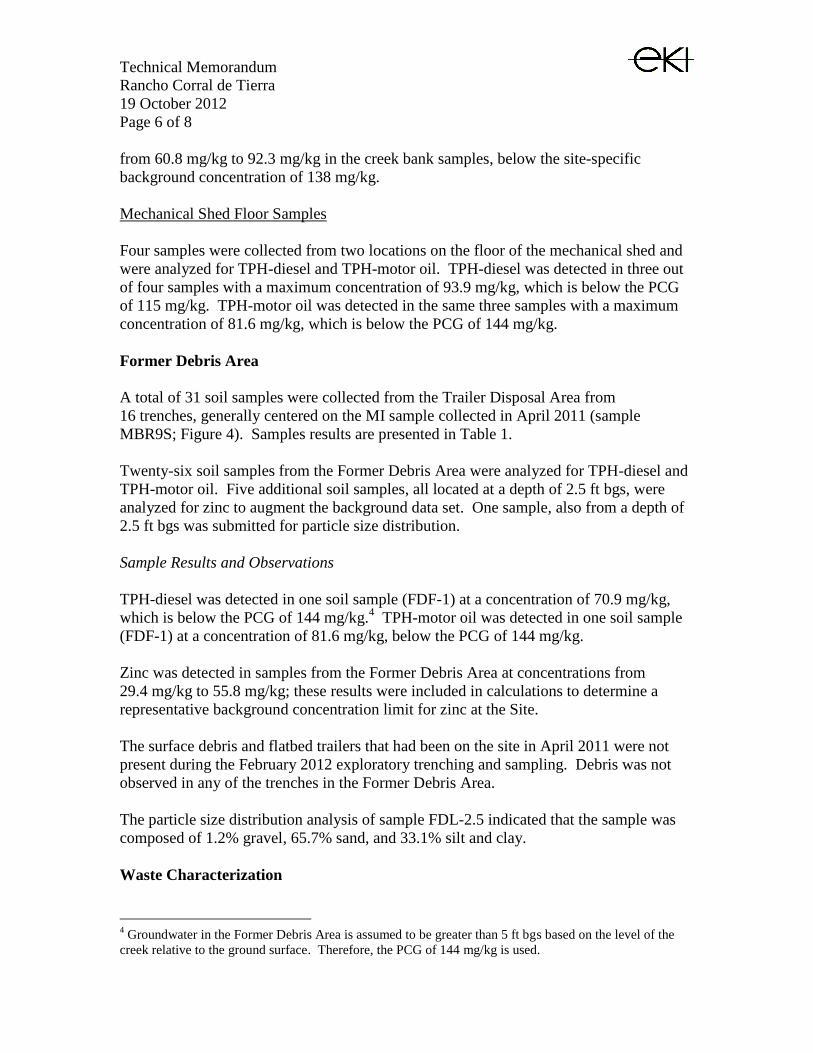
from 60.8 mg/kg to 92.3 mg/kg in the creek bank samples, below the site-specific
background concentration of 138 mg/kg.
Mechanical Shed Floor Samples
Four samples were collected from two locations on the floor of the mechanical shed and
were analyzed for TPH-diesel and TPH-motor oil. TPH-diesel was detected in three out
of four samples with a maximum concentration of 93.9 mg/kg, which is below the PCG
of 115 mg/kg. TPH-motor oil was detected in the same three samples with a maximum
concentration of 81.6 mg/kg, which is below the PCG of 144 mg/kg.
Former Debris Area
A total of 31 soil samples were collected from the Trailer Disposal Area from
16 trenches, generally centered on the MI sample collected in April 2011 (sample
MBR9S; Figure 4). Samples results are presented in Table 1.
Twenty-six soil samples from the Former Debris Area were analyzed for TPH-diesel and
TPH-motor oil. Five additional soil samples, all located at a depth of 2.5 ft bgs, were
analyzed for zinc to augment the background data set. One sample, also from a depth of
2.5 ft bgs was submitted for particle size distribution.
Sample Results and Observations
TPH-diesel was detected in one soil sample (FDF-1) at a concentration of 70.9 mg/kg,
which is below the PCG of 144 mg/kg.4 TPH-motor oil was detected in one soil sample
(FDF-1) at a concentration of 81.6 mg/kg, below the PCG of 144 mg/kg.
Zinc was detected in samples from the Former Debris Area at concentrations from
29.4 mg/kg to 55.8 mg/kg; these results were included in calculations to determine a
representative background concentration limit for zinc at the Site.
The surface debris and flatbed trailers that had been on the site in April 2011 were not
present during the February 2012 exploratory trenching and sampling. Debris was not
observed in any of the trenches in the Former Debris Area.
The particle size distribution analysis of sample FDL-2.5 indicated that the sample was
composed of 1.2% gravel, 65.7% sand, and 33.1% silt and clay.
Waste Characterization
4 Groundwater in the Former Debris Area is assumed to be greater than 5 ft bgs based on the level of the
creek relative to the ground surface. Therefore, the PCG of 144 mg/kg is used.
Technical Memorandum
Rancho Corral de Tierra
19 October 2012
Page 7 of 8
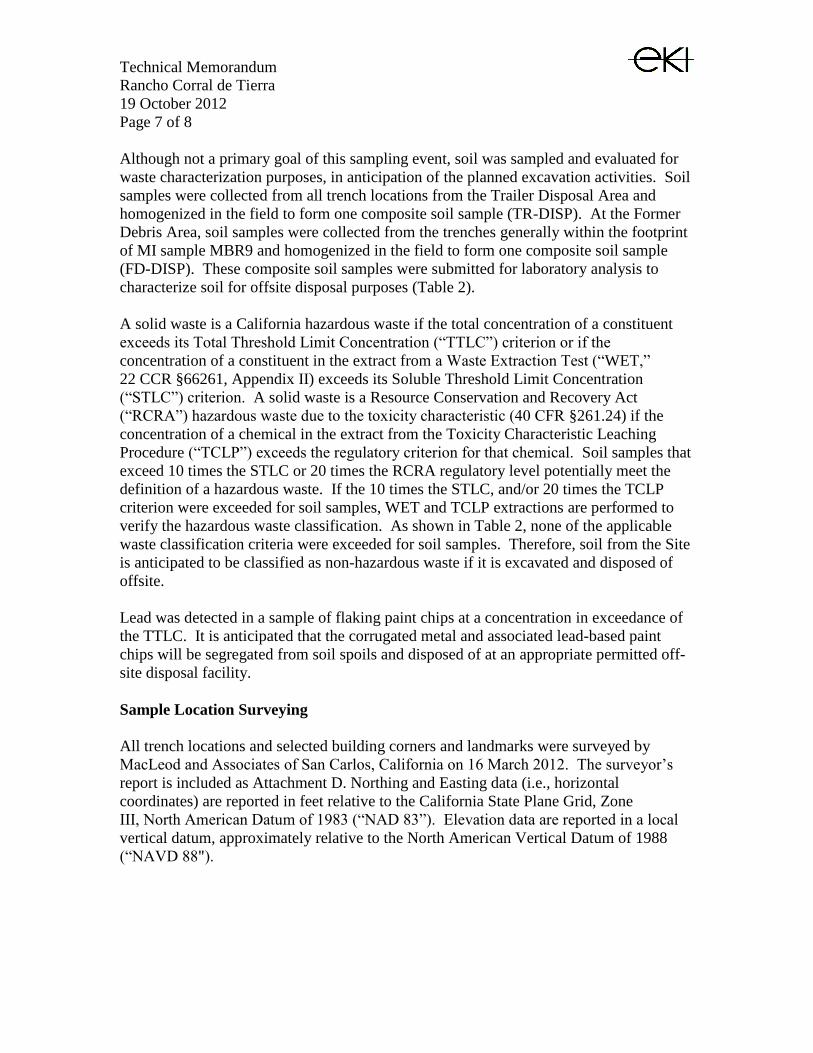
Although not a primary goal of this sampling event, soil was sampled and evaluated for
waste characterization purposes, in anticipation of the planned excavation activities. Soil
samples were collected from all trench locations from the Trailer Disposal Area and
homogenized in the field to form one composite soil sample (TR-DISP). At the Former
Debris Area, soil samples were collected from the trenches generally within the footprint
of MI sample MBR9 and homogenized in the field to form one composite soil sample
(FD-DISP). These composite soil samples were submitted for laboratory analysis to
characterize soil for offsite disposal purposes (Table 2).
A solid waste is a California hazardous waste if the total concentration of a constituent
exceeds its Total Threshold Limit Concentration (“TTLC”) criterion or if the
concentration of a constituent in the extract from a Waste Extraction Test (“WET,”
22 CCR §66261, Appendix II) exceeds its Soluble Threshold Limit Concentration
(“STLC”) criterion. A solid waste is a Resource Conservation and Recovery Act
(“RCRA”) hazardous waste due to the toxicity characteristic (40 CFR §261.24) if the
concentration of a chemical in the extract from the Toxicity Characteristic Leaching
Procedure (“TCLP”) exceeds the regulatory criterion for that chemical. Soil samples that
exceed 10 times the STLC or 20 times the RCRA regulatory level potentially meet the
definition of a hazardous waste. If the 10 times the STLC, and/or 20 times the TCLP
criterion were exceeded for soil samples, WET and TCLP extractions are performed to
verify the hazardous waste classification. As shown in Table 2, none of the applicable
waste classification criteria were exceeded for soil samples. Therefore, soil from the Site
is anticipated to be classified as non-hazardous waste if it is excavated and disposed of
offsite.
Lead was detected in a sample of flaking paint chips at a concentration in exceedance of
the TTLC. It is anticipated that the corrugated metal and associated lead-based paint
chips will be segregated from soil spoils and disposed of at an appropriate permitted off-
site disposal facility.
Sample Location Surveying
All trench locations and selected building corners and landmarks were surveyed by
MacLeod and Associates of San Carlos, California on 16 March 2012. The surveyor’s
report is included as Attachment D. Northing and Easting data (i.e., horizontal
coordinates) are reported in feet relative to the California State Plane Grid, Zone
III, North American Datum of 1983 (“NAD 83”). Elevation data are reported in a local
vertical datum, approximately relative to the North American Vertical Datum of 1988
(“NAVD 88").

Technical Memorandum
Rancho Corral de Tierra
19 October 2012
Page 8 of 8
References
BBL, 2004. Draft Development of Freshwater TPH-diesel and TPH-fuel oil Point of
Compliance Concentrations, Presidio of San Francisco, San Francisco, California,
Blasland, Bouck & Lee, Inc., 15 July 2004.
EKI, 2002. Development of Presidio-Wide Cleanup Levels for Soil, Sediment,
Groundwater, and Surface Water, Presidio of San Francisco, California, October 2002.
EKI, 2011. Result of Sampling Investigations, Rancho Corral de Tierra, Montara, San
Mateo County, California, Erler & Kalinowski, Inc., 21 September 2011.
Scott, C.M., 1995. Background Metals Concentrations in Soils in Northern Santa Clara
County, California, in: Recent Geological Studies in the San Francisco Area, Pacific
Section of the Society of Economic Paleontologists and Mineralogists, Volume 76.
Attachments
Table 1 – Summary of Soil Sample Analytical Results
Table 2 – Summary of Waste Characterization Sample Analytical Results
Figure 1 – Site Location
Figure 2 – Moss Beach Ranch Site Setting
Figure 3 – Moss Beach Ranch Trailer Disposal Area Soil Sampling Results
Figure 4 – Moss Beach Ranch Former Debris Area Soil Sampling Results
Attachment A – Analytical Laboratory Reports
Attachment B – Memorandum: Moss Beach Ranch Background Zinc in Soil
Attachment C – Selected Photographs from Exploratory Trenching Activities
Attachment D – Surveyor’s Report
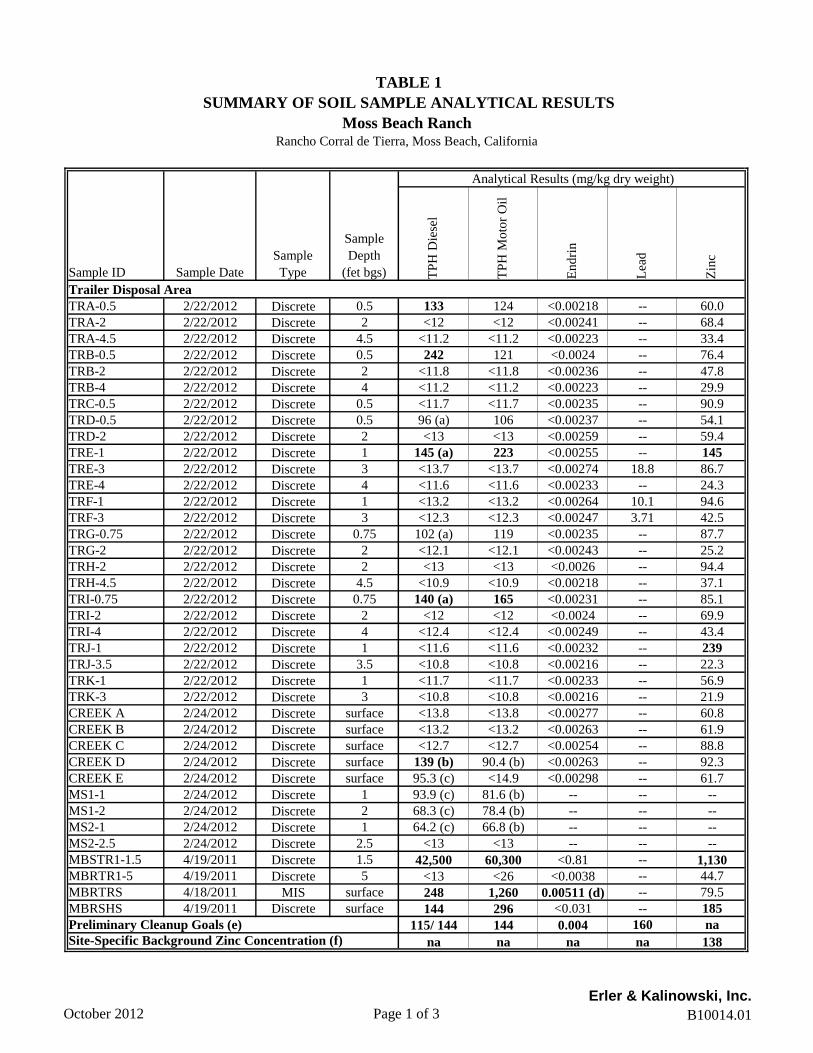
TABLE 1
SUMMARY OF SOIL SAMPLE ANALYTICAL RESULTS
Moss Beach RanchRancho Corral de Tierra, Moss Beach, California
Analytical Results (mg/kg dry weight)
Sample ID Sample Date
Sample
Type
Sample
Depth
(fet bgs) TP
H D
iese
l
TP
H M
oto
r O
il
En
dri
n
Lea
d
Zin
c
Trailer Disposal Area
TRA-0.5 2/22/2012 Discrete 0.5 133 124 <0.00218 -- 60.0
TRA-2 2/22/2012 Discrete 2 <12 <12 <0.00241 -- 68.4
TRA-4.5 2/22/2012 Discrete 4.5 <11.2 <11.2 <0.00223 -- 33.4
TRB-0.5 2/22/2012 Discrete 0.5 242 121 <0.0024 -- 76.4
TRB-2 2/22/2012 Discrete 2 <11.8 <11.8 <0.00236 -- 47.8
TRB-4 2/22/2012 Discrete 4 <11.2 <11.2 <0.00223 -- 29.9
TRC-0.5 2/22/2012 Discrete 0.5 <11.7 <11.7 <0.00235 -- 90.9
TRD-0.5 2/22/2012 Discrete 0.5 96 (a) 106 <0.00237 -- 54.1
TRD-2 2/22/2012 Discrete 2 <13 <13 <0.00259 -- 59.4
TRE-1 2/22/2012 Discrete 1 145 (a) 223 <0.00255 -- 145
TRE-3 2/22/2012 Discrete 3 <13.7 <13.7 <0.00274 18.8 86.7
TRE-4 2/22/2012 Discrete 4 <11.6 <11.6 <0.00233 -- 24.3
TRF-1 2/22/2012 Discrete 1 <13.2 <13.2 <0.00264 10.1 94.6
TRF-3 2/22/2012 Discrete 3 <12.3 <12.3 <0.00247 3.71 42.5
TRG-0.75 2/22/2012 Discrete 0.75 102 (a) 119 <0.00235 -- 87.7
TRG-2 2/22/2012 Discrete 2 <12.1 <12.1 <0.00243 -- 25.2
TRH-2 2/22/2012 Discrete 2 <13 <13 <0.0026 -- 94.4
TRH-4.5 2/22/2012 Discrete 4.5 <10.9 <10.9 <0.00218 -- 37.1
TRI-0.75 2/22/2012 Discrete 0.75 140 (a) 165 <0.00231 -- 85.1
TRI-2 2/22/2012 Discrete 2 <12 <12 <0.0024 -- 69.9
TRI-4 2/22/2012 Discrete 4 <12.4 <12.4 <0.00249 -- 43.4
TRJ-1 2/22/2012 Discrete 1 <11.6 <11.6 <0.00232 -- 239
TRJ-3.5 2/22/2012 Discrete 3.5 <10.8 <10.8 <0.00216 -- 22.3
TRK-1 2/22/2012 Discrete 1 <11.7 <11.7 <0.00233 -- 56.9
TRK-3 2/22/2012 Discrete 3 <10.8 <10.8 <0.00216 -- 21.9
CREEK A 2/24/2012 Discrete surface <13.8 <13.8 <0.00277 -- 60.8
CREEK B 2/24/2012 Discrete surface <13.2 <13.2 <0.00263 -- 61.9
CREEK C 2/24/2012 Discrete surface <12.7 <12.7 <0.00254 -- 88.8
CREEK D 2/24/2012 Discrete surface 139 (b) 90.4 (b) <0.00263 -- 92.3
CREEK E 2/24/2012 Discrete surface 95.3 (c) <14.9 <0.00298 -- 61.7
MS1-1 2/24/2012 Discrete 1 93.9 (c) 81.6 (b) -- -- --
MS1-2 2/24/2012 Discrete 2 68.3 (c) 78.4 (b) -- -- --
MS2-1 2/24/2012 Discrete 1 64.2 (c) 66.8 (b) -- -- --
MS2-2.5 2/24/2012 Discrete 2.5 <13 <13 -- -- --
MBSTR1-1.5 4/19/2011 Discrete 1.5 42,500 60,300 <0.81 -- 1,130
MBRTR1-5 4/19/2011 Discrete 5 <13 <26 <0.0038 -- 44.7
MBRTRS 4/18/2011 MIS surface 248 1,260 0.00511 (d) -- 79.5
MBRSHS 4/19/2011 Discrete surface 144 296 <0.031 -- 185
115/ 144 144 0.004 160 na
na na na na 138
Preliminary Cleanup Goals (e)
Site-Specific Background Zinc Concentration (f)
October 2012 Page 1 of 3
Erler & Kalinowski, Inc.
B10014.01
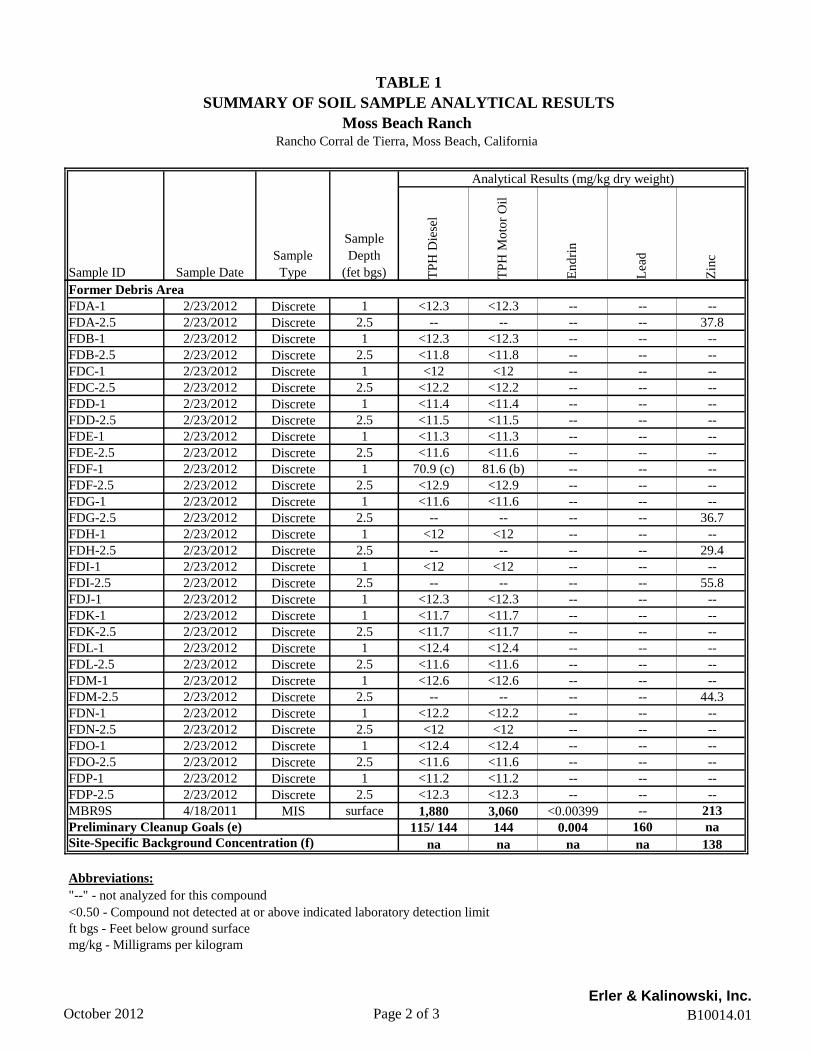
TABLE 1
SUMMARY OF SOIL SAMPLE ANALYTICAL RESULTS
Moss Beach RanchRancho Corral de Tierra, Moss Beach, California
Analytical Results (mg/kg dry weight)
Sample ID Sample Date
Sample
Type
Sample
Depth
(fet bgs) TP
H D
iese
l
TP
H M
oto
r O
il
En
dri
n
Lea
d
Zin
c
Former Debris Area
FDA-1 2/23/2012 Discrete 1 <12.3 <12.3 -- -- --
FDA-2.5 2/23/2012 Discrete 2.5 -- -- -- -- 37.8
FDB-1 2/23/2012 Discrete 1 <12.3 <12.3 -- -- --
FDB-2.5 2/23/2012 Discrete 2.5 <11.8 <11.8 -- -- --
FDC-1 2/23/2012 Discrete 1 <12 <12 -- -- --
FDC-2.5 2/23/2012 Discrete 2.5 <12.2 <12.2 -- -- --
FDD-1 2/23/2012 Discrete 1 <11.4 <11.4 -- -- --
FDD-2.5 2/23/2012 Discrete 2.5 <11.5 <11.5 -- -- --
FDE-1 2/23/2012 Discrete 1 <11.3 <11.3 -- -- --
FDE-2.5 2/23/2012 Discrete 2.5 <11.6 <11.6 -- -- --
FDF-1 2/23/2012 Discrete 1 70.9 (c) 81.6 (b) -- -- --
FDF-2.5 2/23/2012 Discrete 2.5 <12.9 <12.9 -- -- --
FDG-1 2/23/2012 Discrete 1 <11.6 <11.6 -- -- --
FDG-2.5 2/23/2012 Discrete 2.5 -- -- -- -- 36.7
FDH-1 2/23/2012 Discrete 1 <12 <12 -- -- --
FDH-2.5 2/23/2012 Discrete 2.5 -- -- -- -- 29.4
FDI-1 2/23/2012 Discrete 1 <12 <12 -- -- --
FDI-2.5 2/23/2012 Discrete 2.5 -- -- -- -- 55.8
FDJ-1 2/23/2012 Discrete 1 <12.3 <12.3 -- -- --
FDK-1 2/23/2012 Discrete 1 <11.7 <11.7 -- -- --
FDK-2.5 2/23/2012 Discrete 2.5 <11.7 <11.7 -- -- --
FDL-1 2/23/2012 Discrete 1 <12.4 <12.4 -- -- --
FDL-2.5 2/23/2012 Discrete 2.5 <11.6 <11.6 -- -- --
FDM-1 2/23/2012 Discrete 1 <12.6 <12.6 -- -- --
FDM-2.5 2/23/2012 Discrete 2.5 -- -- -- -- 44.3
FDN-1 2/23/2012 Discrete 1 <12.2 <12.2 -- -- --
FDN-2.5 2/23/2012 Discrete 2.5 <12 <12 -- -- --
FDO-1 2/23/2012 Discrete 1 <12.4 <12.4 -- -- --
FDO-2.5 2/23/2012 Discrete 2.5 <11.6 <11.6 -- -- --
FDP-1 2/23/2012 Discrete 1 <11.2 <11.2 -- -- --
FDP-2.5 2/23/2012 Discrete 2.5 <12.3 <12.3 -- -- --
MBR9S 4/18/2011 MIS surface 1,880 3,060 <0.00399 -- 213
115/ 144 144 0.004 160 na
na na na na 138
Abbreviations:
"--" - not analyzed for this compound
<0.50 - Compound not detected at or above indicated laboratory detection limit
ft bgs - Feet below ground surface
mg/kg - Milligrams per kilogram
Site-Specific Background Concentration (f)
Preliminary Cleanup Goals (e)
October 2012 Page 2 of 3
Erler & Kalinowski, Inc.
B10014.01
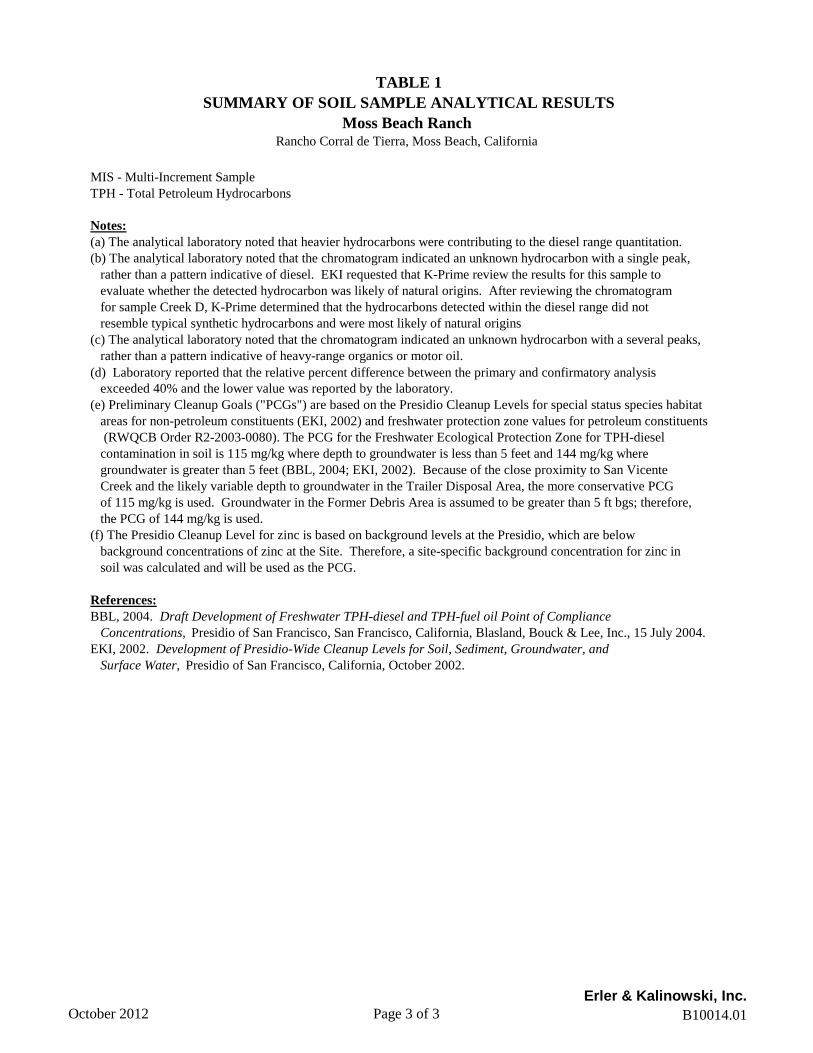
TABLE 1
SUMMARY OF SOIL SAMPLE ANALYTICAL RESULTS
Moss Beach RanchRancho Corral de Tierra, Moss Beach, California
MIS - Multi-Increment Sample
TPH - Total Petroleum Hydrocarbons
Notes:
(a) The analytical laboratory noted that heavier hydrocarbons were contributing to the diesel range quantitation.
(b) The analytical laboratory noted that the chromatogram indicated an unknown hydrocarbon with a single peak,
rather than a pattern indicative of diesel. EKI requested that K-Prime review the results for this sample to
evaluate whether the detected hydrocarbon was likely of natural origins. After reviewing the chromatogram
for sample Creek D, K-Prime determined that the hydrocarbons detected within the diesel range did not
resemble typical synthetic hydrocarbons and were most likely of natural origins
(c) The analytical laboratory noted that the chromatogram indicated an unknown hydrocarbon with a several peaks,
rather than a pattern indicative of heavy-range organics or motor oil.
(d) Laboratory reported that the relative percent difference between the primary and confirmatory analysis
exceeded 40% and the lower value was reported by the laboratory.
(e) Preliminary Cleanup Goals ("PCGs") are based on the Presidio Cleanup Levels for special status species habitat
areas for non-petroleum constituents (EKI, 2002) and freshwater protection zone values for petroleum constituents
(RWQCB Order R2-2003-0080). The PCG for the Freshwater Ecological Protection Zone for TPH-diesel
contamination in soil is 115 mg/kg where depth to groundwater is less than 5 feet and 144 mg/kg where
groundwater is greater than 5 feet (BBL, 2004; EKI, 2002). Because of the close proximity to San Vicente
Creek and the likely variable depth to groundwater in the Trailer Disposal Area, the more conservative PCG
of 115 mg/kg is used. Groundwater in the Former Debris Area is assumed to be greater than 5 ft bgs; therefore,
the PCG of 144 mg/kg is used.
(f) The Presidio Cleanup Level for zinc is based on background levels at the Presidio, which are below
background concentrations of zinc at the Site. Therefore, a site-specific background concentration for zinc in
soil was calculated and will be used as the PCG.
References:
BBL, 2004. Draft Development of Freshwater TPH-diesel and TPH-fuel oil Point of Compliance
Concentrations, Presidio of San Francisco, San Francisco, California, Blasland, Bouck & Lee, Inc., 15 July 2004.
EKI, 2002. Development of Presidio-Wide Cleanup Levels for Soil, Sediment, Groundwater, and
Surface Water, Presidio of San Francisco, California, October 2002.
October 2012 Page 3 of 3
Erler & Kalinowski, Inc.
B10014.01

TABLE 2
SUMMARY OF WASTE CHARACTERIZATION SAMPLE ANALYTICAL RESULTS
Moss Beach RanchRancho Corral de Tierra, Moss Beach, California
Analytical Results (mg/kg, as received) (a)
Area Sample ID Sample Type Sample Date TP
H D
iese
l
TP
H M
oto
r O
il
Ben
zene
Tolu
ene
Eth
ylb
enze
ne
Xyle
nes
(to
tal)
Chlo
rdan
e
Oth
er P
esti
cides
Cad
miu
m
Chro
miu
m
Lea
d
Nic
kel
Zin
c
Trailer Disposal Area TR-DISP soil 2/28/2012 1,680 2,760 <0.00126 <0.00126 <0.00126 <0.00126 0.0526 ND <2.5 25 7.94 15.8 70.3
Trailer Disposal Area TR PAINT paint chip 2/22/2012 -- -- -- -- -- -- -- -- -- -- 4,430 -- --
Former Debris Area FD-DISP soil 2/28/2012 <10 <10 <0.00118 <0.00118 <0.00118 <0.00118 <0.050 ND <2.5 33.5 7.55 38.5 54
Hazardous Waste Criteria (b)
Total Threshold Limit Concentration (mg/kg) na na na na na na 2.5 na 100 2,500 1,000 2,000 5,000
Soluble Threshold Limit Concentration (mg/L) na na na na na na 0.25 na 1 5 5 20 250
10 x Soluble Threshold Limit Concentration (CA) (mg/kg) na na na na na na 2.5 na 10 50 50 200 2,500
20 x Toxicity Characteristic Leaching Procedure (RCRA) (mg/kg) na na 10 na na na 0.6 na 20 100 100 na na
Abbreviations:
"--" - not analyzed for this compound
<0.50 - Compound not detected at or above indicated laboratory detection limit
CA - California
mg/kg - milligrams per kilogram
mg/L - milligrams per liter
na - not available
STLC - Soluble Threshold Limit Concentration
TCLP - Toxicity Characteristic Leaching Procedure
TPH - Total Petroleum Hydrocarbons
TTLC - Total Threshold Limit Concentration
WET - Waste Extraction Test
RCRA - Resource Conservation and Recovery Act
Notes:
(a) The TTLC was not exceeded for soil samples and, therefore, soil from the Site is anticipated to be classified as non-hazardous waste if it is excavated and disposed of offsite. Lead was
detected in a sample of paint chips flaking off of buried corrugated metal at a concentration in exceedance of the TTLC. It is anticipated that the corrugated metal and associated lead-based
paint chips will be segregated from soil spoils and disposed of offsite as lead-containing construction debris
(b) A solid waste is a California hazardous waste if the total concentration of a constituent exceeds its TTLC criterion or if the concentration of a constituent in the extract from a WET
(22 CCR §66261, Appendix II) exceeds its STLC criterion. A solid waste is a RCRA hazardous waste due to the toxicity characteristic (40 CFR §261.24) if the concentration of a chemical in the
extract from the TCLP exceeds the regulatory criterion for that chemical. Soil samples that exceed 10 times the STLC or 20 times the RCRA regulatory level potentially meet the definition of a
hazardous waste. If the 10 times the STLC, and/or 20 times the TCLP criterion were exceeded for soil samples, WET and TCLP extractions are performed to verify the hazardous waste
classification.
October 2012 Page 1 of 1
Erler & Kalinowski, Inc.
B10014.01

Kalinowski, Inc.Erler &
Site LocationMoss Beach Ranch
Rancho Corral de TierraMoss Beach, CA
October 2012EKI B10014.01
Figure 1
G:\B
1001
4.01
\201
2-10
\Rep
ort 1
\Fig
ure
1.dw
g 1
0-23
-12
SITE
Notes:
1. All locations are approximate.
2. Basemap source: The Thomas Guide Digital Edition, State of California,2003/2004.
(Approximate Scale in Feet)
300015000

San
Vic
ente
Cre
ek
San
Vic
ente
Trailer Disposal Area(See Figure 3)
Former Debris Area(See Figure 4)
Cre
ek
Kalinowski, Inc.Erler &
Moss Beach RanchSite Setting
Rancho Corral de TierraMoss Beach, CA
October 2012EKI B10014.01
Figure 2
Notes:
1. All locations are approximate.
2. Basemap source: Google Earth Pro, date of imagery1 October 2009.
(Approximate Scale in Feet)
4002000
Legend:Creek (approximate)

Creek E
Creek A
Creek B
Creek C
HorseRing
TRC
Creek D
MS1MS2
TRA
TRB
TRD
TRJ
TRK
TRITRH
TRE
TRF
TRG
Hay Barn
Horse Paddocks
Horse Paddocks
Storage
MechanicalShed
Building
Shed
Trailer
Fence
MBRSHS
MBRTR1
MBRTRS
San Vicente Creek
Kalinowski, Inc.Erler &
Moss Beach RanchTrailer Disposal Area Sampling Results
Rancho Corral de TierraMoss Beach, CA
October 2012EKI B10014.01
Figure 3
Legend:Soil Sample Location
Test Pit Location
(Approximate Scale in Feet)
30150
Multi-Increment Soil Sample Location
CREEK D surfaceTPH-D 139TPH-Mo 90.4Endrin <0.0132Zinc 92.3
MS1 1 ft bgs 2 ft bgsTPH-D 93.9 68.3TPH-Mo 81.6 78.4
MS2 1 ft bgs 2.5 ft bgsTPH-D 64.2 <13TPH-Mo 66.8 <13
MBSTR1 1.5 ft bgs 5 ft bgsTPH-D 42,500 <13TPH-Mo 60,300 <26Endrin <0.81 <0.0038Zinc 1,130 44.7
MBRTRS surfaceTPH-D 248TPH-Mo 1,260Endrin 0.00511Zinc 79.5
MBRSHS surfaceTPH-D 144TPH-Mo 296Endrin <0.031Zinc 185
Notes:
1. All locations are approximate.
3. Basemap source: Google Earth Pro, date of imageryJune 19, 2011.
Abbreviations:
TPH-d = Total petroleum hydrocarbons as diesel
TPH-mo = Total petroleum hydrocarbons as motor oil
ft bgs = Feet below ground surface
4. Concentrations in milligrams per kilogram "mg/kg".
2. Samples with the prefix "TR" and "Creek" were collectedin February 2012. All other samples were collected inApril 2011.
TRA 0.5 ft bgs 2 ft bgs 4.5 ft bgsTPH-D 133 <12 <11.2TPH-Mo 124 <12 <11.2Endrin <0.00218 <0.00241 <0.00223Zinc 60 68.4 33.4
TRB 0.5 ft bgs 2 ft bgs 4 ft bgsTPH-D 242 <11.8 <11.2TPH-Mo 121 <11.8 <11.2Endrin <0.0024 <0.00236 <0.00223Zinc 76.4 47.8 29.9
TRC 0.5 f t bgsTPH-D <11.7TPH-Mo <11.7Endrin <0.00235Zinc 90.9
TRD 0.5 ft bgs 2 ft bgsTPH-D 96 <13TPH-Mo 106 <13Endrin <0.00237 <0.00259Zinc 54.1 59.4
TRE 1 ft bgs 3 f t bgs 4 ft bgsTPH-D 145 <13.7 <11.6TPH-Mo 223 <13.7 <11.6Endrin <0.00255 <0.00274 <0.00233Lead -- 18.8 --Zinc 145 86.7 24.3
TRF 1 ft bgs 3 ft bgsTPH-D <13.2 <12.3TPH-Mo <13.2 <12.3Endrin <0.00264 <0.00247Lead 10.1 3.71Zinc 94.6 42.5
TRG 0.75 f t bgs 2 ft bgsTPH-D 102 <12.1TPH-Mo 119 <12.1Endrin <0.00235 <0.00243Zinc 87.7 25.2
TRH 2 ft bgs 4.5 f t bgsTPH-D <13 <10.9TPH-Mo <13 <10.9Endrin <0.0026 <0.00218Zinc 94.4 37.1
TRI 0.75 ft bgs 2 ft bgs 4 ft bgsTPH-D 140 <12 <12.4TPH-Mo 165 <12 <12.4Endrin <0.00231 <0.0024 <0.00249Zinc 85.1 69.9 43.4
TRJ 1 f t bgs 3.5 ft bgsTPH-D <11.6 <10.8TPH-Mo <11.6 <10.8Endrin <0.00232 <0.00216Zinc 239 22.3
TRK 1 f t bgs 3 ft bgsTPH-D <11.7 <10.8TPH-Mo <11.7 <10.8Endrin <0.00233 <0.00216Zinc 56.9 21.9
CREEK A surfaceTPH-D <13.8TPH-Mo <13.8Endrin <0.00277Zinc 60.8
CREEK B surfaceTPH-D <13.2TPH-Mo <13.2Endrin <0.00254Zinc 61.9
CREEK C surfaceTPH-D <12.7TPH-Mo <12.7Endrin <0.00263Zinc 88.8
CREEK E surfaceTPH-D 95.3TPH-Mo <14.9Endrin <0.00298Zinc 61.7

FDG
FDF
FDO
FDB
FDA
FDJ
FDP
FDH
FDN FDL
FDC
FDI
FDM
FDE
FDD
FDK
MBR9S
Kalinowski, Inc.Erler &
Moss Beach RanchFormer Debris Area Sampling Results
Rancho Corral de TierraMoss Beach, CA
October 2012EKI B10014.01
Figure 4
Legend:Test Pit Location
0 4020
(Approximate Scale in Feet)
Multi-Increment Soil Sample Location
FDA 1 ft bgs 2.5 f t bgsTPH-D <12.3 --TPH-Mo <12.3 --Zinc -- 37.8
FDB 1 ft bgs 2.5 f t bgsTPH-D <12.3 <11.8TPH-Mo <12.3 <11.8
FDC 1 ft bgs 2.5 f t bgsTPH-D <12 <12.2TPH-Mo <12 <12.2
FDD 1 ft bgs 2.5 f t bgsTPH-D <11.4 <11.5TPH-Mo <11.4 <11.5
FDE 1 ft bgs 2.5 f t bgsTPH-D <11.3 <11.6TPH-Mo <11.3 <11.6
FDG 1 ft bgs 2.5 f t bgsTPH-D <11.6 --TPH-Mo <11.6 --Zinc -- 36.7
FDH 1 ft bgs 2.5 f t bgsTPH-D <12 --TPH-Mo <12 --Zinc -- 29.4
FDI 1 ft bgs 2.5 f t bgsTPH-D <12 --TPH-Mo <12 --Zinc -- 55.8
FDJ 1 ft bgsTPH-D <12.3TPH-Mo <12.3
FDK 1 f t bgs 2.5 ft bgsTPH-D <11.7 <11.7TPH-Mo <11.7 <11.7
FDL 1 f t bgs 2.5 ft bgsTPH-D <12.4 <11.6TPH-Mo <12.4 <11.6 FDM 1 f t bgs 2.5 ft bgs
TPH-D <12.6 --TPH-Mo <12.6 --Zinc -- 44.3FDN 1 f t bgs 2.5 ft bgs
TPH-D <12.2 <12TPH-Mo <12.2 <12
FDO 1 f t bgs 2.5 ft bgsTPH-D <12.4 <11.6TPH-Mo <12.4 <11.6
FDP 1 f t bgs 2.5 ft bgsTPH-D <11.2 <12.3TPH-Mo <11.2 <12.3
MBR9S surfaceTPH-D 1,880TPH-Mo 3,060Endrin <0.00399Zinc 213
Notes:
1. All locations are approximate.
2.
Basemap source: Google Earth Pro, date of imageryJune 19, 2011.
Abbreviations:
TPH-d = Total petroleum hydrocarbons as diesel
TPH-mo = Total petroleum hydrocarbons as motor oil
ft bgs = Feet below ground surface
3.
Concentrations in milligrams per kilogram "mg/kg".
FDF 1 ft bgs 2.5 f t bgsTPH-D 70.9 <12.9TPH-Mo 81.6 <12.9
4.
Sample MBR9S was collected in April 2011. All othersamples were collected in February 2012.