appendix a - springer978-1-349-86117-0/1.pdfa tief or clan ruled by a daimyo a brazier of pottery,...
TRANSCRIPT

Japanese Term
Bakufu
Chonin Chosen Daimyo Detchi Dogyo Kumiai Genro Geta Goyokin
Gyaku-Kosu
Habutae Han Hibachi
Joka-machi Junsenji Keizai Kabu
Karafuto Kawase-gumi Kogyo Kumiai O-bon
Meibutsu Rangaku Ringi-sei
Appendix A Glossary
English Equiva/ent
The feudal government as carried on by the Shogunate The merchants Korea Feudal lord before the Restoration Apprentice Trade association or guild EIder Statesman Wooden footwear Money for government use; may be compared with the Tudor benevolences Reverse course; the process of disentanglement from the Occupation reforms A silk fabric A tief or clan ruled by a daimyo A brazier of pottery, wood or metal, used for warming Japanese houses Castle towns Quasi-war-time economy Share, or membership privilege, as applied to the former guild system J apanese Saghalien Exchange company Manufacturers' association or guild Festival ofthe Dead, held annually in mid-July. The ancestral spirits are supposed to visit the living members of their families Speciality products Dutch learning Circular system of decision-making.
246

Sake Samurai Sangyo Kumiai Sankin Kotai
Shogun
Shokunin Sogo Shosha Taiwan Tonya, or Toiya Yedo Yushutsu Kumiai Zaibatsu Tokugawa Era
Meiji Restoration
Meiji Era Taisho Era Showa Era
GLOSSARY 247
Alcoholic drink distilled from rice A member ofthe military dass in feudal Japan Co-operative society Alternate attendance, referring to the obligation imposed on daimyo of residing for part of each year in Yedo Military governor of the State during period when the Emperor held aloof from the admin-stration Journeyman Trading company Formosa Wholesale dealer or commission merchant The name for Tokyo before the Meiji era Export guild Money groups or plutocracy 1603-1868; the House of Tokugawa ruled Japan during this period as Shogun The Restoration in 1868 of the Emperor to his former position as de facto head of the State Reign of the Emperor Meiji, 1868-1912 Reign of the Emperor Taisho, 1912-26 The present reign, 1926 to date
WEIGHTS AND MEASURES
Cho = 10 tan = 2.45 acres Koku = 4·96 bushels Kwan = 8·27 Ib Picul = 100 kin = 132·3 Ib Yen = 100 sen = 2s ·058d at pre-1914 gold parity; stabilised at Is 2d from 1934 to 1939. 1950 to 1971: 360 yen = one U.S. dollar
After the devaluation ofthe dollar in 1971, the rate rose to 300 yen to the dollar. After the yen was 'floated' in February 1973, the rate ranged between 280 and 305 until, in 1977, the yen beg an to appreciate in terms of dollars. From then until the autumn of 1979 the rate ranged between 240 (January, 1977) and 172 (October, 1978).

Appendix B STATISTICAL TABLESI
TABLE 1
POPULATION, 1873-1979
(thousands)
Year Population Year Population
1873 35,200 1940 73,100 1903 46,100 1950 83,200 1920 56,000 1955 89,300 1925 59,700 1960 93,400 1930 64,500 1965 98,300 1935 69,300 1970 103,700
1979 116,133
Source: Statistical Year-book 0/ the Empire 0/ Japan for period before the Second World War; Japan Statistical Year-Book (Bureau ofStatistics, Office of the Prime Minister) for post-war years. The figures for 1873 and 1903 are estimates based on local records offamily registrations and corrected in the light of subsequent Census returns. The figures for 1920 and later years are based on the Census returns and on Reports issued by the Prime Minister's Office.
1 These tables refer to Japan Proper only, except when otherwise stated. Before 1945 Japan Proper consisted offour main islands of Honshu, Kyushu, Shikoku and Hokkaido, together with the Kuriles, and Luchus and other small outlying islands. A few ofthe tables, notably those showing the foreign trade, also cover Karafuto (Southem Saghalien) up to the Second World War. After that war Karafuto and the Kuriles were transferred to Russia.
248

TA
BL
E
11
DIS
TR
IBU
TIO
N O
F P
OP
UL
AT
ION
AC
CO
RD
ING
TO
S
IZE
OF
TO
WN
SH
IP
(as
perc
enta
ges
of t
otal
pop
ulat
ion)
Size
of
Uni
t 18
93
1903
19
13
1920
19
30
1935
19
40
Und
er 1
0,00
0 pe
rson
s 84
79
72
68
59
54
50
10,0
00-4
9,99
9 10
10
14
16
16
15
16
50,0
00-9
9,99
9 2
3 4
7 6
5
1 00,
000
and
ove
r 6
9 11
12
18
25
29
100
100
100
100
100
100
100
Sou
rce:
B
ank
of
Japa
n, H
undr
ed-
Year
Sta
tist
ics
of t
he J
apan
ese
Eco
nom
y.
1950
46
20 8 26
100
1960
10
38
12
40
100
Vl
-I
>
-I
Vl
-I
n >
t"'" -I
>
Cl
t"'"
!'Tl
Vl
N "'" '-D

TA
DL
E II
I
TH
E I
ND
US
TR
IAL
DIS
TR
IBU
TIO
N O
F T
HE
OC
CU
PIE
D P
OP
UL
AT
ION
, 18
72-1
979
(tho
usan
ds)
Indu
stry
18
72
1895
19
13
1920
19
30
1940
19
50
1960
19
60
1979
Agr
icul
ture
and
For
estr
y 14
,100
16
,912
15
,527
14
,287
14
,131
13
,842
16
,426
12
,730
8,
990
5,68
0 F
ishi
ng
395
473
535
561
590
559
682
670
470
450
Min
ing
6 96
36
4 44
8 31
5 59
7 59
1 43
0 24
0 12
0 M
anuf
actu
ring
70
5 2,
392
3,95
7 4,
357
4,89
1 7,
160
5,69
0 9,
460
13,4
50
13,3
30
Con
stru
ctio
n 12
2 38
5 63
7 75
8 96
3 95
5 1,
531
2,53
0 3,
710
5,36
0 T
rans
port
an
d C
omm
unic
atio
n 11
8 28
8 77
2 95
2 1,
159
1,36
4 1,
586
2,39
0 3,
380
3,82
0 C
omm
erce
and
Fin
ance
94
7 1,
916
2,83
1 3,
662
4,90
6 4,
881
4,32
5 8,
990
11,3
30
14,1
30
Gov
ernm
ent
& P
rofe
ssio
nal
Serv
ices
50
2 95
2 1,
305
1,51
7 1,
791
2,19
4}
} }
} M
isce
llan
eous
17
9 35
5 49
4 72
1 87
3 92
6 4,
693
7,16
0 8,
780
11,8
10
Tot
al
17
,07
42
3,7
69
26
,42
22
7,2
63
29
,619
32
,478
35
,524
44
,340
50
,350
54
,700
Sou
rces
: K
. O
hkaw
a, T
he G
row
th R
ate
oft
he
Japa
nese
Eco
nom
y si
nce
1878
, pp.
245
-6;
the
1950
figu
res
are
base
d o
n th
e C
ensu
s an
d th
e 19
60 a
nd l
ater
fig
ures
on
the
Lab
our
For
ce S
urve
y. T
he f
igur
es a
re n
ot
prec
isel
y co
mpa
rabl
e.
N
VI
o > '" ::c o '" .., tTl n o z o ::: n ::c '" .., o '" -< o 'Tl ::: o o tTl '" Z ... >
.." >
Z

TA
BL
E
IV
TH
E I
ND
US
TR
IAL
DIS
TR
IBU
TIO
N O
F T
HE
O
CC
UP
IED
PO
PU
LA
TIO
N,
19
20
-19
79
(as
perc
enta
ges
of
tota
l)
Indu
stry
19
20
1930
19
40
1947
19
55
1965
19
79
For
estr
y ·7
·6
·9
1·
4 1·
3 }
23-3
}
10-4
A
gric
ultu
re
50·9
46
·8
41·5
49
·9
37·9
F
ishi
ng
2·0
1·9
1·7
2·1
1·8
1·3
·8
Min
ing
1·6
1·1
1·8
2·0
1·4
·7
·3
Con
stru
ctio
n 2·
7 3-
3 3·
0 4·
0 4·
6 7·
0 9·
8 M
anuf
actu
ring
16
·5
16·0
21
·2
16·3
17
·8
24·2
24
·4
Dis
trib
utio
n (W
hoie
sale
an
d R
etai
l) a
nd F
inan
ce
9·8
14·0
12
·7
6·3
13-8
20
·5
25·8
T
rans
port
an
d C
omm
uni-
cati
ons,
E
lect
rici
ty,
Gas
, W
ater
4·
2 4·
4 4·
7 5·
1 5·
2 6·
6 7·
0 P
ubli
c an
d O
ther
Ser
vice
s 9·
8 11
·6
11·8
11
·5 }
16
·2 }
16
·3 }
O
ther
s 1·
9 ·2
·7
1·
3 21
·5
100·
0 10
0·0
100·
0 10
0·0
100·
0 10
0·0
100·
0
Tot
al (
in t
hous
ands
) 26
,970
29
,340
32
,230
33
,330
39
,150
47
,629
54
,700
Sou
rce:
I.
B. T
aeub
er,
The
Pop
ulat
ion
of J
apan
, p.
87.
In
the
cons
truc
tion
of
this
tab
le,
an a
ttem
pt h
as b
een
mad
e to
re
clas
sify
the
popu
lati
on to
acc
ord
wit
h th
e c1
assi
fica
tion
oft
he
1950
Cen
sus.
Adj
ustm
ents
wer
e al
so m
ade
to ta
ke a
ccou
nt
of sm
all c
hang
es in
the
are
a co
vere
d. T
he ta
ble
is, t
here
fore
, not
com
para
ble
wit
h T
able
III
, bu
t the
tren
ds s
how
n by
them
ar
e id
enti
cal
for
the
peri
od f
rom
192
0 to
194
0. T
he f
igur
es f
or 1
965
are
from
the
Cen
sus
of t
hat
year
and
tho
se f
or 1
979
from
the
Lab
our
For
ce S
urve
y. A
ny d
iscr
epan
cies
, in
this
and
oth
er ta
bles
, bet
wee
n th
e to
tals
and
the
sum
oft
he
indi
vidu
al
item
s ar
e du
e to
rou
ndin
g of
f.
[Jl
--l » --l
[Jl
--l ;:; » r --l » CI:) r m
[Jl
N
VI

252 A SHORT ECONOMIC HISTORY OF MODERN JAPAN
TABLE V
NUMBER OF FACTORY OPERATIVES, 1900-1937
(thousands)
Year Males Females Total
1900 165 257 422 1904 208 318 526 1909 307 494 801 1914 384 564 948 1919 741 871 1,612 1925 852 956 1,808 1929 855 970 1,825 1933 968 933 1,901 1936 1,458 1,135 2,593 1937 1,727 1,2\0 2,937
Source: Department of Commerce and Industry, Factory Statistics. The figures for 1900 and 1904 are of factories emp10ying ten persons or more. The figures for the years from 1909 to 1925 are of factories emp10ying five or more persons. The figures for the remaining years are offactories equipped to employ five or more persons. Employees in Government factories were supposed to be included, but the practice was not consistent.

TAD
LE
VI
DIS
TR
IBU
TIO
N O
F F
AC
TO
RY
EM
PL
OY
ME
NT
AM
ON
G C
HIE
F I
ND
US
TR
IAL
GR
OU
PS
(as
perc
enta
ges
0/ t
otal
em
ploy
men
t in
/ac
tori
es)
Mac
hine
ry
Tex
tiles
an
d an
d W
ood-
Pri
ntin
g T
rans
port
Y
ear
Foo
d C
loth
ing
wor
king
Pu
blis
hing
C
eram
ics
Che
mic
als
Met
als
Equ
ipm
tnt
Oth
ers
1909
9·
1 64
·3
2·7
2·7
4·4
3·5
2-3
6·0
5·0
1914
8·
2 62
·0
3·1
3·0
3·7
4·3
2·9
7·9
4·7
1920
7·
2 55
·0
3·1
N
4·5
6·1
5'1
IH
H
1929
8·
2 55
·3
H
3·1
4·1
7·1
5·5
10·8
2·
5 19
37
6·5
36·8
H
N
4·
2 1
l·2
11
'1
20·9
3·
1 19
48
6·8
19·9
9·
2 2·
6 4·
7 14
·7
IN
27·2
N
19
55
11·0
21
·9
8·5
4·5
5·3
13'1
12
-0
21·7
H
19
59
10·2
18
·5
7·7
4·1
5·1
12·2
IB
24
·9
4·0
1967
9·
8 14
·3
4·4
4·1
5·0
10·7
13
-5
31·2
7·
0 19
78
10.7
12
.2
3.7
4.5
5.0
8.8
13.6
32
.8
8.8
Sour
ce:
Min
istr
y of
lnte
rnat
iona
l Tra
de a
nd I
ndus
try,
Fif
ty Y
ears
o/l
ndus
tria
l Sta
tist
ics,
p.
18.
Fro
m 1
90
9-1
4 o
nly
oper
ativ
es
are
incl
uded
; fro
m 1
91
9-4
2 o
pera
tive
s an
d c1
eric
al s
taff
; aft
er th
en a
ll em
ploy
ees.
The
196
7 an
d 19
78 fi
gure
s ar
e fr
om th
e M
inis
try
of
Inte
rnat
iona
l T
rade
and
Ind
ustr
y, C
ensu
s 0/
Man
u/ac
lure
rs.
Che
mic
als
incl
ude
pape
r, r
ubbe
r, p
etro
leum
and
coa
l pr
oduc
ts.
CIl -I
;!>
-I
CIl -I
("') ;!>
r -I
;!>
CD
r t'l'I
CIl
IV
Vl
VJ

254 A SHORT ECONOMIC HISTORY OF MODERN JAPAN
TABLE VII
A
DISTRIBUTION OF EMPLOYMENT ACCORDING TO SIZE OF ESTABLISHMENT IN MANUFACTURING
INDUSTRIES IN 1930
Size Group Number in Per cent of Total No. of Workers Thousands Employment
Under 5 2,345 53 5-9 271 6 10-49 497 11 50 and over 1,330 30
Total 4,443 100
Source: T. Uyeda, The Growth of Population and Occupational Changes in Japan 1920-1936 (I.P.R.), p. 8. The table does not cover employment in building and certain other trades; hence the discrepancy between the total figure and those given in Tables III and IV.
B
DISTRIBUTION OF EMI?LOYMENT IN MANUFACTURING INDUSTRY ACCORDING TO SIZE OF
ESTABLISHMENT IN 1955, 1968 AND 1975
(percentages of Total)
1955 1968 1975
1-9 19.9 16.1 19.1 10-99 40.8 36.0 36.6 100-999 24.7 30.5 28.8 1000 and over 14.6 17.4 15.6
100.0 100.0 100.0
Source: Ministry of International Trade and Industry, Census of Manufacturers (Tokyo, 1976), and Y. Yamanaka, Small Business in Japan's Economic Progress (Tokyo, 1971), p. 57

STATISTICAL TABLES 255
TABLE VIII
GROWTH OF RAW MATERIAL PRODUCTION, 1873-1934
(Annual Average 0/ Volurne 0/ Production in 1921-25 = 100)
All raw Year Agricultural Livestock Fishery Forestry Minerals Materials
(71) (6) (8) (4) (ll) (l00)l
1873 28·6 15·7 1880 37·2 3-9 3-7 2304 1890 50·1 1l·3 11·2 36·7 1900 65·3 34·4 16·8 26·6 28·2 52·1 1910 76·4 56·0 33·9 72-9 61·3 68·4 1913 84·6 58·0 45·4 77-6 81·3 78·1 1920 104·1 77-5 82·9 95·7 105·0 100·3 1921 96·4 89·2 79·6 104-6 91·4 94·2 1922 100·7 94·9 88·4 96·1 94·9 98·5 1923 96·0 98·6 102·2 104·1 100·6 97·5 1924 98·9 105·9 104·0 97·8 102-9 100·1 1925 106·8 109·9 115·7 96·0 108·8 lOH 1926 102·0 110·7 120·2 97·0 111·4 104·7 1927 109·5 115·2 125·8 98·9 117·8 Ill·5 1928 108·5 128·3 118·9 105·2 121·5 Ill·7 1929 108·8 138·5 126·5 107·0 124·8 11304 1930 117·9 135·0 123·9 lOH 120·6 118·9 1931 104·2 149·9 133·1 104-9 1l3-5 109·7 1932 108·4 172-0 132·1 110·1 113-8 113·9 1933 125·7 168·2 155·6 117·7 128·0 130·1 1934 101·1 171·5 151·4 129·0 141·2 112·9
Source: Y. Koide, Physical Volurne 0/ Raw Material Production in Japan.
1 Figures in brackets give weights.

256 A SHORT ECONOMIC HISTORY OF MODERN JAPAN
TABLE IX
INDICES OF AGRICULTURAL AND FISHERY PRODUCTION
A
(Average 1925-29 = JOO)
Vege- Live-Year General Rice tables Fruit stock Cocoons Fisheries
1880 45 53 13 1900 67 70 30 1910 75 78 84 64 54 43 1920 91 106 109 77 72 69 81 1930 110 113 110 112 112 116 107 1935 103 97 121 137 150 90 123
B
(Average 1933-35 = JOO)
1935 98 96 103 110 104 91 98 1938 116 115 104 120 117 101 101 1950 99 107 131 109 119 24 109
C
(Average 1960 = JOO)
1950 95 101 90 95 72 87 87 1955 125 125 111 122 173 124 137 1960 133 130 133 255 247 122 193 1965 149 126 150 291 462 121 228 1969 165 142 179 384 618 129 250 1978 180 131 198 509 919 106(1975) 347
Source: Bank of Japan, Hundred Year Statistics of Japanese Economy; and Ministry of Agriculture, Abstract of Statistics on Agriculture. Forestry and Fisheries (Annual).

TABLE X
A
RICE PRODUCTION AND CONSUMPTION, 1880-1937
(annual averages)
Net Import ( + ) Consumption Production Yie1d per Cho or Net Export ( - ) per Head
Period million koku koku million koku koku
1880-84 29·96 11·59 0·18 0·80 1885-89 36·58 13·78 0·74 0·93 1890-94 40·36 14·64 + 0·37 1·01 1895-99 39·27 14·00 + 1·15 0·95 1900-04 44·64 15·64 + 274 1·05 1905-09 47·58 16·34 + 3·18 1·07 1910-14 51·17 17·06 + 2·96 1·07 1915-19 56·89 18·46 + 4·18 1·13 1920-24 56·34 18·59 + 5·91 1'10 1925-29 59-45 18·71 + 10·01 1·14 1930-34 62·23 18·95 + 10·80 1·08 1935-37 63·71 19·50 +12-46 1·06
Sourees: Statistical Section, Department of Agriculture and Forestry, Statisties of Riee, quoted in Ishii, op. eit., p. 165; and E. F. Penrose, in Schumpeter (Ed.), op. eit., pp. 151-3. The total area under rice increased only from 2,685,000 cho in 1888 to 3,127,000 cho in 1920 and to 3,217,000 cho in 1937. The figures in the fourth column include trade between Japan Proper and her Colonies.
In this and other tables all production figures for the Meiji era should be regarded as approximate.
B
RICE PRODUCTION AND CONSUMPTION, 1934-1976
Year
1934 1950 1960 1965 1968 1969 1976
Production (thousand
metrie tons)
7,776 9,651
12,853 12,409 14,449 14,003 11,772
Yie1d (Kg. per tan)
251 324 398 386
424
Consumption (Kg. per head)
170 122 114 115
88 (1975)
Source: Ministry of Agriculture, Forestry and Fisheries. During the period after the Second World War, imports declined steeply. They amounted to only 6 % of domestic production in 1955-9. In recent years Japan has become an exporter of rice on balance.

258 A SHORT ECONOMIC HISTORY OF MODERN JAPAN
TABLE XI
A
GROWTH OF PHYSICAL VOLUME OF MANUFACTURING PRODUCTION, 1895-1938'
(Annual averages, 1910-14 = 100)
1895-99 1905-09 1925-29 1930-34 1935-38
Textiles 41 70 270 352 416 Metals and Machinery 25 61 255 410 920 Chemica1s and
Ceramics 53 453 643 1,255 W ood Products 91 570 601 1,018 Food Products 80 85 193 186 190 Electricity and Gas 27 653 1,002 1,517 All Manufactures (37) 69 313 377 600
, Based on indices of Bureau of Industrial Research, Nagoya Koto Shogyo Gakko, quoted in W. W. Lockwood, The Economic Deve/opment 0/ Japan, p. 115.
B
INDICES OF INDUSTRIAL PRODUCTION, 1930-1978
(1960 = 100)
1930 1937 1955 1965 1969 1978
All industries 22 38 47 174 321 507 Utilities 15 27 55 166 259 469 Mining 50 78 78 106 111 82 Manufacturing 21 37 46 177 331 521
Food 54 64 77 34 173 223 Textiles 46 85 62 147 205 225 Ferrous metals 9 25 44 178 361 481 Machinery 10 15 29 199 471 718 Chemicals 11 31 50 208 374 665 Ceramics 25 37 51 160 252 338 Paper and Pulp 18 26 53 153 237 329
Source: Bank of Japan, Hundred Year Statistics of Japanese Economy, and Ministry of International Trade and Industry (MITI).

STATISTICAL TABLES 259
TABLE XII
DISTRIBUTION OF OUTPUT AMONG CHIEF INDUSTRIAL GROUPS BY VALUE ADDED
(output of each group as percentage of total)
1930 1955 1957 1959 1968 1978
Textiles 36·5 17·5 14·8 10·3 6·5 4·5 Metals 8·5 17·0 21·2 16·4 14·5 15·4 Machinery, Vehicles,
TooIs, etc. 11·6 14·6 23·6 31·2 35·7 33-4 Ceramics 2·7 3-4 3-4 4·8 4·8 5·2 Chemicals 15·2 19·1 19-6 21·0 17·1 14·5 W ood-working 2·7 5·1 2·2 2·3 1·7 2·4 Printing, Book-
binding, etc. 3·2 3·3 2·7 4·4 4-4 5·2 F ood and Drink 16·0 17·9 11·0 7·3 7·6 10·2 Others 3·6 2·1 1·4 2·3 7·7 9·2
100·0 100·0 100·0 100·0 100·0 100·0
Source: See note to Table VI. Because of a difference in classification, the 1959, 1968 and 1978 figures are not preciseIy comparable with those for earlier years.

260 A SHORT ECONOMIC HISTORY OF MODERN JAPAN
TABLE XIII
STATISTICS OF THE COTTON INDUSTRY
1875-79 1880-84 1885-89 1890-94 1895-99 1900-04
20 30
100 710
2,230 2,740
Year
1896 1900 1903 1907 1913 1918 1921 1925 1929 1931 1934 1936 1937 1950 1955 1959 1960 1963 1965 1967 1969 1973 1978
, Annual averages.
A-Import 0/ Raw Cotton' (thousand piculs)
1905-09 3,610 1910-14 5,610 1915-19 7,490 1920-24 8,460 1925-29 11,190 1930-34 11,900
B-Yarn Output2
(million Ib.)
1894-98 177 1935-37 1909-13 492 1950 1919-23 796 1955 1925-29 1,026 1960 1930-34 1,158 1965
1969 1978
C-Exports 0/ Cotton Goods Piece-Goods3
(million (million square yards) yen)
45 2·2 113 5·7 94 6·9
182 16·3 235 43·0
1,006 268·6 689 204·7
1,298 432·9 1,791 412·7 1,414 198·7 2,577 492-4 2,710 483-6 2,644 5nl 1,103 1,139 1,263 1,424 1,206 1,206
959 657 295 363
2 Annual averages up to 1937.
1935- 37 1951-55 1956-60 1961-65 1966-69 1970-78
1,485 518 857
1,243 1,210 1,124 1,087
Yarn (million
Ib)
17 83
123 91
187 169 117 124 27 13 26 44 52 25 26 24 87 33 25 14 16 18 II
13,750 7,760
11,100 12,580 13,200 13,800
3 The value figures include types of goods additional to those covered in the first column.

STATISTICAL TABLES 261
D
Equipment 0/ Cotton-Spinning Industry
Number of Power- Number of Power-Number of Cotton Looms Owned by Looms Owned by Spin dIes in Place Spinning Companies Specialist Weavers
Year ending (thousands) , (thousands) (thousands)
1877 1887 1893 1897 1903 1907 1913 1920 1925 1929 1933 1935 1937 1945 1950 1955 1960 1966 1969 1979
8 77
382 971
1,381 5 1,540 9 2,415 24 3,814 51 5,186 68 6,650 74 8,525 84
10,330 90 12,297 108 2,064 25 4,340 52 8,168 81 7,781 66
12,555 60 11,659 56 9,894
E
Total Number 0/ Looms in Cotton Industry
(thousands)
Type of Loom
Hand-Iooms Narrow Power-Iooms Wide Power-Iooms
1922
165 122 96
1926
105 116 146
1929
86 106 171
199 220 237 255 112 178 294 307 332 325
1936
51 76
266
Sources: Department ofCommerce and Industry, Statistics o/Commerce and Industry; Japan Cotton Spinners' Association, Cotton Statistics 0/ Japan; Oriental Economist, Foreign Trade 0/ Japan: A Statistical Survey; Toyo Spinning Company, Institute for Economic Research, Statistical Digest 0/ Japanese Textile Industry.
, Mainly ring spindIes, the number of mules being very smalI. The figures for 1966, 1969 and 1979 are not comparable with earlier figures; they are for 'Cotton System SpindIes' and they exclude Condenser-system and Gill system spindIes. In post-war years a high proportion of the spindIes were used for spinning stable fibre and synthetic fibre.

262 A SHORT ECONOMIC HISTORY OF MODERN JAPAN
TABLE XIV
STATISTICS OF THE WOOLLEN AND WORSTED INDUSTRY
A-Raw Wool and Yarn (million Ib.)
Raw Wool Annual Imports Averages (Greasy) Imports
1896-1900 5·5 1·2 1901-05 8·7 2·6 1906-10 9·9 3·7 1911-14 11·4 5·0 1915-19 47·1 0-4 1920-24 57·2 13·9 1925-29 93·2 13·1 1930-34 186·5 4·7 1935-37 239·2 ·8 1955-59 278·2 ·9 1960-64 499·6 ·6 1965-69 626·6 ·5 1970-78 611·7
* average of 1965-6 ** average of 1976-7
t1921-24
B-Tissues
Output Total value (million yards) (inciuding
other kinds) Woollen
Year Muslin Serge Cloth (million yen)
1900 5·1 0·4 0·8 1907 23-8 1·3 2·6 19·9 1913 6% 9·8 1·8 23-3 1922 89·3 24·5 6·7 136·5 1925 127·6 28·3 5·4 182·5 1929 165·6 47·6 9·0 210·5 1934 132·9 90·5 16·9 264·0 1936 340·0
C
Output of all Wool Tissues Year (million square metres)
1934 255·2 1953 138·3 1957 202·3 1960 316·4 1965 340·9 1969 433·6 1979 325·7
Source: MITI, Monthly Statistics.
Yarn
Exports
0·2 0·6 0·2 0·3 H H 8-4
13·3 25·8* 21·8**
Output
not 52·8 85·4
145·2 226·6 320·2 362·3 320·5
Imports Exports (all kinds) (all kinds)
(million yen) (million yen)
17-8 12·2 0·2 1H 0·5 50·0 1·8 57-2 3·7 19·9 4·3 5·2 29·8 1·0 46·0
Export of all Wool Tissues (million square metres)
4·2 24·3 32·7 51·2 56·4 10·1
STATISTICAL TABLES
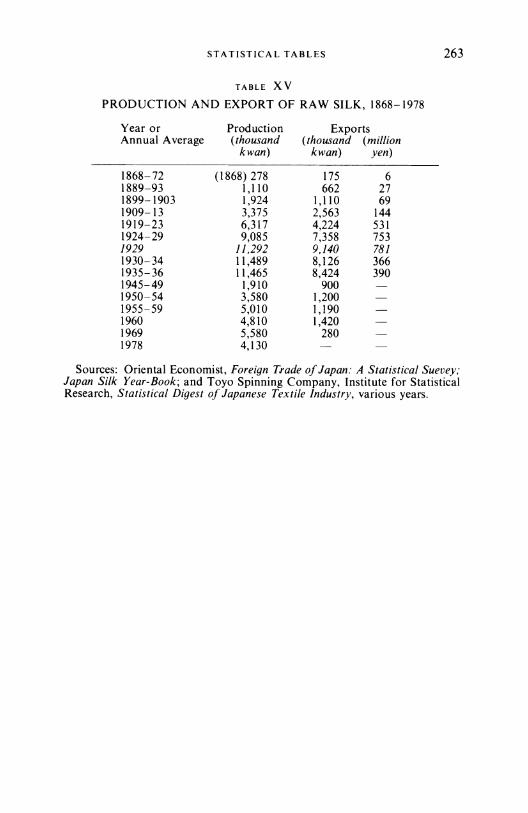
TABLE XV
PRODUCTION AND EXPORT OF RAW SILK, 1868-1978
Year or Annua1 Average
1868-72 1889-93 1899-1903 1909-13 1919-23 1924-29 1929 1930-34 1935-36 1945-49 1950-54 1955-59 1960 1969 1978
Production (thousand
kwan)
(1868) 278 1,110 1,924 3,375 6,317 9,085
11,292 11,489 11,465
1,9\0 3,580 5,010 4,8\0 5,580 4,130
Exports (thousand (million
kwan) yen)
175 662
1,110 2,563 4,224 7,358 9,140 8,126 8,424
900 1,200 1,190 1,420
280
6 27 69
144 531 753 781 366 390
263
Sources: Oriental Economist, Foreign Trade of Japan: A Statistical Suevey; Japan Silk Year-Book; and Toyo Spinning Company, Institute for Statistical Research, Statistical Digest of Japanese Textile Industry, various years.

Yea
r
1934
19
36
1950
19
55
1960
19
65
1970
19
79
Yea
r
1934
19
36
1950
19
55
1960
19
65
1970
19
79
TA
BL
EX
VI
PR
OD
UC
TIO
N A
ND
EX
PO
RT
OF
SY
NT
HE
TIC
FIB
RE
S A
ND
TE
XT
ILE
S
Pro
dUC
lion
Syn
thet
ic F
ibre
s R
ayon
Fab
rics
S
pun
Ray
on F
abri
cs
Syn
thet
ic F
abri
cs
Co
tto
n F
abri
cs
(tho
usan
d m
etri
e Io
ns)
(mil
lion
sq.
mel
res)
(m
illi
on s
q. m
etre
s)
(mil
lion
sq.
met
res)
(m
illi
on s
q. m
etre
s)
I 16
118
380
1,02
8 1,
410
Ray
on F
ilam
ent
(tho
usan
d m
elri
e Io
ns)
10·1
20
·1
2·6
8·6
19·9
19
·5
28·3
39
·2
420
3 3,
393
775
98
2,92
3 33
2 17
5 3
(195
1)
1,28
9 64
7 74
9 54
2,
524
771
1,05
7 42
4 3,
222
390
354
114
Exp
orts
Ray
on F
abri
cs
(mil
lion
sq.
mel
res)
441
127
286
236
200
125 59
935
1,24
1 82
7 2,
746
591
2,98
0
Syn
thet
ic F
abri
cs
(mil
lion
sq.
met
res)
4(1
95
6)
65
419
1,33
9 1,
587
3,01
3 2,
616
2,33
9
Spu
n R
ayon
Fab
rics
(m
illi
on s
q. m
etre
s)
37
436
559
376
136 68
Sou
rce:
M
ITI,
Mon
thly
Sta
list
ies.
The
fig
ures
for
cot
ton
are
incI
uded
for
com
pari
son;
aft
er 1
936
thes
e in
cIud
e m
ixtu
res.
The
fig
ures
for
ray
on f
abri
cs p
rodu
ctio
n ar
e af
fect
ed a
fter
196
0 by
a c
hang
e in
met
hod
of c
alcu
lati
on.
IV
0'1 """ >
CIl X o '" -I !Tl n o z o ~
n x CIl -I
o '" -< o ."
~ o o !Tl '" Z ..... > ..., > z

ST A TISTICA L TABLES 265
TABLE XVII
IRON AND STEEL PRODUCTION
(thousand metrie tons)
Exports of Iron Year Pig Iron Finished Steel and Steel
1896 26 I 1906 145 69 1913 243 255 1920 521 533 1925 685 1.043 1929 1,087 2,034 1931 917 1,663 1936 2,008 4,539 489 1937 5,800 1949 1,549 3,100 1955 5,136 9,407 1,989 1959 9,446 16,629 1960 11,896 22,138 2,313 1965 27,502 41,161 9,664 1970 68,048 93,323 17,539 1978 78,589 102,105 36,382 (1976) 1979 89,825 111,788 30,978
Source: Department ofCommerce and Industry, Refereneesfor Steel Works, and post-I 945) Ministry of International Trade and Industry, Monthly Statisties. The figures for steel production for 1937 onwards are for steel ingots and castings.
TABLE XVIII
COAL PRODUCTION
(million melrie tons)
1875 0·6 1931 28·0 1885 1·2 1936 41·8 1895 5·0 1937 45·2 1905 13·0 1945 23-0 1913 21·3 1950 38·5 1919 31·3 1955 42-4 1921 26·2 1959 47·3 1925 31·5 1960 51·1 1929 34·3 1965 49·5
1970 39·7 1978 19·0 1979 17·6
Source: Department of Commerce and Industry, Mines Bureau, General Conditions of Mining in Japan, and (post-1945) Ministry of International Trade and Industry, Monthly Statisties.

266 A SHORT ECONOMIC HISTORY OF MODERN JAPAN
TABLE XIX
ELECTRICITY GENE RATING CAPACITY
(thousand Kilowatts)
1903 44 1913 597 1920 1,378 1925 2,768 1929 4,194 1937 6,977 1950 10,771 1960 23,657 1969 59,482 1979 122,349
Source: Bank of Japan, Hundred Year Statistics of Japanese Economy, and Economic Statistics Annual.
Period (annual averages)
1899-1903 1904-08 1909-13 1914-18 1919-23 1924-28 1929-33 1934-37 1950-54 1955-59 1960-64 1965-69 1970-4 1975-8
TABLE XX
SHIPBUILDING
Steamships and Motor Ships Launched (thousands gross tons)
23 41 52
267 294 66
106 259 472
1,758 2,433 7,486
13,294 11,516
Sourees: Department of Communications, Record of Ships and Shipbuilding: Statistical Year-Book of League of Nations; and United Nations Monthly Bulletin of Statistics. Ships of over 100 gross tons included. In 1970 the tonnage launched was 9,880,000. The figures for the 1970s are for ships comp1eted.

TA
BL
E
XX
I
PR
OD
UC
TIO
N O
F C
ER
TA
IN F
AS
T-G
RO
WIN
G I
ND
US
TR
IES
Pol
yvin
yl C
hlor
ide
Cem
ent
Mot
or V
ehic
les
Rad
io R
ecei
vers
A
utom
obil
e T
yres
S
heet
Gla
ss
Yea
r (t
hous
and
tonn
es)
(mill
ion
tonn
es)
(tho
usan
d un
its)
(t
hous
and
unit
s)
(tho
usan
d to
nnes
) (m
illio
n ca
ses)
1934
4
3 3
1936
6
9 42
7 4
1950
I
4 28
28
7 14
4
1955
32
11
64
1,
789
27
7 tI
l
1960
25
8 23
47
4 12
,851
86
12
-i
1965
48
3 33
1,
856
22,9
37
163
15
» -i
1970
1,
161
57
5,24
3 32
,517
36
8 25
tI
l -i
19
79
1,59
2 88
9,
573
13,9
09
708
38
n
Ure
a T
elev
isio
n S
ets
Mac
hine
Too
ls
E1e
ctri
c R
efri
gera
tors
M
etal
Fur
nitu
re
» r-Y
ear
(tho
usan
d to
nnes
) (t
hous
and
unit
s)
(tho
usan
d un
its)
(t
hous
and
unit
s)
(ton
nes)
-i
» =
19
34
8 r- tT1
1936
16
tI
l
1950
17
4
5 19
55
172
137
18
31
1960
65
1 3,
578
80
908
1965
1,
254
4,19
0 90
2,
313
27,2
34
1970
2,
460
12,4
87
257
2,65
6 20
9,02
6 19
79
2,08
0 13
,580
16
4 4,
765
549,
399
Sou
rce:
MIT
I, M
onth
ly S
tati
stic
s. T
he f
igur
es f
or M
otor
Veh
icle
s co
ver
pass
enge
r ca
rs a
nd
cha
ssis
for
4-w
heel
ed v
ehic
les.
The
fi
gure
for
the
ear
lier
yea
rs a
re n
ot p
reci
sely
com
para
ble
wit
h th
ose
for
1950
an
d o
nwar
ds.
N
0'1
-....I

268 A SHORT ECONOMIC HISTORY OF MODERN JAPAN
Year
1872 1883 1887 1894 1904 1914 1924 1930 1934 1960 1964
TABLE XXII
TRANSPORT
A
Mileage of Railway Track Year
18 1873 240 1880 640 1890
2,100 1896 4,700 1903 7,100 1913
10,400 1925 13,400 1929 14,500 1931 17,500 1934 17,500 1939
1945 1955 1960 1965 1970 1973 1975 1978
B
Steamships and Motor Ships
(thousand grass tons)
26 42
143 363 657
1,514 3,496 3,802 3,918 3,812 5,729 1,344 3,393 6,674 9,125
26,647 31,232 33,548 32,872
Motor Vehicles in Use (thousands)
Trucks and Passenger End of Fiscal Year Buses Cars
1920 I 7 1925 8 19 1929 26 46 1939 145 55 1950 300 48 1955 728 158 1960 1,380 440 1964 2,587 1,462 1969 8,212 6,934 1973 10,157 14,473 1976 11,011 18,475
Sources: Statistical Year-Book 0/ Empire 0/ Japan (for pre-war shipping figures which cover registrations of ships of 20 gross tons and over in Japan Proper); The Ministry of Transport is the source ofpost-war figures wh ich cover ships of 100 gross tons and over. The figures for 1973, 1975 and 1978 are for ocean-going ships of 3,000 gross tons and over. In August 1945, it is estimated, only 557,000 gross tons were operable.

STATISTICAL TABLES 269
TABLE XXIII
FOREIGN TRADE OF JAPAN PROPER, 1868-1937
(excluding trade between Japan Proper and her Colonies) (million yen)
Period Imports Exports
1868-72 (annual average) 23 16 1873-77 (annual average) 27 22 1878-82 (annual average) 33 30 1883-87 (annual average) 33 42 1888-93 (annual average) 73 77 1894-98 (annual average) 223 139 1899-1903 (annual average) 270 244 1904-08 (annual average) 442 337 1909-13 (annual average) 544 496 1914-20 (annual average) 1,300 1,434
Year Imports Exports Year Imports Exports
1919 2,173 2,099 1929 2,216 2,149 1920 2,336 1,948 1930 1,546 1,470 1921 1,614 1,253 1931 1,236 1,147 1922 1,890 1,638 1932 1,432 1,410 1923 1,982 1,488 1933 1,917 1,861 1924 2,453 1,807 1934 2,283 2,172 1925 2,573 2,306 1935 2,472 2,499 1926 2,377 2,045 1936 2,764 2,693 1927 7,179 1,992 1937 3,783 3,175 1928 2,196 1,972
Source: Oriental Economist, The Foreign Trade 0/ Japan: A Statistical Survey (main1y). The tables dealing with foreign trade apply to Japan Proper and Southern Saghalien. The exports include a small amount of re-exports.

270 A SHORT ECONOMIC HISTORY OF MODERN JAPAN
TABLE XXIV
V ALUE OF FOREIGN TRAOE, AMERICAN AID ANO SPECIAL PROCUREMENT, 1945-1979
(million U.S. dollars)
Exports Imports (f.o.b.) (c.i.f.) Aid Procurement
Sept. 1945- Oec. 1946 103 306 193 1947 174 526 404 1948 258 684 461 1949 510 905 535 1950 820 974 361 149 1951 1,355 1,995 164 592 1952 1,273 2,028 824 1953 1,275 2,410 809 1954 1,629 2,399 596 1955 2,011 2,471 557 1956 2,501 3,230 595 1957 2,858 4,284 549 1958 2,876 3,033 482 1959 3,456 3,599 458 1960 4,055 4,491 549 1961 4,236 5,810 449 1962 4,916 5,637 376 1963 5,452 6,736 347 1964 6,673 7,938 337 1965 8,452 8,169 354 1966 9,776 9,523 485 1967 10,442 11,663 532 1968 12,972 12,987 587 1969 15,990 15,024 641 1970 19,318 18,881 661 1971 24,019 19,712 623 1972 28,591 23,4771 710 1973 36,930 38,314 739 1974 55,536 62,110 704 1975 55,753 57,865 733 1976 67,225 64,799 752 1977 80,495 70,809 818 1978 97,534 79,343 968 1979 103,032 110,672
Sources: Ministry of Finance and Bank of Japan. The depreciation of the dollar in terms of yen and other currencies since 1971 has exaggerated the rise that has occurred.

STATISTICAL TABLES 271
TABLE xxv A
THE STRUCTURE OF THE EXPORT TRADE 1868-1936
(the value 0/ each group shown as percentage 0/ total exports)
Semi-Food and Raw Manufactured Finished
Period Drink Materials Goods Goods Others
1868-72 25·4 23-1 40·8 1·9 8·8 1878-82 37·1 11·6 40·4 7-2 3·7 1893-97 16·8 10·3 43·3 26·2 304 1903-07 11·9 9·1 45·3 31·1 2·6 1908-12 11·1 9·2 48·1 30·5 1·1 1918-22 7·6 5·8 42·4 42-46 1·6 1923-27 6·7 6·5 45·9 39·8 1·1 1928-32 8·3 4·2 39·0 46·8 1·7 1933-36 8·0 4·4 26·4 58·4 2·8
Source: K. Taniguchi, Strukturwandlungen des japanischen Aussenhandels im Laufe des Industrialisierungsprozesses, in Weltwirtscha/tliches Archiv, July 1937. The table does not cover trade between Japan Proper and her Colonies.
B
1934-1978
(as percentages 0/ total value)
1934-36 1955 1959 1970 1978
Textiles and Products 52·0 37·3 29·8 12·5 5·5 Raw Silk 11·1 2·5 1-3 a a Cotton Fabrics 16·5 11-4 8·4 1-0 ·4 Clothing 5·3 6·0 2·4 ·5
Metals and Metal Products 8·2 19·2 11·6 19·7 16·4 Machinery and Vehicles 7·2 12·3 2304 46·3 64·1
Textile Machinery 0·4 1·3 1-0 1-0 ·7 Sewing Machines 1-7 1·5 ·6 Ships 3·9 ]0'6 7·6 7·3 Motor Vehic/es 1·2 15-9
F ood and Drink 9·5 6·8 7·6 1·3 1·1 Chemicals 4·3 4·7 4·8 6·4 5·2 Ceramics 2·9 4·2 1·7 1·9 1·4 Toys 0·9 2·1 2·2 ·7 ·3 Other Goods 15·0 1304 18·9 11·2 6·0
100·0 100·0 100·0 100·0 1000
Source: Ministry of International Trade and Industry; Economic Planning Agency, Economic Survey 0/ Japan. Covers trade with colonies in 1934-36. a = negligible.
272 A SHORT ECONOMIC HISTORY OF MODERN JAPAN
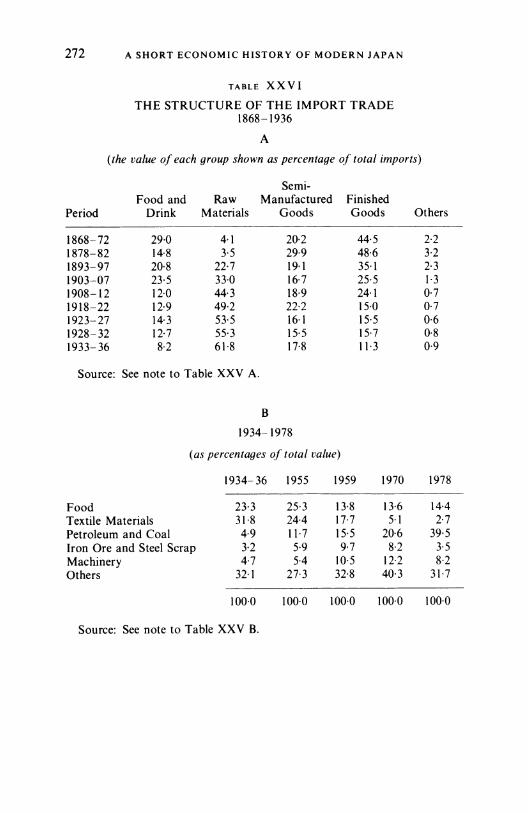
TABLE XXVI
THE STRUCTURE OF THE IMPORT TRADE 1868-1936
A
(the value 01 each group shown as percentage 01 total imports)
Semi-Food and Raw Manufactured Finished
Period Drink Materials Goods Goods Others
1868-72 29·0 4·1 20·2 44·5 2·2 1878-82 14·8 3·5 29·9 48·6 3·2 1893-97 20·8 22·7 19·1 35·1 2·3 1903-07 23·5 33-0 16·7 25·5 1·3 1908-12 12·0 44·3 18·9 24·1 0·7 1918-22 12·9 49·2 22·2 15·0 0·7 1923-27 14·3 53·5 16·1 15·5 0·6 1928-32 12·7 55-3 15·5 15·7 0·8 1933-36 8·2 61·8 17·8 11·3 0·9
Source: See note to Table XXV A.
B
1934-1978
(as percentages 01 total value)
1934-36 1955 1959 1970 1978
Food 23·3 25·3 IH 13·6 14·4 Textile Materials 31·8 24-4 17·7 5·1 2·7 Petroleum and Coal 4·9 11·7 15·5 20·6 39·5 Iron Ore and Steel Scrap 3-2 5·9 9·7 8·2 3-5 Machinery 4·7 5·4 10·5 12·2 8·2 Others 32·1 27·3 32·8 40·3 31·7
100·0 100·0 100·0 100·0 100·0
Source: See note to Table XXV B.

STATISTICAL TABLES 273
TABLE XXVII
A
CHANGES IN EXPORT MARKETS
(as percentages of total exports)
1934- 36 1955 1960 1967 1970 1978
United States 17 23 27 29 31 26 China (mainland) 18 1 3 3 3 Korea and F ormosa 21 5 5 7 8 10 South East Asia 19 28 27 21 17 14 Europe (including U.S.S.R.) 8 10 13 16 17 19 Other countries 17 34 28 24 24 28
100 100 100 100 100 100
B
CHANGES IN SOURCES OF IMPORTS
1934-36 1955 1960 1967 1970 1978
United States 25 31 34 28 29 19 China (mainland) 10 3 1 2 1 3 Korea and Formosa 24 4 2 2 2 5 South East Asia 16 22 18 13 13 16 Saudi Arabia, Kuwait, Iran 5 8 10 9 19 Europe (including U.S.S.R.) 10 7 11 15 14 12 Other countries 15 28 26 30 32 26
100 100 100 100 100 100
Source: Mitsubishi Economic Research Institute, Monthly Circular, January 1957; Economic Planning Agency, Economic Survey of Japan, various years; Bank of Japan, Economic Statistics Annual.

274 A SHORT ECONOMIC HISTORY OF MODERN JAPAN
TADLE XXVIII
A
THE VOLUME OF FOREIGN TRADE, 1873-1937
(1913 = 100)
Terms of Year Exports Imports Trade
1873 1·8 6·3 103·7 1880 7·8 11·2 129·4 1885 11·4 10·1 130·8 1890 15·0 23·8 125·9 1895 27·2 29·2 130·4 1900 31·9 48·4 124·4 1905 48·7 81·6 132-4 1910 76·8 73·6 108·7 1913 100·0 100·0 100·0 1918 146·5 105·2 81·9 1920 108·0 123·9 97-4 1922 123·6 162·1 128·7 1925 158·8 174·2 lOH 1929 204·8 199·2 102-3 1930 188·9 175·1 95·4 1931 194·9 194·3 100·2 1932 230·2 191·8 88·0 1933 25404 198·8 82·2 1934 300·9 212·2 72-7 1935 341·3 222·2 71·4 1936 373·0 244·1 69·2 1937 388·1 259·5 60·8
Source: K. Kojima, Japan's Foreign Trade and Economic Growth in Annals ofthe Hitotsubashi Academy, April 1958, pp. 166-7. Termsoftrade:exportprice index as percentage of import price index (as on p. 145 supra). Trade with colonies excluded.
B
POST-WAR VOLUME OF TRADE
(1934-36 = 100)
Year Exports Imports Year Exports Imports
1948 8 18 1954 55 86 1949 16 28 1955 72 90 1950 30 33 1956 86 114 1951 31 48 1957 95 143 1952 38 61 1958 99 117 1953 41 83 1959 117 148

STATISTICAL TABLES 275
C
POST-WAR VOLUME OF TRADE
(1960 = 100)
Year Exports Imports
1954 33 49 1955 52 50 1956 62 62 1957 69 77 1958 72 65 1959 87 81 1960 100 100 1961 108 131 1962 128 129 1963 144 152 1964 178 175 1965 230 177 1966 265 208 1967 278 260 1968 317 284 1969 405 331 1970 461 454
(1975 = 100)
1970 62·5 82·7 1971 74·7 82-4 1972 79·8 93·1 1973 84·5 119·1 1974 99·7 113-0 1975 100·0 100·0 1976 122·0 108-4 1977 132·9 111·1 1979 133.0 131.6
Source: Ministry of Finance.

276 A SHORT ECONOMIC HISTORY OF MODERN JAPAN
TADLE XXIX
SPECIFIC HOLDINGS OF BANK OF JAPAN AND GOVERNMENT, 1903-1936
(million yen)
Year ending At Home Abroad Total
1903 120 19 139 1905 37 442 479 1910 135 337 472 1913 130 246 376 1919 702 1,343 2,045 1920 1,116 1,062 2,178 1926 1,127 230 1,357 1929· 1,087 91 1,178 1931· 470 1936· 548
Source: Ministry of Finance, Financial Statistics.
• The figure for 1929 is for March, shortly before the decision to return to the gold standard was announced. For the period 1929- 36 there is no information provided about Government holdings or foreign holdings. But as both holdings abroad and Government holdings had become very small by 1929, it may be assumed that the figures for 1931 and 1936 cover substantially all the holdings. It should be noted, however, that they were not revalued after the fall of the yen during this period.

STA TISTICAL TABLES 277
TABLE XXX
FOREIGN EXCHANGE RESERVES
(million U.S. dollars)
1951 930 1961 1,486 1971 15,235 1952 913 1962 1,841 1972 18,365 1953 637 1963 1,878 1973 12,246 1954 738 1964 1,999 1974 13,518 1955 839 1965 2,107 1975 12,815 1956 941 1966 2,074 1976 16,604 1957 524 1967 2,005 1977 22,848 1958 831 1968 2,891 1978 33,019 1959 1,322 1969 3,496 1979 20,327 1960 1,824 1970 4,399
Source: Ministry ofFinance. The figures for 1951 to 1955 are forthe end ofthe fiscal year and for 1956 to 1970 for the end ofthe calendar year. The figures are based on a new method of calculation introduced in April 1958 and therefore ditTer from estimates published before that date. After 1963 the figures exclude IMF gold tranche. In interpreting these figures, the dollar depreciation after 1971 should be kept in mind.

278 A SHORT ECONOMIC HISTORY OF MODERN JAPAN
TADLE XXXI
A
WHOLESALE PRICE INDEX, 1900-1936
(October 1900 = JOO)
Average for Year Average for Year Average for Year
1900 100 1913 132 1925 267 1901 96 1914 126 1926 237 1902 97 1915 128 1927 225 1903 103 1916 155 1928 226 1904 108 1917 195 1929 220 1905 116 1918 255 1930 181 1906 120 1919 312 1931 153 1907 129 1920 343 1932 161 1908 125 1921 265 1933 180 1909 119 1922 259 1934 178 1910 120 1923 264 1935 186 1911 125 1924 273 1936 198 1912 132
Bank of Japan's index of wholesale prices of 56 commodities in Tokyo; an unweighted index.
B
TOKYO COST OF LIVING INDEX, 1914-33
(1914 = JOO)
Average for Year Average for Year Average for Year
1915 93 1922} 223 1928 199 1916 101 215 1929 193 1917 124 1923 205 1930 175 1918 174 1924 208 1931 156 1919 217 1925 214 1932 157 1920 235 1926 208 1933 161 1921 208 1927 204
Source: T. Uyeda, The Smalllndustries 0/ Japan, p. 298. The break at 1922 is explained by Uyeda's use of two incomplete series.

STATISTICAL TABLES
C
WHOLESALE PRICE INDEX, 1946-78
(1934-36 = 1)
279
Average für Year Average für Year Average für Year
1946 16 1955 343 1964 357 1947 48 1956 358 1965 359 1948 128 1957 368 1966 368 1949 209 1958 344 1967 374 1950 247 1959 348 1968 377 1951 343 1960 352 1969 386 1952 349 1961 356 1970 400 1953 352 1962 350 1975 624 1954 343 1963 356 1978 656
D
WHOLESALE PRICE INDEX, 1955-79
(1975 = JOO) Average für Year
1955 55 1961 57 1967 60 1973 1956 57 1962 56 1968 60 1974 1957 59 1963 57 1969 62 1975 1958 55 1964 57 1970 64 1976 1959 56 1965 57 1971 63 1977 1960 56 1966 59 1972 64 1979
Bank üf Japan; Economic Statistics Annual.
E
CONSUMER PRICE INDEX (TOKYO), 1947-79
(1965 = JOO)
Average für Year
1947 25 1971 138 1950 50 1972 144 1954 68 1973 152 1958 70 1974 199 1960 74 1975 222 1962 83 1976 244 1966 \05 1977 264 1969 122 1978 276 1970 130 1979 286
74 97
\00 \05 107 112

280 A SHORT ECONOMIC HISTORY OF MODERN JAPAN
TABLE XXXII INDICES OF WAGE MOVEMENT (TOKYO), 1918-1936
(1914 = JOD)
A
Average for Actual Earnings Cost of Living (b) Year (a)
1918 164 1921 297 1924 356 1926 348 1929 331 1931 296 1933 290
(1926 = JOD)
B
174 208 208 208 193 156 161
Real Wage Index
94 143 171 168 171 190 180
Average for Wage Rates Actual Earnings Cost of Living Real Wage Year (c) (d) (e) Index
1929 1930 1931 1932 1933 1934 1935 1936
99 96 91 88 85 83 81 81
104 99 91 88 89 91 91 92
(a) Ministry of Commerce and Industry's Index. (b) Uyeda's Index. (c), (d) and (e) Bank of Japan's Indices.
91 78 68 69 73 75 76 80
114 127 137 128 122 121 120 115

STATISTICAL TABLES
C
INDEX OF WAGE MOVEMENTS, 1952~1978
Average Monthly Total Cash Earnings
(1960 = lOO)
Year All Industries Manufacturing
1952 59 61 1955 76 75 1960 100 100 1965 165 163 1970 314 323 1975 741 740 1978 975 975
281
Source: Ministry of Labour. Index covers establishments with 30 or more employees.
TABLE XXXIII
INDEX OF REAL WAGES IN MANUFACTURING INDUSTRY, 1934~1979
(l934~36 = lOO)
1947 30 1961 155 1972 320 1950 85 1962 159 1973 352 1952 102 1963 162 1974 358 1953 107 1964 174 1975 356 1954 108 1965 176 1976 365 1955 115 1966 188 1977 367 1956 126 1967 204 1978 375 1957 127 1968 224 1979 389 1958 130 1969 249 1959 139 1970 269 1960 146 1971 304
Source: Ministry of Labour. The Index includes allowances and covers regular, 'productive' workers in establishments with 30 or more employees.

282 A SHORT ECONOMIC HISTORY OF MODERN JAPAN
TABLE XXXIV
A
TRADE UNION MEMBERSHIP, 1947-1978
(thousands at end 0/ year)
Estimated Rate Year of Organization
1947 5,692 45·3 1949 6,655 55·8 1951 5,720 42·6 1960 7,516 33·1 1965 10,070 34·8 1970 11,605 35·4 1978 12,383 32·6
B
UNION ORGANISATION RATIO IN V ARIOUS INDUSTRIES IN 1978
(as percentage 0/ employment)
Agriculture, F orestry, Fishing 22 Mining 45 Construction 17 Manufacturing 38 Finance, Insurance 63 Transport and
Communications 64 Public Utilities 75 Government Service 74
Source: Japan Institute of Labour, Japan's Labour Statistics, 1967 p. 136; and Ministry of Labour, Labour Union Basic Survey (various years). Rate of organization is ratio of number of trade unionists to total number of employees as estimated by Labour Force Survey.

Year
1893 1901 1913 1922 1928 1929 1934 1937
STATISTICAL TABLES
TABLE XXXV
A
NUMBER OF BANKS (HEAD OFFICES), 1893-1937
Special Banks Savings Banks Ordinary Banks
53 34 32 33 32 32
648 145 123 94 78 72
1,457 1,794 1,417
874 481 377
Source: Financial and Economic Annual of Japan.
B
Total
703 2,359 2,158 1,973 1,572 1,001
581 481
283
LOANS AND INVESTMENTS OF- FINANCIAL INSTITUTIONS
(as percentage of total)
1959 1969
All Commercial Banks 54·9 (City Banks) 31·5
Financial Institutions for Small Firms 12·4 Financial Institutions for Agriculture and
Fisheries (inc1uding Co-operative Credit Societies) 5·2 Trust Banks* 4·2 Insurance Companies 4·1 Government Financial klstitutions 19·1
47·0 (97) 25·9 (14) 16·4
8·0 5·4 (7) 5·4 (41)
17·7 (14)
Total 100·0 100·0
Source: Bank of Japan, The Japanese Financial System (July 1970), pp. 7 and 19. The figures in brackets show the number ofbanks or other institutions (head offices).
* Excludes investment trusts.
284 A SHORT ECONOMIC HISTORY OF MODERN JAPAN
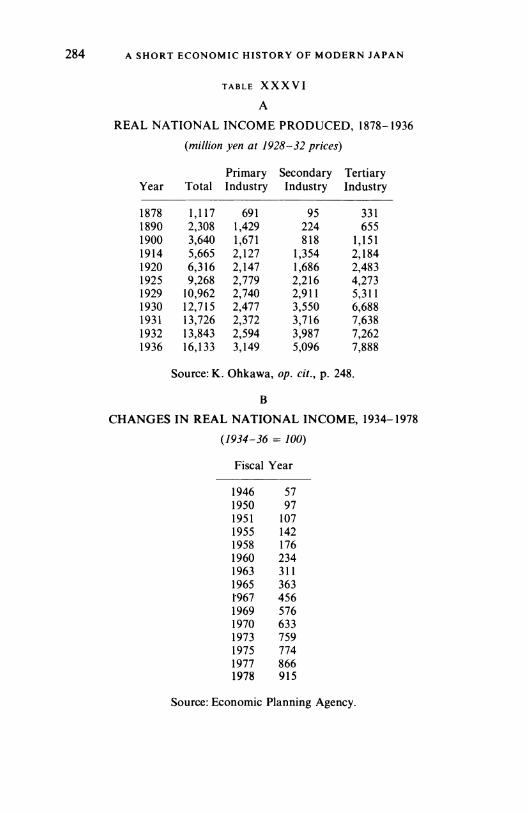
TABLE XXXVI
A
REAL NATIONAL INCOME PRODUCED, 1878-1936
(million yen al 1928-32 prices)
Primary Secondary Tertiary Year Total Industry Industry Industry
1878 1,117 691 95 331 1890 2,308 1,429 224 655 1900 3,640 1,671 818 1,151 1914 5,665 2,127 1,354 2,184 1920 6,316 2,147 1,686 2,483 1925 9,268 2,779 2,216 4,273 1929 10,962 2,740 2,911 5,311 1930 12,715 2,477 3,550 6,688 1931 13,726 2,372 3,716 7,638 1932 13,843 2,594 3,987 7,262 1936 16,133 3,149 5,096 7,888
Source: K. Ohkawa, op. eil., p. 248.
B
CHANGES IN REAL NATIONAL INCOME, 1934-1978
(1934-36 = JOO)
Fiscal Year
1946 57 1950 97 1951 107 1955 142 1958 176 1960 234 1963 311 1965 363 1"967 456 1969 576 1970 633 1973 759 1975 774 1977 866 1978 915
Source: Economic Planning Agency.

STATISTICAL TABLES 285
C
THE RATE OF INCREASE IN THE GROSS NATIONAL PRODUCT (REAL)
Percentage Percentage Year Increase Year Increase
1953 7·2 1966 11·6 1954 6·5 1967 13·1 1955 9·4 1968 13·8 1956 8·3 1969 12·3 1957 11·5 1970 10·2 1958 3·7 1971 5·6 1959 10·3 1972 10·4 1960 15-4 1973 6·5 1961 15·5 1974 0·0 1962 7·3 1975 3·2 1963 7·7 1976 5·5 1964 13·8 1977 5·8 1965 4·0 1978 5·7
Source: Economic Planning Agency: Annual Report on National Income Statistics. The estimates are subject to frequent revisions.
o
COMPARATIVE ANNUAL RATES OF GROWTH OF REAL GROSS NATIONAL PRODUCT, 1860-\976
(per cent)
\860-19\3 \9\3-38 1950-60 \960-70 \970-76
Japan 4·\ 4·5 9·5 5·0 7·0 United Kingdom 2-4 \·0 2·7 2·9 2·5 U.S.A. 4·3 2·0 2·9 4·3 2·8 Germany* 3·0 \·3 7·6 4·6 2·5 France \. \ \. \ 4·3 5·7 4·0
Source: Ministry of Foreign Affairs (Japan), The Economic Development of Japanfor 100 Years (1967), p. 2, and U.N. Yearbook of National Accounts.
* West Germany after 1950.

Appendix C
Bibliography
The following list of publications is intended to indicate the chief printed sources which have been used in the writing of this book and to provide guidance to those who wish to pursue further study of the topics discussed in it. Publications in the Japanese language are marked thus: (J). Pamphlets prepared for the Institute of Pacific Relations are indicated by the letters (IPR).
PART I
GENERAL
(MAINLY STATISTICAL SOURCES FOR PRE-1937 PERIOO)
Bank of Japan, Hundred Year Statistics of the Japanese Economy, 1966.
(J) Bank of Japan, Statistics of Factory and Mining Labour (Monthly). (J) Department of Commerce and Industry, Factory Statistics
(Annual). (J) Department ofCommerce and Industry, Statistics ofCommerce and
Industry (Annual). (J) Department of Commerce and Industry, Mines Bureau, General
Conditions of Mining Industry in Japan (Annual). (J) Department ofCommerce and Industry, Referencesfor Steel Works
(Annual). Department of Agriculture and Forestry, Statistical Abstract of the
Ministry of Agriculture and Forestry (Annual). Department of Finance, Financial and Economic Annual of Japan. F. V. FIELD (Ed.), Economic Handbook of the Pacific Area, 1934. M. IKETANI, The Japan Silk Year-Book.
286

BI BLIOG RAPHY 287
(J) Imperial Cabinet, Bureau of Statistics, Reports of the Censuses of Population, 1920, 1925, 1930, 1935.
Imperial Cabinet, Bureau of Statistics, Population of Japan, 1920, 1925.
Imperial Cabinet, Bureau of Statistics, Resume Statistique de /'Empire du Japon (Annual).
(1) Imperial Cabinet, Bureau of Statistics, Statistical Year-Book of the Empire of Japan.
Japan Cotton Spinners' Association, Cotton Statistics of Japan, 1903-35.
(J) Japan Cotton Spinners' Association, Bi-Annual Reports. The Japan Year Book. The Japan-Manchukuo Year-Book. K. KOHRI, General Features of the Index Numbers of Japan,
1932. (J) Y. KOIDE, Physical Volume of Raw Material Production in Japan,
1936. (J) Ministry of International Trade and Industry, Fifty Years of
Industrial Statistics, 1963. (J) Nagoya Koto Shogyo Gakko, Japanese Economic Statistics, 1936.
Oriental Fconomist, The Foreign Trade of Japan: A Statistical Survey, 1935.
Kyoto University Economic Review (Quarterly). Mitsubishi Economic Research Bureau, Monthly Circular. Oriental Economist (English Edition, Monthly).
(1) K. Ohkawa, M. Shinohara, M. Umemura, Estimates of Long Range Economic Statistics of Japan since 1868 (14 vols.), 1965-79.
11
THE TOKUGAWA PERIOD AND THE EARL Y YEARS OF MEIJI
(C HAPTERS 1 AND 2)
The Currency of Japan (A Reprint of Articles, Letters and Official Reports; published by the Japan Gazette), 1882.
T. FUKUDA, Die gesellschaftliche und wirtschaftliche Entwicklung in Japan, 1900.
W. E. GRIFFlS, The Mikado's Empire (2 vols), 1903. E. HONJo, A Social and Economic History of Japan, 1935.

288 A SHORT ECONOMIC HISTORY OF MODERN JAPAN
Y. HONYDEN, 'Der Durchbruch des Kapitalismus in Japan', in Weltwirtschaftliches Archiv, July 1937.
J. F. K UIPER, 'Some Notes on the Foreign Relations of Japan, 1798-1805', in Trans. of Asiatic Society of Japan, December 1924.
J. MURDOCH, A History of Japan (3 vols), 19\0. E. H. NORMAN, Japan's Emergence as a Modern State, 1946. S. OKUMA, Fifty Years of New Japan (2 vols), 1909. S. OKUMA, A General View of Financial Policy during Thirteen Years,
1868-1880, 1880. S. OKUMA, 'The Industrial Revolution in Japan', in the North American
Review, November 1900. M. PASKE-SMITH, Western Barbarians in Japan and Formosa, 1603-
1868, 1930. G. B. SANSOM, Japan, A Short Cultural History, 1931. G. B. SANSOM, The Western World and Japan, 1950. C. D. SHELDON, The Rise of the Merchant Class in Tokugawa Japan,
1600-1868, 1958. N. SKENESMITH, Tokugawa Japan, 1937. N. SKENE SMITH, An 1ntroduction to Some Japanese Economic Writings
of the Eighteenth Century, 1935. T. C. SMITH, Political Change and 1ndustrial Development in Japan:
Government Enterprise, 1868-1880, 1955. T. C. SMITl-i, The Agrarian Origins of Modern Japan, 1959. M. T AKAKI, A History of Japanese Paper Currency, 1903. Y. T AKEKOSHI, Economic Aspects of the History of the Civilization of
Japan (3 vols), 1930. M. T AKIZAWA, The Penetration of a Money Economy in Japan, 1927. A. F. THOMAS AND S. KOYAMA, Commercial History of Japan, 1936. T. TSUCHIYA, The Development of Economic Life in Japan, 1936. United States Consular Reports, Vol. XIX.
III
MONEY, BANKING AND FINANCE
(CHAPTERS 3,6 AND 9)
G. C. ALLEN, 'The Recent Currency and Exchange Policy of Japan', in Economic Journal, March 1925.
A. ANDREADEs, Les Finances de ['Empire Japonais et leur Evolution, 1932.

BIBLIOGRAPHY
M. ARAKI, The Financial System in Japan (IPR), 1933. Fuji Bank, Banking in Modern Japan (2nd edn, 1967).
289
S. FURUYA, Japan's Foreign Exchange and her Balance of Payments, 1928.
J. INOUYE, Problems ofthe Japanese Exchange, 1914-1926,1931. Japanese Department of Finance, ABrief Outline of the Financial
System of Japan, 1905. Japanese Economic Federation, The Capital Market of Japan, 1940. T. JONES, 'The Recent Banking Crisis and Industrial Conditions in
Japan', in Economic Journal, March 1928. M. MATSUKATA, Report on the Adoption ofthe Gold Standard in Japan,
1899. M. MATSUKATA, Report on the Post-Bellum Financial Administration in
Japan. Mitsui Gomei Kaisha, The Mitsui Bank: ABrief History, 1926. G. OOATE, Japan's Financial Relations with the United States, 1919. G. OGAWA, Expenditure ofthe Russo-Japanese War, 1923. G.ONO, War and Armament Expenditures of Japan, 1922. United States Department of Commerce, Japanese Banking, 1931. United States Department of Commerce, The Currency System of
Japan, 1930. United States Department of Commerce, The Big Five in Japanese
Banking, 1929. United States National Monetary Commission, Reports, Vol. XVIII,
1910.
IV
INDUSTRIAL AND AGRICUL TURAL DEVELOPMENT
(C HAPTERS 4, 5, 7 ANO 10)
G. C. ALLEN, Japanese 1ndustry: Its Recent Development and Present Condition (IPR), 1939. G. C. ALLEN, 'Recent Changes in the Organization of the Japanese
Cotton Industry', in Proceedings of the Manchester Statistical Society, 1937.
I. ASAHI, The Economic Strength of Japan, 1939. H. F. BAIN, Ores and Industry in the Far East, 1933. D. H. BUCHANAN, 'The Rural Economy of Japan', In Quarterly
Journal of Economics, 1923.

290 A SHORT ECONOMIC HISTORY OF MODERN JAPAN
Department of Overseas Trade, Report of British Economic Mission to the Far East, 1930-1.
Department of Overseas Trade, Report of the Cotton Mission to the Far East, 1930-31.
Department of Overseas Trade, Report on the Cotton Spinning and Weaving Industry in Japan, 1925-26.
T. R. H. HAVENS, Farm and Nation in Modern Japan, 1870-1940, 1974.
M. IKETANI, The Japan Silk Year-Book. International Labour Office, Industrial Labour in Japan, 1933. Japan Economic Federation, The Heavy Industry of Manchukuo,
1940. K. KANAl, The South Manchuria Railway Company's Part in the
Economic Development of Manchukuo (IPR), 1936. K. KANAl, Economic Development in Manchukuo (IPR), 1936. 'Katakura and Company' (Works pamphlet), 1934. S. KAWADA, 'The Japanese Agricultural Community and the
Composition of its Population', in Journal of the Osaka University of Commerce, 1935.
U. KOBAYASHI, The Basic Industries and Social History of Japan, 1930.
'Miyata Bicycle Company' (Works pamphlet), no date. (J) Nagoya Koto Shogyo Gakko, Business Analysis of Large-Scale
Establishments in Our Wo ollen Industry, 1936. (J) Nagoya Koto Shogyo Gakko, The Present Status of the Woollen
Industry in Japan, 1935. S. N ASU, "Ziele und Ausrichtung der japanischen Agrarpolitik in der
Gegenwart', in Weltwirtschaftliches Archiv, July 1937. S. NASU, Land Utilization in Japan (!PR), 1929. K. Ohkawa, Differential Structure and Agriculture: Essays on
Dualistic Growth, 1972. y. ONO, 'The Industrial Transition in Japan', in Publications of
American Economic Association, Vol. 5, No. 1. I. OTSUKA, "The Survival of Small Undertakings in Japanese
Industry', in Kyoto University Economic Review, December 1934.
A. S. P EARSE, The Cotton Industry of China and Japan, 1932. H. ROSOVSKY and K. OHKAWA, 'The Role of Agriculture in Modern
Japanese Economic Development', in Economic Development and Culrural Change, October 1960.

BIBLIOGRAPHY 291
SCHUMPETER, ALLEN, GORDON ANDPENROSE, The Industrialization of Japan and Manchukuo, 1930-40, 1940.
United States TaritT Commission, The Japanese Cotton Industry and Trade, 1921.
T. UYEDA, The Small Industries of Japan, 1938. S. UYEHARA, The Industry and Trade in Japan, 1926. World Engineering Congress, Tokyo, Industrial Japan, 1929.
V
ECONOMIC ORGANIZA nON AND POLICY
(C HAPTERS 8, 9 AND 10)
G. C. ALLEN, 'The Concentration of Economic Control in Japan', in Economic Journal, June 1937.
(J) Department of Commerce and Industry, General Conditions of Manufacturers' Guilds (Kogyo Kumiai), 1936.
K. FUJITA, 'Cartels and their Conflicts in Japan', in the Journal ofthe Osaka University of Commerce, December 1935.
W. L. HOLLAND (Ed.), Commodity Control in the Pacific Area, 1935. (1) E. HONJO, A Study of Nishijin (Nishijin Kenkyu), 1930. (J) R.IwAI, The Story of Mitsui and Mitsubishi (Mitsui Mitsubishi
Monogatari). Japan Council, Institute ofPacific Relations, The Control of Industry
in Japan, 1933. Mitsubishi Goshi Kaisha, An Outline of Mitsubishi Enterprise,
1926 and 1935. Mitsui Gomei Kaisha, The House of Mitsui, 1933.
(J) Nagoya Koto Shogyo Gakko, Manufacturers' Guilds in Relation to Domestic Industry, 1936.
M. Roy AMA, The Control of the Electric Power Industry in Japan (IPR), 1933.
(J) Sodal Reform (Shakai Seisaku Jiho), May 1934 and April 1935 (articles on structure of many small-scale trades).
Sumitomo Goshi Kaisha, Sumitomo, 1936. (1) M. SUZUKI, Essay on the Japanese Zaibatsu (Nihon Zaibatsu Ron). (J) H. W ADA, 'How Big Capitalists Camouflage Themselves', in Nippon
Hyoron, June 1936. Y. Y AGI, 'The Relation Between Japan Proper and Korea as seen

292 A SHORT ECONOMIC HISTORY OF MODERN JAPAN
from the Standpoint of the Rice Supply', in Kyoto University Economic Review, 1931.
N. Y ASUo, 'Manchukuo's New Economic Policy', in Pacific Affairs, September 1938.
VI
FOREIGN TRADE AND COMMERCIAL POLICY
(CHAPTERS 5,6,8 AND 10)
(J) Department of Commerce and Industry, General Conditions of Export Guilds (Yushutsu Kumiai), 1936.
Department of Finance, The Import Tarif! of Japan. Department of Communications, History of the Mercantile Marine
in Japan, 1883. Y. HATTORI, The Foreign Commerce of Japan Since the Restoration,
1904. Y. KINOSITA, The Past and Present of Japanese Commerce, 1902. K. KOJIMA, 'Japanese Foreign Trade and Economic Growth', in
Annals of the Hitotsubashi Academy, April 1958. W. W. LOCKWOOD, Trade and Trade Rivalry between the United
States and Japan (IPR), 1936. Nippon Yusen Kaisha, Golden Jubilee History, 1935. S. OGATA, 'The Control of Export Trade in Japan', in the Journal of
the Osaka University of Commerce, No. 2, 1934. S.OGATA, 'Probleme der Exportkontrolle in Japan', in Weltwirt
schaftliches Archiv, May 1936. Oriental Economist, The Foreign Trade of Japan: A Statistical
Survey, 1935. K. TANIGUCHI, 'The Concentration and Dispersion of Japan's
Foreign Trade', in Kyoto University Economic Review, Vol. 11, No. 1, 1936.
Tokyo Association for Liberty of Trading, A Brief Analysis of Japan's Foreign Trade, 1935.
Tokyo Association for Liberty of Trading, Export Trade of Japan and Its Control System, 1938.
Tokyo Association for Liberty of Trading, Trade Agreements Between Japan and Some Other Countries, 1937.
Uni ted States Tariff Commission, Recent Developments in the Foreign Trade of Japan, 1936.

BIBLIOGRAPHY 293
T. UYEDA, The Recent Development of Japanese Foreign Trade (IPR), 1936.
T. UYEDA, Recent Changes in Japanese TarifJs (IPR), 1933. Yokohama and Tokyo Foreign Board of Trade, Translation of
Export Guild Law and List of Export Guilds, 1934.
VII
MISCELLANEOUS
E. A. ACKERMAN, Japan's Natural Resources and Their Relation to Japan's Economic Future, 1953.
K. AKAMATSlJ AND Y. KOIDE, Industrial and Labour Conditions in Japan, 1934.
G. C. ALLEN and A. G. DONNITHORNE, Western Enterprise in Far Eastern Economic Development: China and Japan, 1954.
K. BERRILL (Ed.), Economic Development with Special Reference to East Asia, 1964.
C. BLACKER, The Japanese Enlightenment, 1964. M. BRONFENBRENNER, 'Some Lessons of Japan's Economic
Development', in Pacific AfJairs, Spring 1961". Bureau of Social Affairs, Social Work in Japan, 1934. C. D. COWAN(Ed.), The Economic Development ofChina and Japan,
1964. K. EMI, Government Fiscal Activity and Economic Growth in Japan,
1868-1960, 1963. Foreign Affairs Association of Japan, Japan and World Resources,
1937. Hitotsubashi University Economic Review, Reappraisal of the
Japanese Economic Development, May 1970. J. HIRSCHMEIER, The Origins of Entrepreneurship in Meiji Japan,
1964. International Labour Office, Industrial Labour in Japan, 1933. R. ISHlI, Population Pressure and Economic Life in Japan, 1937. M. B. JANSEN (Ed.), Changing Japanese Attitudes Towards Modern-
isation, 1964. Japan F AO Association, A Century of Technical Development in
Japan's Agriculture, 1959. Japan FAO Association, Agricultural Development in Modern Japan,
1963.

294 A SHORT ECONOMIC HISTORY OF MODERN JAPAN
(J) T. KAWANISHI, 'The Conditions of Living of the Japanese Farmers during the Agricultural Depression since 1930', in Studies in Commerce and Economics (St Paul's University, Tokyo), November 1934.
A. C. KELLEY and J. G. WILLIAMSON, Lessons from Japanese Development, An Analytical Economic History, 1974.
S. KOJIMA, Natural Resources of Japan (International Studies Conference), 1938.
S. KUZNETS and others, Economic Growth: Brazi/, India, Japan, 1955. W. W. LOCKWOOD, The Economic Development of Japan, 1954. W. W. LOCKWOOD (Ed.), The State and Economic Enterprise in
Japan, 1965. F. MAURETTE, Social Aspects of Industrial Development in Japan
(ILO), 1934. H. G. MOULTON, Japan: An Economic and Financial Appraisal,
1931. J. I. NAKAMuRA, Agricultural Production and the Economic
Development of Japan, 1873-1922, 1966. K. ÜGATA, The Cooperative Movement in Japan, 1923. K. ÜHKAWA, The Growth Rate ofthe Japanese Economy Since 1878,
1957. K. ÜHKAWA and üthers, (Ed.), Agriculture and Economic Growth:
Japan's Experience, 1969. J. E. ÜRCHARD, Japan 's Economic Position, 1930. E. F. PENROSE, Food Supply and Raw Materials in Japan, 1929. E. F. PENROSE, 'Japan in the World Economic Depression' in Index,
September and üctober, 1935. H. ROSOVSKY, Capital Formation in Japan, 1868-1940, 1961. H. ROSOVSKY, 'Japanese Capital Formation: the Role ofthe Public
Sector', in Journal ofEconomic History, September, 1959. I. B. T AEUBER, The Population of Japan, 1959. K. TAIRA, 'The Characteristics of the Japanese Labour Market', in
Economic Development and Cultural Change, January, 1962.' K. TAl RA, 'The Dynamics of Industrial Relations in Early Japanese
Development', in Labour Law Journal, July, 1962. K. TAIRA, 'The Inter-Sectoral Wage Differentials in Japan, 1881-
1959', in Journal of Farm Economics, May, 1962. S. TSURU, Essays on Japanese Economy, 1958. S. TSURU, Essays on Economic Development, 1968. T. U YEDA, The Growth of Population and Economic Changes in Japan
1920-1935 (IPR), 1936.

BIBLIOGRAPHY 295
T. UYEDA and T. INoKucHI, The Cost of Living and Real Wages in Japan 1914-1936 (IPR), 1936.
PART 11
OFFICIAL OR STATISTICAL
Bank of Japan, Economic Statistics Annual. Bank of Japan, Hundred- Year Statistics of the Japanese Economy,
1966. Bank of Japan, Mon.ey and Banking in Japan, 1964. Bank of Japan, The Japanese Financial System, 1970 and 1978. Bureau of Statistics, Prime Minister's Office, Japan Statistical
Yearbook. 1 Economic Planning Agency, Economic Survey of Japan (Annual).
Economic Planning Agency, Japan Economic Statistics (Monthly). Economic Planning Agency, New Long-range Economic Plan of
Japan, 1961-1970. Economic Planning Agency, Medium-term Economic Plan, 1964-
1968. Economic Planning Agency, Economic and Social Development Plan
1967-1971. Industrial Bank of Japan, Survey of Japanese Finance and lndustry
(Quarterly). Japan External Trade Organization, Foreign Trade of Japan
(Annual). Japan Institute of Labour, Japan's Labour Statistics, 1967 and 1974. Ministry of Agriculture and Forestry, Abstract of Statistics on
Agriculture, Forestry and Fisheries (Annual). Ministry of Finance, Quarterly Bulletin of Financial Statistics. Ministry of International Trade and Industry, Foreign Trade of
Japan (Annual). (J) Ministry of International Trade and Industry, Fifty years of
lndustrial Statistics, 1963. Ministry of International Trade and Industry, White Paper on Small
and Medium Enterprises, 1977.
I This body has been known under different names during the last 30 years, Economic Stabilisation Board (before 1953), Economic Counsel Board (1953-55), and Economic Planning Board (1955-57).

296 A SHORT ECONOMIC HISTORY OF MODERN JAPAN
Ministry of Labour, Japan Labour Code, 1953. Ministry of Labour, Yearbook of Labour Statistics. Oriental Economist, Japan Economic Yearbook. Toyo Spinning Company, Institute of Economic Research,
Statistical Digest of Japanese Textile Industry (Quarterly).
OTHER PUBLICATIONS
J. G. ABEGGLEN, The Japanese Factory, 1958. G. C. ALLEN, Japan's Economic Expansion, 1965. G. C. ALLEN, Japan's Place in Trade Strategy (Atlantic Trade Study),
1968. G. C. ALLEN, How Japan Competes (Institute of Economic AtTairs),
1978. Asia KYOKAI, The Smaller Industry in Japan, 1957. J. BIENFAlT, La Siderurgie Japonaise, 1965. T. A. BISSON, Zaibatsu Dissolution in Japan, 1954. A. BOLTHO, Japan: An Economic Survey, 1953-73, 1975. S. BROADBRIDGE, Industrial Dualism in Japan, 1966. R. CLARK, The Japanese Company, 1979. J. B. COHEN, Japan's Economy in War and Reconstruction, 1949. J. B. COHEN, Japan's Post-War Economy, 1958. Distribution Economics Institute of Japan, Outline of Japanese
Distribution Structures, 1973. R. P. DORE, Land Reform in Japan, 1959. R. P. DORE, British Factory-Japanese Factory, 1973. E. E. EHRLICH and F. W. TAMAGNA, 'Japan', in B. H. Beckhart (Ed.),
Banking Systems, 1954. S. FUIJI, Japan's Trade and her Level of Living (Science Council of
Japan), 1955. E. M. HADLEY, Antitrust in Japan, 1970. D. F. HENDERSON, Foreign Enterprise in Japan, 1973. Holding Company Liquidation Commission, Final Report on Zaibatsu
Dissolution, 1961. J. HIRSCHMEIER and T. YUI, The Development of Japanese Business,
1600-1973, 1975. S. HORIE, Banking System and Bank Liquidity in Japan (International
Credit Conference, Rome) 1952. W. S. HUNSBERGER, Japan and the United States in World Trade, 1964.

BIBLIOGRAPHY 297
Industrial Bank of Japan, Japanese Finance and Industry (Quarterly Surveys).
Japan External Trade Organisation (Jetro), White Paper on International Trade: A Summary, 1978 and earlier years.
Japan Institute of Labour, Japan Labour Bulletin (Monthly), and Japanese Industrial Relations Series, 1979.
Japan Times, Japan's Economy Plunged into Structural Changes, 1978. H. KITAMURA, Choices for the Japanese Economy, 1976. R. KOMIYA (Ed.), Post-War Economic Growth in Japan, 1966. K. KOJIMA, Japan and a Pacific Free Trade Area, 1971. K. KOJIMA, Japan and a New World Order, 1977. S. B. LEVINE, Industrial Relations in Post- War Japan, 1958. A. MADDISON, Economic Growth in Japan and the USSR, 1969. Mitsubishi Economic Research Bureau, Mitsui, Mitsubishi, Sumitomo,
1955. Mitsui & Co., The JOO Year History of Mitsui and Co. Ltd. 1876-1976,
1977. C. NAKANE, Japanese Society, 1973. OECD, Annual Surveys of Japan. OECD, Monetary Policy in Japan, 1972. K. OHKAWA and H. ROSOVOSKY, Japanese Economic Growth, 1973. S. OKITA, The Rehabilitation of Japan's Economy and Asia (Ministry of
Foreign Affairs), 1955. S. ÜKITA, The Impact ofPlanning on Economic Growth in Japan (Japan
Economic Research Centre), 1965. S. OKITA, Causes and Problems of Rapid Economic Growth in Japan
(Japan Economic Research Centre), 1967. K. OKOCHI, B. KARSH and S. B. LEVINE (Ed.), Workers and Employers in
Japan, 1973. H. T. PATRICK, Monetary Policy and Central Banking in Contemporary
Japan, 1961. M. SAKURABAYASHland E. NASEGAWA, 'Interfirm Wage Differentials in
Post War Japan', Monumenta Nipponica, 1963. H. F. SCHIFFER, The Modern Japanese Banking System, 1962. K. SEKI, The Cotton Industry of Japan, 1956. M. SHINOHARA, Growth and Cycles in the Japanese Economy, 1962. M. SHINOHARA, Structural Changes in Japan's Economic Development,
1970. M. SHINOHARA, 'Factors in Japan's Economic Growth', Hitotsubashi
Journal of Economics, February 1964. S. SHIOMI, Japan's Finance and Taxation, 1940-56, 1957.
298 A SHORT ECONOMIC HISTORY OF MODERN JAPAN
s. TSURU, 'Business Cycles in Post-War Japan', The Business Cycle in the Post- War World, (International Economic Association), 1955.
The Economist, Consider Japan, 1962. K. YAMAMURA, Economic Policy in Post-war Japan, 1967. T. YAMANAKA, Small Business in Japan, 1960. T. YAMANAKA, Small Business in Japan's Economic Progress, 1971. T. Y AO (Ed.), Monetary Factors in Japanese Economic Growth, 1970. K. YOSHITAKE, Public Enterprise in Japan: An Introduction, 1973.

Index 'Administrative guidance', 202, 228 Agricultural and Industrial Banks, 55,
III Agricultural cooperative societies,
135, 138 Agricultural experimental stations,
135, 158 Agriculture: after W orld War 11, 192,
222fT.; diversification of, 119, 223; in Meiji era, 64fT.; in Tokugawa era, 17-19, 29, 118, 169; in World Depression, 107-9, 119-20, 144; number employed in, 64, 118, 192, 223; output of, 65, 118-19, 170, 256-7; productivity of, 4-5, 169, 192, 223; State intervention in, 65, 118, 132, 192, 239; technical advances in, 6, 65, 119, 188
Aid, American, 189 Aikawa,161 'American prosperity', 107 Armaments: expenditure on, 50, 141;
manufacture of, 36, 59 Asano, 89, 138 Australia, trade with, 163, 164,201
Bakufu (military dictatorship), 16 Balance of payments, 11-12, 34, 39,
62,101,103--4, 191, 197,208,231, 238
Bank of Chosen, 57 Bank of Japan: foundation of, 52;
note issue of, 53fT., 103, 143; operations of, 54-5, 59-61, 102-5, 110-12, 142-3, 146-7,206,227
Bank of Taiwan, 57, 106 Bank of Tokyo, 205 Banking system, 52fT., 109-10,
204-6 Banks: after World War 11, 204fT.; and
industry, 59, 60, 110,205-7,227; and samurai, 46; colonial, 56-7; commercial, 58, 60, 109-10, 205; foreign, 37; loans and investments of, 283; national, 45-7, 58; number of, 58, 205, 283; savings, 146, 205; 'special', 55-6, 111, 131, 146, 204
Barley, 18,65,118-19 Benevolences (goyokin), 26, 41 Bicycle industry, 87, 127 Bimetallic standard, 47 Boom, in World War 1,101-3 Breweries, 35, 87, 88 Britain, trade with, 39 Bond issues, 207-8 Bonuses, bi-annual, 221 Budgets, balanced, 190, 206-7 Building industry, 8, 91
Camera industry, 211 Camphor monopoly, 50, 131 Canneries, floating, 121 Capital: import of, 39, 49, 50, 56, 86,
90, 182; supply of industrial, 4-7, 47, 55-6, 113, 131, 137-9, 169, 191-2,205-7,226,233,235
Cartels, 157, 228 CastIe-towns, 17, 19 Cement industry, 35, 87, 89, 117 Chemical industry, 87, 89, 117, 119,
154, 211-12, 238 China: indemnity from, 54, 56; in
fluence of, 23; trade with, 22, 67, 74-5, 114, 162, 196,202
Chosen Industrial Bank, 57 Choshu clan, 32 Clan governments, 16, 26, 32 Clothing industry, 211 Coal: export of, 83, 96; import of,
299

300 INDEX
Coal (contd.) 126-7; output of, 20, 82-3, 117, 126, 156, 200, 213, 265
Colonial expansion, 56-7, 137 Colonies, trade with, 114, 120, 164,
196 Commereial poliey, 34, 132--4, 202,
234,237-8, 239--40 Communieations, 21, 37-8; see also,
Railways, Shipping Companies, special eharaeteristies of,
217-18 Competition, 138, 172,216,234,236 Computers, 211 Confucian doctrine, 3 Consumer prices, 47, 103, 207, 279 Consumption patterns, 7-8, 91, 128,
175-6 Cooperative soeieties, 132, 134, 158 Copper industry, 20, 38, 83, 96, 126-7 Cotton goods: exports of, 26, 74-6,
96-7, 108, 114, 162, 197, 260; imports of, 73--4, 97
Cotton industry: after World War 11, 211; capacity of, 75, 123, 152-3, 210, 261; in Meiji era, 73ff.; in Tokugawa era, 35, 73; output of, 79, 117, 123, 151; strueture of, 75-6, 123--4, 152; technieal advances in, 75, 80, 124, 152--4; workers in, 9, 74, 79, 80, 126
Cotton, raw: eultivation of, 18,66-7; import of, 67, 75, 97, 260
Cyc1ieal fluctuations, 11-12, 193, 235-6
Daimyo, 16,26-7 Dai Nippon Seito, 88-9 Dan, Baron, 160 Debasement of eoinage, 26, 41 Deflation, 53--4, 104, 106, 235 Deposits Bureau of Treasury, 57-8,
112, 143, 146, 205, 207 Depression, world (1929 -31), effeets
of, 107ff., 132, 173 Distributive trades, 21, 91-2, 129,
202, 239--40 Domestie industry, system of, 18-19,
20,29-30,40,66-7, 76, 169
'Dual economy', 8-10, 86-7, 217, 236, 254; see also Small-scale industry
Dutch influence, 22, 24-5 Dyestuffs industry, 132
Earthquake, the Great, 105, 182 'Earthquake Bills', 105, 106 Economic growth: analysis of, 106ff.,
230ff.; cyc1es of, 11,235-6; exportled, 10; rate of, 191, 193
Eeonomie Planning Ageney, 194 Edueation: expenditure on, 2-3; in
early Meiji, 2, 34, 65, 93; in Toku-gawa era, 2, 24-5
Eleetrical and eleetronies industry, 85, 127-8, 199,211
Eleetric power, 86,117,118,150,213-14, 266
Emperor, status of, 168 Engineering industries, 36, 84, 85,127,
150, 155, 198, 211 Exchange companies, 41, 45 Expansionist poliey, 15, 62, 171-2,
191,208,234 Expenditure public: amount of, 2,
6-7,50, 105, 141-2, 145,225; on defence, 226, 236, 237, 245
Rxtraterritorial rights, 23 Export credits compensation
scheme, 128 Export guilds, 134, 158 Export-Import Bank, 205 Exports: see F oreign trade, and under
partieular industries
Factories: employment in, 92, 100-1, 150, 252, 253; in early Meiji, 35, 36; in Tokugawa era, 20, 29; sale of government, 53--4, 131; size of, 90, 254; State-owned, 35; see also Publie sector
Faetory Aets, 130 Fair Trade Commission, 228-9 Farmers: condition of, 4, 17, 192;
subsidiary employments of, 5, 66-7,223; unrest among, 25, 120-1; see also under Agrieulture
Farming families, number of, 64, 118

INDEX 301
Farms, size of, 65-6, 118 'February Incident', 142, 160 Fertilisers, 87, 117, 119 Feudalism: character of, 16ff.; decay
of, 26ff.; overthrow of, 33, 38-9, 44 Financial crisis (1927), 106 Financial policy: after World War I,
IOlff.; after World War 11, 189-90, 205ff.; in 1970s, 207 -8; in Meiji era, 49ff.
Fisheries, 18,66, 121-2, 135,257 Flax,78 Food: distribution of, 129; exports of,
34,40,95; imports of, 97, 114, 119, 200-1,231
Foreign enterprise, in Japan, 22-3, 37, 71,90,97-8
Foreign exchange: controls over, 228, 234; dealings in, 34, 39, 55, 57, 60, 62, 10 I ff., 111-12, 143, 145
Foreign investment: by Japan, 56, 58, 101-2, Ill, 159-60,201,206; in Japan, 35, 43, 50, 56, 90
Foreign technical exports, 34, 93 Foreign trade: after World War I,
IOlff., 113-15; after World War 11, 190-3, 196ff.,231, 233; in Meijiera, 34, 37, 95ff.; in 1930s, 16Iff.; restrictions on, 163, 164, 239; statistics of, 113-14, 161-2,269-75; structure of, 95-7,114-15,198-9, 271, 272
Formosa (Taiwan): annexation of, 50, 56; development of, 199; rice production of, 120; trade with, 114
Fringe benefits, 9, 220 Fruit farming, 119 Fukuzawa, Yukichi, 3 Full employment policy, 141, 174 Furukawa, 38, 83, 85, 138
Genroku period, 27 Geta making, 91 Glass industry, 87, 89 Gold: American embargo on, 102;
exchange standard, 62; reserves, 54, 62, 102, 105, 109, 147,237,276-7
Gold standard: adoption of, I I, 54; departure from, 105, 109, 141; re-
turn to, 106 Guilds: in Tokugawa era, 19-20,28-
9, 44; modern, 134-5, 158
Habutae, 73, 122 Hemp, 18, 78 Hidachi, 86, 216 Hokkaido: agriculture in, 66 Hokkaido Development Bank, 57,
204 Hokkaido Development Commis-
sion,35 Honda, S., 216, 234 Hong Kong, 199 Hosiery industry, 78, 152 Housing, 8, 237 Hu Shih, Dr (quoted), 173 Hypothec Bank, 55-6, 111, 204
Import duties, see Tariffs Import trade, see Foreign trade and
und er particular industries Income-doubling Plan, 192-3 India, trade with, 107, 114, 163 Industrial Bank of Japan, 56, 61, 111,
131,204 Industrial efficiency, 122, 145-6,
I 52ff., 156, 199,231,233,237 Industrial production, 117, 144,
150ff., 188-95,258-67 Industrial relations, 8-9, 80, 129,
171,218ff. Industry: diversification of, 231; dual
character of, 8-10, 63, 86-7, 128, 139-40,217; in Meiji era, 35ff.; in Tokugawa era, 18, 28; numbers engaged in, 92, 129, 150, 250-4; small firms in, 91, 128-9; structural changes in, 149ff., 2IOff., 231, 238; see also under particular industries
Inflation, 41, 47, 102-3, 189 Inouye, Finance Minister, 106, 108,
142 Inouye, Marquis, 137 Iron and steel industry, 20, 81-2, 126,
155, 199,212,265 Iron ore: imports of, 82, 126; pro
duction of, 20, 159 Ito, Prince, 45
302 INDEX
Iwasaki, 93, 137, 140
Japan Atomic Energy Corporation, 225
Japan Development Bank, 205, 226 Japan Electricity Generation and
Transmission Co., 215 Japan Iron and Steel Co., 158, 215 Japan Monopoly Corporation, 225 Japan National Railways, 225 Junsenji Keizai (quasi-wartime-
economy), 7, 147, 160-1, 173-4
Kaempfer, report of, 21, 91 Kanegafuchi, 72 Karafuto (S. Saghalien), 132 Katakura, 71 Kawasaki,3 Konoike,27 Korea: deve10pment of, 50, 57, 160,
199; rice production of, 120, 192; trade with, 82, 114, 196, 201; war in, 190, 230-1
Kuhara, 83, 86 Kyoto, 19, 128
Labour laws, 130, 189,219 Labour Relations Act, 219 Labour Standards Act, 219 Labour supp1y, 9, 80, 90, 129-30,
144, 194, 221- 3, 232, 236- 7 Land reform, 189, 192, 222fT., 230 Land tax, 4, 17-18,43-4,47,49 Land tenure, 18, 66, 118 Landlords, in Meiji era, 4-6 Leadership, business, 2-5, 28, 30, 68,
71,73-4,97,169-70,233-5,239 Libera1isation policy, 202, 206, 237 Lifelong emp10yment system, 8, 220,
221 Literacy,2 Loan and Investment Account, 207 Locomotive manufacture, 85-6 Lukouchiao Incident, 147
Machine tool industry, 212 Machinery: exports of, 163, 271; im
ports of, 97, 164, 272; production of, 85-6, 127, 156,212-13,267
Major Industries Contro1 Law, 157 Management system, 217-18, 233 Manchuria (Manchukuo), 50, 114,
144-5, 159, 161, 196 Manufacturers' guilds (Kogyo Kum
im), 135, 158 Match industry, 38, 90 Matsukata, Prince, 11, 25, 37, 48-9,
172 Matsushita, 216 Meibutsu (speciality) trades, 19, 40,
169 Meiji government, reforms by, 33fT. Merchants: foreign, 22-3, 37, 71,
97-8; in Tokugawa era, 18,20,21, 26-9, 30
MiIlet, 18, 119 Mining, 20, 36, 83-4, 156,210-11 Ministry of International Trade and
Industry (MITI), 228 Mint, founding of, 42 Mitsubishi, 36, 60, 83, 85, 86, 89, 93,
137fT., 215 Mitsui, 21, 30,41,45,60,86,89,98,
137fT., 215 Mitsukoshi Departo, 92 Monetary policy, 190-3, 206-8,
234-6 Monopoly policy, 28-9, 215, 228 Motoori, Nobunaga, 24 Motor car industry, 127, 198-9,212,
267 Motor cycle industry, 212 Mu1berry trees, 18, 67, 120, 210 Munitions manufacture, 35-6 Muslin, production of, 77-8, 125
Nagasaki, 22 Nagoya, 128 Nanyo Yusen Kaisha, 94 National debt, 44, 50-2, 141-2 National income, 92, 116, 188, 191,
195, 284-5 National policy companies, 215 Nationalisation, 158-9 Navigation Subsidy Act, 94 Nippon Gaishi, 86 Nippon Menkwa, 75 Nippon Yusen Kaisha, 75,93-4, 137

INDEX 303
Nishihara loans, 101 Nishijin weavers, 72 Nissan, 161 'Nixon Shock', 194, 238 'No loan' policy, 108 Note issues: by Bank of Japan, 53,
103; by daimyo, 41; by government, 41fT., 45-6, 53; by National Banks, 45-7, 53; in Tokugawa era, 26
Occupation Authority (SCAP), 188-9,204,214-15,218-19,231
Oil imports, 200, 213, 214, 238 Oil industry and trade, 2, 159, 229 'Oil Shock', 194, 212-13, 238 Oil states, trade with, 201 Oji Paper Co., 88 Okuma, Count, 36, 137 Okura, 138 Opium War, 32 Oriental Development Co., 57 Osaka, 19,21, 25 Osaka Shosen Kaisha, 94 Osaka Spinning Mill, 74 'Overloan' condition, 205-6 Owner- Farmer Establishment Law,
221
Paper manufacture, 5,6, 154 Peace treaties, 190 Pension bonds, 43fT. Perry, Commodore, 23 Petro-chemical industry, 212 Planning, economic, 171, 192-3, 227 Pollution, 194, 237 Population: growth of, 64, 116, 145,
188,232,248; in Tokugawa era, 17, 26; occupational distribution of, 12, 92,118,223,232,250-1; rural and urban, 64, 232, 249
Postal system, 25 Pottery industry, 90, 128, 154-5 Price movements, 28-9, 53-4, 62,
103, 104, 107-8, 143, 189-90, 223, 232
Procurement expenditure, special, 190, 197, 231, 242, 270
Production, indices of, 1l7, 144,231, 256-9
Public corporations, 225-6 Public finances, 41fT., 49-52, 132,
206-7 Public sector, 6-7, 131fT., 225 'Purges', post-war, 189,230
Railways, 35, 37, 44, 50,92, 220, 268 Rates of interest, 49, 142-3, 147 Rationalisation, 152-3, 157 Rayon industry, 151-2, 154,211,231 Recessions, after World War 11, 191,
194,212-13,221 Reconstruction Finance Bank, 226 Reflation, 141-3, 197 Reforms, postwar, 189 Reparations, 189 Restoration, the, (Meiji Ishin), 16, 31 Retail trade, 21, 91-2, 240 Retirement, age of, 239 Rice: area under, 65; exports of, 95;
imports of, 118, 120, 192; price of, 30, 103, 108, 119, 200; price support policy for, 192, 223-4, 239; production of, 18, 65, 118, 192, 200, 256-7; rents paid in, 18,66
Rice Control Act, 119 'Rice Riots', 103 Ringisei, 218 Rubber manufactures, 89 Russo-Japanese War, 50-1,94, 187
Saga Rebellion, 33, 44 Sake: production of, 20, 88; tax on, 50 Samurai, 3--4, 6,16-17,26-7,30,32,
36-7, 137, 169 Sank in Korai (alternate attendance),
16, 21, 26 Satsuma: clan, 24, 32, 35-6; Re
bellion, 33, 93 Savings, 5, 6, 58, 169, 192; see also
Banks Scientific instruments, 211 Seclusion policy, 22 Seniority wage system (nenko chingin),
239 Service trades, growth in, 193, 195,
207, 210, 221 Seto, 90, 128 Shibaura Engineering Co., 85

304 INDEX
Shibusawa, Viscount, 4, 74 Shimonoseki, Treaty of, 57,94 Shinko-Zaibatsu (new Zaibatsu), 161,
214-15 Shinohara, Professor (quoted), 11-12 Shipbuilding, 35-6, 37, 84-5, 123,
150-1, 198, 21I, 266 Shipbuilding Encouragement Act, 84 Shipping, 21, 35, 37, 39, 92-5, 101,
159, 188 Silk, raw: commercial organisation
for, 71, 72-3; depression in, 70,121; employment in, 126, 152; exports of, 10, 38, 40, 68-9, 96, 170, 196, 263; government and, 68, 70, 71-2; price of, 103, 107, 119, 121; production of, 18,40, 67fT., 117, 120, 263; size of plants for, 69- 70; technical innovations and, 35, 68-9, 122, 154; valorisation schemes for, 103, 108
Silk fabrics: export of, 20, 73, 96; production of, 72-3, 122, 152
Silk spinning, 72 Silk-worm eggs, 40, 70 Silver standard, 47, 54 Sino-Japanese War: (1894-5), 50,
187; (1937) 159, 187 Small-scale industry, 38fT., 63, 86-8,
90-1,124-5,127-9,216-17,236 Social stability, 188,234-5 Sogo Shosha (trading companies), 215 Sony,216 South East Asia, trade with, 115, 163,
196, 201 Soya beans, 231 'Spring OfTensive' (Shunto), 220 Stabilisation programme ("Dodge
Line"), 190 State intervention in economy: after
World War 11, 225, 234-5; in early Meiji, 33-8, 53-4, 71-4, 77, 78, 81 fT., 94, 170; in 1930s, 156-9
State subsidies, 84-5,94,128,132, 159 Sub-contractors, 217 Sugar: imports of, 88,97; refining of,
35, 87, 88 Sumitomo, 60, 85,110, 136fT., 215 Suzuki, 138, 181
Synthetic fibres and fabrics, 211, 264
Takahashi, Finance Minister, 141-2, 147
TarifTs, 10, 73, 77, 88, 114, 128-9, 132-4
Tatami manufacture, 67 Taxation, 43-4, 49, 50-I, 142, 227,
234 Tea trade, 40, 95 Technological developments after
World War 11, 192-4,212 Technology, import of, 34-6, 65, 74,
82, 86, 233 'Temporary' workers (Rinjiko), 218 Terakoya (temple schools), 2 Terms of trade, 145, 235-6 Textile trades: importance of, 79, 125,
150fT., 210-1I; workers in, 126,213; see also under separate industries
Tobacco monopoly, 50 Tokugawa era, 15fT., 166fT. Tokyo Electric Co., 85, 86 Tonya (merchants), 71, 72 Toyo Spinning Co., 74 Trade, restrictions on, 21-2, 163-5,
202 Trade associations, 135 Trade unions, 129, 130, 219-20, 233,
282 Treaties, commercial, 23, 32, 50 Trust companies, 113 Trust Fund Bureau, see Deposits Bu
reau of Treasury
Uni ted States, trade with: after World War 11, 193, 196,201,237; before World War I, 40, 96; in inter-war period, 107, 114, 162-3
'Unequal treaties', 23, 33, 170
Valorisation schemes, 119, 132 Vietnam War, efTects of, 20, 231
Wages: flexibility of, 172, 221, 236; movementsin, 116-17, 141-4, 183, 193-4, 207, 208, 221, 280; system of, 130,217,220-1
Wartime economic policy, 147-8

INDEX 305
Watches and docks, manufacture of, 198,211
Welfare, provisions for, 211, 219, 240-1; see also Fringe benefits
Wheat, 18,65,118-19,200 Wholesale price indices, 54, 104, 108,
143, 207, 278-9 Wool textile industry, 35-6, 76-8,
117,124-5,151,162,262 World War I, economic etTects of, 11-
12, l00tT., 187 World War 11, economic etTects of,
187tT.
Yasuda, 60, 78, 126, 131, 243 Yawata Steel, 82, 126, 131
Yedo (Tokyo), 16, 19, 21, 38 Yen: depreciation of, 105, 143; float
ing of, 247; over-valuation of, 105; under-valuation of, 237
Yen bloc, 164, 196 Yokohama Special Bank, 54-5, 60,
62,102-3,111-12
Zaibatsu: financial interests of, 110, 113; government and, 7, 171; industrial properties of, 88, 89; rise and development of, 136-40; dissolution of, 189, 214-18; see also under Mitsubishi, Mitsui, Sumitomo, Yasuda