appendix b region 5 country and regional profiles of...
TRANSCRIPT
This profile and the data therein should not be used in place of focussed assessments and information provided by local monitoring and research institutions.
Appendix B – Region 5
Country and regional profiles of volcanic hazard and risk:
Melanesia and Australia
S.K. Brown1, R.S.J. Sparks1, K. Mee2, C. Vye-Brown2, E.Ilyinskaya2, S.F. Jenkins1, S.C. Loughlin2*
1University of Bristol, UK; 2British Geological Survey, UK, * Full contributor list available in Appendix B Full Download
This download comprises the profiles for Region 5: Melanesia and Australia only. For the full report
and all regions see Appendix B Full Download. Page numbers reflect position in the full report. The
following countries are profiled here:
Region 5 Melanesia and Australia Pg.307
Australia 314
Papua New Guinea 320
Solomon Islands 328
Vanuatu 335
Brown, S.K., Sparks, R.S.J., Mee, K., Vye-Brown, C., Ilyinskaya, E., Jenkins, S.F., and Loughlin, S.C. (2015) Country and regional profiles of volcanic hazard and risk. In: S.C. Loughlin, R.S.J. Sparks, S.K. Brown, S.F. Jenkins & C. Vye-Brown (eds) Global Volcanic Hazards and Risk, Cambridge: Cambridge University Press.

This profile and the data therein should not be used in place of focussed assessments and information provided by local monitoring and research institutions.
Region 5: Melanesia and Australia
Figure 5.1 The distribution of Holocene volcanoes through the Melanesia and Australia region. The capital cities of the constituent countries are shown.
Description
Region 5, Melanesia and Australia, comprises volcanoes in five countries. Australia, France, Papua
New Guinea, the Solomon Islands and Vanuatu. The volcanoes of France in this region are the
overseas territories of Matthew and Hunter Islands and Eastern Gemini Seamount, located at the
southern end of the Vanuatu chain. The details of these French islands are incorporated into the
French Pacific Islands country profile of Region 13. Here, just one Australian volcano is classed as
Region 5, but we present two further Australian volcanoes from Region 3 in the Australia profile.
Country Number of volcanoes
Australia 1 + 2 from Region 3 France (See Region 13) 3 Papua New Guinea 56 Solomon Islands 8 Vanuatu 14
Table 5.1 The countries represented in this region and the number of volcanoes. Volcanoes located on the borders between countries are included in the profiles of all countries involved. Note that countries may be represented in more than one region, as overseas territories may be widespread.

308
Volcanism in this region has arisen due to a complex system of plate interactions, with multiple
micro-plates located throughout the region. Most volcanoes are due to subduction zone processes,
dominantly with the subduction of the Pacific and Solomon Sea Plates. The singular volcano on
mainland Australia is due to intra-plate processes. Most volcanoes here are of andesitic or basaltic
composition, and a range of volcano types are present throughout the region. About 60% of all
volcanoes are stratovolcanoes or types of large cones, with 11% of volcanoes classified as calderas.
Large explosive volcanism is recorded back into the Pleistocene, with seven volcanoes having
Pleistocene records of VEI ≥4 eruptions. Despite this, the more recent record is sparse until historical
times. 83 volcanoes have had confirmed or suspected Holocene activity, of which 37 have historical
activity. Of a total of 449 Holocene eruptions, 400 are dated post-1500 AD, and 86% of events have
been recorded through historical observations. The absence of a comprehensive record prior to
recent centuries means that full understanding of activity and hazard here is difficult.
Holocene activity has comprised eruptions of VEI 0 to 6, indicating a range of small to very large
explosive events. Explosive activity is relatively common with about 8% of eruptions of VEI ≥4, and
with moderate to large explosive events occurring about every 13 years. Approximately 12% of
historical eruptions have produced pyroclastic flows.
The population through this region is such that most volcanoes are classed with low to moderate PEI
values. However, about 260,000 people live within 10 km of one or more Holocene volcano, within
the distance where many of the hazardous flows are concentrated. 25 historical eruptions have
resulted in fatalities (6% of historical eruptions here), with most deaths attributed to pyroclastic
flows and tsunamis. This region ranks third for the number of tsunami-generating eruptions
historically.
Dedicated volcano monitoring is in place in Papua New Guinea, Vanuatu and the Solomon Islands,
though most frequently using few seismic stations. The only Risk Level III volcano in the region,
Rabaul in Papua New Guinea, is monitored by the Rabaul Volcano Observatory, with multiple
dedicated ground-based monitoring systems.
Volcano Facts
Number of Holocene volcanoes 83
Number of Pleistocene volcanoes with M≥4 eruptions 7
Number of volcanoes generating pyroclastic flows 24 (69 eruptions)
Number of volcanoes generating lahars 13 (17 eruptions)
Number of volcanoes generating lava flows 20 (110 eruptions)
Number of eruptions with fatalities 28
Number of fatalities attributed to eruptions 10,445
Largest recorded Pleistocene eruption The M7.4 Kiau Ignimbrite eruption at Long Island at 19,245 BP.

309
Largest recorded Holocene eruption The largest recorded Holocene eruption in this region was the 998 BP Dk eruption of Dakataua at M7.4.
Number of Holocene eruptions 449 confirmed Holocene eruptions.
Recorded Holocene VEI range 0 – 6 and unknown
Number of historically active volcanoes 37
Number of historical eruptions 400
Number of volcanoes
Primary volcano type Dominant rock type
9 Caldera(s) Andesitic (3), Basaltic (3), Dacitic (2), Rhyolitic (1)
1 Hydrothermal field Andesitic (1)
48 Large cone(s) Andesitic (24), Basaltic (20), Dacitic (1), Phonolitic (2), Rhyolitic (1)
1 Lava dome(s) Andesitic (1)
2 Shield(s) Basaltic (2)
11 Small cone(s) Andesitic (6), Basaltic (2), Dacitic (1), Rhyolitic (2)
9 Submarine Andesitic (2), Dacitic (1), Unknown (6)
Table 5.2 The volcano types and dominant rock types of the volcanoes of this region according to VOTW4.0.
Eruption Frequency
VEI Recurrence Interval (Years)
Small (< VEI 4) 1 Large (> VEI 3) 10
Table 5.3 Average recurrence interval (years between eruptions) for small and large eruptions in Melanesia and Australia.
The eruption record indicates that on average small to moderate sized eruptions of VEI <4 occur in
this region with an average recurrence interval (ARI) of about a year, whilst the ARI for large
eruptions is longer, at about 10 years.
Eruption Size
Eruptions are recorded through the Melanesia and West Asia region of VEI 0 to 6, representing a
range of eruption styles from gentle effusive events to very large explosive eruptions. VEI 2 events
dominate the record, with nearly 60% of all Holocene eruptions classed as such. Of the eruptions
here, 7.6% are of VEI ≥4.

310
Figure 5.2 Percentage of eruptions in this region recorded at each VEI level; the number of eruptions is also shown. The percentage is of total eruptions with recorded VEI. A further 55 eruptions were recorded with unknown VEI.
Socio-Economic Facts
Total population (2011) 7,187,689
Gross Domestic Product (GDP) per capita (2005 PPP $) 2,363 – 34,548
(Mean 10,889)
Gross National Income (GNI) per capita (2005 PPP $) 2,172 – 34,340
(Mean 10,715)
Human Development Index (HDI) (2012) 0.466 – 0.938 (Low to Very High, Mean 0.64 Medium)
Population Exposure
Number (percentage) of people living within 10 km of a Holocene volcano
257,684 (3.59 %)
Number (percentage) of people living within 30 km of a Holocene volcano
1,252,172 (17.42 %)
Number (percentage) of people living within 100 km of a Holocene volcano
5,869,560 (81.66 %)

311
Hazard, Uncertainty and Exposure Assessments C
LASS
IFIE
D Hazard
III
Long Island; Ulawun; Bagana; Aoba
Manam; Karkar Rabaul
Hazard II
Ambrym; Lopevi Yasur Pago
Hazard I Bam; Ritter Island; Kavachi; Tinakula; Gaua; Epi; Kuwae
Langila
UN
CLA
SSIF
IED
U – HHR
Eastern Gemini Seamount; Hunter Island; Unnamed (258030)
St. Andrew Strait; Unnamed (250030); Dakataua; Bamus; Victory; Waiowa; Billy Mitchell; Simbo; Traitor's Head; Matthew Island
Garbuna Group; Lolobau; Lamington; Savo; Suretamatai
U- HR Loloru Hargy; Dawson Strait Group; Ambitle
Tavui Newer Volcanics Province
U- NHHR
Baluan; Blup Blup; Kadovar; Boisa; Unnamed (252001); Yomba; Umboi; Sakar; Unnamed; Mundua; Bola; Sulu Range; Unnamed; Madilogo; Hydrographers Range; Musa River; Iamalele; Lihir; Tore; Balbi; Kana Keoki; Coleman Seamount; Unnamed; Motlav; Mere Lava; Unnamed (255061); Aneityum
Garove; Doma Peaks; Crater Mountain; Yelia; Managlase Plateau; Sessagara; Goodenough; Takuan Group; North Vate
Garua Harbour; Lolo; Koranga; Gallego
PEI 1 PEI 2 PEI 3 PEI 4 PEI 5 PEI 6 PEI 7 Table 5.4 Identity of the volcanoes in this region in each Hazard-PEI group. Those volcanoes with a sufficient record for determining a hazard score are deemed ‘classified’ (top). Those without sufficient data are ‘Unclassified’ (bottom). The unclassified volcanoes are divided into groups: U-NHHR is Unclassified No Historic or Holocene Record: that is there are no confirmed eruptions recorded in the Holocene. U-HR is Unclassified with Holocene Record: that is there are confirmed eruptions recorded during the Holocene, but no historical (post-1500) events. U-HHR is Unclassified with Historic and Holocene record. The unclassified volcanoes in bold have experienced unrest or eruptions since 1900 AD, and those in red have records of at least one Holocene VEI ≥4 eruption.

312
Population Exposure Index
Number of Volcanoes Population Exposure Index
1 7 0 6 2 5 5 4
21 3 51 2 3 1
Table 5.5 The number of volcanoes in Melanesia and Australia classed in each PEI category.
Risk Levels
Number of Volcanoes Risk Level
1 III 8 II
10 I 18 Unclassified
Table 5.6 The number of volcanoes in the Melanesia and Australia region classified at each Risk Level.
Figure 5.3 Distribution of the classified volcanoes of this region across Hazard and Population Exposure Index levels. The warming of the background colours illustrates increasing Risk levels from Risk Level I - III.
313
Regional Monitoring Capacity
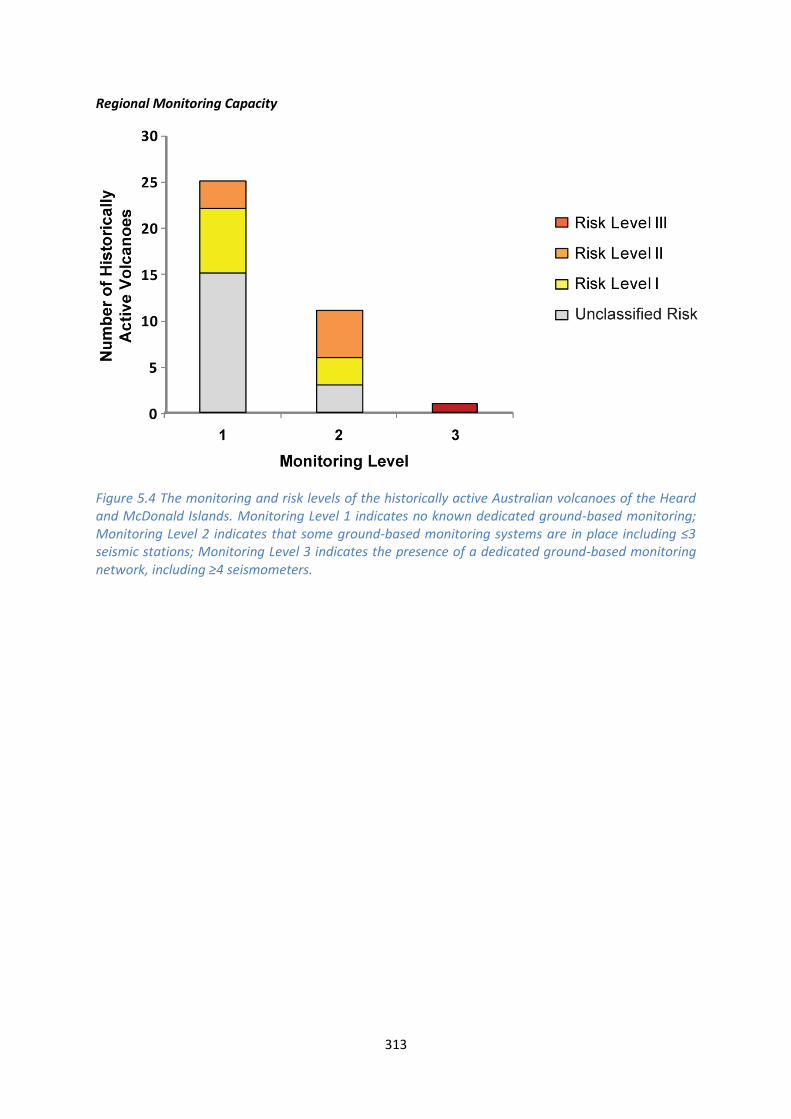
Figure 5.4 The monitoring and risk levels of the historically active Australian volcanoes of the Heard and McDonald Islands. Monitoring Level 1 indicates no known dedicated ground-based monitoring; Monitoring Level 2 indicates that some ground-based monitoring systems are in place including ≤3 seismic stations; Monitoring Level 3 indicates the presence of a dedicated ground-based monitoring network, including ≥4 seismometers.

This profile and the data therein should not be used in place of focussed assessments and information provided by local monitoring and research institutions.
Australia
Note that we include here the two Australian volcanoes located in the Indian Ocean, which are
included in the Region 3 “Middle East and Indian Ocean” description, as defined in this region by the
Global Volcanism Program.
Description
Figure 5.5 Location of Australia’s volcanoes, the capital and largest cities. A zone extending 200 km beyond the country's borders shows other volcanoes whose eruptions may directly affect Australia.
Australia has three Holocene volcanoes: Mount Gambier in the Newer Volcanic Province of south-
eastern Australia, and the Heard and McDonald Islands volcanoes in the southern Indian Ocean.
These volcanoes are related to hot spot volcanism.
All three of Australia’s Holocene volcanoes have Holocene records of lava flows, and two of these
volcanoes – those in the Indian Ocean – have records of historical activity, with eruptions as recent
as 2012. These volcanoes are basaltic to Phonolitic in composition, with a Holocene record of
eruptions of VEI 0 to 2, indicating predominantly effusive to mildly explosive activity.
Less than 1% of the total Australian population lives within 100 km of the Holocene volcanoes,
although this represents over 600,000 people living within 10 km of the Newer Volcanics Province.
This suggests that even small eruptions could cause extensive damage to property and infrastructure
here

315
There is no dedicated regular ground-based monitoring of Australia’s volcanoes. Geoscience
Australia (GA) is the national agency for geoscientific information and would be responsible for
monitoring efforts. GA have experience monitoring, through a twinning programme with the Rabaul
Volcanological Observatory in Papua New Guinea. There are seismometers available for deployment
should volcanic unrest be detected which can telemeter data back to GA in real-time and access to
satellite data can be arranged. Were an emergency event to occur in the Newer Volcanics Province,
GA would provide information and advice to the Crisis Coordination Centre of Emergency
Management Australia.
Volcano Facts
Number of Holocene volcanoes 3
Number of Pleistocene volcanoes with M≥4 eruptions -
Number of volcanoes generating pyroclastic flows 1 (Explosive activity at Mount Gambier about 5,000 years ago)
Number of volcanoes generating lahars -
Number of volcanoes generating lava flows 3
Number of fatalities caused by volcanic eruptions -
Tectonic setting Intra-plate
Largest recorded Pleistocene eruption -
Largest recorded Holocene eruption 7 eruptions are recorded as VEI 2 from Heard volcano from 1881 to 2000 AD.
Number of Holocene eruptions 19 confirmed eruptions. 3 uncertain eruptions.
Recorded Holocene VEI range 0 – 2 and unknown
Number of historically active volcanoes 2
Number of historical eruptions 15
Number of volcanoes
Primary volcano type Dominant rock type
2 Large cone(s) Basaltic (1), Phonolitic (1)
1 Shield(s) Basaltic (1)
Table 5.7 The number of volcanoes in Australia, their volcano type classification and dominant rock type according to VOTW4.0.

316
Socio-Economic Facts
Total population (2012) 23,052,000
Gross Domestic Product (GDP) per capita (2005 PPP $) 34,548
Gross National Income (GNI) per capita (2005 PPP $) 34,340
Human Development Index (HDI) (2012) 0.938 (Very High)
Population Exposure
Capital city Canberra
Distance from capital city to nearest Holocene volcano 652.2 km
Total population (2011) 21,766,711
Number (percentage) of people living within 10 km of a Holocene volcano
157 (<1%)
Number (percentage) of people living within 30 km of a Holocene volcano
4,416 (<1%)
Number (percentage) of people living within 100 km of a Holocene volcano
119,951 (<1%)
Ten largest cities, as measured by population and their population size:
Sydney 4,394,576
Melbourne 3,730,206
Perth 1,446,704
Adelaide 1,074,159
Brisbane 958,504
Newcastle 497,955
Canberra 327,700
Cairns 154,225
Townsville 138,954
Darwin 93,080
Infrastructure Exposure
Number of airports within 100 km of a volcano 0
Number of ports within 100 km of a volcano 1
Total length of roads within 100 km of a volcano (km) 2,577
Total length of railroads within 100 km of a volcano (km) 267

317
Figure 5.6 The location of Australia’s volcanoes and the extent of the 100 km zone surrounding them. Ports, airports and the major cities are just some of the infrastructure that may be exposed to volcanic hazards.
The Newer Volcanics Province is situated in Victoria in the south of Australia, about 200 km from the
city of Melbourne. Being located near the coast, one port lies within 100 km of this province. Many
small communities lie in this radius, exposing their infrastructure, including an extensive road and
rail network. The capital, Canberra, is located more than 600 km from this volcanic province.
Hazard, Uncertainty and Exposure Assessments
Although there is a Holocene record of eruptions for all three Australian volcanoes, the size of the
eruptions at Newer Volcanics Province is unknown and the hazard cannot therefore be assessed at
this volcano without large associated uncertainties. Newer Volcanics Province is therefore
unclassified. . A large population is present close to the Newer Volcanics Province, comprising over
600,000 people within 10 km as this field covers a broad area of SE Australia. This makes Newer
Volcanics Province a PEI 7 volcano, which in turn categorises it as Risk Level III regardless of the
hazard. Heard and McDonald Islands are assigned a Hazard Level of I, based on their eruptive history
of events no larger than VEI 2. These volcanoes have no permanent population living within 100 km,
and are therefore a PEI of 1 making these Risk Level I volcanoes.

318
CLA
SSIF
IED
Hazard III
Hazard II
Hazard I
Heard; McDonald Islands
UN
CLA
SSIF
IED
U – HHR
U- HR Newer Volcanics Province
U- NHHR
PEI 1 PEI 2 PEI 3 PEI 4 PEI 5 PEI 6 PEI 7 Table 5.8 Identity of Australia’s volcanoes in each Hazard-PEI group. Those volcanoes with a sufficient record for determining a hazard score are deemed ‘Classified’ (top). Those without sufficient data are ‘Unclassified’ (bottom). The unclassified volcanoes are divided into groups: U-NHHR is Unclassified No Historic or Holocene Record: that is there are no confirmed eruptions recorded in the Holocene. U-HR is Unclassified with Holocene Record: that is there are confirmed eruptions recorded during the Holocene, but no historical (post-1500) events. U-HHR is Unclassified with Historic and Holocene record. The unclassified volcanoes in bold have experienced unrest or eruptions since 1900 AD, and those in red have records of at least one Holocene VEI ≥4 eruption.
Volcano Population Exposure Index Risk Level
Heard 1 I
McDonald Islands 1 I
Table 5.9 Classified volcanoes of Australia ordered by descending Population Exposure Index (PEI). Risk levels determined through the combination of the Hazard Level and PEI are given. Risk Level I – 2 volcanoes; Risk Level II –0 volcanoes; Risk Level III – 0 volcanoes.

319
Figure 5.7 Distribution of Australia’s classified volcanoes across Hazard and Population Exposure Index levels. The warming of the background colours illustrates increasing Risk levels from Risk Level I - III.
National Capacity for Coping with Volcanic Risk
No volcanoes in mainland Australia have recorded historical eruptions. No regular ground-based
monitoring is undertaken at the historically active Heard and McDonald Islands volcanoes in the
Indian Ocean.
This profile and the data therein should not be used in place of focussed assessments and information provided by local monitoring and research institutions.
Papua New Guinea
Description
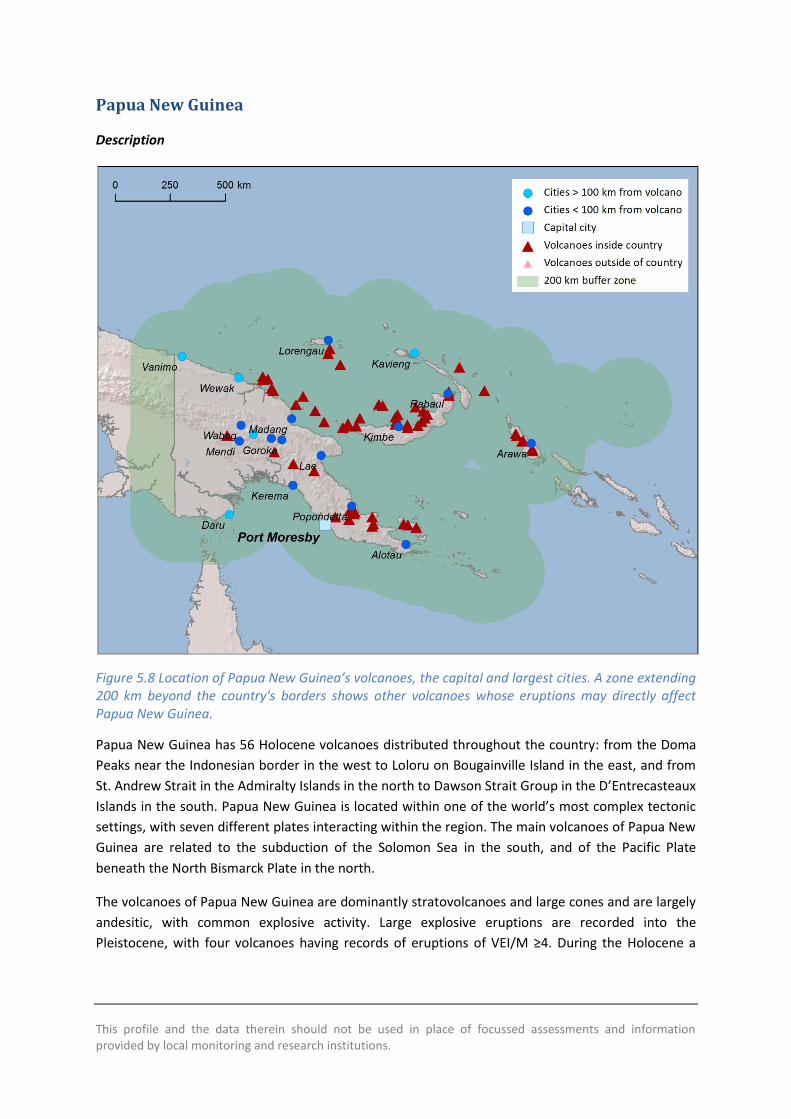
Figure 5.8 Location of Papua New Guinea’s volcanoes, the capital and largest cities. A zone extending 200 km beyond the country's borders shows other volcanoes whose eruptions may directly affect Papua New Guinea.
Papua New Guinea has 56 Holocene volcanoes distributed throughout the country: from the Doma
Peaks near the Indonesian border in the west to Loloru on Bougainville Island in the east, and from
St. Andrew Strait in the Admiralty Islands in the north to Dawson Strait Group in the D’Entrecasteaux
Islands in the south. Papua New Guinea is located within one of the world’s most complex tectonic
settings, with seven different plates interacting within the region. The main volcanoes of Papua New
Guinea are related to the subduction of the Solomon Sea in the south, and of the Pacific Plate
beneath the North Bismarck Plate in the north.
The volcanoes of Papua New Guinea are dominantly stratovolcanoes and large cones and are largely
andesitic, with common explosive activity. Large explosive eruptions are recorded into the
Pleistocene, with four volcanoes having records of eruptions of VEI/M ≥4. During the Holocene a

321
range of activity has been recorded, from VEI 0 to 6, with 28 explosive eruptions of VEI ≥4. 17
volcanoes have Holocene records of generating pyroclastic flows and 8 have triggered lahars.
The most active volcano in Papua New Guinea is Bagana, located in the central part of Bougainville
Island, with frequent ongoing lava effusion from its summit crater. However, due to the quiet nature
of effusive activity and relatively low threat level, it normally goes unnoticed compared to the next
two most active volcanoes of Manam and Ulawun. These two volcanoes have had frequent mild to
moderate sized historical eruptions and occasional large eruptions with pyroclastic flows.
Much of Papua New Guinea is situated within 100 km of one or more Holocene volcanoes, including
many of the largest cities in the country, thus over 80% of the population live within this distance.
Port Moresby lies within 55 km of the poorly known Madilogo volcano. Popondetta, home to 28,000,
is located 25 km north northeast of Lamington, and Kokopo, which has a population of roughly
21,000, is situated about 15 km southeast from the two most active volcanic cones in Rabaul
Caldera; Tavurur and Vulcan.
Of the volcanoes in Papua New Guinea only one, Rabaul, is classed at Risk Level III, with a large
proximal population and a high calculated Hazard score. Most volcanoes are classed at Risk Level I,
with a relatively low PEI.
The most renowned eruption of a Papua New Guinean volcano is probably that of Lamington in
1951. The peak was not recognised as a volcano before it erupted in January 1951, with a VEI 4
eruption that generated pyroclastic flows and surges that covered all sides of the volcano. The
eruption caused 2,492 fatalities and extensive damage. Rabaul is also notable for recent destructive
activity. A VEI 4 eruption in 1937 which triggered pyroclastic flows, lahars, and tsunami caused 507
deaths, whilst powerful explosive eruptions in 1994 caused the temporary evacuation of Rabaul City.
Five deaths from indirect causes were reported in 1994.
Whilst Lamington and Rabaul are well known for fairly recent, high impact eruptions, in terms of loss
of life the largest volcanic disaster in Papua New Guinea was the 1888 eruption of Ritter Island.
Located off the western tip of New Britain, this eruption caused massive slope failure that triggered
tsunamis that devastated the coastline of mainland Papua New Guinea and claimed approximately
3,000 lives. Along with these three volcanoes, Manam is notable for its persistent activity with forty-
three eruptions recorded since 1616. Though activity at Manam is typically mild to moderate, some
larger eruptions have impacted populated areas through generation of pyroclastic flows and lavas
that have reached low-lying coastal villages. The 2005 VEI 4 eruption at Manam devastated about
70% of the island. 90% of the population was evacuated to the mainland weeks prior to the
eruption. Only one death was reported.
The Rabaul Volcanological Observatory is the national institution for monitoring volcanoes in Papua
New Guinea. It was established in 1950 to carry out this task and conduct scientific research. It is
part of the Department of Mineral Policy and Geohazards Management. The institute is funded by
the government of Papua New Guinea and external donors. The institution has 16 staff members,
and about 75% have experience of responding to an eruption. Eight volcanoes are regularly
monitored and six have dedicated ground-based monitoring networks in place. Mobile equipment
and funding resources are available for responding to unrest that may arise at any unmonitored
volcano, however these resources are limited.

322
The Rabaul Volcanological Observatory has been working with certain donor-funded programs with
international agencies to conduct risk assessments. It is also involved in risk management and
mitigation. As part of its mandate, the observatory provides advice to provincial and national
governments on volcano-related issues. A donor-funded programme is currently in place to educate
vulnerable communities living around volcanoes about volcanic hazards and the disasters they pose
and how to mitigate them. The main aim of the programme is to empower communities to be self-
reliant and respond spontaneously during volcanic disasters while they await properly organised
relief services from government sources and non-government organisations.
Volcano Facts
Number of Holocene volcanoes 56
Number of Pleistocene volcanoes with M≥4 eruptions 4
Number of volcanoes generating pyroclastic flows 17
Number of volcanoes generating lahars 8
Number of volcanoes generating lava flows 12
Number of fatalities caused by volcanic eruptions ?8,899
Tectonic setting Subduction zone (55 volcanoes), Rift zone (1 suspected volcano – unnamed - in the Bismarck Sea)
Largest recorded Pleistocene eruption The M6.7 caldera formation at Lolobau in 12 ka.
Largest recorded Holocene eruption M7.4 Dk eruption of Dakataua in 998 BP.
Number of Holocene eruptions 246 confirmed eruptions. 38 uncertain eruptions and 11 discredited eruptions.
Recorded Holocene VEI range 0 – 6 and unknown
Number of historically active volcanoes 20
Number of historical eruptions 207
Number of
volcanoes
Primary volcano type Dominant rock type
7 Caldera(s) Andesitic (3), Basaltic (1), Dacitic (2), Rhyolitic (1)
1 Hydrothermal field Andesitic (1)
32 Large cone(s) Andesitic (18), Basaltic (11), Dacitic (1), Phonolitic (1),
Rhyolitic (1)
1 Lava dome(s) Andesitic (1)
10 Small cone(s) Andesitic (5), Basaltic (2), Dacitic (1), Rhyolitic (2)
5 Submarine Unknown (5)

323
Table 5.10 The number of volcanoes in Papua New Guinea, their volcano type classification and dominant rock type according to VOTW4.0.
Socio-Economic Facts
Total population (2012) 7,187,000
Gross Domestic Product (GDP) per capita (2005 PPP $) 2,363
Gross National Income (GNI) per capita (2005 PPP $) 2,386
Human Development Index (HDI) (2012) 0.466 (Low)
Population Exposure
Capital city Port Moresby
Distance from capital city to nearest Holocene volcano 52.9 km
Total population (2011) 6,187,591
Number (percentage) of people living within 10 km of a Holocene volcano
226,536 (3.7%)
Number (percentage) of people living within 30 km of a Holocene volcano
1,029,276 (16.6%)
Number (percentage) of people living within 100 km of a Holocene volcano
5,232,230 (84.6%)
Ten largest cities, as measured by population and their population size:
Port Moresby 254,158 (2002 Census)
Lae 76,255
Arawa 40,266
Mount Hagen 33,623
Popondetta 28,198
Madang 27,419
Mendi 26,252
Kokopo 20,262 (PNG Census 2000)
Kimbe 18,847
Goroka 18,503
Wewak 18,230
Infrastructure Exposure
Number of airports within 100 km of a volcano 14
Number of ports within 100 km of a volcano 13

324
Total length of roads within 100 km of a volcano (km) 643
Total length of railroads within 100 km of a volcano (km) 0
The numerous volcanoes of Papua New Guinea are distributed throughout much of the country,
meaning that a large proportion of the country lies within 100 km of a volcano. Twelve of the largest
cities in the country lie within these radii, including the capital, Port Moresby, thus much of the
critical infrastructure in Papua New Guinea is exposed to volcanic hazards. Being a nation with many
islands, multiple ports and airports are exposed.
Figure 5.9 The location of Papua New Guinea’s volcanoes and the extent of the 100 km zone surrounding them. Ports, airports and the major cities are just some of the infrastructure that may be exposed to volcanic hazards.
Hazard, Uncertainty and Exposure Assessments
There are varying levels of data available in the eruption records of Papua New Guinea’s volcanoes.
Under 20% of the volcanoes here have an appropriate eruptive history for calculation of the hazard.
These 10 volcanoes are classified at Hazard Levels I, II and III, with six at Hazard Level III. This could
indicate a trend towards particularly hazardous volcanoes in Papua New Guinea, or improved studies
and therefore records at volcanoes thought to be hazardous; or a combination of these factors.
Of the unclassified volcanoes 31 have no confirmed eruptions recorded in the Holocene. Five have
Holocene records but no historical activity and ten have historical (post-1500 AD) activity. Seven

325
unclassified volcanoes have erupted since 1900 AD. Eight unclassified volcanoes have records of
unrest above background levels since 1900 AD.
The PEI in Papua New Guinea ranges from 2 to 5, low to high. Most classified volcanoes have a low
PEI of 2, which in combination with Hazard Levels of I – III, classifies these volcanoes as Risk Levels I
and II. Only one volcano, Rabaul, is categorised as Risk Level III in Papua New Guinea, with a high PEI
of 5 and a Hazard Level of III.
CLA
SSIF
IED
Hazard III
Long Island; Ulawun; Bagana
Manam; Karkar
Rabaul
Hazard II
Pago
Hazard I
Bam; Ritter Island
Langila
UN
CLA
SSIF
IED
U – HHR
St. Andrew Strait; Unnamed (250030); Dakataua; Bamus; Victory; Waiowa; Billy Mitchell
Garbuna Group; Lolobau; Lamington
U- HR Loloru
Hargy; Dawson Strait Group; Ambitle
Tavui
U- NHHR
Baluan; Blup Blup; Kadovar; Boisa; Unnamed; Yomba; Umboi; Sakar; Unnamed (252001); Mundua; Bola; Sulu Range; Unnamed; Madilogo; Hydrographers Range; Musa River; Iamalele; Lihir; Tore; Balbi
Garove; Doma Peaks; Crater Mountain; Yelia; Managlase Plateau; Sessagara; Goodenough; Takuan Group
Garua Harbour; Lolo; Koranga
PEI 1
PEI 2 PEI 3 PEI 4 PEI 5 PEI 6 PEI 7
Table 5.11 Identity of Papua New Guinea’s volcanoes in each Hazard-PEI group. Those volcanoes with a sufficient record for determining a hazard score are deemed ‘Classified’ (top). Those without sufficient data are ‘Unclassified’ (bottom). The unclassified volcanoes are divided into groups: U-NHHR is Unclassified No Historic or Holocene Record: that is there are no confirmed eruptions recorded in the Holocene. U-HR is Unclassified with Holocene Record: that is there are confirmed eruptions recorded during the Holocene, but no historical (post-1500) events. U-HHR is Unclassified with Historic and Holocene record. The unclassified volcanoes in bold have experienced unrest or eruptions since 1900 AD, and those in red have records of at least one Holocene VEI ≥4 eruption.
326
Volcano Population Exposure Index Risk Level
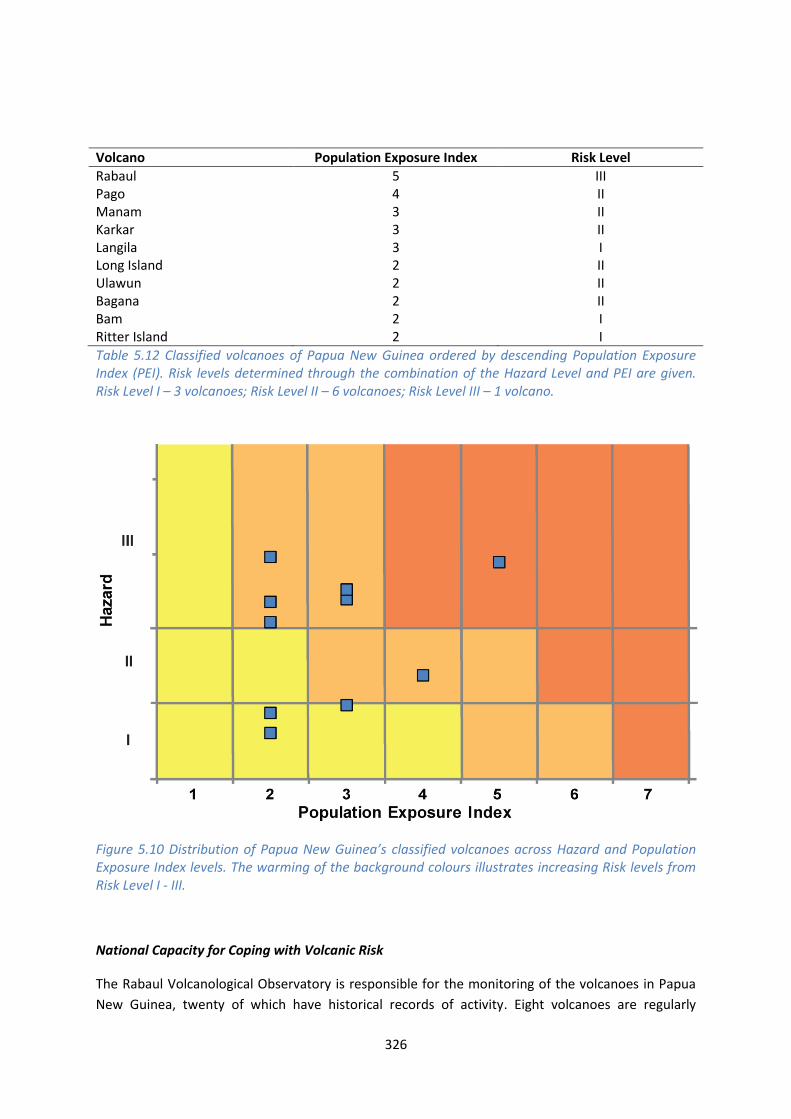
Rabaul 5 III Pago 4 II Manam 3 II Karkar 3 II Langila 3 I Long Island 2 II Ulawun 2 II Bagana 2 II Bam 2 I Ritter Island 2 I
Table 5.12 Classified volcanoes of Papua New Guinea ordered by descending Population Exposure Index (PEI). Risk levels determined through the combination of the Hazard Level and PEI are given. Risk Level I – 3 volcanoes; Risk Level II – 6 volcanoes; Risk Level III – 1 volcano.
Figure 5.10 Distribution of Papua New Guinea’s classified volcanoes across Hazard and Population Exposure Index levels. The warming of the background colours illustrates increasing Risk levels from Risk Level I - III.
National Capacity for Coping with Volcanic Risk
The Rabaul Volcanological Observatory is responsible for the monitoring of the volcanoes in Papua
New Guinea, twenty of which have historical records of activity. Eight volcanoes are regularly
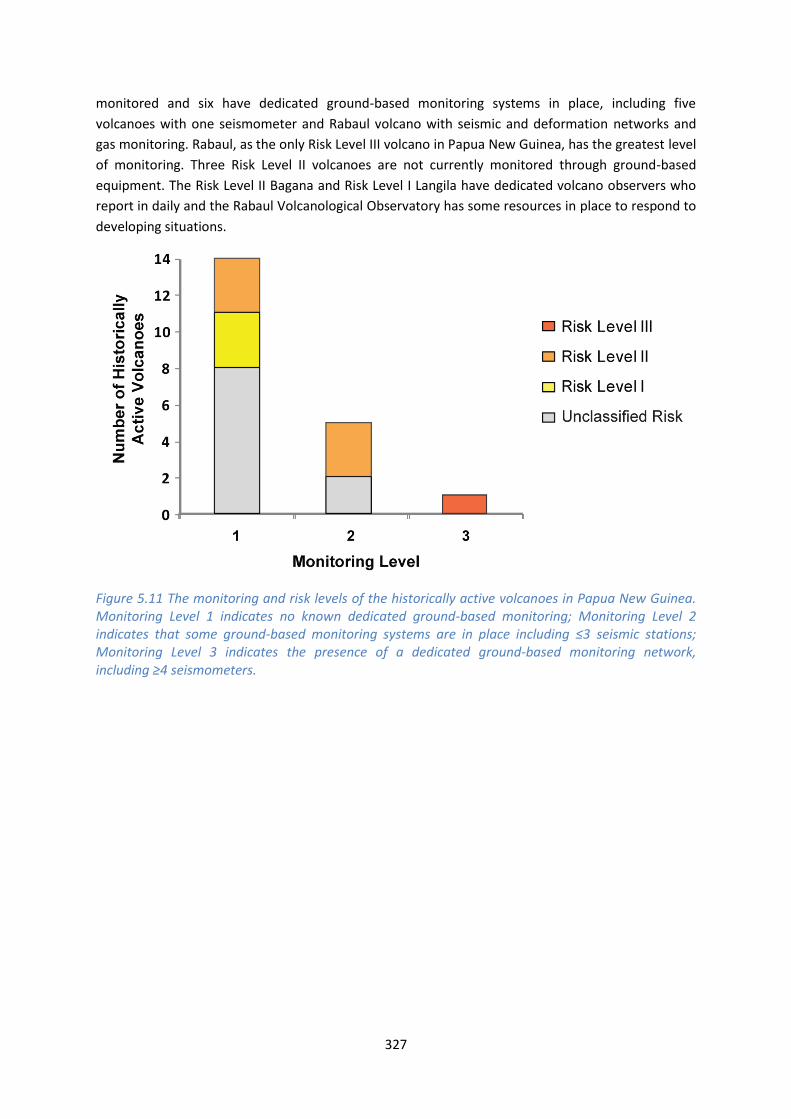
327
monitored and six have dedicated ground-based monitoring systems in place, including five
volcanoes with one seismometer and Rabaul volcano with seismic and deformation networks and
gas monitoring. Rabaul, as the only Risk Level III volcano in Papua New Guinea, has the greatest level
of monitoring. Three Risk Level II volcanoes are not currently monitored through ground-based
equipment. The Risk Level II Bagana and Risk Level I Langila have dedicated volcano observers who
report in daily and the Rabaul Volcanological Observatory has some resources in place to respond to
developing situations.
Figure 5.11 The monitoring and risk levels of the historically active volcanoes in Papua New Guinea. Monitoring Level 1 indicates no known dedicated ground-based monitoring; Monitoring Level 2 indicates that some ground-based monitoring systems are in place including ≤3 seismic stations; Monitoring Level 3 indicates the presence of a dedicated ground-based monitoring network, including ≥4 seismometers.
This profile and the data therein should not be used in place of focussed assessments and information provided by local monitoring and research institutions.
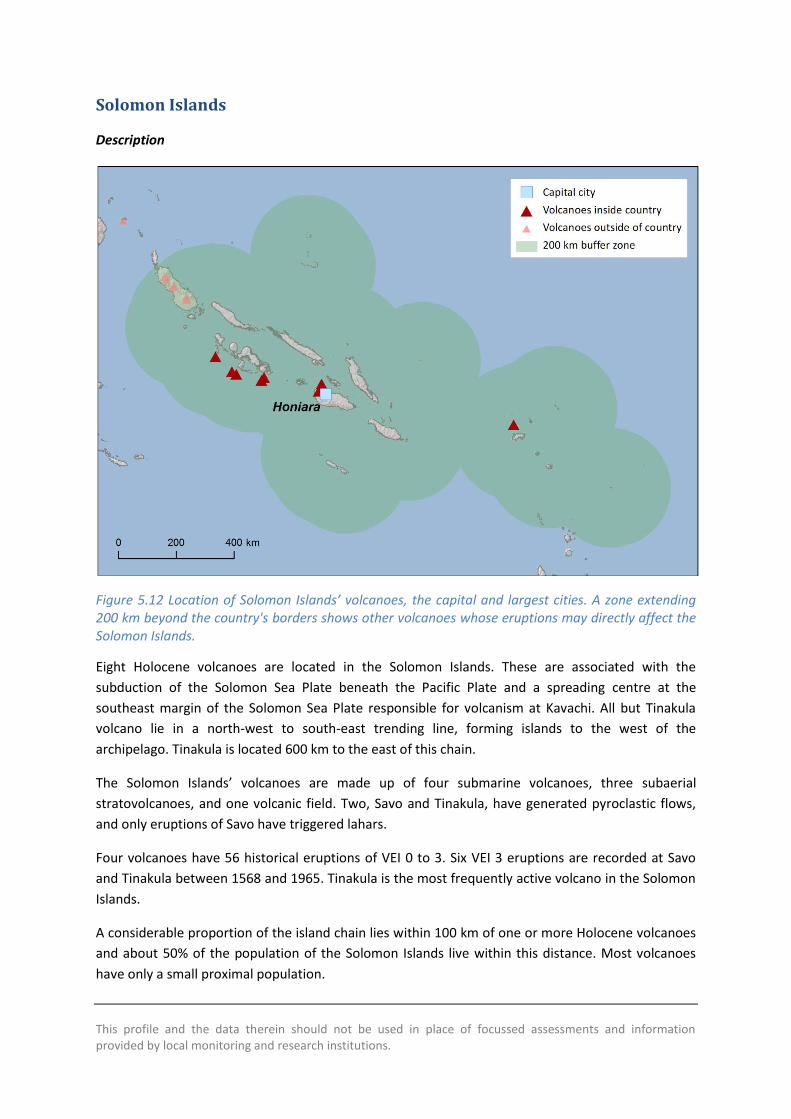
Solomon Islands
Description
Figure 5.12 Location of Solomon Islands’ volcanoes, the capital and largest cities. A zone extending 200 km beyond the country's borders shows other volcanoes whose eruptions may directly affect the Solomon Islands.
Eight Holocene volcanoes are located in the Solomon Islands. These are associated with the
subduction of the Solomon Sea Plate beneath the Pacific Plate and a spreading centre at the
southeast margin of the Solomon Sea Plate responsible for volcanism at Kavachi. All but Tinakula
volcano lie in a north-west to south-east trending line, forming islands to the west of the
archipelago. Tinakula is located 600 km to the east of this chain.
The Solomon Islands’ volcanoes are made up of four submarine volcanoes, three subaerial
stratovolcanoes, and one volcanic field. Two, Savo and Tinakula, have generated pyroclastic flows,
and only eruptions of Savo have triggered lahars.
Four volcanoes have 56 historical eruptions of VEI 0 to 3. Six VEI 3 eruptions are recorded at Savo
and Tinakula between 1568 and 1965. Tinakula is the most frequently active volcano in the Solomon
Islands.
A considerable proportion of the island chain lies within 100 km of one or more Holocene volcanoes
and about 50% of the population of the Solomon Islands live within this distance. Most volcanoes
have only a small proximal population.

329
Two eruptions from Savo have had major impacts, namely those in 1568 and 1840; the 1568
eruption generated pyroclastic flows that killed the island’s approximately 1,000 inhabitants, whilst
ash and ballistics killed many during the 1840 eruption.
Other noteworthy volcanoes in the Solomon Islands are Tinakula and Kavachi. Tinakula is the only
other Solomon Islands volcano known to have caused fatalities, when a VEI 3 eruption in 1840
produced pyroclastic flows that swept all sides of the island and killed its inhabitants. Kavachi is one
of the most active submarine volcanoes in the entire southwest Pacific, with thirty eruptions
recorded since 1939. Kavachi has produced twelve island-forming eruptions in this time, though the
volcano’s isolated position away from major shipping lanes and airport routes reduces the hazard it
poses to people and infrastructure.
Volcano Facts
Number of Holocene volcanoes 8
Number of Pleistocene volcanoes with M≥4 eruptions -
Number of volcanoes generating pyroclastic flows 2
Number of volcanoes generating lahars 1
Number of volcanoes generating lava flows 2
Number of fatalities caused by volcanic eruptions ?1,200
Tectonic setting Subduction zone
Largest recorded Pleistocene eruption -
Largest recorded Holocene eruption 6 eruptions of VEI 3 are recorded at Savo and Tinakula between the years of 1568 and 1965 AD.
Number of Holocene eruptions 57 confirmed eruptions. 5 uncertain eruptions.
Recorded Holocene VEI range 0 – 3 and unknown
Number of historically active volcanoes 4
Number of historical eruptions 56
Number of
volcanoes
Primary volcano type Dominant rock type
3 Large cone(s) Andesitic (3)
1 Small cone(s) Andesitic (1)
4 Submarine Andesitic (2), Dacitic (1), Unknown (1)
Table 5.13 The number of volcanoes in the Solomon Islands, their volcano type classification and dominant rock type according to VOTW4.0.

330
Socio-Economic Facts
Total population (2012) 551,000
Gross Domestic Product (GDP) per capita (2005 PPP $) 2,581
Gross National Income (GNI) per capita (2005 PPP $) 2,172
Human Development Index (HDI) (2012) 0.530 (Low)
Population Exposure
Capital city Honiara
Distance from capital city to nearest Holocene volcano 21.7 km
Total population (2011) 571,890
Number (percentage) of people living within 10 km of a Holocene volcano
4,545 (<1%)
Number (percentage) of people living within 30 km of a Holocene volcano
98,612 (17.2%)
Number (percentage) of people living within 100 km of a Holocene volcano
286,531 (50.1%)
Largest cities, as measured by population and their population size:
Honiara 56,298
Infrastructure Exposure
Number of airports within 100 km of a volcano 1
Number of ports within 100 km of a volcano 6
Total length of roads within 100 km of a volcano (km) 0
Total length of railroads within 100 km of a volcano (km) 0
The volcanoes of the Solomon Islands are mainly located to the west of the largest islands. A
considerable proportion of the island chain lies within 100 km of a Holocene volcano. Many ports are
located in these radii, and an airport in the capital, Honiara, which lies at less than 25 km from
Gallego volcano, and less than 40 km from the historically active Savo volcano. This places much of
the country’s critical infrastructure within 100 km of Holocene volcanoes. The northern tip of
northernmost Choiseul Island lies within 100 km of volcanoes on Bougainville Island, an autonomous
region of Papua New Guinea.

331
Figure 5.13 The location of the Solomon Islands’ volcanoes and the extent of the 100 km zone surrounding them. Ports, airports and the major cities are just some of the infrastructure that may be exposed to volcanic hazards.
Hazard, Uncertainty and Exposure Assessments
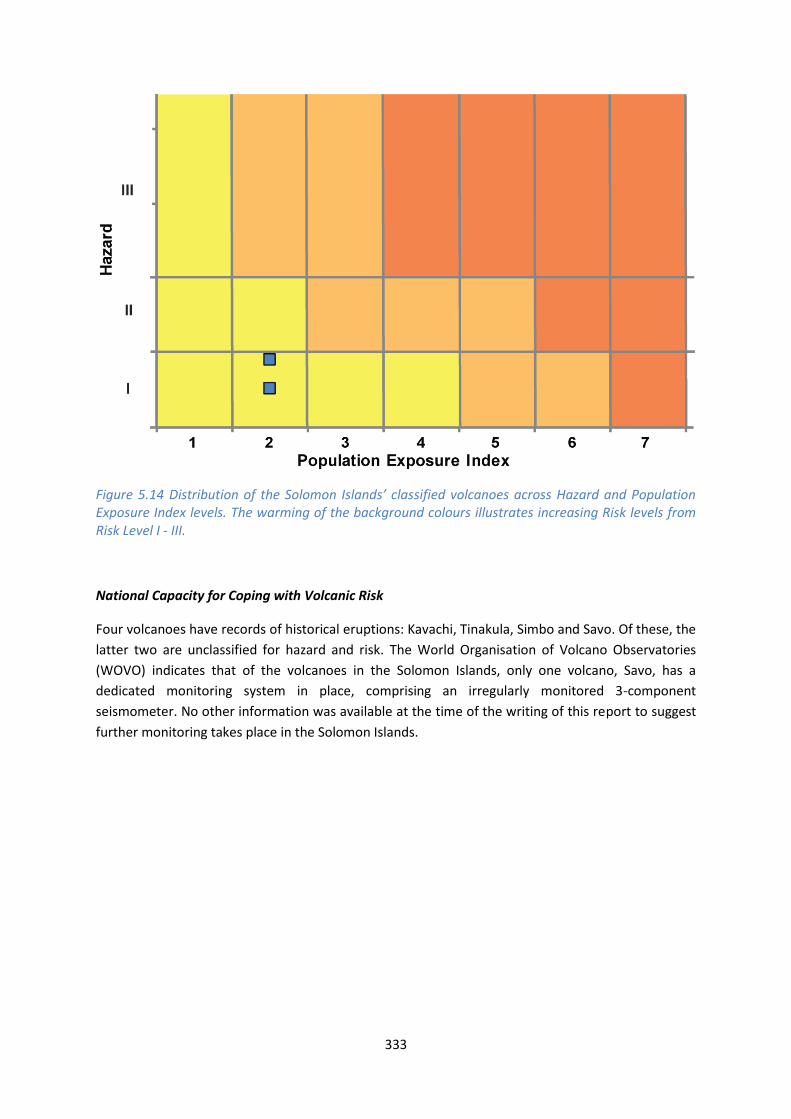
Six of the eight volcanoes of the Solomon Islands lack sufficiently extensive eruptive histories for
calculation of the hazard without large associated uncertainties. These volcanoes are therefore
unclassified. Of these, just two have records of eruptions; Simbo and Savo both have historical
eruptions.
Kavachi and Tinakula volcanoes have 53 confirmed Holocene eruptions, most commonly of VEI 1-2.
These volcanoes are classified at Hazard Level I.
Most Solomon Island volcanoes are PEI 2, and indeed both classified volcanoes are categorised as
such, classifying these as Risk Level I. The highest PEI in the Solomon Islands is PEI 4 at Gallego
volcano which lies within 100 km of the capital, Honiara.

332
CLA
SSIF
IED
Hazard III
Hazard II
Hazard I
Kavachi; Tinakula
UN
CLA
SSIF
IED
U – HHR
Simbo Savo
U- HR
U- NHHR
Kana Keoki; Coleman Seamount; Unnamed (255061)
Gallego
PEI 1 PEI 2 PEI 3 PEI 4 PEI 5 PEI 6 PEI 7 Table 5.14 Identity of the volcanoes in the Solomon Islands in each Hazard-PEI group. Those volcanoes with a sufficient record for determining a hazard score are deemed ‘Classified’ (top). Those without sufficient data are ‘Unclassified’ (bottom). The unclassified volcanoes are divided into groups: U-NHHR is Unclassified No Historic or Holocene Record: that is there are no confirmed eruptions recorded in the Holocene. U-HR is Unclassified with Holocene Record: that is there are confirmed eruptions recorded during the Holocene, but no historical (post-1500) events. U-HHR is Unclassified with Historic and Holocene record. The unclassified volcanoes in bold have experienced unrest or eruptions since 1900 AD, and those in red have records of at least one Holocene VEI ≥4 eruption.
Volcano Population Exposure Index Risk Level
Kavachi 2 I
Tinakula 2 I
Table 5.15 Classified volcanoes of the Solomon Islands ordered by descending Population Exposure Index (PEI). Risk levels determined through the combination of the Hazard Level and PEI are given. Risk Level I – 2 volcanoes; Risk Level II – 0 volcanoes; Risk Level III – 0 volcanoes.
333
Figure 5.14 Distribution of the Solomon Islands’ classified volcanoes across Hazard and Population Exposure Index levels. The warming of the background colours illustrates increasing Risk levels from Risk Level I - III.
National Capacity for Coping with Volcanic Risk
Four volcanoes have records of historical eruptions: Kavachi, Tinakula, Simbo and Savo. Of these, the
latter two are unclassified for hazard and risk. The World Organisation of Volcano Observatories
(WOVO) indicates that of the volcanoes in the Solomon Islands, only one volcano, Savo, has a
dedicated monitoring system in place, comprising an irregularly monitored 3-component
seismometer. No other information was available at the time of the writing of this report to suggest
further monitoring takes place in the Solomon Islands.

334
Figure 5.15 The monitoring and risk levels of the historically active volcanoes in the Solomon Islands. Monitoring Level 1 indicates no known dedicated ground-based monitoring; Monitoring Level 2 indicates that some ground-based monitoring systems are in place including ≤3 seismic stations; Monitoring Level 3 indicates the presence of a dedicated ground-based monitoring network, including ≥4 seismometers.

This profile and the data therein should not be used in place of focussed assessments and information provided by local monitoring and research institutions.
Vanuatu
Description
Figure 5.16 Location of Vanuatu’s volcanoes, the capital and largest cities. A zone extending 200 km beyond the country's borders shows other volcanoes whose eruptions may directly affect Vanuatu.
Fourteen Holocene volcanoes are located throughout Vanuatu. These lie in a north-south trending
line between Tinakula volcano of the Solomon Islands in the north, and the French Eastern Gemini
Seamount in the south. These volcanoes result from the subduction of the Australian Plate beneath
the Pacific Plate.
The volcanoes of Vanuatu are predominantly basaltic in composition, though most are
stratovolcanoes or another edifice type usually associated with explosive activity. Pyroclastic flows
are recorded at five volcanoes, including the only shield volcano in Vanuatu, Aoba. Lahars have been
generated at three volcanoes. Eruptions of VEI 0 – 6 are recorded during the Holocene, indicating a
range of activity styles. Nine volcanoes have had historical activity, producing 128 eruptions since
1500 AD. The record prior to this is sparse, however there is a record of large explosive eruptions at
two volcanoes during the Pleistocene, including the M6.9 eruption of the Efaté Pumice formation at
North Vate, at 1 Ma.

336
The most frequently active volcano in Vanuatu is the basaltic caldera, Ambrym, which has had 53
historical eruptions.
An eruption of Aoba in 1870 triggered a lahar that destroyed villages on the southeast flank and
killed over 100 people, whilst a flank eruption in 1670 destroyed populated areas near the western
coast. Numerous lahar deposits can be seen on the coasts. The Vanuatu Geohazards Observatory
suggests that Aoba can be considered the most dangerous volcano in Vanuatu, due to the presence
of a large lake in the main crater.
With the exception of the almost persistently active Yasur volcano, Gaua is the most recently active
of Vanuatu’s volcanoes. An eruption commencing on 27th September 2009 led to explosions and
high dense ash plumes on 18th November 2009, with the evacuation of over 300 people following
on 26th November 2009. Activity carried on into 2010, and increased in April 2010; plans were made
to evacuate a further 3,000 people. Seismic tremors, as well as ash and gas emissions, continued
throughout the first 8 months of 2010. The Vanuatu Geohazards Observatory reported on 21st
December 2010 that activity from Gaua had been low since September and activity ceased in
October 2010.
The eruptive history is sufficiently detailed to determine the hazard with minimal uncertainties at
about half of Vanuatu’s volcanoes. Aoba is classed with the highest hazard levels in Vanuatu. The
volcanoes are distributed through the island chain and as such, the whole population lives within
100 km of one or more Holocene volcano and almost all infrastructure is exposed. Despite this
overall total exposure, small to moderate sized populations are located close to individual volcanoes.
The Vanuatu Geohazards Observatory operates a national seismic network and an additional
volcano monitoring network. Permanent seismic monitoring is undertaken at Yasur, Ambrym, Aoba
and Gaua. The Vanuatu Geohazards Observatory also run a website accessible to all, where alert
levels for the volcanoes are provided. Alert levels range from 0 to 4 with increasing activity, and
include “Level ?” where there is insufficient monitoring data to make an assessment. This alert level
system is linked with a hazards map which indicates danger areas. The Observatory also has plans in
place for evacuations dependent on the activity observed.
See also:
Vanuatu Geohazards Observatory, www.geohazards.gov.vu/index.php/home
Volcano Facts
Number of Holocene volcanoes 14
Number of Pleistocene volcanoes with M≥4 eruptions 2
Number of volcanoes generating pyroclastic flows 5
Number of volcanoes generating lahars 3
Number of volcanoes generating lava flows 3
337
Number of fatalities caused by volcanic eruptions ?>346
Tectonic setting Subduction zone
Largest recorded Pleistocene eruption The M6.9 eruption of the Efaté Pumice formation at North Vate, at 1 Ma.
Largest recorded Holocene eruption Two M6.8 eruptions are recorded here, the 1760 BP eruption of Ambrym and 520 BP eruption of Kuwae.
Number of Holocene eruptions 133 confirmed eruptions. 18 uncertain eruptions.
Recorded Holocene VEI range 0 – 6 and unknown
Number of historically active volcanoes 9
Number of historical eruptions 128
Number of
volcanoes
Primary volcano type Dominant rock type
2 Caldera(s) Basaltic (2)
11 Large cone(s) Andesitic (3), Basaltic (8)
1 Shield(s) Basaltic (1)
Table 5.16 The number of volcanoes in Vanuatu, their volcano type classification and dominant rock type according to VOTW4.0.
Socio-Economic Facts
Total population (2012) 248,000
Gross Domestic Product (GDP) per capita (2005 PPP $) 4,062
Gross National Income (GNI) per capita (2005 PPP $) 3,960
Human Development Index (HDI) (2012) 0.626 (Medium)
Population Exposure
Capital city Port Vila
Distance from capital city to nearest Holocene volcano 30.2 km
Total population (2011) 224,564
Number (percentage) of people living within 10 km of a Holocene volcano
26,446 (11.8%)

338
Number (percentage) of people living within 30 km of a Holocene volcano
119,868 (53.4%)
Number (percentage) of people living within 100 km of a Holocene volcano
230,848 (>100%)
Largest cities, as measured by population and their population size:
Port Vila 35,901
Infrastructure Exposure
Figure 5.17 The location of Vanuatu’s volcanoes and the extent of the 100 km zone surrounding them. Ports, airports and the major cities are just some of the infrastructure that may be exposed to volcanic hazards.
Number of airports within 100 km of a volcano 2
Number of ports within 100 km of a volcano 3
Total length of roads within 100 km of a volcano (km) 0
Total length of railroads within 100 km of a volcano (km) 0

339
The volcanoes of Vanuatu are located throughout the island chain, with almost the entire country
lying within 100 km of Holocene volcanoes. A number of ports and airports are exposed, and much
of the critical infrastructure of the country is located in these 100 km radii. The capital, Port Vila, lies
just over 30 km from the nearest Holocene volcano, North Vate.
Hazard, Uncertainty and Exposure Assessments
Half of the volcanoes of Vanuatu have detailed eruptive histories allowing the calculation of hazard.
These seven volcanoes are classified at Hazard Levels I, II and III. The only Hazard Level III volcano is
Aoba, with a history of pyroclastic flow producing eruptions.
Of the seven unclassified volcanoes, only two have confirmed Holocene eruptions: Traitor’s Head
and Suretamatai. These volcanoes have erupted historically, as recently as 1965.
The PEI in Vanuatu ranges between 2 and 3 indicative of small to moderate populations. This, in
combination with the hazard levels classifies the volcanoes here at Risk Levels I – II.
CLA
SSIF
IED
Hazard III
Aoba
Hazard II
Ambrym; Lopevi
Yasur
Hazard I
Gaua; Epi; Kuwae
UN
CLA
SSIF
IED
U – HHR
Traitor's Head Suretamatai
U- HR
U- NHHR
Motlav; Mere Lava; Unnamed; Aneityum
North Vate
PEI 1
PEI 2 PEI 3 PEI 4 PEI 5 PEI 6 PEI 7
Table 5.17 Identity of Vanuatu’s volcanoes in each Hazard-PEI group. Those volcanoes with a sufficient record for determining a hazard score are deemed ‘Classified’ (top). Those without sufficient data are ‘Unclassified’ (bottom). The unclassified volcanoes are divided into groups: U-NHHR is Unclassified No Historic or Holocene Record: that is there are no confirmed eruptions recorded in the Holocene. U-HR is Unclassified with Holocene Record: that is there are confirmed eruptions recorded during the Holocene, but no historical (post-1500) events. U-HHR is Unclassified with Historic and Holocene record. The unclassified volcanoes in bold have experienced unrest or eruptions since 1900 AD, and those in red have records of at least one Holocene VEI ≥4 eruption.

340
Volcano Population Exposure Index Risk Level
Yasur 3 II
Aoba 2 II
Lopevi 2 I
Ambrym 2 I
Epi 2 I
Gaua 2 I
Kuwae 2 I
Table 5.18 Classified volcanoes of Vanuatu ordered by descending Population Exposure Index (PEI). Risk levels determined through the combination of the Hazard Level and PEI are given. Risk Level I – 5 volcanoes; Risk Level II – 2 volcanoes; Risk Level III – 0 volcanoes.
Figure 5.18 Distribution of Vanuatu’s classified volcanoes across Hazard and Population Exposure Index levels. The warming of the background colours illustrates increasing Risk levels from Risk Level I - III.
National Capacity for Coping with Volcanic Risk
Volcanism in Vanuatu is monitored by the Vanuatu Geohazards Observatory. A national seismic
network (the Vanuatu Seismic Network) is distributed across the islands of the country measuring
activity in real-time or near real-time. A further volcano monitoring network is in place including:
permanent seismic monitoring at the Risk Level II volcanoes Yasur and Aoba, and Risk Level I
Ambrym and Gaua volcanoes, with non-continuous monitoring used at Lopevi. The Risk Level I
volcanoes Epi and Kuwae and the unclassified Suretamatai and Traitor’s Head volcanoes do not
currently have a dedicated monitoring network in place.
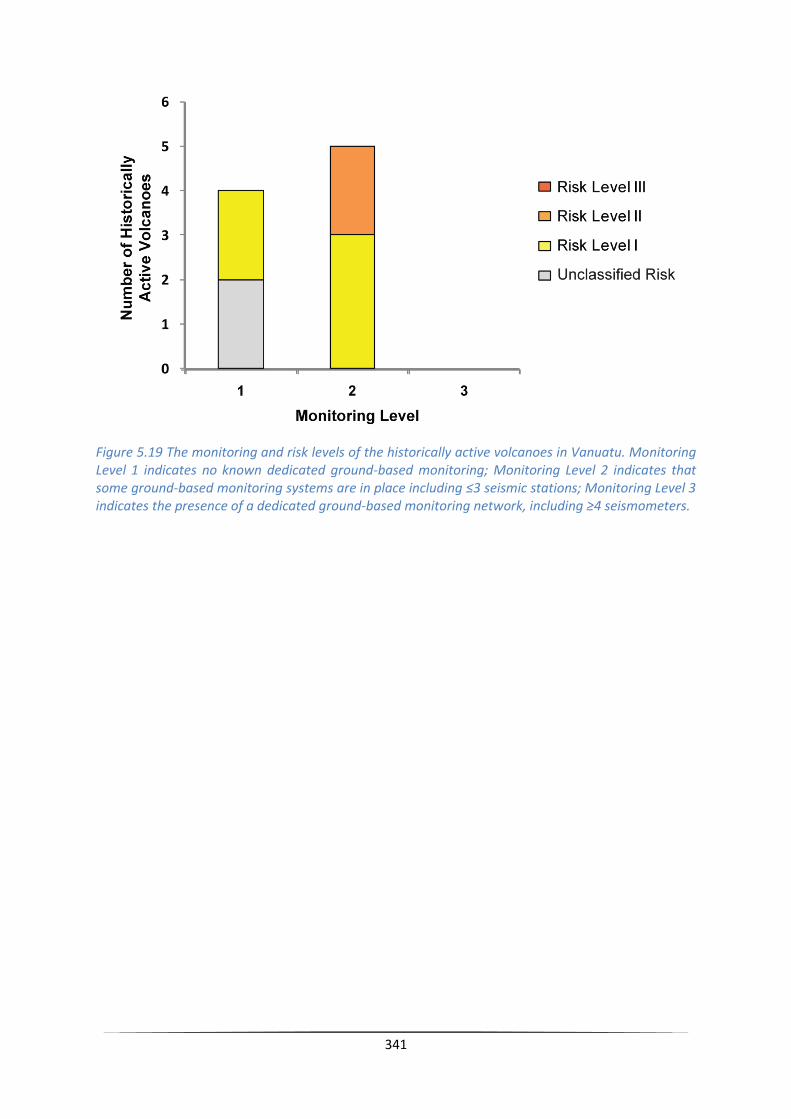
341
Figure 5.19 The monitoring and risk levels of the historically active volcanoes in Vanuatu. Monitoring Level 1 indicates no known dedicated ground-based monitoring; Monitoring Level 2 indicates that some ground-based monitoring systems are in place including ≤3 seismic stations; Monitoring Level 3 indicates the presence of a dedicated ground-based monitoring network, including ≥4 seismometers.