appendix c: classification consistency and accuracy · csap technical report 2006 – appendix c...
TRANSCRIPT

CSAP Technical Report 2006 – Appendix C November, 2006
Page C-1
Appendix C: Classification Consistency and Accuracy
One of the cornerstones of the NCLB Act (2002) is the measurement of adequate yearly progress (AYP) with respect to the percentage of students at or above performance standards set by states. Because of this heavy emphasis on the classification of student performance, a psychometric property of particular interest is how consistently and accurately assessment instruments can classify students into performance categories. Classification consistency is defined conceptually as the extent to which the performance classifications of students agree given two independent administrations of the same test or two parallel test forms. That is, if students are tested twice on the same test or on two parallel tests what is the likelihood of classifying the students into the same performance categories? It is, however, virtually impractical to obtain data from repeated administrations of the same or parallel forms because of cost, testing burden, and effects of student memory or practice. Therefore, a common practice is to estimate classification consistency from a single administration of a test. When a method to estimate decision consistency is applied, a contingency table of (H+1) × (H+1) is constructed, where H is the number of cut scores. For example, with three cut scores, a 4 ×4 contingency table can be built as follows (see Table C-1).
Table C-1. Contingency table with 3 cut scores
Level 1 Level 2 Level 3 Level 4 Sum Level 1 P11 P21 P31 P41 P.1 Level 2 P12 P22 P32 P42 P.2 Level 3 P13 P23 P33 P43 P.3 Level 4 P14 P24 P34 P44 P.4
Sum P1. P2. P3. P4. 1.0
It is common to report two indices of classification consistency, the classification agreement P and coefficient kappa. Hambleton and Novick (1973) proposed P as a measure of classification consistency, where P is defined as sum of diagonal values of the contingency table:
P = P11 + P22 + P33+ P44. To reflect statistical chance agreement, Swaminathan, Hambleton, and Algina (1974) suggest using Cohen’s kappa (1960):
kappa = c
c
PPP
−−
1,
where cP is the chance probability of a consistent classification under two completely random assignments. This probability cP is the sum of the probabilities obtained by multiplying the marginal probability of the first administration and the corresponding marginal probability of the second administration:

CSAP Technical Report 2006 – Appendix C November, 2006
Page C-2
cP = (P1. × P.1 ) + (P2. × P.2 ) + (P3. × P.3 ) + (P4. × P.4 ).
Classification accuracy is defined as the extent to which the actual classifications of test takers agree with those that would be made on the basis of their true scores (Livingston & Lewis, 1995). That is, classification consistency refers to the agreement between two observed scores, while classification accuracy refers to the agreement between observed and true scores. Since true scores are unobservable, a psychometric model is typically used to estimate them based on observed scores and the parameters of the model being used. Classification Consistency and Accuracy when Pattern Scoring is Used A variety of item response theory (IRT) scoring procedures are available for estimating student proficiency scores. Of the most popular score estimation techniques are item-pattern (IP) scoring and number-correct (NC) scoring under the IRT framework. NC scoring considers only how many items a student answered correctly (or the sum of item scores) in determining his or her score. In contrast, the IP scoring method takes into account not only a student’s total raw score, but also which items he or she got right. Several methods have been proposed to measure classification consistency and accuracy based on number-correct (summed) scores. However, few studies have proposed methods for item-pattern (IP) scoring. Kolen and Kim (2004) developed a method to estimate classification consistency and accuracy when IP scoring is used. The following describes the Kolen-Kim (KK) method:
Step 1: Obtain ability distribution weight ( )(ˆ θg ) at each quadrature ( jθ ) point j. Step 2: At each quadrature point jθ , generate two sets of item responses using the item parameters from a test form, assuming that the same test form was administered twice to examinees with the true ability jθ . (1,1,0,0,…: Item response from the first administration) 1
ˆjθ
jθ
(0,1,1,0,…: Item response from the second administration) 2ˆ
jθ If two parallel (or alternative) forms were used, the two response patterns can be generated based on the item parameters from the two forms. Estimate 1
ˆjθ and 2
ˆjθ for the two sets of
item responses. Step 3: Construct a classification matrix (as shown in Table C-2) at each quadrature point ( jθ ). Determine the joint probability for the cells in Table C-2 using the two ability estimates obtained from Step 2.

CSAP Technical Report 2006 – Appendix C November, 2006
Page C-3
Table C-2. Classification Table for One Cut Point (C1)1
First administration or Form 1
1
ˆ Cji ≥θ 11ˆ Cj <θ
12ˆ Cj ≥θ
12ˆ Cj <θ
Second administration, or Form 2
Step 4: Repeat Steps 2 and 3 r times and compute average values over r replications. r should be a large number, e.g., 500, to obtain stable results. Step 5: Multiply the distribution weight ( )(ˆ θg ) by the average values obtained in Step 4 for each quadrature point, and sum the results across all quadrature points. From these results a final contingency table can be constructed and classification consistency indices, such as kappa, can be computed. In addition, because examinees’ abilities are estimated at each quadrature point, this quadrature point can be considered the true score. Therefore, classification accuracy may be computed using both examinees’ estimated abilities (observed scores) and quadrature point (true score). Table C-3 (composed of two tables) includes the classification consistency and accuracy measures for Grade 3 Mathematics CSAP. The first table is a contingency table with all three cut scores prepared based on the Kolen-Kim procedure. The rows represent the first administration of an assessment, and the columns represent the second administration of the same assessment to the same students. As mentioned above, in the procedure by Kolen and Kim, the score distributions for the first administration and the second administration are estimated using simulation. So, the value in each cell represents the probability of belonging to certain performance levels in two hypothetical administrations. For example, 0.0716 represents the probability of belonging to “unsatisfactory” in the both first and second administrations. The 0.0002 represents the probability of belonging to “Unsatisfactory” in the first administration and “Proficient” in the second administration. “Sum” is obtained simply by adding the four row values or the four column values. The “Observed Score Dist” row shows the distribution of real data belonging to each performance level. In general, it is expected that the sum values and the distribution of observed scores from real data agree. The second table shows indices for classification consistency and classification accuracy. Each index was described above. Because there are three cut scores for CSAP, four performance levels exist. The values in “All cuts” were obtained by applying all three cuts simultaneously during analysis. From Table C-3 for Mathematics grade 3, classification agreement (P) is 0.7100, chance probability is 0.2967, kappa is 0.5877, and classification accuracy is 0.7821, when all three cuts were used for computation. The values for cut 1 were obtained by applying only the first cut score, 335. Therefore, there are two levels whenever only one cut is applied. It is clear that the values for P, decision accuracy,
1 This table is constructed for each quadrature point and replication. One, and only one, cell will have a value of 1 and zeros elsewhere.

CSAP Technical Report 2006 – Appendix C November, 2006
Page C-4
obtained with all three cuts are smaller than those obtained with only one cut. This explanation is the same for tables for all other grade levels and content areas.
References Cohen, J. (1960). A coefficient of agreement for nominal scales. Educational and Psychological Measurement, 20, 37-46. Hambleton, R. K., and Novick. M. R. (1973). Toward an integration of theory and method for criterion-referenced tests. Journal of Educational Measurement, 10, 159-96. Livingston, S. A., & Lewis, C. (1995). Estimating the consistency and accuracy of classifications based on test scores. Journal of Educational Measurement, 32, 179-197. No Child Left Behind Act of 2001 (2002). Pub. I, No. 107-110, 115 Stat 1425 Kolen, M. and Kim, D. (2004). Personal Correspondence. Swaminathan, H., Hambleton, R. K., and Algina, J. (1974). Reliability of criterion referenced tests: A decision theoretic formulation. Journal of Educational measurement, 11, 263-268.

CSAP Technical Report 2006 – Appendix C November, 2006
Page C-5
Table C-3. Classification Consistency and Classification Accuracy for Mathematics Grade 3
Contingency Table with All Cut Scores
Unsatisfactory Partially Proficient
Proficient Advanced Sum
Unsatisfactory 0.0716 0.0239 0.0002 0.0000 0.0957
Partially Proficient
0.0232 0.1746 0.0562 0.0012 0.2551
Proficient 0.0000 0.0547 0.2801 0.0634 0.3981
Advanced 0.0000 0.0001 0.0672 0.1837 0.2511
Sum 0.0948 0.2533 0.4037 0.2482 1.0000
Observed Score Dist.
0.0699
0.2201
0.4213
0.2888
1.0000
Indexes for Classification Consistency and Classification Accuracy
Cut 1 Cut 2 Cut 3 All cuts
Classification Agreement (P) 0.9528 0.8876 0.8681 0.7100
Chance Probability (Pc) 0.8276 0.5453 0.6254 0.2967
Kappa 0.7260 0.7529 0.6480 0.5877
Classification Accuracy 0.9658 0.9126 0.9036 0.7821

CSAP Technical Report 2006 – Appendix C November, 2006
Page C-6
Table C-4. Classification Consistency and Classification Accuracy for Mathematics Grade 4
Contingency Table with All Cut Scores
Unsatisfactory Partially Proficient
Proficient Advanced Sum
Unsatisfactory 0.0952 0.0217 0.0000 0.0000 0.1169
Partially Proficient
0.0205 0.2020 0.0464 0.0000 0.2690
Proficient 0.0000 0.0508 0.3266 0.0498 0.4271
Advanced 0.0000 0.0001 0.0529 0.1340 0.1870
Sum 0.1157 0.2747 0.4259 0.1837 1.0000
Observed Score Dist.
0.0817
0.2262
0.4357
0.2564
1.0000
Indexes for Classification Consistency and Classification Accuracy
Cut 1 Cut 2 Cut 3 All cuts
Classification Agreement (P) 0.9577 0.9026 0.8972 0.7577
Chance Probability (Pc) 0.7945 0.5250 0.6980 0.3037
Kappa 0.7944 0.7950 0.6596 0.6521
Classification Accuracy 0.9606 0.9108 0.9148 0.7861

CSAP Technical Report 2006 – Appendix C November, 2006
Page C-7
Table C-5. Classification Consistency and Classification Accuracy for Mathematics Grade 5
Contingency Table with All Cut Scores
Unsatisfactory Partially Proficient
Proficient Advanced Sum
Unsatisfactory 0.1052 0.0227 0.0001 0.0000 0.1279
Partially Proficient
0.0229 0.2119 0.0448 0.0000 0.2795
Proficient 0.0001 0.0455 0.2638 0.0472 0.3566
Advanced 0.0000 0.0000 0.0509 0.1850 0.2359
Sum 0.1281 0.2801 0.3596 0.2322 1.0000
Observed Score Dist.
0.0884
0.2559
0.3811
0.2747
1.0000
Indexes for Classification Consistency and Classification Accuracy
Cut 1 Cut 2 Cut 3 All cuts
Classification Agreement (P) 0.9543 0.9095 0.9019 0.7659
Chance Probability (Pc) 0.7767 0.5170 0.6414 0.2777
Kappa 0.7952 0.8126 0.7265 0.6759
Classification Accuracy 0.9509 0.9233 0.9279 0.8022

CSAP Technical Report 2006 – Appendix C November, 2006
Page C-8
Table C-6. Classification Consistency and Classification Accuracy for Mathematics Grade 6
Contingency Table with All Cut Scores
Unsatisfactory Partially Proficient
Proficient Advanced Sum
Unsatisfactory 0.1813 0.0363 0.0000 0.0000 0.2176
Partially Proficient
0.0382 0.2052 0.0499 0.0000 0.2933
Proficient 0.0002 0.0487 0.2270 0.0432 0.3192
Advanced 0.0000 0.0000 0.0389 0.1310 0.1700
Sum 0.2197 0.2901 0.3159 0.1743 1.0000
Observed Score Dist.
0.1531
0.2749
0.3561
0.2158
1.0000
Indexes for Classification Consistency and Classification Accuracy
Cut 1 Cut 2 Cut 3 All cuts
Classification Agreement (P) 0.9253 0.9011 0.9178 0.7445
Chance Probability (Pc) 0.6583 0.5002 0.7150 0.2633
Kappa 0.7813 0.8022 0.7117 0.6532
Classification Accuracy 0.9258 0.8998 0.9376 0.7632

CSAP Technical Report 2006 – Appendix C November, 2006
Page C-9
Table C-7. Classification Consistency and Classification Accuracy for Mathematics Grade 7
Contingency Table with All Cut Scores
Unsatisfactory Partially Proficient
Proficient Advanced Sum
Unsatisfactory 0.2469 0.0465 0.0000 0.0000 0.2934
Partially Proficient
0.0485 0.2436 0.0438 0.0002 0.3362
Proficient 0.0004 0.0436 0.1669 0.0298 0.2407
Advanced 0.0000 0.0000 0.0307 0.0991 0.1298
Sum 0.2958 0.3337 0.2413 0.1291 1.0000
Observed Score Dist.
0.2073
0.3421
0.2744
0.1762
1.0000
Indexes for Classification Consistency and Classification Accuracy
Cut 1 Cut 2 Cut 3 All cuts
Classification Agreement (P) 0.9046 0.9119 0.9393 0.7564
Chance Probability (Pc) 0.5844 0.5336 0.7746 0.2738
Kappa 0.7703 0.8112 0.7305 0.6645
Classification Accuracy 0.8963 0.9209 0.9420 0.7593
CSAP Technical Report 2006 – Appendix C November, 2006
Page C-10
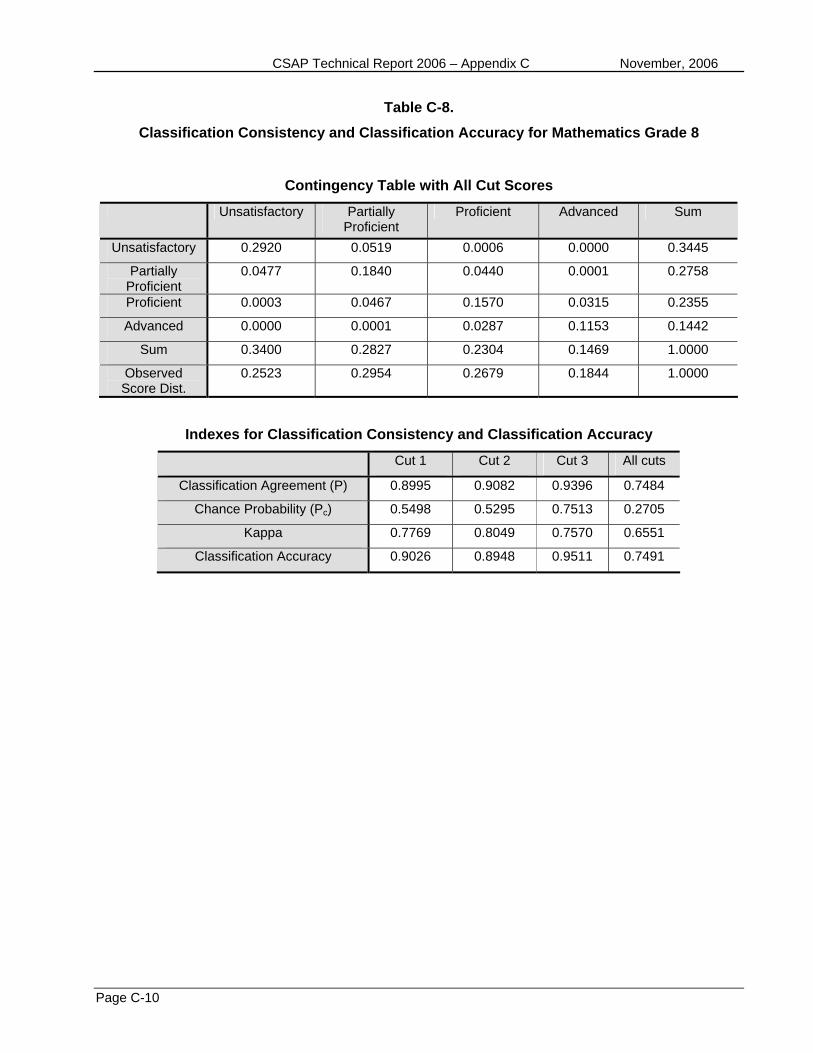
Table C-8. Classification Consistency and Classification Accuracy for Mathematics Grade 8
Contingency Table with All Cut Scores
Unsatisfactory Partially Proficient
Proficient Advanced Sum
Unsatisfactory 0.2920 0.0519 0.0006 0.0000 0.3445
Partially Proficient
0.0477 0.1840 0.0440 0.0001 0.2758
Proficient 0.0003 0.0467 0.1570 0.0315 0.2355
Advanced 0.0000 0.0001 0.0287 0.1153 0.1442
Sum 0.3400 0.2827 0.2304 0.1469 1.0000
Observed Score Dist.
0.2523
0.2954
0.2679
0.1844
1.0000
Indexes for Classification Consistency and Classification Accuracy
Cut 1 Cut 2 Cut 3 All cuts
Classification Agreement (P) 0.8995 0.9082 0.9396 0.7484
Chance Probability (Pc) 0.5498 0.5295 0.7513 0.2705
Kappa 0.7769 0.8049 0.7570 0.6551
Classification Accuracy 0.9026 0.8948 0.9511 0.7491

CSAP Technical Report 2006 – Appendix C November, 2006
Page C-11
Table C-9. Classification Consistency and Classification Accuracy for Mathematics Grade 9
Contingency Table with All Cut Scores
Unsatisfactory Partially Proficient
Proficient Advanced Sum
Unsatisfactory 0.3687 0.0487 0.0002 0.0000 0.4175
Partially Proficient
0.0537 0.1984 0.0435 0.0003 0.2959
Proficient 0.0002 0.0466 0.1256 0.0213 0.1937
Advanced 0.0000 0.0003 0.0226 0.0701 0.0930
Sum 0.4225 0.2940 0.1919 0.0917 1.0000
Observed Score Dist.
0.3094
0.3018
0.2545
0.1343
1.0000
Indexes for Classification Consistency and Classification Accuracy
Cut 1 Cut 2 Cut 3 All cuts
Classification Agreement (P) 0.8974 0.9089 0.9555 0.7627
Chance Probability (Pc) 0.5128 0.5924 0.8324 0.3090
Kappa 0.7894 0.7765 0.7344 0.6566
Classification Accuracy 0.8782 0.8967 0.9562 0.7319

CSAP Technical Report 2006 – Appendix C November, 2006
Page C-12
Table C-10. Classification Consistency and Classification Accuracy for Mathematics Grade 10
Contingency Table with All Cut Scores
Unsatisfactory Partially Proficient
Proficient Advanced Sum
Unsatisfactory 0.3788 0.0499 0.0002 0.0000 0.4288
Partially Proficient
0.0556 0.2400 0.0379 0.0001 0.3335
Proficient 0.0000 0.0386 0.1567 0.0111 0.2065
Advanced 0.0000 0.0000 0.0111 0.0201 0.0312
Sum 0.4344 0.3285 0.2059 0.0312 1.0000
Observed Score Dist.
0.3212
0.3661
0.2662
0.0464
1.0000
Indexes for Classification Consistency and Classification Accuracy
Cut 1 Cut 2 Cut 3 All cuts
Classification Agreement (P) 0.8943 0.9233 0.9777 0.7956
Chance Probability (Pc) 0.5093 0.6379 0.9395 0.3393
Kappa 0.7847 0.7882 0.6312 0.6906
Classification Accuracy 0.8826 0.9127 0.9764 0.7717

CSAP Technical Report 2006 – Appendix C November, 2006
Page C-13
Table C-11. Classification Consistency and Classification Accuracy for Reading Grade 3
Contingency Table with All Cut Scores
Unsatisfactory Partially Proficient
Proficient Advanced Sum
Unsatisfactory 0.0986 0.0256 0.0007 0.0000 0.1249
Partially Proficient
0.0258 0.1296 0.0514 0.0000 0.2068
Proficient 0.0005 0.0450 0.5264 0.0314 0.6032
Advanced 0.0000 0.0000 0.0308 0.0344 0.0652
Sum 0.1248 0.2001 0.6093 0.0658 1.0000
Observed Score Dist.
0.1060
0.1855
0.6497
0.0588
1.0000
Indexes for Classification Consistency and Classification Accuracy
Cut 1 Cut 2 Cut 3 All cuts
Classification Agreement (P) 0.9475 0.9024 0.9378 0.7889
Chance Probability (Pc) 0.7815 0.5590 0.8776 0.4288
Kappa 0.7596 0.7788 0.4917 0.6304
Classification Accuracy 0.9610 0.9280 0.9585 0.8476

CSAP Technical Report 2006 – Appendix C November, 2006
Page C-14
Table C-12. Classification Consistency and Classification Accuracy for Reading Grade 4
Contingency Table with All Cut Scores
Unsatisfactory Partially Proficient
Proficient Advanced Sum
Unsatisfactory 0.1013 0.0226 0.0000 0.0000 0.1239
Partially Proficient
0.0211 0.1718 0.0421 0.0000 0.2350
Proficient 0.0001 0.0423 0.5322 0.0216 0.5962
Advanced 0.0000 0.0000 0.0210 0.0239 0.0449
Sum 0.1225 0.2367 0.5953 0.0455 1.0000
Observed Score Dist.
0.1015
0.2193
0.6268
0.0525
1.0000
Indexes for Classification Consistency and Classification Accuracy
Cut 1 Cut 2 Cut 3 All cuts
Classification Agreement (P) 0.9562 0.9155 0.9574 0.8292
Chance Probability (Pc) 0.7839 0.5397 0.9137 0.4278
Kappa 0.7973 0.8163 0.5061 0.7014
Classification Accuracy 0.9670 0.9299 0.9688 0.8657

CSAP Technical Report 2006 – Appendix C November, 2006
Page C-15
Table C-13. Classification Consistency and Classification Accuracy for Reading Grade 5
Contingency Table with All Cut Scores
Unsatisfactory Partially Proficient
Proficient Advanced Sum
Unsatisfactory 0.1181 0.0215 0.0003 0.0000 0.1398
Partially Proficient
0.0216 0.1362 0.0407 0.0000 0.1984
Proficient 0.0001 0.0418 0.5122 0.0333 0.5874
Advanced 0.0000 0.0000 0.0350 0.0394 0.0743
Sum 0.1397 0.1994 0.5882 0.0727 1.0000
Observed Score Dist.
0.1184
0.1811
0.6082
0.0922
1.0000
Indexes for Classification Consistency and Classification Accuracy
Cut 1 Cut 2 Cut 3 All cuts
Classification Agreement (P) 0.9566 0.9171 0.9317 0.8058
Chance Probability (Pc) 0.7596 0.5521 0.8638 0.4100
Kappa 0.8195 0.8149 0.4986 0.6708
Classification Accuracy 0.9636 0.9383 0.9452 0.8471

CSAP Technical Report 2006 – Appendix C November, 2006
Page C-16
Table C-14. Classification Consistency and Classification Accuracy for Reading Grade 6
Contingency Table with All Cut Scores
Unsatisfactory Partially Proficient
Proficient Advanced Sum
Unsatisfactory 0.0980 0.0203 0.0001 0.0000 0.1184
Partially Proficient
0.0214 0.1485 0.0467 0.0000 0.2166
Proficient 0.0000 0.0452 0.4931 0.0306 0.5690
Advanced 0.0000 0.0000 0.0329 0.0631 0.0960
Sum 0.1194 0.2140 0.5728 0.0937 1.0000
Observed Score Dist.
0.1026
0.1999
0.5945
0.1030
1.0000
Indexes for Classification Consistency and Classification Accuracy
Cut 1 Cut 2 Cut 3 All cuts
Classification Agreement (P) 0.9582 0.9079 0.9364 0.8026
Chance Probability (Pc) 0.7905 0.5550 0.8283 0.3954
Kappa 0.8004 0.7931 0.6298 0.6735
Classification Accuracy 0.9671 0.9301 0.9535 0.8507

CSAP Technical Report 2006 – Appendix C November, 2006
Page C-17
Table C-15. Classification Consistency and Classification Accuracy for Reading Grade 7
Contingency Table with All Cut Scores
Unsatisfactory Partially Proficient
Proficient Advanced Sum
Unsatisfactory 0.1268 0.0260 0.0002 0.0000 0.1531
Partially Proficient
0.0272 0.1709 0.0480 0.0000 0.2461
Proficient 0.0000 0.0482 0.4634 0.0244 0.5360
Advanced 0.0000 0.0000 0.0262 0.0386 0.0648
Sum 0.1540 0.2451 0.5379 0.0630 1.0000
Observed Score Dist.
0.1263
0.2230
0.5703
0.0804
1.0000
Indexes for Classification Consistency and Classification Accuracy
Cut 1 Cut 2 Cut 3 All cuts
Classification Agreement (P) 0.9466 0.9036 0.9494 0.7998
Chance Probability (Pc) 0.7401 0.5203 0.8804 0.3763
Kappa 0.7944 0.7990 0.5768 0.6789
Classification Accuracy 0.9608 0.9163 0.9625 0.8397

CSAP Technical Report 2006 – Appendix C November, 2006
Page C-18
Table C-16. Classification Consistency and Classification Accuracy for Reading Grade 8
Contingency Table with All Cut Scores
Unsatisfactory Partially Proficient
Proficient Advanced Sum
Unsatisfactory 0.1124 0.0232 0.0000 0.0000 0.1356
Partially Proficient
0.0225 0.1765 0.0419 0.0000 0.2409
Proficient 0.0000 0.0457 0.4805 0.0271 0.5533
Advanced 0.0000 0.0000 0.0270 0.0431 0.0701
Sum 0.1349 0.2455 0.5494 0.0702 1.0000
Observed Score Dist.
0.1137
0.2150
0.5808
0.0904
1.0000
Indexes for Classification Consistency and Classification Accuracy
Cut 1 Cut 2 Cut 3 All cuts
Classification Agreement (P) 0.9543 0.9124 0.9459 0.8126
Chance Probability (Pc) 0.7661 0.5296 0.8695 0.3864
Kappa 0.8047 0.8138 0.5854 0.6946
Classification Accuracy 0.9674 0.9284 0.9552 0.8510

CSAP Technical Report 2006 – Appendix C November, 2006
Page C-19
Table C-17. Classification Consistency and Classification Accuracy for Reading Grade 9
Contingency Table with All Cut Scores
Unsatisfactory Partially Proficient
Proficient Advanced Sum
Unsatisfactory 0.1070 0.0230 0.0001 0.0000 0.1300
Partially Proficient
0.0196 0.1841 0.0456 0.0000 0.2493
Proficient 0.0000 0.0481 0.5103 0.0195 0.5779
Advanced 0.0000 0.0000 0.0176 0.0252 0.0428
Sum 0.1266 0.2552 0.5735 0.0447 1.0000
Observed Score Dist.
0.1021
0.2202
0.6239
0.0538
1.0000
Indexes for Classification Consistency and Classification Accuracy
Cut 1 Cut 2 Cut 3 All cuts
Classification Agreement (P) 0.9574 0.9062 0.9630 0.8267
Chance Probability (Pc) 0.7763 0.5285 0.9163 0.4134
Kappa 0.8096 0.8011 0.5572 0.7045
Classification Accuracy 0.9661 0.9119 0.9734 0.8514
CSAP Technical Report 2006 – Appendix C November, 2006
Page C-20
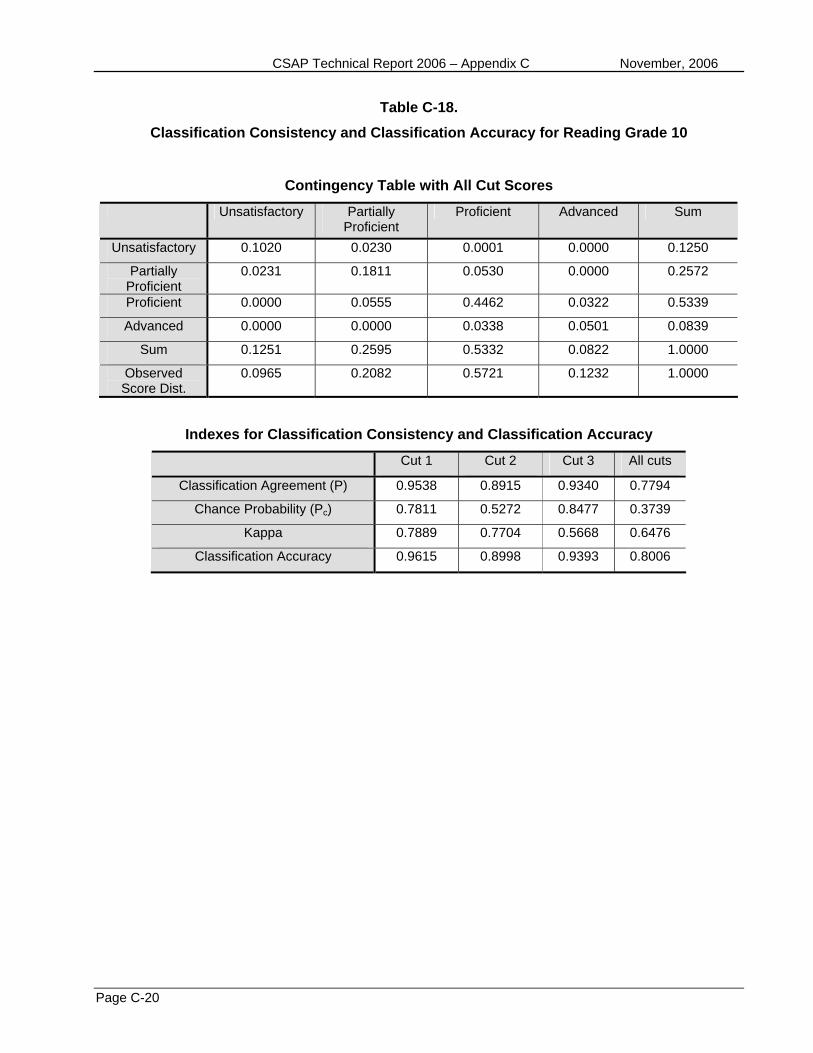
Table C-18. Classification Consistency and Classification Accuracy for Reading Grade 10
Contingency Table with All Cut Scores
Unsatisfactory Partially Proficient
Proficient Advanced Sum
Unsatisfactory 0.1020 0.0230 0.0001 0.0000 0.1250
Partially Proficient
0.0231 0.1811 0.0530 0.0000 0.2572
Proficient 0.0000 0.0555 0.4462 0.0322 0.5339
Advanced 0.0000 0.0000 0.0338 0.0501 0.0839
Sum 0.1251 0.2595 0.5332 0.0822 1.0000
Observed Score Dist.
0.0965
0.2082
0.5721
0.1232
1.0000
Indexes for Classification Consistency and Classification Accuracy
Cut 1 Cut 2 Cut 3 All cuts
Classification Agreement (P) 0.9538 0.8915 0.9340 0.7794
Chance Probability (Pc) 0.7811 0.5272 0.8477 0.3739
Kappa 0.7889 0.7704 0.5668 0.6476
Classification Accuracy 0.9615 0.8998 0.9393 0.8006

CSAP Technical Report 2006 – Appendix C November, 2006
Page C-21
Table C-19. Classification Consistency and Classification Accuracy for Science Grade 5
Contingency Table with All Cut Scores
Unsatisfactory Partially Proficient
Proficient Advanced Sum
Unsatisfactory 0.1850 0.0397 0.0000 0.0000 0.2247
Partially Proficient
0.0384 0.3242 0.0628 0.0007 0.4261
Proficient 0.0000 0.0607 0.1556 0.0310 0.2473
Advanced 0.0000 0.0005 0.0365 0.0649 0.1019
Sum 0.2234 0.4250 0.2550 0.0966 1.0000
Observed Score Dist.
0.2116
0.4125
0.2662
0.1098
1.0000
Indexes for Classification Consistency and Classification Accuracy
Cut 1 Cut 2 Cut 3 All cuts
Classification Agreement (P) 0.9219 0.8752 0.9313 0.7297
Chance Probability (Pc) 0.6523 0.5448 0.8211 0.3042
Kappa 0.7754 0.7260 0.6159 0.6116
Classification Accuracy 0.9349 0.9104 0.9437 0.7894

CSAP Technical Report 2006 – Appendix C November, 2006
Page C-22
Table C-20. Classification Consistency and Classification Accuracy for Science Grade 8
Contingency Table with All Cut Scores
Unsatisfactory Partially Proficient
Proficient Advanced Sum
Unsatisfactory 0.1977 0.0353 0.0003 0.0000 0.2332
Partially Proficient
0.0380 0.2190 0.0562 0.0000 0.3132
Proficient 0.0005 0.0546 0.3280 0.0180 0.4011
Advanced 0.0000 0.0000 0.0197 0.0327 0.0525
Sum 0.2363 0.3088 0.4042 0.0508 1.0000
Observed Score Dist.
0.2061
0.2864
0.4407
0.0668
1.0000
Indexes for Classification Consistency and Classification Accuracy
Cut 1 Cut 2 Cut 3 All cuts
Classification Agreement (P) 0.9259 0.8884 0.9623 0.7774
Chance Probability (Pc) 0.6407 0.5042 0.9021 0.3166
Kappa 0.7937 0.7750 0.6146 0.6743
Classification Accuracy 0.9315 0.8992 0.9717 0.8024

CSAP Technical Report 2006 – Appendix C November, 2006
Page C-23
Table C-21. Classification Consistency and Classification Accuracy for Science Grade 10
Contingency Table with All Cut Scores
Unsatisfactory Partially Proficient
Proficient Advanced Sum
Unsatisfactory 0.2591 0.0388 0.0004 0.0000 0.2984
Partially Proficient
0.0404 0.1761 0.0468 0.0000 0.2633
Proficient 0.0005 0.0545 0.3322 0.0135 0.4007
Advanced 0.0000 0.0000 0.0131 0.0245 0.0376
Sum 0.3001 0.2695 0.3925 0.0380 1.0000
Observed Score Dist.
0.2712
0.2509
0.4356
0.0423
1.0000
Indexes for Classification Consistency and Classification Accuracy
Cut 1 Cut 2 Cut 3 All cuts
Classification Agreement (P) 0.9198 0.8977 0.9734 0.7919
Chance Probability (Pc) 0.5806 0.5086 0.9273 0.3192
Kappa 0.8087 0.7919 0.6347 0.6943
Classification Accuracy 0.9373 0.9232 0.9784 0.8389

CSAP Technical Report 2006 – Appendix C November, 2006
Page C-24
Table C-22. Classification Consistency and Classification Accuracy for Writing Grade 3
Contingency Table with All Cut Scores
Unsatisfactory Partially Proficient
Proficient Advanced Sum
Unsatisfactory 0.0635 0.0200 0.0000 0.0000 0.0834
Partially Proficient
0.0187 0.3642 0.0746 0.0006 0.4581
Proficient 0.0000 0.0731 0.2577 0.0401 0.3709
Advanced 0.0000 0.0007 0.0397 0.0472 0.0876
Sum 0.0821 0.4580 0.3719 0.0879 1.0000
Observed Score Dist.
0.0662
0.4118
0.4108
0.1113
1.0000
Indexes for Classification Consistency and Classification Accuracy
Cut 1 Cut 2 Cut 3 All cuts
Classification Agreement (P) 0.9614 0.8510 0.9188 0.7325
Chance Probability (Pc) 0.8481 0.5033 0.8399 0.3623
Kappa 0.7457 0.6999 0.4930 0.5806
Classification Accuracy 0.9715 0.8945 0.9334 0.7994

CSAP Technical Report 2006 – Appendix C November, 2006
Page C-25
Table C-23. Classification Consistency and Classification Accuracy for Writing Grade 4
Contingency Table with All Cut Scores
Unsatisfactory Partially Proficient
Proficient Advanced Sum
Unsatisfactory 0.1053 0.0355 0.0000 0.0000 0.1408
Partially Proficient
0.0370 0.3663 0.0734 0.0001 0.4768
Proficient 0.0000 0.0707 0.2271 0.0289 0.3267
Advanced 0.0000 0.0005 0.0257 0.0295 0.0557
Sum 0.1424 0.4730 0.3262 0.0585 1.0000
Observed Score Dist.
0.0766
0.4192
0.4259
0.0783
1.0000
Indexes for Classification Consistency and Classification Accuracy
Cut 1 Cut 2 Cut 3 All cuts
Classification Agreement (P) 0.9275 0.8554 0.9448 0.7282
Chance Probability (Pc) 0.7569 0.5271 0.8923 0.3554
Kappa 0.7017 0.6941 0.4873 0.5784
Classification Accuracy 0.9234 0.8661 0.9599 0.7495

CSAP Technical Report 2006 – Appendix C November, 2006
Page C-26
Table C-24. Classification Consistency and Classification Accuracy for Writing Grade 5
Contingency Table with All Cut Scores
Unsatisfactory Partially Proficient
Proficient Advanced Sum
Unsatisfactory 0.0827 0.0269 0.0000 0.0000 0.1096
Partially Proficient
0.0300 0.3129 0.0736 0.0006 0.4171
Proficient 0.0000 0.0740 0.2799 0.0363 0.3902
Advanced 0.0000 0.0003 0.0378 0.0450 0.0831
Sum 0.1127 0.4142 0.3913 0.0819 1.0000
Observed Score Dist.
0.0570
0.3431
0.4727
0.1272
1.0000
Indexes for Classification Consistency and Classification Accuracy
Cut 1 Cut 2 Cut 3 All cuts
Classification Agreement (P) 0.9431 0.8514 0.9250 0.7205
Chance Probability (Pc) 0.8024 0.5014 0.8487 0.3446
Kappa 0.7121 0.7020 0.5044 0.5735
Classification Accuracy 0.9426 0.8622 0.9444 0.7492

CSAP Technical Report 2006 – Appendix C November, 2006
Page C-27
Table C-25. Classification Consistency and Classification Accuracy for Writing Grade 6
Contingency Table with All Cut Scores
Unsatisfactory Partially Proficient
Proficient Advanced Sum
Unsatisfactory 0.0893 0.0312 0.0000 0.0000 0.1205
Partially Proficient
0.0333 0.3032 0.0695 0.0001 0.4061
Proficient 0.0003 0.0745 0.2930 0.0324 0.4002
Advanced 0.0000 0.0002 0.0316 0.0414 0.0733
Sum 0.1229 0.4090 0.3941 0.0740 1.0000
Observed Score Dist.
0.0549
0.3494
0.4862
0.1096
1.0000
Indexes for Classification Consistency and Classification Accuracy
Cut 1 Cut 2 Cut 3 All cuts
Classification Agreement (P) 0.9352 0.8554 0.9356 0.7269
Chance Probability (Pc) 0.7863 0.5017 0.8636 0.3440
Kappa 0.6970 0.7099 0.5279 0.5836
Classification Accuracy 0.9334 0.8559 0.9409 0.7304

CSAP Technical Report 2006 – Appendix C November, 2006
Page C-28
Table C-26. Classification Consistency and Classification Accuracy for Writing Grade 7
Contingency Table with All Cut Scores
Unsatisfactory Partially Proficient
Proficient Advanced Sum
Unsatisfactory 0.0950 0.0386 0.0002 0.0000 0.1338
Partially Proficient
0.0417 0.3038 0.0770 0.0003 0.4228
Proficient 0.0000 0.0691 0.2543 0.0341 0.3576
Advanced 0.0000 0.0002 0.0330 0.0526 0.0858
Sum 0.1367 0.4118 0.3645 0.0870 1.0000
Observed Score Dist.
0.0528
0.3809
0.4526
0.1137
1.0000
Indexes for Classification Consistency and Classification Accuracy
Cut 1 Cut 2 Cut 3 All cuts
Classification Agreement (P) 0.9195 0.8532 0.9323 0.7057
Chance Probability (Pc) 0.7661 0.5055 0.8421 0.3302
Kappa 0.6560 0.7031 0.5713 0.5607
Classification Accuracy 0.9136 0.8666 0.9488 0.7293

CSAP Technical Report 2006 – Appendix C November, 2006
Page C-29
Table C-27. Classification Consistency and Classification Accuracy for Writing Grade 8
Contingency Table with All Cut Scores
Unsatisfactory Partially Proficient
Proficient Advanced Sum
Unsatisfactory 0.0978 0.0374 0.0000 0.0000 0.1352
Partially Proficient
0.0389 0.3640 0.0732 0.0002 0.4763
Proficient 0.0000 0.0728 0.2254 0.0264 0.3245
Advanced 0.0000 0.0003 0.0294 0.0344 0.0640
Sum 0.1367 0.4744 0.3279 0.0609 1.0000
Observed Score Dist.
0.0532
0.4268
0.4292
0.0908
1.0000
Indexes for Classification Consistency and Classification Accuracy
Cut 1 Cut 2 Cut 3 All cuts
Classification Agreement (P) 0.9237 0.8536 0.9438 0.7215
Chance Probability (Pc) 0.7651 0.5248 0.8829 0.3548
Kappa 0.6751 0.6920 0.5205 0.5684
Classification Accuracy 0.9152 0.8633 0.9548 0.7334

CSAP Technical Report 2006 – Appendix C November, 2006
Page C-30
Table C-28. Classification Consistency and Classification Accuracy for Writing Grade 9
Contingency Table with All Cut Scores
Unsatisfactory Partially Proficient
Proficient Advanced Sum
Unsatisfactory 0.1169 0.0424 0.0000 0.0000 0.1593
Partially Proficient
0.0461 0.3430 0.0685 0.0000 0.4576
Proficient 0.0003 0.0673 0.2446 0.0247 0.3369
Advanced 0.0000 0.0004 0.0231 0.0226 0.0462
Sum 0.1634 0.4531 0.3362 0.0474 1.0000
Observed Score Dist.
0.0555
0.4153
0.4501
0.0791
1.0000
Indexes for Classification Consistency and Classification Accuracy
Cut 1 Cut 2 Cut 3 All cuts
Classification Agreement (P) 0.9112 0.8634 0.9517 0.7271
Chance Probability (Pc) 0.7294 0.5272 0.9108 0.3488
Kappa 0.6718 0.7112 0.4587 0.5809
Classification Accuracy 0.9019 0.8471 0.9617 0.7107

CSAP Technical Report 2006 – Appendix C November, 2006
Page C-31
Table C-29. Classification Consistency and Classification Accuracy for Writing Grade 10
Contingency Table with All Cut Scores
Unsatisfactory Partially Proficient
Proficient Advanced Sum
Unsatisfactory 0.1125 0.0337 0.0000 0.0000 0.1461
Partially Proficient
0.0300 0.4030 0.0845 0.0015 0.5190
Proficient 0.0000 0.0838 0.1776 0.0238 0.2852
Advanced 0.0000 0.0014 0.0239 0.0243 0.0497
Sum 0.1425 0.5219 0.2860 0.0496 1.0000
Observed Score Dist.
0.0769
0.4042
0.4379
0.0810
1.0000
Indexes for Classification Consistency and Classification Accuracy
Cut 1 Cut 2 Cut 3 All cuts
Classification Agreement (P) 0.9363 0.8288 0.9493 0.7174
Chance Probability (Pc) 0.7530 0.5543 0.9056 0.3757
Kappa 0.7422 0.6159 0.4629 0.5473
Classification Accuracy 0.9276 0.7961 0.9603 0.6844