appendix c-crooked mud honey project deadwood...
TRANSCRIPT
Crooked Mud Honey Project Wildlife Report Appendix C DecAID Report
Wildlife
1
Appendix C-Crooked Mud Honey Project Deadwood Analysis (DecAid)
Current Direction Based on “Biological Potential”
The goal of management for species richness is to insure that most native wildlife species are
maintained in viable numbers and that habitat requirements for all species must be accounted for
(Thomas, 1979, p.141). Habitat requirements, including snag and down woody material levels,
were described for a vast array of wildlife species using information known at the time in
Thomas (1979) and Brown (1985). However, Bull et al. (1997) states current direction for
providing wildlife habitat on public forest lands does not reflect the new information available,
which suggests that to fully meet the needs of wildlife, additional snags and habitat are required
for foraging, denning, nesting, and roosting. Rose et al. (2001) also state that several major
lessons have been learned in the period 1979 to 1999 that have tested critical assumptions of
earlier management advisory models, including some assumptions used to develop current
recommendations in the LRMP Standards and Guidelines. Some assumptions include:
Calculation of numbers of snags required by woodpeckers based on assessing their
“biological (population) potential” is a flawed technique (Rose et al., 2001). Empirical
studies are suggesting that snag numbers in areas used and selected by some wildlife
species are far higher than those calculated by this technique (Rose et al., 2001).
Numbers and sizes (dbh) of snags used and selected by secondary cavity nesters often
exceed those of primary excavators (Rose et al., 2001).
This suggests the current direction of managing for 100 percent population levels of primary
excavators may not represent the most current knowledge of managing for cavity nesters and that
these snag levels, under certain conditions, may not be adequate for some species.
DecAID is a culmination of the most recent science and data available. As stated by Rose et al.
(2001), DecAID is based on a thorough review of the literature, available research and inventory
data, and expert judgment. Information in DecAID will be compared to the current LRMP
standards and guidelines for this project.
Explanation of the DecAID Version 2.0 Advisory Tool
The snag analysis for the Crooked Mud Honey Project was conducted using DecAID Version
2.0. DecAID is an advisory tool developed to help managers evaluate the effects of forest
conditions (existing conditions or conditions that would result from proposed activities) on
wildlife that use snags and down wood. It is a summary, synthesis, and integration of current
scientific knowledge about the sizes and amounts of snags and down wood used by cavity
nesting birds in specific vegetation types in the West.
DecAID can help managers decide how much snag and down wood of different sizes should be
retained to meet wildlife management objectives for a particular project or area (Mellen et al.,
2006). The information contained in DecAID is based on published scientific literature, research
data, expert judgment, and professional experience. It is primarily a statistical summary of
published research data for wildlife presence (mainly cavity-nesting birds) and inventoried forest
conditions (Mellen et al., 2006). DecAID presents information on the range of “natural

Crooked Mud Honey Project Wildlife Report Appendix C DecAID Report
Wildlife
2
conditions” (as represented by unharvested plots within the plots sampled), “current conditions”
(all plots sampled, including both unharvested and harvested plots), and wildlife use.
DecAID contains two major data sets, which are summarized by wildlife habitat types. The
vegetative inventory data is composed of statistical summaries of forest inventory data on snags
and down wood in unharvested forests and entire landscapes across Oregon and Washington.
The wildlife data is derived from a thorough review of published literature and other available
data on wildlife use of snags and down wood, primarily in Oregon and Washington. DecAID
provides a statistical synthesis of data showing levels of use by individual wildlife species of
snags and down wood. Wildlife use data are not available for all structural condition classes in
all wildlife habitat types.
Descriptions of terminology and data sources used in DecAID
Two types of data sets provided in DecAID were used to develop recommendations for this
project. They include:
Wildlife data
Vegetative inventory data
Definition of “wildlife data” as used in DecAID:
“Wildlife data” as used in DecAID refers to the data collected in a variety of wildlife studies
conducted in specific vegetation types found in the West. Most of the data was collected for bird
species, primarily cavity-nesters such as woodpeckers. The wildlife data in DecAID is provided
in the form of tolerance levels of 30 percent, 50 percent, or 80 percent. In other words, for a
given study location, data was collected that correlated certain stand conditions (size and
abundance of snags and down wood) with nesting use by 30 percent, 50 percent or 80 percent of
the population of a particular species in that area.
One of these wildlife studies looked specifically at post-fire habitats in the State of Idaho. That
study, which collected data on 35 black-backed woodpecker nests, found that 30 percent of the
nests occurred in stands with less than 62.2 snags >10 inches dbh, per acre. Fifty percent of the
nest sites were found in stands with less than 88.3 snags >10 inches dbh, per acre. Eighty
percent of the nests were located in stands that had up to126.1 snags >10 inches dbh, per acre
(Mellen et al., 2006).
Referring to the array of wildlife data collected, DecAID notes:
“The wildlife studies, on which the wildlife portion of DecAID is based, were conducted in a
variety of landscapes and site conditions. Typically, the studies (a) did not report how the
general study areas and specific study sites were chosen relative to others, and (b) did not
describe how the vegetation conditions within the general study areas and specific study sites
differed from conditions within a broader area, especially within the wildlife habitat and
vegetation condition classes used in DecAID. Thus, there is no way to know to what degree the
study areas and sites varied from conditions generally present, and thus no way to gauge the bias
in study area and site selection. In turn, this means there is no way to estimate the degree of bias
in the wildlife data summarized in DecAID” (Mellen et al., 2006).
Crooked Mud Honey Project Wildlife Report Appendix C DecAID Report
Wildlife
3
In general, this unknown bias is likely reduced when a greater number and extent of studies are
conducted in a particular wildlife habitat and structural condition. The benefit of the meta-
analysis used in DecAID is that it increases sample sizes, and multiple studies strengthen
evidence of dead wood associations.
Definition of “tolerance level” as used in DecAID for wildlife data:
“Tolerance level” is the percentage of individual birds within a given population that will nest in
forest stands characterized by a certain number and size range of snags. For example, black-
backed woodpeckers show 30 and 50 percent tolerance levels for stands that contain 62 and 88
snags >10 inches dbh per acre, respectively. This means that 20 percent (50 minus 30) of all the
black-backed woodpecker nests in that area were found in stands with snag densities in that
range (tolerance interval).
Data is displayed by tolerance level for both wildlife data and inventory data. A tolerance level
as it relates to wildlife data is defined as follows: “tolerance intervals are estimates of the
percent of all individuals in the population that are within some specified range of values”
(Mellen et al., 2006). For example, we’ll use data from the wildlife species curves for black-
backed woodpeckers.
Snag density (>10inches dbh) for black-backed woodpeckers:
30% tolerance level = 62.2 snags per acre
50% tolerance level = 88.3 snags per acre
80% tolerance level = 126.1 snags per acre
The above data from 35 nests in post-fire habitats indicate (Mellen, pers.com):
Areas with less than 62.2 snags per acre would be expected to be used for nesting by only
30 percent of the individuals within the population of black-backed woodpeckers, and
conversely 70 percent of the population would be expected to nest in areas with equal to
or greater than 62.2 snags per acre.
Half the individuals within the population would be expected to nest in areas with less
than 88.3 snags per acre and the other half would be expected to nest in areas with equal
to or greater than 88.3 snags per acre.
80 percent of the individuals within the population of black-backed woodpeckers would
be expected to nest in areas with less than 126.1 snags per acre and, conversely, 20
percent of the population would be expected to nest in areas with equal to or greater than
126.1 snags per acre.
Definition of “vegetative inventory data” as used in DecAID:
The second set of data included in DecAID is data about vegetative conditions from around the
Pacific Northwest. This data set is called the “vegetative inventory data,” sometimes shortened
to the “inventory data.” This data set consists of a sample of forest inventory plots (which, in
addition to recording sizes, numbers, and species of live trees, also record sizes and numbers of
snags and down wood), taken from the:

Crooked Mud Honey Project Wildlife Report Appendix C DecAID Report
Wildlife
4
Current Vegetation Survey (conducted on National Forest System lands in the USDA
Forest Service, Pacific Northwest Region).
Forest Inventory and Analysis (conducted on lands other than National Forest System
lands, by the Pacific Northwest Research Station of the USDA Forest Service).
Natural Resource Inventory (conducted by the USDI Bureau of Land Management on
BLM lands in Oregon) (Mellen et al., 2006).
The vegetative inventory data set summarizes the data from these various inventory plots in
various categories, such as:
The data from only those inventory plots that have not been harvested.
The data from all inventory plots in their current condition, including those that have
been harvested.
The data from only those inventory plots that contained measurable snags.
The data from all inventory plots, whether or not they contained measurable snags.
A map of the plot locations (both harvested and unharvested) used in DecAID can be found on
the following website: http://www.notes.fs.fed.us:81/pnw/DecAID/DecAID.nsf.
Definition of “tolerance level” as used in DecAID for vegetative inventory data
DecAID also uses the term “tolerance level” with respect to the dead wood conditions measured
in the vegetative inventory data set. However, “tolerance level” has a different definition when
used in conjunction with the vegetative inventory data set. In this context, tolerance levels
describe the sizes and amounts of dead wood found to be characteristic across the landscape (that
is, the area represented by the sampled plots), for a certain vegetative type (for example,
ponderosa pine) in a certain condition (for example, unharvested) (Mellen et al., 2006). To more
fully illustrate this definition, the following example, extracted from DecAID, is offered:
For the category: vegetative type, Ponderosa Pine/Douglas-fir Forest, Larger Trees, in the
condition, Unharvested and contains measurable snags, a tolerance level of 80 percent with
respect to snags indicates that 80 percent of the acres in this category are expected to have fewer
than 13.3 snags per acre (10 inches dbh or larger) and 20 percent of the acres are expected to
have more than 13.3 snags per acre (10 inches dbh or larger). In other words, for all the acres
sampled in the large ponderosa pine/Douglas fir category that have never been harvested and that
contain some amount of snags, 80 percent of the time these acres should have fewer than 13
snags (10 inches dbh or larger).
It is important to remember that these data represent average snag numbers for a particular
vegetative type and condition at a regional level, rather than vegetative conditions and snag
numbers specific to nest sites. When considering this data, wildlife managers need to adjust it in
light of the vegetation conditions present in their local project area.
Crooked Mud Honey EA Vegetation Distribution Information
Crooked Mud Honey Project Wildlife Report Appendix C DecAID Report
Wildlife
5
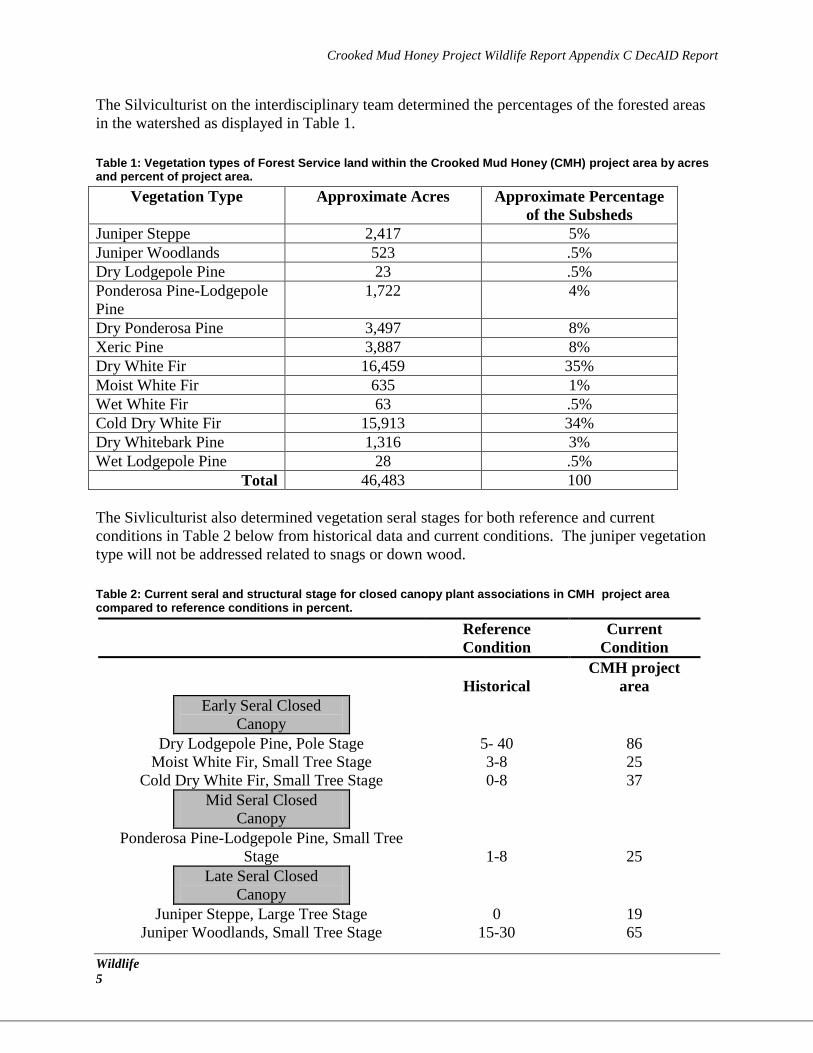
The Silviculturist on the interdisciplinary team determined the percentages of the forested areas
in the watershed as displayed in Table 1.
Table 1: Vegetation types of Forest Service land within the Crooked Mud Honey (CMH) project area by acres and percent of project area.
Vegetation Type Approximate Acres Approximate Percentage
of the Subsheds
Juniper Steppe 2,417 5%
Juniper Woodlands 523 .5%
Dry Lodgepole Pine 23 .5%
Ponderosa Pine-Lodgepole
Pine
1,722 4%
Dry Ponderosa Pine 3,497 8%
Xeric Pine 3,887 8%
Dry White Fir 16,459 35%
Moist White Fir 635 1%
Wet White Fir 63 .5%
Cold Dry White Fir 15,913 34%
Dry Whitebark Pine 1,316 3%
Wet Lodgepole Pine 28 .5%
Total 46,483 100
The Sivliculturist also determined vegetation seral stages for both reference and current
conditions in Table 2 below from historical data and current conditions. The juniper vegetation
type will not be addressed related to snags or down wood.
Table 2: Current seral and structural stage for closed canopy plant associations in CMH project area compared to reference conditions in percent.
Reference
Condition
Current
Condition
Historical
CMH project
area
Early Seral Closed
Canopy
Dry Lodgepole Pine, Pole Stage 5- 40 86
Moist White Fir, Small Tree Stage 3-8 25
Cold Dry White Fir, Small Tree Stage 0-8 37
Mid Seral Closed
Canopy
Ponderosa Pine-Lodgepole Pine, Small Tree
Stage 1-8 25
Late Seral Closed
Canopy
Juniper Steppe, Large Tree Stage 0 19
Juniper Woodlands, Small Tree Stage 15-30 65
Crooked Mud Honey Project Wildlife Report Appendix C DecAID Report
Wildlife
6
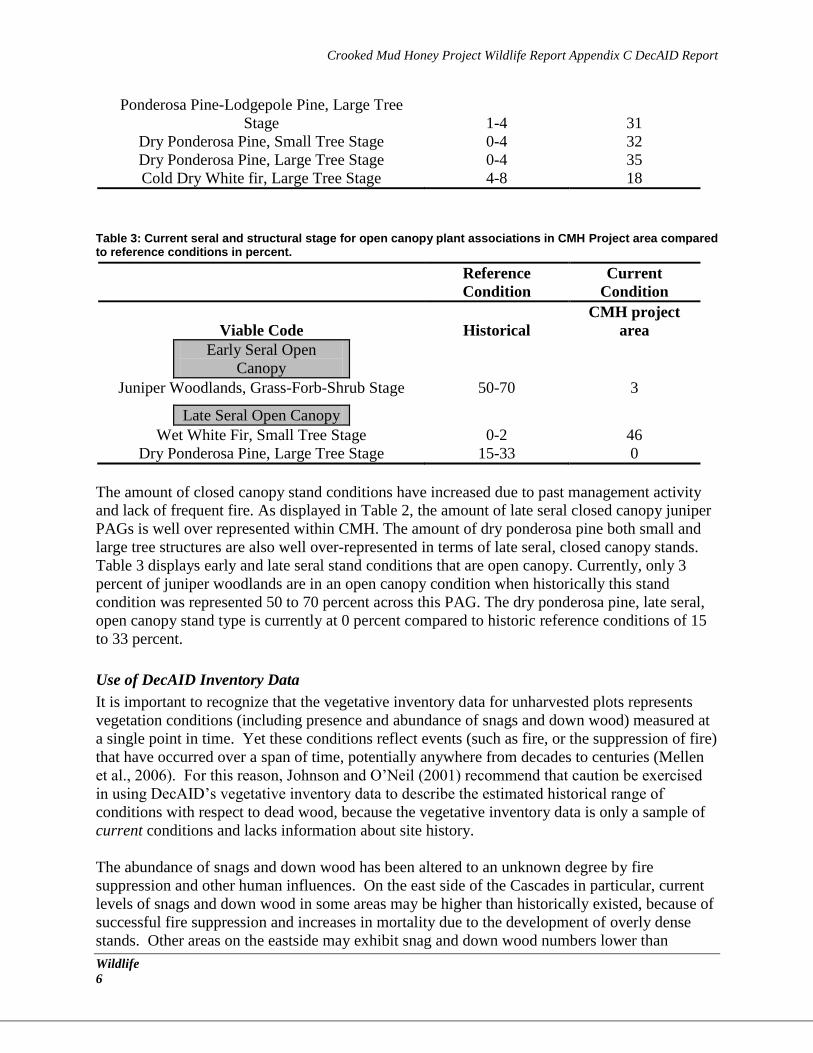
Ponderosa Pine-Lodgepole Pine, Large Tree
Stage 1-4 31
Dry Ponderosa Pine, Small Tree Stage 0-4 32
Dry Ponderosa Pine, Large Tree Stage 0-4 35
Cold Dry White fir, Large Tree Stage 4-8 18
Table 3: Current seral and structural stage for open canopy plant associations in CMH Project area compared to reference conditions in percent.
Reference
Condition
Current
Condition
Viable Code Historical
CMH project
area
Early Seral Open
Canopy
Juniper Woodlands, Grass-Forb-Shrub Stage 50-70 3
Late Seral Open Canopy
Wet White Fir, Small Tree Stage 0-2 46
Dry Ponderosa Pine, Large Tree Stage 15-33 0
The amount of closed canopy stand conditions have increased due to past management activity
and lack of frequent fire. As displayed in Table 2, the amount of late seral closed canopy juniper
PAGs is well over represented within CMH. The amount of dry ponderosa pine both small and
large tree structures are also well over-represented in terms of late seral, closed canopy stands.
Table 3 displays early and late seral stand conditions that are open canopy. Currently, only 3
percent of juniper woodlands are in an open canopy condition when historically this stand
condition was represented 50 to 70 percent across this PAG. The dry ponderosa pine, late seral,
open canopy stand type is currently at 0 percent compared to historic reference conditions of 15
to 33 percent.
Use of DecAID Inventory Data
It is important to recognize that the vegetative inventory data for unharvested plots represents
vegetation conditions (including presence and abundance of snags and down wood) measured at
a single point in time. Yet these conditions reflect events (such as fire, or the suppression of fire)
that have occurred over a span of time, potentially anywhere from decades to centuries (Mellen
et al., 2006). For this reason, Johnson and O’Neil (2001) recommend that caution be exercised
in using DecAID’s vegetative inventory data to describe the estimated historical range of
conditions with respect to dead wood, because the vegetative inventory data is only a sample of
current conditions and lacks information about site history.
The abundance of snags and down wood has been altered to an unknown degree by fire
suppression and other human influences. On the east side of the Cascades in particular, current
levels of snags and down wood in some areas may be higher than historically existed, because of
successful fire suppression and increases in mortality due to the development of overly dense
stands. Other areas on the eastside may exhibit snag and down wood numbers lower than

Crooked Mud Honey Project Wildlife Report Appendix C DecAID Report
Wildlife
7
historic levels because snags/down wood were consumed in severe fires or removed by repeated
harvest and firewood cutting (Johnson and O’Neil, 2001).
The terms Historic Range of Variability (HRV), Natural Conditions, and Historical Conditions
are sometimes used interchangeably to indicate conditions which occurred on the landscape prior
to the influence of humans (particularly Europeans). Because it is difficult to determine what
snag and down wood levels were prior to influence of humans, the term reference condition is
used in this document in reference to the use of inventory data from DecAID. While it is not
known how well the data represents pre-European levels, the data do provide a reference
condition for managers to consider.
Caution should be used when assuming unharvested stands represent “natural” or reference
conditions. Due to years of fire exclusion, current levels and composition of snags and down
wood may not accurately reflect “pre-settlement” or reference conditions in eastside forests
(Mellen et al., 2006). Although current snag and down wood levels found in DecAID may not
accurately reflect reference conditions, they are still within reason when compared to other
current research as described below. Refer to the document “Comparison of Historical Range of
Variability for Dead Wood: DecAID vs. Other Published Estimates”
(http://www.fs.fed.us/r6/nr/wildlife/decaid/hrv-dead-wood-comparison.shtml) for more
information. DecAID vegetation data provide the most current scientific data available and it is
the only data that indicates the historical distribution of snag densities.
How the Data in DecAID was Reviewed Specific to This Project
Methodology: Existing snag conditions were derived using Gradient Nearest Neighbor, or GNN;
Ohmann and Gregory 2002. Refer to the website www.fsl.orst.edu/lemma for more information
on the GNN data. This analysis is intended to be a course level analysis of snag density and
distribution within the CMH Project area.
Assumptions
1.) The reference condition in DecAID represents historical range of variability.
2.) The GNN data is representative of existing snag densities.
3.) The snag analysis area includes 12 Subwatersheds within the CMH Project area.
The CMH project will be evaluated for snag habitat with this method: 1) a distribution analysis,
inventory level analysis, and wildlife tolerance level analysis.
1. Distribution analysis
The vegetation inventory data in DecAID from the unharvested portion of the landscape can be
used as a reference or desired future conditions; it is a coarse-filter approach to management at a
broad landscape scale. As a general rule-of-thumb, it is suggested that planning areas be at least
20 square miles in size [12,800 acres]. DecAID states that analysis areas (landscapes or
watersheds) should be sufficiently large to encompass the range of variation in wildlife habitat
types and structural conditions that occur in the area (Mellen et al., 2006). The CMH project
area is 51,525 acres. Four Decaid wildlife habitat types are found within the project area. The
dominate type Eastside Mixed Conifer (EMC) Forest habitat type includes 40,949 acres,
Crooked Mud Honey Project Wildlife Report Appendix C DecAID Report
Wildlife
8
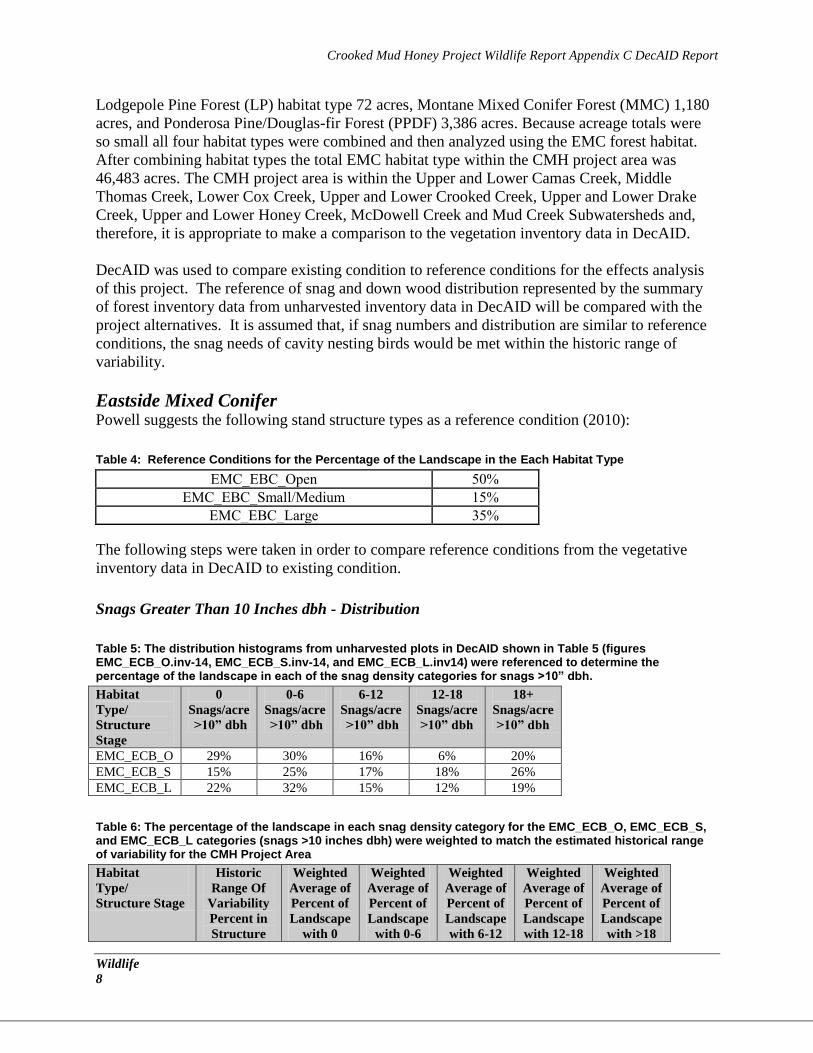
Lodgepole Pine Forest (LP) habitat type 72 acres, Montane Mixed Conifer Forest (MMC) 1,180
acres, and Ponderosa Pine/Douglas-fir Forest (PPDF) 3,386 acres. Because acreage totals were
so small all four habitat types were combined and then analyzed using the EMC forest habitat.
After combining habitat types the total EMC habitat type within the CMH project area was
46,483 acres. The CMH project area is within the Upper and Lower Camas Creek, Middle
Thomas Creek, Lower Cox Creek, Upper and Lower Crooked Creek, Upper and Lower Drake
Creek, Upper and Lower Honey Creek, McDowell Creek and Mud Creek Subwatersheds and,
therefore, it is appropriate to make a comparison to the vegetation inventory data in DecAID.
DecAID was used to compare existing condition to reference conditions for the effects analysis
of this project. The reference of snag and down wood distribution represented by the summary
of forest inventory data from unharvested inventory data in DecAID will be compared with the
project alternatives. It is assumed that, if snag numbers and distribution are similar to reference
conditions, the snag needs of cavity nesting birds would be met within the historic range of
variability.
Eastside Mixed Conifer Powell suggests the following stand structure types as a reference condition (2010):
Table 4: Reference Conditions for the Percentage of the Landscape in the Each Habitat Type
EMC_EBC_Open 50%
EMC_EBC_Small/Medium 15%
EMC_EBC_Large 35%
The following steps were taken in order to compare reference conditions from the vegetative
inventory data in DecAID to existing condition.
Snags Greater Than 10 Inches dbh - Distribution
Table 5: The distribution histograms from unharvested plots in DecAID shown in Table 5 (figures EMC_ECB_O.inv-14, EMC_ECB_S.inv-14, and EMC_ECB_L.inv14) were referenced to determine the percentage of the landscape in each of the snag density categories for snags >10” dbh.
Habitat
Type/
Structure
Stage
0
Snags/acre
>10” dbh
0-6
Snags/acre
>10” dbh
6-12
Snags/acre
>10” dbh
12-18
Snags/acre
>10” dbh
18+
Snags/acre
>10” dbh
EMC_ECB_O 29% 30% 16% 6% 20%
EMC_ECB_S 15% 25% 17% 18% 26%
EMC_ECB_L 22% 32% 15% 12% 19%
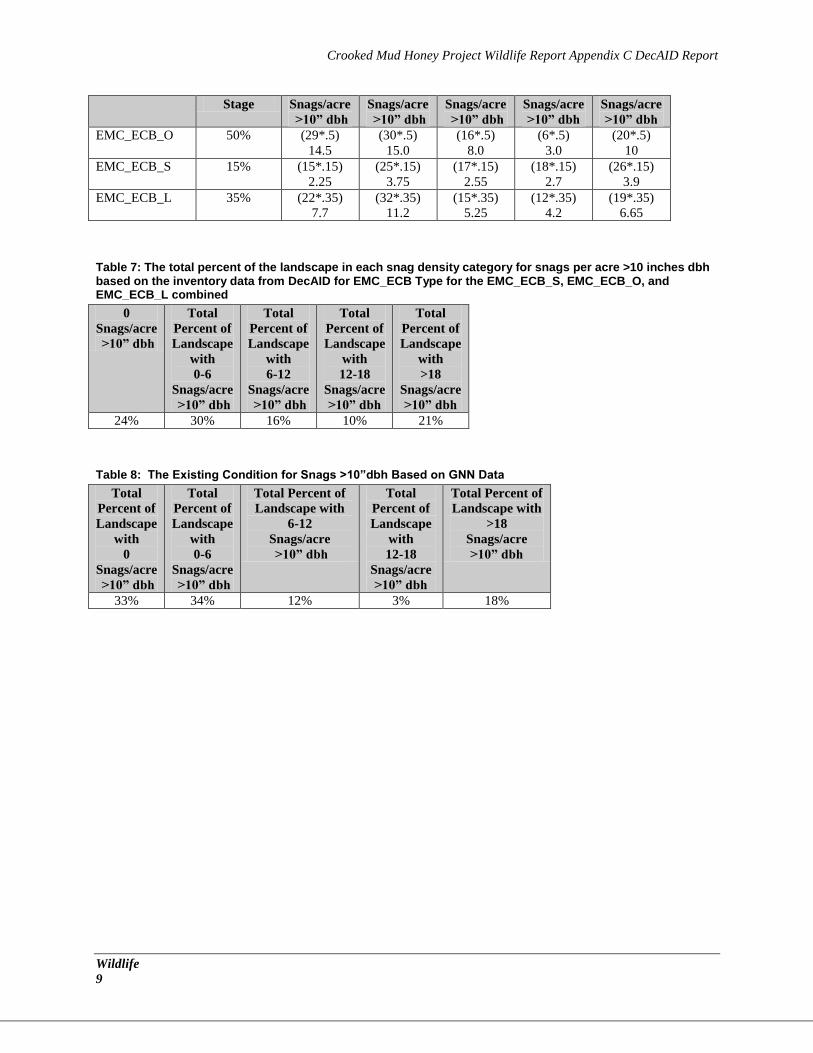
Table 6: The percentage of the landscape in each snag density category for the EMC_ECB_O, EMC_ECB_S, and EMC_ECB_L categories (snags >10 inches dbh) were weighted to match the estimated historical range of variability for the CMH Project Area
Habitat
Type/
Structure Stage
Historic
Range Of
Variability
Percent in
Structure
Weighted
Average of
Percent of
Landscape
with 0
Weighted
Average of
Percent of
Landscape
with 0-6
Weighted
Average of
Percent of
Landscape
with 6-12
Weighted
Average of
Percent of
Landscape
with 12-18
Weighted
Average of
Percent of
Landscape
with >18
Crooked Mud Honey Project Wildlife Report Appendix C DecAID Report
Wildlife
9
Stage Snags/acre
>10” dbh
Snags/acre
>10” dbh
Snags/acre
>10” dbh
Snags/acre
>10” dbh
Snags/acre
>10” dbh
EMC_ECB_O 50% (29*.5)
14.5
(30*.5)
15.0
(16*.5)
8.0
(6*.5)
3.0
(20*.5)
10
EMC_ECB_S 15% (15*.15)
2.25
(25*.15)
3.75
(17*.15)
2.55
(18*.15)
2.7
(26*.15)
3.9
EMC_ECB_L 35% (22*.35)
7.7
(32*.35)
11.2
(15*.35)
5.25
(12*.35)
4.2
(19*.35)
6.65
Table 7: The total percent of the landscape in each snag density category for snags per acre >10 inches dbh based on the inventory data from DecAID for EMC_ECB Type for the EMC_ECB_S, EMC_ECB_O, and EMC_ECB_L combined
0
Snags/acre
>10” dbh
Total
Percent of
Landscape
with
0-6
Snags/acre
>10” dbh
Total
Percent of
Landscape
with
6-12
Snags/acre
>10” dbh
Total
Percent of
Landscape
with
12-18
Snags/acre
>10” dbh
Total
Percent of
Landscape
with
>18
Snags/acre
>10” dbh
24% 30% 16% 10% 21%
Table 8: The Existing Condition for Snags >10”dbh Based on GNN Data
Total
Percent of
Landscape
with
0
Snags/acre
>10” dbh
Total
Percent of
Landscape
with
0-6
Snags/acre
>10” dbh
Total Percent of
Landscape with
6-12
Snags/acre
>10” dbh
Total
Percent of
Landscape
with
12-18
Snags/acre
>10” dbh
Total Percent of
Landscape with
>18
Snags/acre
>10” dbh
33% 34% 12% 3% 18%

Crooked Mud Honey Project Wildlife Report Appendix C DecAID Report
Wildlife
10
Figure 1: Existing Condition for Snag Densities Greater Than 10 Inches dbh Compared to the Reference
Conditions in Decaid.
3334
12
3
18
24
30
16
10
21
0
5
10
15
20
25
30
35
40
0 0-6 6-12 12-18 18+
Pe
rce
nt
of
Lan
dsc
ape
Snags per acre
Existing Condition for Snag Densities Greater Than 10 Inches dbh Compared to the Reference Conditions in
DecAID
Current Condition
Reference Condition
Total Snags Greater Than 20 Inches dbh - Distribution
Table 9: The distribution histograms from unharvested plots in DecAID (figures EMC_ECB_O.inv-15, EMC_ECB_S.inv-15, and EMC_ECB_L.inv15) were referenced to determine the percentage of the landscape in each of the snag density categories for snags >20” dbh.
Habitat
Type/
Structure
Stage
0
Snags/acre
>10” dbh
0-2
Snags/acre
>10” dbh
2-4
Snags/acre
>10” dbh
4-6
Snags/acre
>10” dbh
6+
Snags/acre
>10” dbh
EMC_ECB_O 53% 22% 10% 5% 10%
EMC_ECB_S 31% 18% 17% 13% 21%
EMC_ECB_L 32% 8% 19% 14% 27%
Table 10: The percentage of the landscape in each snag density category for the EMC_ECB_O, EMC_ECB_S, and EMC_ECB _L categories (snags >20 inches dbh) were weighted to match the estimated historical range of variability for the Crooked Mud Honey Project Area
Habitat
Type/
Structure Stage
Historic
Range Of
Variability
Percent in
Structure
Stage
Weighted
Average of
Percent of
Landscape
with 0
Snags/acre
>10” dbh
Weighted
Average of
Percent of
Landscape
with 0-2
Snags/acre
>10” dbh
Weighted
Average of
Percent of
Landscape
with 2-4
Snags/acre
>10” dbh
Weighted
Average of
Percent of
Landscape
with 4-6
Snags/acre
>10” dbh
Weighted
Average of
Percent of
Landscape
with >6
Snags/acre
>10” dbh
EMC_ECB_O 50% (53*.5)
26.5
(22*.5)
11.0
(10*.5)
5.0
(5*.5)
2.5
(10*.5)
5.0
EMC_ECB_SM 15% (31*.15)
4.65
(18*.15)
2.7
(17*.15)
2.55
(13*.15)
1.95
(21*.15)
3.15
EMC_ECB_L 35% (32*.35)
11.2
(8*.35)
2.8
(19*.35)
6.65
(14*.35)
4.9
(27*.35)
9.45

Crooked Mud Honey Project Wildlife Report Appendix C DecAID Report
Wildlife
11
Table 11: The total percent of the landscape in each snag density category for snags per acre >20 inches dbh based on the inventory data from DecAID for EMC_ECB Type for the EMC_ECB_S, EMC_ECB_O, and EMC_ECB_L combined
Total
Percent of
Landscape
with
0
Snags/acre
>10” dbh
Total
Percent of
Landscape
with
0-2
Snags/acre
>20” dbh
Total
Percent of
Landscape
with
2-4
Snags/acre
>20” dbh
Total
Percent of
Landscape
with
4-6
Snags/acre
>20” dbh
Total
Percent of
Landscape
with
>6
Snags/acre
>20” dbh
42% 17% 14% 9% 8%
Table 12: The Existing Condition for Snags >20”dbh Based on GNN Data
Total
Percent of
Landscape
with
0
Snags/acre
>20” dbh
Total
Percent of
Landscape
with
0-2
Snags/acre
>20” dbh
Total
Percent of
Landscape
with
2-4
Snags/acre
>20” dbh
Total
Percent of
Landscape
with
4-6
Snags/acre
>20” dbh
Total
Percent of
Landscape
with
>6
Snags/acre
>20” dbh
46% 26% 5% 13% 10%
Figure 2: Existing Condition for snag Densities Greater Than 20 Inches dbh Compared to the Reference
Conditions in Decaid
GNN Data

Crooked Mud Honey Project Wildlife Report Appendix C DecAID Report
Wildlife
12
Table 13 below displays snag information contained in the Gradient Nearest Neighbor data set.
GNN contains data averaged over many stand types and conditions. The larger the scale that this
data is used, the more accurate it becomes for particular vegetation type. This data indicates that
we exceed Forest Plan standards related to snag densities.
Table 13: GNN snag data for the Fremont-Winema National Forest by EMC vegetation type
Number of Snags EMC Snags per Acre
> 12 cm (4.7 in.) DBH 18.3
> 25 cm (9.8 in.) DBH 6.6
> 50 cm (19.7 in.) DBH 1.5
DecAID Snag Diameter Information
Table 14 below displays the average snag diameter used by cavity excavator species by tolerance
level and forest habitat type taken from DecAID. Generally speaking higher tolerance levels
provide for a greater percentage of the individuals within a population.
Table 14: Snag diameter information by tolerance levels for selected wildlife species from DecAID Tables EMC_L.sp-17, EMC_S.sp-17.
Forest Wildlife Habitat Type EMC Mixed Conifer
Species
30% t.l.
snag
DBH (in)
50% t.l.
snag
DBH (in)
80% t.l.
snag
DBH (in)
BBWP-Black-backed Woodpecker 8.8 12.0 16.7
HAWO-Hairy Woodpecker 10.5 16.3 25.2
NOFL-Northern Flicker 17.7 22.2 30.6
PCE-Primary Cavity Excavators 16.8 23.1 33.3
PIWO-Pileated Woodpecker 25.2 29.5 36.0
WHWO-White-headed Woodpecker 20.8 26.7 35.9
WISA-Williamson’s Sapsucker 20.2 26.2 34.6
Data Source within DecAID Table EMC_L.sp-17 and
EMC_S.sp-17. (numbers in these tables are the same)
When Table 14 above is compared with Tables 5-12 above and Figures 1-2, it shows that the
project area is providing snag diameters that could be used by these wildlife species. Generally
speaking higher tolerance levels provide for a greater percentage of the individuals within a
population.
Snag Density Information
Densities of snags are also important for determining level of habitat provided. Table 15 below
was compiled with information from DecAID (version 2.0) Tables EMC_S/L.sp-22. This table
contains synthesized data for wildlife use of snag densities from various studies for the Eastside
Mixed Forest Conifer Wildlife Habitat Type and Small/medium Trees and Larger Trees
Structural Condition Classes.
Interpreting Table 15 below indicates for the four cavity excavator species with data available
generally shows that increasing the snag diameter reduces the number of snags per acre needed
to accommodate the same percentage of the population.

Crooked Mud Honey Project Wildlife Report Appendix C DecAID Report
Wildlife
13
Table 15: Synthesized snag density information by tolerance levels for selected wildlife species from DecAID Tables EMC_S/L.sp-22.
Snag Size >= 6.4” dbh Snag Size >= 9.6” dbh Snag Size >= 20” dbh
Species
30% t.l.
snag
density
(#/ac.)
50% t.l.
snag
density
(#/ac.)
80% t.l.
snag
density
(#/ac.)
30% t.l.
snag
density
(#/ac.)
50% t.l.
snag
density
(#/ac.)
80% t.l.
snag
density
(#/ac.)
30% t.l.
snag
density
(#/ac.)
50% t.l.
snag
density
(#/ac.)
80% t.l.
snag
density
(#/ac.)
BBWP-Black-backed
Woodpecker
no data no data no data 2.5 13.6 29.2 0 1.4 5.7
PIWO-Pileated
Woodpecker
no data no data no data 14.9 30.1 49.3 3.5 7.8 18.4
WHWO-White-
headed Woodpecker
Table EMC_S/L.sp-22
only
0.8 3.0 6.2 0.3 1.9 4.3 0 1.5 3.8
WISA-Williamson’s
Sapsucker
no data no data no data 14.0 28.4 49.7 3.3 8.6 16.6
In summary, snag densities were compared with Figures 1-2. The following species are
currently being provided for at the tolerance levels indicated. The CMH project area has pockets
of bug kill including 1377 acres of lodgepole that will be retained on the landscape. Retention
areas, no cut areas, single tree retention areas will also provide smaller dbh conifers in dense
patches required by species above.

Crooked Mud Honey Project Wildlife Report Appendix C DecAID Report
Wildlife
14
Snag Summary for CMH Project Area Harvest prescriptions within the CMH project area call for thinning from below, variable density
spacing, and skip/gap techniques. These prescriptions will be followed with prescribed fire. The
effect of this on these stands is that there will be a mosaic of stand densities across the landscape,
and these stands would be within the historical range of variability, and therefore, should
continue to allow the natural processes that create snags to function. Also, the design criteria to
retain 15-20% of each treatment unit will leave areas of these stands above the insect threshold.
Additionally, no treatment areas will be dispersed across the CMH project area. Ponderosa pine
trees >21” will also not be harvested within the project area. Within the Eastside mixed conifer
vegetation community there has been a shift from the larger tree structural stage to small/medium
structural stages. This shift is the result from past harvest practices, and fire suppression. In
areas of past clear cuts and salvage logging, snag density is likely less than what would have
occurred historically.
The overall affect is that without recent snag survey data, it is difficult to quantify statistically
what is there right now. However, it appears based on GNN data snag information available that
the project area is close to reference conditions and Forest Plan standards (white paper from the
Forest identifying 4 snags/acre). Past logging practices and fire suppression have moved current
conditions above/below reference conditions in some categories. The proposed action and time
will move current conditions back toward historic snag reference conditions.
Down Wood Summary CMH Project Area
Definition of “down wood percent cover”, as used in DecAID:
DecAID includes data on down wood, a habitat component used by many wildlife species.
DecAID uses “down wood percent cover” to measure the presence of down wood on a given
acre. “Down wood percent cover” means within a given area, the percentage of the ground that
is covered with down wood at least 4.9 inches dbh on the small end and at least 3.3 feet long.
Wood in any decay class is included in the measurement as long as it meets the size criteria.
This way of measuring down wood was used in DecAID because it best describes the abundance
of down wood as it relates to wildlife use (Mellen et al., 2006). “Down wood percent cover” is
one of the most precise and efficient means of recording amounts of down wood, and is the
measure most commonly used in research studies that investigate wildlife use of down wood. As
an illustration of how this measure is applied, one acre exhibiting 0.9 percent down wood cover
might contain:
One 30-inch dbh ponderosa pine down tree 100-feet long
One 20-inch dbh ponderosa pine down tree 80-feet long
One 15-inch dbh ponderosa pine down trees 60-feet long
Two 10-inch dbh ponderosa pine down trees 40-feet long
or, that same acre could also exhibit 0.9 percent down wood cover with one of the groups below:
4.0 - 20-inch dbh ponderosa pine down trees 80-feet long OR
6.7 - 15-inch dbh ponderosa pine down trees 60-feet long OR
16.7 - 10-inch dbh ponderosa pine down trees 40-feet long.
Crooked Mud Honey Project Wildlife Report Appendix C DecAID Report
Wildlife
15
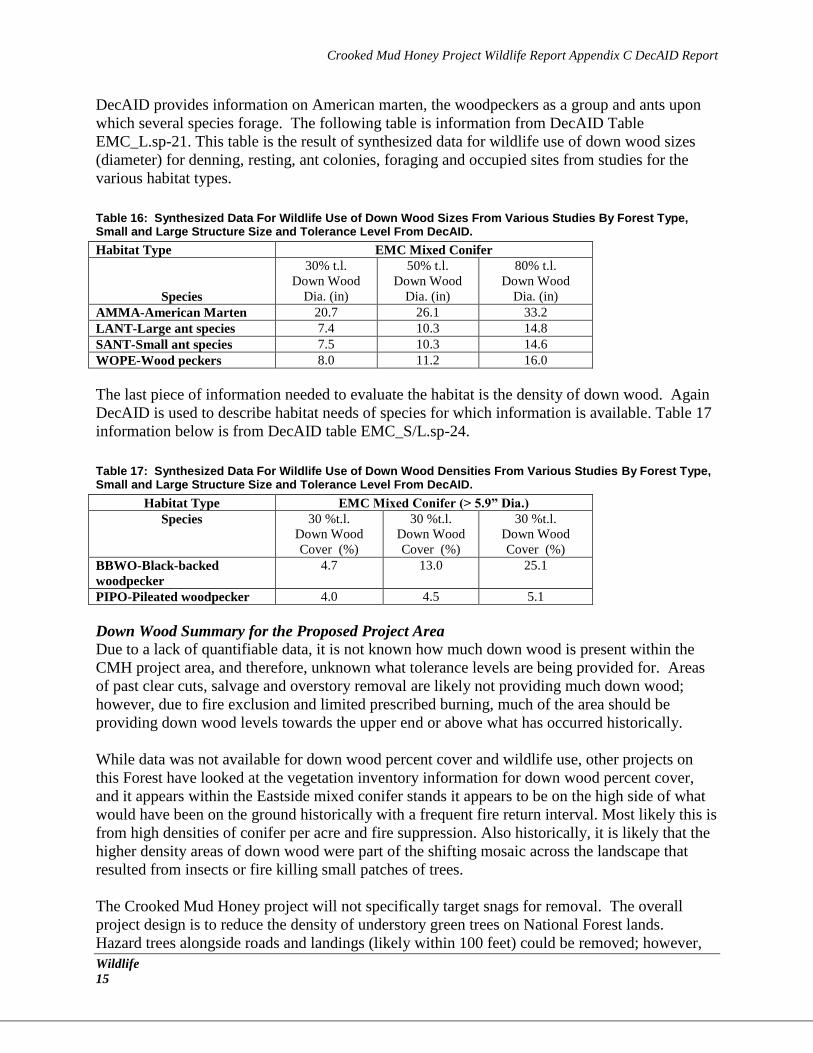
DecAID provides information on American marten, the woodpeckers as a group and ants upon
which several species forage. The following table is information from DecAID Table
EMC_L.sp-21. This table is the result of synthesized data for wildlife use of down wood sizes
(diameter) for denning, resting, ant colonies, foraging and occupied sites from studies for the
various habitat types.
Table 16: Synthesized Data For Wildlife Use of Down Wood Sizes From Various Studies By Forest Type, Small and Large Structure Size and Tolerance Level From DecAID.
Habitat Type EMC Mixed Conifer
Species
30% t.l.
Down Wood
Dia. (in)
50% t.l.
Down Wood
Dia. (in)
80% t.l.
Down Wood
Dia. (in)
AMMA-American Marten 20.7 26.1 33.2
LANT-Large ant species 7.4 10.3 14.8
SANT-Small ant species 7.5 10.3 14.6
WOPE-Wood peckers 8.0 11.2 16.0
The last piece of information needed to evaluate the habitat is the density of down wood. Again
DecAID is used to describe habitat needs of species for which information is available. Table 17
information below is from DecAID table EMC_S/L.sp-24.
Table 17: Synthesized Data For Wildlife Use of Down Wood Densities From Various Studies By Forest Type, Small and Large Structure Size and Tolerance Level From DecAID.
Habitat Type EMC Mixed Conifer (> 5.9” Dia.)
Species 30 %t.l.
Down Wood
Cover (%)
30 %t.l.
Down Wood
Cover (%)
30 %t.l.
Down Wood
Cover (%)
BBWO-Black-backed
woodpecker
4.7 13.0 25.1
PIPO-Pileated woodpecker 4.0 4.5 5.1
Down Wood Summary for the Proposed Project Area
Due to a lack of quantifiable data, it is not known how much down wood is present within the
CMH project area, and therefore, unknown what tolerance levels are being provided for. Areas
of past clear cuts, salvage and overstory removal are likely not providing much down wood;
however, due to fire exclusion and limited prescribed burning, much of the area should be
providing down wood levels towards the upper end or above what has occurred historically.
While data was not available for down wood percent cover and wildlife use, other projects on
this Forest have looked at the vegetation inventory information for down wood percent cover,
and it appears within the Eastside mixed conifer stands it appears to be on the high side of what
would have been on the ground historically with a frequent fire return interval. Most likely this is
from high densities of conifer per acre and fire suppression. Also historically, it is likely that the
higher density areas of down wood were part of the shifting mosaic across the landscape that
resulted from insects or fire killing small patches of trees.
The Crooked Mud Honey project will not specifically target snags for removal. The overall
project design is to reduce the density of understory green trees on National Forest lands.
Hazard trees alongside roads and landings (likely within 100 feet) could be removed; however,

Crooked Mud Honey Project Wildlife Report Appendix C DecAID Report
Wildlife
16
hazard trees that are felled in the interior of units would be retained to contribute to down wood,
and decrease the incentive to cut them.
The requirement to maintain felled hazard trees inside of units as down wood would help assure
that it is being provided for across the landscape. However, by re-introducing fire into these
stands, some of this would be consumed. As prescribed fire use is continued over time, the area
would be expected to provide down wood consistent with HRV levels, and also at levels
consistent with what the stand is capable of providing.
Continuation of Ecological Processes
The Silviculturist identified that many of the open stands are mainly past clear cuts, a technique
which the Forest does not currently practice. Past clear cuts that were reforested are moving
towards the small/medium structural stage, these stands will thin and in 10-20 years should
provide snags and down wood. Areas that were historically more open habitats are becoming
closed canopy. This is reducing vegetation diversity across the landscape. Removing
encroachment conifer will move sage steppe, meadows , mahogany stands and aspen habitats
back to historical conditions.
The CMH project is retaining existing snags (except hazard trees), and future snags are being
provided for by retention of stocked stands, 15-20% of each unit will be retained, and not
treating approximately 5,986 acres within the project boundary.
The CMH project is retaining existing down wood, and future down wood is being provided for
by retention of existing snags, and maintaining tree stocking levels within or at the high end of
the historical range of variability.
It is assumed that if snag numbers and distribution and down wood size and distribution are
similar to “natural” conditions, that we would be meeting the snag needs of cavity nesting birds
under the historic range of variability. Areas of past management activities (past harvest) are
likely deficient in snags. Therefore, stands that are currently stocked with commercial size trees
would likely be needed to meet snag dependent species requirements across the subsheds. This
is consistent with the proposed projects requirements to retain existing snags except where they
pose a safety issue.
References
Brown, James K., Elizabeth D. Reinhardt, and Kylie A. Kramer. 2003. Coarse woody debris:
Managing benefits and fire hazard in the recovering forest. Gen. Tech. Rep. RMRS_GTR-105.
Ogden UT. USDA, Forest Service, Rocky Mountain Research Station. 16p.
http://www.fs.fed.us/rm/pubs/rmrs_gtr105.pdf
Bull, Evelyn L., Catherine G. Parks, and Torolf R. Torgersen. 1997. Trees and Logs Important to
Wildlife in the Interior Columbia River Basin. Gen. Tech. Rep. PNW-GTR-391. Portland, OR:
U.S. Department of Agriculture, Forest Service, Pacific Northwest Research Station. 55p.
Mellen, Kim, Bruce G Marcot, Janet L. Ohmann, Karen L. Waddell, Elizabeth A. Willhite,
Bruce B. Hostetler, Susan A. Livingston, Catherine Ogden, and Tina Dreisbach. 2006. The

Crooked Mud Honey Project Wildlife Report Appendix C DecAID Report
Wildlife
17
DecAID repository: background information for DecAID, the decayed wood advisor for
managing snags, partially dead trees, and down wood for biodiversity in forests of Washington
and Oregon. USDA Forest Service, Pacific Northwest Research Station and Pacific Northwest
Region, Portland, Oregon. Available on-line at:
http://wwwnotes.fs.fed.us:81/pnw/DecAID/DecAID.nsf.
Powell, David C. 2010. Range of Variation Recommendations for Dry, Moist, and Cold Forests.
White Paper F14-SO-WP-SILV-3. Umatilla National Forest. Supervisor's Office, Pendleton,
OR
Thomas, Jack Ward. September, 1979. Wildlife Habitats in Managed Forests, the Blue
Mountains of Oregon and Washington. U.S.D.A. Agriculture Handbook No. 553. 512 pp.