appendix c midtown plaza market feasibility analysis
TRANSCRIPT

APPENDIX C
Midtown Plaza Market Feasibility Analysis


MIDTOWN PLAZA MARKET FEASIBILITY ANALYSIS &
10-YEAR DEMAND FORECAST ROCHESTER, NEW YORK
Prepared for the City of Rochester
By: Cushman & Wakefield, Inc.
August 2008

1
TABLE OF CONTENTS
Table of Contents A: Executive Summary ...................................................................................................2
Introduction....................................................................................................................2 Overview........................................................................................................................2 Methodology And Assumptions .....................................................................................3 Results...........................................................................................................................4 Forecast Assumptions ...................................................................................................6 Limiting Conditions ........................................................................................................7
B: Economic and Demographic Profile.........................................................................8 Overview........................................................................................................................8 Population Growth and Forecast ...................................................................................9 Employment Growth and Forecast ..............................................................................11
C: Office Market.............................................................................................................15 Market Inventory and Characteristics ..........................................................................15 Recent Performance....................................................................................................17
D: Residential Market....................................................................................................21 Market Inventory and Characteristics ..........................................................................21 Recent Performance....................................................................................................23
E: Retail Market .............................................................................................................27 Market Inventory and Charactersitics ..........................................................................27 Recent Performance....................................................................................................29
F: Hotel Market ..............................................................................................................30 Market Characteristics and Inventory ..........................................................................30 Recent Performance....................................................................................................32
G: Demand Forecasts ...................................................................................................34 Office Market Forecast ................................................................................................37 Residential Market Forecast........................................................................................39 Retail Market Forecast ................................................................................................41 Hotel Market Forecast .................................................................................................46 Conclusions.................................................................................................................48

2
EXECUTIVE SUMMARY
A: Executive Summary INTRODUCTION Cushman and Wakefield Inc. were retained to conduct a market feasibility analysis for the redevelopment of Midtown Plaza fronting on East Main and Broad Streets and Clinton Avenue in Downtown Rochester, Monroe County, New York, also referred to herein as the Subject Property. The objective of this study is to determine the overall potential square footage of office, residential, retail and hotel space that could be supported at the Subject Property over a 10-year time frame 2008-2017.
OVERVIEW Midtown Plaza, fronting on East Main Street, was designed by Victor Gruen as the first downtown enclosed mall in the 1960s and originally housed McCurdy’s and B. Forman department stores and complementary in-line stores. As envisioned by the developers, the mall was meant to counter the emerging trend of suburban plaza and strip malls that were being built. The centerpiece of the Midtown Plaza development was a clock that opens on the hour and half-hour to display scenes of dancing marionettes from 12 nations and aptly named the Clock of Nations. In addition to the retail space, the complex also included an 18-story office tower on the southeast side of the site that was occupied by many of the cities prominent law firms and other professional tenants.
Subsequently, Midtown Plaza has struggled to keep up with the challenging economic and demographic forces that saw Rochester’s employment base in manufacturing progressively dwindle and the continued movement of households away from the inner city and central Monroe County to the more distant suburbs and counties. Until recently the forces of suburbanization that the mall was intended to compete against have, in fact, had the upper hand in Rochester’s development.
There have been some initial signs that Rochester’s Downtown market area1 has begun to experience a gradual turnaround, a revitalization that shares many similarities with other downtowns in metropolitan areas across the nation. The redevelopment of Pittsburgh’s Golden triangle and Hartford’s Civic center are perhaps most comparable as these cities share similar population growth trends and have likewise been impacted by the movement and downsizing of large headquarter companies that symbolized the city’s prosperity.
The forces behind the revitalization of Rochester’s downtown are the same lifestyle factors and demographic trends that have spawned redevelopment in other markets. These include an increased backlash against suburban sprawl in favor of a lifestyle in
1 The Downtown market area is roughly defined as the area within the Inner Loop boundary.

3
EXECUTIVE SUMMARY
denser areas that favors an ease of social interaction, lower commute times and 24/7 living. As noted in this report, these lifestyle factors have been particularly embraced by younger age cohorts and Empty Nesters2. Projected demographic trends that evidence strong growth in the Empty Nesters as well as a continued decline in the average household size reinforce Downtown’s redevelopment potential.
Redevelopment in Downtown Rochester still faces considerable challenges as noted in this report and the pacing of potential development is likely to be very gradual. This market still lacks the critical mass of residents and 24/7 amenities that contribute to a lively live-work environment, and perceptions of the area remain somewhat negative. Construction costs for office development and residential are high and could make new development prohibitive without substantial subsidies. Additionally Rochester’s macroeconomic outlook is clouded by its heavy reliance on a few industries and continued declines in manufacturing employment in spite of increased diversification in its employment base.
METHODOLOGY AND ASSUMPTIONS Supply and demand conditions in the four property types (Office, Residential, Retail and Hotel) that affect the feasibility of the new development form the basis of the methodology used in this study. In addition to identifying key demand drivers for each property type, the study also gauges the competitiveness of existing area markets and assesses their potential impact on the Subject Project.
Three potential development scenarios were analyzed based on differing assumptions of Monroe County’s share of overall growth in employment and households relative to the Rochester Metropolitan Statistical Area (MSA)3.
• The Low scenario reflects the existing trends which have favored growth outside of the central city.
• The Base and High scenarios assume that new development in Downtown contributes to reverse this trend of higher growth in the outer suburbs. It is important to note that projected results for both the Base and High scenarios are contingent on the relocation of approximately 1,200 PAETEC’s employees to Downtown. The accompanying report further details the findings summarized in
2 The term Empty Nesters is used to describe the generally 50+ age households whose children have left home. 3 MSAs are delineated on the basis of a central urbanized area—a contiguous area of relatively high population density. The counties containing the core urbanized area are known as the central counties of the MSA (per US census). The Rochester MSA is comprised of the five counties of Livingston, Monroe, Ontario, Orleans and Wayne.

4
EXECUTIVE SUMMARY
the Executive Summary. The report should be read in its entirety, and its use is subject to the Limiting Conditions found on page 7.
RESULTS A summary of key results and assumptions for the forecast demand for the four property types is presented below.
OFFICE
• The three forecast scenarios result in new office-using employment gains, the main driver of office demand, ranging from 1,311 jobs in the Low to 4,330 jobs in the High for Monroe County over the 10-year period 2008 to 2017.
• Midtown Plaza, with PAETEC’s relocation, could capture two-thirds of this overall demand.
• This results in new demand for office space ranging from a low of 219,000 square feet to a high of 725,000 square feet using an average 250 square feet per office-using employee.
RESIDENTIAL
• The forecast for housing demand in Midtown Plaza is based on growth in household formation in Monroe County for various age groups and is reflective of the fact that housing demand varies by age.
• Demand is expected to be highest for Empty Nesters and young professionals resulting in a higher capture rate for these groups.
• Based on projected household growth under the three scenarios, housing demand for Midtown Plaza is expected to capture 20 percent of Downtown’s forecast housing demand over the 10-year period resulting in 239 units to 297 units.
RETAIL
• Retail development at Midtown Plaza is expected to be driven by the forecast for three demand generators: local households, office workers and tourists to Rochester.
• The total estimated demand from these three consumer groups, when compared against existing supply, is expected to result in retail expenditure demand potential ranging from $107 million to $123 million.
• This translates into development potential of retail space in Downtown of approximately 306,000 square feet in the Low to 338,000 square feet in the High

5
EXECUTIVE SUMMARY
of which Midtown Plaza is expected to capture 20 percent or just over 60,000 square feet.
HOTEL
• This forecast for hotel demand is driven by growth in overnight visitors to Rochester MSA and Downtown in particular. For the MSA as a whole these visitors are primarily comprised of business and convention travelers.
• Based on the recent historic annual growth rate of 1.2 percent, the projected increase in visitation is expected to result in hotel room demand that could support a 100-room hotel.
• Only one scenario is assumed since the number of overall visitors to Rochester, the main driver for hotel room demand is not expected to change significantly in the forecasts.

6
EXECUTIVE SUMMARY
FORECAST ASSUMPTIONS
• The forecasts for demand captured at the Subject Property assumes that necessary infrastructure, roads, clearings, utilities, parks, and permitting are in place to ensure that development can occur in a timely manner.
• The forecast of all property square footage assumes a steady long-term forecast of key economic and demographic variables that determine the overall demand for the four property types. While over time the economy is expected to revert to this long term trend, the volatility and inherent fluctuations in the business cycle could cause these variables and the forecast demand to depart for periods of time from the long term trend.
• In particular, the tightening in lending standards that has resulted from the sub-prime meltdown, if protracted, could significantly impact the near term outlook for the economy.
• Residential and retail estimates may vary depending on overall project design, environmental issues, zoning factors, flood zone parameters, and other unknown factors which could increase or decrease the number of units and/or amount of space allowed.
• Because the aforementioned and other assumptions as noted herein are subject to risks and uncertainties, actual results may differ materially from those expressed or implied by the report.
• The report is also subject to the Limiting Conditions found on the following page.

7
EXECUTIVE SUMMARY
LIMITING CONDITIONS "C&W" shall mean Cushman & Wakefield, Inc. or its affiliates that prepared the Report (or Deliverables). The Report will be subject to the following limiting conditions: 1. The Report is to be used in whole and not in part. No part of the Report shall be used in conjunction with
any other market study, report, or model. C&W disclaims any and all liability to any party other than the party that retained C&W to prepare the Report. Publication of the Report or any portion thereof without the prior written consent of C&W is prohibited. Except as may be otherwise stated in the letter of engagement to prepare the Report, the Report may not be used by any person other than the party to whom they are addressed or for purposes other than that for which they were prepared. No part of the Report shall be conveyed to the public through advertising, or used in any sales or promotional material without C&W's prior written consent.
2. In the event of a claim against C&W or its affiliates or their respective officers or employees in connection with or in any way relating to this Report or this engagement, the maximum damages recoverable shall be the amount of the monies actually collected by C&W or its affiliates for this Report and under no circumstances shall any claim for consequential damages be made.
3. The information in the Report reflects data available at the date set forth therein and does not reflect data or changes subsequent to that date. The information contained in the Report has been gathered by C&W from sources assumed to be reliable, including publicly available records. Because records of all transactions are not readily available, the information contained in the Report may not reflect all transactions occurring in the geographic area discussed. In addition, transactions that are reported may not be described accurately or completely in the publicly available records. C&W shall not be responsible for and does not warrant the accuracy or completeness of any such information derived from such publicly available records (or information relating to transactions that were not reported).
4. In connection with the Report, C&W made numerous assumptions with respect to industry performance, general business and economic conditions, and other matters. Any estimates or approximations contained therein could reasonably be subject to different interpretations by other parties. Because predictions of future events are inherently subject to uncertainty, neither C&W, nor any other person can assume that such predicted rental rates, absorption, or other events will occur as outlined or predicted in the Report. Reported asking rates of properties, replacement cost rents or estimated replacement costs do not purport to necessarily reflect the rental rates at which properties may actually be rented, actual rents required to support new development or the actual cost of replacement. In many instances, asking rents and actual rental rates differ significantly.
5. The forecast of all property square footage at the Subject Property assumes a steady long-term forecast of key economic and demographic variables that determine the overall demand. While over time the economy is expected to revert to this long term trend, the volatility and inherent fluctuations in the business cycle could cause these variables and the forecast demand to depart for periods of time from the long term trend.
6. The tightening in lending standards that has resulted from the sub-prime meltdown, if protracted, could negatively impact development at the Subject Property.
7. Changes in local, national or international economic conditions will affect the markets described in the Report. Therefore, C&W can give no assurance that occupancy and absorption levels and rental rates as of the date of the Report will continue or that such occupancy levels and rental rates will be attained at any time in the future. Forecasts of absorption rates, rental activity, replacement cost rents and replacement costs are C&W's estimates as of the date of the Report. Actual future market conditions may differ materially from the forecasts and projections contained therein.
8. C&W is a part of a national network of affiliated companies providing real estate services. As such, from time to time, C&W and its affiliates may have provided and in the future may provide real estate related services, including brokerage and leasing agent services, to the Client for whom it prepared the Report or its principals, or may represent the Client, its principals or others doing business with the Client or its principal.

8
ECONOMIC AND DEMOGRAPHIC PROFILE
B: Economic and Demographic Profile OVERVIEW An economic and demographic overview of the Rochester Metropolitan Statistical Area (MSA) provides the necessary backdrop to this study as growth in the overall economy and population of the MSA are the driving force for the demand analysis of the four real estate property types (office, retail, residential and hotel).
The Rochester MSA is comprised of the five counties of Livingston, Monroe, Ontario, Orleans and Wayne. Based on the latest statistics provided by the U.S. Census Bureau for 2007, the area is home to over 1,180,000 residents. Midtown Plaza is located in Monroe County which is by far the largest county within the MSA, with a population of approximately 729,681, representing over 60 percent of the MSA’s population.
Exhibit 1: Rochester MSA and Counties
Source: Nielsen Claritas, Cushman & Wakefield Analytics

9
ECONOMIC AND DEMOGRAPHIC PROFILE
POPULATION GROWTH AND FORECAST Data on population trends indicates that growth in the Rochester MSA has consistently lagged behind both the State and the U.S. averages. From 1990 to 2007 the MSA’s population declined by 0.1 percent in contrast to growth of 20.8 percent and 5.5 percent respectively for the U.S and New York State. Within the Rochester MSA, Monroe County’s population declined by a larger 0.7 percent over this period, while the outer counties grew by 1.1 percent, reflective of a trend that has seen growth continue to favor the outer suburban counties over Monroe County.
Also shown in Exhibit 2 is a comparison of the Rochester MSA with three other metropolitan areas, Detroit, Pittsburgh and Buffalo that share a similar high concentration of employment in manufacturing and that have likewise lagged the U.S. averages in population growth. The Rochester MSA has fared significantly better than Buffalo and Pittsburg and based on projections provided by Moody’s Economy.com is expected to maintain a stable population trend through 2017 in contrast to declines for the other metro areas (including Detroit). This result is partly due to the MSA’s ability to better diversify its economy from manufacturing as will be discussed in greater detail in the subsequent section.
Exhibit 2: Annual Population Growth Rates 1990-2017 Rochester vs. Benchmark Geographies
0.80
0.90
1.00
1.10
1.20
1.30
1.40
1990
1991
1992
1993
1994
1995
1996
1997
1998
1999
2000
2001
2002
2003
2004
2005
2006
2007
2008
2009
2010
2011
2012
2013
2014
2015
2016
2017
Inde
x 19
90=1
United States Buffalo Detroit Pittsburgh Rochester MSA New York
In this and subsequent graphs in this section, growth is indexed to 1990 for comparison purposes. Source: Moody’s Economy.com, US Census Bureau, Cushman & Wakefield Analytics

10
ECONOMIC AND DEMOGRAPHIC PROFILE
A more detailed analysis of the overall population trends reveals that for all four geographic areas (U.S., State, MSA and Monroe County) the highest growth rate from 2007 to 2017 is expected to be in the 55+ year group, a pattern forecast throughout the nation and that reflects the ageing of the baby boomer generation. In contrast both the 35-44 and 45-54 age groups are expected to decline. (Exhibit 3)
Exhibit 3: Annual Population Growth Rates by Age Group 2007-2017: U.S., NY, Rochester MSA, Monroe County
-2.0% -1.0% 0.0% 1.0% 2.0% 3.0%
Population: Ages 0-14
Population: Ages 15-24
Population: Ages 25-34
Population: Ages 35-44
Population: Ages 45-54
Population: Ages 55-64
Population: Ages 65 >
Monroe Rochester NY State U.S.
Source: Moody’s Economy.com, US Census Bureau, Cushman & Wakefield Analytics
The ageing of the population has important implications in terms of housing demand. Since couples without children are becoming the fastest-growing family type and represent a very large and important segment of the home-buying market, development is increasingly built to meet the needs of baby boomers now reaching their 50s and those who have already moved into the "empty nest" stage of life after their children leave home (Empty Nesters). As shown in the Exhibit 4, the 55-64 age group share of the overall population is expected to nearly double from roughly 8.0 percent in 1997 to almost 14 percent by 2017 in both Monroe County and the Rochester MSA.
Exhibit 4: Age Group Share of Total Population 2007-2017: Monroe County and Rochester MSA
Population: Ages 0-14 21.9% 18.6% 16.5% 21.9% 18.3% 15.9%
Population: Ages 15-24 13.3% 15.5% 16.1% 13.3% 15.3% 15.7%
Population: Ages 25-34 14.8% 11.7% 10.7% 14.5% 11.8% 11.7%
Population: Ages 35-44 16.2% 14.1% 13.1% 16.4% 14.2% 13.0%
Population: Ages 45-54 13.0% 15.2% 14.0% 13.1% 15.4% 14.1%
Population: Ages 55-64 7.9% 11.6% 13.8% 8.0% 11.7% 13.8%
Population: Ages 65 > 12.9% 13.4% 15.8% 12.7% 13.4% 15.9%
Monroe County Rochester MSA1997 2007 2017 1997 2007 2017
Source: U.S. Census Bureau, Moody’s Economy.com, Cushman & Wakefield Analytics.

11
ECONOMIC AND DEMOGRAPHIC PROFILE
EMPLOYMENT GROWTH AND FORECAST As with population, employment growth in the Rochester MSA economy has generally lagged the national average though it has been more in line with New York State’s. From 1990 to 2007 employment in the MSA averaged annual growth of only 0.3 percent compared to 1.4 percent for the nation and 0.3 percent for the State. For comparison purposes Pittsburgh grew by a stronger 0.6 percent annually, while Detroit and Buffalo lagged with growth of 0.2 and 0.0 percent respectively.
Exhibit 5: Index Employment Growth 1990-2017 Rochester compared to Benchmarks
0.90
0.95
1.00
1.05
1.10
1.15
1.20
1.25
1.30
1.35
1.40
1990 1993 1996 1999 2002 2005 2008 2011 2014 2017
Inde
x 19
90=1
Rochester MSA New York United StatesBuffalo MSA Pittsburgh MSA Detroit MSA
Source: U.S. Census Bureau, Moody’s Economy.com, Cushman & Wakefield Analytics.
Rochester’s overall economic performance over the 1990 to 2007 period is directly correlated with its employment base and distribution. As shown in Exhibit 6 while the Education and Health sectors make up the largest share of employment in the MSA, Manufacturing is still far more dominant in Rochester and Monroe County, at approximately a 14 percent share, compared to the nation and the state at 10 percent and 6 percent respectively. In contrast, Financial Services and Government are far less weighted in Rochester and Monroe County compared to New York.
Forecast

12
ECONOMIC AND DEMOGRAPHIC PROFILE
Exhibit 6: Employment Shares by Sector %, 2007 Monroe County vs. Benchmarks
22.2% 20.2% 18.4% 13.3%
15.7% 16.5% 17.4%19.3%
14.2% 14.3%6.3% 10.1%
13.7% 11.8%
13.0% 13.1%
12.7% 15.6%
17.1% 16.1%
7.4% 7.8%7.9% 9.8%
4.5% 4.3%8.5% 6.0%
3.9% 3.7% 4.1% 4.0%3.1% 3.5% 4.0% 5.5%
3.1% 2.2%2.2%2.6%
0.0%
10.0%
20.0%
30.0%
40.0%
50.0%
60.0%
70.0%
80.0%
90.0%
100.0%
Monroe County Rochester MSA NY State US
Education & Health Services Trade, Transportation, & Utilities ManufacturingProfessional & Business Services Government Leisure & HospitalityFinancial Activities Other Services ConstructionInformation
Source: U.S. Census Bureau, Moody’s Economy.com, Cushman & Wakefield Analytics.
Looking forward, the forecast provided by Moody’s Economy.com indicates that cutbacks in the manufacturing sector due to outsourcing will continue to act as an overall drag on growth. From 2007 to 2017 employment in this sector is forecast to decline by 6,700 and 8,100 jobs respectively for Monroe County and the Rochester MSA (Exhibit 7). These declines combined with forecast losses in the cyclical sectors such as professional and business services and financial activities (approximately 5,000 for the MSA and the County) is expected to offset gains in the less volatile education and health care sectors. As a result, office-using employment which is composed of those sectors that are the main occupants of office space (primarily finance, professional services, and a select subsectors within education and medical) is expected to be relatively flat in the forecast from 2007 to 2017 with projected gains of only 1,300 jobs for Monroe County and a slightly higher 2,600 jobs for the MSA.

13
ECONOMIC AND DEMOGRAPHIC PROFILE
Exhibit 7: Employment Gains by Sector, 2007, 2017 Monroe County and Rochester MSA
Monroe County Rochester MSA2007 2017 Change 2007 2017 Change
Total 398.0 393.7 -4.3 515.0 512.7 -2.3
Construction 12.4 11.2 -1.2 17.9 16.4 -1.4
Manufacturing 56.6 49.9 -6.7 73.7 65.6 -8.1
Trade, Transportation, & Utilities 62.7 61.7 -1.0 85.1 84.6 -0.4
Information 10.2 10.2 0.0 11.6 11.7 0.1
Financial Activities 18.1 16.1 -2.0 22.1 19.8 -2.3
Professional & Business Services 54.6 51.8 -2.8 60.7 57.9 -2.8
Education & Health Services 88.3 100.0 11.7 104.1 118.9 14.7
Leisure & Hospitality 29.3 29.8 0.5 40.0 41.3 1.3
Government 50.4 47.7 -2.7 80.3 77.1 -3.2
Office-Using Employment* (OUE) 119.8 121.1 1.3 139.5 142.1 2.6 Source: U.S. Census Bureau, Moody’s Economy.com, Cushman & Wakefield Analytics.
This forecast continues the secular trend in Rochester’s diversification away from the manufacturing base that once dominated this City with its reliance on employment from key industries like Kodak and Xerox. In 1997 manufacturing employment accounted for almost one in four jobs or 24 percent of employment in Monroe County. By 2017 this share is expected to fall by almost 50 percent to only 12.7 percent.
Exhibit 8: Employment Shares by Sector, 1997, 2007, 2017 Monroe County and Rochester MSA
Manufacturing 23.4% 14.2% 12.7% 22.5% 14.3% 12.8%
Education & Health Services 17.5% 22.2% 25.4% 16.3% 20.2% 23.2%
Trade, Transportation, & Utilities 15.4% 15.7% 15.7% 16.3% 16.5% 16.5%
Professional & Business Services 11.6% 13.7% 13.2% 10.3% 11.8% 11.3%
Government 11.6% 12.7% 12.1% 14.4% 15.6% 15.0%
Leisure & Hospitality 7.3% 7.4% 7.6% 7.5% 7.8% 8.1%
Financial Activities 4.7% 4.5% 4.1% 4.3% 4.3% 3.9%
Other Services 3.3% 3.9% 3.8% 3.1% 3.7% 3.7%
Construction 3.1% 3.1% 2.9% 3.2% 3.5% 3.2%
Information 2.2% 2.6% 2.6% 2.0% 2.2% 2.3%
Monroe County Rochester MSA1997 2007 2017 1997 2007 2017
Source: U.S. Census Bureau, Moody’s Economy.com, Cushman & Wakefield Analytics.

14
ECONOMIC AND DEMOGRAPHIC PROFILE
Another important trend evidenced in the forecast is Monroe County’s declining share of the overall Rochester MSA employment. As shown in Exhibit 9 Monroe County’s share of the overall Rochester MSA total employment (left axis) is projected to decline from 79.5 percent in 1997 to just below 77 percent by 2017. With respect to office-using employment, Monroe County’s share (right axis) is projected to decline from a peak of 87 percent in 2001 percent to 85 percent by 2017.
Exhibit 9: Monroe County Share of Overall Rochester MSA, 1997-2017
75.0%
75.5%
76.0%
76.5%
77.0%
77.5%
78.0%
78.5%
79.0%
79.5%
80.0%
1997 1999 2001 2003 2005 2007 2009 2011 2013 2015 2017
Mon
roe
Cou
nty
Sha
re o
f MS
A
80.0%
81.0%
82.0%
83.0%
84.0%
85.0%
86.0%
87.0%
88.0%
Mon
roe
Cou
nty
Sha
re o
f MS
A
Total Employment, Left Axis Office Using Employment, Right Axis
Source: U.S. Census Bureau, Moody’s Economy.com, Cushman & Wakefield Analytics
Forecast

15
OFFICE MARKET
C: Office Market MARKET INVENTORY AND CHARACTERISTICS The trend in overall employment growth away from the urban center and Downtown in favor of suburban areas has had a direct repercussion on the office market. From 1998 to 20074, the Rochester’s Downtown or Central Business District (CBD) market inventory for Class A space5 has remained essentially unchanged, totaling approximately 2 million square feet (msf). There have been no new significant additions to this market in over 10-years, since the completion of Bausch and Lomb headquarter building on Stone Street (One Bausch and Lomb Place).
Exhibit 10: Rochester Class A Office Characteristics, 1998-2007 CBD vs. Suburban Inventory
Denotes Years of Recession
0.00.51.01.52.02.53.03.54.04.5
1998 1999 2000 2001 2002 2003 2004 2005 2006 2007
Tota
l Inv
ento
ry, M
SF
CBD Suburban
Source: Pyramid Brokerage, Cushman & Wakefield Analytics
4 In this and subsequent charts, annual data through year-end 2007 is used. More recent quarterly data is not available for all property types and when available does not indicate significant differences form the trends identified using annual data. 5 Class A space is comprised of the most prestigious buildings competing for premier office users with above average rents for the area. Buildings have high-quality standard finishes, state-of-the-art systems, exceptional accessibility and suggest a definitive market presence.
The Downtown Rochester Alliance provides an extensive survey of the CBD market. Because there are slight differences in classifications of building classes numbers used in various reports are slightly different although overall trends are similar.

16
OFFICE MARKET
In contrast to the CBD, the suburban Class A market has experienced more steady growth increasing from approximately 2.3 msf in 1998 to 4.1 msf as of 2007. Some of the most significant additions to this market include the corporate campus which is the current home to PAETEC.
The market for Class B space consists primarily of older space and remains therefore far more heavenly concentrated in the CBD with approximately 4.2 msf of space, almost double the suburban market’s inventory of 2.9 msf (Exhibit 11). Many of the Class B buildings in the CBD are better suited for smaller tenants and for conversions to residential uses. The Temple Building (which once housed offices for the Masons) and the Michaels Sterns Buildings (a clothing manufacturer) have recently been converted and are part of the growing Downtown trend of office and commercial space conversions to residential uses.
Exhibit 11: Rochester Class B Office Characteristics, 1998-2007 CBD vs. Suburban Inventory
Denotes Years of Recession
0.00.51.01.52.02.53.03.54.04.55.0
1998 1999 2000 2001 2002 2003 2004 2005 2006 2007
Tota
l Inv
ento
ry, M
SF
CBD Suburban
0.00.51.01.52.02.53.03.54.04.55.0
1998 1999 2000 2001 2002 2003 2004 2005 2006 2007
Tota
l Inv
ento
ry, M
SF
CBD Suburban
Source: Pyramid Brokerage, Cushman & Wakefield Analytics
17
OFFICE MARKET
RECENT PERFORMANCE
VACANCY RATES
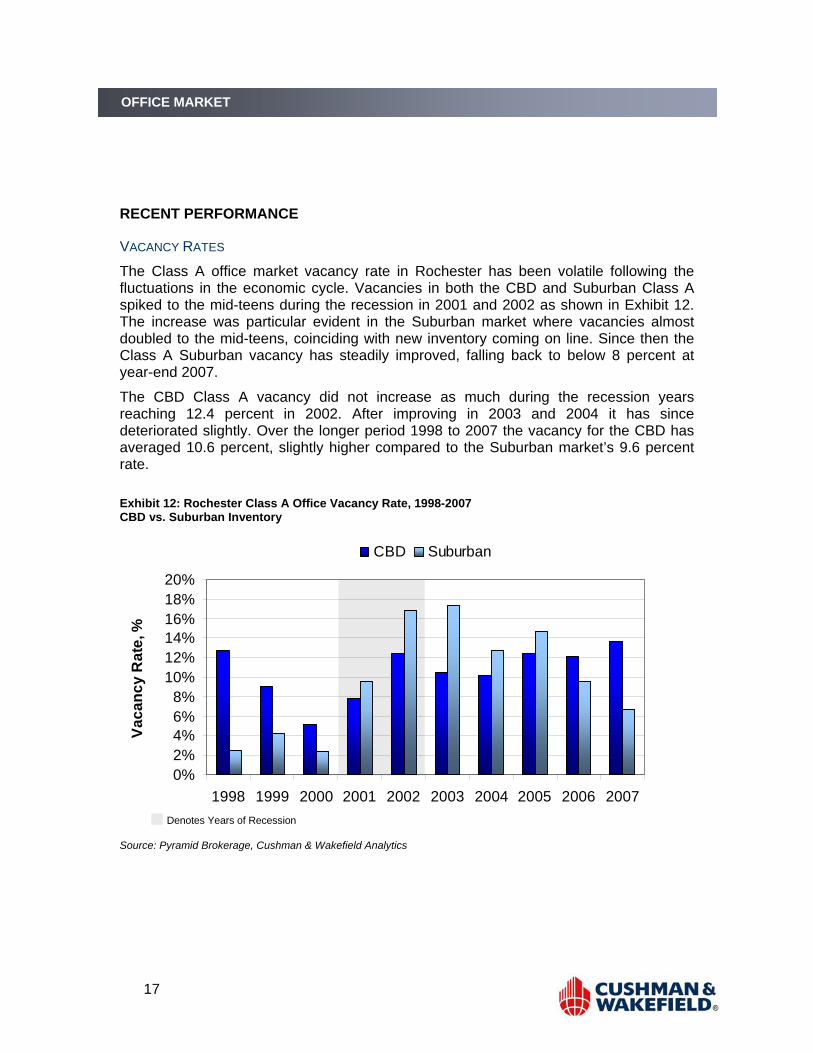
The Class A office market vacancy rate in Rochester has been volatile following the fluctuations in the economic cycle. Vacancies in both the CBD and Suburban Class A spiked to the mid-teens during the recession in 2001 and 2002 as shown in Exhibit 12. The increase was particular evident in the Suburban market where vacancies almost doubled to the mid-teens, coinciding with new inventory coming on line. Since then the Class A Suburban vacancy has steadily improved, falling back to below 8 percent at year-end 2007.
The CBD Class A vacancy did not increase as much during the recession years reaching 12.4 percent in 2002. After improving in 2003 and 2004 it has since deteriorated slightly. Over the longer period 1998 to 2007 the vacancy for the CBD has averaged 10.6 percent, slightly higher compared to the Suburban market’s 9.6 percent rate.
Exhibit 12: Rochester Class A Office Vacancy Rate, 1998-2007 CBD vs. Suburban Inventory
Denotes Years of Recession
0%2%4%6%8%
10%12%14%16%18%20%
1998 1999 2000 2001 2002 2003 2004 2005 2006 2007
Vaca
ncy
Rat
e, %
CBD Suburban
Source: Pyramid Brokerage, Cushman & Wakefield Analytics

18
OFFICE MARKET
Exhibit 13: Rochester Class B Office Vacancy Rate, 1998-2007 CBD vs. Suburban Inventory
Denotes Years of Recession
0%5%
10%15%20%25%30%35%40%
1998 1999 2000 2001 2002 2003 2004 2005 2006 2007
Vaca
ncy
Rat
e %
CBD Suburban
Source: Pyramid Brokerage, Cushman & Wakefield Analytics
Vacancies in the CBD and Suburban Class B market have remained considerably higher over the 1998 to 2007 period. Indicative of the scarce demand for this product, Class B vacancies averaged almost 30 percent in the CBD while the Suburban Class B market has averaged less than half at 13 percent.
ASKING RENTS
The CBD market has generally commanded the highest Class A asking rents in Rochester. While rents in suburban markets have remained below $20 per square foot (psf) over the 2002-2007 period, the CBD market has seen greater rental appreciation with average asking rents increasing to almost $21 psf as of 2007 with the upper end of the rental range closer to $25 psf for premium space on higher floors.

19
OFFICE MARKET
Exhibit 14: Rochester Class A Office Rental Rate, 1998-2007 CBD vs. Suburban Inventory
$0
$5
$10
$15
$20
$25
2002 2003 2004 2005 2006 2007
Avg
. Ask
ing
Ren
t, $
PSF
CBD Suburban
Source: Pyramid Brokerage, Cushman & Wakefield Analytics
In contrast to the moderate increase in Class A rents, average asking rents for Class B have declined in both the CBD and Suburban markets reflective of the high vacancies and scarcer demand for these older buildings as shown in Exhibit 15.
Exhibit 15: Rochester Class B Office Rental Rate, 1998-2007 CBD vs. Suburban Inventory
$0$2$4$6$8
$10$12$14$16
2002 2003 2004 2005 2006 2007
Avg
. Ask
ing
Ren
ts, $
PSF
CBD Non-CBD
Source: Pyramid Brokerage, Cushman & Wakefield Analytics

20
OFFICE MARKET
OCCUPIED SPACE
A measure of market demand is the change in occupied space over time. Since 1998 the CBD’s share of the overall occupied space in the Rochester market has been steadily declining. In 1998 the CBD Class A share was 42 percent but has since declined to only 31 percent. Conversely the Suburban market’s share of Class A occupied space has increased from 58 percent in 1998 to 69 percent in 2007. The CBD Class B share has held steadier hovering around 55-56 percent over the same time frame.
Exhibit 16: Rochester Share of Occupied Space, 1998-2007 CBD vs. Suburban Inventory
31%
42%
55%56%
0%
10%
20%
30%
40%
50%
60%
1998 1999 2000 2001 2002 2003 2004 2005 2006 2007
Sha
re o
f Occ
upie
d S
pace
%
CBD Share of Class A CBD Share of Class B
. Source: Reis, Cushman & Wakefield Analytics

21
RESIDENTIAL MARKET
D: Residential Market MARKET INVENTORY AND CHARACTERISTICS The Rochester housing market is comprised primarily of single-family and town homes which make up the vast majority of the total housing stock in all five counties. Single-family homes account for nearly 70 percent of the total 300,000 homes in the MSA with only small differences in the share in single-family among the five counties. Monroe County has a somewhat higher percentage of multi family homes reflective of the greater share of rental units versus owner-occupied units. Monroe County’s share at almost 33 percent is considerable higher than the other four counties. This is in large part due to the higher concentration of students and younger households in this County
As shown in Exhibit 17 the MSA as a whole has added approximately 40,000 new single-family homes over the 1990-2007 timeframe representing average annual growth of 0.8 percent. Monroe County’s growth has been lower than the MSA average, reflecting higher growth in the suburbs.
Exhibit 17: Rochester MSA Total Housing Units by County, 1990-2007
0
50
100
150
200
250
300
350
1990
1991
1992
1993
1994
1995
1996
1997
1998
1999
2000
2001
2002
2003
2004
2005
2006
2007
Sin
gle
Fam
ily H
omes
, 000
s
Monroe Livingston Ontario Orleans Wayne
Source: Moody’s Economy.com, Cushman & Wakefield Analytics
With respect to the Downtown Rochester market6, annual data from 2000 to 2007 indicates that the total number of new housing units has increased by approximately 480 6 Like most Downtown markets, Rochester’s Downtown is almost entirely comprised of multi-unit dwellings.

22
RESIDENTIAL MARKET
units, or annual rate of increase of 3.0 percent. Almost of all the new units are represented by rental units with the exception of the Sagamore on East with 34 new condominium for sale units.
Exhibit 18: Downtown Rochester Rental vs. Owner Occupied Housing, 2000
2007
-
500
1,000
1,500
2,000
2,500
3,000
2000 2001 2002 2003 2004 2005 2006 2007
Dow
ntow
n H
ousi
ng S
tock
Rental Owner Occupied
Source: Rochester Downtown Development Corporation (RDDC), Cushman & Wakefield Analytics

23
RESIDENTIAL MARKET
RECENT PERFORMANCE
PRICING
The average single-family home price within the MSA varies considerably among neighborhoods and counties. The highest home prices within the city limits are generally found southeast of the Inner Loop, in historic mansions along East Avenue, and neighborhoods like Corn Hill where median home prices exceed $200,000, and are considerably higher than the MSA average of $120,000. Outside the city limits, the suburban towns of Pittsford and Mendon (highlighted in dark green in Exhibit 19) have the highest overall median home prices, while the most affordable housing is in the outer counties of Orleans and Wayne where the median home price is roughly $100,000.
Exhibit 19: Rochester Median Home Price by Zip Code, 2007
Source: Nielsen Claritas, Cushman & Wakefield Analytics

24
RESIDENTIAL MARKET
As shown in Exhibit 20, the median single-family home price in the MSA has increased on average by approximately 2.0 percent per year since 1990 with the highest growth experienced in Ontario County at 3.0 percent, while Monroe County has experienced the slowest rate at roughly 2.0 percent.
More recently over the past five years from 2002-2007, the pace of appreciation has averaged about 5.0 percent annual growth which is still considerably lower than other parts of the country that have experienced double-digit growth rates. As a result of its continued housing affordability and the restrained pace of new development, Rochester is not expected to be as severely impacted by the housing downturn as much as other previously high demand parts of the nation.
Exhibit 20: Rochester Median Home Price by County, 1990-2007
$0
$20,000
$40,000
$60,000
$80,000
$100,000
$120,000
$140,000
1990
1991
1992
1993
1994
1995
1996
1997
1998
1999
2000
2001
2002
2003
2004
2005
2006
2007
Med
ian
Hom
e P
rice
Monroe Livingston Ontario Orleans Wayne
Source: Nielsen Claritas, Cushman & Wakefield Analytics

25
RESIDENTIAL MARKET
RENTS AND VACANCY
In terms of the rental market, the average asking rent for an apartment in the Rochester market area is approximately $734 per month or approximately $0.70-$0.80 per square foot using an average apartment size of 900 to 1000 sf. Among the various submarkets the Southeast Monroe and Brighton command the highest rents estimated at nearly $800 per month (Exhibit 21). According to the 2007 Survey of the Downtown Rental Market7 which surveys more than 2,200 units, rental apartment prices in Downtown Rochester ranged from $.050 psf to $1.76 psf with an average of $1.10 per square foot.
Exhibit 21: Rochester Rental Apartment Rates by Submarket, 2007
$0$100$200$300$400$500$600$700$800$900
CentralRochester
Brighton Irondequoit Greece SoutheastMonroe
Source: Nielsen Claritas, Cushman & Wakefield Analytics
7 The Survey of Downtown Housing Rental Market is published by the Downtown Rochester Development Corporation.

26
RESIDENTIAL MARKET
The average vacancy rate for rental units in the Rochester MSA was 4.0 percent in 2007, a decline of one percentage point from the previous year’s 5.0 percent rate. In Downtown Rochester the average vacancy rate of the surveyed properties was higher at 6.7 percent, up from 5.7 percent the previous year, although vacancies were concentrated in three buildings which accounted for nearly 60 percent of all vacant units.

27
RETAIL MARKET
E: Retail Market MARKET INVENTORY AND CHARACTERSITICS Shopping in Rochester is dominated by five large shopping malls with gross leasing areas (GLA) generally over 500,000 sf, all of which are located outside of the City as shown below.
Exhibit 22: Major Shopping Centers in the Rochester MSA 2007
Source: Nielsen Claritas, Cushman & Wakefield Analytics
Street-front retail in Rochester is very limited and located more prominently just east of the Inner Loop along East and Park Avenues and further south along Monroe Street as well as on high streets in towns like Pittsford. These street-front venues typically include a mix of restaurants, cafes, bookstores, and convenience stores along with some bountiful apparel and crafts shops. There is currently very little retail in the Inner Loop.

28
RETAIL MARKET
Where retail was once dominated by large department stores in Midtown Plaza, the Sibley Building and others, today it is mainly comprised of restaurants and fast food establishments catering to office workers. The absence of a grocery store is notable in the Inner Loop, although a Wegman’s was formerly located within Midtown Plaza.
Outside of the large shopping centers shown in Exhibit 22, Rochester’s community and neighborhood shopping center inventory8 totals approximately 10.6 msf. This market inventory has remained practically unchanged in the past eight years as indicated in Exhibit 23.
Exhibit 23: Rochester Community and Neighborhood Retail Inventory, 1999-2007
-
2.0
4.0
6.0
8.0
10.0
12.0
1999 2000 2001 2002 2003 2004 2005 2006 2007
Ret
ail M
arke
t Inv
ento
ry, M
SF
Source: Reis, Cushman & Wakefield Analytics
8 In contrast to the larger shopping malls, community and neighborhood centers have GLA’s less then 250,000 sf.
0.0

29
RETAIL MARKET
RECENT PERFORMANCE
ASKING RENTS AND VACANCY RATES
The lack of new construction along with increased demand has contributed to a decline in overall vacancies. From a peak of over 12 percent in 1999 the overall vacancy rate decreased to 7.0 percent in 2007. Concurrent with the declining vacancy rate, the average retail asking rent in Rochester has increased steadily from $12.00 psf to $13.55 psf from 1999 to 2007, an annual increase of 1.3 percent per year.
Exhibit 24: Rochester Community and Neighborhood Retail Asking Rents and Vacancy Rates, 1999-2007
$0.00
$2.00
$4.00
$6.00
$8.00
$10.00
$12.00
$14.00
$16.00
1999 2000 2001 2002 2003 2004 2005 2006 2007
Aski
ng R
ents
, $ P
SF
0.0
2.0
4.0
6.0
8.0
10.0
12.0
14.0
Vaca
ncy
Rate
%
Asking Rents Vacancy Rate
Source: Reis, Cushman & Wakefield Analytics

30
HOTEL MARKET
F: Hotel Market MARKET CHARACTERISTICS AND INVENTORY
The focus for the hotel market analysis is Monroe County since competition for hotel development in Midtown Plaza is expected to be limited primarily to properties in Downtown. The total Monroe County hotel market inventory is comprised of 60 hotel properties with 6,763 rooms9. The Downtown Inner Loop market area includes three major hotels, the Clarion, the Hyatt and the Rochester Plaza which combined account for 1,165 rooms. Outside of the Downtown and the airport hotels, most properties are small limited services facilities, averaging less than 100 rooms.
Monroe County’s hotel market inventory has remained stable in recent years. There have been only seven new hotel developments totaling 545 rooms since 2000, including most recently the Holiday Inn Express Hotel & Suites Rochester in Webster. New development has, however, been offset by closures or conversions of seven, mainly older, hotels over the same time period.
VISITOR STATISTICS
Hotel market fundamentals are driven by the number of overnight visitors, which are categorized into three major visitor segments: corporate/transient, convention/meeting and leisure. As indicated in Exhibit 25, the corporate and convention segments make up by far the majority of visitors at roughly 82 percent. Leisure is a small segment of overall demand as Rochester’s cold climate and relative remoteness are not supportive of leisure demand.
Exhibit 25: Rochester Visitors by Segment, 2005-2006
Corporate/Transient 795,000 44.2% 730,000 43.8%
Convention/Meeting/Tournament 675,000 37.5% 630,000 37.8%
Leisure Tourists 330,000 18.3% 305,000 18.3%
Total Visitors 1,800,000 100.0% 1,665,000 100.0%
Visitor Segments 2006 % Total 2005 % Total
Source: Greater Rochester Visitors Association, Cushman & Wakefield Analytics
9 Hotel room inventory is based on data from Smith Travel Research

31
HOTEL MARKET
The number of visitors to the Rochester area has grown at annual rate of 1.1 percent over the 1990 to 2007 period (Exhibit 26) although more recently from 2000 to 2006, growth has been stronger at over 2.0 percent per year. Visitor spending has increased at annual rate of 3.6 percent since 1990 though more recently overall spending has averaged a more moderate 3.0 percent since 2000. The average expenditure per visitor in 2006 was $160, very little changed since 2000, suggesting that even though the number of overall visitors has increased, the mix of visitors has shifted towards lower spending segments.
Exhibit 26: Rochester Total Visitors and Spending, 1990-2006
YEAR # of Visitors Visitor Spending
1990 1,500,000 $163,000,000
1991 1,420,000 $171,000,000
1992 1,420,000 $180,000,000
1993 1,433,000 $177,000,000
1994 1,460,000 $187,000,000
1995 1,521,000 $213,000,000
1996 1,450,000 $202,000,000
1997 1,525,000 $217,000,000
1998 1,520,000 $231,000,000
1999 1,560,000 $238,000,000
2000 1,560,000 $241,000,000
2001 1,410,000 $226,000,000
2002 1,475,000 $231,000,000
2003 1,550,000 $246,000,000
2004 1,627,000 $254,000,000
2005 1,665,000 $261,000,000
2006 1,800,000 $289,000,000
Avg Annual Growth1990-2006 1.1% 3.6%
Source: Greater Rochester Visitors Association, Cushman & Wakefield Analytics

32
HOTEL MARKET
RECENT PERFORMANCE
OCCUPANCY AND AVERAGE DAILY ROOM RATE (ADR)
Stronger visitation growth rates have helped improved hotel market fundamentals in Rochester10. Hotel occupancy which was below 60 percent in the recession years 2002 and 2003 has steadily improved reaching 63.7 percent at year-end 2007 on par with the U.S. average. The Average Daily Roomrate (ADR) has also increased but at $90 as of 2007 remains below the national average of approximately $100, as shown below.
Exhibit 27: Rochester Annual Hotel Occupancy and Average Daily Rates, 2002-20007
0.0
10.0
20.0
30.0
40.0
50.0
60.0
70.0
2002 2003 2004 2005 2006 2007
Occ
upan
cy %
$0
$10
$20
$30
$40
$50
$60
$70
$80
$90
$100
AD
R, $
Occupancy (%) ADR ($)
Source: Smith Travel Research, Cushman & Wakefield Analytics
As a result of lower ADR, revenue per available room, (RevPAR) a key measure of hotel performance averaged, $58 in 2007 (Exhibit 28). Though a significant improvement from $40 in 2002, this is still below the national average of $65 and generally not considered to be supportive of strong new hotel development.
10 Performance data specific to the three large hotels in Downtown is not available.

33
HOTEL MARKET
Exhibit 28: Hotel RevPAR Rochester vs. US, 2002-20007
$0
$10
$20
$30
$40
$50
$60
$70
2002 2003 2004 2005 2006 2007
Rochester U.S.
Source: Smith Travel Research, Cushman & Wakefield Analytics

34
DEMAND FORECASTS
G: Demand Forecasts Three forecast scenarios for potential development at Midtown Plaza are analyzed based on differing assumptions of Monroe County’s overall share of employment and household growth relative to the overall MSA. The premise of these assumptions is that the redevelopment of Midtown Plaza and Downtown can help to reverse the pattern that has favored suburban growth over Monroe County and Downtown Rochester. The factors supporting this reversal are discussed in the following section, along with potential risks. Outlined below are the three basic assumptions used to forecast the different scenarios.
In addition to the demand analysis, it is important to note that developer pro formas were analyzed separately in an overview report to determine whether the feasibility of new development could be attained from a financial analysis perspective.
• Low Scenario: Assumes baseline projections provided by Moody’s Economy.com. In this scenario the surrounding counties continue to increase their share of employment and households relative to Monroe County, consistent with recent historic trends.
• Base Scenario: Assumes that redevelopment in Downtown would enable Monroe County to maintain its share of the MSA’s households and employment at 2007 levels. Continued residential development and conversions combined with new office development attract new, younger households and Empty Nesters to Downtown. The pace is more moderate compared to the High Scenario. This scenario assumes PAETEC will relocate 1,200 employees to Midtown Plaza11.
• High Scenario: This scenario also assumes that PAETEC will relocate 1,200 employees to Midtown Plaza. Additionally the redevelopment in Downtown would enable Monroe County to capture a higher share of the MSA’s households and employment at 1997 levels. In this scenario, the redevelopment succeeds in
11 The Base and High Scenarios assume PAETEC’s 1,200 employees will occupy 300,000 SF. (1,200 x 250 sf per employee). If PAETEC occupies more space the resulting demand could be higher than indicated herein.

35
DEMAND FORECASTS
reversing the hemorrhaging of households and employment over the past decades. As result Downtown redevelopment occurs at a much more rapid pace.
These scenarios are reflective of both positive and negative factors that could impact development in Downtown.
Catalyst for Downtown Redevelopment
• Substantial public and private sector investment in downtown development estimated at over $700 million.
• PAETEC’s and the ESL Federal Credit Union planned relocations to Downtown and Midtown Plaza.
• Favorable demographic trends for residential development, with more single-family households and growth in the Empty Nester population.
• The East End of Downtown will continue to experience redevelopment.
• Existing stock of remarkable buildings suited for loft conversion.
• Available tax and financial incentives for development.
• Potential expansion of Convention Center and Redevelopment of Renaissance Square.
• Unanticipated uses and relocations to Midtown Block (new law school, school of architecture.
Risks for Downtown Redevelopment
• Still a somewhat negative perception of area, particularly north of Midtown Plaza.
• Scarce retail amenities.
• Vacant buildings and lack of critical residential mass and 24/7 amenities to create a vibrant buzz.
• Competition from other emerging residential markets particularly for younger households, from other neighborhoods like the South Wedge.

36
DEMAND FORECASTS
• High construction and renovation costs.
• Economic growth in Rochester is slower compared to other US markets particularly in the South Region that have been able to compete on a lower cost basis in attracting new businesses.

37
DEMAND FORECASTS
OFFICE MARKET FORECAST In order to asses support for new office construction and development at the Subject Property, the potential forecast demand for new office space is based on the change in office-using employment (OUE) since these employees are the occupants of office space.
As shown in Exhibit 29, all three scenarios reflect the forecast near-term weakness in the economy. Over the longer term from 2007 to 2017, however, OUE employment in the High Scenario is projected to be approximately 3,000 jobs higher than in the Low Scenario. As noted in the demand forecast this result reflects Monroe County capturing a higher share of the MSA total office-using employment.
Exhibit 29: Monroe County Office-Using Employment Growth, 2007-2017 Low, Base and High Scenarios
115,000
117,000
119,000
121,000
123,000
125,000
2007 2008 2009 2010 2011 2012 2013 2014 2015 2016 2017
Offi
ce-U
sing
Em
ploy
men
t
Low Base High
Source: Moody’s Economy.com, Cushman & Wakefield Analytics
For each scenario the total demand square footage is obtained by multiplying the yearly change in OUE for the Rochester MSA by an average 250 sf per employee.
• The 250 sf per employee ratio is reflective of space usage in a Class A building as envisioned for PAETEC’s headquarter building.
• The Base and High Scenarios also assume the relocation of 1,200 PAETEC employees to Midtown Plaza and results in a higher capture rate of two-thirds of employment in Downtown compared to the current estimated average of approximately one-half.
• Additional demand for office space by PAETEC, above the projected 300,000 sf, would further augment this demand.

38
DEMAND FORECASTS
• The difference between the three employment scenarios results in office development potential for Downtown ranging between 220,000 sf and 725,000 sf square feet as shown below.
Exhibit 30: Monroe County and Midtown Plaza Change in Occupied Space, 2008-2017 Low, Base and High Scenarios
Low 119,780 121,091 1,311 1.1% 327,640 219,519
Base 119,780 123,243 3,462 2.9% 865,530 579,905
High 119,780 124,111 4,330 3.6% 1,082,547 725,306
Monroe County Downtown*2008 2017 Change % Chg Change in Occupied Capture
Space@ 250 psf @ 2/3 OUE Employment (Rounded)
Source: Moody’s Economy.com, Cushman & Wakefield Analytics
The forecast for new office development at Midtown Plaza is highly dependent on PAETEC’s relocation to this site. As shown in the Low scenario, the projected growth in office-using employment would only support additional demand for approximately 220,000 sf over the 2008 to 2017 period. Given Downtown’s existing market inventory and vacancy, this demand could be accommodated within existing occupancies without any need for new development.
The Base and High Scenarios, with PAETEC as anchor tenant at Midtown Plaza occupying 300,000 sf, contributes to draw additional demand into Downtown and results in total demand for 580,000 sf in the Base and 725,000 sf in the High scenario. As noted, the High Scenario is predicated on the assumption that Monroe County and Downtown share of the MSA employment reverts to 1997 levels. This should be viewed as an aggressive forecast and considered a best-case scenario.

39
DEMAND FORECASTS
RESIDENTIAL MARKET FORECAST The main demand driver for residential demand is the projected growth in households. Simialr to the office forecast the scenarios assume three different shares for Monroe County’s overall household growth within the MSA. The Low Scenario asuumes that the current pattern of suburbanization, with households continuing to move away from Monroe County will continue, while the Base and High assume that new development in Downtown Rochester will be successful in retaining Monroe County’s share of households at 2007 and 1997 levels respectively. The forecast is then derived as follows:
• Since housing demand and characteristics vary by age, for each scenario growth in Monore County households is determined for 10-year age groups. As shown in Exhibit 31 the highest growth in all scenarios is expexted to be in the 65+ years group, with the total new hosueholds ranging from 7,500 to 12,500.
Exhibit 31: Monroe County Household Growth 000’s, 2007-2017 Low, Base and High Scenarios
Low 2007-2017 Base 2007-2017 High 2007-20172007 2017 Change 2007 2017 Change 2007 2017 Change
HOUSEHOLDS (000’s)
Ages 15-24 18.9 19.6 0.7 18.9 19.4 0.5 18.9 19.2 0.3
Ages 25-34 42.7 39.2 -3.4 42.7 42.4 -0.2 42.7 43.7 1.1
Ages 35-44 36.8 34.1 -2.7 36.8 33.7 -3.1 36.7 33.5 -3.2
Ages 45-54 39.7 36.5 -3.2 39.7 36.5 -3.2 39.7 36.7 -3.0
Ages 55-64 42.4 50.5 8.2 42.4 50.0 7.7 42.4 49.9 7.6
Ages 65 > 49.2 57.8 8.6 49.2 58.4 9.2 49.2 59.2 10.0
Total 210.7 218.2 7.5 210.7 221.1 10.4 210.7 223.2 12.5
Source: Moody’s Economy.com, Cushman & Wakefield Analytics
In addition to the growth in households the following factors were also considered:
• A measure of the internal churn or household move within the market, estimated at 13.3 percent based on Census data, is applied to all households within Monroe County. This measures the inter-market demand for housing within Monroe County.
• For example in the 65+ years group, the total projected households in the Low Scenario 57,800 is multiplied by 13.3 percent to yield potential new household demand of approximately 8,600 units based on internal churn (Exhibit 31).
• A capture rate that reflects the differences in propensity of the various age groups to relocate to downtown is then used.

40
DEMAND FORECASTS
• The highest capture rate (between 5 to 6 percent) is applied to the younger 25-34 age group and Empty Nesters, reflective of their lifestyle preferences. The lowest capture rate (1 to 2 percent) is applied to the 35-54 age group which consists primarily of families with children who are less likely to relocate to Downtown as shown in Exhibit 32. The Base and High scenarios assume slightly higher capture rates for all age groups compared to the Low.
Exhibit 32: Midtown Plaza Household Capture Rate, 2007-2017 Low, Base and High Scenarios
Low Base HighHOUSEHOLDS Demand Capture Total Demand Capture Total Demand Capture Total
Ages 15-24 2,613 5% 131 2,575 6% 142 2,552 6% 154
Ages 25-34 5,219 5% 261 5,644 6% 310 5,817 6% 352
Ages 35-44 4,540 2% 91 4,483 2% 99 4,463 2% 108
Ages 45-54 4,856 1% 49 4,857 1% 53 4,885 1% 59
Ages 55-64 6,724 4% 269 6,658 4% 293 6,646 4% 322
Ages 65 > 7,686 5% 384 7,772 6% 427 7,879 6% 477
Total 31,638 1,184 31,989 1,324 32,240 1,472
Midtown Plaza @ 20% 236 264 294
Numbers may not add due to rounding Source: Moody’s Economy.com, Cushman & Wakefield Analytics
• This results in estimated housing demand over the 10-year forecast period 2007 to 2107 for Downtown ranging from 1,184 in the Low to 1,472 units in the High Scenario.
• Midtown Plaza’s share is estimated at 20 percent and results in projected demand ranging from 236 to 294 housing units or about 20 to 30 units per year, comparable in size to the new Sagamore condominiums.
It is impartant to note that while new office development is highly dependent on PAETEC’s relocation to Midtown, the forecast demand for housing is not as dependant on an anchor office tenant relocating to Midtown Plaza.
The demand is reflective of the gradual revitalization of the Downtown residential market and assumes that the demographc trends will continue to increase demand for this type of housing particulary among Empty Nesters and young professionals. While PAETECs relocation of young employees to this market would augment this demand, the 1,200 employees constitute only a small fraction of the 31,000 overall households in Monroe County from which housing demand in Downtown will most heavily draw from.

41
DEMAND FORECASTS
RETAIL MARKET FORECAST
The forecast for retail demand in Downtown and Midtown Plaza is based on the forecast demand and spending from three main consumer segments: new and exisitng households, office workers, and visitors to Downtown. The three forecast scenarios for households and office workers in Downtown derived previosuly result in a range of development potential for retail space at Midtown Plaza.
The demand for each of these three groups is described herein.
EXISTING AND NEW RESIDENT EXPENDITURE POTENTIAL
The total expenditure potential of existing residents is based on the Effective Buyuing Income (EBI) of local residents in Downtown. This is defined as the the 0.5 mile radius from Midtown Plaza which corresponds roughly to the Inner Loop area12. Demand from current and future hosueholds is determined as follows
• The total expediture potential of the approximately 2,000 exisitng households is provided by Claritas Inc for major retail catoegories as shown below in Exhbit 33.
• In addtion to the current local residents estimated by Claritas, the new residents in this markets (based on the three forecasts for new housing demand derived previously which show new households ranging from 1,184 to 1,472) are added to the exisitng households. The new households are expected to have EBI’s 25 percent higher than exisitng residents since redevelopment is expected to attract a wealthier mix of young preofessionals and Empty Nesters.
12While some demand could be generated from residents outside of the Inner Loop it is likely to be small given that there are numerous retail venues outside of the 0.5 mile radius providing stiff competition. Additionally, since the scenarios already assume that the Downtown market captures a share of residents and employees from outside the County, this secondary demand is already incorporated into the forecasts.

42
DEMAND FORECASTS
The estmitated total expenditure potential for new and exisitng households in the 0.5 mile radius is estimated to range from $71 million to $78 million. As indicated below food and beverage stores (groceries) are expected to have the highest demand potential
Exhibit 33: Retail Sales Household Demand Potential Low, Base and High Scenarios
Total Retail Sales & $71,133,814 $74,584,679 $78,206,153 Eating, Drinking Places
Furniture & Home $1,281,320 $1,343,480 $1,408,713 Furnishings Stores
Electronics & $1,829,377 $1,918,124 $2,011,259 Appliance Stores
Food & Beverage $10,453,177 $10,960,285 $11,492,464 Stores
Health & Personal $4,183,733 $4,386,695 $4,599,692 Care Stores
Clothing & Clothing $3,002,832 $3,148,506 $3,301,383 Accessories Stores
Sporting Gds, Hobby, $1,642,413 $1,722,090 $1,805,707 Book, Music Stores
Miscellaneous Store $1,777,998 $1,864,253 $1,954,772 Retailers
Foodservice & $8,279,500 $8,681,157 $9,102,673 Drinking Places
Household DemandLow Base High
Source: Nielsen Claritas, Cushman & Wakefield Analytics
OFFICE WORKER EXPENDITURE POTENTIAL
The potential expenditure for Downtown employees is based on the estimated current 50,000 workers along with the forecasts for new office workers in the office demand section which resulted in a range of 878 to 2,800 new office workers.
• The expenditures of these office workers on various retail categories is determined using a survey of weekly spending patterns for office workers conducted by the International Council of Shopping Centers (ISCS) and adjusted for inflation to obtain 2007 estimates.
• The average weekly expenditures $69 are multiplied by 48 workweeks to obtain total annual expenditures of $3,331 per worker.
• The total retail expenditures from office workers are therefore estimated to range from $169 million (50,878 employees x $3,331 spent per worker) to $176 million (52,901 employees X $3,331) as shown in Exhibit 34.

43
DEMAND FORECASTS
• As indicated in the survey the majority of retail expenditures are for lunch and eating and drinking places.
Exhibit 34: Retail Sales Office Worker Demand Potential Low, Base and High Scenarios
Total Retail Sales & $169,499,060 $174,301,529 $176,239,136 Eating, Drinking Places
Furniture & Home $7,538,592 $7,752,186 $7,838,362 Furnishings Stores
Electronics & $10,763,063 $11,068,016 $11,191,053 Appliance Stores
Food & Beverage $17,213,200 $17,700,907 $17,897,677 Stores
Health & Personal $15,061,550 $15,488,294 $15,660,468 Care Stores
Clothing & Clothing $17,667,039 $18,167,604 $18,369,563Accessories Stores
Sporting Gds, Hobby, $9,663,069 $9,936,855 $10,047,318 Book, Music Stores
Miscellaneous Store $3,856,188 $3,965,446 $4,009,528Retailers
Foodservice & $87,736,360 $90,222,221 $91,225,168 Drinking Places
Office Worker DemandLow Base High
Source: Nielsen Claritas, Cushman & Wakefield Analytics
TOURISM AND VISITOR EXPENDITURE POTENTIAL
Retail demand from tourists and overnight visitors to Downtown are also expected to provide support for retail development. There were an estimated 358,000 hotel visitors in Downtown Rochester in 2007. The total expenditure potential for these visitors was obtained as follows:
• The average visitor expenditure on food and beverage and retail, based on data provided by the Greater Rochester Visitors Association and estimated at $52.78, was used to calculate the expenditure potential from tourists and business visitors.

44
DEMAND FORECASTS
• This results in estimated total retail demand potential from visitors of $18.9 million (358,000 visitors x $52.78), of which 50 percent is assumed to be captured within the Downtown market.
• In addition to food and beverage, 50 percent of the $36.67 of expenditures on the Transportation/Retail category reported by the Greater Rochester Visitors Association is assumed to be spent on retail categories such as clothing and miscellaneous retailers.
Exhibit 35: Retail Sales Office Visitor Demand Potential Low, Base and High Scenarios
Total Retail Sales & $16,046,091 $17,982,809 $17,982,809 Eating, Drinking Places
Furniture & Home Furnishings Stores
Electronics & Appliance Stores
Food & Beverage Stores
Health & Personal Care Stores
Clothing & Clothing $3,288,950 $3,685,917 $3,685,917 Accessories Stores
Sporting Gds, Hobby, Book, Music Stores
Miscellaneous Store $3,288,950 $3,685,917 $3,685,917 Retailers
Foodservice & $9,468,190 $10,610,974 $10,610,974 Drinking Places
Visitor DemandLow Base High
Source: Nielsen Claritas, Cushman & Wakefield Analytics
OVERALL RETAIL DEMAND AND EXISTING SUPPLY
The three demand components of retail demand (households, office workers and tourists) are summed to obtain the demand potential for the three scenarios. This demand is then compared to the existing supply in order to determine unmet demand (opportunity gaps) than can support new retail completions. As shown in Exhibit 36, the opportunity gaps are expected to range from $107 million to $128 million.

45
DEMAND FORECASTS
Exhibit 36: Retail Sales Total Demand Potential, Existing Supply and Opportunity Gaps Low, Base and High Scenarios
Total Retail Sales & $256,678,965 $266,869,017 $272,428,098 $149,335,087 $107,343,878 $117,533,930 $123,093,011Eating, Drinking Places
Furniture & Home $8,819,912 $9,095,665 $9,247,075 $2,690,583 $6,129,329 $6,405,082 $6,556,492 Furnishings Stores
Electronics & $12,592,440 $12,986,140 $13,202,312 $6,750,863 $5,841,577 $6,235,277 $6,451,449 Appliance Stores
Food & Beverage $27,666,377 $28,661,192 $29,390,141 $2,222,049 $25,444,328 $26,439,143 $27,168,092 Stores
Health & Personal $19,245,283 $19,874,989 $20,260,160 $9,863,036 $9,382,247 $10,011,953 $10,397,124 Care Stores
Clothing & Clothing $23,958,821 $25,002,028 $25,356,863 $9,941,171 $14,017,650 $15,060,857 $15,415,692 Accessories Stores
Sporting Gds, Hobby, $11,305,482 $11,658,946 $11,853,024 $14,364,872 $(3,059,390) $(2,705,926) $(2,511,848)Book, Music Stores
Miscellaneous $8,923,136 $9,515,616 $9,650,217 $13,357,456 $(4,434,320) $(3,841,840) $(3,707,239)Store Retailers
Foodservice & $105,484,050 $109,514,353 $110,938,815 $29,115,723 $76,368,327 $80,398,630 $81,823,092Drinking Places
Total Demand* Existing Supply* Opportunity GapLow Base High Low Base High
Numbers may not add due to rounding Source: Nielsen Claritas, Cushman & Wakefield Analytics
In order to determine the overall square feet of supportable new retail space, the unmet demand in the market for the three scenarios is divided by an estimate of the sales per square foot necessary to support retail development.
• These estimates range from a low of approximately $261 psf for furniture to $689 for health and convenience stores.
• As shown in Exhibit 37 this results in supportable completions within the 0.5 mile radius between 306,000 sf and 338,000 sf with food and drinking establishment accounting for over half of the potential development.
Within the Inner Loop market, Midtown Plaza is assumed to capture 20 percent of the overall demand or a range of between 62,000 and 68,000 sf of retail. This estimate and the ultimate mix of retailer could vary based on the retail offering at other competitive sites within Midtown, such as Renaissance Square.

46
DEMAND FORECASTS
Exhibit 37: Total Retail Sales Gap, Sales PSF and Supportable Completions Low, Base and High Scenarios
$107,343,878 $117,533,930 $123,093,011 - 308,230 328,943 337,694
$6,129,329 $6,405,082 $6,556,492 $261 23,509 24,567 25,148
$5,841,577 $6,235,277 $6,451,449 $392 14,886 15,889 16,440
$25,444,328 $26,439,143 $27,168,092 $458 55,522 57,693 59,283
$9,382,247 $10,011,953 $10,397,124 $689 13,609 14,522 15,081
$14,017,650 $15,060,857 $15,415,692 $343 40,904 43,948 44,983
$(3,059,390) $(2,705,926) $(2,511,848) $305 (10,029) (8,870) (8,234)
$(4,434,320) $(3,841,840) $(3,707,239) $344 (12,889) (11,167) (10,776)
$76,368,327 $80,398,630 $81,823,092 $418 182,718 192,361 195,769
Total Gap Total Downtown Supportable Completions SF*Low Base High Sales PSF Low Base High
Total Retail Sales & Eating, Drinking Places
Furniture & Home Furnishings Stores
Electronics & Appliance Stores
Food & Beverage Stores
Health & Personal Care Stores
Clothing & Clothing Accessories Stores
Sporting Gds, Hobby, Book, Music Stores
Miscellaneous Store Retailers
Foodservice & Drinking Places
Source: Nielsen Claritas, Cushman & Wakefield Analytics
HOTEL MARKET FORECAST Demand for new hotel rooms is predicated on the growth in overnight visitors to Rochester from three demand segments, corporate, meeting/convention and overnight leisure travelers. This is qauntified in the following manner:
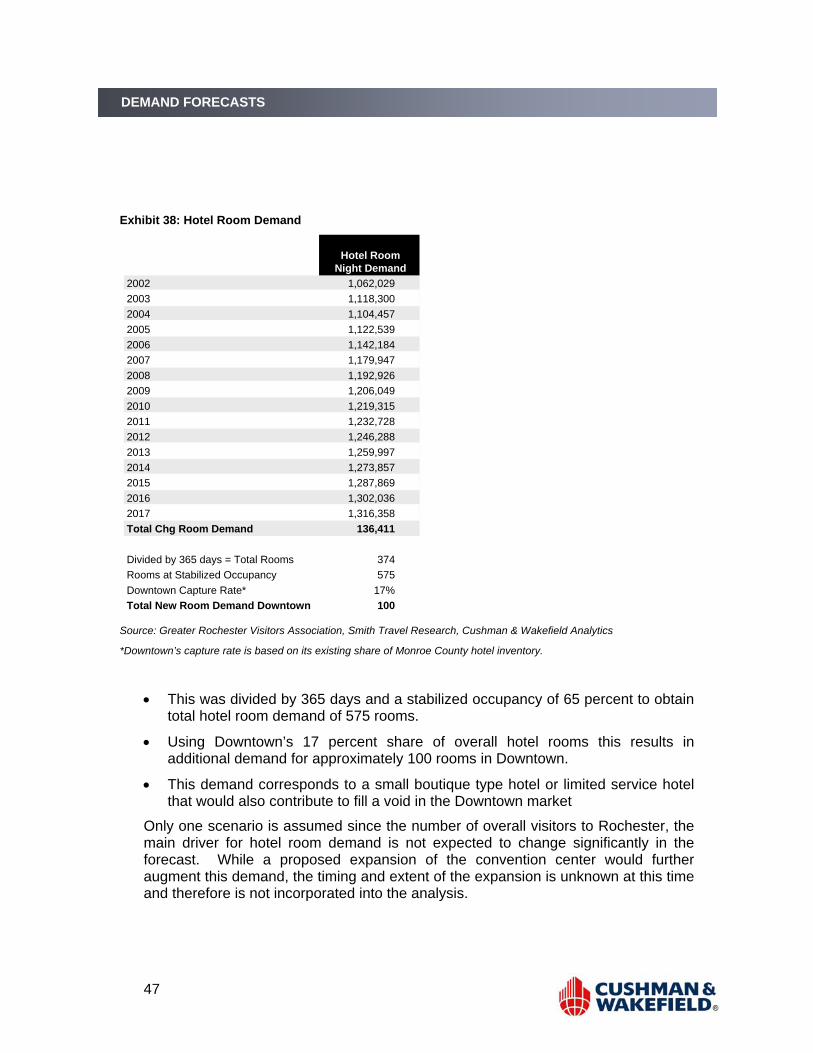
• The average growth rate of 1.1 percent in overall visitors to Rochester (page 31) was applied to overall room night demand resulting in an incremental room night demand of 136,411 btween 2007 and 2017.
47
DEMAND FORECASTS
Exhibit 38: Hotel Room Demand
Hotel RoomNight Demand
2002 1,062,029 2003 1,118,300 2004 1,104,457 2005 1,122,539 2006 1,142,184 2007 1,179,947 2008 1,192,926 2009 1,206,049 2010 1,219,315 2011 1,232,728 2012 1,246,288 2013 1,259,997 2014 1,273,857 2015 1,287,869 2016 1,302,036 2017 1,316,358 Total Chg Room Demand 136,411
Divided by 365 days = Total Rooms 374 Rooms at Stabilized Occupancy 575 Downtown Capture Rate* 17%Total New Room Demand Downtown 100
Source: Greater Rochester Visitors Association, Smith Travel Research, Cushman & Wakefield Analytics
*Downtown’s capture rate is based on its existing share of Monroe County hotel inventory.
• This was divided by 365 days and a stabilized occupancy of 65 percent to obtain total hotel room demand of 575 rooms.
• Using Downtown’s 17 percent share of overall hotel rooms this results in additional demand for approximately 100 rooms in Downtown.
• This demand corresponds to a small boutique type hotel or limited service hotel that would also contribute to fill a void in the Downtown market
Only one scenario is assumed since the number of overall visitors to Rochester, the main driver for hotel room demand is not expected to change significantly in the forecast. While a proposed expansion of the convention center would further augment this demand, the timing and extent of the expansion is unknown at this time and therefore is not incorporated into the analysis.

48
DEMAND FORECASTS
CONCLUSIONS A summary of the development potential for Midtown Plaza, based on the preceeding analysis of the demand generators13 for each property type and the share of overall demand that can be captured here is presented in Exhibit 38.
Exhibit 38: Hotel Room Demand
Property Type Low Base High
Office (SF) 220,000 580,000 725,000
Residential (Units) 236 265 294
Retail (SF) 61,600 65,800 67,600
Hotel ( Rooms) 100 100 100
Source: Cushman & Wakefield Analytics
As noted the Base and High Scenario assume that Monroe County can stabilize and increase its share of overall employment and population in the Rochester MSA, reversing a trend that has favored suburban growth over the denser urban Downtown market. In particular, with respect to residential development, the premise for Downtown Rochester’s revitalization is the strong appeal of urban living within specific segments of the population as seen in other Downtown market areas in the nation.
Downtown Rochester’s revitalization is already underway but significant challenges remain. Retail offerings are scarce in this market, reflective of the adage that retailers follow roof-tops. Retail will be an essential to creating a vibrant live-work environment that draws more residents to the area outside of early pioneers. In addition, Rochester’s economy, though performing considerable better than the economy of other upstate New York MSAs, remains sluggish and must compete with faster growing economies to attract young workers that will likely be the area’s main residents. While new development in Downtown can help create a more attractive and vibrant environment that will help retain young professionals, Rochester’s ability to create jobs and provide economic stability will be vital to its redevelopment.
13 The feasibility of development from a construction and financial pro forma perspective is detailed in the accompanying overview report.