appendix d sustainability baseline assessment...
TRANSCRIPT

AIRPORT MASTER PLAN – Monterey Regional Airport
SUSTAINABILITY BASELINE ASSESSMENT D-1 DRAFT-FEBRUARY 2015
Appendix D SUSTAINABILITY BASELINE ASSESSMENT Monterey Regional Airport The purpose of this Baseline Assessment is to provide an assessment of Monterey Regional Airport’s (MRY or Airport) current sustainability performance as determined by its related activities, policies, and procedures. This evaluation is an important first step in the devel-opment of the Airport’s long-term sustainability strategy that will support the economic vitality of the airport, ensure the efficient use of limited resources, reduce negative envi-ronmental impacts, and enhance the social well-being of the community. It will also enable the Airport to measure, through existing and new metrics, its overall sustainability perfor-mance over time as well as the impact of individual initiatives. SUSTAINABILITY AND THE FEDERAL AVIATION ADMINISTRATION In recognition of the Airport’s commitment to sustainability, the Airport received a grant through the Federal Aviation Administration’s (FAA’s) Airport Improvement Program to prepare a Sustainable Airport Master Plan. Through this program, FAA provides funding for the development of sustainable master plans or sustainable management plans, which are standalone documents that integrate sustainability principles into the airport planning process. Sustainable master and management plans make sustainability a central focus in the planning process, which generates strategies to achieve economic benefits, enhance operational efficiency, increase community involvement, and reduce negative environmen-tal impacts. Further information on the FAA’s approach to sustainable master planning can be accessed at: http://www.faa.gov/airports/environmental/sustainability/.
AIRPORT MASTER PLAN – Monterey Regional Airport
SUSTAINABILITY BASELINE ASSESSMENT D-2 DRAFT-FEBRUARY 2015
WHAT IS SUSTAINABILITY? Per the FAA’s Airport Sustainability Master Plan Pilot Program memorandum dated May 27, 2010, the FAA defines airport sustainability broadly to include a wide variety of practices applicable to planning, design, building and operating airport facilities. There are three core principles:
• Protecting the environment; • Maintaining high and stable levels of economic growth; and • Social progress that recognizes all stakeholders’ needs.
There are many benefits of airport sustainability planning, including reduced energy consumption, reduced noise impacts, reduced hazardous and solid waste generation, reduced greenhouse gas emissions, improved water quality, improved community relations, and cost savings. Airport master plans have traditionally looked at accommodating an airport’s forecasted demand and the associated environmental impacts. However, looking at sustainability issues in the planning process will make it a core objective rather than a secondary consideration. By including sustainability principles in the planning process, the Airport can create a road map before making final planning and management decisions. This will in turn promote design, project implementation, and financial decisions that will help airports identify ways to reduce energy consumption, environmental impacts, and carbon footprint. As a result, the Airport can incorporate sustainability issues in the master planning process. Another applicable definition of sustainability specific to airports has been established by the Airports Council International-North America (ACI-NA), which defines sustainability as: “A holistic approach to managing an airport so as to ensure the integrity of the Economic viability, Operational efficiency, Natural resource conservation, and Social responsibility [EONS] of the airport” (see Figure D1).

AIRPORT MASTER PLAN – Monterey Regional Airport
SUSTAINABILITY BASELINE ASSESSMENT D-3 DRAFT-FEBRUARY 2015
Figure D1: ACI-NA’s EONS Approach to Sustainability
ACI-NA’s definition is also applicable because of its focus on airports and its inclusion of the operational aspects of an airport. The following provides a brief description for each category identified by FAA and ACI-NA: • Economic Viability - refers to maintaining high and stable levels of economic growth
and including the continued business viability of an airport enterprise, the tangible assets created by capital investments at the airport, and the direct and indirect economic impact on the region. This impact includes the value added to public and private sectors through investments in partnerships, tax payments, and other contributions.
• Operational Efficiency – an airport’s management structure and ability to leverage operations and maintenance monies to promote efficient use of resources and minimize waste.
• Natural Resource Conservation - refers to protecting the environment with a focus on the natural resources that are used or affected as a result of airport operations and the ecosystem in which these resources are located.
• Social Responsibility – refers to a broad set of actions that ensure organizational goals are achieved in a way that’s consistent with the needs and values of the local community.
Sustainability, as part of an organizational strategy, has demonstrated measurable benefits at airports across the world including:
AIRPORT MASTER PLAN – Monterey Regional Airport
SUSTAINABILITY BASELINE ASSESSMENT D-4 DRAFT-FEBRUARY 2015
• Improved passenger experience; • Better use of assets; • Reduced development and/or operations and maintenance costs; • Reduced environmental/ecological footprint; • Facilitation of environmental approvals/permitting; • Improved relationships within communities; • Enhancement of regional economies; • Creation of an engaged and enriched place to work; and • Creation and utilization of new technologies through increased demand and investment
in technologies that facilitate sustainable solutions. SUSTAINABILITY CONTEXT The Monterey Peninsula Airport District (MPAD) is a stand-alone public entity that serves the Monterey County Region, including the incorporated cities of Monterey, Pacific Grove, Carmel-by-the-Sea, Del Rey Oaks, and majority portions of Sand City and Seaside. Many of these communities have enacted sustainability initiatives to address wide-ranging issues such as recycling programs, water and energy conservation, and sustainable transportation development, among other programs. The City of Monterey (City), the largest community near the Airport, has a robust sustainability program already in place. In 2007, the City be-came a signatory of the “U.S. Mayors Climate Protection Agreement.” Under this agree-ment, participating cities commit to take the following three actions:
1. “Strive to meet or beat the Kyoto Protocol1 targets in their own communities, through actions ranging from anti-sprawl land-use policies to urban forest restora-tion projects to public information campaigns.
2. Urge their state governments, and the federal government, to enact policies and programs to meet or beat the greenhouse gas emission reduction target suggested for the United States in the Kyoto Protocol – seven percent reduction from 1990 lev-els by 2012.
3. Urge the U.S. Congress to pass greenhouse gas reduction legislation, which would establish a national emission trading system.”
As a result, the City implemented its Climate Action Plan (CAP) “to address environmental problems that, although global in scope, affect our future as a community. The CAP consists of an audit of 2005 Greenhouse Gas (GHG) emissions and GHG emissions reduction strate-gies for both the community and government operations.” According to the City’s Green Actions’ website, the following initiatives have been put in place: • Green Energy Plan – The City has implemented lighting upgrades throughout the City
to reduce energy consumption by 35 percent. 1 The Kyoto Protocol is an international agreement linked to the United Nations Framework Convention on Climate Change (UNFCCC), which commits its Parties by setting internationally binding emission reduction targets. For more information visit the UNFCCC’s Kyoto Protocol website: http://unfccc.int/kyoto_protocol/items/2830.php

AIRPORT MASTER PLAN – Monterey Regional Airport
SUSTAINABILITY BASELINE ASSESSMENT D-5 DRAFT-FEBRUARY 2015
• Environmentally Friendly Food Packaging – The City adopted an ordinance on Feb-ruary 3, 2009, prohibiting the use of polystyrene materials used for food applications and requiring the use of environmentally preferable alternatives.
• Monterey Bay Green Business Program – The City has created an incentive-based
program “designed to encourage businesses to meet or exceed environmental stand-ards targeting four areas of performance within each business: waste reduction, pollu-tion prevention, water and energy conservation.”
• Single Use Carry Out Bags – Incentive program to increase the use of reusable car-ryout bags and recyclable paper bags and limit the use of single-use plastic carryout bags. Several other regional jurisdictions have or are adopting plastic carryout bag bans. A statewide ban on single-use plastic bags was to go into effect on July 1, 2015; however, it was announced on February 24, 2015 that a referendum to overturn the measure has qualified to be voted on by the public in November 2016. Therefore, the statewide plastic bag ban will not go in effect unless approved by the public vote.
• Urban Environmental Accords – An agreement by the City “to focus on bringing envi-
ronmental planning to the forefront of City efforts.” Achievements related to this agreement include “energy efficiency and water conservation upgrades at major facili-ties, a city-wide recycling outreach campaign, passage of a Green Building Ordinance, an integrated pest management system, B20 biodiesel for the City fleet and fire trucks, and much more.”
• California Green Building Standards Code (CAL Green) – As of January 1, 2014, the
City adopted CAL Green (California Code of Regulations Title 24, Part 11). The stated purpose of CAL Green is “to improve public health, safety and general welfare by en-hancing the design and construction of buildings through the use of building concepts having a reduced negative impact or positive environmental impact and encouraging sustainable construction practices in the following categories:
1. Planning and design. 2. Energy efficiency. 3. Water efficiency and conservation. 4. Material conservation and resource efficiency. 5. Environmental quality.”
The commissioning of this Sustainability Airport Master Plan is evidence that the MPAD is contributing to the sustainability efforts of the Monterey Peninsula region. This Sustaina-ble Airport Master Plan integrates sustainability and commits the Airport to a long-term, comprehensive, and integrated approach guided by the Airport’s mission statement “to provide the region convenient commercial and general aviation access to the national air transportation system, operate the airport in a safe, efficient, sustainable, and fiscally re-sponsible manner, and develop the airport to meet future needs.”

AIRPORT MASTER PLAN – Monterey Regional Airport
SUSTAINABILITY BASELINE ASSESSMENT D-6 DRAFT-FEBRUARY 2015
SUSTAINABILITY SUCCESSES The MPAD has already begun implementing sustainability into its decision-making process and has incorporated several successful sustainability initiatives. For anticipated future projects such as the construction of a new terminal and aircraft rescue and firefighting (ARFF) buildings, the MPAD will likely seek Leadership in Energy and Environmental De-sign (LEED) certifications, which require a number of sustainable prerequisites and credits. Other successful MPAD-adopted sustainability initiatives at the Airport include the follow-ing: • The Airport Energy Lighting Program began in 2004, funded by FAA Airport Improve-
ment Program grants. MPAD replaced airfield lighting with energy efficient options in-cluding LED lights on the taxiways and pilot controlled lighting (PCL) for both runways. For 2003, electrical usage for all airfield lighting totaled 193,600 kilowatt-hours (kWh) . For the 12 months following the completion of the Airport Energy Lighting project, the total usage recorded on the same airfield meter was 102,960 kWh, a 47 percent reduc-tion in kWh due to these energy conservation measures.
• The Airport Terminal Lighting Initiative began in late spring 2009, when the District’s
Board of Directors approved the Airport Lighting Energy Efficient Capital Improvement Project. This project also included the installation of 37 new flight information screens and smart software to program the monitors to turn off when not needed to conserve energy. For the six months of July through December 2008, total electrical usage for terminal lighting was 694,720 kWh. For the same 6-month period one year later in 2009, total usage recorded on the same terminal meter was down 91,944 kWh to 602,776 kWh. This represents a 13 percent reduction in kWh derived from this energy conservation measure. More recently, for the same six-month period in 2013, total electrical usage in the terminal was 642,748 kWh, a 7.5 percent reduction from 2008 levels.
• In 2010, retrofitting the street lighting beginning on Fred Kane Drive and wrapping
around to the north side of the Airport was completed. Energy efficient induction (ECH-ED) lights were installed. The induction lamps produce high quality light output and are energy efficient and long-lasting with low maintenance.
• In January 2012, the Association of Monterey Bay Area Government (AMBAG) and
PG&E sponsored a project to install ECH-ED lights at all of the parking areas and airfield ramp lighting at the Airport. In some of the parking areas, a lighting solution was cho-sen that increases safety while optimizing energy savings. Inefficient lighting fixtures were replaced with EverLast® Bi-Level Induction luminaires. Each fixture was equipped with a Lumewave wireless controller and an occupancy sensor that allows the installation to operate as a system that can determine an occupant's direction of travel. These controls are combined with dimmable induction lighting to reduce total energy use when no movement is detected in that area. The lighting retrofit project is expected to reduce energy use by 420,000 kWh per year, which was anticipated to save the Air-port approximately $55,000 annually.
AIRPORT MASTER PLAN – Monterey Regional Airport
SUSTAINABILITY BASELINE ASSESSMENT D-7 DRAFT-FEBRUARY 2015
• Three Level 2 electric vehicle (EV) charging stations were installed in the Airport’s parking lots for airport customers in 2012. These Airport locations add to a growing re-gional network for EV drivers. The Airport’s EV chargers are strategically designed to relieve potential “range anxiety” that EV owners may experience and spur the adoption of electric vehicles. There is no fee to “plug-in” to one of the Airport’s charging stations. Partial funding for the charging stations was made possible through a grant awarded by the California Energy Commission and the Association of Bay Area Governments. The installation was accomplished through a cooperative effort between the Airport, Ecolo-gy Action, Clean Fuel Connection, and Monterey Bay Electric Vehicle Alliance. The Air-port District funded the balance of the installation. There were approximately 340 uses of the charging stations in 2013.
Additional sustainability initiatives and successes at the Airport include: • A Chevy Electron electric maintenance vehicle was purchased in 1999. • Terminal recycling program started in 2008. • Terminal restrooms were equipped with motion-sensor sink and toilet fixtures to re-
duce water usage in 2010. • In August 2011, an energy-efficient film (Huper Optik Fusion 10) was installed on the
windows and doors along the airfield side of the terminal, resulting in the elimination of 99.9 percent of ultraviolet light penetration, 88 percent reduction in glare, and 77 per-cent of the solar energy reduction while maintaining a clear view to passengers.
• In August 2011, the Airport was recognized by the AMBAG Board with an Energy Effi-ciency Leadership Award in recognition of Innovation in Energy Efficiency.
• A weather awning on the street side of the terminal to protect waiting passengers from the elements was installed in December 2011. The Airport has a pilot-controlled airfield lighting system, which allows pilots to utilize their radio transmitter to active Runway 10R-28L lighting systems and approach aids during periods the airport traffic control tower (ATCT) is closed. This system allows the airfield lights to remain off when not in use and saves on electrical consumption.
BASELINE ASSESSMENT CONTENTS OVERVIEW The sustainability baseline assessment is focused on the following key priority categories: • Greenhouse Gas (GHG) Emissions • Energy • Waste Management and Recycling • Ground Access and Transportation • Water Quality • Noise This baseline assessment will present current emission/consumption data and baseline information related to each category as well as an initial list of opportunities for improve-

AIRPORT MASTER PLAN – Monterey Regional Airport
SUSTAINABILITY BASELINE ASSESSMENT D-8 DRAFT-FEBRUARY 2015
ment, which are initiatives that will be considered and evaluated later in the sustainability master plan process. GREENHOUSE GAS (GHG) EMISSIONS KB Environmental Sciences, Inc. has prepared a GHG emissions inventory for the Monterey Regional Airport. The full preliminary draft report is included as an attachment to this ap-pendix. The full report details nationwide and statewide GHG regulatory initiatives such as the California Global Warming Solutions Act of 2006 (AB 32), the GHG inventory approach and methodology, results, and separate appendices with the detailed data, assumptions, methodology and results. The following is a summary of the findings of the full report. The primary sources of GHG emissions at MRY, as shown in Table D1, are typical of most airports that service both commercial and general aviation (GA) and include aircraft, auxil-iary power units (APU), ground support equipment (GSE), an assortment of stationary sources, and motor vehicles (operating on MRY’s internal roadways, parking facilities and terminal curbsides, and off-airport roadways). For the most part, emissions from these sources arise from the combustion of fossil fuels (i.e., jet fuel, avgas, diesel, gasoline, com-pressed natural gas, etc.) and are emitted as by-products contained in the engine exhaust.
TABLE D1 Sources of GHG Emissions Sources Characteristics Aircraft Exhaust products of fuel combustion that vary depending on aircraft engine
type (i.e., turbo-jet, turbo-prop, etc.), fuel type (Jet-A, avgas), number of engines, power setting (i.e., taxi/idle, take-off, cruise), and amount of fuel burned.
Motor vehicles Exhaust products of fuel combustion from patron, employee and cargo motor vehicles approaching, departing, and moving within the airport including the airport’s parking lots. These include automobiles, vans and buses. Emissions vary depending on vehicle type (i.e., gasoline, diesel, etc.) and the amount of fuel consumed.
Ground service equipment / Auxilia-ry Power Units
Exhaust products of fuel combustion from aircraft service trucks, tow tugs, belt loaders and other portable equipment. Emissions are also emitted by auxiliary power units used to furnish power to some aircraft when the main engines are off.
Stationary sources Exhaust products of fossil fuel combustion in boilers for space heating, emer-gency generator units and training fires and fugitive emissions associated with the compressed natural gas (CNG) station.
Electrical Usage Emissions associated with the production of electricity at off-site utilities that use coal, oil or natural gas.
Refrigerants A range of chemicals used for refrigeration and air conditioning that are com-prised of substances possessing global warming characteristics (e.g., Freon, chloroflorocarbons, etc.).
Waste Management Emissions associated with the solid waste generated at MRY and the recycling and solid waste disposal practices employed by MRY.
Source: KB Environmental Sciences, Inc. 2014.

AIRPORT MASTER PLAN – Monterey Regional Airport
SUSTAINABILITY BASELINE ASSESSMENT D-9 DRAFT-FEBRUARY 2015
TYPES OF GHG EMISSIONS According to the United Nations Intergovernmental Panel on Climate Change (IPCC), the six main GHGs whose emissions are human-related are: carbon dioxide (CO2), methane (CH4), nitrous oxide (N2O), hydroflorocarbons (HFCs), perfluorcarbons (PFCs) and sulfur hexaflu-oride (SF6). On a global scale, CO2 represents the largest portion, ranging from 80 to over 90 percent of the total, depending on the estimate under consideration. By comparison, global emissions of CH4 and N2O correspond to approximately two and four percent, re-spectively. Collectively, HFCs, PFCs, and SF6 are less than one percent of global GHG emis-sions. Due to the fact that CO2, CH4, and N2O are by-products of fuel combustion, they are also the predominant GHGs at most airports, including MRY. Other GHGs associated with aircraft operations include water vapor, soot, and sulfates, but to a far lesser extent. Emissions of HFCs, PFCs, and SF6 are most commonly linked with refrigeration, air condi-tioning, and other coolants. Since these units are modern and well maintained, GHGs asso-ciated with these sources were not considered to be significant and were not included in this inventory. Furthermore, with the temperate regional climate, air conditioning units are rare. Within the terminal building, only the MPAD offices are air conditioned. The storage of fuel (i.e., jet fuel, avgas, gasoline, and diesel) is a potential source of evaporative hydrocarbon emissions, but does not produce the type of hydrocarbons that contribute di-rectly to global climate change. GREENHOUSE GAS BOUNDARIES Greenhouse Gas Ownership and Control Boundaries – These boundaries reflect the sources based on ownership or control as shown in Figure D2. There are three categories characterized by degrees of control that an airport operator may have and they are sum-marized as follows:
o Category 1 – GHG emissions from sources that are owned and controlled by the re-porting entity (e.g., MPAD). These sources typically represent all Scope 1 and 2 sources, and Scope 3 sources which are not owned by the entity, but over which the entity can exert control. At MRY, these sources include airport-owned and con-trolled stationary sources (e.g., boilers, generators, etc.), some GSE, fleet vehicles, and purchased electricity. On-airport ground transportation emissions are also in-cluded if they are controlled by MPAD.
o Category 2 – This category comprises Scope 3 emissions associated with sources
owned and controlled by airlines and airport tenants. These sources can include aircraft (on-ground, within the landing and takeoffs [LTO], in the cruise mode to the destination), APU, most GSE, electrical consumption, and other stationary sources.

AIRPORT MASTER PLAN – Monterey Regional Airport
SUSTAINABILITY BASELINE ASSESSMENT D-10 DRAFT-FEBRUARY 2015
Figure D2: GHG Inventory Boundaries
Category 1 - Airport
Category 2 - Tenants
Category 3 - Public
Scope 3
Scope 3
Scopes 1, 2, 3
Operational Ownership &
Control
o Category 3 – This category generally comprises GHG emissions associated with oth-er sources associated with MRY. These include public owned and controlled sources such as: automobiles, taxis, limousines, buses, and shuttle vans, which are operating on the off-airport roadway network.
Greenhouse Gas Operational Boundaries – Once the ownership boundaries are deter-mined, the operational boundaries are also set, reflecting the Scope and reflecting the own-ership of the emission source. Three Scopes are identified and characterized as follows:
o Scope 1 – GHG emissions from sources that are owned and controlled by the report-ing entity (i.e., MPAD). In the case of MRY, these include on-airport owned and con-trolled stationary sources (e.g., boilers, emergency generators, etc.) and MPAD-owned GSE and fleet motor vehicles.
o Scope 2 – GHG emissions associated with the generation of electricity consumed by
the reporting entity.
o Scope 3 – GHG emissions that are associated with the activities of the reporting enti-ty, but are associated with sources that are owned and controlled by others. These include aircraft-related emissions, emissions from airport tenants’ activities, as well as ground transportation to and from MRY.
The GHG inventory ownership and control and operational boundaries are summarized in Figure D2. Table D2 provides a detailed listing of the MRY GHG emission sources ana-lyzed as part of the GHG emissions inventory broken out by Source Category, Activity and Scope.

AIRPORT MASTER PLAN – Monterey Regional Airport
SUSTAINABILITY BASELINE ASSESSMENT D-11 DRAFT-FEBRUARY 2015
CURRENT PERFORMANCE/BASELINE INFORMATION A GHG emissions inventory was completed to provide an accounting of GHGs for MRY. The primary purposes of this GHG emissions inventory were to:
Identify the principal sources of GHGs associated with MRY;
Estimate existing (2013) and future (2018, 2023, and 2033) emissions; and
Enable the MPAD to demonstrate consistency with the California Global Warming Solu-tions Act of 2006.
The emissions inventory was prepared following guidance established by the United States Environmental Protection Agency (EPA), International Civil Aviation Organization (ICAO), IPCC, Energy Information Administration (EIA), FAA, and the California Air Resources Board (CARB). GHG emissions were calculated based on approved emission models, emis-sion factors and other commonly used and widely accepted guidance materials. For further accuracy, operational data and other information specific to MRY were used to the fullest extent possible. The GHG emissions inventory was strictly voluntary and was not prepared in response to any regulatory requirements statewide, nationally, or globally. TABLE D2 Sources of GHG Emissions by Source Category, Activity and Scope Source Category Activity Scope Category 1 - Airport MPAD Fleet Vehicles 1
MPAD Parking Lots 1 Employee Trips 3 On-airport Roadways 3 Taxis 3 Boilers 1 Generators 1 Electrical Usagea 2
Category 2 – Tenant Aircraftb 3 APU 3 GSE 3 Employee Trips 3 Electrical Usagea 2
Category 3 – Public Off-airport Roadways 3 Source: KB Environmental Sciences, Inc. 2014. Note: GSE – ground service equipment, APUs – auxiliary power units. a. Electrical consumption emissions occur off airport property at power generating plants; however, these emis-sion are included in the GHG Inventory under Category 1 and 2 as the energy is consumed on the airport by MPAD and Tenants. b. Aircraft emissions based on landing/take-off (LTO) cycle, including start-up, and cruise to its destination.

AIRPORT MASTER PLAN – Monterey Regional Airport
SUSTAINABILITY BASELINE ASSESSMENT D-12 DRAFT-FEBRUARY 2015
The computation of GHGs was conducted for the year 2013, which served as the existing condition for this analysis. This year was specifically selected because it represents the most current year for which the necessary data for MRY were available. For comparative purposes, future years 2018, 2023, and 2033 were also analyzed to correspond to the planning horizons within this sustainable Master Plan. GHG emissions associated with the consumption of electricity by MPAD and its tenants (but generated elsewhere by the burning of coal, oil, and natural gas or generated by renewable energy) were included. It should be noted that neither MPAD nor the tenants at MRY are involved in fossil fuel-based power generation, cement manufacturing, the incineration or landfilling of solid wastes, livestock management or the treatment of wastewater (which are several other common sources of GHGs). The GHG emissions from refrigerants used in vehicles, refrigeration, and heating, ventilat-ing, and air-conditioning (HVAC) systems as well as the GHG emissions from recycling of solid waste associated with MRY were not included in the inventory analysis. No significant construction improvements occurred to MRY facilities and infrastructure during 2013; thus, GHG emissions associated with construction activities were not quanti-fied for the existing condition. Emissions from the construction of the runway safety area (RSA) project that began in 2014 were not included in the analysis because they are tempo-rary emissions only and do not affect the long term inventory. For more information re-garding the GHG emissions related to the ongoing RSA project see the Environmental Im-pact Report (EIR) for Proposed Runway Safety Area Improvements at Monterey Peninsula Airport. Finally, GHG emissions associated with the “supply-chains” or “life-cycles” (i.e., production, consumption and/or disposal of goods and materials such as paper, plastic and waste products, foodstuffs, building materials, etc.) by either MPAD facilities or its tenants’ facili-ties are not included in this analysis. The GHGs included in this inventory were comprised of CO2, CH4, and N2O. The results were then converted to CO2 equivalent (CO2e) values using appropriate Global Warming Poten-tial (GWP) values and reported in metric tons (MT). It was found that the vast majority (99 percent) of the GHG emissions associated with MRY were in the form of CO2, while the re-mainder was CH4 and N2O. The following is a summary of the main findings obtained from this GHG emissions inventory: Category 1 emissions (i.e., sources that are owned and controlled by MPAD) represent-
ed one percent of the total GHG emissions. Category 2 emissions (i.e., sources that are owned and controlled by tenants including
the aircraft emissions) represented 96 percent of the total GHG emissions. Category 3 emissions (i.e., sources that are owned and controlled by the public) com-
prised three percent of the total GHG emissions.
AIRPORT MASTER PLAN – Monterey Regional Airport
SUSTAINABILITY BASELINE ASSESSMENT D-13 DRAFT-FEBRUARY 2015
Scope 1 (e.g., stationary sources) and Scope 2 (e.g., electrical consumption) each repre-sented less than one percent respectively of total GHG emissions.
The majority of the GHG emissions (99 percent) were classifiable as Scope 3 (i.e., asso-
ciated with the activities from sources owned and controlled by others). Therefore, MPAD has some control or influence over Scopes 1 and 2 and the least control and management potential over Scope 3.
GHG emissions estimated for 2018, 2023, and 2033 remained comparatively similar to
the 2013 conditions, specifically in terms of the largest contributors by Category and Scope. The top contributors were vehicles using on-airport roadways, aircraft, and ve-hicles using off-airport roadways.
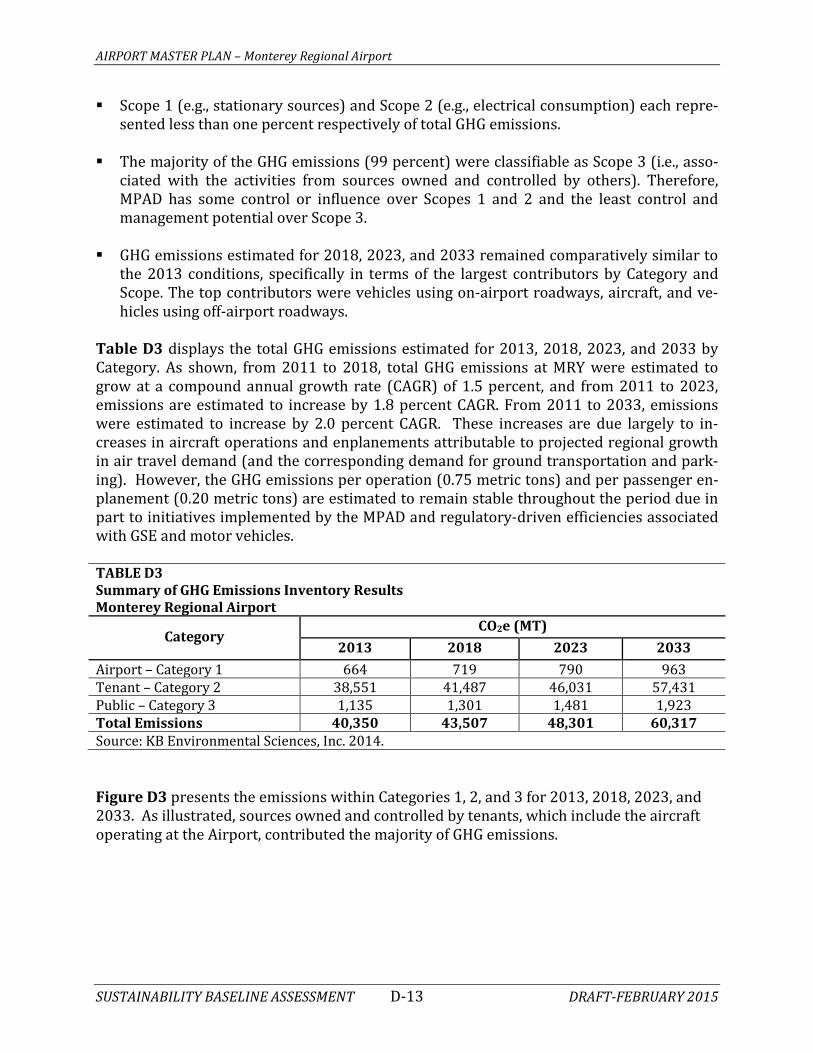
Table D3 displays the total GHG emissions estimated for 2013, 2018, 2023, and 2033 by Category. As shown, from 2011 to 2018, total GHG emissions at MRY were estimated to grow at a compound annual growth rate (CAGR) of 1.5 percent, and from 2011 to 2023, emissions are estimated to increase by 1.8 percent CAGR. From 2011 to 2033, emissions were estimated to increase by 2.0 percent CAGR. These increases are due largely to in-creases in aircraft operations and enplanements attributable to projected regional growth in air travel demand (and the corresponding demand for ground transportation and park-ing). However, the GHG emissions per operation (0.75 metric tons) and per passenger en-planement (0.20 metric tons) are estimated to remain stable throughout the period due in part to initiatives implemented by the MPAD and regulatory-driven efficiencies associated with GSE and motor vehicles. TABLE D3 Summary of GHG Emissions Inventory Results Monterey Regional Airport
Category CO2e (MT)
2013 2018 2023 2033 Airport – Category 1 664 719 790 963 Tenant – Category 2 38,551 41,487 46,031 57,431 Public – Category 3 1,135 1,301 1,481 1,923 Total Emissions 40,350 43,507 48,301 60,317 Source: KB Environmental Sciences, Inc. 2014. Figure D3 presents the emissions within Categories 1, 2, and 3 for 2013, 2018, 2023, and 2033. As illustrated, sources owned and controlled by tenants, which include the aircraft operating at the Airport, contributed the majority of GHG emissions.

AIRPORT MASTER PLAN – Monterey Regional Airport
SUSTAINABILITY BASELINE ASSESSMENT D-14 DRAFT-FEBRUARY 2015
FIGURE D3 GHG Emissions Inventory Results by Category and Year Monterey Regional Airport
Source: KB Environmental Sciences, Inc. 2014. Table D4 presents the GHG emissions inventory results, the aircraft operations, and the GHG emissions per aircraft operation during 2013, 2018, 2023, and 2033. The GHG emis-sions per operation and per passenger enplanement are estimated to remain steady throughout the period due in part to initiatives implemented by MPAD and regulatory-driven efficiencies associated with GSE and motor vehicles. These results show that MRY is maintaining its GHG emissions on a per-operation and per-passenger basis. TABLE D4 GHG Emissions Inventory by Year Monterey Regional Airport Parameter 2013 2018 2023 2033 Total CO2e (MT) 40,350 43,507 48,301 60,317 Total Aircraft Operations 53,827 58,100 64,600 80,900 CO2e (MT) per aircraft operation 0.75 0.75 0.75 0.75 Total Enplanements 200,651 223,000 245,000 298,000 CO2e (MT) per enplanement 0.20 0.20 0.20 0.20 Sources: Operational and Enplanement data from Draft Monterey Regional Airport Master Plan, April 2014; GHG emissions data from KB Environmental Sciences, Inc. 2014.
-
10,000
20,000
30,000
40,000
50,000
60,000
2013 2018 2023 2033
Airport Public Tenant
AIRPORT MASTER PLAN – Monterey Regional Airport
SUSTAINABILITY BASELINE ASSESSMENT D-15 DRAFT-FEBRUARY 2015
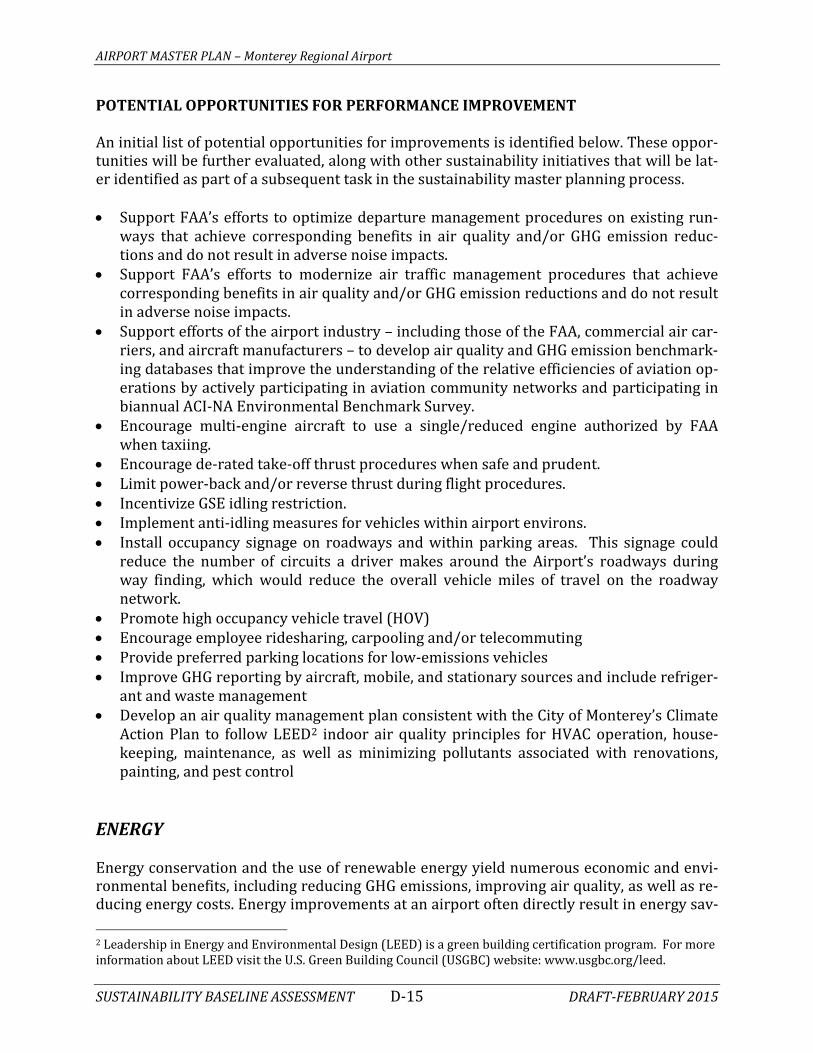
POTENTIAL OPPORTUNITIES FOR PERFORMANCE IMPROVEMENT An initial list of potential opportunities for improvements is identified below. These oppor-tunities will be further evaluated, along with other sustainability initiatives that will be lat-er identified as part of a subsequent task in the sustainability master planning process. • Support FAA’s efforts to optimize departure management procedures on existing run-
ways that achieve corresponding benefits in air quality and/or GHG emission reduc-tions and do not result in adverse noise impacts.
• Support FAA’s efforts to modernize air traffic management procedures that achieve corresponding benefits in air quality and/or GHG emission reductions and do not result in adverse noise impacts.
• Support efforts of the airport industry – including those of the FAA, commercial air car-riers, and aircraft manufacturers – to develop air quality and GHG emission benchmark-ing databases that improve the understanding of the relative efficiencies of aviation op-erations by actively participating in aviation community networks and participating in biannual ACI-NA Environmental Benchmark Survey.
• Encourage multi-engine aircraft to use a single/reduced engine authorized by FAA when taxiing.
• Encourage de-rated take-off thrust procedures when safe and prudent. • Limit power-back and/or reverse thrust during flight procedures. • Incentivize GSE idling restriction. • Implement anti-idling measures for vehicles within airport environs. • Install occupancy signage on roadways and within parking areas. This signage could
reduce the number of circuits a driver makes around the Airport’s roadways during way finding, which would reduce the overall vehicle miles of travel on the roadway network.
• Promote high occupancy vehicle travel (HOV) • Encourage employee ridesharing, carpooling and/or telecommuting • Provide preferred parking locations for low-emissions vehicles • Improve GHG reporting by aircraft, mobile, and stationary sources and include refriger-
ant and waste management • Develop an air quality management plan consistent with the City of Monterey’s Climate
Action Plan to follow LEED2 indoor air quality principles for HVAC operation, house-keeping, maintenance, as well as minimizing pollutants associated with renovations, painting, and pest control
ENERGY Energy conservation and the use of renewable energy yield numerous economic and envi-ronmental benefits, including reducing GHG emissions, improving air quality, as well as re-ducing energy costs. Energy improvements at an airport often directly result in energy sav- 2 Leadership in Energy and Environmental Design (LEED) is a green building certification program. For more information about LEED visit the U.S. Green Building Council (USGBC) website: www.usgbc.org/leed.

AIRPORT MASTER PLAN – Monterey Regional Airport
SUSTAINABILITY BASELINE ASSESSMENT D-16 DRAFT-FEBRUARY 2015
ings, due to the high cost of electricity, oil, and natural gas. This section focuses on energy performance within MRY facilities. CURRENT PERFORMANCE/BASELINE INFORMATION An analysis of the Airport’s utility bills was conducted for the period between calendar years 2011 and 2013. Data was available for 24 electric meters and submeters and five natural gas meters. Of those monitored by the MPAD, the terminal building consumes the vast majority of the electricity used on the Airport accounting for over 77 percent of all electricity usage. In calendar year 2013, the terminal building consumed approximately 1.3 million kWh of electricity and almost 25,800 therms of natural gas, totaling $183,700 in annual energy costs. A detailed account of each meter is provided in Table D5. TABLE D5 Annual Energy (Electricity & Natural Gas) Usage and Cost – CY 2013 Monterey Regional Airport Electric Natural Gas Facility Description kWh $ Therms $ Total Cost Terminal 1,290,588 $161,978.64 25,798 $21,732.76 $183,711.40 OK Aviation/SE Hangar #2 2,011 $485.48 46,362 $36,858.49 $37,343.97 Airport Lights 115,007 $17,865.98 -- -- $17,865.98 Fire House/Safety Building 40,480 $7,485.61 2,659 $2,548.57 $10,034.18 Obstruction Lights 38,516 $7,136.35 -- -- $7,136.35 Obstruction & Parking Light 34,775 $5,091.51 -- -- $5,091.51 Security & Obstruction Lights1 18,720 $3,631.19 -- -- $3,631.19 Auto Parking Gate 18,851 $3,462.07 -- -- $3,462.07 Beacon Light/Parking Lot 22,610 $3,424.11 -- -- $3,424.11 Public Works/Maintenance 9,732 $1,847.72 1,700 $1,491.16 $3,338.88 Security Fence Lights 16,327 $3,027.85 -- -- $3,027.85 Security & Obstruction Lights2 14,402 $2,664.85 -- -- $2,664.85 Sky Park Street Lights 16,657 $2,588.11 -- -- $2,588.11 Auto Body Repair Shop 11,280 $2,270.98 -- -- $2,270.98 Navigation Aids Light 9,772 $1,974.65 -- -- $1,974.65 Construction 9,918 $1,938.54 -- -- $1,938.54 Hangar #4 East Side 9,073 $1,715.23 -- -- $1,715.23 Hangar #3 East Side 3,623 $764.60 -- -- $764.60 Hangar (Meter #28466504) -- -- 748 $756.10 $756.10 Electric Vehicle Charging Sta-tions 696 $250.21a -- -- $250.21a
Security Light & Gate 637 $235.78 -- -- $235.78 200 Fred Kane Drive (Meter #1008716234)
654 $235.11 -- -- $235.11
Airport Sign 381 $190.55 -- -- $190.55 Security Gate 285 $173.73 -- -- $173.73 Hangars 7P & 8P 134 $148.82 -- -- $148.82 Total 1,685,129 $230,587.67 77,267 $63,387.08 $293,974.75 Source: Pacific Gas and Electric Company, CMT Reports/Account Services – Energy Report 1 – Meter #1009539332 2 – Meter #1009574291
a – Estimated based upon similar kWh consumption and cost.

AIRPORT MASTER PLAN – Monterey Regional Airport
SUSTAINABILITY BASELINE ASSESSMENT D-17 DRAFT-FEBRUARY 2015
A breakdown of the monthly electrical (kWh) usage for the terminal building is presented in Table D6. The data shows that January is, on average, the leading month for electrical consumption. A more in-depth energy study, such as an American Society of Heating, Re-frigeration and Air-Conditioning Engineers (ASHRAE) level II energy audit, is recommend-ed to provide a more detailed analysis of electrical consumption in MPAD facilities. TABLE D6 Monthly Electricity Usage – CY 2011-2013 Monterey Regional Airport – Terminal Building
kWh 2011 2012 2013 2011-2013 %
January 114,400 117,760 120,000 352,160 9.16% February 106,080 103,520 109,280 318,880 8.29% March 111,360 110,880 112,320 334,560 8.70% April 114,720 105,600 97,600 317,920 8.27% May 106,560 102,560 101,760 310,880 8.09% June 99,040 106,080 106,880 312,000 8.12% July 113,600 107,840 101,280 322,720 8.39% August 105,120 98,560 122,944 326,624 8.50% September 102,880 100,800 107,912 311,592 8.11% October 109,120 99,200 96,745 305,065 7.94% November 106,720 100,480 101,619 308,819 8.03% December 104,960 105,920 112,248 323,128 8.41% Source: Pacific Gas and Electric Company, CMT Reports/Account Services – Energy Report The U.S. Energy Information Administration (EIA) publishes energy usage averages from the 2003 Commercial Buildings Energy Consumption Survey (CBECS). This published data is an effective tool for benchmarking building performance by usage, size, location, year constructed, or several other categories. CBECS data can also be viewed in a variety of ways (i.e., by building size, use, construction year, region, etc.). The Energy Usage Index (EUI) is a measure of total energy used (represented by British thermal units [Btus]; 1,000 Btus = 1kBtu) per square foot (sq. ft.) of floor area per year. The calculated EUI for the terminal building at MRY for calendar year 2013 is approximately 101 kBtu/sq. ft. (this figure combines electrical and natural gas consumption). The CBECS category utilized is “Assembly Buildings” which encompasses transportation termi-nals/airports. The national average for assembly type buildings in this category and square footage is 110 kBtu/sq. ft. This analysis shows that MRY’s terminal building is ahead of the national average on energy conservation. However, there are still opportunities for im-provement. POTENTIAL OPPORTUNITIES FOR PERFORMANCE IMPROVEMENT As a part of Airport Cooperative Research Program (ACRP) 01-24, Renewable Energy as an Airport Revenue Source, Monterey Regional Airport was assessed to identify the potential of a solar installation. This assessment included an economic assessment to demonstrate the
AIRPORT MASTER PLAN – Monterey Regional Airport
SUSTAINABILITY BASELINE ASSESSMENT D-18 DRAFT-FEBRUARY 2015
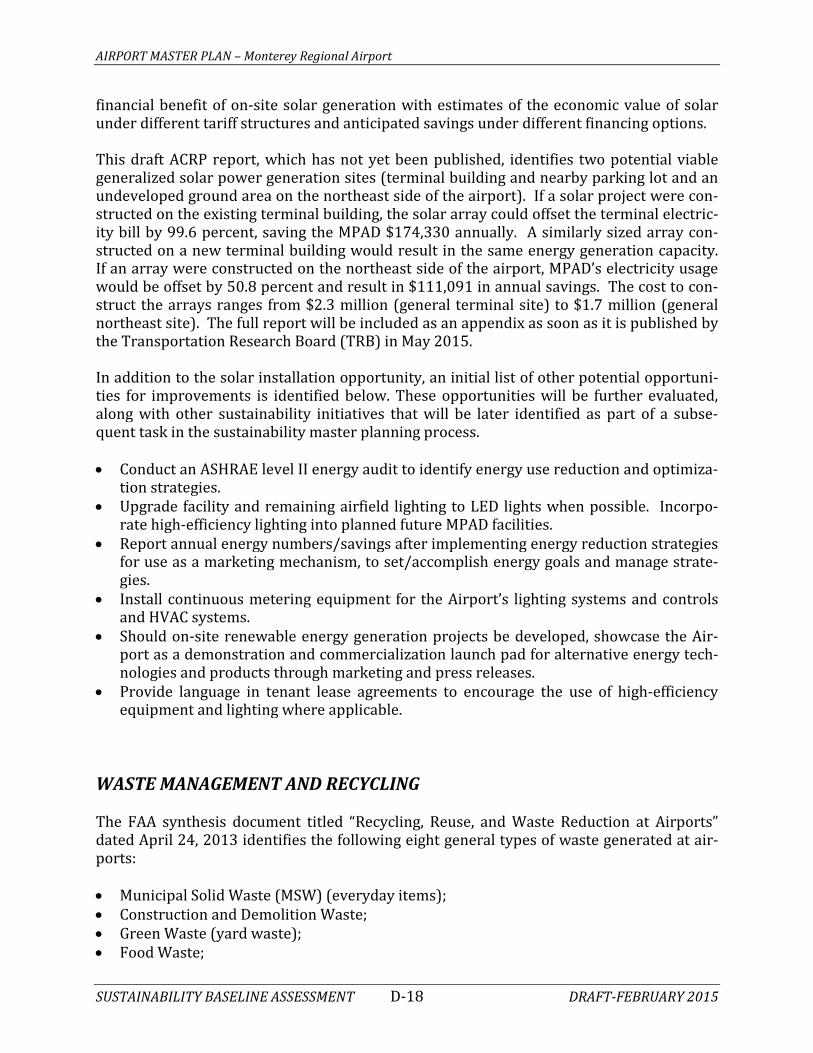
financial benefit of on-site solar generation with estimates of the economic value of solar under different tariff structures and anticipated savings under different financing options. This draft ACRP report, which has not yet been published, identifies two potential viable generalized solar power generation sites (terminal building and nearby parking lot and an undeveloped ground area on the northeast side of the airport). If a solar project were con-structed on the existing terminal building, the solar array could offset the terminal electric-ity bill by 99.6 percent, saving the MPAD $174,330 annually. A similarly sized array con-structed on a new terminal building would result in the same energy generation capacity. If an array were constructed on the northeast side of the airport, MPAD’s electricity usage would be offset by 50.8 percent and result in $111,091 in annual savings. The cost to con-struct the arrays ranges from $2.3 million (general terminal site) to $1.7 million (general northeast site). The full report will be included as an appendix as soon as it is published by the Transportation Research Board (TRB) in May 2015. In addition to the solar installation opportunity, an initial list of other potential opportuni-ties for improvements is identified below. These opportunities will be further evaluated, along with other sustainability initiatives that will be later identified as part of a subse-quent task in the sustainability master planning process. • Conduct an ASHRAE level II energy audit to identify energy use reduction and optimiza-
tion strategies. • Upgrade facility and remaining airfield lighting to LED lights when possible. Incorpo-
rate high-efficiency lighting into planned future MPAD facilities. • Report annual energy numbers/savings after implementing energy reduction strategies
for use as a marketing mechanism, to set/accomplish energy goals and manage strate-gies.
• Install continuous metering equipment for the Airport’s lighting systems and controls and HVAC systems.
• Should on-site renewable energy generation projects be developed, showcase the Air-port as a demonstration and commercialization launch pad for alternative energy tech-nologies and products through marketing and press releases.
• Provide language in tenant lease agreements to encourage the use of high-efficiency equipment and lighting where applicable.
WASTE MANAGEMENT AND RECYCLING The FAA synthesis document titled “Recycling, Reuse, and Waste Reduction at Airports” dated April 24, 2013 identifies the following eight general types of waste generated at air-ports: • Municipal Solid Waste (MSW) (everyday items); • Construction and Demolition Waste; • Green Waste (yard waste); • Food Waste;

AIRPORT MASTER PLAN – Monterey Regional Airport
SUSTAINABILITY BASELINE ASSESSMENT D-19 DRAFT-FEBRUARY 2015
• Deplaned Waste (bottles, cans, mixed paper, food waste, etc., from passenger aircraft); • Lavatory Waste (sanitary waste from aircraft); • Spill Cleanup and Remediation Waste; and • Hazardous Waste;
o Solvents o Caustic parts washes o Heavy metal paint waste and paint chips o Wastewater sludge from metal etching and electroplating o Unused epoxies and monomers o Waste fuels (including sump fuel or tank sludge) and other ignitables o Unusable water conditioning chemicals o Illegal dumping of containerized chemicals o Contaminated sludge in general aviation aircraft wash rack oil/water separators o Nickel cadmium (ni-cad) batteries o Waste pesticides
CURRENT PERFORMANCE/BASELINE INFORMATION The Monterey Regional Airport and its associated tenants and passengers generate waste, both on the airside and landside. The terminal building is the source of most MSW and de-planed waste generated at the Airport with more than 1,100 passengers arriving and depart-ing on average each day in 2013. The terminal’s waste stream, which includes MSW and food waste, is collected and sorted into a 4-yard dumpster. Recyclable materials (paper, plastic, and aluminum cans) are collected at numerous recycling bins throughout the terminal build-ing and transferred to one of three 96-gallon recycle toter carts. Waste Management, the waste handling contractor, removes the MSW, and recycling materials five times per week. An additional recycling dumpster located outside of the baggage make-up area, provided as a complimentary service by Waste Management, is used by the Transportation Security Ad-ministration (TSA), the airlines and the Airport primarily for cardboard box recycling. A detailed breakdown of MSW and recycled material removed from the terminal was not readily available; therefore, an estimate of total waste generated at the terminal has been prepared and assumes that the MSW and recycling receptacles are full for each pick-up by Waste Management. This results in an estimated 20 cubic yards of MSW and eight cubic yards of recycled materials each week. To ascertain a more detailed breakdown of terminal waste, it is recommended that a waste audit be conducted to quantify the amount and types of waste generated at the terminal. STORMWATER POLLUTION PREVENTION PLAN The MPAD maintains a Stormwater Pollution Prevention Plan (SWPPP) to protect water quality and comply with the General Permit Number CAS000001 for stormwater discharge associated with industrial activity excluding construction activities. The SWPPP on file with the MPAD was updated on August 17, 2013. The two main objectives of the SWPPP are:

AIRPORT MASTER PLAN – Monterey Regional Airport
SUSTAINABILITY BASELINE ASSESSMENT D-20 DRAFT-FEBRUARY 2015
1. To identify and evaluate sources of pollutants associated with industrial activities that may affect the quality of stormwater discharges and authorized non-stormwater discharges from the Airport.
2. To identify and implement site specific Best Management Practices (BMPs) to re-duce or prevent pollutants associated with industrial activities in stormwater dis-charges and authorized non-stormwater discharges.
SPILL PREVENTION CONTROL AND COUNTERMEASURE PLAN The MPAD also maintains a Spill Prevention Control and Countermeasure Plan (SPCC Plan), which was most recently updated on November 8, 2011. The purpose of the SPCC Plan is to prevent the discharge of gasoline, oil, and diesel fuel into or upon the navigable water of the United States, or adjoining shorelines, wetlands or rivers. Navigable waters in the re-gion include Monterey Bay, which receives water from Del Monte Lake, which in turn re-ceives runoff from the in-ground stormwater collection system at Monterey Regional Air-port; however, Airport property does not contain any features indicative of United States Army Corps of Engineers (USACE) jurisdictional waters. HAZARDOUS MATERIALS The MPAD has in place control measures designed to minimize hazards to employees and the public from hazardous materials, hazardous waste or hazardous constituents to air, soil, sur-face water or groundwater. These measures are detailed in the document, Hazardous Mate-rials Business Response Plan, dated January 15, 2013. This document outlines the facility’s evacuation plan, emergency contacts, and contractors to conduct site clean-up and identifies responsibilities for specific tasks related to hazardous material emergency incidents. The MPAD keeps records of spills and leaks of hazardous materials that occur on the Airport. A summary of these records is provided in Table D7. Every spill reported was cleaned either by the MPAD or by a third party primarily by the use of an absorbent material. TABLE D7 Record of Hazardous Material Spills and Leaks Monterey Regional Airport Spills/Leaks
Reported Type of Material Spill Quantity Range
2006 6 Sewage; Jet A Fuel; Transmission Fluid; Diesel Fuel 1 - 15 Gallons 2007 15 Jet A Fuel; Gasoline; Lavatory Water ½ - 15 Gallons 2008 11 Jet A Fuel; Hydrazine; Radiator Fluid; Sewage <1 – 15 Gallons 2009 6 AFF (Foam); Jet A Fuel; De-Ice Fluid <1 – 10 Gallons 2010 10 Jet A Fuel; Grey Water; Hydraulic Fluid 1 – 80 Gallons 2011 6 Jet A Fuel; Radiator Fluid; Lavatory Water; Raw Sewage 4-30 Gallons 2012 6 Diesel Fuel; Raw Sewage; Jet A Fuel ½ - 10 Gallons 2013 9 Jet A Fuel; Raw Sewage; Diesel Fuel <1 – 200 Gallons Source: MPAD Record of Spills and Leaks
AIRPORT MASTER PLAN – Monterey Regional Airport
SUSTAINABILITY BASELINE ASSESSMENT D-21 DRAFT-FEBRUARY 2015
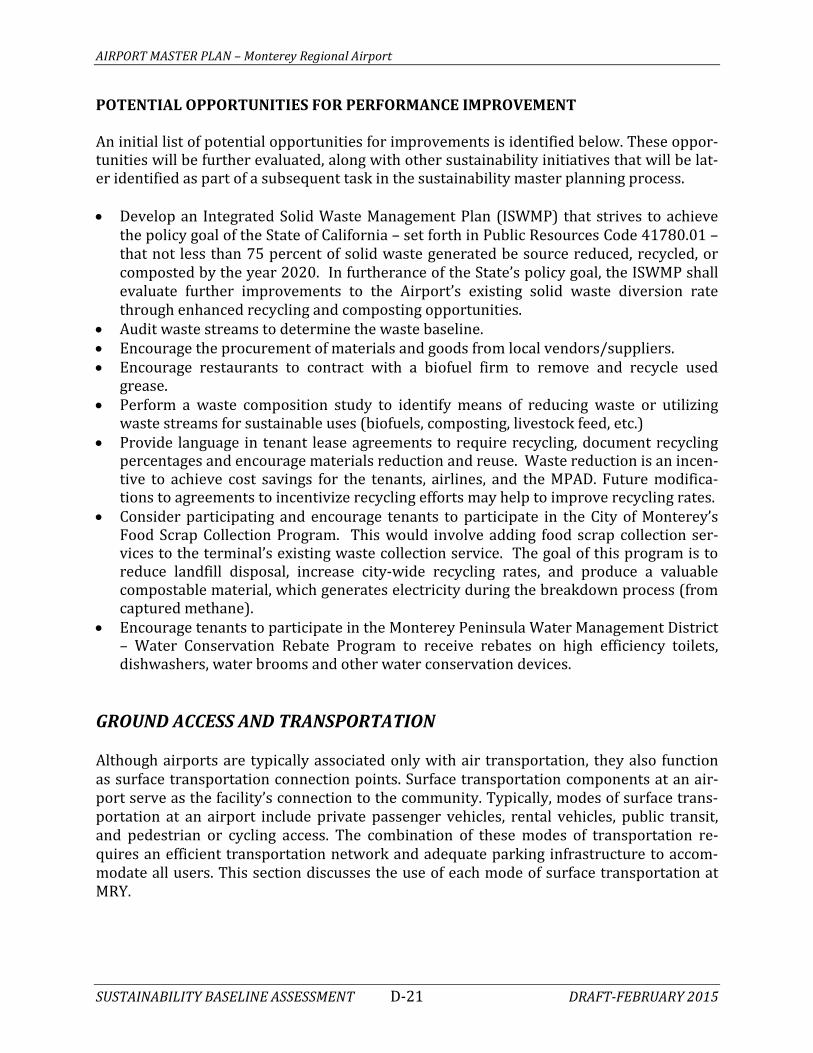
POTENTIAL OPPORTUNITIES FOR PERFORMANCE IMPROVEMENT An initial list of potential opportunities for improvements is identified below. These oppor-tunities will be further evaluated, along with other sustainability initiatives that will be lat-er identified as part of a subsequent task in the sustainability master planning process. • Develop an Integrated Solid Waste Management Plan (ISWMP) that strives to achieve
the policy goal of the State of California – set forth in Public Resources Code 41780.01 – that not less than 75 percent of solid waste generated be source reduced, recycled, or composted by the year 2020. In furtherance of the State’s policy goal, the ISWMP shall evaluate further improvements to the Airport’s existing solid waste diversion rate through enhanced recycling and composting opportunities.
• Audit waste streams to determine the waste baseline. • Encourage the procurement of materials and goods from local vendors/suppliers. • Encourage restaurants to contract with a biofuel firm to remove and recycle used
grease. • Perform a waste composition study to identify means of reducing waste or utilizing
waste streams for sustainable uses (biofuels, composting, livestock feed, etc.) • Provide language in tenant lease agreements to require recycling, document recycling
percentages and encourage materials reduction and reuse. Waste reduction is an incen-tive to achieve cost savings for the tenants, airlines, and the MPAD. Future modifica-tions to agreements to incentivize recycling efforts may help to improve recycling rates.
• Consider participating and encourage tenants to participate in the City of Monterey’s Food Scrap Collection Program. This would involve adding food scrap collection ser-vices to the terminal’s existing waste collection service. The goal of this program is to reduce landfill disposal, increase city-wide recycling rates, and produce a valuable compostable material, which generates electricity during the breakdown process (from captured methane).
• Encourage tenants to participate in the Monterey Peninsula Water Management District – Water Conservation Rebate Program to receive rebates on high efficiency toilets, dishwashers, water brooms and other water conservation devices.
GROUND ACCESS AND TRANSPORTATION Although airports are typically associated only with air transportation, they also function as surface transportation connection points. Surface transportation components at an air-port serve as the facility’s connection to the community. Typically, modes of surface trans-portation at an airport include private passenger vehicles, rental vehicles, public transit, and pedestrian or cycling access. The combination of these modes of transportation re-quires an efficient transportation network and adequate parking infrastructure to accom-modate all users. This section discusses the use of each mode of surface transportation at MRY.
AIRPORT MASTER PLAN – Monterey Regional Airport
SUSTAINABILITY BASELINE ASSESSMENT D-22 DRAFT-FEBRUARY 2015
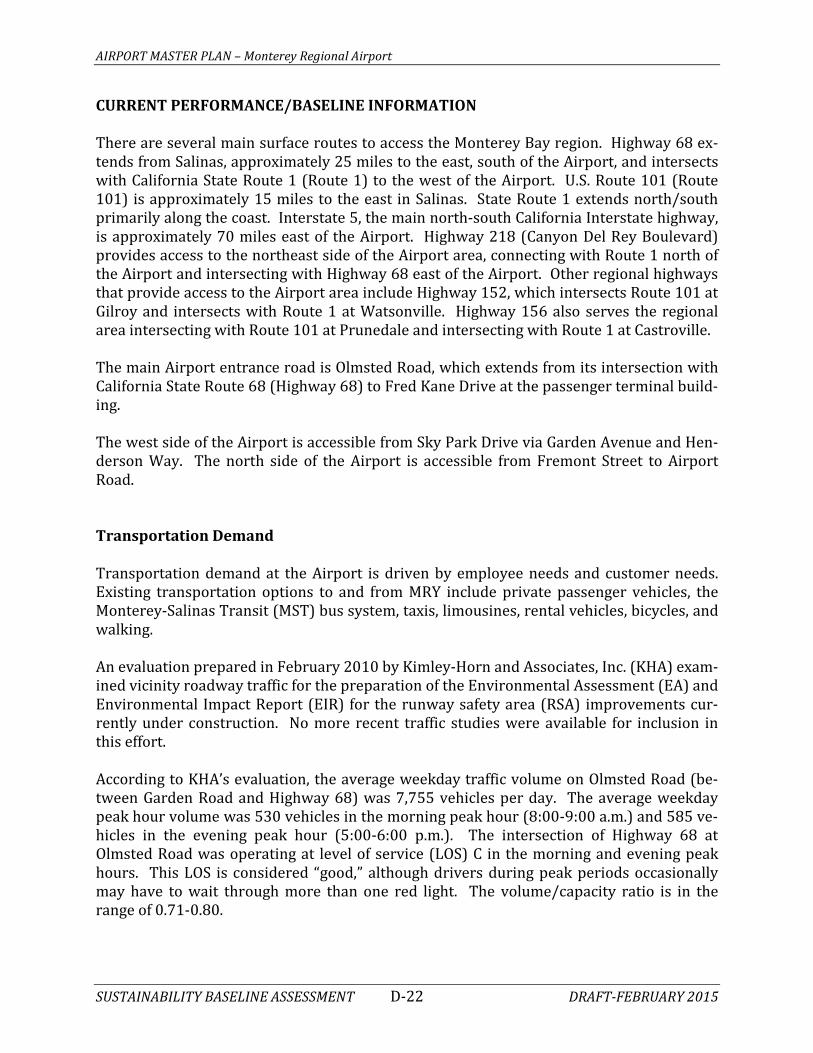
CURRENT PERFORMANCE/BASELINE INFORMATION There are several main surface routes to access the Monterey Bay region. Highway 68 ex-tends from Salinas, approximately 25 miles to the east, south of the Airport, and intersects with California State Route 1 (Route 1) to the west of the Airport. U.S. Route 101 (Route 101) is approximately 15 miles to the east in Salinas. State Route 1 extends north/south primarily along the coast. Interstate 5, the main north-south California Interstate highway, is approximately 70 miles east of the Airport. Highway 218 (Canyon Del Rey Boulevard) provides access to the northeast side of the Airport area, connecting with Route 1 north of the Airport and intersecting with Highway 68 east of the Airport. Other regional highways that provide access to the Airport area include Highway 152, which intersects Route 101 at Gilroy and intersects with Route 1 at Watsonville. Highway 156 also serves the regional area intersecting with Route 101 at Prunedale and intersecting with Route 1 at Castroville. The main Airport entrance road is Olmsted Road, which extends from its intersection with California State Route 68 (Highway 68) to Fred Kane Drive at the passenger terminal build-ing. The west side of the Airport is accessible from Sky Park Drive via Garden Avenue and Hen-derson Way. The north side of the Airport is accessible from Fremont Street to Airport Road. Transportation Demand Transportation demand at the Airport is driven by employee needs and customer needs. Existing transportation options to and from MRY include private passenger vehicles, the Monterey-Salinas Transit (MST) bus system, taxis, limousines, rental vehicles, bicycles, and walking. An evaluation prepared in February 2010 by Kimley-Horn and Associates, Inc. (KHA) exam-ined vicinity roadway traffic for the preparation of the Environmental Assessment (EA) and Environmental Impact Report (EIR) for the runway safety area (RSA) improvements cur-rently under construction. No more recent traffic studies were available for inclusion in this effort. According to KHA’s evaluation, the average weekday traffic volume on Olmsted Road (be-tween Garden Road and Highway 68) was 7,755 vehicles per day. The average weekday peak hour volume was 530 vehicles in the morning peak hour (8:00-9:00 a.m.) and 585 ve-hicles in the evening peak hour (5:00-6:00 p.m.). The intersection of Highway 68 at Olmsted Road was operating at level of service (LOS) C in the morning and evening peak hours. This LOS is considered “good,” although drivers during peak periods occasionally may have to wait through more than one red light. The volume/capacity ratio is in the range of 0.71-0.80.

AIRPORT MASTER PLAN – Monterey Regional Airport
SUSTAINABILITY BASELINE ASSESSMENT D-23 DRAFT-FEBRUARY 2015
The traffic demand on the vicinity roadway network is projected to increase based on the projected growth in enplanements at the Airport as well as increased traffic for businesses on and around the Airport, with the level of service declining to LOS D, which is considered “fair” by the Transportation Research Board, Highway Capacity Manual (2000), based upon volume/capacity ratios less than 0.90. At this level, delays may be substantial during por-tions of the rush hours, but enough lower volume periods occur to permit clearing of de-veloping lines, preventing excessive backups. Perceived poor circulation in and around the Airport, especially on Route 1 and Highway 218, is a contributor to passengers opting to use Airports in the Bay Area. California Government Code §65081.1 states that primary air carrier airports are required to have an Airport Ground Access Improvement Program (AGAIP) prepared by the regional transportation planning agency. The Final Metropolitan Transportation Plan (MTP) was adopted by the AMBAG Board in June 2014. A provision in the MTP indicates that the Transportation Planning Agency for Monterey County (TAMC) will develop an AGAIP in co-ordination with AMBAG. The City of Monterey’s General Plan - Policy c.13 and Program c.B-2, encourage widening of Highway 68 to four lanes of expressway. The Draft 2014 Monterey County Regional Transportation Plan (RTP), as produced by TAMC, states that regional improvements to the Highway 68 corridor will improve access to the Airport from destinations in the Salinas Valley. Two projects which are located ap-proximately seven miles to the east of the Airport are considered for Highway 68: • Highway 68 Commuter Improvements: This project will add capacity on State Route 68
to serve commuters by widening the roadway to four lanes between the existing four-lane highway at Toro Park and Corral de Tierra Road.
• Highway 68 Corral de Tierra Intersection Improvements: This project, sponsored by the County of Monterey, will make operation improvements to the Corral de Tierra inter-section, which is currently a bottleneck for regional commuters on Highway 68. The project will construct dual left turn lanes on westbound Highway 68, a merge lane on southbound Corral de Tierra, and a right turn lane on northbound Corral de Tierra.
The draft recommended Master Plan concept is also examining future Airport access points to the north side of the airfield. Three alternatives are being considered including 1) a connection from Highway 68 to a relocated service road; 2) a connection from Del Rey Gar-dens Drive to the relocated service road; and 3) extending General Jim Moore Boulevard southwest through its intersection with Highway 218. These alternatives are still under review and are subject to change. A more detailed discussion of these alternatives is pro-vided in Chapter Six of the Master Plan. As indicated in the MTP, regional transportation agencies should develop an AGAIP to ad-dress traffic congestion that occurs in the immediate vicinity of the Airport. Of particular concern is the intersection of Highway 68 and Olmsted Road, where morning and evening peaks have a LOS C. In the future, as activity at the Airport grows, the LOS is projected to decrease to D.
AIRPORT MASTER PLAN – Monterey Regional Airport
SUSTAINABILITY BASELINE ASSESSMENT D-24 DRAFT-FEBRUARY 2015
Ground Access to the Airport by Mode Public Transit Public transit options for reaching the Airport are limited to local bus services. Local bus service connects MRY to a broader transit network that includes rail and regional bus ser-vice. MST serves a 280 square-mile area of Monterey County and Southern Santa Cruz County. MST’s 60 routes serve an estimated population base of 422,000. There are 1,308 stops in the area served, including a stop on Fred Kane Drive in front of the Airport terminal. Grey-hound Bus and AmTrak train service are available in Salinas. MST provides bus service to the station in Salinas. Single Occupancy Vehicles Single occupancy vehicle modes of transportation available at the Airport include taxicabs, private shuttles, hotel-based courtesy van service, and rental vehicles. Taxicab services are subject to the Monterey County Regional Taxi Authority and are permitted by the MPAD. Taxi services available include: Associated Taxi; Central Coast Taxi; Sal’s Taxi; Salinas Yel-low Cab; Serra Yellow Cab; and Yellow Cab of Monterey County (dba Checker Cab). Each trip to/from the Airport is subject to a $3 airport surcharge. The rental car ready/return lot and the Quick Turn Around (QTA) facilities are located northwest of the terminal building. Rental car companies at MRY include: Alamo; Avis; Budget; Enterprise; Hertz; and National. Pedestrian and Cycling Access Pedestrian and cycling access to the Monterey Regional Airport is fairly limited. Sidewalks along Highway 68 lead to Olmsted Road, which lead to Fred Kane Drive and the terminal building. According to the Bicycle and Pedestrian Master Plan, prepared by the Transporta-tion Agency for Monterey County in December 2011, Garden Road is equipped with a Class II bicycle lane up to where it intersects with Olmstead Road, from which point cyclists could access the terminal facility. Highway 68 is also identified in this plan as a Caltrans bike route. Two bike storage containers are available for public use at the terminal’s east second level entrance. Parking Parking facilities at MRY include short-term and long-term public parking lots and employ-ee, rental car, and taxi/shuttle stand lots. Public parking lots total 438 spaces, and are charged at $20.00 per day for the upper short-term lot; $24 per day for the lower premium

AIRPORT MASTER PLAN – Monterey Regional Airport
SUSTAINABILITY BASELINE ASSESSMENT D-25 DRAFT-FEBRUARY 2015
short-term lot; and $10 per day for the long-term lot. The employee parking lot has 137 spaces; the rental car lot has 231 spaces; and the taxi/shuttle stand has 27 spaces. In total, there are 833 total spaces serving the airport terminal facility. The draft recommended Master Plan concept has initially identified plans to expand terminal area parking capacity to 1,298 spaces. According to parking records kept by Republic Parking, there were a total of 138,455 re-ceipts for vehicles using the public parking lots at the Airport in 2013. This equates to 379 vehicle trips to the public Airport parking lots on average each day. The peak month for the 2013 calendar year was July with 9.5 percent of annual parking receipts. POTENTIAL OPPORTUNITIES FOR PERFORMANCE IMPROVEMENT An initial list of potential opportunities for improvements is identified below. These oppor-tunities will be further evaluated, along with other sustainability initiatives that will be lat-er identified as part of a subsequent task in the sustainability master planning process. • Provide incentives to employees to use public transportation, such as subsidized bus
passes, to reduce emissions and parking required. • Communicate with local and regional transit authorities to advance multiple transit
connection opportunities. • Establish an image that promotes bicycle transit by providing incentives for employees
to bike to work. Consider a bike-sharing program for employees and passengers. • Provide infrastructure to facilitate shared vehicle usage such as carpool drop-off areas,
or car-share services. Implement incentives such as rebates and/or preferred parking for staff vanpools/carpools for five percent of the total provided parking spaces.
• Provide incentives to airport staff and the public to encourage the use of alternative fuel vehicles (the Airport has begun to do this by providing electric-vehicle charging sta-tions on-site).
• Encourage the use of alternatively fueled GSE and shuttle buses. • Develop a reduced vehicle idling plan for commercial vehicles, construction vehicles,
airport service vehicles, tenant vehicles GSE. Initiate a system to regulate private vehi-cle idling, including issuing notices or fines for vehicles that are left idling for excessive periods.
WATER QUALITY Potable water consumption has a significant impact on the local and regional environment and affects the Airport’s energy footprint since that water must be pumped, cleaned, and processed. This section analyzes the Airport’s water consumption by source.

AIRPORT MASTER PLAN – Monterey Regional Airport
SUSTAINABILITY BASELINE ASSESSMENT D-26 DRAFT-FEBRUARY 2015
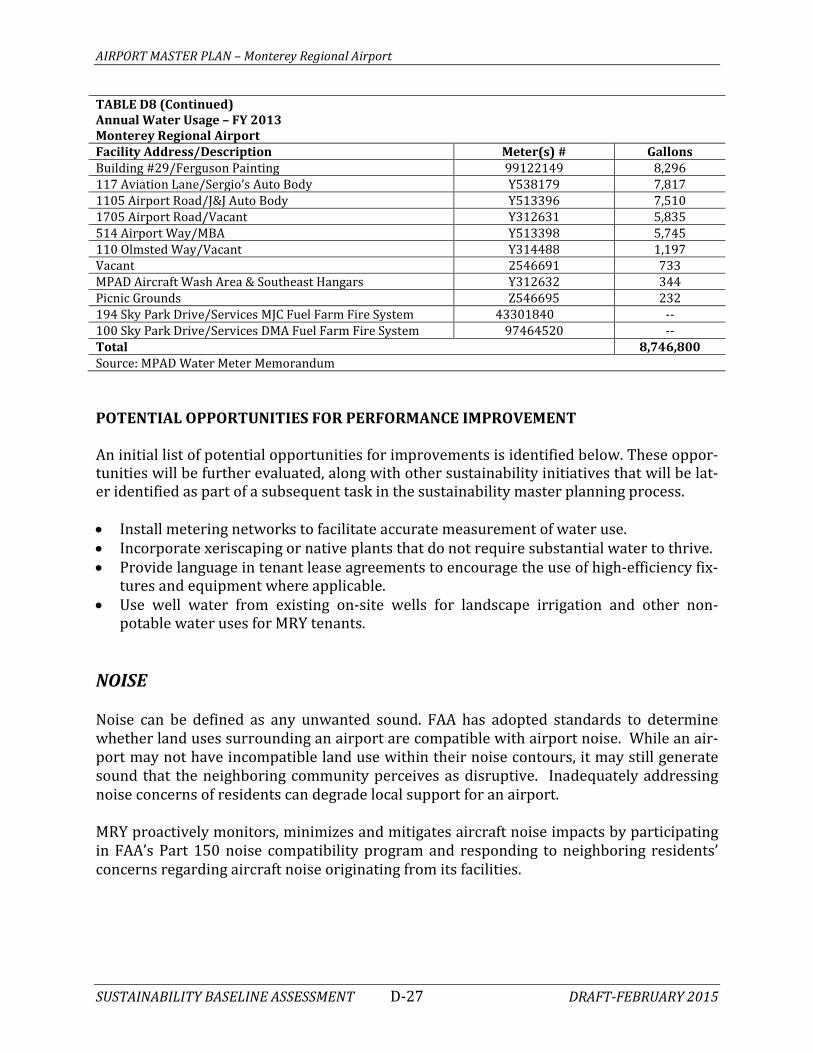
CURRENT PERFORMANCE/BASELINE INFORMATION The MPAD monitors 5 water meters and 45 sub meters throughout the Airport, which are supplied by the California American Water company (Cal Am). The fiscal year 2013 totals for each of those meters are provided in Table D8. The total water consumption for these meters was over 8.7 million gallons, of which the terminal building accounted for only 9,815 gallons or 0.05 gallons per enplanement in 2013. The public restroom facilities in the terminal building are equipped with high-efficiency fixtures. The MPAD also manages three water wells, which produced approximately 133,500 gallons of water in 2013. An additional five wells on the north side of the Airport, which were previously Army Corps of Engineer remediation wells, are now managed by the MPAD. An assessment of these wells will be conducted in Spring/Summer 2015 to determine the well capacity/production and its highest and best use. Additionally, this assessment is funded by the Monterey Peninsula Water Management District as a local water project that can potentially improve local wa-ter supply by offsetting current demand for Cal Am resources. TABLE D8 Annual Water Usage – FY 2013 Monterey Regional Airport Facility Address/Description Meter(s) # Gallons 300 Sky Park Drive/Monterey Jet Center (MJC) Y522108
Y522109 SN77630 Y522106 Y522111
3,410,369
100 Sky Park Drive/Del Monte Aviation (DMA) Y531824 1,180,875 70 Sky Park Drive/QTA Facility Sub-meter #08184235 850,086 1102 Airport Road/Legal Research I 94579409 703,244 1174 Airport Road/517 Airport Way/BHH 005040 618,415 120 Olmsted Way/DMA East Hangar 28383 473,143 202 Sky Park Drive 75341611
60274588 458,705
400 Sky Park Way/Sky Park Self-Storage Well #2328936 44859790
253,477
99 Sky Park Drive/ MPAD Maintenance Department S528893 159,260 198 Sky Park Drive/MJC 60129459
73459062 142,803
506 Airport Way Y513430 84,111 MPAD Fire Department 60823038 83,939 102 Aviation Lane/Legal Research II P-021963 77,087 270 Sky Park Drive MJC 33929426
07001316 53,665
1248 Airport Road/NSSI, Inc. 2546697 40,238 1101 Airport Road/Searle Electric Y535334 27,738 505 Airport Way Y515976 21,349 101 Aviation Lane/Forza Y513394 18,769 1600 Airport Road/MNFC 99122146 16,734 1118 Airport Road/Airport Road Self-Storage 60262621 12,919 510 Airport Way/Commercial Woodworking Y535333 12,350 MPAD/Terminal, Southeast Offices and Hangars 14612 9,815
AIRPORT MASTER PLAN – Monterey Regional Airport
SUSTAINABILITY BASELINE ASSESSMENT D-27 DRAFT-FEBRUARY 2015
TABLE D8 (Continued) Annual Water Usage – FY 2013 Monterey Regional Airport Facility Address/Description Meter(s) # Gallons Building #29/Ferguson Painting 99122149 8,296 117 Aviation Lane/Sergio’s Auto Body Y538179 7,817 1105 Airport Road/J&J Auto Body Y513396 7,510 1705 Airport Road/Vacant Y312631 5,835 514 Airport Way/MBA Y513398 5,745 110 Olmsted Way/Vacant Y314488 1,197 Vacant 2546691 733 MPAD Aircraft Wash Area & Southeast Hangars Y312632 344 Picnic Grounds Z546695 232 194 Sky Park Drive/Services MJC Fuel Farm Fire System 43301840 -- 100 Sky Park Drive/Services DMA Fuel Farm Fire System 97464520 -- Total 8,746,800 Source: MPAD Water Meter Memorandum POTENTIAL OPPORTUNITIES FOR PERFORMANCE IMPROVEMENT An initial list of potential opportunities for improvements is identified below. These oppor-tunities will be further evaluated, along with other sustainability initiatives that will be lat-er identified as part of a subsequent task in the sustainability master planning process. • Install metering networks to facilitate accurate measurement of water use. • Incorporate xeriscaping or native plants that do not require substantial water to thrive. • Provide language in tenant lease agreements to encourage the use of high-efficiency fix-
tures and equipment where applicable. • Use well water from existing on-site wells for landscape irrigation and other non-
potable water uses for MRY tenants.
NOISE Noise can be defined as any unwanted sound. FAA has adopted standards to determine whether land uses surrounding an airport are compatible with airport noise. While an air-port may not have incompatible land use within their noise contours, it may still generate sound that the neighboring community perceives as disruptive. Inadequately addressing noise concerns of residents can degrade local support for an airport. MRY proactively monitors, minimizes and mitigates aircraft noise impacts by participating in FAA’s Part 150 noise compatibility program and responding to neighboring residents’ concerns regarding aircraft noise originating from its facilities.
AIRPORT MASTER PLAN – Monterey Regional Airport
SUSTAINABILITY BASELINE ASSESSMENT D-28 DRAFT-FEBRUARY 2015
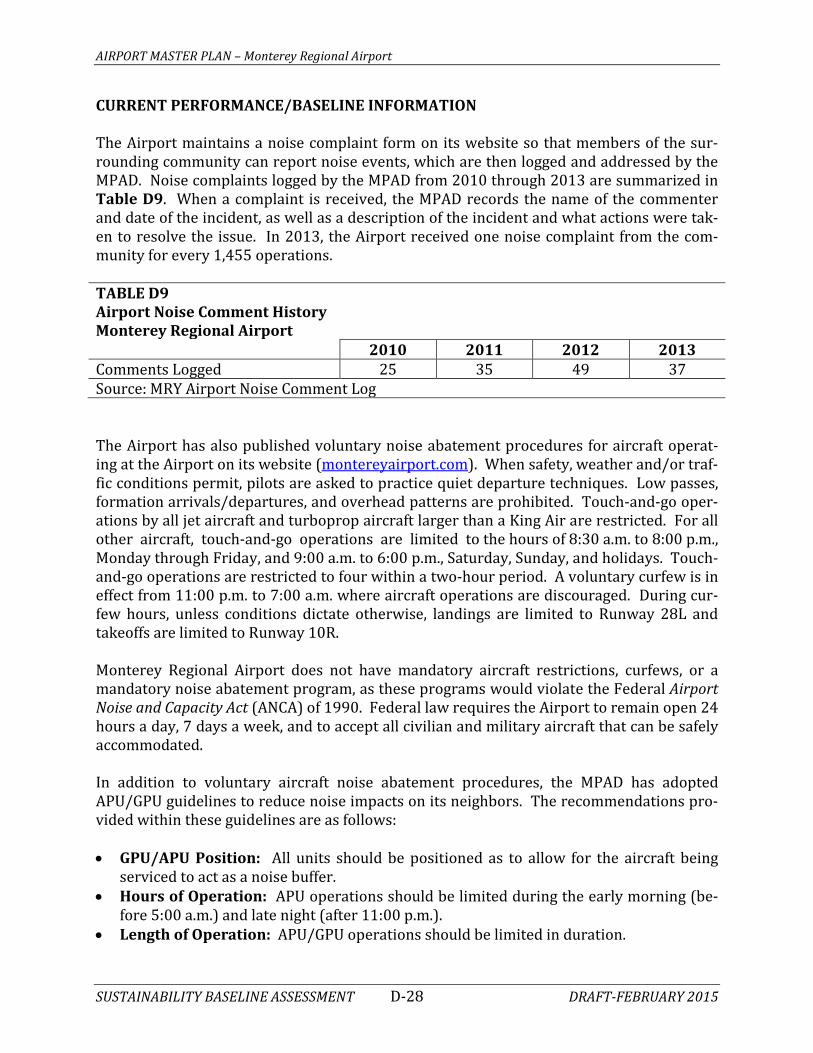
CURRENT PERFORMANCE/BASELINE INFORMATION The Airport maintains a noise complaint form on its website so that members of the sur-rounding community can report noise events, which are then logged and addressed by the MPAD. Noise complaints logged by the MPAD from 2010 through 2013 are summarized in Table D9. When a complaint is received, the MPAD records the name of the commenter and date of the incident, as well as a description of the incident and what actions were tak-en to resolve the issue. In 2013, the Airport received one noise complaint from the com-munity for every 1,455 operations. TABLE D9 Airport Noise Comment History Monterey Regional Airport 2010 2011 2012 2013 Comments Logged 25 35 49 37 Source: MRY Airport Noise Comment Log The Airport has also published voluntary noise abatement procedures for aircraft operat-ing at the Airport on its website (montereyairport.com). When safety, weather and/or traf-fic conditions permit, pilots are asked to practice quiet departure techniques. Low passes, formation arrivals/departures, and overhead patterns are prohibited. Touch-and-go oper-ations by all jet aircraft and turboprop aircraft larger than a King Air are restricted. For all other aircraft, touch-and-go operations are limited to the hours of 8:30 a.m. to 8:00 p.m., Monday through Friday, and 9:00 a.m. to 6:00 p.m., Saturday, Sunday, and holidays. Touch-and-go operations are restricted to four within a two-hour period. A voluntary curfew is in effect from 11:00 p.m. to 7:00 a.m. where aircraft operations are discouraged. During cur-few hours, unless conditions dictate otherwise, landings are limited to Runway 28L and takeoffs are limited to Runway 10R. Monterey Regional Airport does not have mandatory aircraft restrictions, curfews, or a mandatory noise abatement program, as these programs would violate the Federal Airport Noise and Capacity Act (ANCA) of 1990. Federal law requires the Airport to remain open 24 hours a day, 7 days a week, and to accept all civilian and military aircraft that can be safely accommodated. In addition to voluntary aircraft noise abatement procedures, the MPAD has adopted APU/GPU guidelines to reduce noise impacts on its neighbors. The recommendations pro-vided within these guidelines are as follows: • GPU/APU Position: All units should be positioned as to allow for the aircraft being
serviced to act as a noise buffer. • Hours of Operation: APU operations should be limited during the early morning (be-
fore 5:00 a.m.) and late night (after 11:00 p.m.). • Length of Operation: APU/GPU operations should be limited in duration.
AIRPORT MASTER PLAN – Monterey Regional Airport
SUSTAINABILITY BASELINE ASSESSMENT D-29 DRAFT-FEBRUARY 2015
• Equipment Review: All APU/GPU equipment should be thoroughly analyzed, main-tained and reviewed on a regular basis. Older units and poorly maintained units often create more noise than newer or properly maintained units.
• Sound Suppression Muffler: It is requested that a sound suppression muffler be in-stalled on all GPU units operating at MRY.
To promote compatible land uses in the airport environs, Monterey Regional Airport has undertaken three 14 CFR Part 150 noise compatibility studies (1986, 1998, and 2008) to assess aircraft noise within the airport environs. The studies include the preparation of noise exposure contours, which are overlain on existing land use maps to evaluate the ef-fect of airport noise on the surrounding community. Noise contours have been prepared for this Master Plan; however, Part 150 noise studies are a much more detailed analysis and therefore, for the purposes of noise abatement, the MPAD has adopted the most recent Part 150 as its official noise contours. For more information on the noise contours pre-pared for this Master Plan, see Appendix B, Environmental Overview. As a result of the Part 150 noise studies, the MPAD proposed a Noise Compatibility Pro-gram to the FAA, including many components that were implemented, such the Residential Sound Insulation Program (RSIP). The RSIP involved the installation of central air condi-tioning systems, improved insulation, and/or installation of double-glazed windows. The neighborhoods impacted by this program include: Upper Oak-Knoll; Lower Oak-Knoll; Villa Del Monte; Live Oaks Park; and Del Monte Beach. The RSIP began in 1989 and was closed out in June 2010, during which period 852 units were treated, improving the quality of life of 1,814 people. Participation rates were high with 92 percent of the eligible dwelling units being treated by the program. Those units that were eligible for the program but went un-treated opted out of the program. Economic benefits of the RSIP include over $23 million dollars spent by the MPAD for sound insulation work as well as district, consultant, and contractor planning and imple-mentation efforts. The RSIP resulted in improved housing quality in noise-impacted neigh-borhoods with an average of $20,000 of improvements per home. According to a report prepared by The Jones Payne Group for the MPAD, entitled Residen-tial Sound Insulation Program, additional benefits of the RSIP include quality of life benefits including: • Decreased infiltration of aircraft noise into the home. • Upgraded building envelopes with replacement of windows and doors. • Improved thermal performance and life-safety of housing stock with added insulation,
updated egress & occupancy, and hazardous materials remediation. • Contributed to community goodwill. • Encourage and promote incentives for airlines to implement quiet technology.
AIRPORT MASTER PLAN – Monterey Regional Airport
SUSTAINABILITY BASELINE ASSESSMENT D-30 DRAFT-FEBRUARY 2015
POTENTIAL OPPORTUNITIES FOR PERFORMANCE IMPROVEMENT MPAD has established a robust noise mitigation program that has already had a significant impact on reducing the noise exposure to the surrounding communities. These programs should be maintained and reporting efforts continued. The following initiatives should be considered in addition to MPAD’s existing program: • Provide electrical hookups at aircraft parking positions to eliminate APU/GPU use. • Monitor aircraft noise issues and update noise assessment studies as needed. MRY TENANT SUSTAINABILITY QUESTIONNAIRE As part of the Baseline Assessment for the Master Plan, the MPAD has distributed a ques-tionnaire to its tenants (e.g., fixed base operators, specialty operators, and aircraft owners). The purpose of the questionnaire is to supplement the sustainability baseline effort with tenant’s consumption information, existing sustainability initiatives, and priorities for fu-ture sustainability development at the Airport. The questionnaire also serves to engage the tenants in the Airport’s sustainability programs and raise awareness of the MRY Sustaina-bility Master Plan. The questionnaire was emailed to approximately 45 tenants and to-date, five responses have been submitted. The questionnaire period is still open for tenants to complete and responses will be collected through March 20, 2015. The following bullets summarize the responses received to-date:
• Four of the respondents already participate in sustainability initiatives, primarily recycling programs for metals, electronics, plastics, and glass. None of the tenants has any initiatives to reduce water usage, such as high-efficiency water fixtures; however, two tenants do plan to implement water-efficiency initiatives in the next five years. Other future initiatives planned include the implementation of high-efficiency lighting and employee training programs.
• None of the respondents has existing programs to monitor or measure their sus-tainability performance.
• When asked to rank sustainability initiatives in order of importance, respondents felt energy efficiency/on-site generation initiatives were the most important fol-lowed by surface transportation initiatives, natural resource management initia-tives, water conservation and water quality initiatives, waste management, and re-cycling initiatives. The two areas ranked as the least important were socioeconomic and community initiatives, and air quality and greenhouse gas emissions reduction initiatives.
• Three of the respondents estimated that their facilities consumed less than 100 kWhs on average each month, while another tenant estimated their consumption at between 100 kWhs to 499 kWhs each month.

AIRPORT MASTER PLAN – Monterey Regional Airport
SUSTAINABILITY BASELINE ASSESSMENT D-31 DRAFT-FEBRUARY 2015
• None of the respondents consumes natural gas, diesel fuel, or propane fuel in their facilities or equipment.
• Gasoline usage for fleet vehicles varied from less than 100 gallons to 600-699 gal-lons each month.
• Water usage from each respondent was estimated to be below 1,000 gallons each month.
• Only one respondent reported having an on-site MSW dumpster and recycling bin. Their dumpster capacity is two cubic yards and their recycling bin size is 32 gallons. A waste service provider empties both receptacles once every other week.
• None of the respondents reported disposing of construction or demolition waste on a regular basis.
NEXT STEPS Based on the analysis, discussion, and conclusions provided in this Baseline Assessment, program goals, objectives, and performance targets for each focus area will be identified. These program components will provide the overall direction of the Airport’s Sustainability Master Plan. Subsequently, the specific sustainability initiatives will be identified and eval-uated based upon their ability to support the MPAD in achieving its established goals. Please note this appendix will be updated in future printings of the Airport Master Plan.

Attachment 1
GREENHOUSE GASEMISSIONS INVENTORY
GREENHOUSE GAS EMISSIONS INVENTORY
for
MONTEREY REGIONAL AIRPORT
Prepared for the:
Monterey Peninsula Airport District
Prepared by:
Coffman and Associates KB Environmental Sciences, Inc.
August 30, 2014
PRELIMINARY DRAFT

Monterey Regional Airport
Greenhouse Gas Emissions Inventory i August 30, 2014
This page intentionally left blank.

Monterey Regional Airport
Greenhouse Gas Emissions Inventory ii August 30, 2014
TABLE OF CONTENTS 1 Purpose of the GHG Emissions Inventory ............................................................................... 1
2 GHG Regulatory Initiatives ...................................................................................................... 3
2.1 Nationwide ...................................................................................................................... 3
2.2 Statewide ........................................................................................................................ 4
3 GHG Inventory Approach and Methodology .......................................................................... 5
3.1 Approach and Methodology ........................................................................................... 5
3.2 Terms and Concepts ....................................................................................................... 6
3.3 Sources of GHG Emissions .............................................................................................. 8
3.4 Types of GHG Emissions .................................................................................................. 9
3.5 GHG Inventory Boundaries ........................................................................................... 10
3.6 Analysis Years ................................................................................................................ 10
3.7 Sources of Information and Data .................................................................................. 10
4 GHG Emissions Inventory Results ......................................................................................... 11
4.1 2013 GHG Emissions Inventory Results ........................................................................ 13
4.2 2018, 2023, and 2033 GHG Emissions Inventory Results ............................................. 16
5 Conclusions ........................................................................................................................... 20
APPENDIX A – DETAILED DATA, ASSUMPTIONS, AND METHODOLOGY
APPENDIX B – DETAILED RESULTS

Monterey Regional Airport
Greenhouse Gas Emissions Inventory iii August 30, 2014
LIST OF TABLES ES-1 Summary of GHG Emissions Inventory Results ................................................................ v
1 Sources of GHG Emissions ............................................................................................. 19
2 Sources of GHG Emissions by Source Category, Activity, and Scope ............................ 10
3 Sources of Information and Data ................................................................................... 11
4 GHG Emissions Inventory by Year .................................................................................. 12
5 GHG Emissions Inventory for 2013 ................................................................................ 14
6 GHG Emissions Inventory for 2018 ................................................................................ 17
7 GHG Emissions Inventory for 2023 ................................................................................ 18
8 GHG Emissions Inventory for 2033 ................................................................................ 19
LIST OF FIGURES ES-1 GHG Emissions Inventory Results by Category and Year ................................................. vi
1 GHG Inventory Boundaries .............................................................................................. 7
2 GHG Emissions Inventory by Year .................................................................................. 12
3 2013 GHG Emissions Inventory by Category ................................................................. 15
4 2013 GHG Emissions within Category 1 ......................................................................... 15
5 2013 GHG Emissions within Category 2 ......................................................................... 16
6 GHG Emissions Inventory Results by Category and Year ............................................... 20
Monterey Regional Airport
Greenhouse Gas Emissions Inventory iv August 30, 2014
EXECUTIVE SUMMARY
A greenhouse gas (GHG) emissions inventory was completed to provide an accounting of GHGs for Monterey Regional Airport (MRY). The primary purposes of this GHG emissions inventory were to:
Identify the principal sources of GHGs associated with MRY;
Estimate existing (2013) and future (2018, 2023, and 2033) emissions; and
Enable the Monterey Peninsula Airport District (MPAD), owner and operator of MRY, to demonstrate consistency with the California Global Warming Solutions Act of 2006.
This emissions inventory was prepared following guidance established by the United States Environmental Protection Agency (USEPA), United Nations Intergovernmental Panel on Climate Change (IPCC), Energy Information Administration (EIA), Federal Aviation Administration (FAA), and the California Air Resources Board (CARB). GHG emissions were calculated based on approved emission models, emission factors and other commonly used and widely accepted guidance materials. For further accuracy, operational data and other information specific to MRY were used to the fullest extent possible. This GHG emissions inventory was strictly voluntary and was not prepared in response to any regulatory requirements state-wide, nationally, or globally.
The computation of GHGs was conducted for the year 2013 which served as the existing condition for this analysis. This year was specifically selected because it represents the most current year for which the necessary data for MRY were available. For comparative purposes, future years 2018, 2023, and 2033 were also analyzed to correspond to the planning horizons within the Master Plan Update.
The GHGs included in this inventory were comprised of carbon dioxide (CO2), methane (CH4), and nitrous oxide (N2O). The results were then converted to CO2 equivalent (CO2e) values using appropriate Global Warming Potential (GWP) values and reported in metric tons (MT). It was found that the vast majority (99 percent) of the GHG emissions associated with MRY were in the form of CO2 while the remainder was CH4 and N2O. The following is a summary of the main findings obtained from this GHG emissions inventory:
GHG emissions were summarized by Ownership and Control Boundaries, of which there are three Categories. Category 1 emissions (i.e., sources that are owned and controlled by MPAD) represented 1 percent of the total GHG emissions. Category 2 emissions (i.e., sources that are owned and controlled by Tenants) represented 96 percent of the total GHG emissions. Finally, Category 3 emissions (i.e., sources that are owned and controlled by the Public) comprised 3 percent of the total GHG emissions. These percentages remained consistent for 2018, 2023, and 2033.
GHG emissions were also summarized by Operational Boundaries, of which there are three Scopes. Scope 1 (e.g., stationary sources) and Scope 2 (e.g., electrical consumption)

Monterey Regional Airport
Greenhouse Gas Emissions Inventory v August 30, 2014
represented approximately less than 1 and 1 percent of total GHG emissions, respectively. The majority of the GHG emissions (99 percent) were classifiable as Scope 3 (i.e., associated with the activities from sources owned and controlled by others). Notably, MPAD has the least control and management potential over Scope 3, as compared to Scopes 1 and 2 which the MPAD can either control or have some influence over.
GHG emissions estimated for 2018, 2023, and 2033 remained comparatively similar to the 2013 conditions, specifically in terms of the largest contributors by Category and Scope. The top contributors were vehicles using on-airport roadways, aircraft, and vehicles using off-airport roadways.
Table ES-1 displays the total GHG emissions estimated for 2013, 2018, 2023, and 2033 by Category. As shown, from 2011 to 2018, total GHG emissions at MRY were estimated to increase by 8 percent, from 2011 to 2023 emissions were estimated to increase by 20 percent, and from 2011 to 2033 emissions were estimated to increase by 49 percent. These increases are due largely to increases in aircraft operations and enplanements attributable to projected regional growth in air travel demand (and the corresponding demand for ground transportation and parking). However, the GHG emissions per operation (0.75 metric tons) and per passenger enplanement (0.19 metric tons) are estimated to decrease steadily throughout the period due in part to initiatives implemented by the MPAD and regulatory-driven efficiencies associated with ground support equipment (GSE) and motor vehicles.
Table ES-1: Summary of GHG Emissions Inventory Results
Category CO2e (MT)
2013 2018 2023 2033 Airport – Category 1 664 719 790 963 Tenant – Category 2 1,135 1,301 1,481 1,923 Public – Category 3 38,551 41,487 46,031 57,431 Total Emissions 40,350 43,507 48,301 60,317

Monterey Regional Airport
Greenhouse Gas Emissions Inventory vi August 30, 2014
Figure ES-1 presents the emissions within Categories 1, 2, and 3 for 2013, 2018, 2023, and 2033. As illustrated, sources owned and controlled by tenants contributed the majority of GHG emissions.
Figure ES-1: GHG Emissions Inventory Results by Category and Year
-
10,000
20,000
30,000
40,000
50,000
60,000
2013 2018 2023 2033
Airport Public Tenant

Monterey Regional Airport
Greenhouse Gas Emissions Inventory 1 August 30, 2014
1 Purpose of the GHG Emissions Inventory
There is presently a broad scientific consensus that greenhouse gases (GHG) associated with human activities are contributing to changes in the earth’s atmosphere. These GHGs, brought about principally by the combustion of fossil fuels, decomposition of waste materials, and deforestation, are linked to an increase in the earth’s average temperature by means of a phenomenon called the “greenhouse effect”.1
As GHG emissions from human activities increase, they contribute to the greenhouse effect and warming of the climate, which in turn leads to many other changes around the world—in the atmosphere, on land, and in the oceans. These changes have potential for both positive and negative effects on people, plants, and animals. Since many of the major GHGs remain in the atmosphere for tens to hundreds of years after being released, their warming effects on the climate could become long-lasting.
On behalf of the Monterey Peninsula Airport District (MPAD), owner and operator of Monterey Regional Airport (MRY), Coffman and Associates and KB Environmental Sciences, Inc. (KBE) have conducted a GHG emissions inventory for MRY. The purposes of this GHG Emissions Inventory were to:
Identify the principal sources of GHGs associated with the operation of MRY;
Quantify GHG emissions for existing (2013) and future (2018, 2023, and 2033) conditions; and
Serve as a guide to the MPAD in their development of both short- and long-term policies directed at reducing MRY’s overall contribution of GHGs and to demonstrate consistency with the California Global Warming Solutions Act of 2006.
MPAD is among several airport operators nationwide that are undertaking proactive efforts to quantify GHGs associated with their facilities. These assessments have been initiated despite evidence that the aviation sector is among the lowest man-made contributors to GHG emissions both world- and nation-wide, and that the role of airport-related GHGs on global climate change is presently not fully understood.2
1 The phenomenon whereby certain gases in the atmosphere, such as carbon dioxide, water vapor, and methane, allow incoming sunlight to pass through, but trap, absorb, and retain heat radiated back from the earth's surface. Without this effect the earth would not be warm enough to support life. 2 Estimates of total aviation-related GHG emission contributions to man-made totals world-wide range from 2 to 5 percent (Intergovernmental Panel on Climate Change, 2001).
Aerial View of MRY
Monterey Regional Airport
Greenhouse Gas Emissions Inventory 2 August 30, 2014
The California Global Warming Solutions Act of 2006, best known as AB 32, signed into law on September 27, 2006, by Governor of California Arnold Schwarzenegger, created a first-in-the country comprehensive program to achieve real, quantifiable and cost-effective reductions in GHGs. The Act requires the CARB to lower GHG emissions to 1990 levels by 2020—a 25 percent reduction statewide, with mandatory caps for significant emissions sources. Importantly, these reduction targets are focused principally on the largest contributors of GHGs (e.g., electrical generation, stationary sources, motor vehicles, etc.). Since the aviation sector (including airports, aircraft, and the supporting infrastructure) represents such a small percentage of the overall total, it is typically not placed alongside these groups. Moreover, there are presently no regulations or other requirements on either the federal or state levels governing airport-related GHGs. This GHG emissions inventory for MRY is strictly voluntary and has not been prepared in response to any regulatory requirements state-wide, nationally or globally.
There is still much uncertainty about the causes, effects and solutions to global climate change and, in many aspects, the topic is presently in a very dynamic state. As such, it should be clear that the information in this document is based on the premise that changes to the earth’s climate are occurring and must be addressed, but it is not within the scope of this initiative by MPAD to further assess or comment on the broader scientific, political or social issues surrounding the effects of GHGs.
The information, data and recommendations contained in this report were developed in accordance with procedures and practices that are current and considered appropriate for this highly specialized application. The GHG emissions inventory was conducted following three commonly used and widely accepted guidelines for assessing GHG emissions associated with the aviation sector, in general, or airports in particular:
Transportation Research Board, Airport Cooperative Research Program (ACRP) Report 11, Guidebook on Preparing Airport Greenhouse Gas Emissions Inventories3;
United States Environmental Protection Agency (USEPA) Climate Leaders Greenhouse Gas Inventory Protocol Core Module Guidance, Optional Emissions from Commuting, Business Travel and Product Transport4; and the
Intergovernmental Panel on Climate Change (IPCC) Guidelines for National Greenhouse Gas Inventories. 5
3 Transportation Research Board, ACRP Report 11, Guidebook on Preparing Airport Greenhouse Gas Emissions Inventories, 2009, http://onlinepubs.trb.org/onlinepubs/acrp/acrp_rpt_011.pdf. 4 United States Environmental Protection Agency, Climate Leaders Greenhouse Gas Inventory Protocol Core Module Guidance, Optional Emissions from Commuting, Business Travel and Product Transport, May 2008, http://www.epa.gov/climateleadership/documents/resources/commute_travel_product.pdf. 5 IPCC Guidelines for National Greenhouse Gas Inventories, Volume 2, 2006, www.ipcc-nggip.iges.or.jp/public/gl/invs5.htm.
This GHG Emissions Inventory for MRY enables MPAD to demonstrate consistency with the
California Global Warming Solutions Act of 2006.
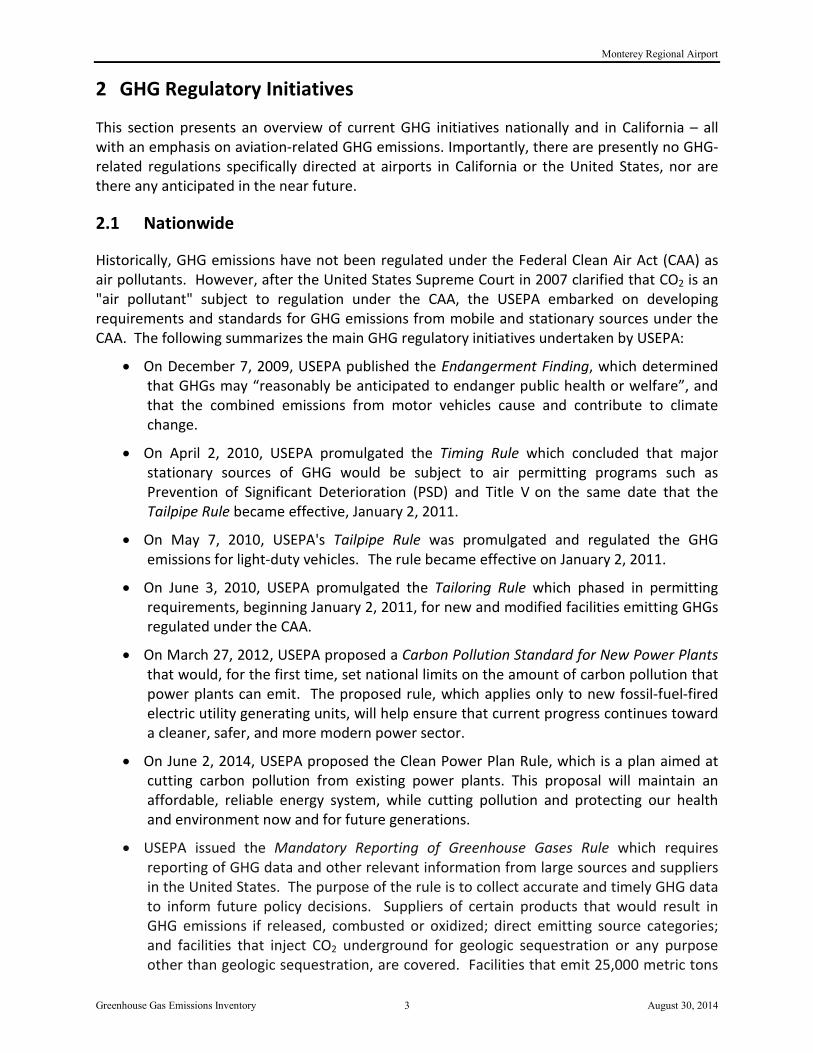
Monterey Regional Airport
Greenhouse Gas Emissions Inventory 3 August 30, 2014
2 GHG Regulatory Initiatives
This section presents an overview of current GHG initiatives nationally and in California – all with an emphasis on aviation-related GHG emissions. Importantly, there are presently no GHG-related regulations specifically directed at airports in California or the United States, nor are there any anticipated in the near future.
2.1 Nationwide
Historically, GHG emissions have not been regulated under the Federal Clean Air Act (CAA) as air pollutants. However, after the United States Supreme Court in 2007 clarified that CO2 is an "air pollutant" subject to regulation under the CAA, the USEPA embarked on developing requirements and standards for GHG emissions from mobile and stationary sources under the CAA. The following summarizes the main GHG regulatory initiatives undertaken by USEPA:
• On December 7, 2009, USEPA published the Endangerment Finding, which determined that GHGs may “reasonably be anticipated to endanger public health or welfare”, and that the combined emissions from motor vehicles cause and contribute to climate change.
• On April 2, 2010, USEPA promulgated the Timing Rule which concluded that major stationary sources of GHG would be subject to air permitting programs such as Prevention of Significant Deterioration (PSD) and Title V on the same date that the Tailpipe Rule became effective, January 2, 2011.
• On May 7, 2010, USEPA's Tailpipe Rule was promulgated and regulated the GHG emissions for light-duty vehicles. The rule became effective on January 2, 2011.
• On June 3, 2010, USEPA promulgated the Tailoring Rule which phased in permitting requirements, beginning January 2, 2011, for new and modified facilities emitting GHGs regulated under the CAA.
• On March 27, 2012, USEPA proposed a Carbon Pollution Standard for New Power Plants that would, for the first time, set national limits on the amount of carbon pollution that power plants can emit. The proposed rule, which applies only to new fossil-fuel-fired electric utility generating units, will help ensure that current progress continues toward a cleaner, safer, and more modern power sector.
• On June 2, 2014, USEPA proposed the Clean Power Plan Rule, which is a plan aimed at cutting carbon pollution from existing power plants. This proposal will maintain an affordable, reliable energy system, while cutting pollution and protecting our health and environment now and for future generations.
• USEPA issued the Mandatory Reporting of Greenhouse Gases Rule which requires reporting of GHG data and other relevant information from large sources and suppliers in the United States. The purpose of the rule is to collect accurate and timely GHG data to inform future policy decisions. Suppliers of certain products that would result in GHG emissions if released, combusted or oxidized; direct emitting source categories; and facilities that inject CO2 underground for geologic sequestration or any purpose other than geologic sequestration, are covered. Facilities that emit 25,000 metric tons
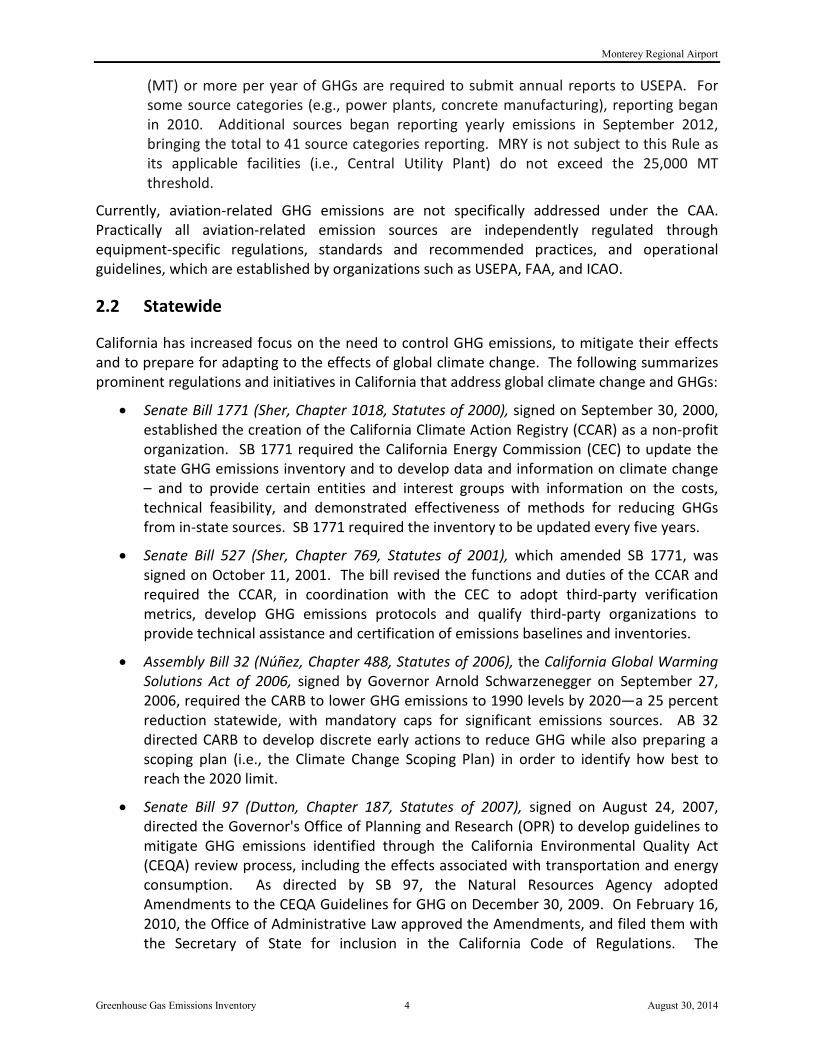
Monterey Regional Airport
Greenhouse Gas Emissions Inventory 4 August 30, 2014
(MT) or more per year of GHGs are required to submit annual reports to USEPA. For some source categories (e.g., power plants, concrete manufacturing), reporting began in 2010. Additional sources began reporting yearly emissions in September 2012, bringing the total to 41 source categories reporting. MRY is not subject to this Rule as its applicable facilities (i.e., Central Utility Plant) do not exceed the 25,000 MT threshold.
Currently, aviation-related GHG emissions are not specifically addressed under the CAA. Practically all aviation-related emission sources are independently regulated through equipment-specific regulations, standards and recommended practices, and operational guidelines, which are established by organizations such as USEPA, FAA, and ICAO.
2.2 Statewide
California has increased focus on the need to control GHG emissions, to mitigate their effects and to prepare for adapting to the effects of global climate change. The following summarizes prominent regulations and initiatives in California that address global climate change and GHGs:
• Senate Bill 1771 (Sher, Chapter 1018, Statutes of 2000), signed on September 30, 2000, established the creation of the California Climate Action Registry (CCAR) as a non-profit organization. SB 1771 required the California Energy Commission (CEC) to update the state GHG emissions inventory and to develop data and information on climate change – and to provide certain entities and interest groups with information on the costs, technical feasibility, and demonstrated effectiveness of methods for reducing GHGs from in-state sources. SB 1771 required the inventory to be updated every five years.
• Senate Bill 527 (Sher, Chapter 769, Statutes of 2001), which amended SB 1771, was signed on October 11, 2001. The bill revised the functions and duties of the CCAR and required the CCAR, in coordination with the CEC to adopt third-party verification metrics, develop GHG emissions protocols and qualify third-party organizations to provide technical assistance and certification of emissions baselines and inventories.
• Assembly Bill 32 (Núñez, Chapter 488, Statutes of 2006), the California Global Warming Solutions Act of 2006, signed by Governor Arnold Schwarzenegger on September 27, 2006, required the CARB to lower GHG emissions to 1990 levels by 2020—a 25 percent reduction statewide, with mandatory caps for significant emissions sources. AB 32 directed CARB to develop discrete early actions to reduce GHG while also preparing a scoping plan (i.e., the Climate Change Scoping Plan) in order to identify how best to reach the 2020 limit.
• Senate Bill 97 (Dutton, Chapter 187, Statutes of 2007), signed on August 24, 2007, directed the Governor's Office of Planning and Research (OPR) to develop guidelines to mitigate GHG emissions identified through the California Environmental Quality Act (CEQA) review process, including the effects associated with transportation and energy consumption. As directed by SB 97, the Natural Resources Agency adopted Amendments to the CEQA Guidelines for GHG on December 30, 2009. On February 16, 2010, the Office of Administrative Law approved the Amendments, and filed them with the Secretary of State for inclusion in the California Code of Regulations. The

Monterey Regional Airport
Greenhouse Gas Emissions Inventory 5 August 30, 2014
Amendments to the CEQA guidelines implementing SB 97 became effective on March 18, 2010.
3 GHG Inventory Approach and Methodology
In this section, the overall approach and methodology, including sources of the GHG emissions associated with MRY, are discussed. Additional information and data developed in support of this analysis are included in Appendix A. Furthermore, the results of the GHG emission inventory for MRY are presented in Section 4 and further detailed in Appendix B.
3.1 Approach and Methodology
The approach to the MRY GHG emissions inventory followed six guiding principles:
Accuracy – Use of the most up-to-date information and data currently available, application of reasonable assumptions, and reduction of uncertainties as much as practical.
Completeness – Inclusive of all relevant and available information that may significantly affect the accounting and quantification of GHG emissions at MRY.
Conservativeness – Estimates of GHG emissions trend on the “high side” while GHG emission reductions are not overstated.
Consistency – Consistent with the most appropriate guidelines for quantifying airport-related emissions.
Relevance – Representative of emission sources and conditions that are characteristic of MRY.
Transparency – Clear and understandable results that enable reviewers to assess the credibility and reliability of the findings.
As previously discussed, the GHG emissions inventory was conducted following three commonly used and widely accepted guidelines:
- ACRP Report 11, Guidebook on Preparing Airport Greenhouse Gas Emissions Inventories;
- USEPA Climate Leaders Greenhouse Gas Inventory Protocol Core Module Guidance, Optional Emissions from Commuting, Business Travel and Product Transport; and the
- IPCC Guidelines for National Greenhouse Gas Inventories.
In addition, the majority of the technical analysis was accomplished using the latest version of the FAA’s Emissions and Dispersion Modeling System (EDMS version 5.1.4.1) and the CARB’s EMFAC2011 motor vehicle emission inventory model. EMFAC2011 was used to determine emission factors for motor vehicles along roadways. The approach, methodology, information and data collected or developed in support of the analyses are included in Appendix A.
In addition, emission factors used to compute the GHG emissions inventory were obtained from a variety of references as they are specific to the individual source type, fuel type and/or

Monterey Regional Airport
Greenhouse Gas Emissions Inventory 6 August 30, 2014
activity level. These references are further discussed in Section 3.6.
3.2 Terms and Concepts
There are a number of terms and concepts that are considered standard, but unique, to the preparation of airport-related GHG emissions inventories. It is important to note that in most cases these definitions are considered to be industry-standard and commonly used when computing GHGs, while others have been adapted for this application. The terms and concepts used in this assessment are listed in alphabetical order below:
Airport Tenants – Lessors, owners and/or occupiers of airport property that utilize the facilities or land for business purposes, including airlines and fixed-base operators.
Atmospheric Mixing Height – The altitude above which aircraft emissions are not expected to have significant ground level impacts (assumed to be 3,000 feet for GHG emissions inventories).
Auxiliary Power Units (APUs) – On-board engines that supply power to an aircraft while taxiing and parked at the gate (when the main engines are powered off).
Carbon Dioxide (CO2) – The most prevalent GHG emitted when burning carbon-based fuels.
Carbon Dioxide Equivalents (CO2e) – The universal unit of measurement used to indicate the global warming potential for different GHGs. Represented by the symbol CO2e, these values range from 1 for CO2 to 25 for CH4 to 298 for N2O.
Emission Factors – The relationship between the amount of emissions produced and the amount of raw material processed (e.g., in the case of GHGs, the amount of fuel burned, vehicle miles traveled, etc.).
Emission Sources – The entity (or entities) that emit the emissions (e.g., motor vehicles, boilers, etc.).
Existing Conditions – The baseline conditions for which the GHG emission inventory is computed. The year 2013 represents the existing conditions for the MRY GHG emissions inventory.
Future Conditions – The future years for which the GHG emission inventory is compared. The years 2018, 2023, and 2033 represent the future conditions for the MRY GHG emissions inventory.
Global Warming Potential (GWP) – A relative measure of how much heat a GHG traps in the atmosphere when compared to CO2.
Greenhouse Gases – A gas that contributes to the greenhouse effect by absorbing infrared radiation. The six Kyoto GHGs pollutants are: CO2, CH4, N2O, hydroflorocarbons (HFCs), perfluorcarbons (PFCs), and sulfur hexafluoride (SF6). Notably, CO2, CH4, and N2O are the predominant GHGs associated with airports. The other GHGs occur, but to a far lesser extent, and were therefore not included in this GHG emissions inventory.
Greenhouse Gas Ownership and Control Boundaries – These boundaries reflect the sources based on ownership or control as shown in Figure 1. The ACRP Report 11 identifies three
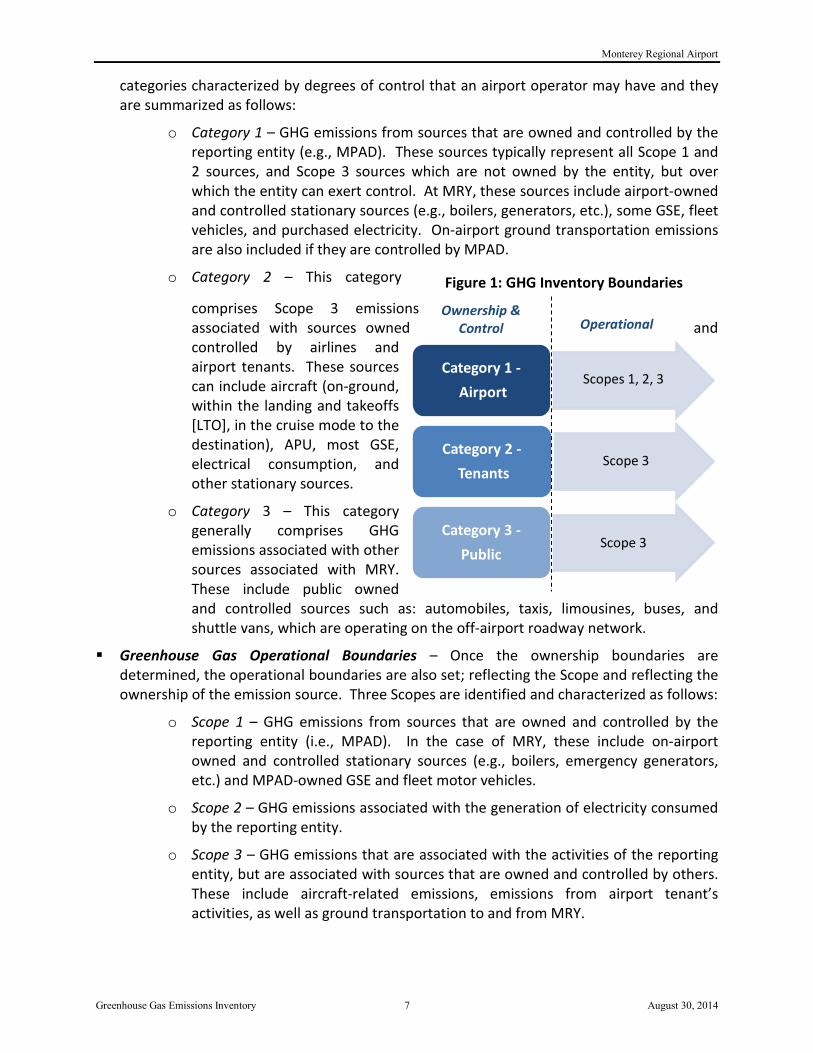
Monterey Regional Airport
Greenhouse Gas Emissions Inventory 7 August 30, 2014
Figure 1: GHG Inventory Boundaries
Category 1 - Airport
Category 2 - Tenants
Category 3 - Public
Scope 3
Scope 3
Scopes 1, 2, 3
Operational Ownership &
Control
categories characterized by degrees of control that an airport operator may have and they are summarized as follows:
o Category 1 – GHG emissions from sources that are owned and controlled by the reporting entity (e.g., MPAD). These sources typically represent all Scope 1 and 2 sources, and Scope 3 sources which are not owned by the entity, but over which the entity can exert control. At MRY, these sources include airport-owned and controlled stationary sources (e.g., boilers, generators, etc.), some GSE, fleet vehicles, and purchased electricity. On-airport ground transportation emissions are also included if they are controlled by MPAD.
o Category 2 – This category
comprises Scope 3 emissions associated with sources owned and controlled by airlines and airport tenants. These sources can include aircraft (on-ground, within the landing and takeoffs [LTO], in the cruise mode to the destination), APU, most GSE, electrical consumption, and other stationary sources.
o Category 3 – This category generally comprises GHG emissions associated with other sources associated with MRY. These include public owned and controlled sources such as: automobiles, taxis, limousines, buses, and shuttle vans, which are operating on the off-airport roadway network.
Greenhouse Gas Operational Boundaries – Once the ownership boundaries are determined, the operational boundaries are also set; reflecting the Scope and reflecting the ownership of the emission source. Three Scopes are identified and characterized as follows:
o Scope 1 – GHG emissions from sources that are owned and controlled by the reporting entity (i.e., MPAD). In the case of MRY, these include on-airport owned and controlled stationary sources (e.g., boilers, emergency generators, etc.) and MPAD-owned GSE and fleet motor vehicles.
o Scope 2 – GHG emissions associated with the generation of electricity consumed by the reporting entity.
o Scope 3 – GHG emissions that are associated with the activities of the reporting entity, but are associated with sources that are owned and controlled by others. These include aircraft-related emissions, emissions from airport tenant’s activities, as well as ground transportation to and from MRY.
Monterey Regional Airport
Greenhouse Gas Emissions Inventory 8 August 30, 2014
Ground Support Equipment (GSE) – Vehicles and equipment designed to service aircraft while parked at the gate or when operating in the terminal area (e.g., baggage tugs, belt loaders, etc.).
Metric Ton (MT) – The standard reporting unit for GHG emissions (1 MT = 1.10 Short tons = 2,200 pounds).
Stationary Sources – Source of air emissions that have fixed locations and generally release emissions through stacks (e.g., boilers).
3.3 Sources of GHG Emissions
As shown in Table 1, the primary sources of GHG emissions at MRY are typical of most airports that service both commercial and general aviation (GA) and include aircraft, APU, GSE, an assortment of stationary sources, and motor vehicles (operating on MRY’s internal roadways, parking facilities and terminal curbsides, and off-airport roadways). For the most part, emissions from these sources arise from the combustion of fossil fuels (i.e., jet fuel, avgas, diesel, gasoline, compressed natural gas, etc.) and are emitted as by-products contained in the engine exhaust.
GHG emissions associated with the consumption of electricity by MPAD and its tenants (but generated elsewhere by the burning of coal, oil, and natural gas or generated by renewable energy) were included. It should be noted that neither MPAD nor the tenants at MRY are involved in fossil fuel-based power generation, cement manufacturing, the incineration or landfilling of solid wastes, livestock management or the treatment of wastewater (which are several other common sources of GHGs).
The GHG emissions from refrigerants used in vehicles, refrigeration, and heating, ventilating, and air-conditioning (HVAC) systems as well as the GHG emissions from recycling of solid waste associated with MRY were not included in the inventory analysis.
No significant construction improvements occurred to MRY facilities and infrastructure during 2013, thus GHG emissions associated with construction activities were not quantified for the existing condition. The Runway Safety Area (RSA) project was slated to begin construction in 2014.
Finally, GHG emissions associated with the “supply-chains” or “life-cycles” (i.e., production, consumption and/or disposal of goods and materials such as paper, plastic and waste products, foodstuffs, building materials, etc.) by either MPAD facilities or its tenant’s facilities are not included in this analysis.

Monterey Regional Airport
Greenhouse Gas Emissions Inventory 9 August 30, 2014
Table 1: Sources of GHG Emissions Sources Characteristics
Aircraft Exhaust products of fuel combustion that vary depending on aircraft engine type (i.e., turbo-jet, turbo-prop, etc.), fuel type (Jet-A, avgas), number of engines, power setting (i.e., taxi/idle, take-off, cruise), and amount of fuel burned.
Motor vehicles Exhaust products of fuel combustion from patron, employee and cargo motor vehicles approaching, departing, and moving with the airport. These include automobiles, vans and buses. Emissions vary depending on vehicle type (i.e., gasoline, diesel, etc.) and the amount of fuel consumed.
Ground service equipment / Auxiliary Power Units
Exhaust products of fuel combustion from aircraft service trucks, tow tugs, belt loaders and other portable equipment. Emissions are also emitted by auxiliary power units used to furnish power to some aircraft when the main engines are off.
Stationary sources Exhaust products of fossil fuel combustion in boilers for space heating, emergency generator units and training fires and fugitive emissions associated with the compressed natural gas (CNG) station.
Electrical Usage Emissions associated with the production of electricity at off-site utilities that use coal, oil or natural gas.
Refrigerants A range of chemicals used for refrigeration and air conditioning that are comprised of substances possessing global warming characteristics (e.g., Freon, chloroflorocarbons, etc.).
Waste Management Emissions associated with the solid waste generated at MRY and the recycling and solid waste disposal practices employed by MRY.
Source: KB Environmental Sciences, Inc. 2014.
3.4 Types of GHG Emissions
According to the IPCC, the six main GHGs whose emissions are human-related are: CO2, CH4, N2O, HFCs, PFCs and SF6. On a global scale, CO2 represents the largest portion ranging from 80 to over 90 percent of the total, depending on the estimate under consideration. By comparison, global emissions of CH4 and N2O correspond to approximately 2 and 4 percent, respectively. Collectively, HFCs, PFCs, and SF6 are less than 1 percent of global GHG emissions.
Due to the fact that CO2, CH4, and N2O are by-products of fuel combustion, they are also the predominant GHGs at most airports, including MRY. Other GHGs associated with aircraft operations include water vapor, soot, and sulfates, but to a far lesser extent.
Emissions of HFCs, PFCs, and SF6 are most commonly linked with refrigeration, air conditioning, and other coolants. Since these units are modern and well maintained, GHGs associated with these sources were not considered to be significant and were not included in this inventory. The storage of fuel (i.e., jet fuel, avgas, gasoline, and diesel) is a potential source of evaporative hydrocarbon emissions, but does not produce the type of hydrocarbons that contribute directly to global climate change.

Monterey Regional Airport
Greenhouse Gas Emissions Inventory 10 August 30, 2014
3.5 GHG Inventory Boundaries
As discussed in Section 3.1 and per ACRP Report 11 guidelines is important for GHG emissions inventory to identify the ownership and control boundaries (i.e., Category 1, 2, and 3) of the GHG emission sources and to further set their operational boundaries. This involves identifying the emissions associated with the sources’ operations and categorizing them either as: Scopes 1, 2, or 3.
For this analysis, sources at MRY were categorized as either: Airport operator owned and controlled (i.e., Category 1), Tenant owned and controlled (i.e., Category 2), and Public owned and controlled (i.e., Category 3). Table 2 provides a detailed listing of the MRY GHG emission sources analyzed as part of the GHG emissions inventory broken out by Source Category, Activity and Scope.
Table 2: Sources of GHG Emissions by Source Category, Activity and Scope Source Category Activity Scope Category 1 - Airport MPAD Fleet Vehicles 1
MPAD Parking Lots 1 Employee Trips 3 On-airport Roadways 3 Taxis 3 Boilers 1 Generators 1 Electrical Usagea 2
Category 2 - Tenant Aircraftb 3 APU 3 GSE 3 Employee Trips 3 Electrical Usagea 2
Category 3 - Public Off-airport Roadways 3 Note: GSE – ground service equipment, APUs – auxiliary power units. a. Electrical consumption emissions occur off airport property at power generating plants; however, these emission are included in the GHG Inventory under Category 1 and 2 as the energy is consumed on the airport by MPAD and Tenants. b. Aircraft emissions based on landing/take-off (LTO) cycle, including start-up, and cruise to its destination.
3.6 Analysis Years
For the MRY GHG emissions inventory during the year 2013 represented the existing conditions as it represented the most current year for which the necessary input data were available. For comparative purposes future years 2018, 2023, and 2033 were also analyzed.
3.7 Sources of Information and Data
The information and data assembled for the preparation of this GHG emissions inventory came from a variety of sources and were considered to be the most appropriate for this application.
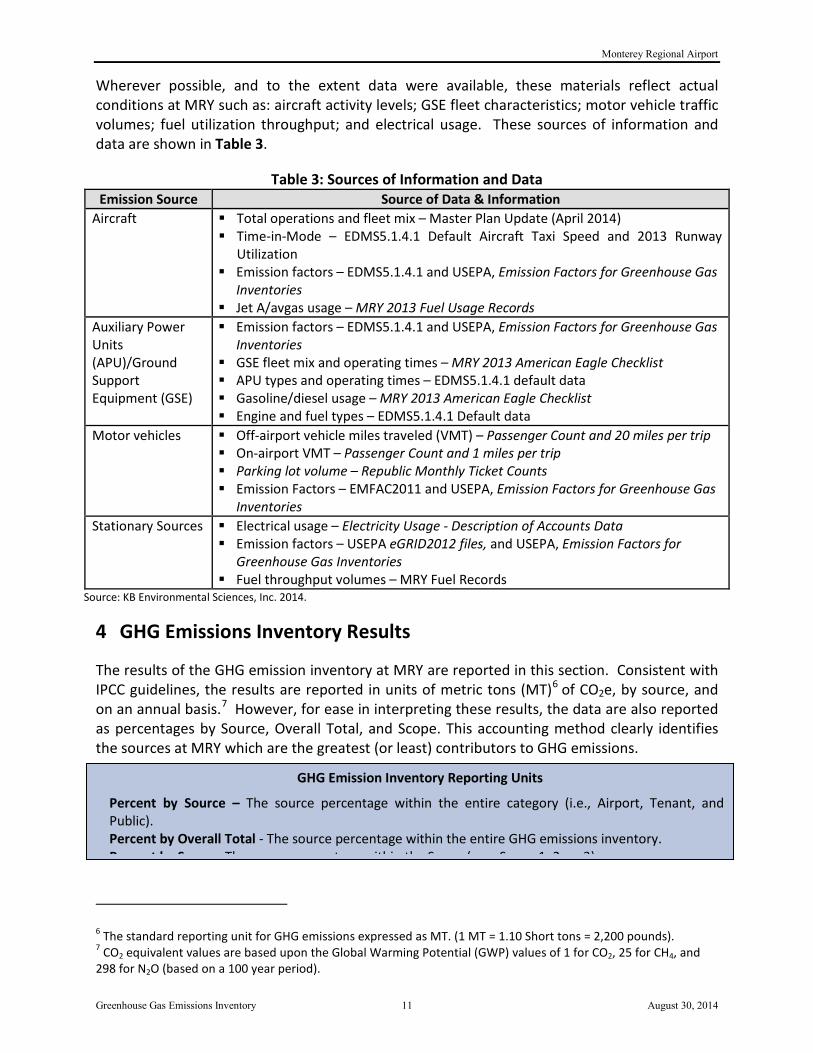
Monterey Regional Airport
Greenhouse Gas Emissions Inventory 11 August 30, 2014
Wherever possible, and to the extent data were available, these materials reflect actual conditions at MRY such as: aircraft activity levels; GSE fleet characteristics; motor vehicle traffic volumes; fuel utilization throughput; and electrical usage. These sources of information and data are shown in Table 3.
Table 3: Sources of Information and Data Emission Source Source of Data & Information
Aircraft Total operations and fleet mix – Master Plan Update (April 2014) Time-in-Mode – EDMS5.1.4.1 Default Aircraft Taxi Speed and 2013 Runway
Utilization Emission factors – EDMS5.1.4.1 and USEPA, Emission Factors for Greenhouse Gas
Inventories Jet A/avgas usage – MRY 2013 Fuel Usage Records
Auxiliary Power Units (APU)/Ground Support Equipment (GSE)
Emission factors – EDMS5.1.4.1 and USEPA, Emission Factors for Greenhouse Gas Inventories
GSE fleet mix and operating times – MRY 2013 American Eagle Checklist APU types and operating times – EDMS5.1.4.1 default data Gasoline/diesel usage – MRY 2013 American Eagle Checklist Engine and fuel types – EDMS5.1.4.1 Default data
Motor vehicles Off-airport vehicle miles traveled (VMT) – Passenger Count and 20 miles per trip On-airport VMT – Passenger Count and 1 miles per trip Parking lot volume – Republic Monthly Ticket Counts Emission Factors – EMFAC2011 and USEPA, Emission Factors for Greenhouse Gas
Inventories Stationary Sources Electrical usage – Electricity Usage - Description of Accounts Data
Emission factors – USEPA eGRID2012 files, and USEPA, Emission Factors for Greenhouse Gas Inventories
Fuel throughput volumes – MRY Fuel Records Source: KB Environmental Sciences, Inc. 2014.
4 GHG Emissions Inventory Results
The results of the GHG emission inventory at MRY are reported in this section. Consistent with IPCC guidelines, the results are reported in units of metric tons (MT)6 of CO2e, by source, and on an annual basis.7 However, for ease in interpreting these results, the data are also reported as percentages by Source, Overall Total, and Scope. This accounting method clearly identifies the sources at MRY which are the greatest (or least) contributors to GHG emissions.
6 The standard reporting unit for GHG emissions expressed as MT. (1 MT = 1.10 Short tons = 2,200 pounds). 7 CO2 equivalent values are based upon the Global Warming Potential (GWP) values of 1 for CO2, 25 for CH4, and 298 for N2O (based on a 100 year period).
Percent by Source – The source percentage within the entire category (i.e., Airport, Tenant, and Public). Percent by Overall Total - The source percentage within the entire GHG emissions inventory. Percent by Scope The so rce percentage ithin the Scope (e g Scope 1 2 or 3)
GHG Emission Inventory Reporting Units

Monterey Regional Airport
Greenhouse Gas Emissions Inventory 12 August 30, 2014
Table 4 presents the GHG emissions inventory results, the aircraft operations, and the GHG emissions per aircraft operation during 2013, 2018, 2023, and 2033. The GHG emissions per operation and per passenger enplanement are estimated to remain steady or decrease throughout the period due in part to initiatives implemented by MPAD and regulatory-driven efficiencies associated with GSE and motor vehicles. These results show that MRY is reducing or maintaining its GHG emissions on a per-operation and per-passenger basis.
Table 4: GHG Emissions Inventory by Year Parameter 2013 2018 2023 2033
Total CO2e (MT) 40,350 43,507 48,301 60,317 Total Aircraft Operations 53,827 58,100 64,600 80,900 CO2e (MT) per aircraft operation 0.75 0.75 0.75 0.75 Total Enplanements 200,651 228,104 258,888 336,363 CO2e (MT) per enplanement 0.20 0.19 0.19 0.18
Source: MRY Master Plan Update, April 2014.
Figure 2 provides a graphical interpretation of the total GHG emissions inventory results by analysis years 2013, 2018, 2023, and 2033. As shown in Table 4 and Figure 2, the total MRY GHG emissions inventory results for 2013, 2018, 2023, and 2033 are: 40,350, 43,507, 48,301, and 60,317 MT of CO2e; respectively. From 2013 to 2018, total GHG emissions at MRY were estimated to increase by 8 percent, from 2013 to 2023, emissions were estimated to increase by 20 percent, and from 2013 to 2033, and emissions were estimated to increase by 49 percent. These increases are due largely to increases in aircraft operations and enplanements and changes in aircraft fleet mix as a result of regional growth in air travel demand.
Figure 2: GHG Emissions Inventory by Year
-
10,000
20,000
30,000
40,000
50,000
60,000
70,000
2013 2018 2023 2033
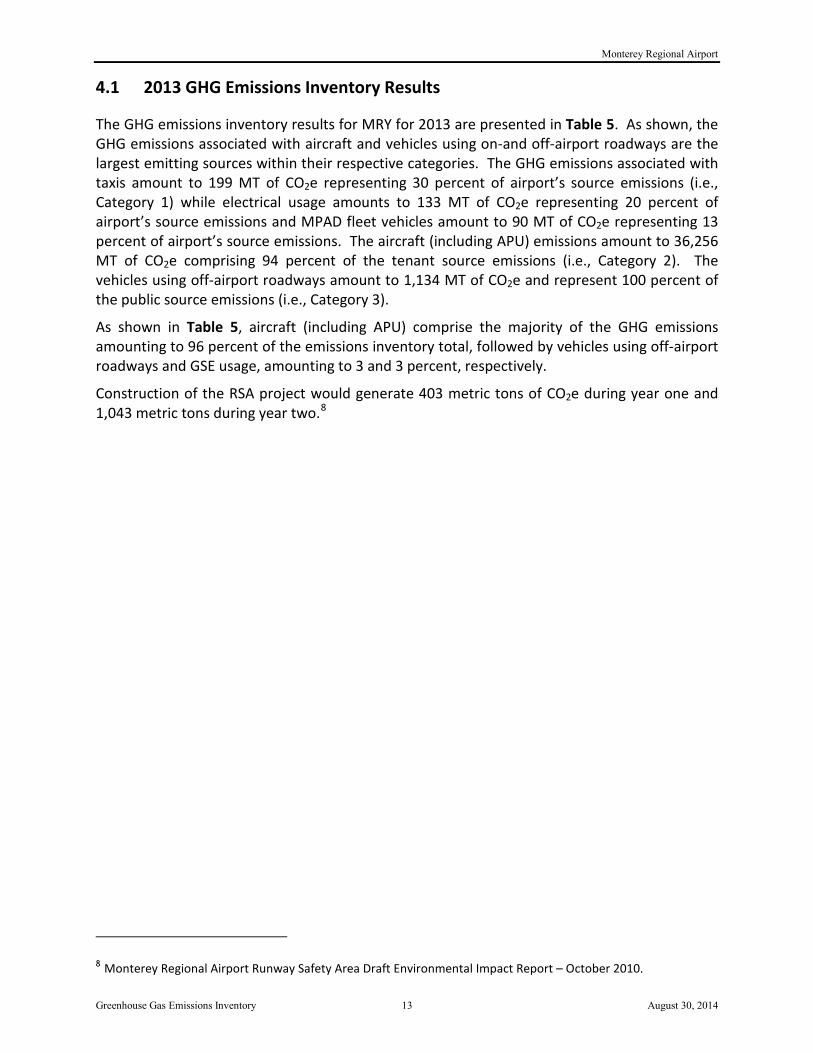
Monterey Regional Airport
Greenhouse Gas Emissions Inventory 13 August 30, 2014
4.1 2013 GHG Emissions Inventory Results
The GHG emissions inventory results for MRY for 2013 are presented in Table 5. As shown, the GHG emissions associated with aircraft and vehicles using on-and off-airport roadways are the largest emitting sources within their respective categories. The GHG emissions associated with taxis amount to 199 MT of CO2e representing 30 percent of airport’s source emissions (i.e., Category 1) while electrical usage amounts to 133 MT of CO2e representing 20 percent of airport’s source emissions and MPAD fleet vehicles amount to 90 MT of CO2e representing 13 percent of airport’s source emissions. The aircraft (including APU) emissions amount to 36,256 MT of CO2e comprising 94 percent of the tenant source emissions (i.e., Category 2). The vehicles using off-airport roadways amount to 1,134 MT of CO2e and represent 100 percent of the public source emissions (i.e., Category 3).
As shown in Table 5, aircraft (including APU) comprise the majority of the GHG emissions amounting to 96 percent of the emissions inventory total, followed by vehicles using off-airport roadways and GSE usage, amounting to 3 and 3 percent, respectively.
Construction of the RSA project would generate 403 metric tons of CO2e during year one and 1,043 metric tons during year two.8
8 Monterey Regional Airport Runway Safety Area Draft Environmental Impact Report – October 2010.
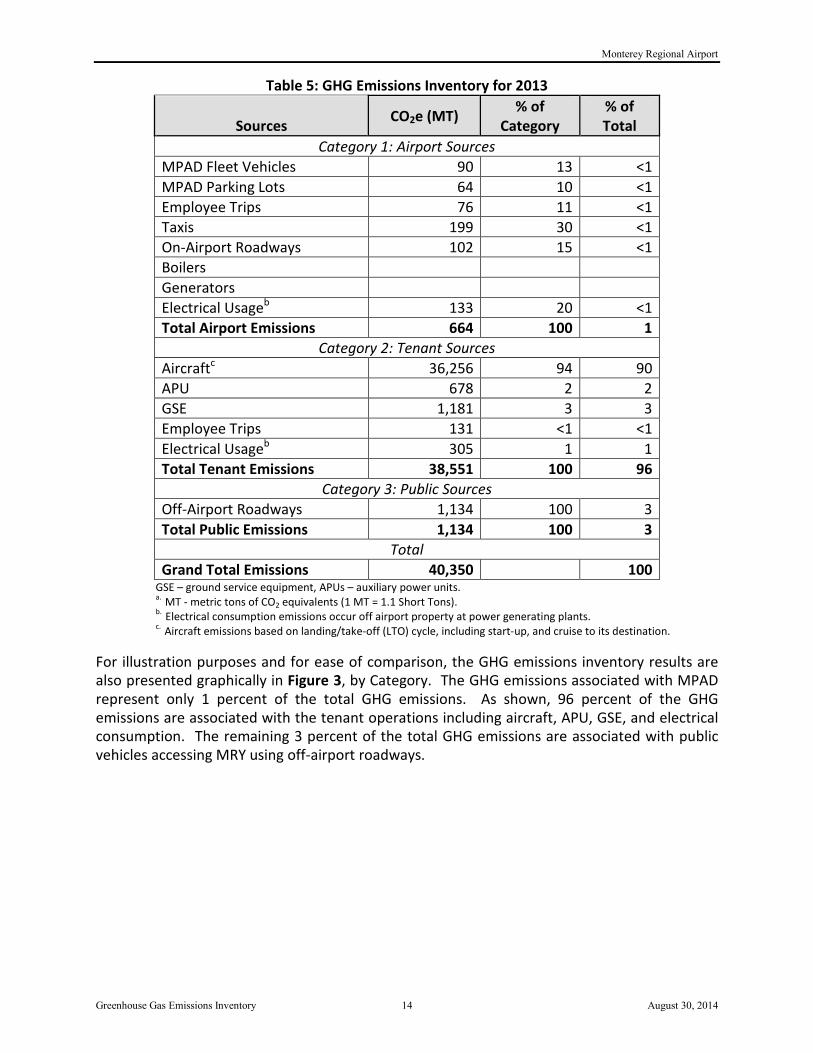
Monterey Regional Airport
Greenhouse Gas Emissions Inventory 14 August 30, 2014
Table 5: GHG Emissions Inventory for 2013
Sources CO2e (MT) % of Category
% of Total
Category 1: Airport Sources MPAD Fleet Vehicles 90 13 <1 MPAD Parking Lots 64 10 <1 Employee Trips 76 11 <1 Taxis 199 30 <1 On-Airport Roadways 102 15 <1 Boilers Generators Electrical Usageb 133 20 <1 Total Airport Emissions 664 100 1
Category 2: Tenant Sources Aircraftc 36,256 94 90 APU 678 2 2 GSE 1,181 3 3 Employee Trips 131 <1 <1 Electrical Usageb 305 1 1 Total Tenant Emissions 38,551 100 96
Category 3: Public Sources Off-Airport Roadways 1,134 100 3 Total Public Emissions 1,134 100 3
Total Grand Total Emissions 40,350 100
GSE – ground service equipment, APUs – auxiliary power units. a. MT - metric tons of CO2 equivalents (1 MT = 1.1 Short Tons). b. Electrical consumption emissions occur off airport property at power generating plants. c. Aircraft emissions based on landing/take-off (LTO) cycle, including start-up, and cruise to its destination.
For illustration purposes and for ease of comparison, the GHG emissions inventory results are also presented graphically in Figure 3, by Category. The GHG emissions associated with MPAD represent only 1 percent of the total GHG emissions. As shown, 96 percent of the GHG emissions are associated with the tenant operations including aircraft, APU, GSE, and electrical consumption. The remaining 3 percent of the total GHG emissions are associated with public vehicles accessing MRY using off-airport roadways.
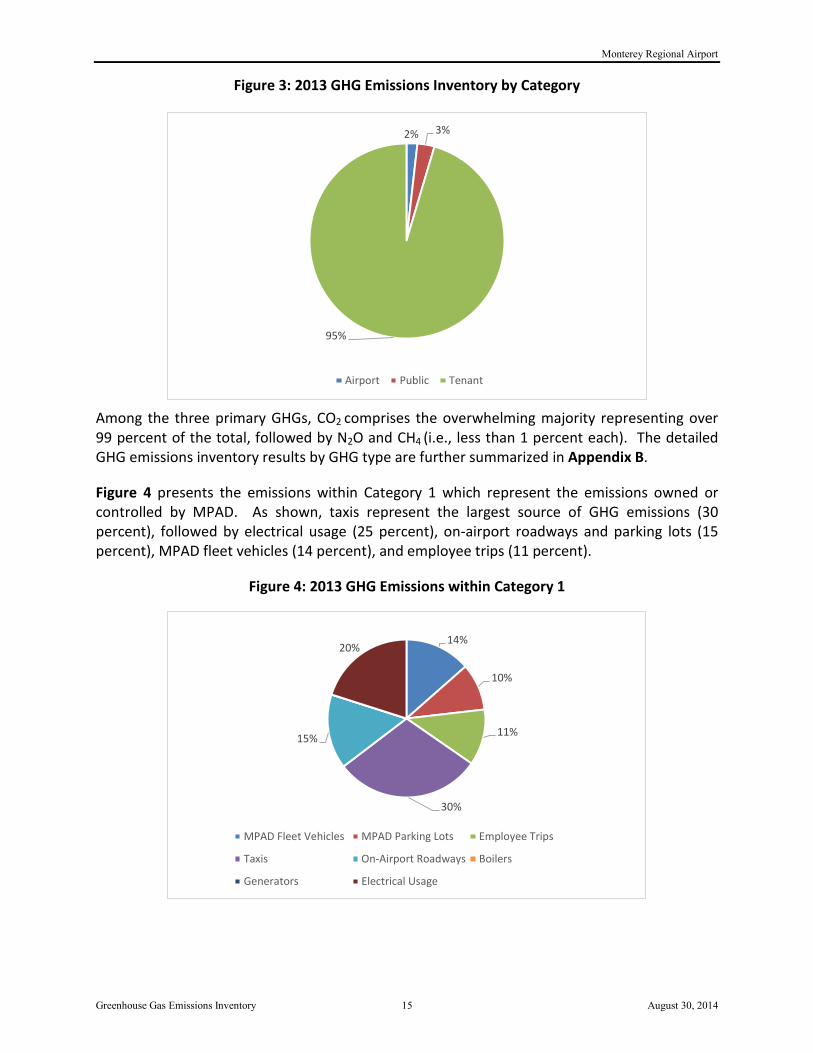
Monterey Regional Airport
Greenhouse Gas Emissions Inventory 15 August 30, 2014
Figure 3: 2013 GHG Emissions Inventory by Category
Among the three primary GHGs, CO2 comprises the overwhelming majority representing over 99 percent of the total, followed by N2O and CH4 (i.e., less than 1 percent each). The detailed GHG emissions inventory results by GHG type are further summarized in Appendix B.
Figure 4 presents the emissions within Category 1 which represent the emissions owned or controlled by MPAD. As shown, taxis represent the largest source of GHG emissions (30 percent), followed by electrical usage (25 percent), on-airport roadways and parking lots (15 percent), MPAD fleet vehicles (14 percent), and employee trips (11 percent).
Figure 4: 2013 GHG Emissions within Category 1
2% 3%
95%
Airport Public Tenant
14%
10%
11%
30%
15%
20%
MPAD Fleet Vehicles MPAD Parking Lots Employee Trips
Taxis On-Airport Roadways Boilers
Generators Electrical Usage
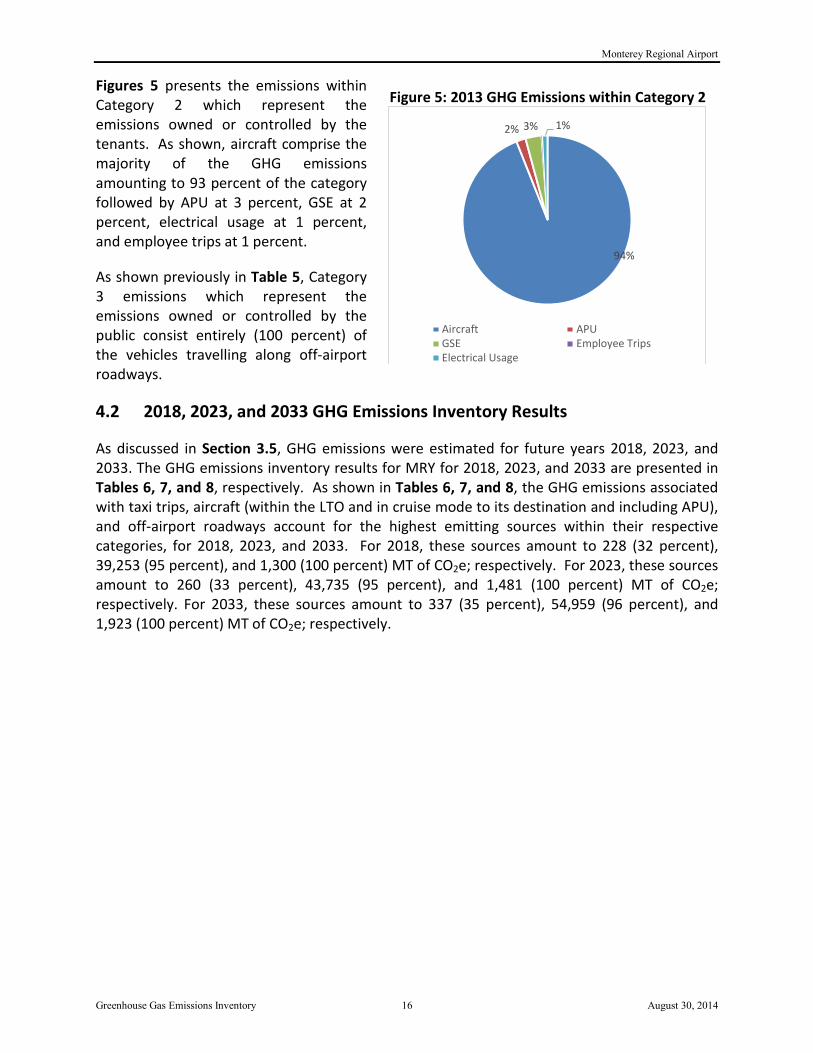
Monterey Regional Airport
Greenhouse Gas Emissions Inventory 16 August 30, 2014
Figures 5 presents the emissions within Category 2 which represent the emissions owned or controlled by the tenants. As shown, aircraft comprise the majority of the GHG emissions amounting to 93 percent of the category followed by APU at 3 percent, GSE at 2 percent, electrical usage at 1 percent, and employee trips at 1 percent.
As shown previously in Table 5, Category 3 emissions which represent the emissions owned or controlled by the public consist entirely (100 percent) of the vehicles travelling along off-airport roadways.
4.2 2018, 2023, and 2033 GHG Emissions Inventory Results
As discussed in Section 3.5, GHG emissions were estimated for future years 2018, 2023, and 2033. The GHG emissions inventory results for MRY for 2018, 2023, and 2033 are presented in Tables 6, 7, and 8, respectively. As shown in Tables 6, 7, and 8, the GHG emissions associated with taxi trips, aircraft (within the LTO and in cruise mode to its destination and including APU), and off-airport roadways account for the highest emitting sources within their respective categories, for 2018, 2023, and 2033. For 2018, these sources amount to 228 (32 percent), 39,253 (95 percent), and 1,300 (100 percent) MT of CO2e; respectively. For 2023, these sources amount to 260 (33 percent), 43,735 (95 percent), and 1,481 (100 percent) MT of CO2e; respectively. For 2033, these sources amount to 337 (35 percent), 54,959 (96 percent), and 1,923 (100 percent) MT of CO2e; respectively.
Figure 5: 2013 GHG Emissions within Category 2
94%
2% 3% 1%
Aircraft APUGSE Employee TripsElectrical Usage

Monterey Regional Airport
Greenhouse Gas Emissions Inventory 17 August 30, 2014
Table 6: GHG Emissions Inventory for 2018
Sources CO2e (MT) % of Category
% of Total
Category 1: Airport Sources MPAD Fleet Vehicles 97 13 <1 MPAD Parking Lots 62 9 <1 Employee Trips 83 12 <1 Taxis 228 32 1 On-Airport Roadways 116 16 <1 Boilers Generators Electrical Usageb 133 19 <1 Total Airport Emissions 720 100 2
Category 2: Tenant Sources Aircraftc 39,253 95 90 APU 613 1 1 GSE 1,158 3 3 Employee Trips 131 <1 <1 Electrical Usageb 332 1 1 Total Tenant Emissions 41,487 100 95
Category 3: Public Sources Off-Airport Roadways 1,300 100 3 Total Public Emissions 1,300 100 3
Total Total Emissions 43,507 100
GSE – ground service equipment, APUs – auxiliary power units. a. MT - metric tons of CO2 equivalents (1 MT = 1.1 Short Tons). b. Electrical consumption emissions occur off airport property at power generating plants. c. Aircraft emissions based on landing/take-off (LTO) cycle, including start-up, and cruise to its destination.

Monterey Regional Airport
Greenhouse Gas Emissions Inventory 18 August 30, 2014
Table 7: GHG Emissions Inventory for 2023
Sources CO2e (MT) % of Category
% of Total
Category 1: Airport Sources MPAD Fleet Vehicles 108 14 <1 MPAD Parking Lots 65 8 <1 Employee Trips 93 12 <1 Taxis 260 33 1 On-Airport Roadways 132 17 <1 Boilers Generators Electrical Usageb 133 17 <1 Total Airport Emissions 790 100 2
Category 2: Tenant Sources Aircraftc 43,735 95 91 APU 591 1 1 GSE 1,203 3 2 Employee Trips 131 <1 <1 Electrical Usageb 371 1 1 Total Tenant Emissions 46,031 100 95
Category 3: Public Sources Off-Airport Roadways 1,481 100 3 Total Public Emissions 1,481 100 3
Total Grand Total Emissions 48,301 100
GSE – ground service equipment, APUs – auxiliary power units. a. MT - metric tons of CO2 equivalents (1 MT = 1.1 Short Tons). b. Electrical consumption emissions occur off airport property at power generating plants. c. Aircraft emissions based on landing/take-off (LTO) cycle, including start-up, and cruise to its destination.
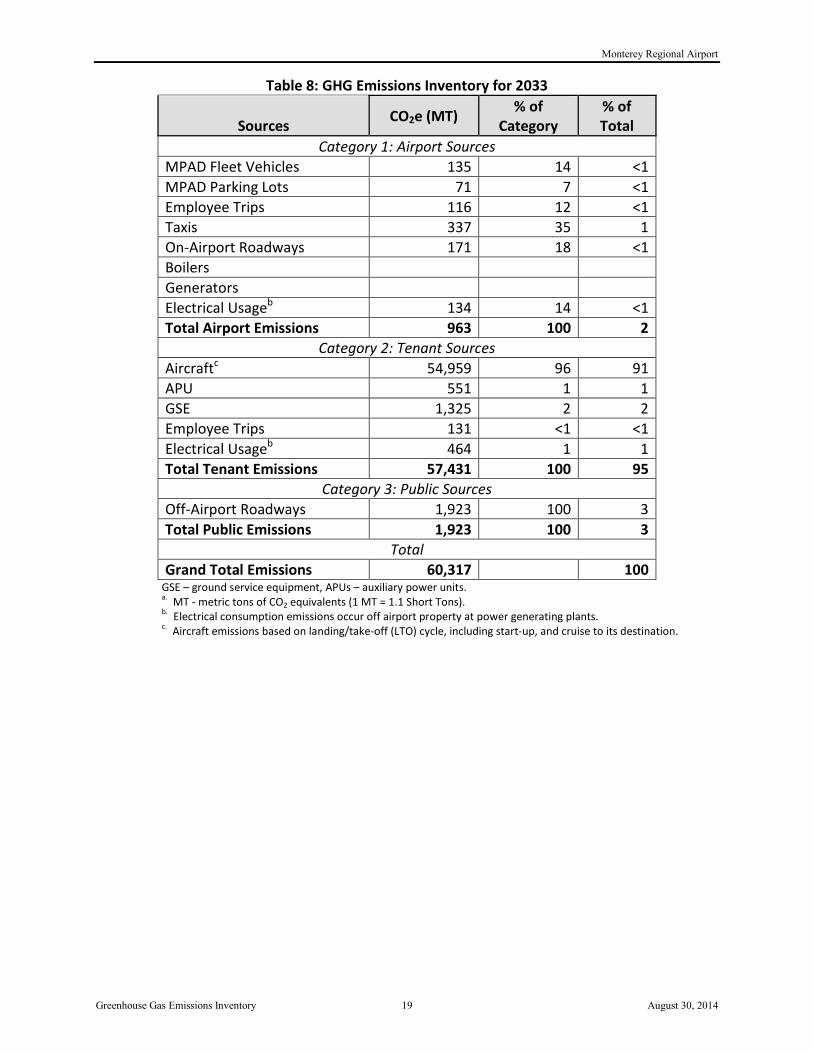
Monterey Regional Airport
Greenhouse Gas Emissions Inventory 19 August 30, 2014
Table 8: GHG Emissions Inventory for 2033
Sources CO2e (MT) % of Category
% of Total
Category 1: Airport Sources MPAD Fleet Vehicles 135 14 <1 MPAD Parking Lots 71 7 <1 Employee Trips 116 12 <1 Taxis 337 35 1 On-Airport Roadways 171 18 <1 Boilers Generators Electrical Usageb 134 14 <1 Total Airport Emissions 963 100 2
Category 2: Tenant Sources Aircraftc 54,959 96 91 APU 551 1 1 GSE 1,325 2 2 Employee Trips 131 <1 <1 Electrical Usageb 464 1 1 Total Tenant Emissions 57,431 100 95
Category 3: Public Sources Off-Airport Roadways 1,923 100 3 Total Public Emissions 1,923 100 3
Total Grand Total Emissions 60,317 100
GSE – ground service equipment, APUs – auxiliary power units. a. MT - metric tons of CO2 equivalents (1 MT = 1.1 Short Tons). b. Electrical consumption emissions occur off airport property at power generating plants. c. Aircraft emissions based on landing/take-off (LTO) cycle, including start-up, and cruise to its destination.

Monterey Regional Airport
Greenhouse Gas Emissions Inventory 20 August 30, 2014
5 Conclusions
The GHG emissions inventory competed for MPAD serves as a guide in their development of both short- and long-term policies directed at reducing MRY’s overall GHG emissions and to demonstrate consistency with the California Global Warming Solutions Act of 2006.
This GHG emissions inventory included emissions from aircraft (operating within the LTO cycle and cruise mode to its destination), APU, GSE, on-airport motor vehicles (roadways, terminal curbsides, and parking facilities), and various stationary sources such as boilers and emergency generators associated with MRY. The analysis was conducted using FAA’s EDMS5.1.4.1 and the CARB’s EMFAC2011. Airport-specific aircraft operations, GSE fleet mix and operating characteristics, traffic volumes, and stationary source fuel usage data were utilized. The following GHGs were evaluated: CO2, CH4, and N2O and the GHG emissions inventory was conducted for 2013, 2018, 2023, and 2033.
Due to regional growth in air travel demand, annual aircraft operations were estimated to increase from 53,827 in 2013 to 58,100 in 2018 (8 percent increase), 64,600 in 2023 (20 percent increase), and 80,900 in 2033 (50 percent increase). The associated increase in enplanements is anticipated to result in an increase in motor vehicle volumes and parking demand, as well as usage of APU and GSE. As a result of these increased operations, air emissions were estimated to also increase from 2011, to 2018, to 2023, and 2033 to 40,350, 43,507, 48,301, and 60,317 MT of CO2e, respectively. Figure 6 shows the GHG emissions by category and analysis year.
Figure 6: GHG Emissions Inventory Results by Category and Year
From 2011 to 2018, MPAD owned/controlled source emissions were projected to increase by approximately 8 percent; tenant owned/controlled source emissions were projected to increase by approximately 8 percent; and public owned/controlled source emissions were projected to increase by approximately 15 percent. The increases are due largely to increases in aircraft operations and enplanements and changes in aircraft fleet mix.
-
10,000
20,000
30,000
40,000
50,000
60,000
2013 2018 2023 2033
Airport Public Tenant

Monterey Regional Airport
Greenhouse Gas Emissions Inventory 21 August 30, 2014
References
California Air Resources Board, Mobile Source Emission Inventory -- Current Methods and Data, http://www.arb.ca.gov/msei/modeling.htm
Coffman and Associates, Monterey Regional Airport, Master Plan Update, April 2014.
Federal Aviation Administration, Emissions and Dispersion Modeling System (EDMS) User’s Manual, June 2013, http://www.faa.gov/about/office_org/headquarters_offices/apl/research/models/edms_model/media/EDMS_5.1.4_User_Manual.pdf.
Intergovernmental Panel on Climate Change, Guidelines for National Greenhouse Gas Inventories, Vol. 2, Energy, Intergovernmental Panel on Climate Change, 2006.
Intergovernmental Panel on Climate Change, Fourth Assessment Report: Climate Change, 2007.
Monterey Regional Airport Runway Safety Area Draft Environmental Impact Report, October 2010.
Transportation Research Board, ACRP Report 11, Guidebook on Preparing Airport Greenhouse Gas Emissions Inventories, 2009, http://onlinepubs.trb.org/onlinepubs/acrp/acrp_rpt_011.pdf.
United States Environmental Protection Agency, Emission Factors for Greenhouse Gas Inventories, April 2014, http://www.epa.gov/climateleadership/documents/emission-factors.pdf
United States Environmental Protection Agency, Climate Leaders Greenhouse Gas Inventory Protocol Core Module Guidance, Optional Emissions from Commuting, Business Travel and Product Transport, May 2008, http://www.epa.gov/climateleadership/documents/resources/commute_travel_product.pdf.
United States Environmental Protection Agency, eGrid Database, eGRID2012 files, Version 1.0., http://www.epa.gov/cleanenergy/energy-resources/egrid/index.html.

Monterey Regional Airport
Greenhouse Gas Emissions Inventory A-1 August 30, 2014
APPENDIX A – DETAILED DATA, ASSUMPTIONS, AND METHODOLOGY
Appendix A presents the overall data, assumptions, approach, and methodology for preparing the greenhouse gas (GHG) emissions inventories for Monterey Regional Airport (MRY). The GHG emissions inventories were calculated for an existing year (2013) and three future years (2018, 2023, and 2033). The findings of the emissions inventories are based on the actual and estimated electrical and fuel usages and vehicle miles traveled (VMT) for airport-related sources. For purposes of this analysis, the data documented in this appendix are broken out by:
• Aircraft Operations • Aircraft Time-in-Mode (TIM) • Aircraft Emission Factors • Ground Support Equipment (GSE) • Auxiliary Power Units (APU) • Motor Vehicles: - Vehicles owned and controlled by the Monterey Peninsula Airport District (MPAD) (i.e.,
fleet vehicles)
- Vehicles owned and controlled by airport tenants (primarily GSE)
- Vehicles for both employees and passengers (private and taxis) accessing on-airport and off-airport public roadways
• Stationary Sources such as boilers and generators For airports, GHG emissions are calculated in much the same way criteria pollutants are calculated - and that is through the use of input data such as activity levels or material throughput rates (i.e., fuel usage, VMT, electrical consumption) that are applied to appropriate emission factors (i.e., in units of GHG emissions per gallons of fuel).
For this analysis, the input data were either based on MPAD records, data and information or derived from the latest version of the Federal Aviation Administration (FAA) Emissions and Dispersion Modeling System (EDMS5.1.4.1).1
The GHG emissions inventory was conducted following three commonly used and widely accepted guidelines:
- Transportation Research Board, Airport Cooperative Research Program (ACRP) Report 11, Guidebook on Preparing Airport Greenhouse Gas Emissions Inventories2;
1 Federal Aviation Administration, Emissions and Dispersion Modeling System (EDMS) User’s Manual, June 2013, http://www.faa.gov/about/office_org/headquarters_offices/apl/research/models/edms_model/media/EDMS_5.1.4_User_Manual.pdf. 2 Transportation Research Board, ACRP Report 11, Guidebook on Preparing Airport Greenhouse Gas Emissions Inventories, 2009, http://onlinepubs.trb.org/onlinepubs/acrp/acrp_rpt_011.pdf.
Monterey Regional Airport
Greenhouse Gas Emissions Inventory A-2 August 30, 2014
- United States Environmental Protection Agency (USEPA) Climate Leaders Greenhouse Gas Inventory Protocol Core Module Guidance, Optional Emissions from Commuting, Business Travel and Product Transport3; and the
- Intergovernmental Panel on Climate Change (IPCC) Guidelines for National Greenhouse Gas Inventories. 4
Emission factors were obtained from the United States Energy Information Administration (EIA)5, the IPCC, and the USEPA.
The GHG included in this inventory were comprised of carbon dioxide (CO2), methane (CH4), and nitrous oxide (N2O). As is customary for GHG emissions inventories, the results are reported in units of metric tons (MT) of carbon dioxide equivalents (CO2e), by source, and on an annual basis. The GHG emission results were converted to CO2e values using the Global Warming Potential (GWP) values of 1 for CO2, 25 for CH4, and 298 for N2O (based on a 100 year period) as presented in the IPCC’s Assessment Report.6 GWP value is a relative measure of how much heat a GHG traps in the atmosphere when compared to carbon dioxide. That is, CH4 is 25 times as potent a GHG than CO2. The estimated CH4 emissions were multiplied by 25 to determine the CO2e.
A. Aircraft Operations
Actual aircraft operational data were obtained from the Master Plan Update (April 2014) for 2013, 2018, 2023, and 2033, which reports aircraft operations, including aircraft type (such as commercial, general aviation, military), aircraft code (such as CL600, CNA441, LEAR35), and operations type (LTO/TGO). A Landing and Takeoff Cycle (LTO) cycle consists of aircraft operating modes of approach, taxi in, engine startup, taxi out, takeoff, and climbout. A Touch and Go (TGO) is an aircraft operation where the pilot lands on a runway and taking off again without coming to a full stop.
Representative aircraft/engine combinations for each aircraft category will be developed based on USEPA’s 2011 National Emissions Inventory (NEI), Official Airline Guide (OAG) Aviation Database, the JP Airline-Fleets International Database (JP Fleets), or other appropriate sources. Where unavailable, aircraft engine assignments were based on EDMS5.1.4.1 default values, which are based on the most popular aircraft/engine assignments for the United States aircraft fleet. Table A-1 presents the annual aircraft operations per aircraft category during 2013, 2018,
3 United States Environmental Protection Agency, Climate Leaders Greenhouse Gas Inventory Protocol Core Module Guidance, Optional Emissions from Commuting, Business Travel and Product Transport, May 2008, http://www.epa.gov/climateleadership/documents/resources/commute_travel_product.pdf. 4 IPCC Guidelines for National Greenhouse Gas Inventories, Volume 2, 2006, www.ipcc-nggip.iges.or.jp/public/gl/invs5.htm. 5 United States Environmental Protection Agency, Emission Factors for Greenhouse Gas Inventories, April 2014, http://www.epa.gov/climateleadership/documents/emission-factors.pdf. 6 Fourth Assessment Report of the Intergovernmental Panel on Climate Change, Cambridge University Press, New York City, NY. 2007, http://www.ipcc.ch/publications_and_data/publications_ipcc_fourth_assessment_report_synthesis_report.htm.
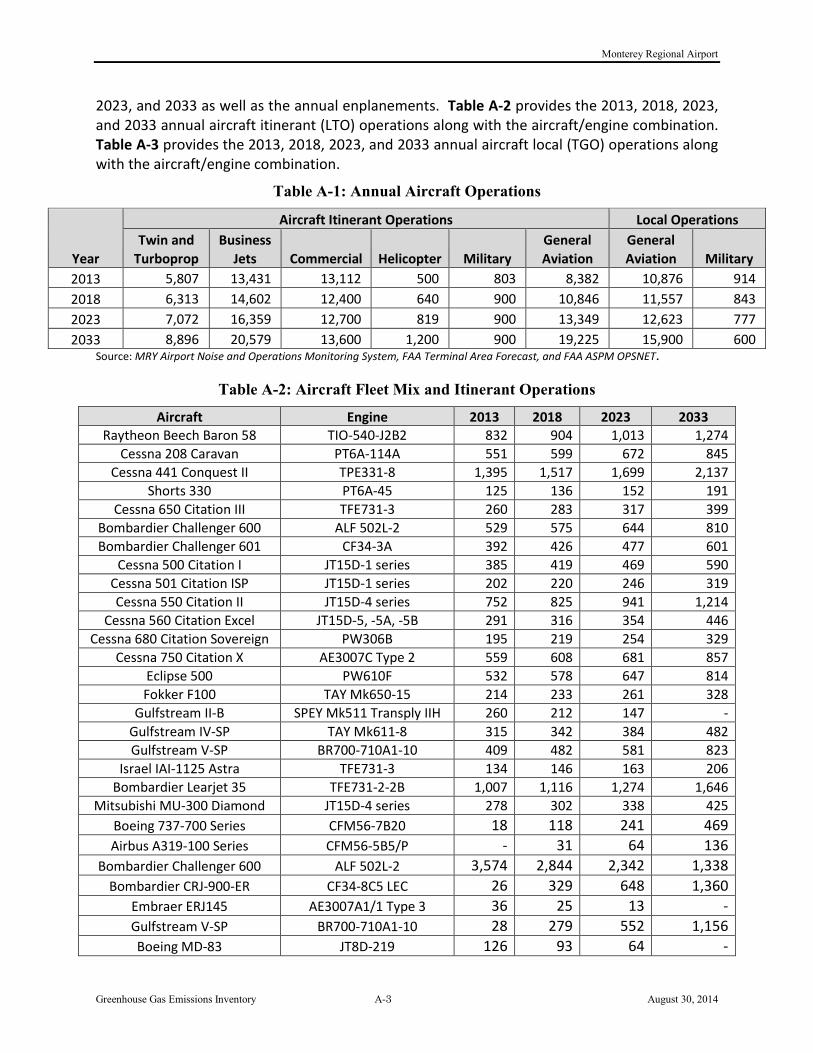
Monterey Regional Airport
Greenhouse Gas Emissions Inventory A-3 August 30, 2014
2023, and 2033 as well as the annual enplanements. Table A-2 provides the 2013, 2018, 2023, and 2033 annual aircraft itinerant (LTO) operations along with the aircraft/engine combination. Table A-3 provides the 2013, 2018, 2023, and 2033 annual aircraft local (TGO) operations along with the aircraft/engine combination.
Table A-1: Annual Aircraft Operations
Year
Aircraft Itinerant Operations Local Operations Twin and
Turboprop Business
Jets Commercial Helicopter Military General Aviation
General Aviation Military
2013 5,807 13,431 13,112 500 803 8,382 10,876 914 2018 6,313 14,602 12,400 640 900 10,846 11,557 843 2023 7,072 16,359 12,700 819 900 13,349 12,623 777 2033 8,896 20,579 13,600 1,200 900 19,225 15,900 600
Source: MRY Airport Noise and Operations Monitoring System, FAA Terminal Area Forecast, and FAA ASPM OPSNET.
Table A-2: Aircraft Fleet Mix and Itinerant Operations
Aircraft Engine 2013 2018 2023 2033 Raytheon Beech Baron 58 TIO-540-J2B2 832 904 1,013 1,274
Cessna 208 Caravan PT6A-114A 551 599 672 845 Cessna 441 Conquest II TPE331-8 1,395 1,517 1,699 2,137
Shorts 330 PT6A-45 125 136 152 191 Cessna 650 Citation III TFE731-3 260 283 317 399
Bombardier Challenger 600 ALF 502L-2 529 575 644 810 Bombardier Challenger 601 CF34-3A 392 426 477 601
Cessna 500 Citation I JT15D-1 series 385 419 469 590 Cessna 501 Citation ISP JT15D-1 series 202 220 246 319 Cessna 550 Citation II JT15D-4 series 752 825 941 1,214
Cessna 560 Citation Excel JT15D-5, -5A, -5B 291 316 354 446 Cessna 680 Citation Sovereign PW306B 195 219 254 329
Cessna 750 Citation X AE3007C Type 2 559 608 681 857 Eclipse 500 PW610F 532 578 647 814 Fokker F100 TAY Mk650-15 214 233 261 328
Gulfstream II-B SPEY Mk511 Transply IIH 260 212 147 - Gulfstream IV-SP TAY Mk611-8 315 342 384 482 Gulfstream V-SP BR700-710A1-10 409 482 581 823
Israel IAI-1125 Astra TFE731-3 134 146 163 206 Bombardier Learjet 35 TFE731-2-2B 1,007 1,116 1,274 1,646
Mitsubishi MU-300 Diamond JT15D-4 series 278 302 338 425 Boeing 737-700 Series CFM56-7B20 18 118 241 469 Airbus A319-100 Series CFM56-5B5/P - 31 64 136
Bombardier Challenger 600 ALF 502L-2 3,574 2,844 2,342 1,338 Bombardier CRJ-900-ER CF34-8C5 LEC 26 329 648 1,360
Embraer ERJ145 AE3007A1/1 Type 3 36 25 13 - Gulfstream V-SP BR700-710A1-10 28 279 552 1,156 Boeing MD-83 JT8D-219 126 93 64 -

Monterey Regional Airport
Greenhouse Gas Emissions Inventory A-4 August 30, 2014
Aircraft Engine 2013 2018 2023 2033 Cessna 208 Caravan PT6A-114A 564 533 546 585
de Havilland DHC-8-300 PW123B 382 361 370 396 Embraer EMB120 Brasilia PW118 1,802 1,587 1,511 1,360
Aerospatiale SA-355F Twin Star 250B17B 250 320 410 600 Cessna 150 Series O-200 43 48 48 48 Bell 206 JetRanger 250B17B 37 42 42 42
Boeing F/A-18 Hornet F404-GE-400 25 28 28 28 Lockheed C-130 Hercules T56-A-15 86 97 97 97
Convair CV-580 501D22A 210 235 235 235 Cessna 182 IO-360-B 598 773 952 1,371 Cessna 206 TIO-540-J2B2 260 336 414 596
Cessna 150 Series O-200 3,334 4,313 5,309 7,646 Total 42,037 45,700 51,200 64,400
Source: MRY Master Plan Update, April 2014.
Table A-3: Aircraft Fleet Mix and Local Operations
Aircraft Engine 2013 2018 2023 2033 Cessna 150 Series O-200 4,894 5,201 5,680 7,155
Piper PA-24 Comanche TIO-540-J2B2 4,894 5,201 5,680 7,155 Raytheon Beech Baron 58 TIO-540-J2B2 1,088 1,156 1,262 1,590
Cessna 150 Series O-200 457 422 389 300 Convair CV-580 501D22A 457 422 389 300
Total 11,790 12,400 13,400 16,500 Source: MRY Master Plan Update, April 2014.
B. Aircraft Time in Mode
International Civil Aviation Organization (ICAO) operating times will be used to estimate fuel usage within each aircraft operating mode: approach, engine startup, takeoff, and climbout. Taxi in and taxi out times were based on typical aircraft taxi speed, runway utilization, and taxiway distance. The ground-based taxi time and queue delay used re shown in Table A-4. The taxi-delay and queue time is a function of the aircraft type.
Table A-4: Aircraft Taxi Time
Aircraft Taxi In Taxi Out Commercial
Jet 7.0 19.0 Turboprop 7.0 19.0 Piston 6.5 6.5
General Aviation Business Jet 6.5 6.5 Turboprop 7.0 19.0 Piston 4.0 12.0 Helicopter 3.5 3.5

Monterey Regional Airport
Greenhouse Gas Emissions Inventory A-5 August 30, 2014
Aircraft Taxi In Taxi Out Military
Combat (USAF) 11.3 18.5 Trainer 4.4 6.8 Transport 6.7 9.2
Source: Federal Aviation Administration EDMS, 2013 and United States Environmental Protection Agency, Compilation of Air Pollutant Emission Factors.
Aircraft are categorized as Category 2 (Scope 3) emissions under airline/tenant owned/controlled. For this assessment, the GHG emissions were developed using Method 2 for aircraft of the ACRP Report 11 Guidebook.
C. Aircraft Emission Factors
EDMS5.1.4.1 contains a database of aircraft/engine-specific criteria pollutant emission factors based on engine manufacturer, model, and operational mode. The level of aircraft-related emissions is reflective of the time that an aircraft operates in each of the operational modes with the entire cycle referred to as a landing/take-off (LTO) cycle. An LTO cycle consists of the following operational modes:
• “Taxi/idle” includes the time an aircraft taxis between the runway and a terminal, and all ground-based delay incurred through the aircraft route. The taxi/idle-delay mode includes the landing roll, which is the movement of an aircraft from touchdown through deceleration to taxi speed or full stop.
• “Approach” begins when an aircraft descends below the atmospheric mixing height and ends when an aircraft touches down on a runway.
• “Takeoff” begins when full power is applied to an aircraft and ends when an aircraft reaches approximately 500 to 1,000 feet. At this altitude, pilots typically power back for a gradual ascent.
• “Climb out” begins when an aircraft powers back from the takeoff mode and ascends above the atmospheric mixing height.
• Aircraft emissions (of GHG) also account for the period of engine startup which occurs within the gate terminal area prior to departure.
Consistent with the ACRP Report 11 Guidebook, the GHG emissions inventory assessed emissions with a mixing height of 3,000 feet. Table A-5 presents the GHG emission factors for aircraft operations.
Table A-5: Aircraft GHG Emission Factors
Fuel CO2 N2O CH4 Units
Jet A 21.50 0.00066 - lb/gallon AvGas 18.32 0.000243 0.0155 lb/gallon

Monterey Regional Airport
Greenhouse Gas Emissions Inventory A-6 August 30, 2014
Source: Guidebook for Preparing Airport-Related Greenhouse Gas Emissions Inventories, prepared for the Airport Cooperative Research Program, Transportation Research Board, April 2009.
Estimated total aircraft fuel usage for 2013 was 3,652,694 gallons of Jet A and 116,627 gallons of Avgas based on airport fuel records. This fuel usage was separated into usage within the LTO cycle, during engine startup mode, APU usage, and cruise mode to the destination. Thus, the fuel usage in the cruise mode was determined as the total fuel usage minus engine startup minus LTO cycle minus APU usage (described in further sections).7
Fuel usage within the aircraft engine startup mode was estimated based on published guidance for the engine startup fuel flow rate.8 Based on the number of non-piston aircraft operations and this fuel flow rate, the engine startup fuel usage was determined and with the use of the aircraft GHG emission factors GHG emissions were developed. EDMS5.1.4.1 was used to determine the VOC emissions from engine startup. Estimated aircraft engine startup fuel usage for 2013 was 22,078 gallons of Jet A.
E. Ground Support Equipment
Ground support equipment is a term used to describe the equipment that service aircraft after arrival and before departure at an airport. The type of GSE includes aircraft tugs, baggage tugs, belt loaders, fuel or hydrant trucks, water trucks, lavatory trucks, and cargo loaders, among others.
The GSE fuel usage for 2013 was derived based on American Eagle GSE fleet mix, national average for fuel type, and EDMS defaults for operating times. Future year GSE fuel usage was determined as a function of the number of aircraft operations. Air emissions resulting from the operation of GSE vary depending on the type of equipment, fuel type (i.e., gasoline, diesel, propane, electric, etc.) and the duration of equipment operation (engine run time). The type of GSE used depends on the aircraft type and the designated category of an aircraft operation (i.e., passenger, cargo, etc.).
GHG emissions were calculated based on the GSE fuel usage and the GHG emissions factors in Table A-6. Estimated GSE fuel usage in 2013 was 66,522 gallons of diesel and 55,961 gallons of gasoline. Future year GSE fuel usage was estimated as a function of forecasted aircraft operations.
GSE are categorized as either Category 1 or 2 emissions (depending on the owner) and Scope 1 or 3 (depending on operational boundary) but are mostly airline owned/controlled with the exception of some GSE which are MPAD owned/controlled. For this assessment, GSE were categorized as Category 2 (Scope 3) emissions under airline/tenant owned/controlled and the GHG emissions were developed using Method 2 for GSE of the ACRP Report 11 Guidebook.
7 Based on a fuel density of 6.84 pounds per gallon for Jet A and 6.00 pounds per gallon for aviation gasoline. 8 ICAO/CAEP Working Group 3, May 5, 2006, Engine Starting Emissions.
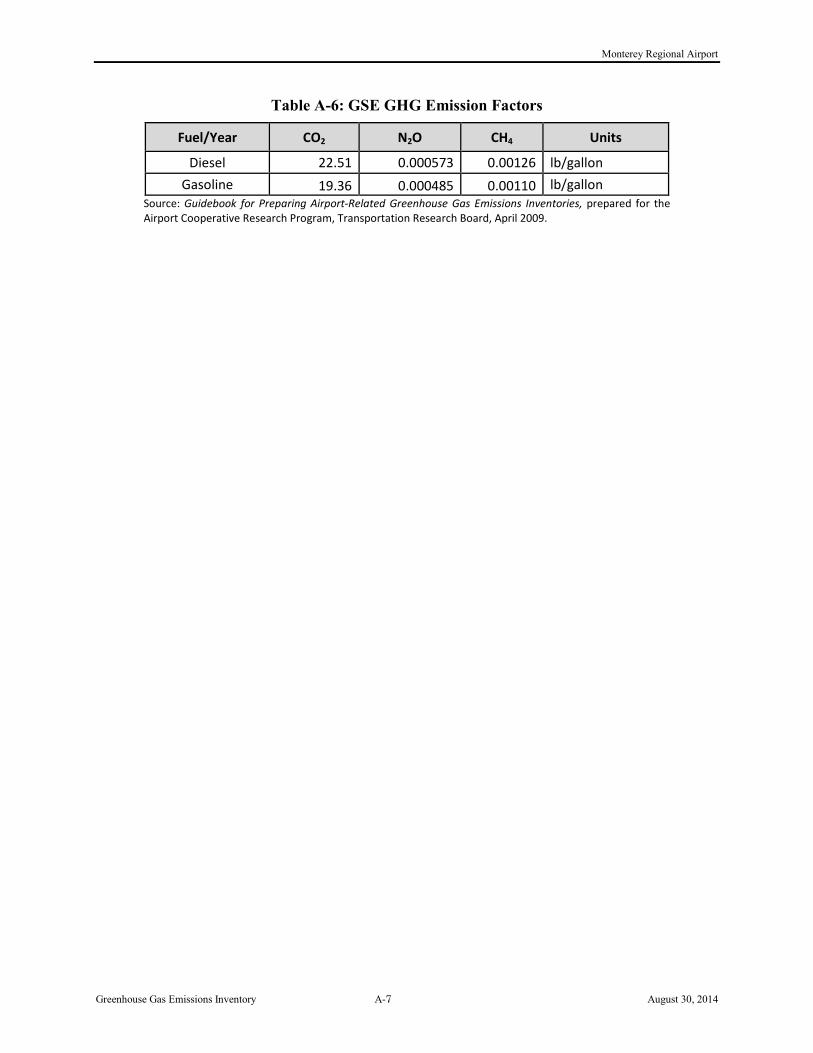
Monterey Regional Airport
Greenhouse Gas Emissions Inventory A-7 August 30, 2014
Table A-6: GSE GHG Emission Factors
Fuel/Year CO2 N2O CH4 Units
Diesel 22.51 0.000573 0.00126 lb/gallon Gasoline 19.36 0.000485 0.00110 lb/gallon
Source: Guidebook for Preparing Airport-Related Greenhouse Gas Emissions Inventories, prepared for the Airport Cooperative Research Program, Transportation Research Board, April 2009.
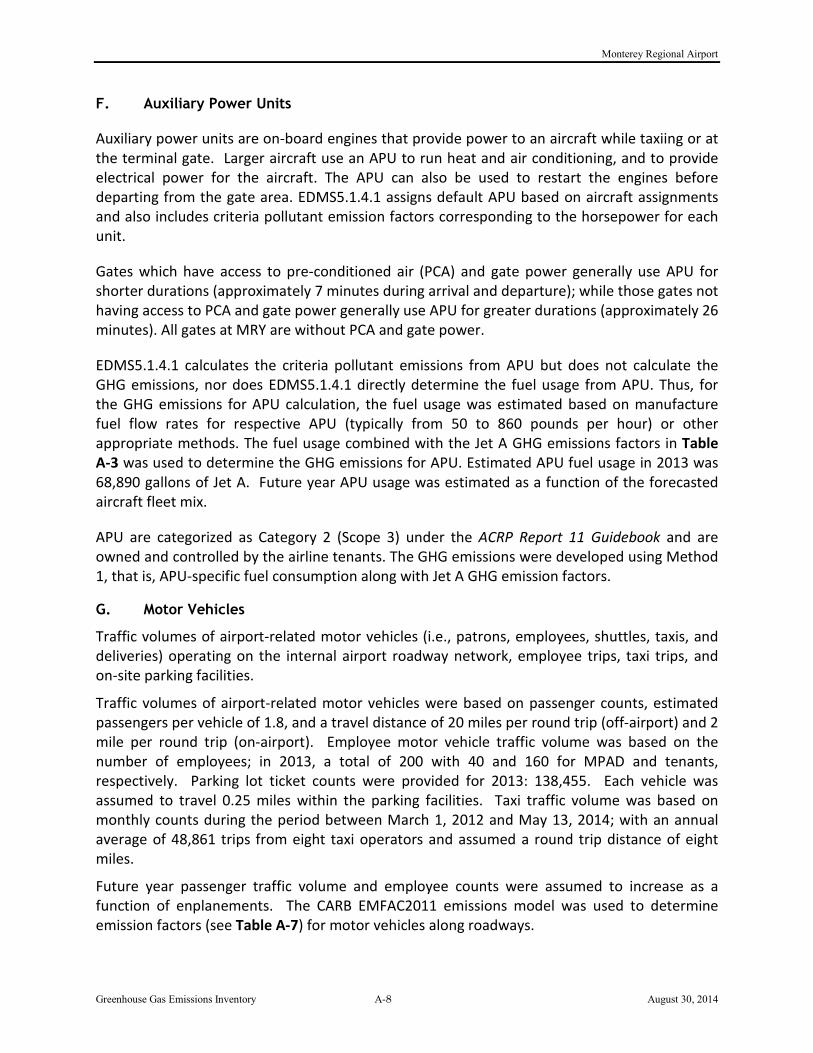
Monterey Regional Airport
Greenhouse Gas Emissions Inventory A-8 August 30, 2014
F. Auxiliary Power Units
Auxiliary power units are on-board engines that provide power to an aircraft while taxiing or at the terminal gate. Larger aircraft use an APU to run heat and air conditioning, and to provide electrical power for the aircraft. The APU can also be used to restart the engines before departing from the gate area. EDMS5.1.4.1 assigns default APU based on aircraft assignments and also includes criteria pollutant emission factors corresponding to the horsepower for each unit.
Gates which have access to pre-conditioned air (PCA) and gate power generally use APU for shorter durations (approximately 7 minutes during arrival and departure); while those gates not having access to PCA and gate power generally use APU for greater durations (approximately 26 minutes). All gates at MRY are without PCA and gate power.
EDMS5.1.4.1 calculates the criteria pollutant emissions from APU but does not calculate the GHG emissions, nor does EDMS5.1.4.1 directly determine the fuel usage from APU. Thus, for the GHG emissions for APU calculation, the fuel usage was estimated based on manufacture fuel flow rates for respective APU (typically from 50 to 860 pounds per hour) or other appropriate methods. The fuel usage combined with the Jet A GHG emissions factors in Table A-3 was used to determine the GHG emissions for APU. Estimated APU fuel usage in 2013 was 68,890 gallons of Jet A. Future year APU usage was estimated as a function of the forecasted aircraft fleet mix.
APU are categorized as Category 2 (Scope 3) under the ACRP Report 11 Guidebook and are owned and controlled by the airline tenants. The GHG emissions were developed using Method 1, that is, APU-specific fuel consumption along with Jet A GHG emission factors.
G. Motor Vehicles
Traffic volumes of airport-related motor vehicles (i.e., patrons, employees, shuttles, taxis, and deliveries) operating on the internal airport roadway network, employee trips, taxi trips, and on-site parking facilities.
Traffic volumes of airport-related motor vehicles were based on passenger counts, estimated passengers per vehicle of 1.8, and a travel distance of 20 miles per round trip (off-airport) and 2 mile per round trip (on-airport). Employee motor vehicle traffic volume was based on the number of employees; in 2013, a total of 200 with 40 and 160 for MPAD and tenants, respectively. Parking lot ticket counts were provided for 2013: 138,455. Each vehicle was assumed to travel 0.25 miles within the parking facilities. Taxi traffic volume was based on monthly counts during the period between March 1, 2012 and May 13, 2014; with an annual average of 48,861 trips from eight taxi operators and assumed a round trip distance of eight miles.
Future year passenger traffic volume and employee counts were assumed to increase as a function of enplanements. The CARB EMFAC2011 emissions model was used to determine emission factors (see Table A-7) for motor vehicles along roadways.

Monterey Regional Airport
Greenhouse Gas Emissions Inventory A-9 August 30, 2014
Table A-7: GHG Emission Factors for Motor Vehicles (grams/mile)
Year Speed CO2 N2O CH4 2013 10 mph 893 0.005 0.014
25 mph 456 0.005 0.014 Composite 507 0.005 0.014
2018 10 mph 893 0.005 0.014 25 mph 456 0.005 0.014
Composite 511 0.005 0.014 2023 10 mph 894 0.005 0.014
25 mph 456 0.005 0.014 Composite 513 0.005 0.014
2033 10 mph 893 0.005 0.014 25 mph 456 0.005 0.014
Composite 513 0.005 0.014 Source: CARB EMFAC2011 Emissions Model.
The MPAD also operates a fleet of vehicles which are used for airport operations as well as a fleet of parking lot shuttle buses. Fuel usage is tracked for these vehicles. During 2013, the fuel usage for the MPAD fleet vehicles was 6,080 gallons of gasoline and 3,477 gallons of diesel. Future year fuel usage for MPAD fleet vehicles was estimated as a function of forecasted aircraft operations. The GHG emissions were based on fuel usage and emissions factors previously presented within Table A-6.
Mobile sources are categorized as Category 1, 2 and 3 (Scope 1 and 3) and are under the ownership/control of the MPAD, tenants or public. The GHG emissions were developed using Method 3 for mobile sources of the ACRP Report 11 Guidebook.
H. Stationary Sources
Stationary sources such as boilers and generators were included in the analysis. These sources are generally owned and controlled by MPAD. The GHG emissions were based on actual fuel usage and emissions factors presented within Table A-6.
Table A-6: GHG Emission Factors for Stationary Sources
Sources Fuel CO2 N2O CH4 Units Generator Diesel 22.51 0.000573 0.00126 lb/gallon Boiler CNG NA NA NA NA Electrical Consumption 0.611 0.0285 0.00603 lb/kWh
Notes: CH4 – methane, CO2 – carbon dioxide, N2O – nitrous oxides, lb – pound, kWh – kilowatt hour, scfd – standard cubic feet per day. Source: United States Environmental Protection Agency, Emission Factors for Greenhouse Gas Inventories, April 2014, http://www.epa.gov/climateleadership/documents/emission-factors.pdf USEPA’s eGRID Database (http://www.epa.gov/cleanenergy/energy-resources/egrid/index.html).
Stationary source fuel usage was not available at the time of the preparation of this preliminary draft report. This information will be added for future drafts of this report. Future year usage

Monterey Regional Airport
Greenhouse Gas Emissions Inventory A-10 August 30, 2014
was set equal to usage during 2013 as no terminal expansion, which would require greater usage, is expected.
During 2013, electrical consumption was 950,669 kilowatts of which 478,745 kilowatts was directly related to airport operations, 471,228 kilowatts was related to tenant operations, and 696 kilowatts was associated with the vehicle charging stations.
The GHG emission factor for electrical usage is based on data from USEPA’s eGRID2012.9 The analysis used a value of 610.82 pounds of CO2 per megawatt, 28.49 pounds of CH4 per gigawatt, and 6.03 pounds of N2O per gigawatt.
Stationary sources are categorized as Category 1 and 2 (Scope 1 and 2) and are under the ownership/control of MPAD or tenants. The GHG emissions were developed using Method 1 for stationary sources of the ACRP Report 11 Guidebook.
9 eGRID2012 Version 1.0 Year 2009 GHG Annual Output Emission Rates, http://www.epa.gov/cleanenergy/documents/egridzips/eGRID2012V1_0_year09_GHGOutputrates.pdf.

Monterey Regional Airport
Greenhouse Gas Emissions Inventory B-1 August 30, 2014
APPENDIX B – DETAILED RESULTS
Appendix B contains detailed GHG emissions inventory data and results for the MRY GHG emissions inventory. Tables B-1 and B-2 present the estimate material usage and GHG emissions during 2013, respectively. Tables B-3 and B-4 present the estimate material usage and GHG emissions during 2018, respectively. Tables B-5 and B-6 present the estimate material usage and GHG emissions during 2023, respectively. Tables B-7 and B-8 present the estimate material usage and GHG emissions during 2033, respectively.
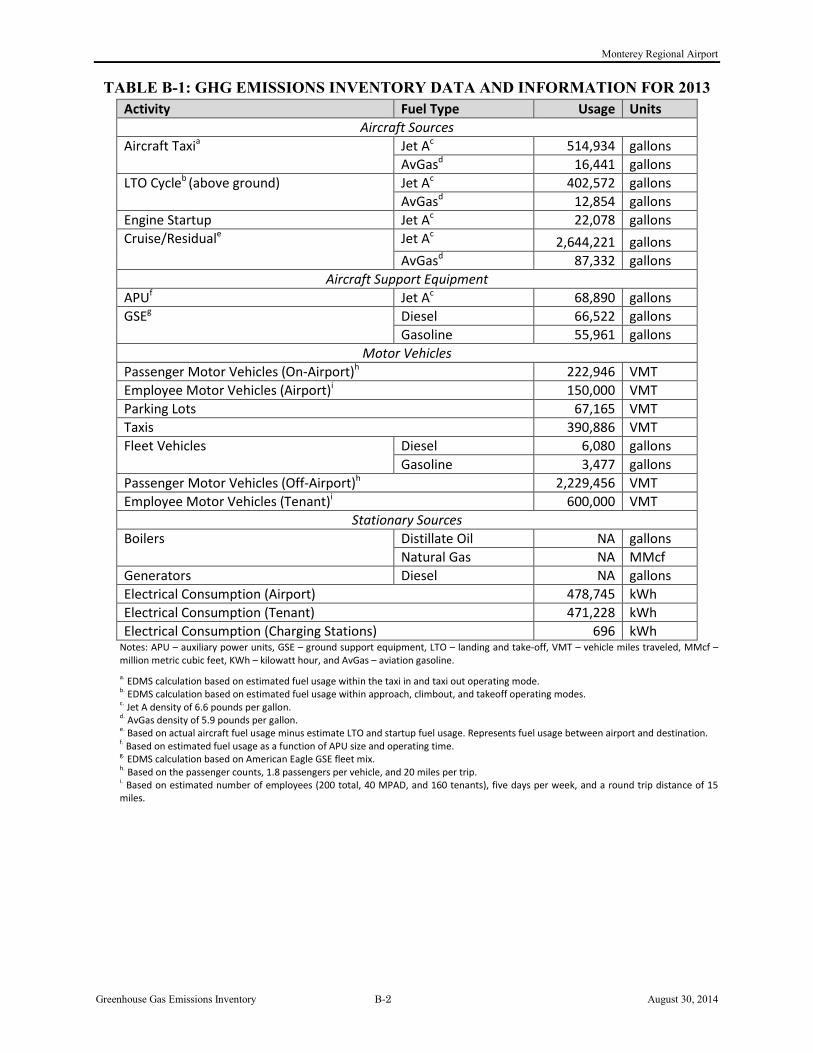
Monterey Regional Airport
Greenhouse Gas Emissions Inventory B-2 August 30, 2014
TABLE B-1: GHG EMISSIONS INVENTORY DATA AND INFORMATION FOR 2013 Activity Fuel Type Usage Units
Aircraft Sources Aircraft Taxia Jet Ac 514,934 gallons
AvGasd 16,441 gallons LTO Cycleb (above ground) Jet Ac 402,572 gallons
AvGasd 12,854 gallons Engine Startup Jet Ac 22,078 gallons Cruise/Residuale Jet Ac 2,644,221 gallons
AvGasd 87,332 gallons Aircraft Support Equipment
APUf Jet Ac 68,890 gallons GSEg Diesel 66,522 gallons
Gasoline 55,961 gallons Motor Vehicles
Passenger Motor Vehicles (On-Airport)h 222,946 VMT Employee Motor Vehicles (Airport)i 150,000 VMT Parking Lots 67,165 VMT Taxis 390,886 VMT Fleet Vehicles Diesel 6,080 gallons
Gasoline 3,477 gallons Passenger Motor Vehicles (Off-Airport)h 2,229,456 VMT Employee Motor Vehicles (Tenant)i 600,000 VMT
Stationary Sources Boilers Distillate Oil NA gallons
Natural Gas NA MMcf Generators Diesel NA gallons Electrical Consumption (Airport) 478,745 kWh Electrical Consumption (Tenant) 471,228 kWh Electrical Consumption (Charging Stations) 696 kWh
Notes: APU – auxiliary power units, GSE – ground support equipment, LTO – landing and take-off, VMT – vehicle miles traveled, MMcf – million metric cubic feet, KWh – kilowatt hour, and AvGas – aviation gasoline. a. EDMS calculation based on estimated fuel usage within the taxi in and taxi out operating mode. b. EDMS calculation based on estimated fuel usage within approach, climbout, and takeoff operating modes. c. Jet A density of 6.6 pounds per gallon. d. AvGas density of 5.9 pounds per gallon. e. Based on actual aircraft fuel usage minus estimate LTO and startup fuel usage. Represents fuel usage between airport and destination. f. Based on estimated fuel usage as a function of APU size and operating time. g. EDMS calculation based on American Eagle GSE fleet mix. h. Based on the passenger counts, 1.8 passengers per vehicle, and 20 miles per trip. i. Based on estimated number of employees (200 total, 40 MPAD, and 160 tenants), five days per week, and a round trip distance of 15 miles.
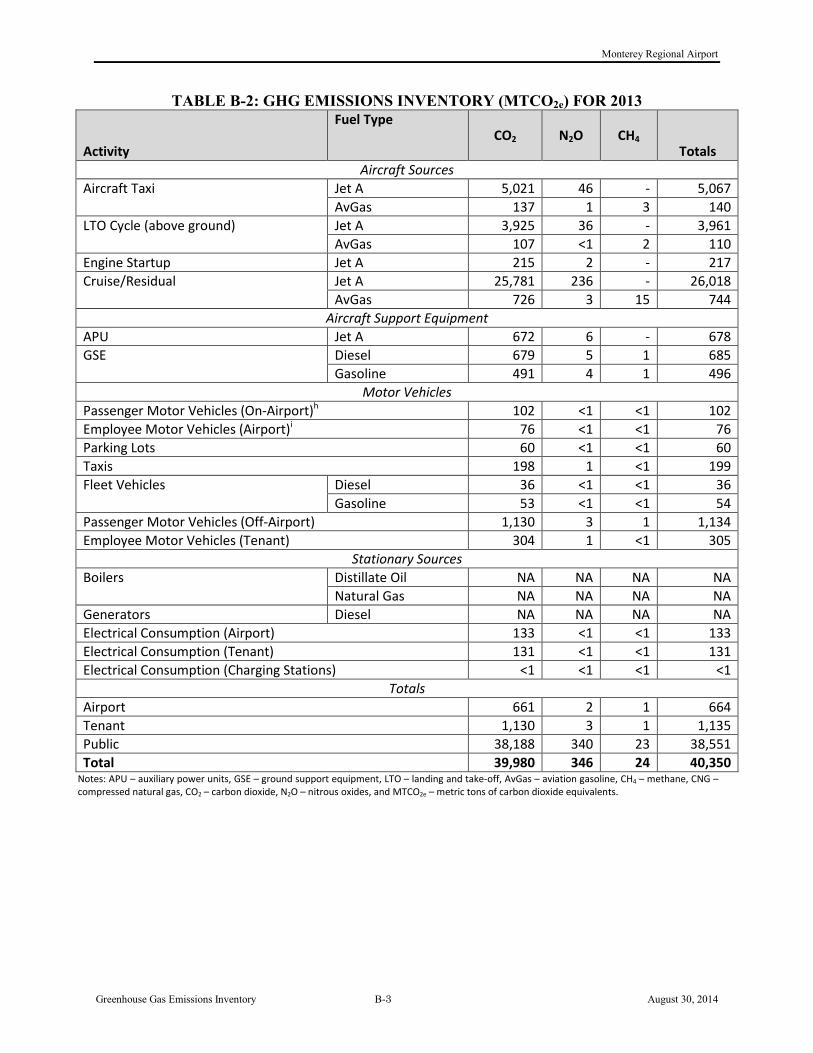
Monterey Regional Airport
Greenhouse Gas Emissions Inventory B-3 August 30, 2014
TABLE B-2: GHG EMISSIONS INVENTORY (MTCO2e) FOR 2013
Activity
Fuel Type CO2 N2O CH4
Totals Aircraft Sources
Aircraft Taxi Jet A 5,021 46 - 5,067 AvGas 137 1 3 140
LTO Cycle (above ground) Jet A 3,925 36 - 3,961 AvGas 107 <1 2 110
Engine Startup Jet A 215 2 - 217 Cruise/Residual Jet A 25,781 236 - 26,018
AvGas 726 3 15 744 Aircraft Support Equipment
APU Jet A 672 6 - 678 GSE Diesel 679 5 1 685
Gasoline 491 4 1 496 Motor Vehicles
Passenger Motor Vehicles (On-Airport)h 102 <1 <1 102 Employee Motor Vehicles (Airport)i 76 <1 <1 76 Parking Lots 60 <1 <1 60 Taxis 198 1 <1 199 Fleet Vehicles Diesel 36 <1 <1 36
Gasoline 53 <1 <1 54 Passenger Motor Vehicles (Off-Airport) 1,130 3 1 1,134 Employee Motor Vehicles (Tenant) 304 1 <1 305
Stationary Sources Boilers Distillate Oil NA NA NA NA
Natural Gas NA NA NA NA Generators Diesel NA NA NA NA Electrical Consumption (Airport) 133 <1 <1 133 Electrical Consumption (Tenant) 131 <1 <1 131 Electrical Consumption (Charging Stations) <1 <1 <1 <1
Totals Airport 661 2 1 664 Tenant 1,130 3 1 1,135 Public 38,188 340 23 38,551 Total 39,980 346 24 40,350
Notes: APU – auxiliary power units, GSE – ground support equipment, LTO – landing and take-off, AvGas – aviation gasoline, CH4 – methane, CNG – compressed natural gas, CO2 – carbon dioxide, N2O – nitrous oxides, and MTCO2e – metric tons of carbon dioxide equivalents.

Monterey Regional Airport
Greenhouse Gas Emissions Inventory B-4 August 30, 2014
TABLE B-3: GHG EMISSIONS INVENTORY DATA AND INFORMATION FOR 2018 Activity Fuel Type Usage Units
Aircraft Sources Aircraft Taxia Jet Ac 541,753 gallons
AvGasd 17,298 gallons LTO Cycleb (above ground) Jet Ac 448,753 gallons
AvGasd 14,328 gallons Engine Startup Jet Ac 22,808 gallons Cruise/Residuale Jet Ac 2,867,016 gallons
AvGasd 94,259 gallons Aircraft Support Equipment
APUf Jet Ac 62,329 gallons GSEg Diesel 63,663 gallons
Gasoline 56,657 gallons Motor Vehicles
Passenger Motor Vehicles (On-Airport)h 253,449 VMT Employee Motor Vehicles (Airport)i 161,908 VMT Parking Lots 69,603 VMT Taxis 444,366 VMT Fleet Vehicles Diesel 3,753 gallons
Gasoline 6,562 gallons Passenger Motor Vehicles (Off-Airport)h 2,534,489 VMT Employee Motor Vehicles (Tenant)i 647,630 VMT
Stationary Sources Boilers Distillate Oil NA gallons
Natural Gas NA MMcf Generators Diesel NA gallons Electrical Consumption (Airport) 478,745 kWh Electrical Consumption (Tenant) 471,228 kWh Electrical Consumption (Charging Stations) 696 kWh
Notes: APU – auxiliary power units, GSE – ground support equipment, LTO – landing and take-off, VMT – vehicle miles traveled, MMcf – million metric cubic feet, KWh – kilowatt hour, and AvGas – aviation gasoline. a. EDMS calculation based on estimated fuel usage within the taxi in and taxi out operating mode. b. EDMS calculation based on estimated fuel usage within approach, climbout, and takeoff operating modes. c. Jet A density of 6.6 pounds per gallon. d. AvGas density of 5.9 pounds per gallon. e. Based on actual aircraft fuel usage minus estimate LTO and startup fuel usage. Represents fuel usage between airport and destination. f. Based on estimated fuel usage as a function of APU size and operating time. g. EDMS calculation based on American Eagle GSE fleet mix. h. Based on the passenger counts, 1.8 passengers per vehicle, and 20 miles per trip. i. Based on estimated number of employees (200 total, 40 MPAD, and 160 tenants), five days per week, and a round trip distance of 15 miles.

Monterey Regional Airport
Greenhouse Gas Emissions Inventory B-5 August 30, 2014
TABLE B-4: GHG EMISSIONS INVENTORY (MTCO2e) FOR 2018
Activity
Fuel Type CO2 N2O CH4
Totals Aircraft Sources
Aircraft Taxi Jet A 5,282 48 - 5,331 AvGas 144 1 3 147
LTO Cycle (above ground) Jet A 4,375 40 - 4,415 AvGas 119 <1 3 122
Engine Startup Jet A 222 2 - 224 Cruise/Residual Jet A 27,953 256 - 28,210
AvGas 783 3 17 803 Aircraft Support Equipment
APU Jet A 608 6 - 613 GSE Diesel 650 5 1 656
Gasoline 497 4 1 502 Motor Vehicles
Passenger Motor Vehicles (On-Airport)h 116 <1 <1 116 Employee Motor Vehicles (Airport)i 83 <1 <1 83 Parking Lots 62 <1 <1 62 Taxis 227 1 <1 228 Fleet Vehicles Diesel 38 <1 <1 39
Gasoline 58 <1 <1 58 Passenger Motor Vehicles (Off-Airport) 1,296 4 1 1,300 Employee Motor Vehicles (Tenant) 331 1 <1 332
Stationary Sources Boilers Distillate Oil NA NA NA NA
Natural Gas NA NA NA NA Generators Diesel NA NA NA NA Electrical Consumption (Airport) 133 <1 <1 133 Electrical Consumption (Tenant) 131 <1 <1 131 Electrical Consumption (Charging Stations) <1 <1 <1 <1
Totals Airport 716 2 1 719 Tenant 1,296 4 1 1,301 Public 41,096 367 24 41,487 Total 43,108 373 26 43,507
Notes: APU – auxiliary power units, GSE – ground support equipment, LTO – landing and take-off, AvGas – aviation gasoline, CH4 – methane, CNG – compressed natural gas, CO2 – carbon dioxide, N2O – nitrous oxides, and MTCO2e – metric tons of carbon dioxide equivalents.

Monterey Regional Airport
Greenhouse Gas Emissions Inventory B-6 August 30, 2014
TABLE B-5: GHG EMISSIONS INVENTORY DATA AND INFORMATION FOR 2023 Activity Fuel Type Usage Units
Aircraft Sources Aircraft Taxia Jet Ac 598,709 gallons
AvGasd 19,116 gallons LTO Cycleb (above ground) Jet Ac 515,066 gallons
AvGasd 16,446 gallons Engine Startup Jet Ac 24,729 gallons Cruise/Residuale Jet Ac 3,185,151 gallons
AvGasd 104,407 gallons Aircraft Support Equipment
APUf Jet Ac 60,094 gallons GSEg Diesel 64,450 gallons
Gasoline 60,858 gallons Motor Vehicles
Passenger Motor Vehicles (On-Airport)h 287,653 VMT Employee Motor Vehicles (Airport)i 180,021 VMT Parking Lots 72,337 VMT Taxis 504,336 VMT Fleet Vehicles Diesel 4,173 gallons
Gasoline 7,296 gallons Passenger Motor Vehicles (Off-Airport)h 2,876,533 VMT Employee Motor Vehicles (Tenant)i 720,085 VMT
Stationary Sources Boilers Distillate Oil NA gallons
Natural Gas NA MMcf Generators Diesel NA gallons Electrical Consumption (Airport) 478,745 kWh Electrical Consumption (Tenant) 471,228 kWh Electrical Consumption (Charging Stations) 696 kWh
Notes: APU – auxiliary power units, GSE – ground support equipment, LTO – landing and take-off, VMT – vehicle miles traveled, MMcf – million metric cubic feet, KWh – kilowatt hour, and AvGas – aviation gasoline. a. EDMS calculation based on estimated fuel usage within the taxi in and taxi out operating mode. b. EDMS calculation based on estimated fuel usage within approach, climbout, and takeoff operating modes. c. Jet A density of 6.6 pounds per gallon. d. AvGas density of 5.9 pounds per gallon. e. Based on actual aircraft fuel usage minus estimate LTO and startup fuel usage. Represents fuel usage between airport and destination. f. Based on estimated fuel usage as a function of APU size and operating time. g. EDMS calculation based on American Eagle GSE fleet mix. h. Based on the passenger counts, 1.8 passengers per vehicle, and 20 miles per trip. i. Based on estimated number of employees (200 total, 40 MPAD, and 160 tenants), five days per week, and a round trip distance of 15 miles.
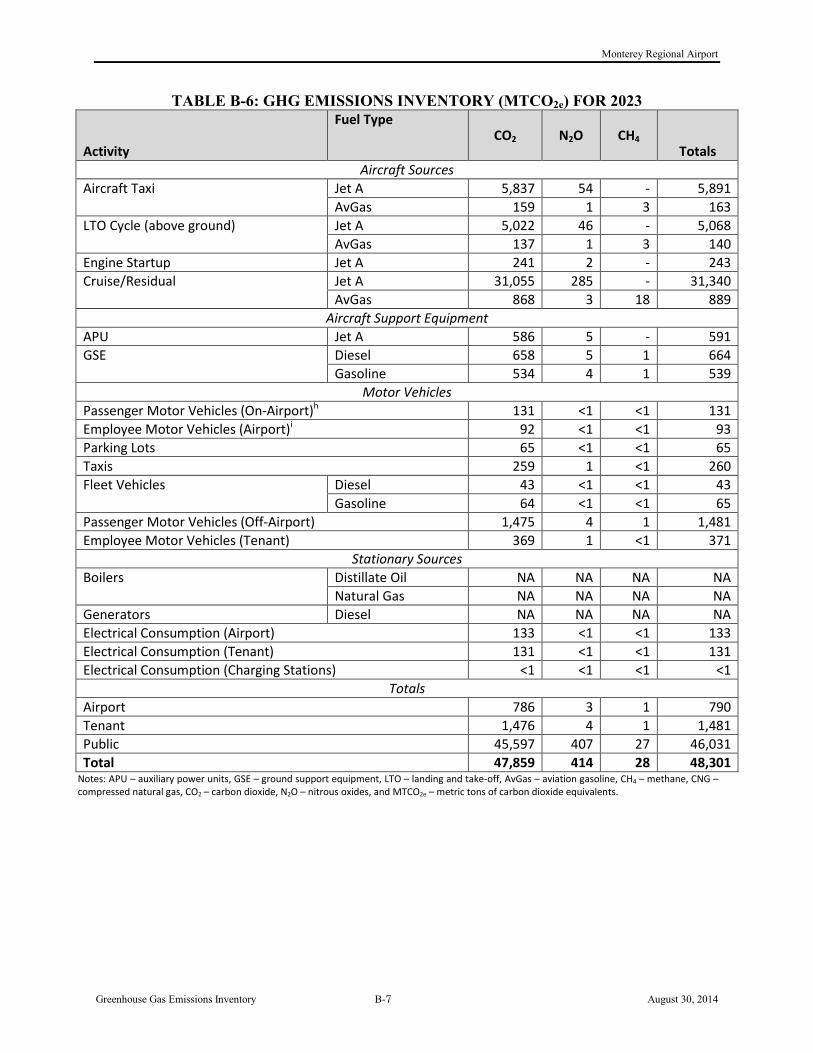
Monterey Regional Airport
Greenhouse Gas Emissions Inventory B-7 August 30, 2014
TABLE B-6: GHG EMISSIONS INVENTORY (MTCO2e) FOR 2023
Activity
Fuel Type CO2 N2O CH4
Totals Aircraft Sources
Aircraft Taxi Jet A 5,837 54 - 5,891 AvGas 159 1 3 163
LTO Cycle (above ground) Jet A 5,022 46 - 5,068 AvGas 137 1 3 140
Engine Startup Jet A 241 2 - 243 Cruise/Residual Jet A 31,055 285 - 31,340
AvGas 868 3 18 889 Aircraft Support Equipment
APU Jet A 586 5 - 591 GSE Diesel 658 5 1 664
Gasoline 534 4 1 539 Motor Vehicles
Passenger Motor Vehicles (On-Airport)h 131 <1 <1 131 Employee Motor Vehicles (Airport)i 92 <1 <1 93 Parking Lots 65 <1 <1 65 Taxis 259 1 <1 260 Fleet Vehicles Diesel 43 <1 <1 43
Gasoline 64 <1 <1 65 Passenger Motor Vehicles (Off-Airport) 1,475 4 1 1,481 Employee Motor Vehicles (Tenant) 369 1 <1 371
Stationary Sources Boilers Distillate Oil NA NA NA NA
Natural Gas NA NA NA NA Generators Diesel NA NA NA NA Electrical Consumption (Airport) 133 <1 <1 133 Electrical Consumption (Tenant) 131 <1 <1 131 Electrical Consumption (Charging Stations) <1 <1 <1 <1
Totals Airport 786 3 1 790 Tenant 1,476 4 1 1,481 Public 45,597 407 27 46,031 Total 47,859 414 28 48,301
Notes: APU – auxiliary power units, GSE – ground support equipment, LTO – landing and take-off, AvGas – aviation gasoline, CH4 – methane, CNG – compressed natural gas, CO2 – carbon dioxide, N2O – nitrous oxides, and MTCO2e – metric tons of carbon dioxide equivalents.
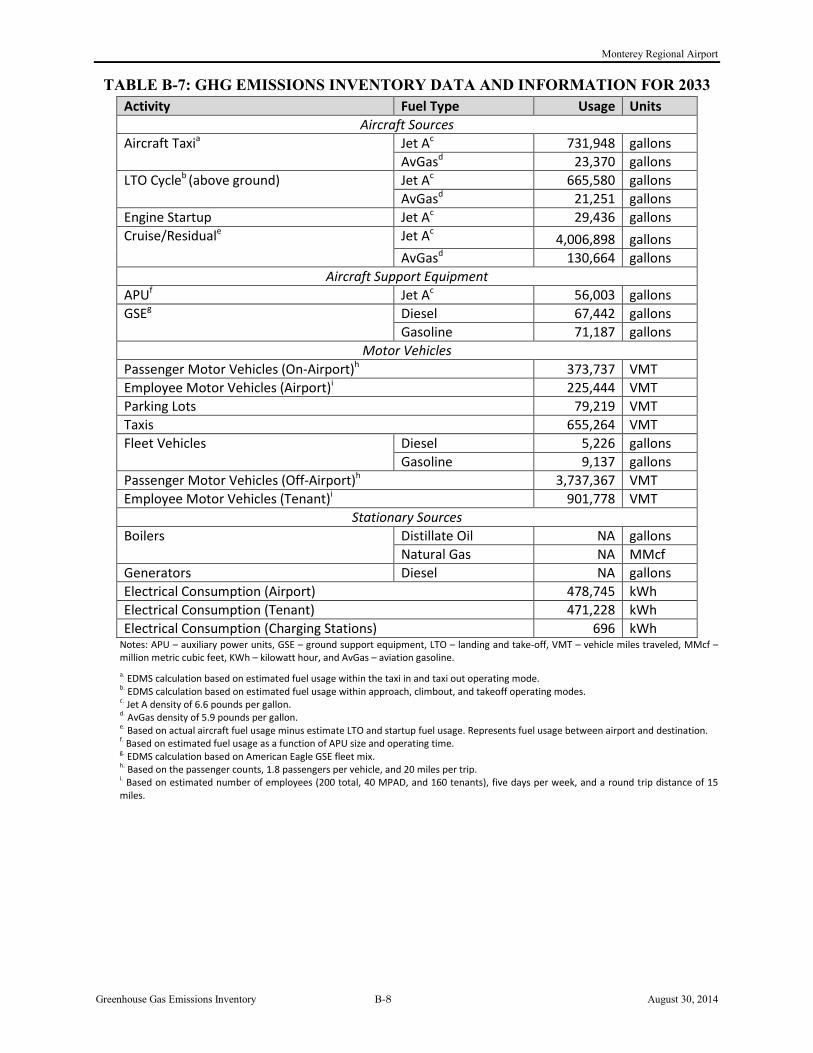
Monterey Regional Airport
Greenhouse Gas Emissions Inventory B-8 August 30, 2014
TABLE B-7: GHG EMISSIONS INVENTORY DATA AND INFORMATION FOR 2033 Activity Fuel Type Usage Units
Aircraft Sources Aircraft Taxia Jet Ac 731,948 gallons
AvGasd 23,370 gallons LTO Cycleb (above ground) Jet Ac 665,580 gallons
AvGasd 21,251 gallons Engine Startup Jet Ac 29,436 gallons Cruise/Residuale Jet Ac 4,006,898 gallons
AvGasd 130,664 gallons Aircraft Support Equipment
APUf Jet Ac 56,003 gallons GSEg Diesel 67,442 gallons
Gasoline 71,187 gallons Motor Vehicles
Passenger Motor Vehicles (On-Airport)h 373,737 VMT Employee Motor Vehicles (Airport)i 225,444 VMT Parking Lots 79,219 VMT Taxis 655,264 VMT Fleet Vehicles Diesel 5,226 gallons
Gasoline 9,137 gallons Passenger Motor Vehicles (Off-Airport)h 3,737,367 VMT Employee Motor Vehicles (Tenant)i 901,778 VMT
Stationary Sources Boilers Distillate Oil NA gallons
Natural Gas NA MMcf Generators Diesel NA gallons Electrical Consumption (Airport) 478,745 kWh Electrical Consumption (Tenant) 471,228 kWh Electrical Consumption (Charging Stations) 696 kWh
Notes: APU – auxiliary power units, GSE – ground support equipment, LTO – landing and take-off, VMT – vehicle miles traveled, MMcf – million metric cubic feet, KWh – kilowatt hour, and AvGas – aviation gasoline. a. EDMS calculation based on estimated fuel usage within the taxi in and taxi out operating mode. b. EDMS calculation based on estimated fuel usage within approach, climbout, and takeoff operating modes. c. Jet A density of 6.6 pounds per gallon. d. AvGas density of 5.9 pounds per gallon. e. Based on actual aircraft fuel usage minus estimate LTO and startup fuel usage. Represents fuel usage between airport and destination. f. Based on estimated fuel usage as a function of APU size and operating time. g. EDMS calculation based on American Eagle GSE fleet mix. h. Based on the passenger counts, 1.8 passengers per vehicle, and 20 miles per trip. i. Based on estimated number of employees (200 total, 40 MPAD, and 160 tenants), five days per week, and a round trip distance of 15 miles.

Monterey Regional Airport
Greenhouse Gas Emissions Inventory B-9 August 30, 2014
TABLE B-8: GHG EMISSIONS INVENTORY (MTCO2e) FOR 2033
Activity
Fuel Type CO2 N2O CH4
Totals Aircraft Sources
Aircraft Taxi Jet A 7,136 65 - 7,202 AvGas 194 1 4 199
LTO Cycle (above ground) Jet A 6,489 60 - 6,549 AvGas 177 1 4 181
Engine Startup Jet A 287 3 - 290 Cruise/Residual Jet A 39,067 358 - 39,425
AvGas 1,086 4 23 1,113 Aircraft Support Equipment
APU Jet A 546 5 - 551 GSE Diesel 689 5 1 695
Gasoline 625 5 1 631 Motor Vehicles
Passenger Motor Vehicles (On-Airport)h 170 <1 <1 170 Employee Motor Vehicles (Airport)i 116 <1 <1 116 Parking Lots 71 <1 <1 71 Taxis 336 1 <1 337 Fleet Vehicles Diesel 53 <1 <1 54
Gasoline 80 1 <1 81 Passenger Motor Vehicles (Off-Airport) 1,916 6 1 1,923 Employee Motor Vehicles (Tenant) 462 1 <1 464
Stationary Sources Boilers Distillate Oil NA NA NA NA
Natural Gas NA NA NA NA Generators Diesel NA NA NA NA Electrical Consumption (Airport) 133 <1 <1 133 Electrical Consumption (Tenant) 131 <1 <1 131 Electrical Consumption (Charging Stations) <1 <1 <1 <1
Totals Airport 959 3 1 963 Tenant 1,916 6 1 1,923 Public 56,889 508 33 57,431 Total 59,764 517 35 60,317
Notes: APU – auxiliary power units, GSE – ground support equipment, LTO – landing and take-off, AvGas – aviation gasoline, CH4 – methane, CNG – compressed natural gas, CO2 – carbon dioxide, N2O – nitrous oxides, and MTCO2e – metric tons of carbon dioxide equivalents.

Monterey Regional Airport Greenhouse Gas Emissions Inventory
Sustainability Measures August 30, 2014
The Airports Council International - North America’s (ACI-NA) definition of airport sustainability1 presents a holistic approach to airport management, centered on four pillars (inset figure): Economic viability, Operational efficiency, Natural resource conservation, and Social responsibility (EONS). Many elements of this framework apply to the sustainable management of Monterey Regional Airport (MRY) and Monterey Peninsula Airport District (MPAD).
As part of a business strategy, airport sustainability has measurable immediate and long-term benefits. Some benefits of sustainability initiatives that have been demonstrated at airports across the world include:
Improved passenger experience;
Better use of assets;
Reduced development and/or operations and maintenance costs;
Reduced environmental/ecological footprint (eco-footprint);
Facilitation of environmental approvals/permitting;
Improved relationships within the community;
Enhancement of regional economy;
Creation of an enriched place to work; and
Creation and utilization of new technologies and investment in existing technologies that facilitate sustainable solutions.
A key principle of sustainability is recognizing that addressing one concern does not necessarily come at the expense of another. Optimally, evaluating a project or activity based on environmental and social concerns will spur innovation that ultimately reduces costs and enhances benefits over the life of the project.
1 Airport Council International (ACI). Airport Sustainability: A Holistic Approach to Effective Airport Management. http://www.aci-
na.org/static/entransit/Sustainability%20White%20Paper.pdf.
EONS Approach to Sustainability
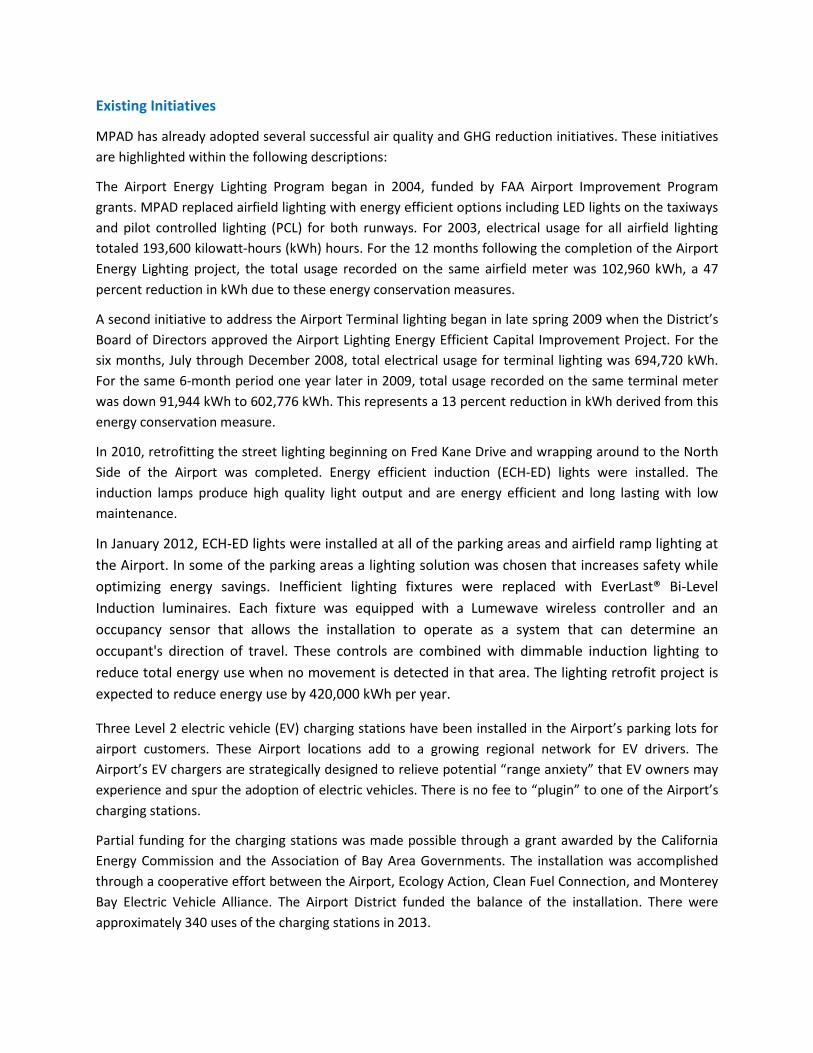
Existing Initiatives
MPAD has already adopted several successful air quality and GHG reduction initiatives. These initiatives are highlighted within the following descriptions:
The Airport Energy Lighting Program began in 2004, funded by FAA Airport Improvement Program grants. MPAD replaced airfield lighting with energy efficient options including LED lights on the taxiways and pilot controlled lighting (PCL) for both runways. For 2003, electrical usage for all airfield lighting totaled 193,600 kilowatt-hours (kWh) hours. For the 12 months following the completion of the Airport Energy Lighting project, the total usage recorded on the same airfield meter was 102,960 kWh, a 47 percent reduction in kWh due to these energy conservation measures.
A second initiative to address the Airport Terminal lighting began in late spring 2009 when the District’s Board of Directors approved the Airport Lighting Energy Efficient Capital Improvement Project. For the six months, July through December 2008, total electrical usage for terminal lighting was 694,720 kWh. For the same 6-month period one year later in 2009, total usage recorded on the same terminal meter was down 91,944 kWh to 602,776 kWh. This represents a 13 percent reduction in kWh derived from this energy conservation measure.
In 2010, retrofitting the street lighting beginning on Fred Kane Drive and wrapping around to the North Side of the Airport was completed. Energy efficient induction (ECH-ED) lights were installed. The induction lamps produce high quality light output and are energy efficient and long lasting with low maintenance.
In January 2012, ECH-ED lights were installed at all of the parking areas and airfield ramp lighting at the Airport. In some of the parking areas a lighting solution was chosen that increases safety while optimizing energy savings. Inefficient lighting fixtures were replaced with EverLast® Bi-Level Induction luminaires. Each fixture was equipped with a Lumewave wireless controller and an occupancy sensor that allows the installation to operate as a system that can determine an occupant's direction of travel. These controls are combined with dimmable induction lighting to reduce total energy use when no movement is detected in that area. The lighting retrofit project is expected to reduce energy use by 420,000 kWh per year.
Three Level 2 electric vehicle (EV) charging stations have been installed in the Airport’s parking lots for airport customers. These Airport locations add to a growing regional network for EV drivers. The Airport’s EV chargers are strategically designed to relieve potential “range anxiety” that EV owners may experience and spur the adoption of electric vehicles. There is no fee to “plugin” to one of the Airport’s charging stations.
Partial funding for the charging stations was made possible through a grant awarded by the California Energy Commission and the Association of Bay Area Governments. The installation was accomplished through a cooperative effort between the Airport, Ecology Action, Clean Fuel Connection, and Monterey Bay Electric Vehicle Alliance. The Airport District funded the balance of the installation. There were approximately 340 uses of the charging stations in 2013.
Potential Initiatives
The following summarizes a series of potential emissions reduction measures to be considered by the MPAD for MRY. For evaluation purposes, an indication of the estimated emissions reduction potential and associated costs is also identified for each measure. Notably, each measure is further discussed in greater detail, including:
• Description of what the measure entails; • Identification of whether the measure is feasible and applicable to MRY; • Qualitative evaluation of the estimated cost associated with the measure; and • Qualitative estimation of the emissions reduction potential associated with the measure.
These measures are organized based on whether they affect airside emissions sources or landside emissions sources. Airside-focused sustainability measures typically relate to the efficient and responsible operation of fossil-fueled off-road vehicles and devices such as aircraft, auxiliary power units (APU) and ground support equipment (GSE), as well as the use of sustainable construction practices for improvement projects occurring on the airfield or within the apron areas. Table 1 denotes airside measures to be considered by the airport.
Landside-focused sustainability measures focus on a wide array of energy efficiency, traffic congestion mitigation, waste management and “green fleet” activities that largely depend on the operational size and character of the airport. Table 2 suggests landside measures to be considered by the airport.

Table 1 -- Airside Measures
Sustainability Initiative
Description Sustainability Benefits Applicable Sustainability Categories (EONS)
Emission Reduction Potential
Cost Feasibility and Applicability
Encourage Single-engine Taxi and/or De-rated Take-off Procedures
If safety considerations allow, pilots may conduct taxi operations using a reduced number of aircraft engines (i.e., “single-engine taxi”), and/or utilize only enough thrust necessary to conduct a safe take-off (i.e., “de-rated take-off”).
Reduces aircraft taxi emissions and aircraft fuel burn overall, creating emissions savings.
E, O, N, S Moderate Low Yes but limited
opportunities
Limit Power-back and/or Reverse Thrust during Flight Procedures
Pilots can opt to use reverse thrust to slow the aircraft down and ensure a safe speed is attained before reaching the end of the runway.
Reduces levels of pollutants commonly emitted at high engine power settings.
O, N Moderate Low Yes but limited
opportunities
Use Aircraft Tugs to Move Aircraft on Airfield
Rather than having aircraft taxi on the airfield using their own engine power, move them using tow tractors (to the extent feasible)
Reduces aircraft taxi emissions and aircraft fuel burn overall, creating emissions savings.
E, O, N Moderate Moderate Yes but limited
opportunities
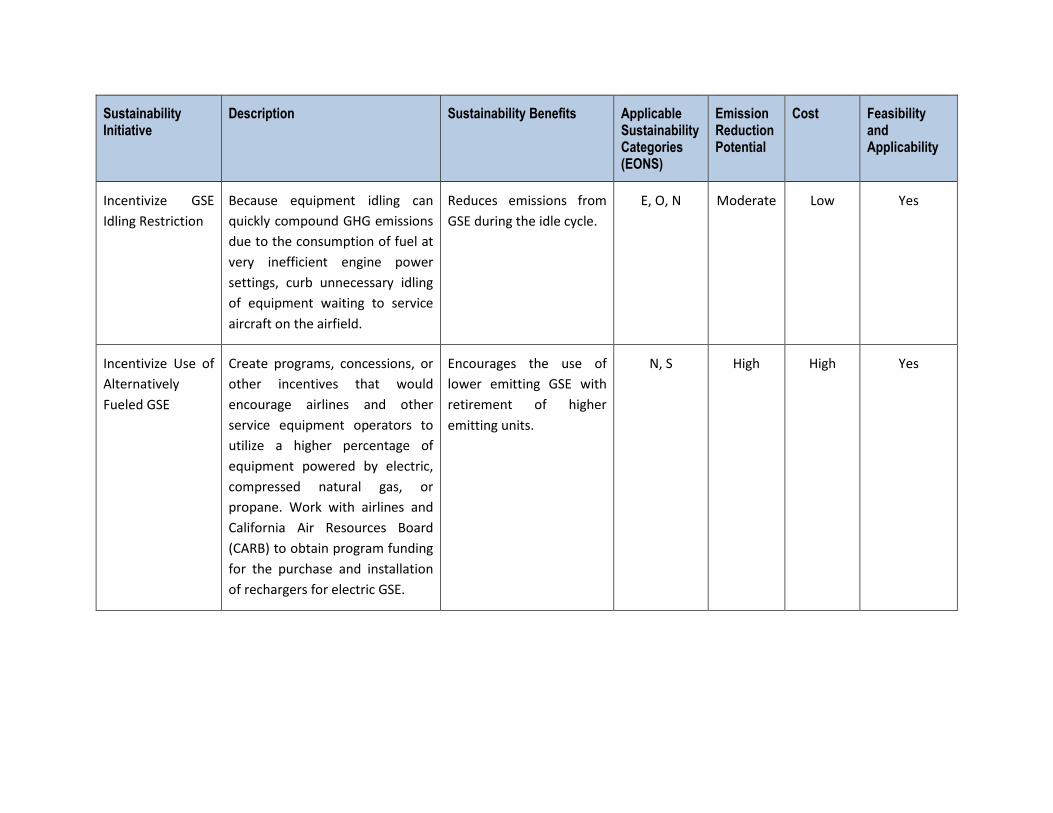
Sustainability Initiative
Description Sustainability Benefits Applicable Sustainability Categories (EONS)
Emission Reduction Potential
Cost Feasibility and Applicability
Incentivize GSE Idling Restriction
Because equipment idling can quickly compound GHG emissions due to the consumption of fuel at very inefficient engine power settings, curb unnecessary idling of equipment waiting to service aircraft on the airfield.
Reduces emissions from GSE during the idle cycle.
E, O, N Moderate Low Yes
Incentivize Use of Alternatively Fueled GSE
Create programs, concessions, or other incentives that would encourage airlines and other service equipment operators to utilize a higher percentage of equipment powered by electric, compressed natural gas, or propane. Work with airlines and California Air Resources Board (CARB) to obtain program funding for the purchase and installation of rechargers for electric GSE.
Encourages the use of lower emitting GSE with retirement of higher emitting units.
N, S High High Yes
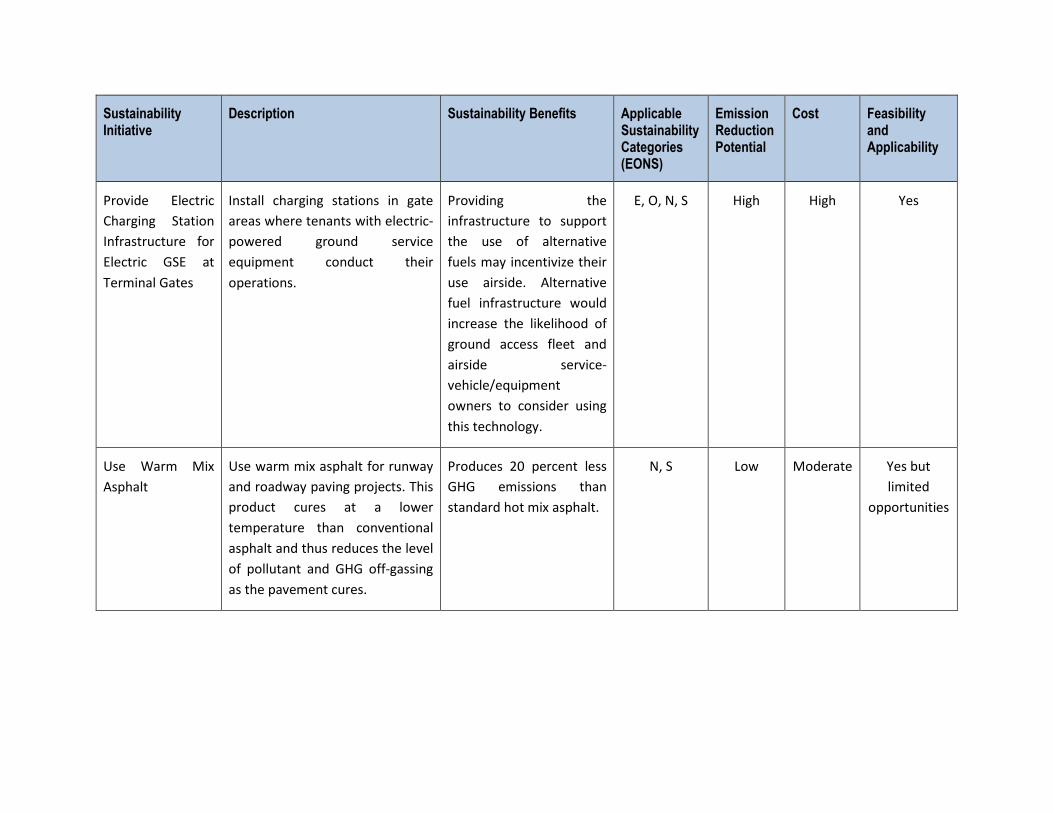
Sustainability Initiative
Description Sustainability Benefits Applicable Sustainability Categories (EONS)
Emission Reduction Potential
Cost Feasibility and Applicability
Provide Electric Charging Station Infrastructure for Electric GSE at Terminal Gates
Install charging stations in gate areas where tenants with electric-powered ground service equipment conduct their operations.
Providing the infrastructure to support the use of alternative fuels may incentivize their use airside. Alternative fuel infrastructure would increase the likelihood of ground access fleet and airside service-vehicle/equipment owners to consider using this technology.
E, O, N, S High High Yes
Use Warm Mix Asphalt
Use warm mix asphalt for runway and roadway paving projects. This product cures at a lower temperature than conventional asphalt and thus reduces the level of pollutant and GHG off-gassing as the pavement cures.
Produces 20 percent less GHG emissions than standard hot mix asphalt.
N, S Low Moderate Yes but limited
opportunities

Table 2 – Landside Measures
Sustainability Initiative
Description Sustainability Benefits Applicable Sustainability Categories (EONS)
Emission Reduction Potential
Cost Feasibility and Applicability
Replace Aging Vehicles with Alternative-fuel Options
Replace aging vehicles with alternative-fuel options, such as electric. New vehicles must be capable of meeting the use requirements of the Airport. Alternative Fuel Vehicles (AFVs) have fewer GHG emissions than conventional vehicles.
Reduces emissions from fleet vehicles and electric-powered equipment emit little-to-no pollutants directly (i.e., there are no tailpipe emissions).
Replacing fossil-fueled equipment of most frequent use with hybrids and CNG vehicles will provide emissions savings.
E, N Moderate Moderate Yes
Implement Anti-idling Measures for Vehicles within Airport Environs
Implement Terminal Area congestion reduction and anti-idling measures. Reducing congestion and idling will help to reduce emissions.
Reduces emissions that would occur if trucks were permitted to idle.
E, O, N Moderate Low Yes
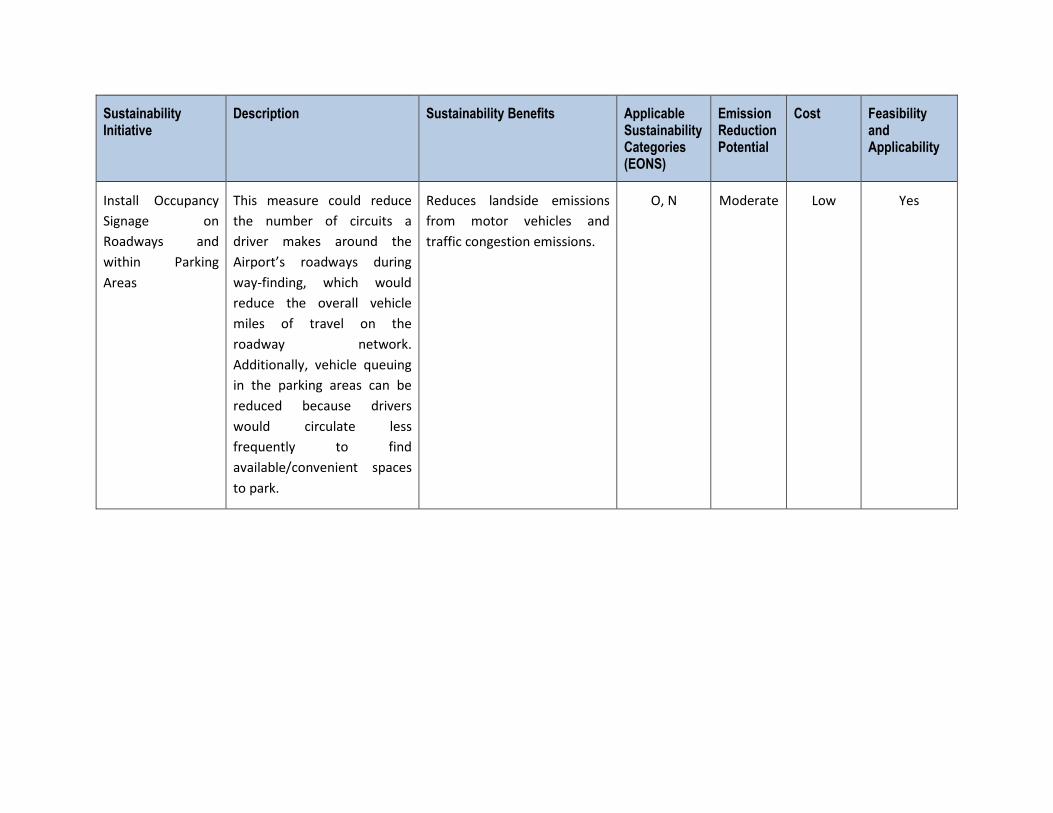
Sustainability Initiative
Description Sustainability Benefits Applicable Sustainability Categories (EONS)
Emission Reduction Potential
Cost Feasibility and Applicability
Install Occupancy Signage on Roadways and within Parking Areas
This measure could reduce the number of circuits a driver makes around the Airport’s roadways during way-finding, which would reduce the overall vehicle miles of travel on the roadway network. Additionally, vehicle queuing in the parking areas can be reduced because drivers would circulate less frequently to find available/convenient spaces to park.
Reduces landside emissions from motor vehicles and traffic congestion emissions.
O, N Moderate Low Yes

Sustainability Initiative
Description Sustainability Benefits Applicable Sustainability Categories (EONS)
Emission Reduction Potential
Cost Feasibility and Applicability
Promote High Occupancy Travel (HOV) Travel
Continue to promote public transportation and carpooling by passengers and employees. Strive to reduce single occupant vehicle use. HOV travel modes should be encouraged when traveling to the airport and while traveling on-Airport or to off-Airport meetings.
Reduces landside emissions from motor vehicles, traffic congestion emissions both on and off-airport.
N Moderate Low Yes
Encourage Employee Ridesharing, Carpooling and/or Telecommuting
Create a carpool matching program or some sort of enhanced compensation/benefits program for ridesharing, carpooling, or telecommuting. This can also be facilitated by providing mass transit options for employees (i.e., shuttles, discounted bus fare, etc.).
Reduces landside emissions from motor vehicles, traffic congestion emissions both on and off-airport.
N Moderate Low Yes
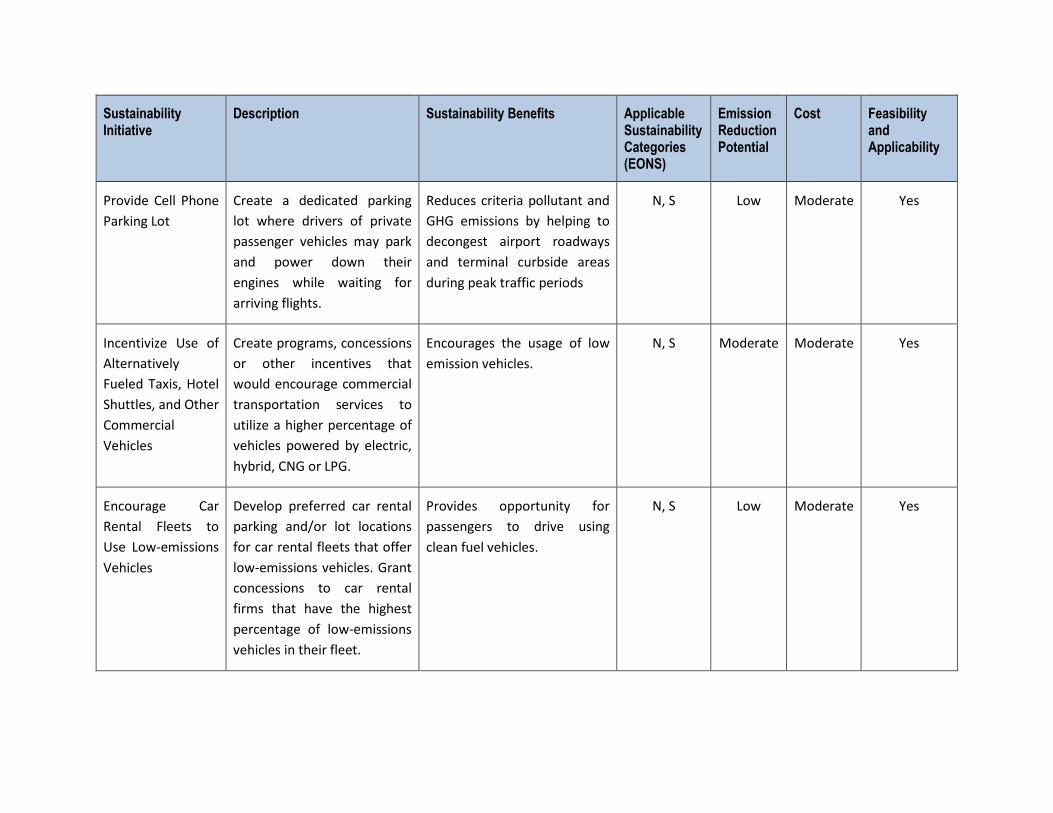
Sustainability Initiative
Description Sustainability Benefits Applicable Sustainability Categories (EONS)
Emission Reduction Potential
Cost Feasibility and Applicability
Provide Cell Phone Parking Lot
Create a dedicated parking lot where drivers of private passenger vehicles may park and power down their engines while waiting for arriving flights.
Reduces criteria pollutant and GHG emissions by helping to decongest airport roadways and terminal curbside areas during peak traffic periods
N, S Low Moderate Yes
Incentivize Use of Alternatively Fueled Taxis, Hotel Shuttles, and Other Commercial Vehicles
Create programs, concessions or other incentives that would encourage commercial transportation services to utilize a higher percentage of vehicles powered by electric, hybrid, CNG or LPG.
Encourages the usage of low emission vehicles.
N, S Moderate Moderate Yes
Encourage Car Rental Fleets to Use Low-emissions Vehicles
Develop preferred car rental parking and/or lot locations for car rental fleets that offer low-emissions vehicles. Grant concessions to car rental firms that have the highest percentage of low-emissions vehicles in their fleet.
Provides opportunity for passengers to drive using clean fuel vehicles.
N, S Low Moderate Yes
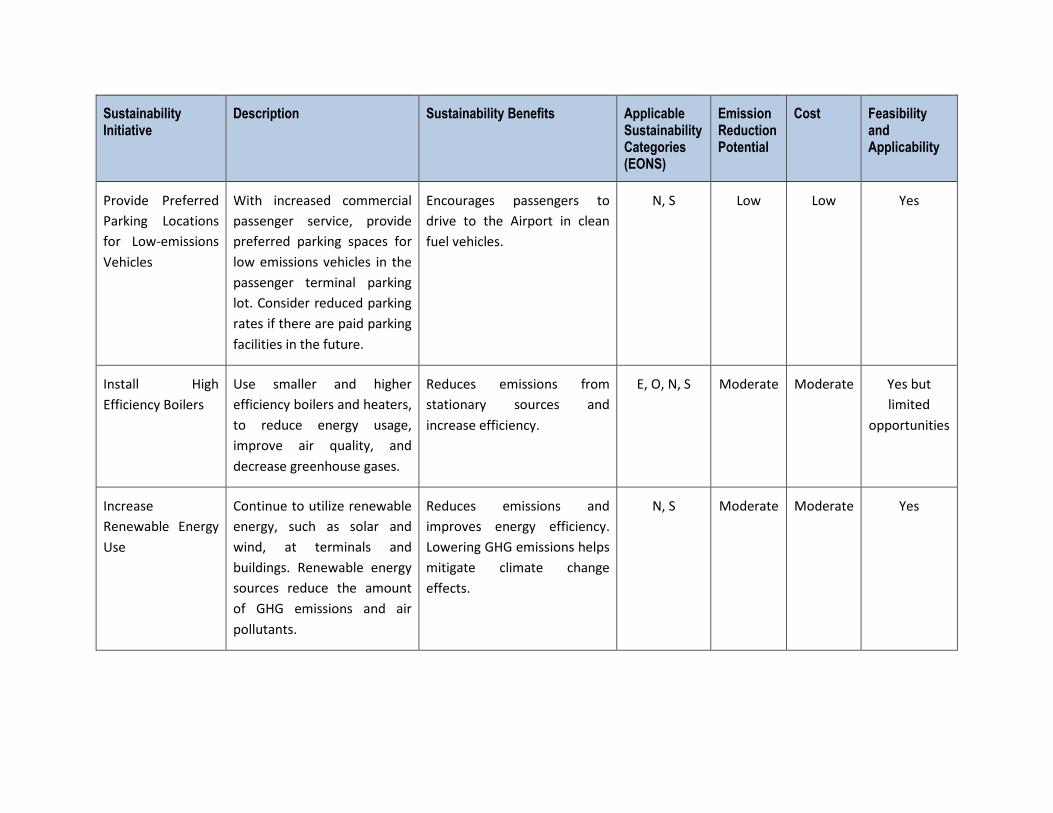
Sustainability Initiative
Description Sustainability Benefits Applicable Sustainability Categories (EONS)
Emission Reduction Potential
Cost Feasibility and Applicability
Provide Preferred Parking Locations for Low-emissions Vehicles
With increased commercial passenger service, provide preferred parking spaces for low emissions vehicles in the passenger terminal parking lot. Consider reduced parking rates if there are paid parking facilities in the future.
Encourages passengers to drive to the Airport in clean fuel vehicles.
N, S Low Low Yes
Install High Efficiency Boilers
Use smaller and higher efficiency boilers and heaters, to reduce energy usage, improve air quality, and decrease greenhouse gases.
Reduces emissions from stationary sources and increase efficiency.
E, O, N, S Moderate Moderate Yes but limited
opportunities
Increase Renewable Energy Use
Continue to utilize renewable energy, such as solar and wind, at terminals and buildings. Renewable energy sources reduce the amount of GHG emissions and air pollutants.
Reduces emissions and improves energy efficiency. Lowering GHG emissions helps mitigate climate change effects.
N, S Moderate Moderate Yes
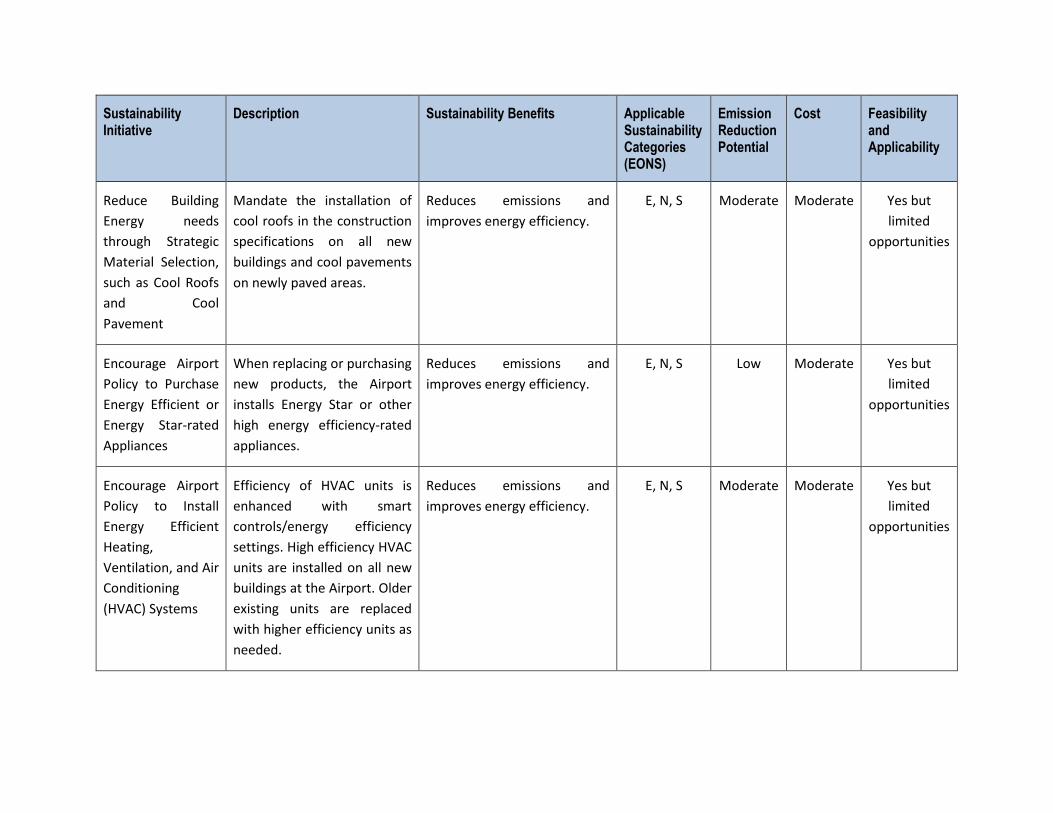
Sustainability Initiative
Description Sustainability Benefits Applicable Sustainability Categories (EONS)
Emission Reduction Potential
Cost Feasibility and Applicability
Reduce Building Energy needs through Strategic Material Selection, such as Cool Roofs and Cool Pavement
Mandate the installation of cool roofs in the construction specifications on all new buildings and cool pavements on newly paved areas.
Reduces emissions and improves energy efficiency.
E, N, S Moderate Moderate Yes but limited
opportunities
Encourage Airport Policy to Purchase Energy Efficient or Energy Star-rated Appliances
When replacing or purchasing new products, the Airport installs Energy Star or other high energy efficiency-rated appliances.
Reduces emissions and improves energy efficiency.
E, N, S Low Moderate Yes but limited
opportunities
Encourage Airport Policy to Install Energy Efficient Heating, Ventilation, and Air Conditioning (HVAC) Systems
Efficiency of HVAC units is enhanced with smart controls/energy efficiency settings. High efficiency HVAC units are installed on all new buildings at the Airport. Older existing units are replaced with higher efficiency units as needed.
Reduces emissions and improves energy efficiency.
E, N, S Moderate Moderate Yes but limited
opportunities

Sustainability Initiative
Description Sustainability Benefits Applicable Sustainability Categories (EONS)
Emission Reduction Potential
Cost Feasibility and Applicability
Ensure New Building HVAC Equipment does not Use CFC or HCFC Refrigerants
Design new HVAC requirements without CFC/HCFC refrigerants. Inventory existing equipment that uses CFC/HCFC refrigerants and adopt a replacement schedule to eliminate use of them.
Reduces GHG emissions by reducing or eliminating the use of high emitting materials.
N, S Low Moderate Yes but limited
opportunities
Incorporate Energy Efficiency in Building Design
Incorporates green building technologies and energy use reduction strategies. For new and substantial renovation of buildings over 20,000 square feet, strive for Leadership in Energy and Environmental Design (LEED™) Silver or higher certification and also participate in the LEED™ for Existing Buildings Operations and Maintenance (EBOM) rating system.
Improves air quality and reduces operating costs and contributes to overall quality of life and enhances passenger experience.
LEED™ Certification encourages global adoption of sustainable green building and development practices.
E, O, N, S Moderate High Yes but limited
opportunities
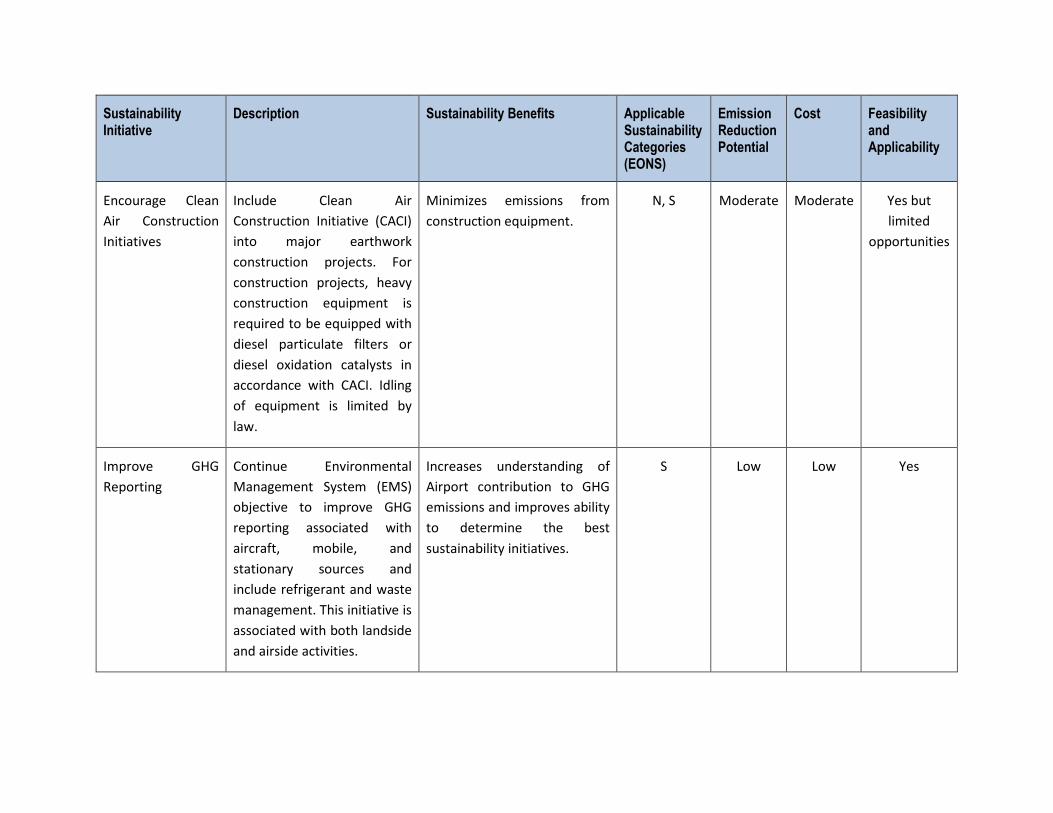
Sustainability Initiative
Description Sustainability Benefits Applicable Sustainability Categories (EONS)
Emission Reduction Potential
Cost Feasibility and Applicability
Encourage Clean Air Construction Initiatives
Include Clean Air Construction Initiative (CACI) into major earthwork construction projects. For construction projects, heavy construction equipment is required to be equipped with diesel particulate filters or diesel oxidation catalysts in accordance with CACI. Idling of equipment is limited by law.
Minimizes emissions from construction equipment.
N, S Moderate Moderate Yes but limited
opportunities
Improve GHG Reporting
Continue Environmental Management System (EMS) objective to improve GHG reporting associated with aircraft, mobile, and stationary sources and include refrigerant and waste management. This initiative is associated with both landside and airside activities.
Increases understanding of Airport contribution to GHG emissions and improves ability to determine the best sustainability initiatives.
S Low Low Yes
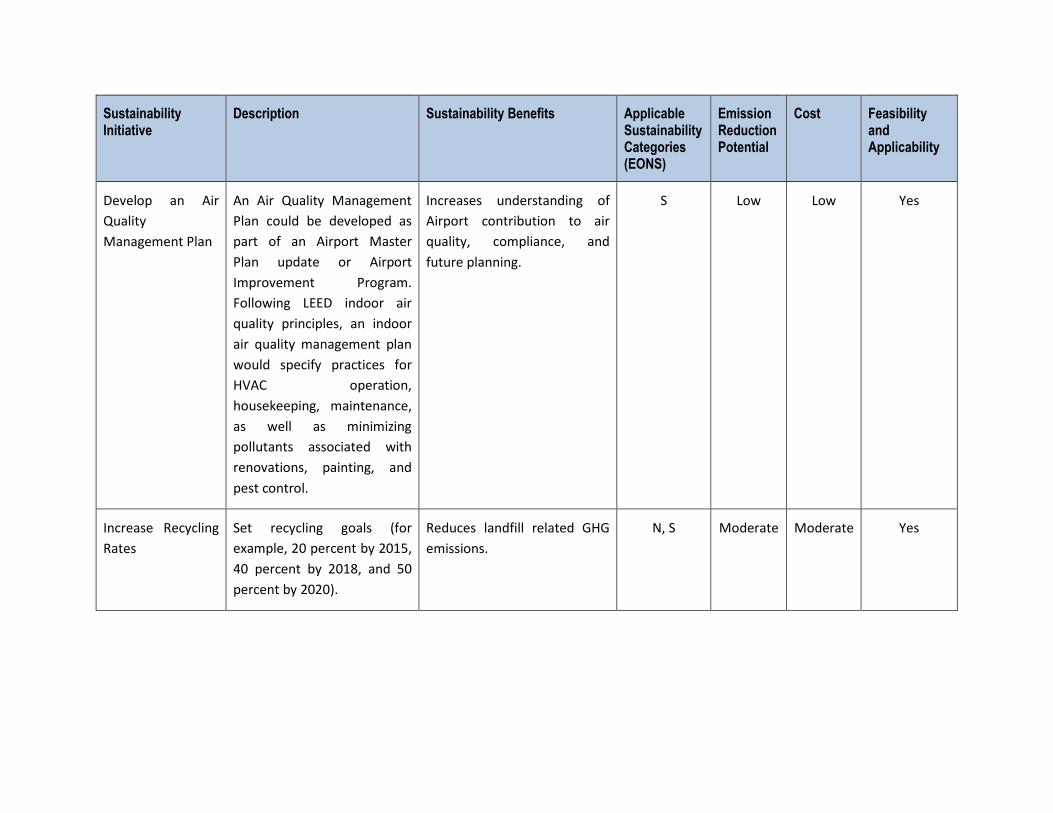
Sustainability Initiative
Description Sustainability Benefits Applicable Sustainability Categories (EONS)
Emission Reduction Potential
Cost Feasibility and Applicability
Develop an Air Quality Management Plan
An Air Quality Management Plan could be developed as part of an Airport Master Plan update or Airport Improvement Program. Following LEED indoor air quality principles, an indoor air quality management plan would specify practices for HVAC operation, housekeeping, maintenance, as well as minimizing pollutants associated with renovations, painting, and pest control.
Increases understanding of Airport contribution to air quality, compliance, and future planning.
S Low Low Yes
Increase Recycling Rates
Set recycling goals (for example, 20 percent by 2015, 40 percent by 2018, and 50 percent by 2020).
Reduces landfill related GHG emissions.
N, S Moderate Moderate Yes