appendix e noise - san bernardino county - official website · appendix e noise bloomington i ......
TRANSCRIPT
Appendix E
Noise
BLOOMINGTON INDUSTRIAL FACILITY
Draft
ENVIRONMENTAL IMPACT REPORT

NOISE AND VIBRATION
TECHNICAL REPORT,
BLOOMINGTON DISTRIBUTION PROJECT
Prepared for:
Western Realco 500 Newport Center Drive # 630
Newport Beach, California 92660
Contact: Jeremy Mape
Prepared by:
605 Third Street
Encinitas, California 92024
Contact: Mike Greene 949.373.8317
SEPTEMBER 2016

Printed on 30% post-consumer recycled material.
Noise and Vibration Technical Report, Bloomington Distribution Project
8674 i September 2016
TABLE OF CONTENTS
Section Page No.
ACRONYMS ............................................................................................................................... III
SUMMARY ................................................................................................................................... V
1 INTRODUCTION..............................................................................................................1
1.1 Purpose .................................................................................................................... 1
1.2 Project Location ...................................................................................................... 1
1.3 Project Description.................................................................................................. 1
2 FUNDAMENTALS OF NOISE AND VIBRATION ......................................................9
2.1 Sound, Noise, and Acoustics .................................................................................. 9
2.2 Sound Pressure Levels and Decibels ...................................................................... 9
2.3 A-Weighted Sound Level ....................................................................................... 9
2.4 Human Response to Changes in Noise Levels ..................................................... 10
2.5 Noise Descriptors .................................................................................................. 11
2.6 Sound Propagation ................................................................................................ 11
2.7 Groundborne Vibration Fundamentals ................................................................. 11
3 REGULATORY SETTING ............................................................................................13
3.1 Federal................................................................................................................... 13
3.2 State....................................................................................................................... 13
3.3 Local ..................................................................................................................... 14
3.3.1 County of San Bernardino Municipal Code.............................................. 14
3.3.2 County of San Bernardino 2007 General Plan .......................................... 15
4 EXISTING CONDITIONS .............................................................................................17
4.1 Ambient Noise Monitoring ................................................................................... 18
5 PROJECT IMPACT ANALYSIS ..................................................................................23
5.1 Methodology ......................................................................................................... 23
5.2 Thresholds of Significance ................................................................................... 23
5.3 Construction Noise Impacts .................................................................................. 24
5.4 Operational Noise Impacts .................................................................................... 28
5.4.1 Off-Site Traffic Noise ............................................................................... 28
5.4.2 On-Site Operations Noise ......................................................................... 30
5.5 Vibration Impacts.................................................................................................. 32
Noise and Vibration Technical Report, Bloomington Distribution Project
TABLE OF CONTENTS (CONTINUED)
Section Page No.
8674 ii September 2016
6 MITIGATION MEASURES...........................................................................................33
6.1 Construction Noise Mitigation Measures ............................................................. 33
6.2 Level of Significance After Mitigation ................................................................. 34
7 REFERENCES .................................................................................................................35
APPENDICES
A Field Noise Measurement Data Sheets
B Construction Noise Model Input / Output
C Traffic Noise Modeling Input and Output Files
D On-Site Noise Modeling Files
E Resume
FIGURES
1 Regional Map .......................................................................................................................3
2 Vicinity Map ........................................................................................................................5
3 Site Plan ...............................................................................................................................7
4 Noise Measurement and Modeling Locations ...................................................................21
TABLES
1 Typical Sound Levels in the Environment and Industry ...................................................10
2 Noise Standards for Stationary Noise Sources ..................................................................14
3 Noise Standards for Adjacent Mobile Noise Sources ........................................................14
4 Existing Daily Traffic Volumes .........................................................................................17
5 Short-Term Measurement Noise Levels ............................................................................18
6 Long-Term Measured Noise Levels ..................................................................................19
7 Measures of Substantial Increase for Community Noise Sources .....................................24
8 Construction Equipment Noise Emission Levels ..............................................................25
9 Construction Noise Model Results Summary ....................................................................27
10 Project-Related Traffic Noise: Existing .............................................................................29
11 Project-Related Traffic Noise: Future (Year 2018) ...........................................................30
12 Noise from On-Site Activities ...........................................................................................31
Noise and Vibration Technical Report, Bloomington Distribution Project
8674 iii September 2016
ACRONYMS
Acronym Definition
ADT average daily traffic
dB decibel
dBA A-weighted decibel
CEQA California Environmental Quality Act
CNEL community noise equivalent level
FHWA Federal Highway Administration
Leq equivalent sound level
PPV peak particle velocity
TNM Traffic Noise Model
VdB velocity decibel

Noise and Vibration Technical Report, Bloomington Distribution Project
8674 iv September 2016
INTENTIONALLY LEFT BLANK
Noise and Vibration Technical Report, Bloomington Distribution Project
8674 v September 2016
SUMMARY
The project applicant (Western Realco) is proposing to construct a single 676,983-square-foot
distribution building within an approximately 35-acre property. The site would include two
detention basins and landscaping along Cedar Avenue and Jurupa Avenue. There will be a total
of 272 automobile parking stalls constructed for employee parking with access from Cedar
Avenue and Jurupa Avenue. Truck access will be installed from Cedar Avenue, and the dockyard
would include 138 trailer storage stalls, 4 grade level ramps, and 110 dock high doors.
This noise and vibration report summarizes the impact analysis evaluating the potential for
significant adverse impacts due to construction, operation and maintenance of the proposed
project. Potential noise impacts during construction were found to be potentially significant; with
implementation of the recommended mitigation measures, noise impacts would be reduced to a
level of less than significant. During operation and maintenance, noise impacts were determined
to be less than significant; therefore, no operations noise mitigation would be required.

Noise and Vibration Technical Report, Bloomington Distribution Project
8674 vi September 2016
INTENTIONALLY LEFT BLANK
Noise and Vibration Technical Report, Bloomington Distribution Project
8674 1 September 2016
1 INTRODUCTION
1.1 Purpose
The purpose of this report is to estimate and evaluate the potential noise and vibration impacts
associated with construction and operation of the Bloomington Distribution Project (proposed
project) relative to the significance thresholds and noise / vibration standards of the County of
San Bernardino.
1.2 Project Location
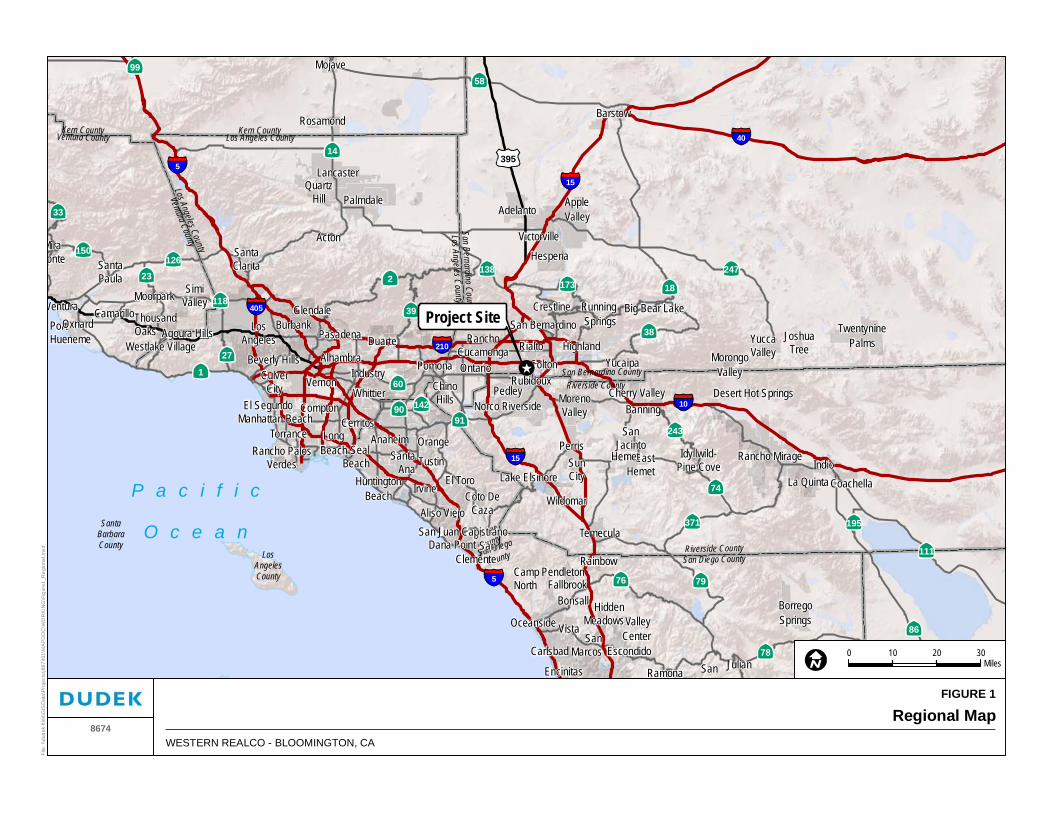
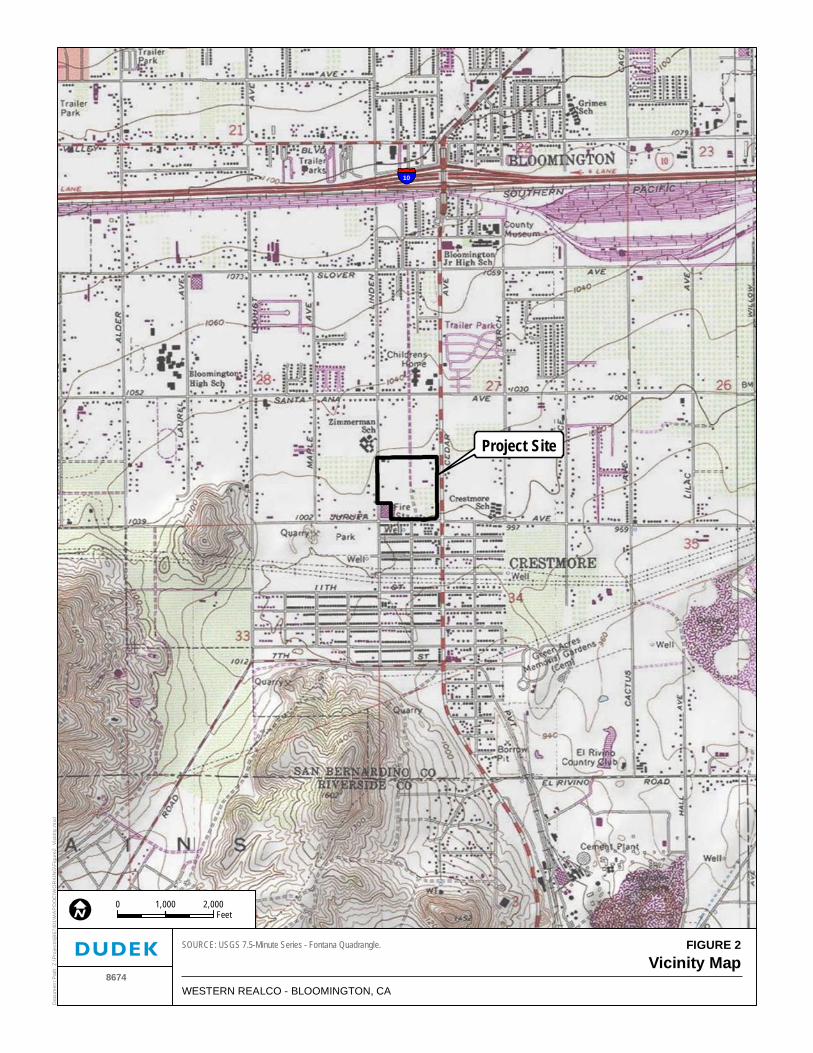
The proposed project would be located north of Jurupa Avenue, east of Linden Avenue, and west
of Cedar Avenue in the census-designated place (CDP) of Bloomington, in the County of San
Bernardino, California, as shown in Figures 1 and 2.
1.3 Project Description
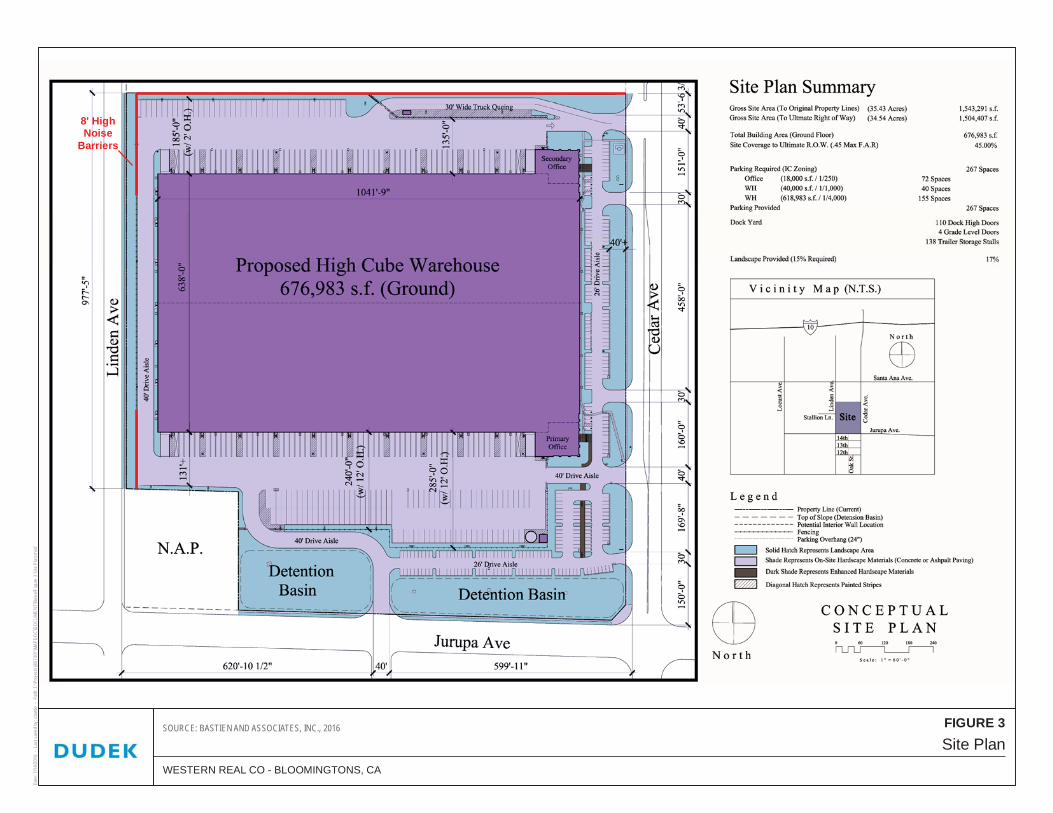
Western Realco is proposing to construct a single 676,983-square-foot distribution building
within an approximately 35-acre property. The site would include two detention basins and
landscaping along Cedar Avenue and Jurupa Avenue. There will be a total of 272 automobile
parking stalls constructed for employee parking with access from Cedar Avenue and Jurupa
Avenue. Truck access will be installed from Cedar Avenue, and the dockyard would include 138
trailer storage stalls, 4 grade level ramps, and 110 dock high doors. A site plan of the project is
shown in Figure 3.

Noise and Vibration Technical Report, Bloomington Distribution Project
8674 2 September 2016
INTENTIONALLY LEFT BLANK
Im
LosAngelesCounty
SantaBarbaraCounty
Los Angeles County
Riverside County
Los Angeles CountyVentura County
San Bernardino County
Kern County
Los Angeles County
Ventura County
San Bernardino County
Orange
CountySan Diego
County San Diego County
Sa
Riverside County
Kern County
Encinitas
CarlsbadSan
Marcos Escondido
Vista ValleyCenter
HiddenMeadowsOceanside
Bonsall
Camp PendletonNorth Fallbrook
Rainbow
Ramona SanDi
Julian
BorregoSprings
SanClemente
Dana PointSan Juan CapistranoAliso Viejo
Coto DeCaza
El ToroIrvineHuntington
Beach
TustinSantaAna
SealBeach
OrangeAnaheim
Temecula
Perris
Norco MorenoValley
Pedley Desert Hot SpringsCherry ValleyRiverside
Rubidoux
Banning
Wildomar
Lake ElsinoreSunCity Coachella
Idyllwild-Pine Cove
La Quinta
EastHemet Indio
Hemet
SanJacinto
Rancho MirageRancho PalosVerdes
Torrance LongBeach
CerritosManhattan BeachComptonEl Segundo
WhittierVernonCulver
CityIndustry
Beverly Hills Alhambra PomonaWestlake Village
Agoura Hills LosAngeles
SantaClarita
Lancaster
BurbankDuartePasadena
Glendale
Acton
PalmdaleQuartz
Hill
PortHueneme
Oxnard ThousandOaks
SimiValleyMoorpark
Ventura Camarillo
SantaPaula
Miraonte
ChinoHills
YucaipaOntario Colton MorongoValley
RanchoCucamonga Rialto
San BernardinoYuccaValley
TwentyninePalmsJoshua
TreeHighland
RunningSprings
Crestline Big Bear Lake
Hesperia
AppleValley
Victorville
Adelanto
BarstowRosamond
Mojave
P a c i f i c
O c e a n
74
118
91
39
99
142
126
195
23
90
33
27
150
371
173
243
58
160
86
247
38
76
14
79
111
2138
18
78
395
15
10
5
5
210
15
405
40
Copyright:' 2014 Esri
FIGURE 1
Regional MapWESTERN REALCO - BLOOMINGTON, CA
8674
0 3010 20Miles
Project Site
File
: \\d
udek
-file
s\G
ISD
ata\
Pro
ject
s\j8
6740
1\M
AP
DO
C\W
OR
KIN
G\F
igur
e1_R
egio
nal.m
xd
Noise and Vibration Technical Report, Bloomington Distribution Project
8674 4 September 2016
INTENTIONALLY LEFT BLANK
10
FIGURE 2Vicinity Map
8674WESTERN REALCO - BLOOMINGTON, CA
SOURCE: USGS 7.5-Minute Series - Fontana Quadrangle.
0 2,0001,000Feet
Project Site
Doc
umen
t Pat
h: Z
:\Pro
ject
s\j8
6740
1\M
AP
DO
C\W
OR
KIN
G\F
igur
e2_V
icin
ity.m
xd
Noise and Vibration Technical Report, Bloomington Distribution Project
8674 6 September 2016
INTENTIONALLY LEFT BLANK
8' HighNoise
Barriers
Site PlanWESTERN REAL CO - BLOOMINGTONS, CA
SOURCE: BASTIEN AND ASSOCIATES, INC., 2016
Date:
7/14
/201
6 -
Last
save
d by:
cbat
tle -
Path
: Z:\P
rojec
ts\j86
7401
\MAP
DOC\
DOCU
MEN
T\No
ise\F
igure
3 Si
te P
lan.m
xd
FIGURE 3

Noise and Vibration Technical Report, Bloomington Distribution Project
8674 8 September 2016
INTENTIONALLY LEFT BLANK
Noise and Vibration Technical Report, Bloomington Distribution Project
8674 9 September 2016
2 FUNDAMENTALS OF NOISE AND VIBRATION
The following is a brief discussion of fundamental noise concepts and terminology.
2.1 Sound, Noise, and Acoustics
Sound is actually a process that consists of three components: the sound source, the sound path,
and the sound receiver. All three components must be present for sound to exist. Without a source
to produce sound, there is no sound. Similarly, without a medium to transmit sound pressure
waves, there is no sound. Finally, sound must be received; a hearing organ, sensor, or object must
be present to perceive, register, or be affected by sound or noise. In most situations, there are many
different sound sources, paths, and receptors rather than just one of each. Acoustics is the field of
science that deals with the production, propagation, reception, effects, and control of sound. Noise
is defined as sound that is loud, unpleasant, unexpected, or undesired.
2.2 Sound Pressure Levels and Decibels
The amplitude of a sound determines its loudness. Loudness of sound increases with increasing
amplitude. Sound pressure amplitude is measured in units of micronewton per square meter, also
called micropascal. One micropascal is approximately one-hundred billionth (0.00000000001) of
normal atmospheric pressure. The pressure of a very loud sound may be 200 million
micropascals, or 10 million times the pressure of the weakest audible sound. Because expressing
sound levels in terms of micropascal would be very cumbersome, sound pressure level in
logarithmic units is used instead to describe the ratio of actual sound pressure to a reference
pressure squared. These units are called Bels. To provide a finer resolution, a Bel is subdivided
into 10 decibels (dB).
2.3 A-Weighted Sound Level
Sound pressure level alone is not a reliable indicator of loudness. The frequency, or pitch, of a
sound also has a substantial effect on how humans will respond. Although the intensity (energy
per unit area) of the sound is a purely physical quantity, the loudness, or human response, is
determined by the characteristics of the human ear.
Human hearing is limited not only in the range of audible frequencies, but also in the way it
perceives the sound in that range. In general, the healthy human ear is most sensitive to sounds
between 1,000 and 5,000 hertz, and it perceives a sound within that range as more intense than a
sound of higher or lower frequency with the same magnitude. To approximate the frequency
response of the human ear, a series of sound level adjustments is usually applied to the sound
Noise and Vibration Technical Report, Bloomington Distribution Project
8674 10 September 2016
measured by a sound level meter. The adjustments (referred to as a weighting network) are
frequency-dependent.
The A-scale weighting network approximates the frequency response of the average young ear
when listening to ordinary sounds. When people make judgments about the relative loudness or
annoyance of a sound, their judgments correlate well with the A-scale sound levels of those
sounds. Other weighting networks have been devised to address high noise levels or other special
situations (e.g., B-scale, C-scale, D-scale), but these scales are rarely used in conjunction with
most environmental noise. Noise levels are typically reported in terms of A-weighted sound
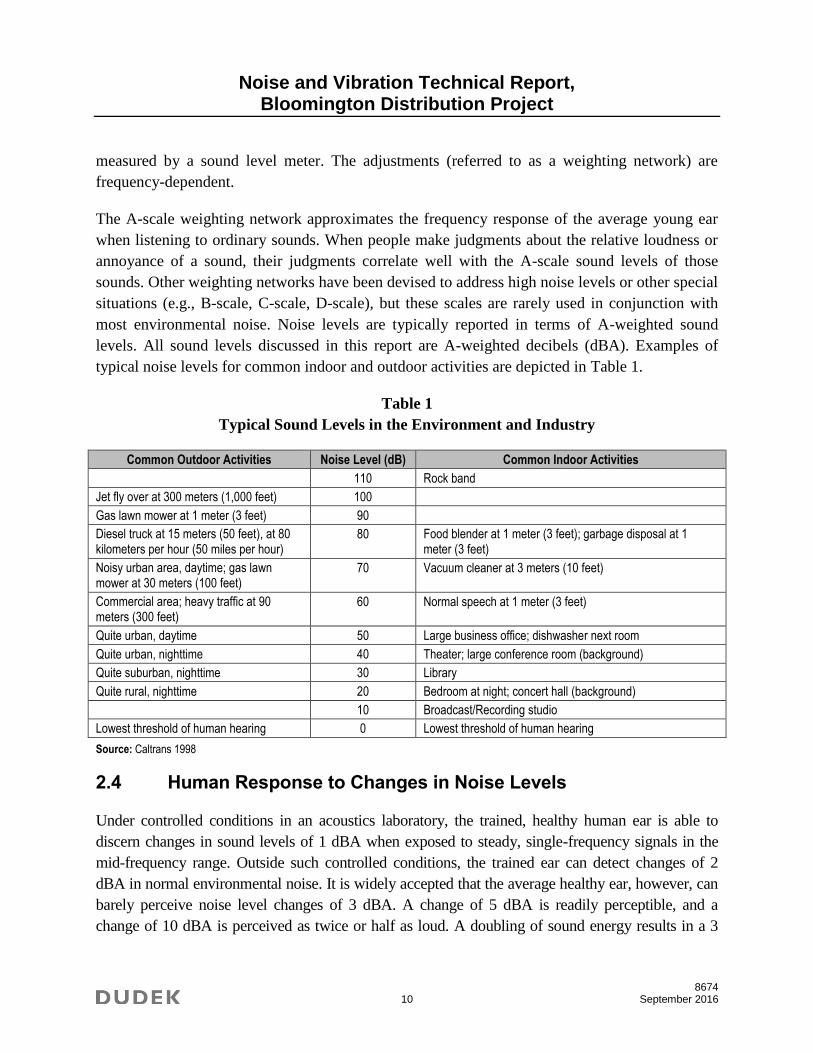
levels. All sound levels discussed in this report are A-weighted decibels (dBA). Examples of
typical noise levels for common indoor and outdoor activities are depicted in Table 1.
Table 1
Typical Sound Levels in the Environment and Industry
Common Outdoor Activities Noise Level (dB) Common Indoor Activities
110 Rock band
Jet fly over at 300 meters (1,000 feet) 100
Gas lawn mower at 1 meter (3 feet) 90
Diesel truck at 15 meters (50 feet), at 80 kilometers per hour (50 miles per hour)
80 Food blender at 1 meter (3 feet); garbage disposal at 1 meter (3 feet)
Noisy urban area, daytime; gas lawn mower at 30 meters (100 feet)
70 Vacuum cleaner at 3 meters (10 feet)
Commercial area; heavy traffic at 90 meters (300 feet)
60 Normal speech at 1 meter (3 feet)
Quite urban, daytime 50 Large business office; dishwasher next room
Quite urban, nighttime 40 Theater; large conference room (background)
Quite suburban, nighttime 30 Library
Quite rural, nighttime 20 Bedroom at night; concert hall (background)
10 Broadcast/Recording studio
Lowest threshold of human hearing 0 Lowest threshold of human hearing
Source: Caltrans 1998
2.4 Human Response to Changes in Noise Levels
Under controlled conditions in an acoustics laboratory, the trained, healthy human ear is able to
discern changes in sound levels of 1 dBA when exposed to steady, single-frequency signals in the
mid-frequency range. Outside such controlled conditions, the trained ear can detect changes of 2
dBA in normal environmental noise. It is widely accepted that the average healthy ear, however, can
barely perceive noise level changes of 3 dBA. A change of 5 dBA is readily perceptible, and a
change of 10 dBA is perceived as twice or half as loud. A doubling of sound energy results in a 3
Noise and Vibration Technical Report, Bloomington Distribution Project
8674 11 September 2016
dBA increase in sound, which means that a doubling of sound energy (e.g., doubling the volume of
traffic on a road) would result in a barely perceptible change in sound level).
2.5 Noise Descriptors
Additional units of measure have been developed to evaluate the long-term characteristics of
sound. The equivalent sound level (Leq) is also referred to as the time-average sound level. It is
the equivalent steady-state sound level that in a stated period of time would contain the same
acoustical energy as the time-varying sound level during the same time period. The 1-hour A-
weighted equivalent sound level, Leq(h), is the energy average of the A-weighted sound levels
occurring during a 1-hour period, and is the basis for the County of San Bernardino’s noise
ordinance criteria.
People are generally more sensitive and annoyed by noise occurring during the evening and
nighttime hours. Thus, another noise descriptor used in community noise assessments—the
community noise equivalent level (CNEL)—was introduced. The CNEL scale represents a time-
weighted, 24-hour average noise level based on the A-weighted sound level. The CNEL accounts
for the increased noise sensitivity during the evening hours (7 p.m. to 10 p.m.) and nighttime
hours (10 p.m. to 7 a.m.) by adding 5 dBA and 10 dBA, respectively, to the average sound levels
occurring during the evening and nighttime hours.
2.6 Sound Propagation
Sound propagation (i.e., the passage of sound from a noise source to a receiver) is influenced
by geometric spreading, ground absorption, atmospheric effects, and shielding by natural
and/or built features.
Sound levels attenuate (or diminish) at a rate of approximately 6 dBA per doubling of distance
from an outdoor point source due to the geometric spreading of the sound waves. Atmospheric
conditions such as humidity, temperature, and wind gradients can also temporarily either
increase or decrease sound levels. In general, the greater the distance the receiver is from the
source, the greater the potential for variation in sound levels due to atmospheric effects.
Additional sound attenuation can result from built features such as intervening walls and
buildings, and by natural features such as hills and dense woods.
2.7 Groundborne Vibration Fundamentals
Groundborne vibration is a small, rapidly fluctuating motion transmitted through the ground. The
strength of groundborne vibration attenuates fairly rapidly over distance. Some soil types
transmit vibration quite efficiently; other types (primarily sandy soils) do not. Several basic
Noise and Vibration Technical Report, Bloomington Distribution Project
8674 12 September 2016
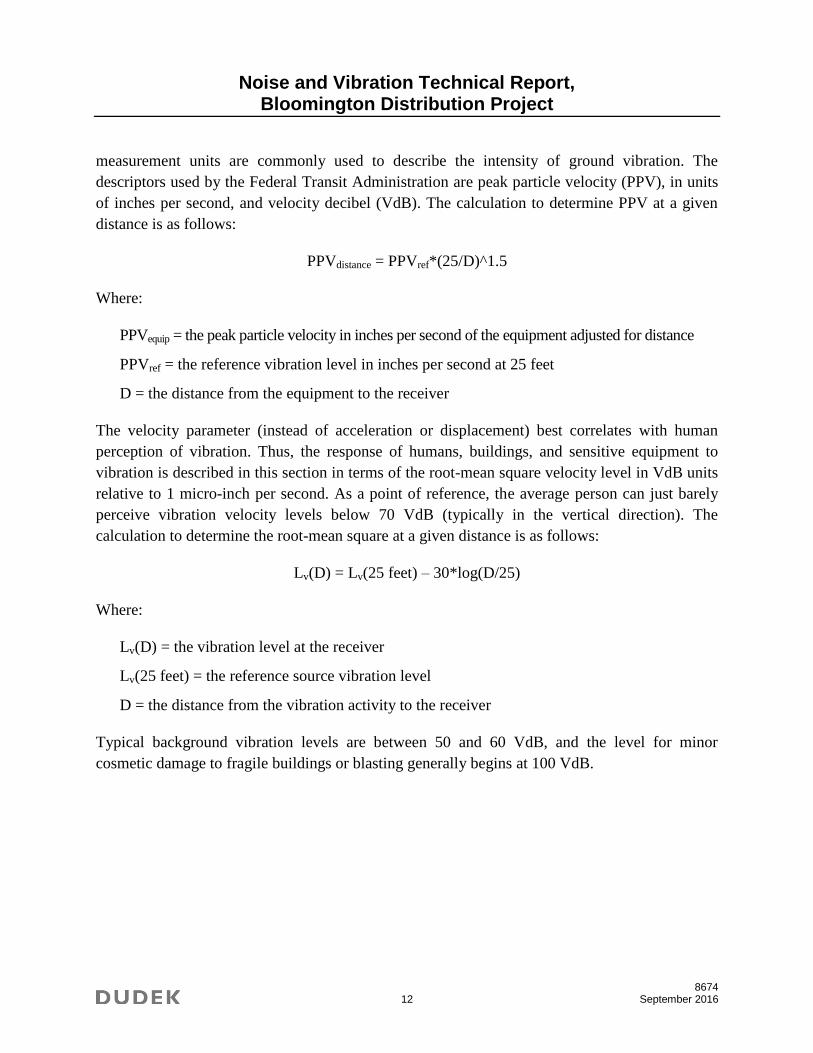
measurement units are commonly used to describe the intensity of ground vibration. The
descriptors used by the Federal Transit Administration are peak particle velocity (PPV), in units
of inches per second, and velocity decibel (VdB). The calculation to determine PPV at a given
distance is as follows:
PPVdistance = PPVref*(25/D)^1.5
Where:
PPVequip = the peak particle velocity in inches per second of the equipment adjusted for distance
PPVref = the reference vibration level in inches per second at 25 feet
D = the distance from the equipment to the receiver
The velocity parameter (instead of acceleration or displacement) best correlates with human
perception of vibration. Thus, the response of humans, buildings, and sensitive equipment to
vibration is described in this section in terms of the root-mean square velocity level in VdB units
relative to 1 micro-inch per second. As a point of reference, the average person can just barely
perceive vibration velocity levels below 70 VdB (typically in the vertical direction). The
calculation to determine the root-mean square at a given distance is as follows:
Lv(D) = Lv(25 feet) – 30*log(D/25)
Where:
Lv(D) = the vibration level at the receiver
Lv(25 feet) = the reference source vibration level
D = the distance from the vibration activity to the receiver
Typical background vibration levels are between 50 and 60 VdB, and the level for minor
cosmetic damage to fragile buildings or blasting generally begins at 100 VdB.
Noise and Vibration Technical Report, Bloomington Distribution Project
8674 13 September 2016
3 REGULATORY SETTING
3.1 Federal
Although no federal regulations are directly applicable to the proposed project, the Federal
Transit Administration provides guidance related to noise levels from construction activities
which is used for this project in the absence of a local agency construction noise standard. The
FTA’s Transit Noise and Vibration Impact Assessment manual (FTA, 2006) Based upon the
information provided in Chapter 12 (Noise and Vibration During Construction) of the FTA
handbook, adverse community reaction would be anticipated if construction noise levels exceed
90 dBA Leq 1-hour during daytime hours or 80 dBA Leq 1-hour during nighttime hours, or 80 dBA Leq
8-hour during daytime hours or 70 dBA Leq 8-hour during nighttime hours.
3.2 State
Government Code Section 65302(g)
California Government Code Section 65302(g) requires the preparation of a Noise Element in a
general plan, which shall identify and appraise the noise problems in the community. The Noise
Element shall recognize the guidelines adopted by the Office of Noise Control in the State
Department of Health Services and shall quantify, to the extent practicable, current and projected
noise levels for the following sources:
1. Highways and freeways
2. Primary arterials and major local streets
3. Passenger and freight on-line railroad operations and ground rapid transit systems
4. Aviation and airport-related operations
5. Local industrial plants
6. Other ground stationary noise sources contributing to the community noise environment.
California Department of Transportation Vibration Standards
The California Department of Transportation (Caltrans) Division of Environmental Analysis
created the Transportation and Construction Vibration Guidance Manual, which provides
guidance to Caltrans engineers, planners, and consultants in assessing vibration from
construction, operation, and maintenance of Caltrans projects. The manual also provides general
information on the potential effects and levels of vibration on people and vibration-sensitive land
uses. For the purposes of providing a recognized threshold for annoyance from vibration, the
Noise and Vibration Technical Report, Bloomington Distribution Project
8674 14 September 2016
vibration impacts analysis for the proposed project references the Caltrans threshold of
approximately 0.10 inches/second peak particle velocity (PPV) as the level at which continuous
vibration begins to cause annoyance (Caltrans 2013).
3.3 Local
3.3.1 County of San Bernardino Municipal Code
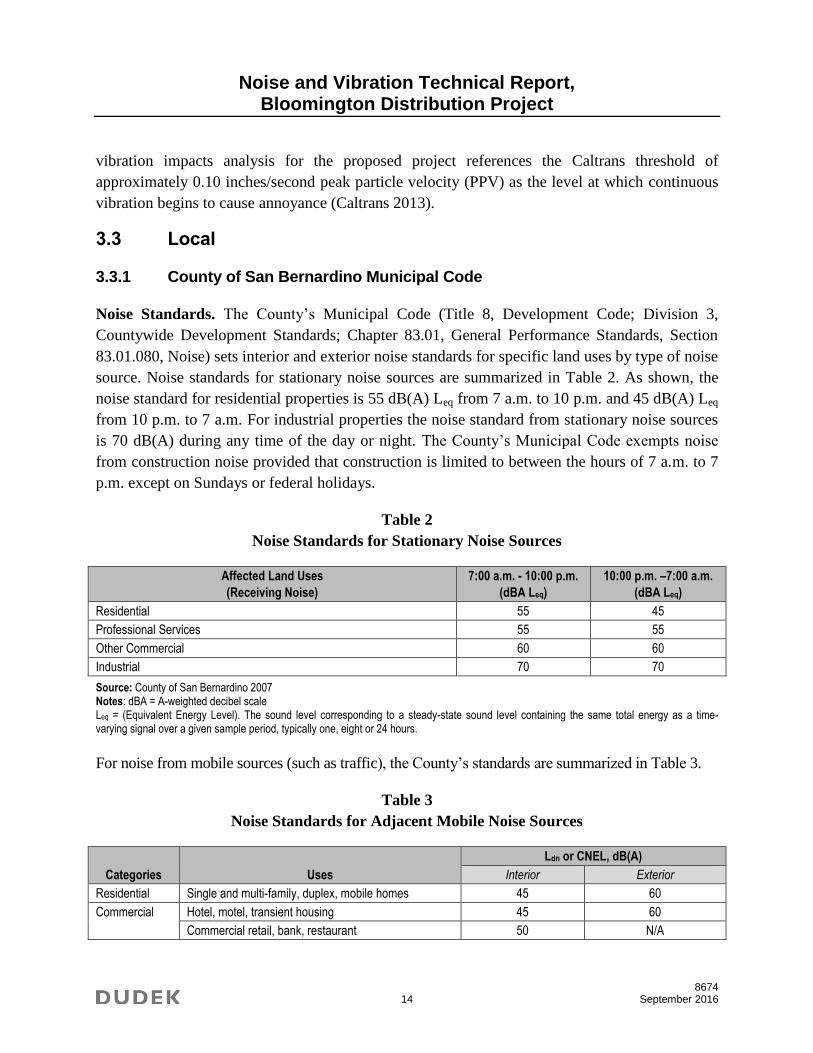
Noise Standards. The County’s Municipal Code (Title 8, Development Code; Division 3,
Countywide Development Standards; Chapter 83.01, General Performance Standards, Section
83.01.080, Noise) sets interior and exterior noise standards for specific land uses by type of noise
source. Noise standards for stationary noise sources are summarized in Table 2. As shown, the
noise standard for residential properties is 55 dB(A) Leq from 7 a.m. to 10 p.m. and 45 dB(A) Leq
from 10 p.m. to 7 a.m. For industrial properties the noise standard from stationary noise sources
is 70 dB(A) during any time of the day or night. The County’s Municipal Code exempts noise
from construction noise provided that construction is limited to between the hours of 7 a.m. to 7
p.m. except on Sundays or federal holidays.
Table 2
Noise Standards for Stationary Noise Sources
Affected Land Uses
(Receiving Noise)
7:00 a.m. - 10:00 p.m.
(dBA Leq)
10:00 p.m. –7:00 a.m.
(dBA Leq)
Residential 55 45
Professional Services 55 55
Other Commercial 60 60
Industrial 70 70
Source: County of San Bernardino 2007 Notes: dBA = A-weighted decibel scale Leq = (Equivalent Energy Level). The sound level corresponding to a steady-state sound level containing the same total energy as a time-varying signal over a given sample period, typically one, eight or 24 hours.
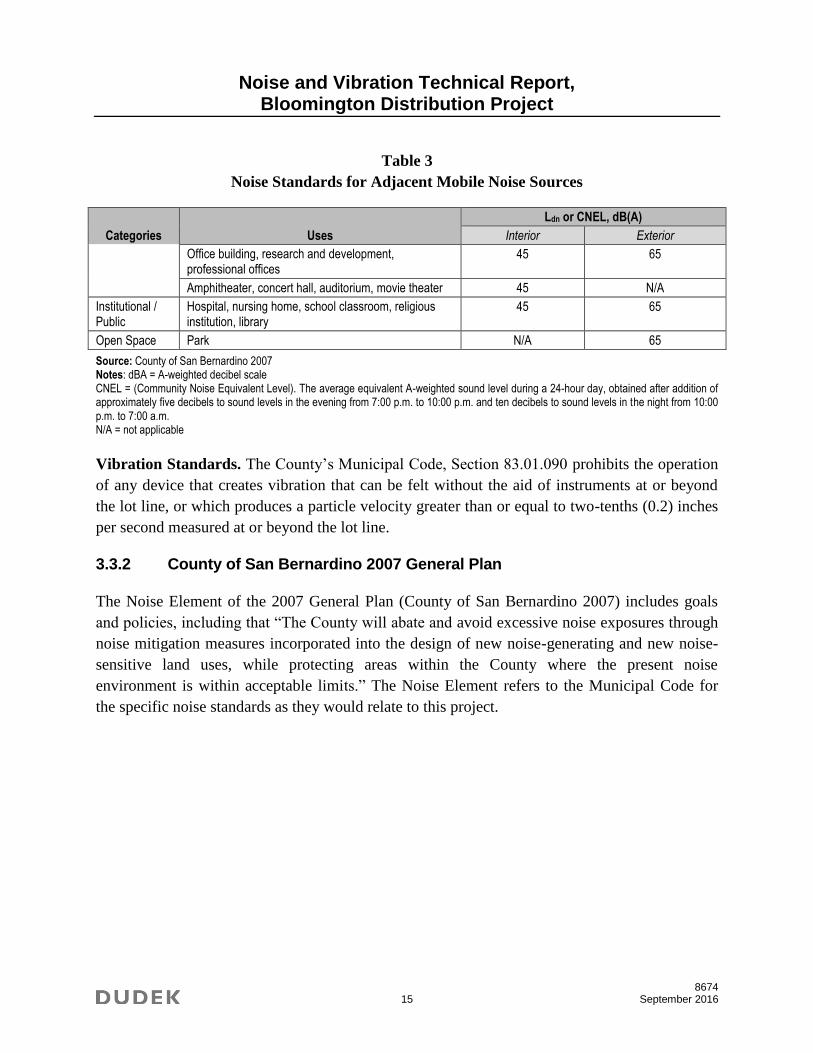
For noise from mobile sources (such as traffic), the County’s standards are summarized in Table 3.
Table 3
Noise Standards for Adjacent Mobile Noise Sources
Categories Uses
Ldn or CNEL, dB(A)
Interior Exterior
Residential Single and multi-family, duplex, mobile homes 45 60
Commercial Hotel, motel, transient housing 45 60
Commercial retail, bank, restaurant 50 N/A
Noise and Vibration Technical Report, Bloomington Distribution Project
8674 15 September 2016
Table 3
Noise Standards for Adjacent Mobile Noise Sources
Categories Uses
Ldn or CNEL, dB(A)
Interior Exterior
Office building, research and development, professional offices
45 65
Amphitheater, concert hall, auditorium, movie theater 45 N/A
Institutional / Public
Hospital, nursing home, school classroom, religious institution, library
45 65
Open Space Park N/A 65
Source: County of San Bernardino 2007 Notes: dBA = A-weighted decibel scale CNEL = (Community Noise Equivalent Level). The average equivalent A-weighted sound level during a 24-hour day, obtained after addition of approximately five decibels to sound levels in the evening from 7:00 p.m. to 10:00 p.m. and ten decibels to sound levels in the night from 10:00 p.m. to 7:00 a.m. N/A = not applicable
Vibration Standards. The County’s Municipal Code, Section 83.01.090 prohibits the operation
of any device that creates vibration that can be felt without the aid of instruments at or beyond
the lot line, or which produces a particle velocity greater than or equal to two-tenths (0.2) inches
per second measured at or beyond the lot line.
3.3.2 County of San Bernardino 2007 General Plan
The Noise Element of the 2007 General Plan (County of San Bernardino 2007) includes goals
and policies, including that “The County will abate and avoid excessive noise exposures through
noise mitigation measures incorporated into the design of new noise-generating and new noise-
sensitive land uses, while protecting areas within the County where the present noise
environment is within acceptable limits.” The Noise Element refers to the Municipal Code for
the specific noise standards as they would relate to this project.

Noise and Vibration Technical Report, Bloomington Distribution Project
8674 16 September 2016
INTENTIONALLY LEFT BLANK
Noise and Vibration Technical Report, Bloomington Distribution Project
8674 17 September 2016
4 EXISTING CONDITIONS
The project area is subject to typical suburban noises and semi-rural, such as noise generated
by traffic, schoolyard, and day-to-day outdoor activities including occasional noise from
roosters. Noise around the project site is the cumulative effect of noise from transportation
activities and stationary sources. “Transportation noise” typically refers to noise from
automobile use, trucking, airport operations, and rail operations. “Stationary noise” typically
refers to noise from sources such as heating, ventilation, and air conditioning (HVAC)
systems, compressors, landscape maintenance equipment, or machinery associated with local
industrial or commercial activities.
Currently, the project site is disturbed with evidence of recent disking within open areas of the site.
Multiple single-family homes and junk yards are present throughout the northern half of the site and
three single-family homes are located in the southeastern portion of the site. A dirt road that looks to
be an old channel now filled with soil runs north to south through the center of the project site.
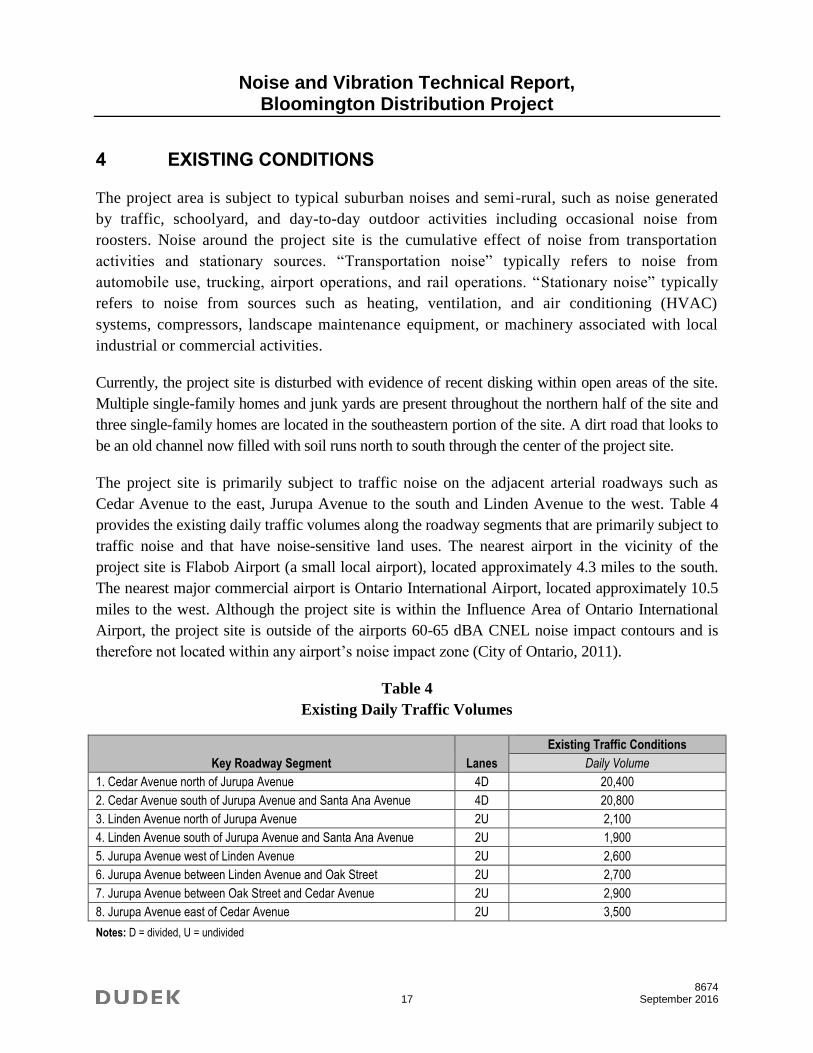
The project site is primarily subject to traffic noise on the adjacent arterial roadways such as
Cedar Avenue to the east, Jurupa Avenue to the south and Linden Avenue to the west. Table 4
provides the existing daily traffic volumes along the roadway segments that are primarily subject to
traffic noise and that have noise-sensitive land uses. The nearest airport in the vicinity of the
project site is Flabob Airport (a small local airport), located approximately 4.3 miles to the south.
The nearest major commercial airport is Ontario International Airport, located approximately 10.5
miles to the west. Although the project site is within the Influence Area of Ontario International
Airport, the project site is outside of the airports 60-65 dBA CNEL noise impact contours and is
therefore not located within any airport’s noise impact zone (City of Ontario, 2011).
Table 4
Existing Daily Traffic Volumes
Key Roadway Segment Lanes
Existing Traffic Conditions
Daily Volume
1. Cedar Avenue north of Jurupa Avenue 4D 20,400
2. Cedar Avenue south of Jurupa Avenue and Santa Ana Avenue 4D 20,800
3. Linden Avenue north of Jurupa Avenue 2U 2,100
4. Linden Avenue south of Jurupa Avenue and Santa Ana Avenue 2U 1,900
5. Jurupa Avenue west of Linden Avenue 2U 2,600
6. Jurupa Avenue between Linden Avenue and Oak Street 2U 2,700
7. Jurupa Avenue between Oak Street and Cedar Avenue 2U 2,900
8. Jurupa Avenue east of Cedar Avenue 2U 3,500
Notes: D = divided, U = undivided
Noise and Vibration Technical Report, Bloomington Distribution Project
8674 18 September 2016
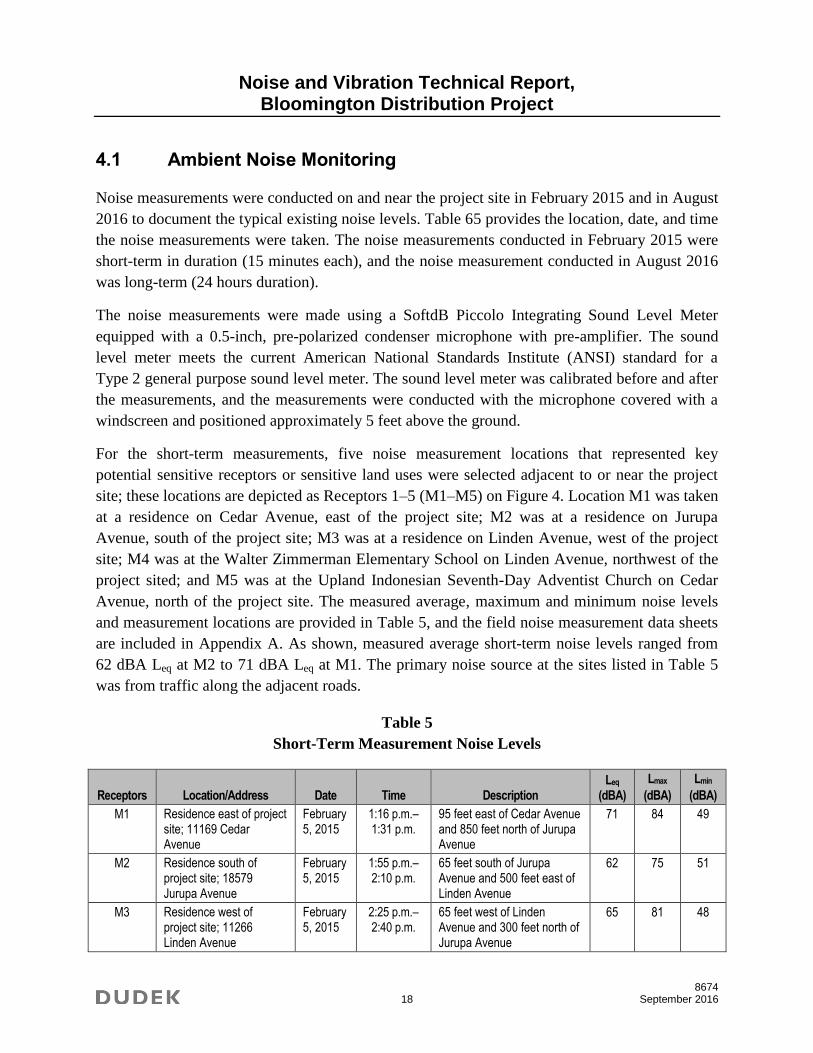
4.1 Ambient Noise Monitoring
Noise measurements were conducted on and near the project site in February 2015 and in August
2016 to document the typical existing noise levels. Table 65 provides the location, date, and time
the noise measurements were taken. The noise measurements conducted in February 2015 were
short-term in duration (15 minutes each), and the noise measurement conducted in August 2016
was long-term (24 hours duration).
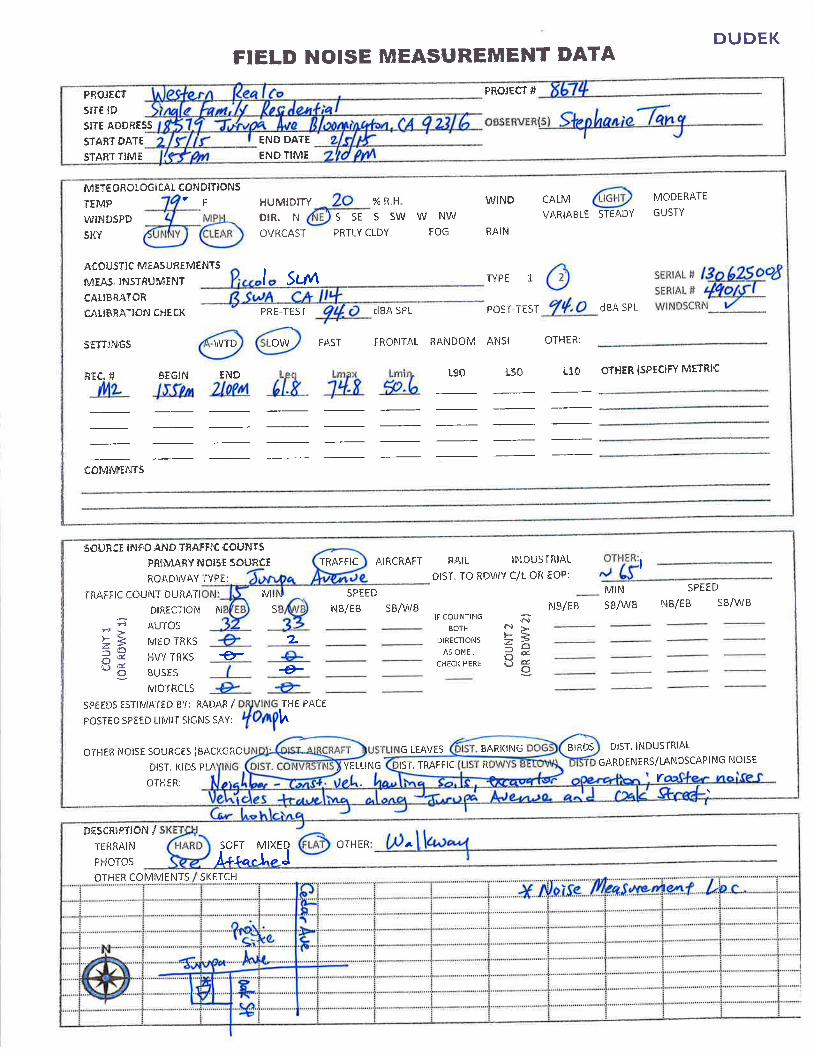
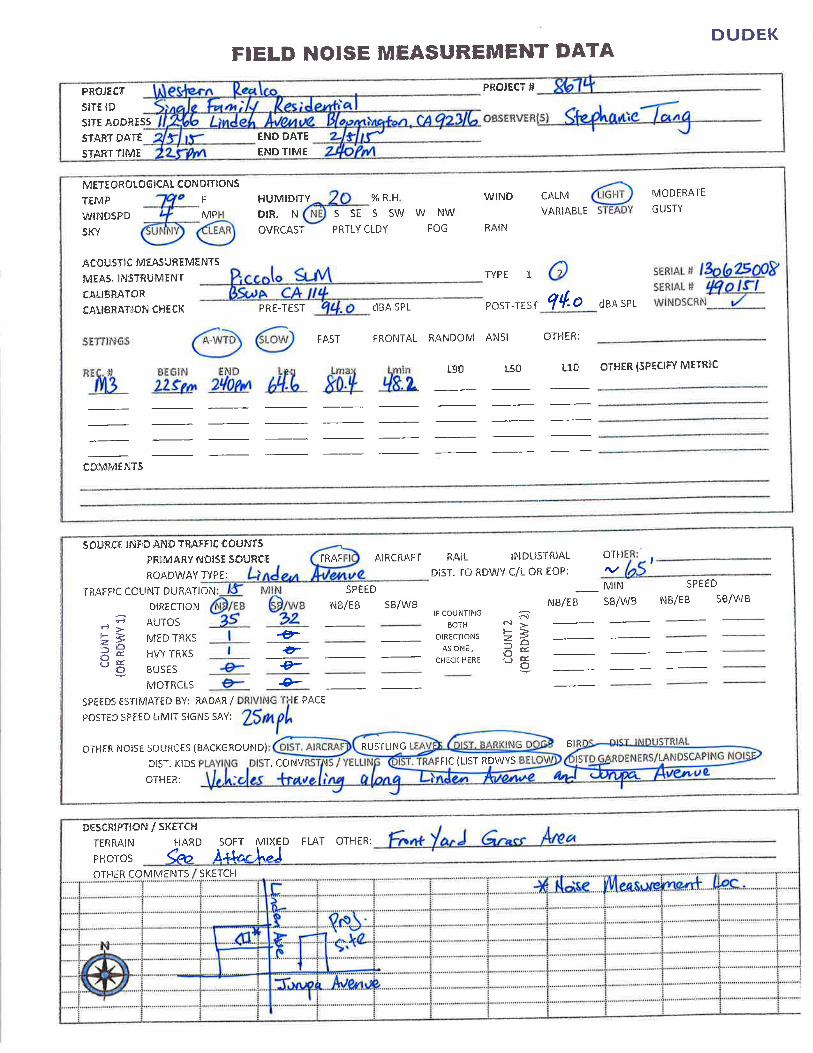
The noise measurements were made using a SoftdB Piccolo Integrating Sound Level Meter
equipped with a 0.5-inch, pre-polarized condenser microphone with pre-amplifier. The sound
level meter meets the current American National Standards Institute (ANSI) standard for a
Type 2 general purpose sound level meter. The sound level meter was calibrated before and after
the measurements, and the measurements were conducted with the microphone covered with a
windscreen and positioned approximately 5 feet above the ground.
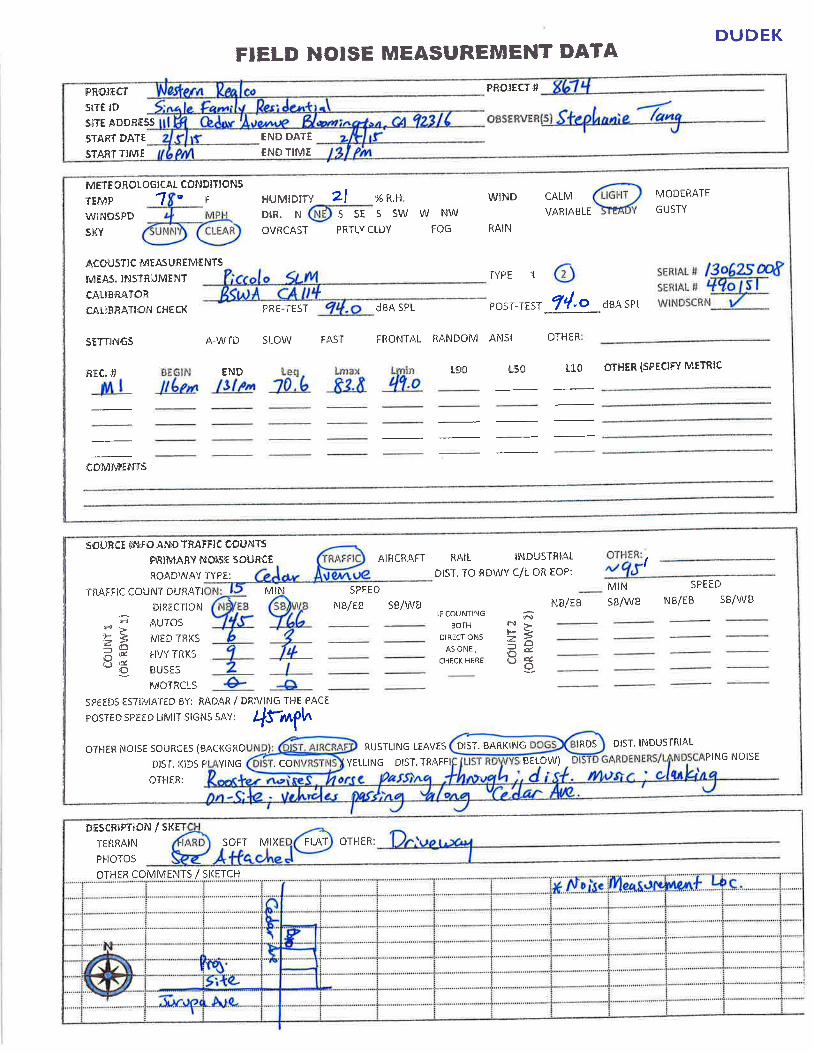
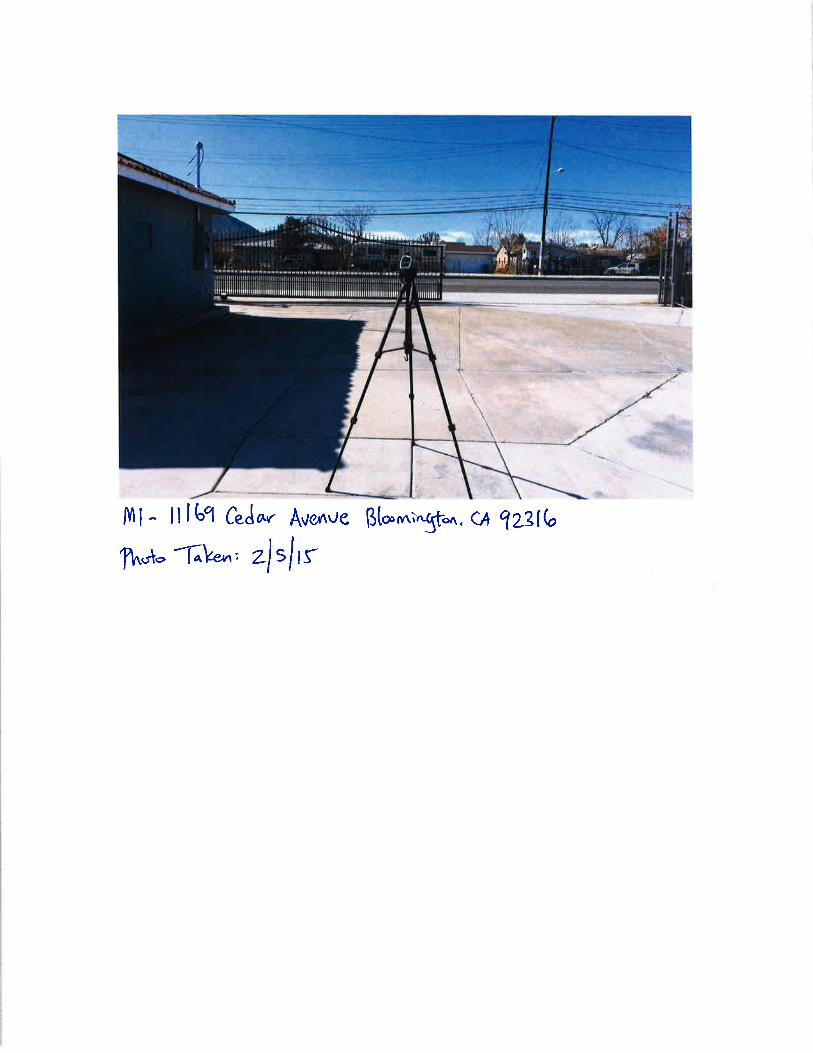
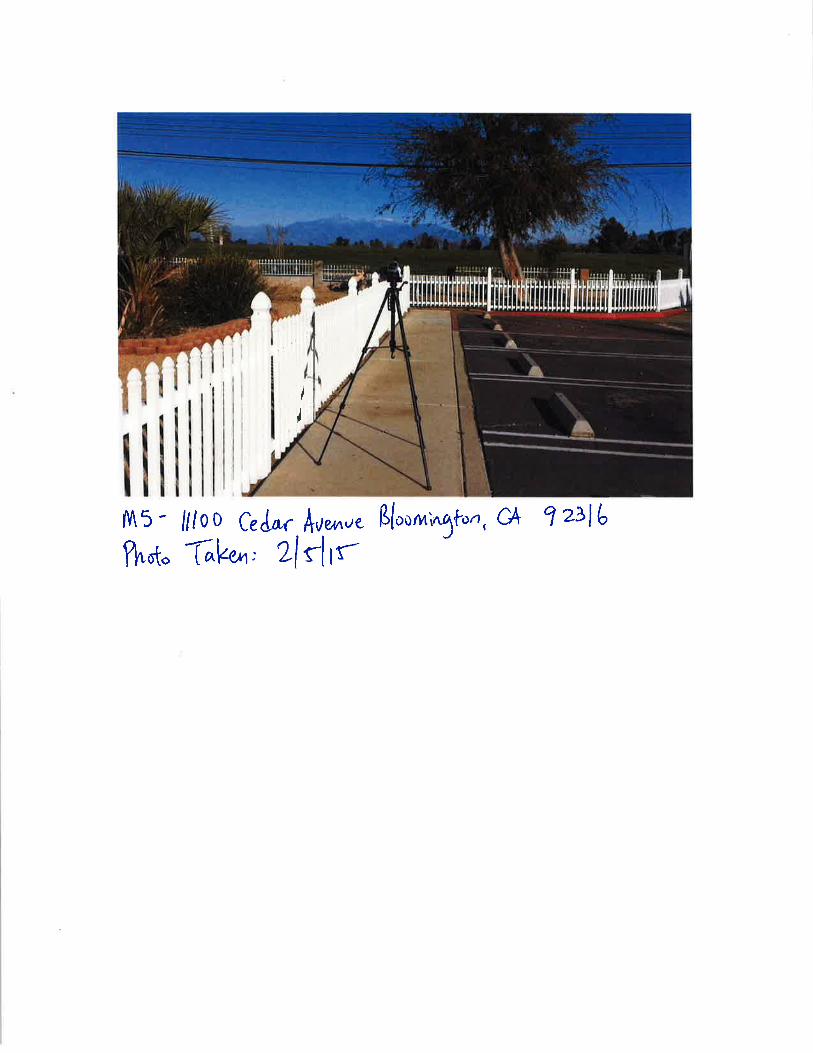
For the short-term measurements, five noise measurement locations that represented key
potential sensitive receptors or sensitive land uses were selected adjacent to or near the project
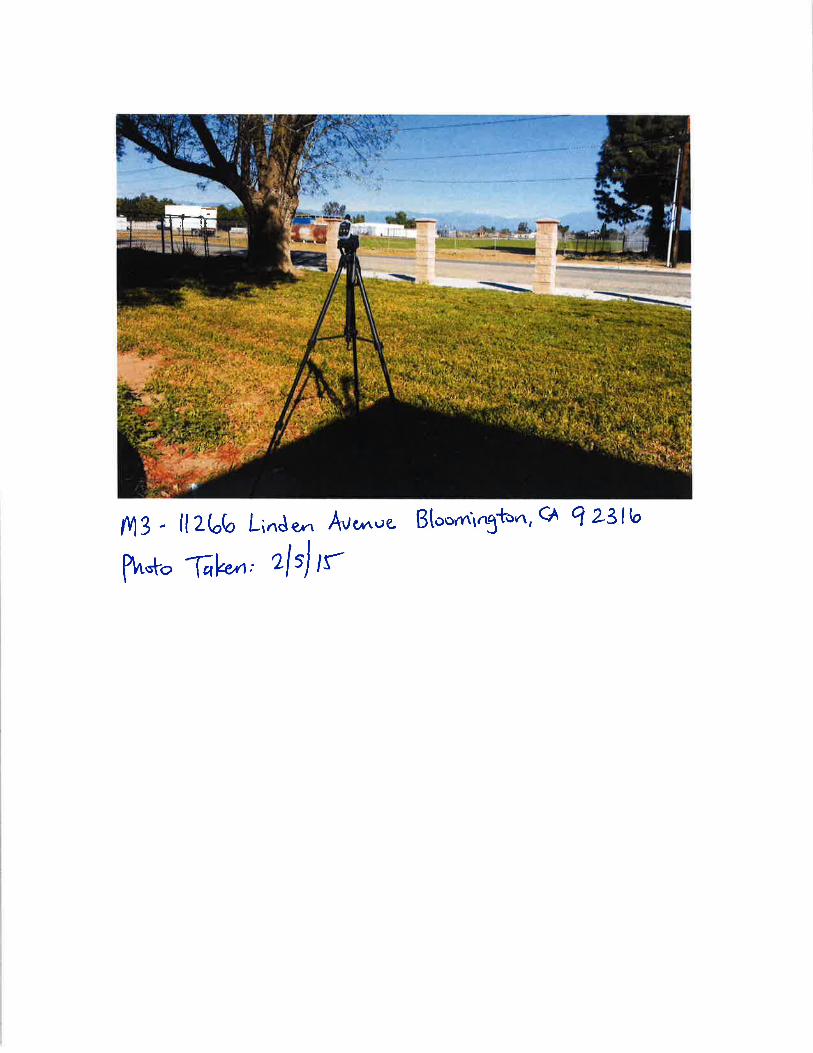
site; these locations are depicted as Receptors 1–5 (M1–M5) on Figure 4. Location M1 was taken
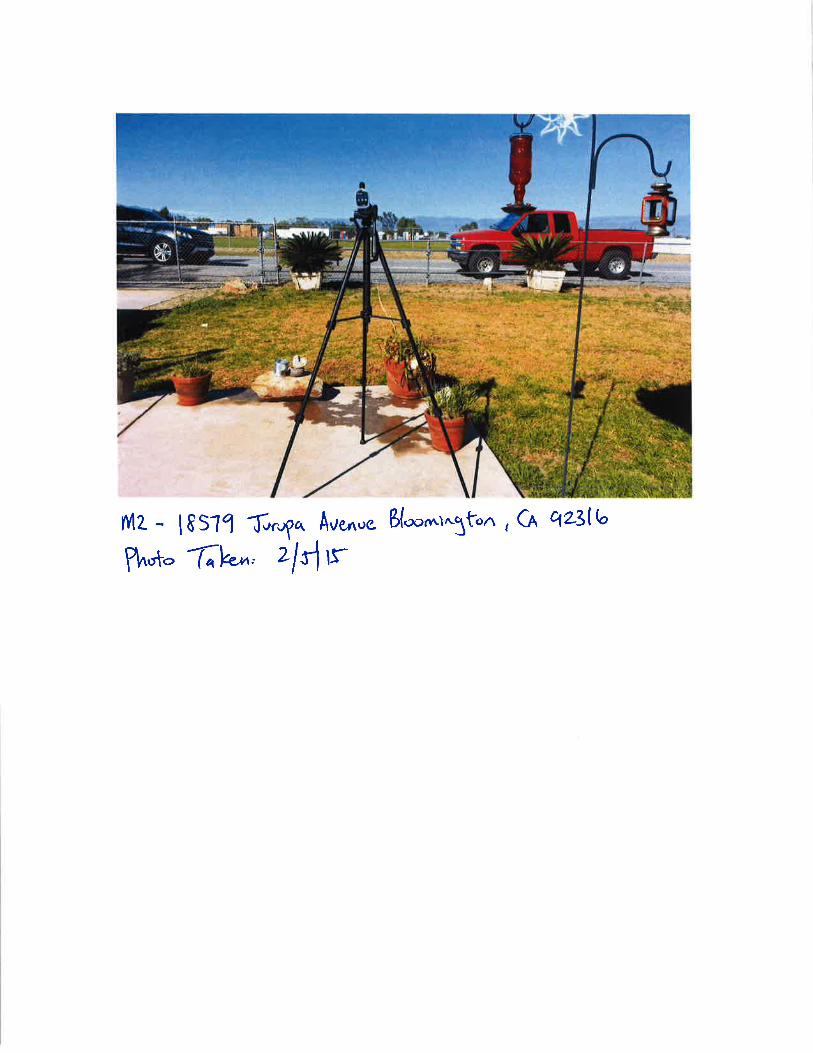
at a residence on Cedar Avenue, east of the project site; M2 was at a residence on Jurupa
Avenue, south of the project site; M3 was at a residence on Linden Avenue, west of the project
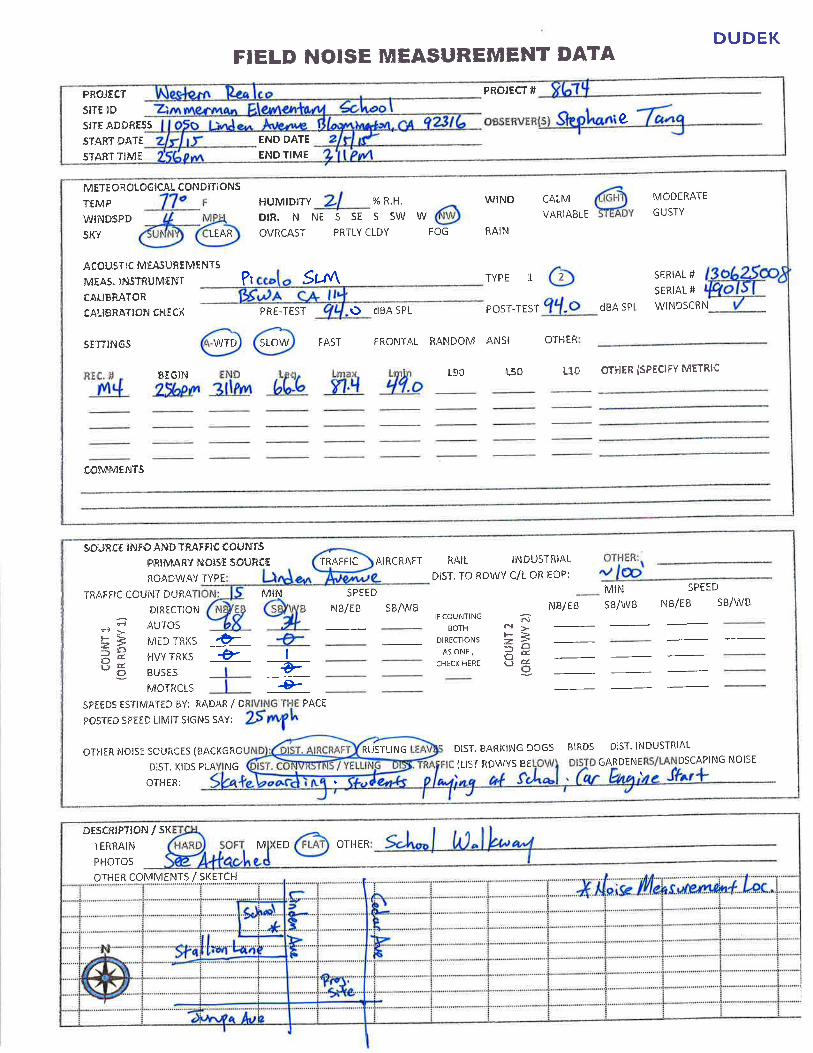
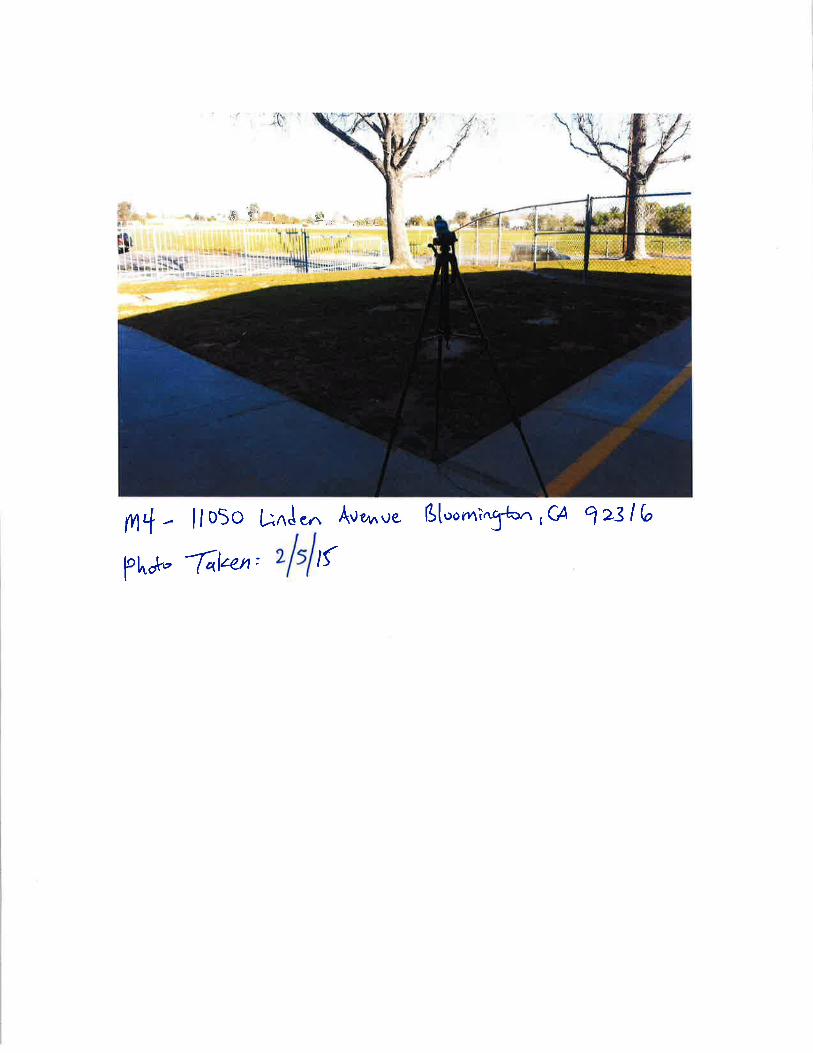
site; M4 was at the Walter Zimmerman Elementary School on Linden Avenue, northwest of the
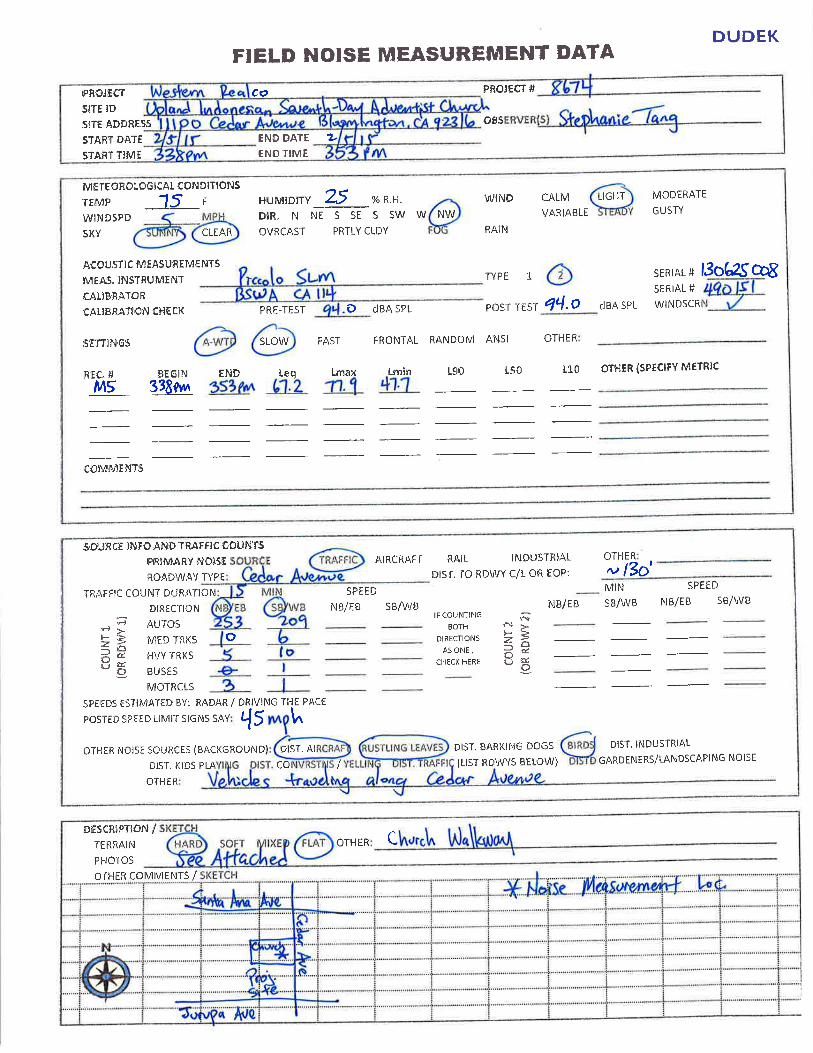
project sited; and M5 was at the Upland Indonesian Seventh-Day Adventist Church on Cedar
Avenue, north of the project site. The measured average, maximum and minimum noise levels
and measurement locations are provided in Table 5, and the field noise measurement data sheets
are included in Appendix A. As shown, measured average short-term noise levels ranged from
62 dBA Leq at M2 to 71 dBA Leq at M1. The primary noise source at the sites listed in Table 5
was from traffic along the adjacent roads.
Table 5
Short-Term Measurement Noise Levels
Receptors Location/Address Date Time Description Leq
(dBA)
Lmax
(dBA)
Lmin
(dBA)
M1 Residence east of project site; 11169 Cedar Avenue
February 5, 2015
1:16 p.m.–1:31 p.m.
95 feet east of Cedar Avenue and 850 feet north of Jurupa Avenue
71 84 49
M2 Residence south of project site; 18579 Jurupa Avenue
February 5, 2015
1:55 p.m.–2:10 p.m.
65 feet south of Jurupa Avenue and 500 feet east of Linden Avenue
62 75 51
M3 Residence west of project site; 11266 Linden Avenue
February 5, 2015
2:25 p.m.–2:40 p.m.
65 feet west of Linden Avenue and 300 feet north of Jurupa Avenue
65 81 48
Noise and Vibration Technical Report, Bloomington Distribution Project
8674 19 September 2016
Table 5
Short-Term Measurement Noise Levels
Receptors Location/Address Date Time Description Leq
(dBA)
Lmax
(dBA)
Lmin
(dBA)
M4 Elementary School northwest of project site; 11050 Linden Avenue
February 5, 2015
2:56 p.m.–3:11 p.m.
100 feet west of Linden Avenue and 1,500 feet north of Jurupa Avenue
67 87 49
M5 Elementary School north of project site; 11100 Linden Avenue
February 5, 2015
3:38 p.m.–3:53 p.m.
130 feet east of Cedar Avenue and 1,400 feet north of Jurupa Avenue
67 78 48
Notes: Leq = equivalent continuous sound level (time-averaged sound level); Lmax = maximum sound level during the measurement interval
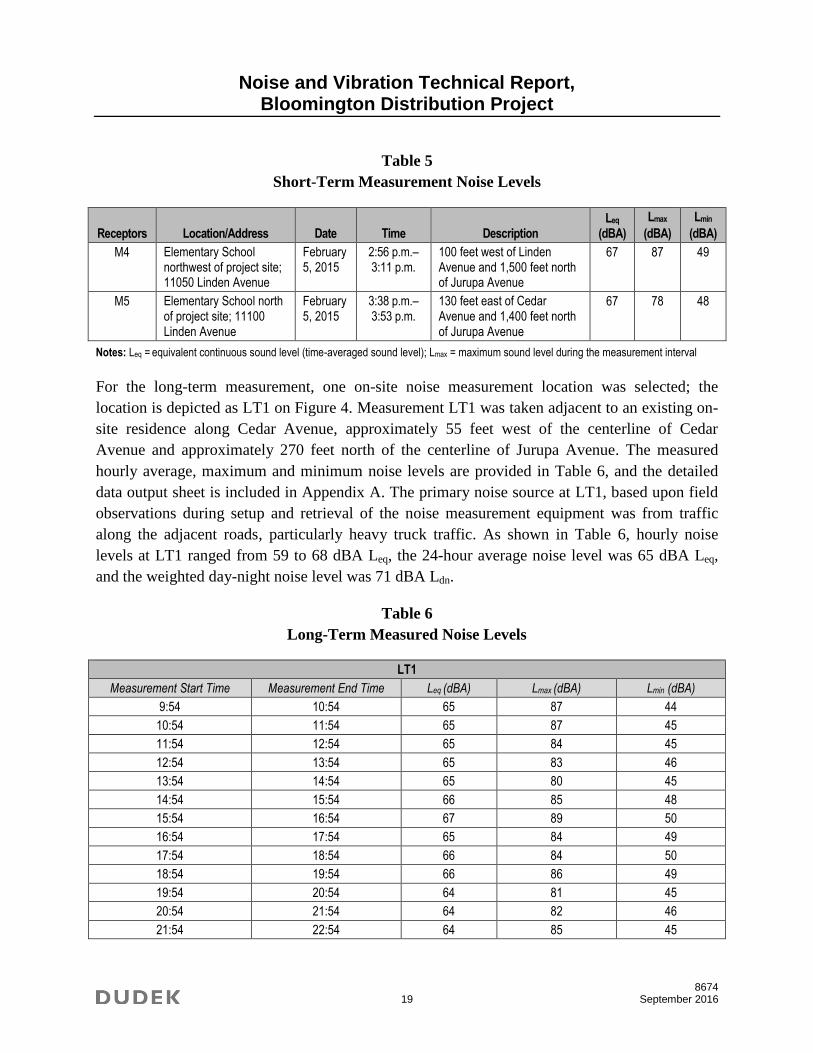
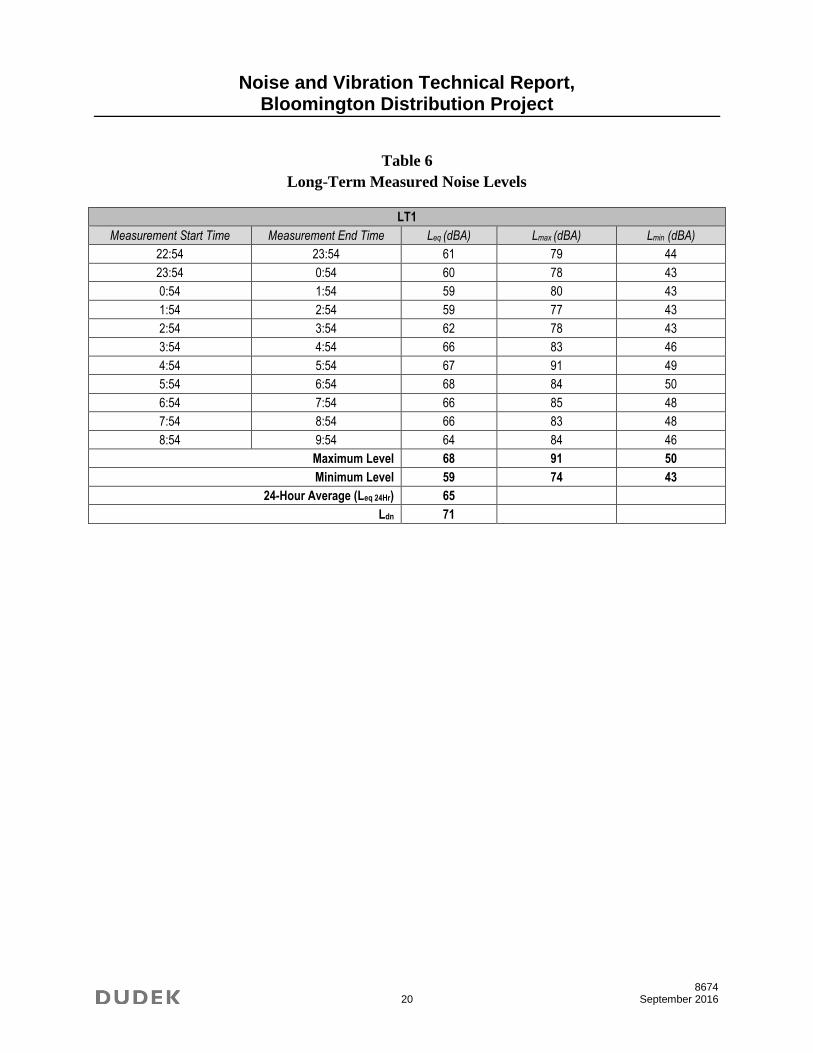
For the long-term measurement, one on-site noise measurement location was selected; the
location is depicted as LT1 on Figure 4. Measurement LT1 was taken adjacent to an existing on-
site residence along Cedar Avenue, approximately 55 feet west of the centerline of Cedar
Avenue and approximately 270 feet north of the centerline of Jurupa Avenue. The measured
hourly average, maximum and minimum noise levels are provided in Table 6, and the detailed
data output sheet is included in Appendix A. The primary noise source at LT1, based upon field
observations during setup and retrieval of the noise measurement equipment was from traffic
along the adjacent roads, particularly heavy truck traffic. As shown in Table 6, hourly noise
levels at LT1 ranged from 59 to 68 dBA Leq, the 24-hour average noise level was 65 dBA Leq,
and the weighted day-night noise level was 71 dBA Ldn.
Table 6
Long-Term Measured Noise Levels
LT1
Measurement Start Time Measurement End Time Leq (dBA) Lmax (dBA) Lmin (dBA)
9:54 10:54 65 87 44
10:54 11:54 65 87 45
11:54 12:54 65 84 45
12:54 13:54 65 83 46
13:54 14:54 65 80 45
14:54 15:54 66 85 48
15:54 16:54 67 89 50
16:54 17:54 65 84 49
17:54 18:54 66 84 50
18:54 19:54 66 86 49
19:54 20:54 64 81 45
20:54 21:54 64 82 46
21:54 22:54 64 85 45
Noise and Vibration Technical Report, Bloomington Distribution Project
8674 20 September 2016
Table 6
Long-Term Measured Noise Levels
LT1
Measurement Start Time Measurement End Time Leq (dBA) Lmax (dBA) Lmin (dBA)
22:54 23:54 61 79 44
23:54 0:54 60 78 43
0:54 1:54 59 80 43
1:54 2:54 59 77 43
2:54 3:54 62 78 43
3:54 4:54 66 83 46
4:54 5:54 67 91 49
5:54 6:54 68 84 50
6:54 7:54 66 85 48
7:54 8:54 66 83 48
8:54 9:54 64 84 46
Maximum Level 68 91 50
Minimum Level 59 74 43
24-Hour Average (Leq 24Hr) 65
Ldn 71
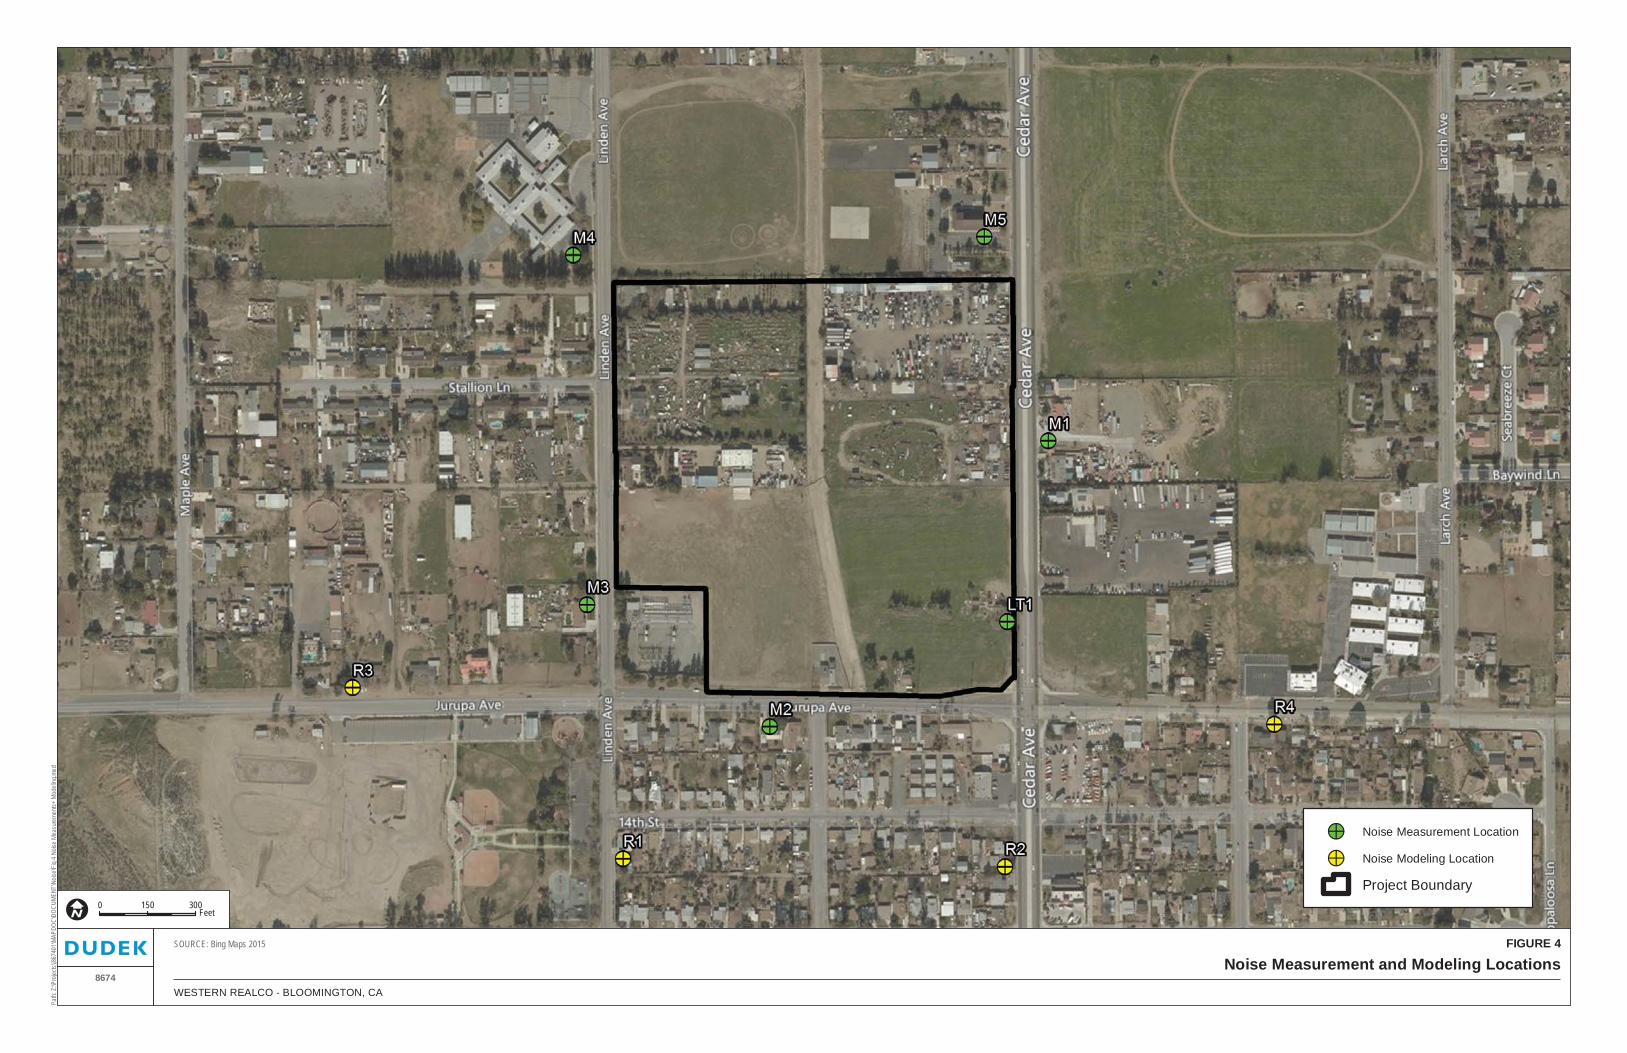
FIGURE 4
Noise Measurement and Modeling LocationsWESTERN REALCO - BLOOMINGTON, CA
SOURCE: Bing Maps 2015
Path
: Z:\P
rojec
ts\j86
7401
\MAP
DOC\
DOCU
MEN
T\No
ise\F
ig 4
Noise
Mea
sure
men
ts+ M
odeli
ng.m
xd
8674
0 300150FeetI
!> Noise Measurement Location
!> Noise Modeling Location
Project Boundary
Noise and Vibration Technical Report, Bloomington Distribution Project
8674 22 September 2016
INTENTIONALLY LEFT BLANK
Noise and Vibration Technical Report, Bloomington Distribution Project
8674 23 September 2016
5 PROJECT IMPACT ANALYSIS
5.1 Methodology
Ambient noise measurements were conducted to quantify the existing daytime noise
environment at five sites representative of nearby noise-sensitive land uses. Estimated noise
levels resulting from the proposed construction activities were obtained from reports prepared
by the Federal Transit Administration (FTA 2006) and field data from files. The noise impact
assessment utilized criteria established in the County of San Bernardino General Plan Noise
Element and Municipal Code Noise Ordinance. The noise levels associated with selected
roadways was determined based the provided traffic impact analysis (Kunzman Associates
2016) and using the Federal Highway Administration’s Traffic Noise Model (TNM), Version
2.5 (FHWA 2004).
5.2 Thresholds of Significance
The significance criteria used to evaluate the project impacts related to noise are based on
Appendix G of the CEQA Guidelines. According to Appendix G, a significant impact related to
noise would occur if the project would:
1. Result in the exposure of persons to or generation of noise levels in excess of
standards established in the local general plan or noise ordinance, or applicable
standards of other agencies.
2. Result in exposure of persons to or generation of excessive groundborne vibration or
groundborne noise levels.
3. Result in a substantial permanent increase in ambient noise levels in the project vicinity
above levels existing without the project.
4. Result in a substantial temporary or periodic increase in ambient noise levels in the
project vicinity above levels existing without the project.
5. Be located within an airport land use plan or, where such a plan has not been adopted,
within two miles of a public airport or public use airport, and if so, the project would
expose people residing or working in the project area to excessive noise levels.
Substantial Changes in Ambient Noise Levels
Some guidance regarding the determination of a substantial permanent increase in ambient noise
levels in the project vicinity above existing levels is provided by the 1992 findings of the Federal
Interagency Committee on Noise (FICON), which assessed the annoyance effects of changes in
Noise and Vibration Technical Report, Bloomington Distribution Project
8674 24 September 2016
ambient noise levels resulting from aircraft operations. The FICON recommendations are based
upon studies that relate aircraft and traffic noise levels to the percentage of persons highly
annoyed by the noise. Annoyance is a qualitative measure of the adverse reaction of people to
noise that generates speech interference, sleep disturbance, or interference with the desire for a
tranquil environment.
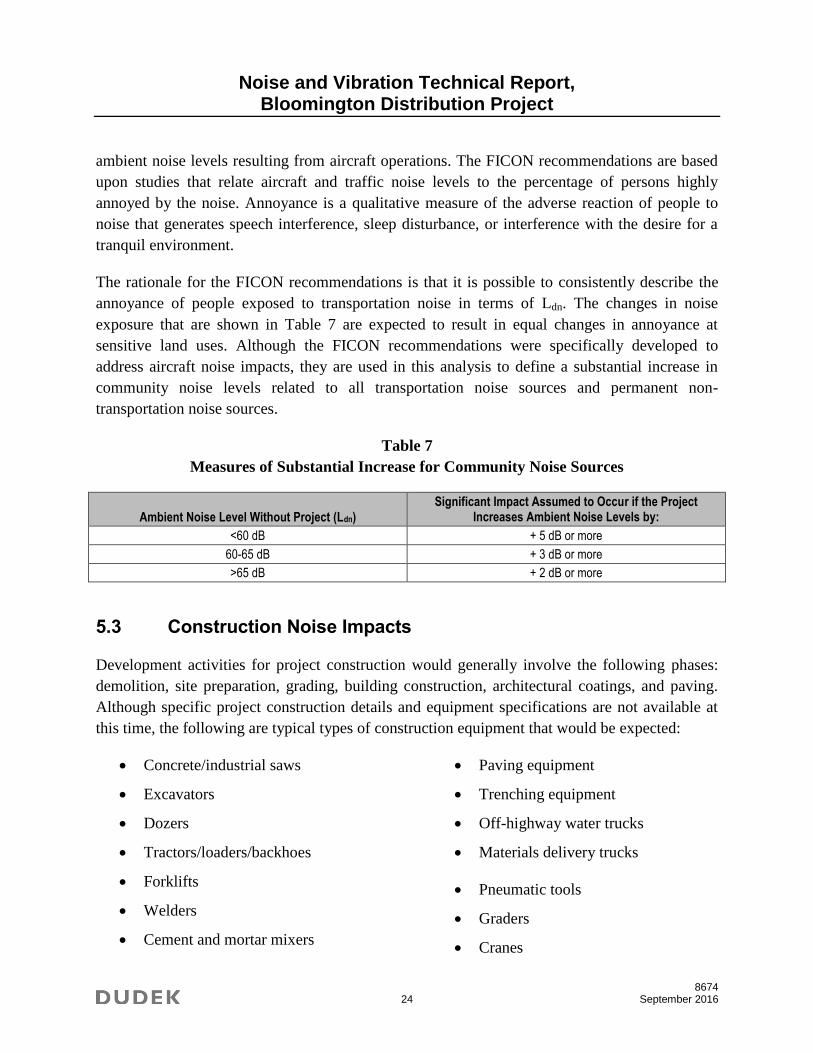
The rationale for the FICON recommendations is that it is possible to consistently describe the
annoyance of people exposed to transportation noise in terms of Ldn. The changes in noise
exposure that are shown in Table 7 are expected to result in equal changes in annoyance at
sensitive land uses. Although the FICON recommendations were specifically developed to
address aircraft noise impacts, they are used in this analysis to define a substantial increase in
community noise levels related to all transportation noise sources and permanent non-
transportation noise sources.
Table 7
Measures of Substantial Increase for Community Noise Sources
Ambient Noise Level Without Project (Ldn) Significant Impact Assumed to Occur if the Project
Increases Ambient Noise Levels by:
<60 dB + 5 dB or more
60-65 dB + 3 dB or more
>65 dB + 2 dB or more
5.3 Construction Noise Impacts
Development activities for project construction would generally involve the following phases:
demolition, site preparation, grading, building construction, architectural coatings, and paving.
Although specific project construction details and equipment specifications are not available at
this time, the following are typical types of construction equipment that would be expected:
Concrete/industrial saws
Excavators
Dozers
Tractors/loaders/backhoes
Forklifts
Welders
Cement and mortar mixers
Paving equipment
Trenching equipment
Off-highway water trucks
Materials delivery trucks
Pneumatic tools
Graders
Cranes
Noise and Vibration Technical Report, Bloomington Distribution Project
8674 25 September 2016
Generator sets
Air compressors
Pavers
Scrapers
Rollers
Concrete trucks
Asphalt trucks.
As demonstrated by this list, construction equipment would include only standard equipment that
would be employed for any routine construction project of this scale; construction equipment
with substantially higher noise-generation characteristics (such as pile drivers, rock drills,
blasting equipment) would not be necessary for development of any phase of the project.
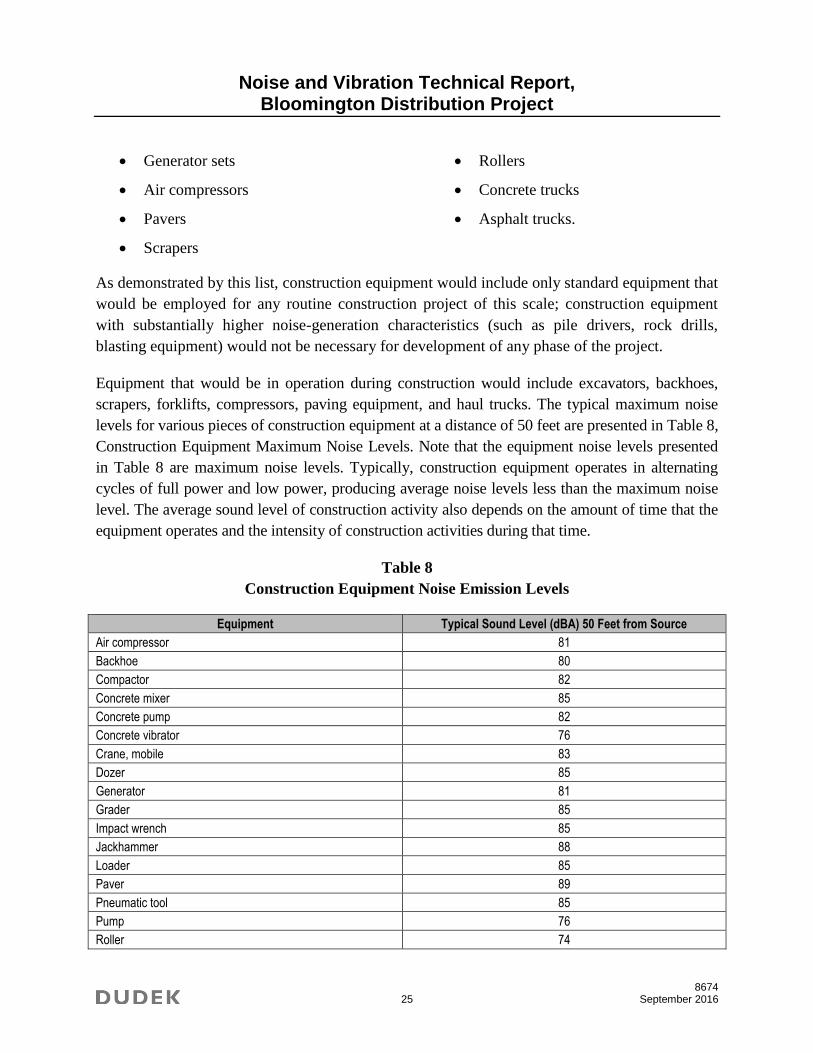
Equipment that would be in operation during construction would include excavators, backhoes,
scrapers, forklifts, compressors, paving equipment, and haul trucks. The typical maximum noise
levels for various pieces of construction equipment at a distance of 50 feet are presented in Table 8,
Construction Equipment Maximum Noise Levels. Note that the equipment noise levels presented
in Table 8 are maximum noise levels. Typically, construction equipment operates in alternating
cycles of full power and low power, producing average noise levels less than the maximum noise
level. The average sound level of construction activity also depends on the amount of time that the
equipment operates and the intensity of construction activities during that time.
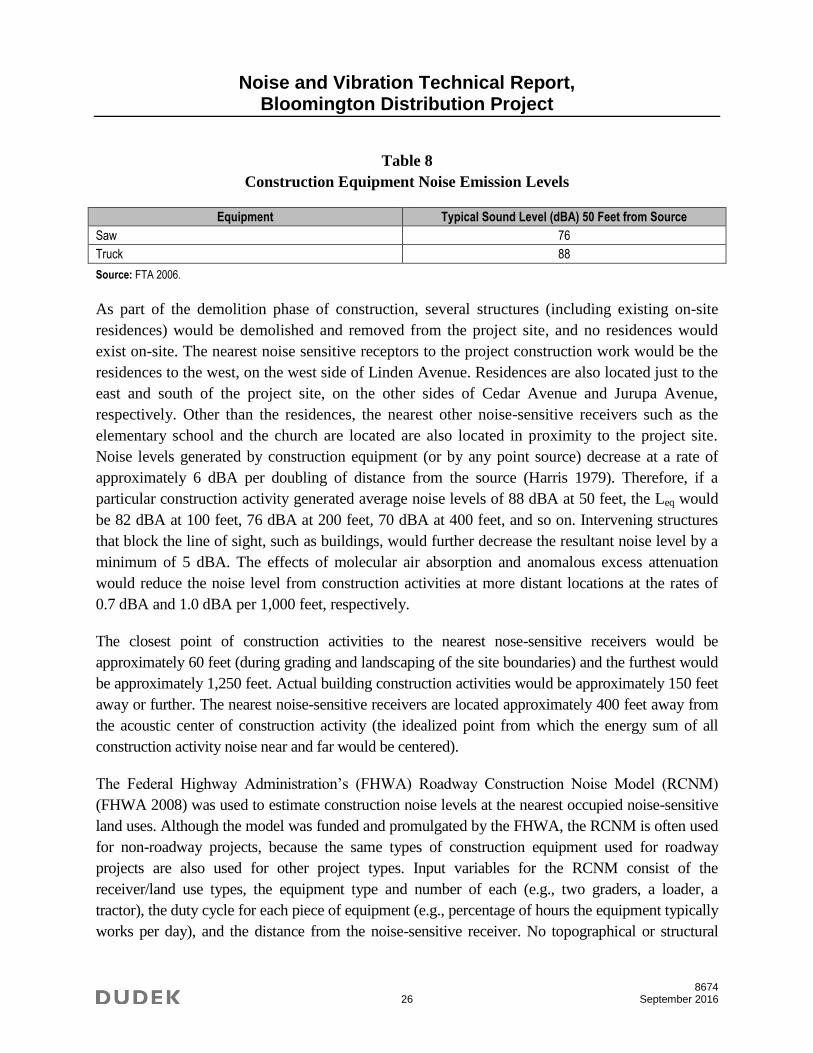
Table 8
Construction Equipment Noise Emission Levels
Equipment Typical Sound Level (dBA) 50 Feet from Source
Air compressor 81
Backhoe 80
Compactor 82
Concrete mixer 85
Concrete pump 82
Concrete vibrator 76
Crane, mobile 83
Dozer 85
Generator 81
Grader 85
Impact wrench 85
Jackhammer 88
Loader 85
Paver 89
Pneumatic tool 85
Pump 76
Roller 74
Noise and Vibration Technical Report, Bloomington Distribution Project
8674 26 September 2016
Table 8
Construction Equipment Noise Emission Levels
Equipment Typical Sound Level (dBA) 50 Feet from Source
Saw 76
Truck 88
Source: FTA 2006.
As part of the demolition phase of construction, several structures (including existing on-site
residences) would be demolished and removed from the project site, and no residences would
exist on-site. The nearest noise sensitive receptors to the project construction work would be the
residences to the west, on the west side of Linden Avenue. Residences are also located just to the
east and south of the project site, on the other sides of Cedar Avenue and Jurupa Avenue,
respectively. Other than the residences, the nearest other noise-sensitive receivers such as the
elementary school and the church are located are also located in proximity to the project site.
Noise levels generated by construction equipment (or by any point source) decrease at a rate of
approximately 6 dBA per doubling of distance from the source (Harris 1979). Therefore, if a
particular construction activity generated average noise levels of 88 dBA at 50 feet, the Leq would
be 82 dBA at 100 feet, 76 dBA at 200 feet, 70 dBA at 400 feet, and so on. Intervening structures
that block the line of sight, such as buildings, would further decrease the resultant noise level by a
minimum of 5 dBA. The effects of molecular air absorption and anomalous excess attenuation
would reduce the noise level from construction activities at more distant locations at the rates of
0.7 dBA and 1.0 dBA per 1,000 feet, respectively.
The closest point of construction activities to the nearest nose-sensitive receivers would be
approximately 60 feet (during grading and landscaping of the site boundaries) and the furthest would
be approximately 1,250 feet. Actual building construction activities would be approximately 150 feet
away or further. The nearest noise-sensitive receivers are located approximately 400 feet away from
the acoustic center of construction activity (the idealized point from which the energy sum of all
construction activity noise near and far would be centered).
The Federal Highway Administration’s (FHWA) Roadway Construction Noise Model (RCNM)
(FHWA 2008) was used to estimate construction noise levels at the nearest occupied noise-sensitive
land uses. Although the model was funded and promulgated by the FHWA, the RCNM is often used
for non-roadway projects, because the same types of construction equipment used for roadway
projects are also used for other project types. Input variables for the RCNM consist of the
receiver/land use types, the equipment type and number of each (e.g., two graders, a loader, a
tractor), the duty cycle for each piece of equipment (e.g., percentage of hours the equipment typically
works per day), and the distance from the noise-sensitive receiver. No topographical or structural
Noise and Vibration Technical Report, Bloomington Distribution Project
8674 27 September 2016
shielding was assumed in the modeling. The RCNM has default duty-cycle values for the various
pieces of equipment, which were derived from an extensive study of typical construction activity
patterns. Those default duty-cycle values were used for this noise analysis.
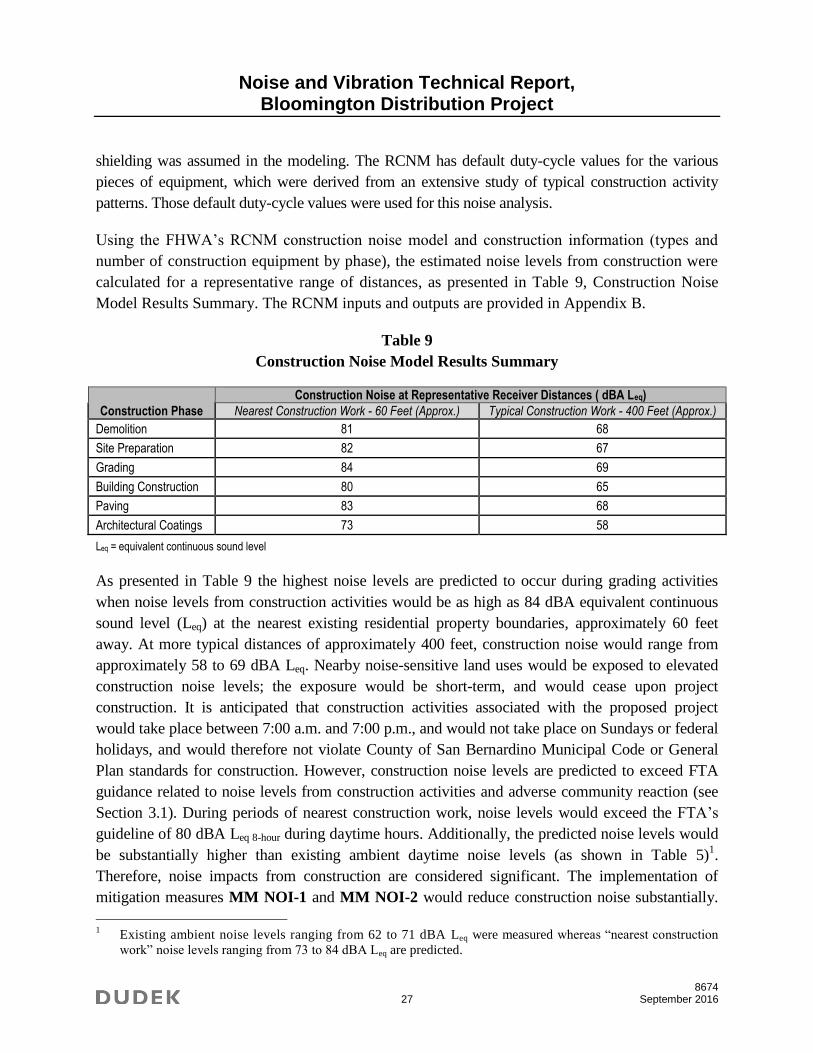
Using the FHWA’s RCNM construction noise model and construction information (types and
number of construction equipment by phase), the estimated noise levels from construction were
calculated for a representative range of distances, as presented in Table 9, Construction Noise
Model Results Summary. The RCNM inputs and outputs are provided in Appendix B.
Table 9
Construction Noise Model Results Summary
Construction Phase
Construction Noise at Representative Receiver Distances ( dBA Leq)
Nearest Construction Work - 60 Feet (Approx.) Typical Construction Work - 400 Feet (Approx.)
Demolition 81 68
Site Preparation 82 67
Grading 84 69
Building Construction 80 65
Paving 83 68
Architectural Coatings 73 58
Leq = equivalent continuous sound level
As presented in Table 9 the highest noise levels are predicted to occur during grading activities
when noise levels from construction activities would be as high as 84 dBA equivalent continuous
sound level (Leq) at the nearest existing residential property boundaries, approximately 60 feet
away. At more typical distances of approximately 400 feet, construction noise would range from
approximately 58 to 69 dBA Leq. Nearby noise-sensitive land uses would be exposed to elevated
construction noise levels; the exposure would be short-term, and would cease upon project
construction. It is anticipated that construction activities associated with the proposed project
would take place between 7:00 a.m. and 7:00 p.m., and would not take place on Sundays or federal
holidays, and would therefore not violate County of San Bernardino Municipal Code or General
Plan standards for construction. However, construction noise levels are predicted to exceed FTA
guidance related to noise levels from construction activities and adverse community reaction (see
Section 3.1). During periods of nearest construction work, noise levels would exceed the FTA’s
guideline of 80 dBA Leq 8-hour during daytime hours. Additionally, the predicted noise levels would
be substantially higher than existing ambient daytime noise levels (as shown in Table 5)1.
Therefore, noise impacts from construction are considered significant. The implementation of
mitigation measures MM NOI-1 and MM NOI-2 would reduce construction noise substantially.
1 Existing ambient noise levels ranging from 62 to 71 dBA Leq were measured whereas “nearest construction
work” noise levels ranging from 73 to 84 dBA Leq are predicted.
Noise and Vibration Technical Report, Bloomington Distribution Project
8674 28 September 2016
Therefore, temporary construction-related noise impacts would be less than significant with
mitigation incorporated.
Temporary noise from construction would be readily audible at the nearest sensitive receptors
and at times could represent a substantial temporary increase. Impacts are considered less than
significant with mitigation incorporated (please see Section 4.10.6).
5.4 Operational Noise Impacts
Long-term operational noise from the project would consist of noise associated with typical
office and warehousing activities. Noise would be generated by truck and passenger vehicle trips
to and from the site on adjacent roadways; trucks backing up, starting up, and idling; fork lifts;
and mechanical plant (heating, ventilation, and air conditioning [HVAC]) noise. Predicted noise
levels from each of these noise sources are addressed in the following sections. Long-term
operational noises also include project-generated traffic and overall traffic noise at the site.
5.4.1 Off-Site Traffic Noise
The project would generate traffic along adjacent roads including Cedar Avenue, Jurupa Avenue
and Linden Avenue. Traffic noise modeling was conducted for the proposed project using the traffic
volumes from the project’s traffic impact analysis report and the FHWA’s TNM model. The TNM
noise model accepts as input the number and types of vehicles on the roadway, vehicle speeds, and
receiver locations. The modeled traffic speeds used were the posted speed limits in the project
vicinity; 45 miles per hour (mph) on Cedar Avenue; 40 mph on Jurupa Avenue; and 25 mph on
Linden Avenue. The noise modeling input and output files, and the Non-Passenger Car Equivalent
traffic volumes provided by Kunzman Associates are included in Appendix C.
The information provided from this modeling was compared to the noise impact significance criteria
in the County’s Municipal Code for adjacent mobile noise sources (i.e., a 60 dBA CNEL/Ldn noise
standard for noise-sensitive land uses) and the FICON thresholds for noise increase (i.e., a 5 dBA
increase in an ambient noise environment of less than 60 dBA Ldn, a 3 dBA noise increase in an
ambient noise environment of 60 - 65 dBA Ldn and a 2 dBA increase in an ambient noise
environment of more than 65 dBA Ldn) to assess whether project traffic noise would cause a
significant impact and, if so, where. The results of the traffic noise analysis are shown in Table 10 for
the existing and existing plus project scenarios and in Table 11 for the year 2018 and year 2018 plus
project scenarios.
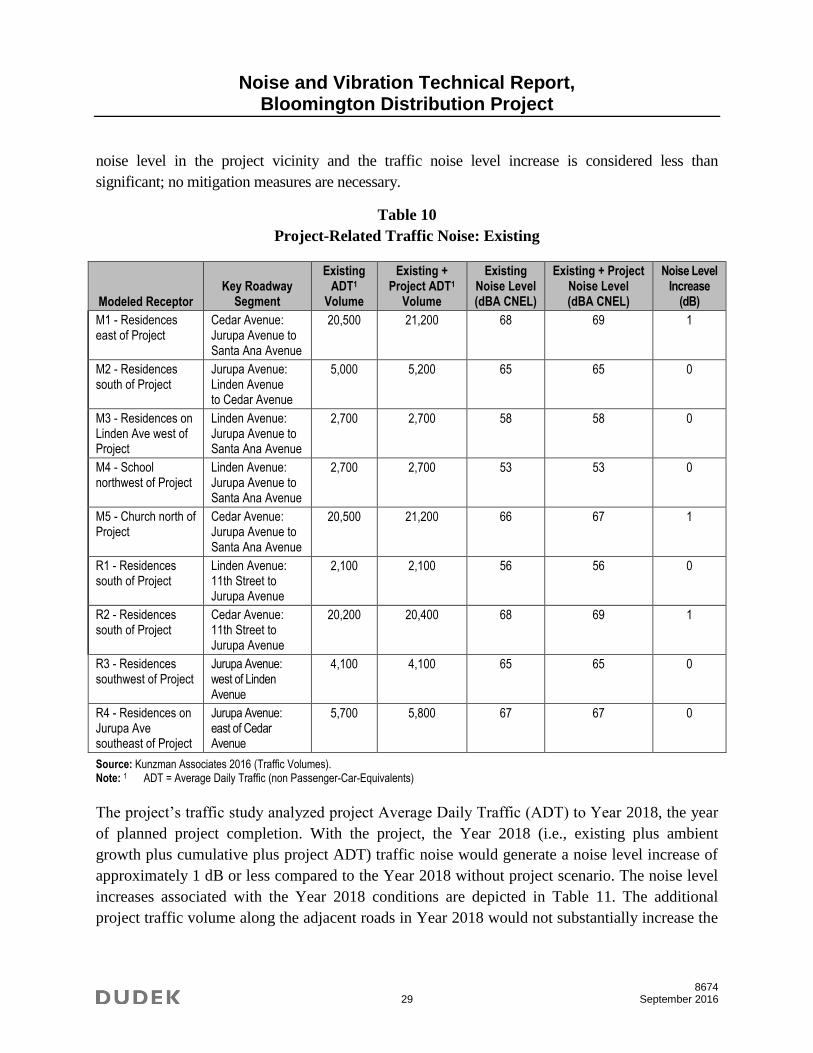
As shown in Table 10, the existing plus project traffic noise would generate a noise level increase of
1 dBA CNEL or less (rounded to whole numbers) along the studied roads in the vicinity of the site.
The additional traffic volume along the adjacent roads would not substantially increase the existing
Noise and Vibration Technical Report, Bloomington Distribution Project
8674 29 September 2016
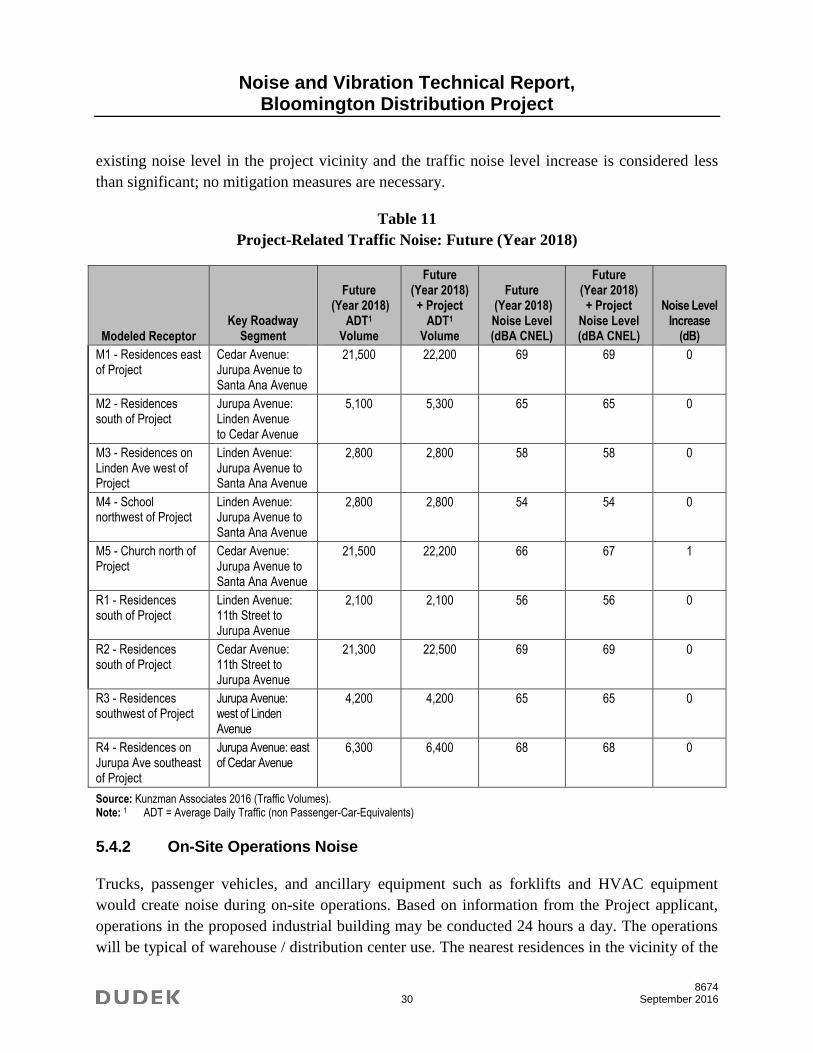
noise level in the project vicinity and the traffic noise level increase is considered less than
significant; no mitigation measures are necessary.
Table 10
Project-Related Traffic Noise: Existing
Modeled Receptor Key Roadway
Segment
Existing ADT1
Volume
Existing + Project ADT1
Volume
Existing Noise Level (dBA CNEL)
Existing + Project Noise Level (dBA CNEL)
Noise Level Increase
(dB)
M1 - Residences east of Project
Cedar Avenue: Jurupa Avenue to Santa Ana Avenue
20,500 21,200 68 69 1
M2 - Residences south of Project
Jurupa Avenue: Linden Avenue to Cedar Avenue
5,000 5,200 65 65 0
M3 - Residences on Linden Ave west of Project
Linden Avenue: Jurupa Avenue to Santa Ana Avenue
2,700 2,700 58 58 0
M4 - School northwest of Project
Linden Avenue: Jurupa Avenue to Santa Ana Avenue
2,700 2,700 53 53 0
M5 - Church north of Project
Cedar Avenue: Jurupa Avenue to Santa Ana Avenue
20,500 21,200 66 67 1
R1 - Residences south of Project
Linden Avenue: 11th Street to Jurupa Avenue
2,100 2,100 56 56 0
R2 - Residences south of Project
Cedar Avenue: 11th Street to Jurupa Avenue
20,200 20,400 68 69 1
R3 - Residences southwest of Project
Jurupa Avenue: west of Linden Avenue
4,100 4,100 65 65 0
R4 - Residences on Jurupa Ave southeast of Project
Jurupa Avenue: east of Cedar Avenue
5,700 5,800 67 67 0
Source: Kunzman Associates 2016 (Traffic Volumes). Note: 1 ADT = Average Daily Traffic (non Passenger-Car-Equivalents)
The project’s traffic study analyzed project Average Daily Traffic (ADT) to Year 2018, the year
of planned project completion. With the project, the Year 2018 (i.e., existing plus ambient
growth plus cumulative plus project ADT) traffic noise would generate a noise level increase of
approximately 1 dB or less compared to the Year 2018 without project scenario. The noise level
increases associated with the Year 2018 conditions are depicted in Table 11. The additional
project traffic volume along the adjacent roads in Year 2018 would not substantially increase the
Noise and Vibration Technical Report, Bloomington Distribution Project
8674 30 September 2016
existing noise level in the project vicinity and the traffic noise level increase is considered less
than significant; no mitigation measures are necessary.
Table 11
Project-Related Traffic Noise: Future (Year 2018)
Modeled Receptor Key Roadway
Segment
Future (Year 2018)
ADT1 Volume
Future (Year 2018) + Project
ADT1
Volume
Future (Year 2018) Noise Level (dBA CNEL)
Future (Year 2018) + Project
Noise Level (dBA CNEL)
Noise Level Increase
(dB)
M1 - Residences east of Project
Cedar Avenue: Jurupa Avenue to Santa Ana Avenue
21,500 22,200 69 69 0
M2 - Residences south of Project
Jurupa Avenue: Linden Avenue to Cedar Avenue
5,100 5,300 65 65 0
M3 - Residences on Linden Ave west of Project
Linden Avenue: Jurupa Avenue to Santa Ana Avenue
2,800 2,800 58 58 0
M4 - School northwest of Project
Linden Avenue: Jurupa Avenue to Santa Ana Avenue
2,800 2,800 54 54 0
M5 - Church north of Project
Cedar Avenue: Jurupa Avenue to Santa Ana Avenue
21,500 22,200 66 67 1
R1 - Residences south of Project
Linden Avenue: 11th Street to Jurupa Avenue
2,100 2,100 56 56 0
R2 - Residences south of Project
Cedar Avenue: 11th Street to Jurupa Avenue
21,300 22,500 69 69 0
R3 - Residences southwest of Project
Jurupa Avenue: west of Linden Avenue
4,200 4,200 65 65 0
R4 - Residences on Jurupa Ave southeast of Project
Jurupa Avenue: east of Cedar Avenue
6,300 6,400 68 68 0
Source: Kunzman Associates 2016 (Traffic Volumes). Note: 1 ADT = Average Daily Traffic (non Passenger-Car-Equivalents)
5.4.2 On-Site Operations Noise
Trucks, passenger vehicles, and ancillary equipment such as forklifts and HVAC equipment
would create noise during on-site operations. Based on information from the Project applicant,
operations in the proposed industrial building may be conducted 24 hours a day. The operations
will be typical of warehouse / distribution center use. The nearest residences in the vicinity of the
Noise and Vibration Technical Report, Bloomington Distribution Project
8674 31 September 2016
proposed Project site are located approximately 700 feet from the center and approximately 150
feet from the nearest side of the proposed industrial building, to the west. Refrigerated trucks
(which have an additional auxiliary cooling system which could result in higher individual truck
noise levels) are not anticipated as part of this project.
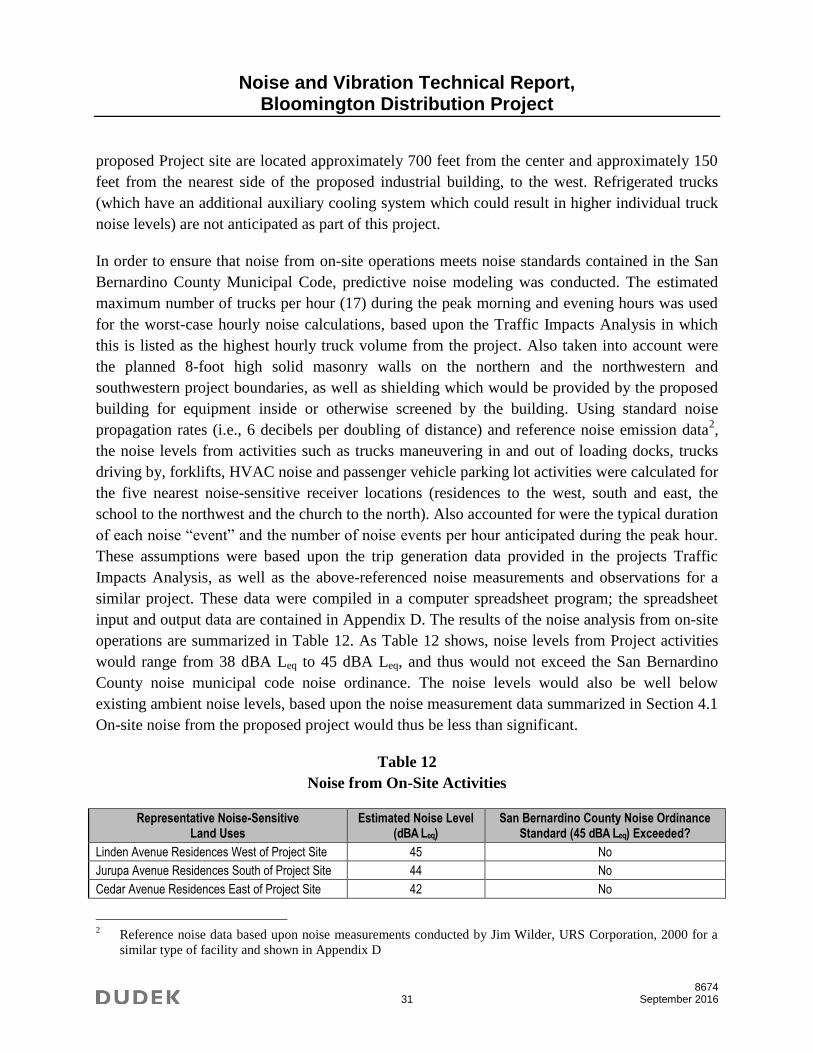
In order to ensure that noise from on-site operations meets noise standards contained in the San
Bernardino County Municipal Code, predictive noise modeling was conducted. The estimated
maximum number of trucks per hour (17) during the peak morning and evening hours was used
for the worst-case hourly noise calculations, based upon the Traffic Impacts Analysis in which
this is listed as the highest hourly truck volume from the project. Also taken into account were
the planned 8-foot high solid masonry walls on the northern and the northwestern and
southwestern project boundaries, as well as shielding which would be provided by the proposed
building for equipment inside or otherwise screened by the building. Using standard noise
propagation rates (i.e., 6 decibels per doubling of distance) and reference noise emission data2,
the noise levels from activities such as trucks maneuvering in and out of loading docks, trucks
driving by, forklifts, HVAC noise and passenger vehicle parking lot activities were calculated for
the five nearest noise-sensitive receiver locations (residences to the west, south and east, the
school to the northwest and the church to the north). Also accounted for were the typical duration
of each noise “event” and the number of noise events per hour anticipated during the peak hour.
These assumptions were based upon the trip generation data provided in the projects Traffic
Impacts Analysis, as well as the above-referenced noise measurements and observations for a
similar project. These data were compiled in a computer spreadsheet program; the spreadsheet
input and output data are contained in Appendix D. The results of the noise analysis from on-site
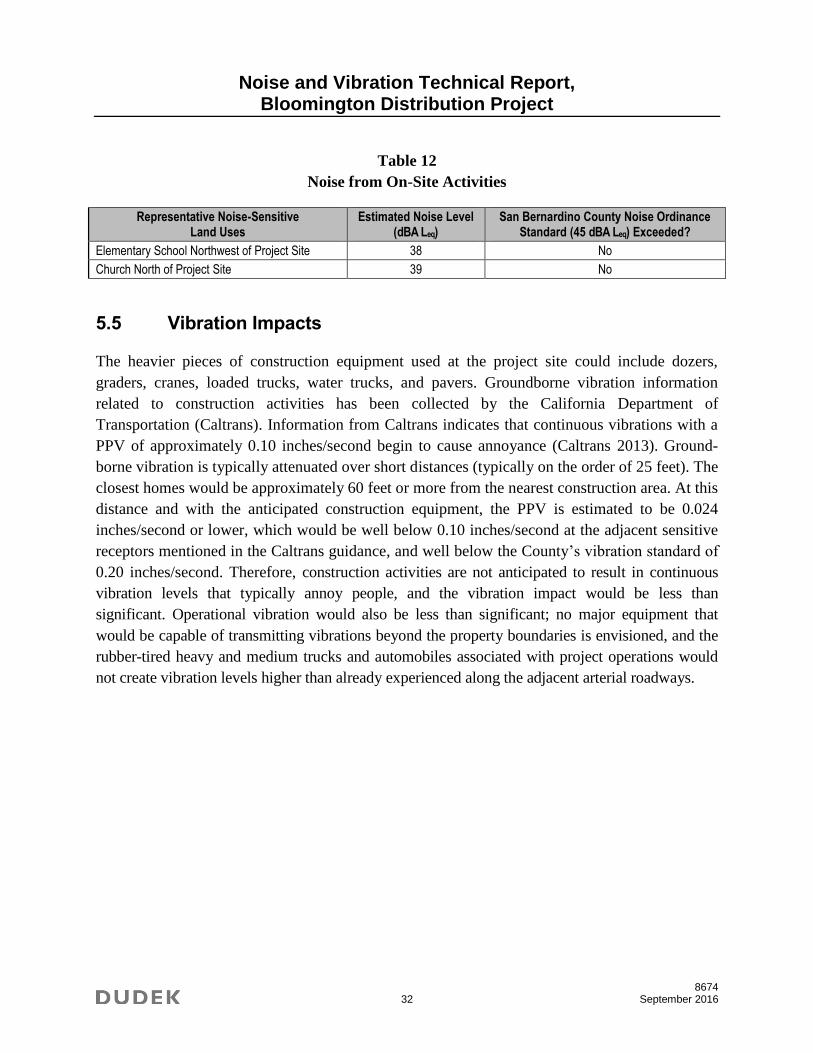
operations are summarized in Table 12. As Table 12 shows, noise levels from Project activities
would range from 38 dBA Leq to 45 dBA Leq, and thus would not exceed the San Bernardino
County noise municipal code noise ordinance. The noise levels would also be well below
existing ambient noise levels, based upon the noise measurement data summarized in Section 4.1
On-site noise from the proposed project would thus be less than significant.
Table 12
Noise from On-Site Activities
Representative Noise-Sensitive Land Uses
Estimated Noise Level (dBA Leq)
San Bernardino County Noise Ordinance Standard (45 dBA Leq) Exceeded?
Linden Avenue Residences West of Project Site 45 No
Jurupa Avenue Residences South of Project Site 44 No
Cedar Avenue Residences East of Project Site 42 No
2 Reference noise data based upon noise measurements conducted by Jim Wilder, URS Corporation, 2000 for a
similar type of facility and shown in Appendix D
Noise and Vibration Technical Report, Bloomington Distribution Project
8674 32 September 2016
Table 12
Noise from On-Site Activities
Representative Noise-Sensitive Land Uses
Estimated Noise Level (dBA Leq)
San Bernardino County Noise Ordinance Standard (45 dBA Leq) Exceeded?
Elementary School Northwest of Project Site 38 No
Church North of Project Site 39 No
5.5 Vibration Impacts
The heavier pieces of construction equipment used at the project site could include dozers,
graders, cranes, loaded trucks, water trucks, and pavers. Groundborne vibration information
related to construction activities has been collected by the California Department of
Transportation (Caltrans). Information from Caltrans indicates that continuous vibrations with a
PPV of approximately 0.10 inches/second begin to cause annoyance (Caltrans 2013). Ground-
borne vibration is typically attenuated over short distances (typically on the order of 25 feet). The
closest homes would be approximately 60 feet or more from the nearest construction area. At this
distance and with the anticipated construction equipment, the PPV is estimated to be 0.024
inches/second or lower, which would be well below 0.10 inches/second at the adjacent sensitive
receptors mentioned in the Caltrans guidance, and well below the County’s vibration standard of
0.20 inches/second. Therefore, construction activities are not anticipated to result in continuous
vibration levels that typically annoy people, and the vibration impact would be less than
significant. Operational vibration would also be less than significant; no major equipment that
would be capable of transmitting vibrations beyond the property boundaries is envisioned, and the
rubber-tired heavy and medium trucks and automobiles associated with project operations would
not create vibration levels higher than already experienced along the adjacent arterial roadways.
Noise and Vibration Technical Report, Bloomington Distribution Project
8674 33 September 2016
6 MITIGATION MEASURES
The following mitigation measures would reduce temporary noise levels from construction activities.
6.1 Construction Noise Mitigation Measures
Construction noise is potentially significant and could adversely affect nearby residents during
construction. However, the noise would be temporary and limited to the duration of the
construction. The following measures should be incorporated into the Project contract
specifications to minimize construction noise impacts:
1. All noise-producing Project equipment and vehicles using internal combustion engines
shall be equipped with mufflers, air-inlet silencers where appropriate, and any other
shrouds, shields, or other noise-reducing features in good operating condition that meet or
exceed original factory specification. Mobile or fixed “package” equipment (e.g., arc-
welders, air compressors) shall be equipped with shrouds and noise control features that
are readily available for that type of equipment.
2. All mobile or fixed noise-producing equipment used on the Project that are regulated for
noise output by a local, state, or federal agency shall comply with such regulation while
in the course of Project activity.
3. Electrically powered equipment shall be used instead of pneumatic or internal
combustion powered equipment, where feasible.
4. Material stockpiles and mobile equipment staging, parking, and maintenance areas shall
be located as far as practicable from noise-sensitive receptors.
5. Construction site and access road speed limits shall be established and enforced during
the construction period.
6. Construction operations shall not occur between 7:00 p.m. and 7:00 a.m. Monday through
Saturday, or at any time on Sunday or on federal holidays. The hours of construction,
including noisy maintenance activities and all spoils and material transport, shall be
restricted to the periods and days permitted by the local noise or other applicable ordinance.
7. The use of noise-producing signals, including horns, whistles, alarms, and bells, shall be
for safety warning purposes only.
8. No Project-related public address or music system shall be audible at any adjacent receptor.
9. The on-site construction supervisor shall have the responsibility and authority to receive
and resolve noise complaints. A clear appeal process to the owner shall be established
Noise and Vibration Technical Report, Bloomington Distribution Project
8674 34 September 2016
prior to construction commencement that will allow for resolution of noise problems that
cannot be immediately solved by the site supervisor.
Effectiveness of these mitigation measures would vary from several decibels (which in general is
a relatively small change) to ten or more decibels (which subjectively would be perceived as a
substantial change), depending upon the specific equipment and the original condition of that
equipment, the specific locations of the noise sources and the receivers, etc. Relocation of
equipment to a more distant location, for example, could range from 1 decibel or less to over 15
decibels, depending upon the location of the equipment before and after relocation. Installation
of more effective silencers could range from several decibels to well over 10 decibels. Reduction
of idling equipment could reduce overall noise levels from barely any reduction to several
decibels. Cumulatively, however, these measures would result in substantial decreases in the
noise from construction. With implementation of these measures, short-term construction
impacts associated with exposure of persons to or generation of noise levels in excess of
established standards would be less than significant.
6.2 Level of Significance After Mitigation
With implementation of the listed mitigation measures, temporary construction noise would be
reduced to a level below significance. Project-related noise impacts would be less than significant.
Noise and Vibration Technical Report, Bloomington Distribution Project
8674 35 September 2016
7 REFERENCES
California Department of Transportation (Caltrans). September, 2013. Transportation and
Construction Vibration Guidance Manual. Division of Environmental Analysis,
Environmental Engineering, Hazardous Waste, Air, Noise, Paleontology Office.
Sacramento, California.
City of Ontario. 2011. LA/Ontario International Airport Land Use Compatibility Plan. Adopted
April 19, 2011.
County of San Bernardino. 2007a. Noise Element. In San Bernardino County 2007 General Plan.
County of San Bernardino. 2007b. Noise Standards. County of San Bernardino Municipal Code
(Title 8, Development Code; Division 3, Countywide Development Standards; Chapter
83.01, General Performance Standards, Section 83.01.080, Noise.
FHWA (Federal Highway Administration). 2004. FHWA Traffic Noise Model, Version 2.5.
Released April 2004.
Federal Highway Administration. December 8, 2008. Roadway Construction Noise Model
(RCNM), Software Version 1.1. U.S. Department of Transportation, Research and
Innovative Technology Administration, John A. Volpe National Transportation Systems
Center, Environmental Measurement and Modeling Division. Washington, D.C.
FTA (Federal Transit Administration). 2006. Transit Noise and Vibration Impact Assessment.
July 1, 2006.
Kunzman Associates, Inc. 2016. Bloomington Option C Traffic Impact Analysis.
Wilder. 2000. Noise survey of commercial loading dock operations.

Noise and Vibration Technical Report, Bloomington Distribution Project
8674 36 September 2016
INTENTIONALLY LEFT BLANK
APPENDIX A
Field Noise Measurement Data Sheets

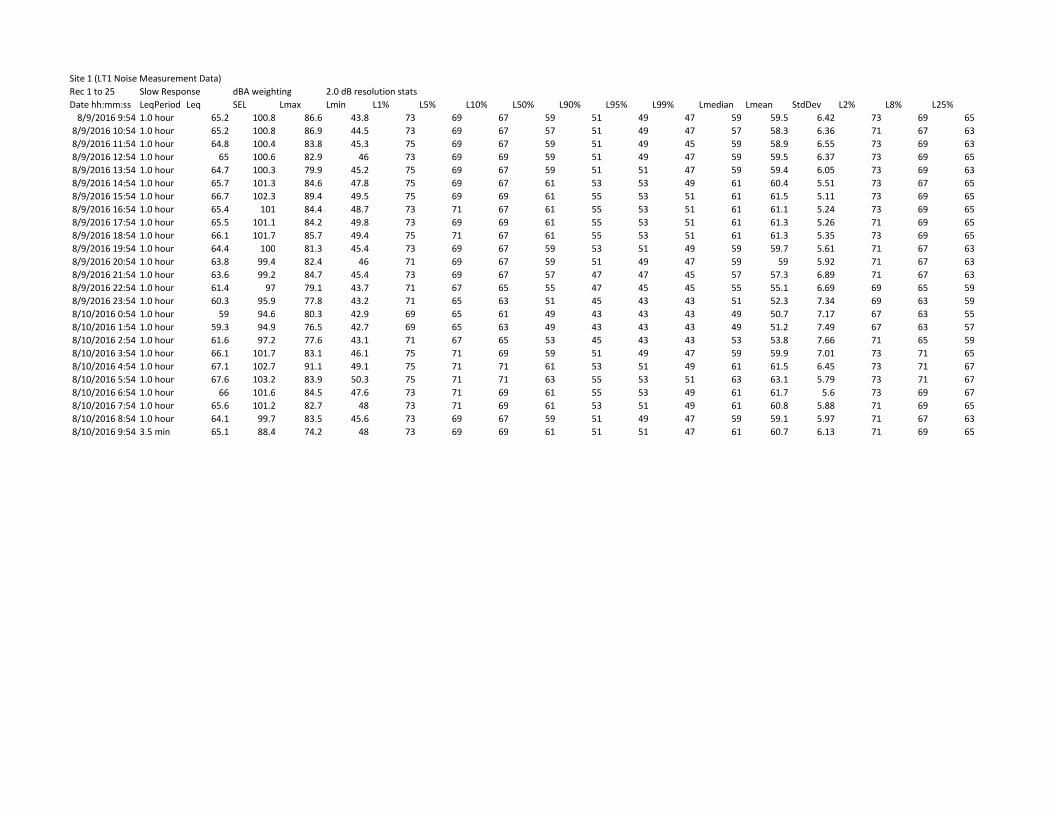
Site 1 (LT1 Noise Measurement Data)Rec 1 to 25 Slow Response dBA weighting 2.0 dB resolution statsDate hh:mm:ss LeqPeriod Leq SEL Lmax Lmin L1% L5% L10% L50% L90% L95% L99% Lmedian Lmean StdDev L2% L8% L25%
8/9/2016 9:54 1.0 hour 65.2 100.8 86.6 43.8 73 69 67 59 51 49 47 59 59.5 6.42 73 69 658/9/2016 10:54 1.0 hour 65.2 100.8 86.9 44.5 73 69 67 57 51 49 47 57 58.3 6.36 71 67 638/9/2016 11:54 1.0 hour 64.8 100.4 83.8 45.3 75 69 67 59 51 49 45 59 58.9 6.55 73 69 638/9/2016 12:54 1.0 hour 65 100.6 82.9 46 73 69 69 59 51 49 47 59 59.5 6.37 73 69 658/9/2016 13:54 1.0 hour 64.7 100.3 79.9 45.2 75 69 67 59 51 51 47 59 59.4 6.05 73 69 638/9/2016 14:54 1.0 hour 65.7 101.3 84.6 47.8 75 69 67 61 53 53 49 61 60.4 5.51 73 67 658/9/2016 15:54 1.0 hour 66.7 102.3 89.4 49.5 75 69 69 61 55 53 51 61 61.5 5.11 73 69 658/9/2016 16:54 1.0 hour 65.4 101 84.4 48.7 73 71 67 61 55 53 51 61 61.1 5.24 73 69 658/9/2016 17:54 1.0 hour 65.5 101.1 84.2 49.8 73 69 69 61 55 53 51 61 61.3 5.26 71 69 658/9/2016 18:54 1.0 hour 66.1 101.7 85.7 49.4 75 71 67 61 55 53 51 61 61.3 5.35 73 69 658/9/2016 19:54 1.0 hour 64.4 100 81.3 45.4 73 69 67 59 53 51 49 59 59.7 5.61 71 67 638/9/2016 20:54 1.0 hour 63.8 99.4 82.4 46 71 69 67 59 51 49 47 59 59 5.92 71 67 638/9/2016 21:54 1.0 hour 63.6 99.2 84.7 45.4 73 69 67 57 47 47 45 57 57.3 6.89 71 67 638/9/2016 22:54 1.0 hour 61.4 97 79.1 43.7 71 67 65 55 47 45 45 55 55.1 6.69 69 65 598/9/2016 23:54 1.0 hour 60.3 95.9 77.8 43.2 71 65 63 51 45 43 43 51 52.3 7.34 69 63 598/10/2016 0:54 1.0 hour 59 94.6 80.3 42.9 69 65 61 49 43 43 43 49 50.7 7.17 67 63 558/10/2016 1:54 1.0 hour 59.3 94.9 76.5 42.7 69 65 63 49 43 43 43 49 51.2 7.49 67 63 578/10/2016 2:54 1.0 hour 61.6 97.2 77.6 43.1 71 67 65 53 45 43 43 53 53.8 7.66 71 65 598/10/2016 3:54 1.0 hour 66.1 101.7 83.1 46.1 75 71 69 59 51 49 47 59 59.9 7.01 73 71 658/10/2016 4:54 1.0 hour 67.1 102.7 91.1 49.1 75 71 71 61 53 51 49 61 61.5 6.45 73 71 678/10/2016 5:54 1.0 hour 67.6 103.2 83.9 50.3 75 71 71 63 55 53 51 63 63.1 5.79 73 71 678/10/2016 6:54 1.0 hour 66 101.6 84.5 47.6 73 71 69 61 55 53 49 61 61.7 5.6 73 69 678/10/2016 7:54 1.0 hour 65.6 101.2 82.7 48 73 71 69 61 53 51 49 61 60.8 5.88 71 69 658/10/2016 8:54 1.0 hour 64.1 99.7 83.5 45.6 73 69 67 59 51 49 47 59 59.1 5.97 71 67 638/10/2016 9:54 3.5 min 65.1 88.4 74.2 48 73 69 69 61 51 51 47 61 60.7 6.13 71 69 65

APPENDIX B
Construction Noise Model Input / Output

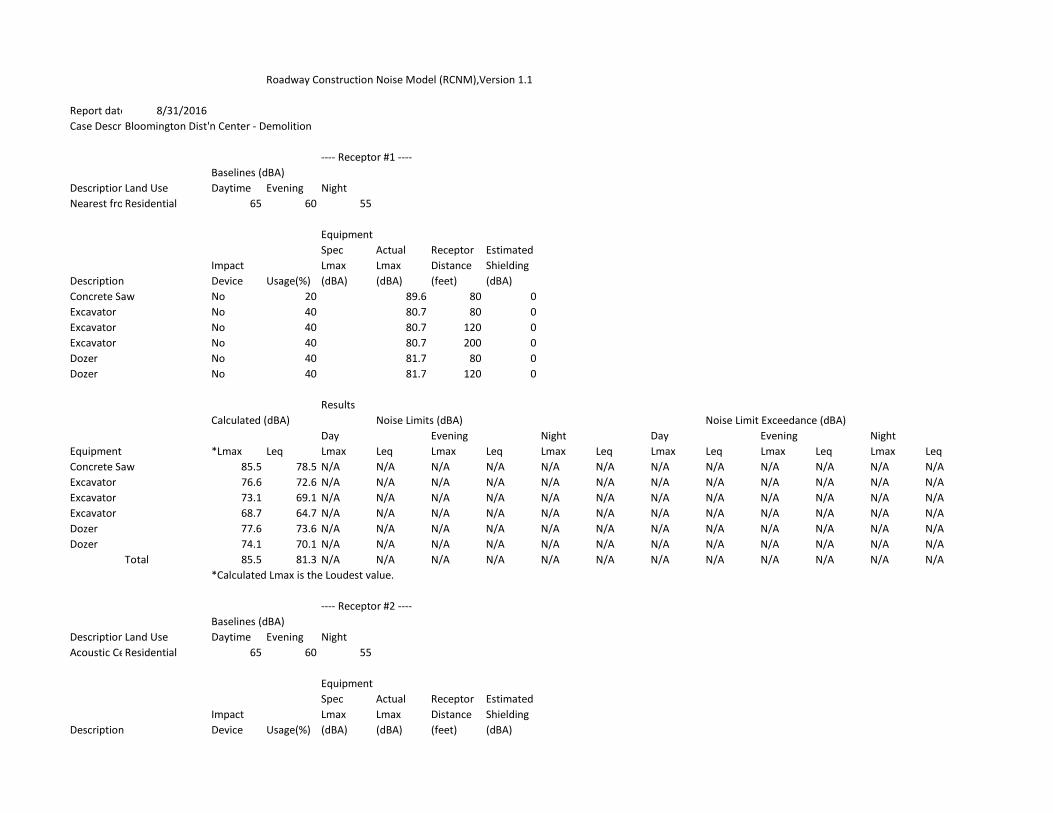
Roadway Construction Noise Model (RCNM),Version 1.1Report date: 8/31/2016Case Description:Bloomington Dist'n Center - Demolition
---- Receptor #1 ----Baselines (dBA)
DescriptionLand Use Daytime Evening NightNearest from Demo 80'Residential 65 60 55
EquipmentSpec Actual Receptor Estimated
Impact Lmax Lmax Distance ShieldingDescription Device Usage(%) (dBA) (dBA) (feet) (dBA)Concrete Saw No 20 89.6 80 0Excavator No 40 80.7 80 0Excavator No 40 80.7 120 0Excavator No 40 80.7 200 0Dozer No 40 81.7 80 0Dozer No 40 81.7 120 0
ResultsCalculated (dBA) Noise Limits (dBA) Noise Limit Exceedance (dBA)
Day Evening Night Day Evening NightEquipment *Lmax Leq Lmax Leq Lmax Leq Lmax Leq Lmax Leq Lmax Leq Lmax LeqConcrete Saw 85.5 78.5 N/A N/A N/A N/A N/A N/A N/A N/A N/A N/A N/A N/AExcavator 76.6 72.6 N/A N/A N/A N/A N/A N/A N/A N/A N/A N/A N/A N/AExcavator 73.1 69.1 N/A N/A N/A N/A N/A N/A N/A N/A N/A N/A N/A N/AExcavator 68.7 64.7 N/A N/A N/A N/A N/A N/A N/A N/A N/A N/A N/A N/ADozer 77.6 73.6 N/A N/A N/A N/A N/A N/A N/A N/A N/A N/A N/A N/ADozer 74.1 70.1 N/A N/A N/A N/A N/A N/A N/A N/A N/A N/A N/A N/A
Total 85.5 81.3 N/A N/A N/A N/A N/A N/A N/A N/A N/A N/A N/A N/A*Calculated Lmax is the Loudest value.
---- Receptor #2 ----Baselines (dBA)
DescriptionLand Use Daytime Evening NightAcoustic Center 400'Residential 65 60 55
EquipmentSpec Actual Receptor Estimated
Impact Lmax Lmax Distance ShieldingDescription Device Usage(%) (dBA) (dBA) (feet) (dBA)
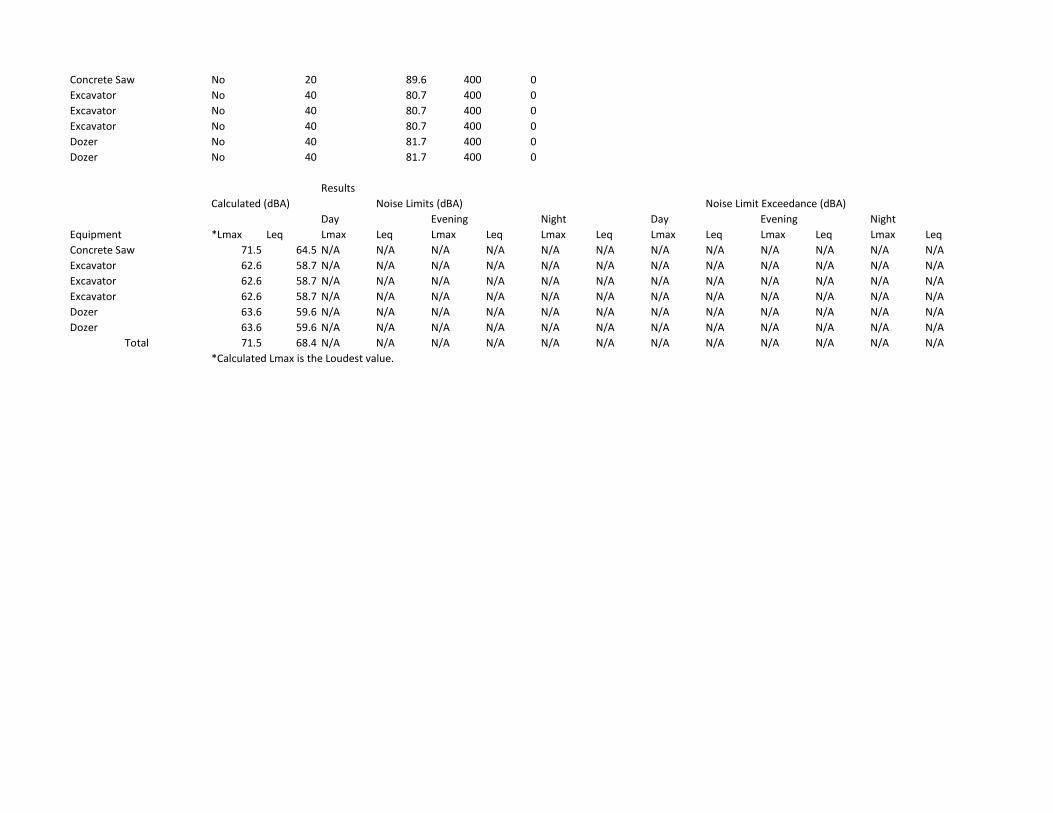
Concrete Saw No 20 89.6 400 0Excavator No 40 80.7 400 0Excavator No 40 80.7 400 0Excavator No 40 80.7 400 0Dozer No 40 81.7 400 0Dozer No 40 81.7 400 0
ResultsCalculated (dBA) Noise Limits (dBA) Noise Limit Exceedance (dBA)
Day Evening Night Day Evening NightEquipment *Lmax Leq Lmax Leq Lmax Leq Lmax Leq Lmax Leq Lmax Leq Lmax LeqConcrete Saw 71.5 64.5 N/A N/A N/A N/A N/A N/A N/A N/A N/A N/A N/A N/AExcavator 62.6 58.7 N/A N/A N/A N/A N/A N/A N/A N/A N/A N/A N/A N/AExcavator 62.6 58.7 N/A N/A N/A N/A N/A N/A N/A N/A N/A N/A N/A N/AExcavator 62.6 58.7 N/A N/A N/A N/A N/A N/A N/A N/A N/A N/A N/A N/ADozer 63.6 59.6 N/A N/A N/A N/A N/A N/A N/A N/A N/A N/A N/A N/ADozer 63.6 59.6 N/A N/A N/A N/A N/A N/A N/A N/A N/A N/A N/A N/A
Total 71.5 68.4 N/A N/A N/A N/A N/A N/A N/A N/A N/A N/A N/A N/A*Calculated Lmax is the Loudest value.
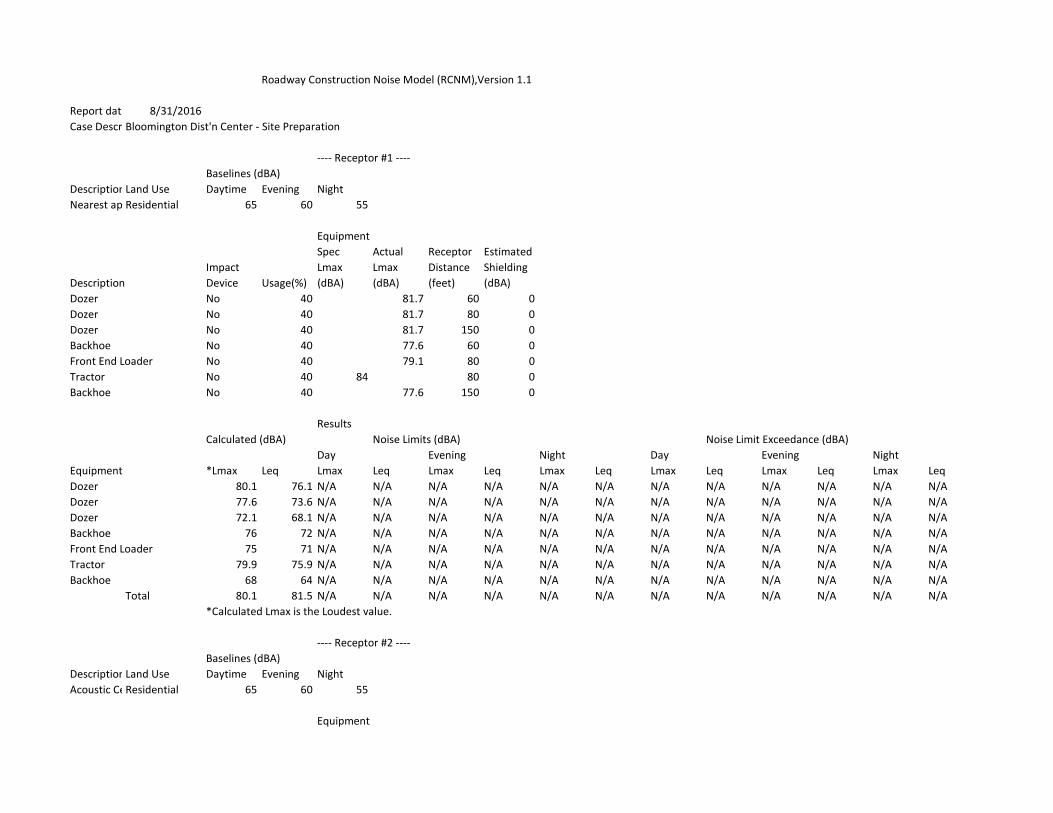
Roadway Construction Noise Model (RCNM),Version 1.1Report date: 8/31/2016Case Description:Bloomington Dist'n Center - Site Preparation
---- Receptor #1 ----Baselines (dBA)
DescriptionLand Use Daytime Evening NightNearest approx 60'Residential 65 60 55
EquipmentSpec Actual Receptor Estimated
Impact Lmax Lmax Distance ShieldingDescription Device Usage(%) (dBA) (dBA) (feet) (dBA)Dozer No 40 81.7 60 0Dozer No 40 81.7 80 0Dozer No 40 81.7 150 0Backhoe No 40 77.6 60 0Front End Loader No 40 79.1 80 0Tractor No 40 84 80 0Backhoe No 40 77.6 150 0
ResultsCalculated (dBA) Noise Limits (dBA) Noise Limit Exceedance (dBA)
Day Evening Night Day Evening NightEquipment *Lmax Leq Lmax Leq Lmax Leq Lmax Leq Lmax Leq Lmax Leq Lmax LeqDozer 80.1 76.1 N/A N/A N/A N/A N/A N/A N/A N/A N/A N/A N/A N/ADozer 77.6 73.6 N/A N/A N/A N/A N/A N/A N/A N/A N/A N/A N/A N/ADozer 72.1 68.1 N/A N/A N/A N/A N/A N/A N/A N/A N/A N/A N/A N/ABackhoe 76 72 N/A N/A N/A N/A N/A N/A N/A N/A N/A N/A N/A N/AFront End Loader 75 71 N/A N/A N/A N/A N/A N/A N/A N/A N/A N/A N/A N/ATractor 79.9 75.9 N/A N/A N/A N/A N/A N/A N/A N/A N/A N/A N/A N/ABackhoe 68 64 N/A N/A N/A N/A N/A N/A N/A N/A N/A N/A N/A N/A
Total 80.1 81.5 N/A N/A N/A N/A N/A N/A N/A N/A N/A N/A N/A N/A*Calculated Lmax is the Loudest value.
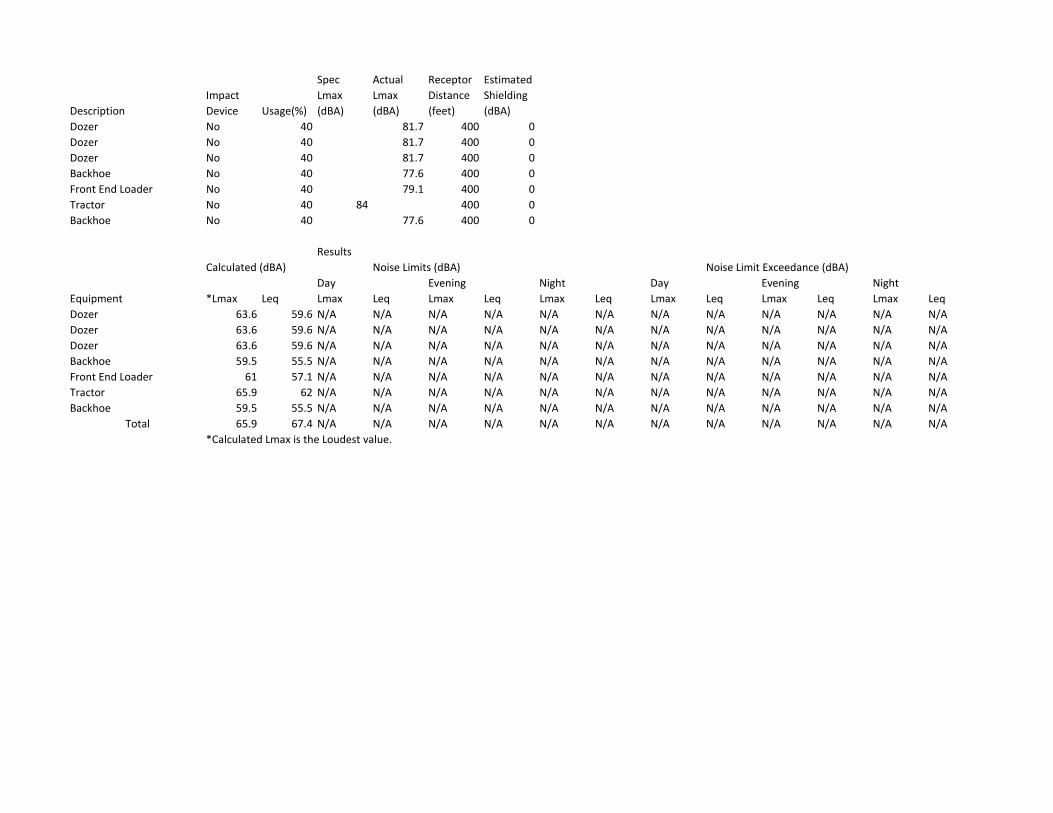
---- Receptor #2 ----Baselines (dBA)
DescriptionLand Use Daytime Evening NightAcoustic Center 400'Residential 65 60 55
Equipment
Spec Actual Receptor EstimatedImpact Lmax Lmax Distance Shielding
Description Device Usage(%) (dBA) (dBA) (feet) (dBA)Dozer No 40 81.7 400 0Dozer No 40 81.7 400 0Dozer No 40 81.7 400 0Backhoe No 40 77.6 400 0Front End Loader No 40 79.1 400 0Tractor No 40 84 400 0Backhoe No 40 77.6 400 0
ResultsCalculated (dBA) Noise Limits (dBA) Noise Limit Exceedance (dBA)
Day Evening Night Day Evening NightEquipment *Lmax Leq Lmax Leq Lmax Leq Lmax Leq Lmax Leq Lmax Leq Lmax LeqDozer 63.6 59.6 N/A N/A N/A N/A N/A N/A N/A N/A N/A N/A N/A N/ADozer 63.6 59.6 N/A N/A N/A N/A N/A N/A N/A N/A N/A N/A N/A N/ADozer 63.6 59.6 N/A N/A N/A N/A N/A N/A N/A N/A N/A N/A N/A N/ABackhoe 59.5 55.5 N/A N/A N/A N/A N/A N/A N/A N/A N/A N/A N/A N/AFront End Loader 61 57.1 N/A N/A N/A N/A N/A N/A N/A N/A N/A N/A N/A N/ATractor 65.9 62 N/A N/A N/A N/A N/A N/A N/A N/A N/A N/A N/A N/ABackhoe 59.5 55.5 N/A N/A N/A N/A N/A N/A N/A N/A N/A N/A N/A N/A
Total 65.9 67.4 N/A N/A N/A N/A N/A N/A N/A N/A N/A N/A N/A N/A*Calculated Lmax is the Loudest value.
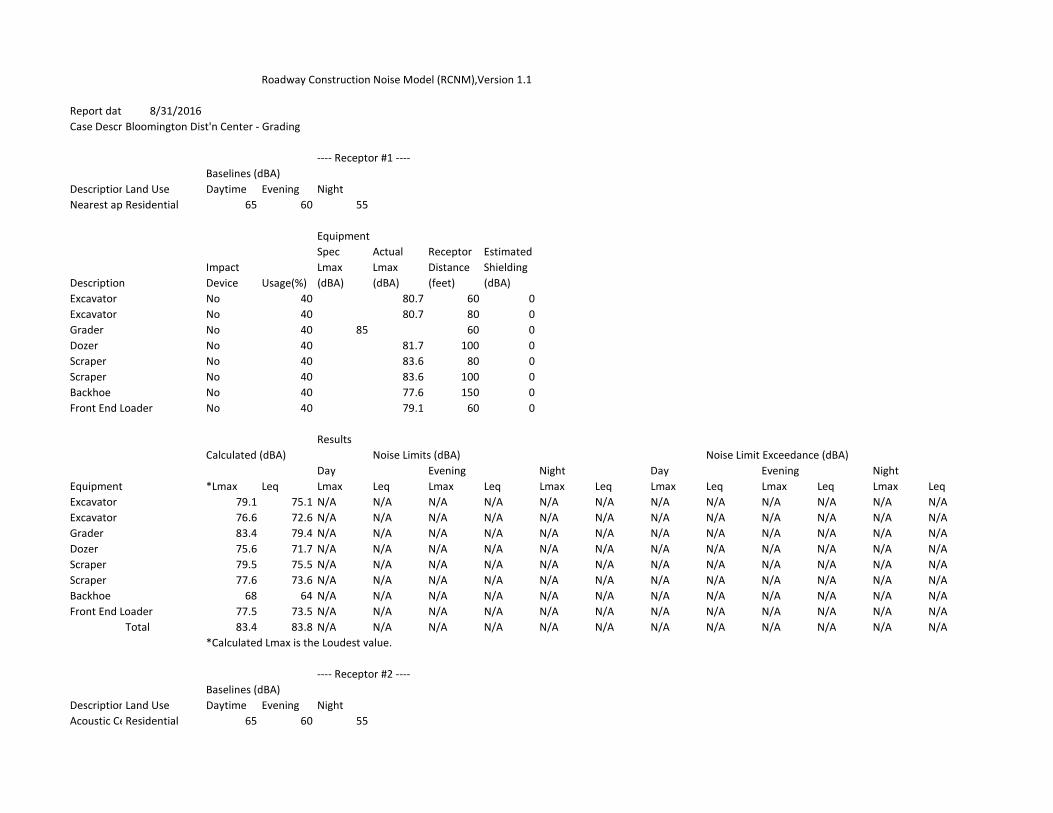
Roadway Construction Noise Model (RCNM),Version 1.1Report date: 8/31/2016Case Description:Bloomington Dist'n Center - Grading
---- Receptor #1 ----Baselines (dBA)
DescriptionLand Use Daytime Evening NightNearest approx 60'Residential 65 60 55
EquipmentSpec Actual Receptor Estimated
Impact Lmax Lmax Distance ShieldingDescription Device Usage(%) (dBA) (dBA) (feet) (dBA)Excavator No 40 80.7 60 0Excavator No 40 80.7 80 0Grader No 40 85 60 0Dozer No 40 81.7 100 0Scraper No 40 83.6 80 0Scraper No 40 83.6 100 0Backhoe No 40 77.6 150 0Front End Loader No 40 79.1 60 0
ResultsCalculated (dBA) Noise Limits (dBA) Noise Limit Exceedance (dBA)
Day Evening Night Day Evening NightEquipment *Lmax Leq Lmax Leq Lmax Leq Lmax Leq Lmax Leq Lmax Leq Lmax LeqExcavator 79.1 75.1 N/A N/A N/A N/A N/A N/A N/A N/A N/A N/A N/A N/AExcavator 76.6 72.6 N/A N/A N/A N/A N/A N/A N/A N/A N/A N/A N/A N/AGrader 83.4 79.4 N/A N/A N/A N/A N/A N/A N/A N/A N/A N/A N/A N/ADozer 75.6 71.7 N/A N/A N/A N/A N/A N/A N/A N/A N/A N/A N/A N/AScraper 79.5 75.5 N/A N/A N/A N/A N/A N/A N/A N/A N/A N/A N/A N/AScraper 77.6 73.6 N/A N/A N/A N/A N/A N/A N/A N/A N/A N/A N/A N/ABackhoe 68 64 N/A N/A N/A N/A N/A N/A N/A N/A N/A N/A N/A N/AFront End Loader 77.5 73.5 N/A N/A N/A N/A N/A N/A N/A N/A N/A N/A N/A N/A
Total 83.4 83.8 N/A N/A N/A N/A N/A N/A N/A N/A N/A N/A N/A N/A*Calculated Lmax is the Loudest value.
---- Receptor #2 ----Baselines (dBA)
DescriptionLand Use Daytime Evening NightAcoustic Center 400'Residential 65 60 55
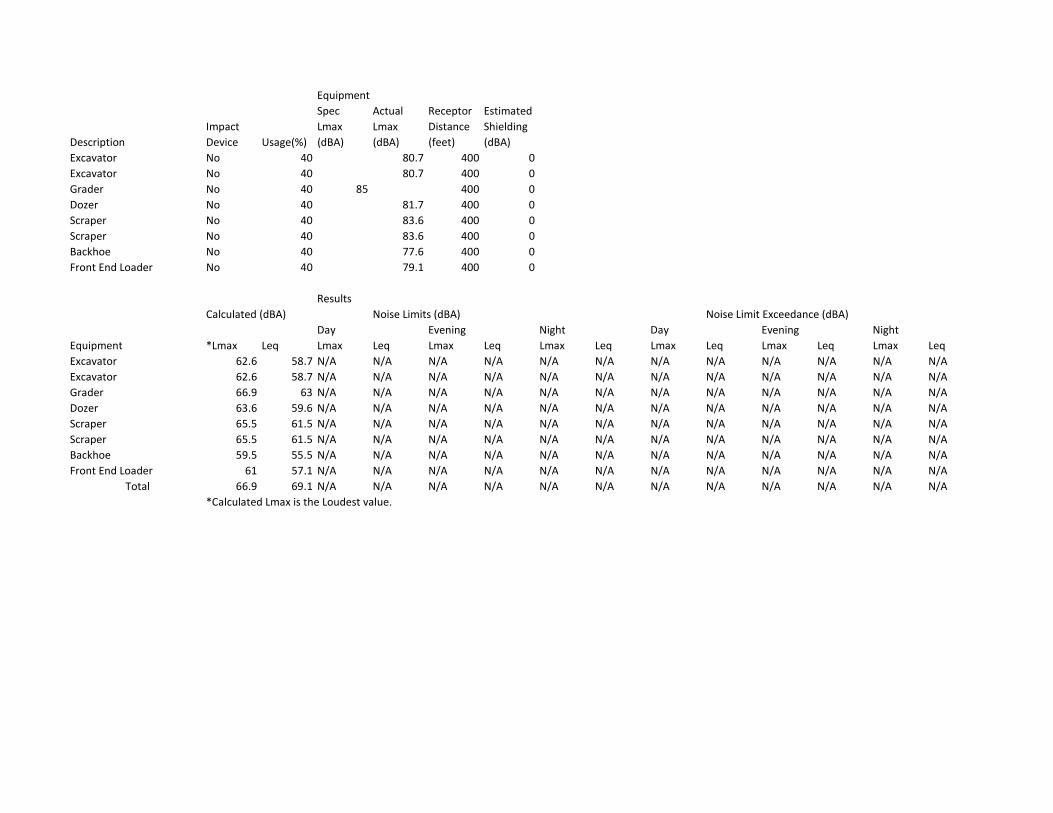
EquipmentSpec Actual Receptor Estimated
Impact Lmax Lmax Distance ShieldingDescription Device Usage(%) (dBA) (dBA) (feet) (dBA)Excavator No 40 80.7 400 0Excavator No 40 80.7 400 0Grader No 40 85 400 0Dozer No 40 81.7 400 0Scraper No 40 83.6 400 0Scraper No 40 83.6 400 0Backhoe No 40 77.6 400 0Front End Loader No 40 79.1 400 0
ResultsCalculated (dBA) Noise Limits (dBA) Noise Limit Exceedance (dBA)
Day Evening Night Day Evening NightEquipment *Lmax Leq Lmax Leq Lmax Leq Lmax Leq Lmax Leq Lmax Leq Lmax LeqExcavator 62.6 58.7 N/A N/A N/A N/A N/A N/A N/A N/A N/A N/A N/A N/AExcavator 62.6 58.7 N/A N/A N/A N/A N/A N/A N/A N/A N/A N/A N/A N/AGrader 66.9 63 N/A N/A N/A N/A N/A N/A N/A N/A N/A N/A N/A N/ADozer 63.6 59.6 N/A N/A N/A N/A N/A N/A N/A N/A N/A N/A N/A N/AScraper 65.5 61.5 N/A N/A N/A N/A N/A N/A N/A N/A N/A N/A N/A N/AScraper 65.5 61.5 N/A N/A N/A N/A N/A N/A N/A N/A N/A N/A N/A N/ABackhoe 59.5 55.5 N/A N/A N/A N/A N/A N/A N/A N/A N/A N/A N/A N/AFront End Loader 61 57.1 N/A N/A N/A N/A N/A N/A N/A N/A N/A N/A N/A N/A
Total 66.9 69.1 N/A N/A N/A N/A N/A N/A N/A N/A N/A N/A N/A N/A*Calculated Lmax is the Loudest value.
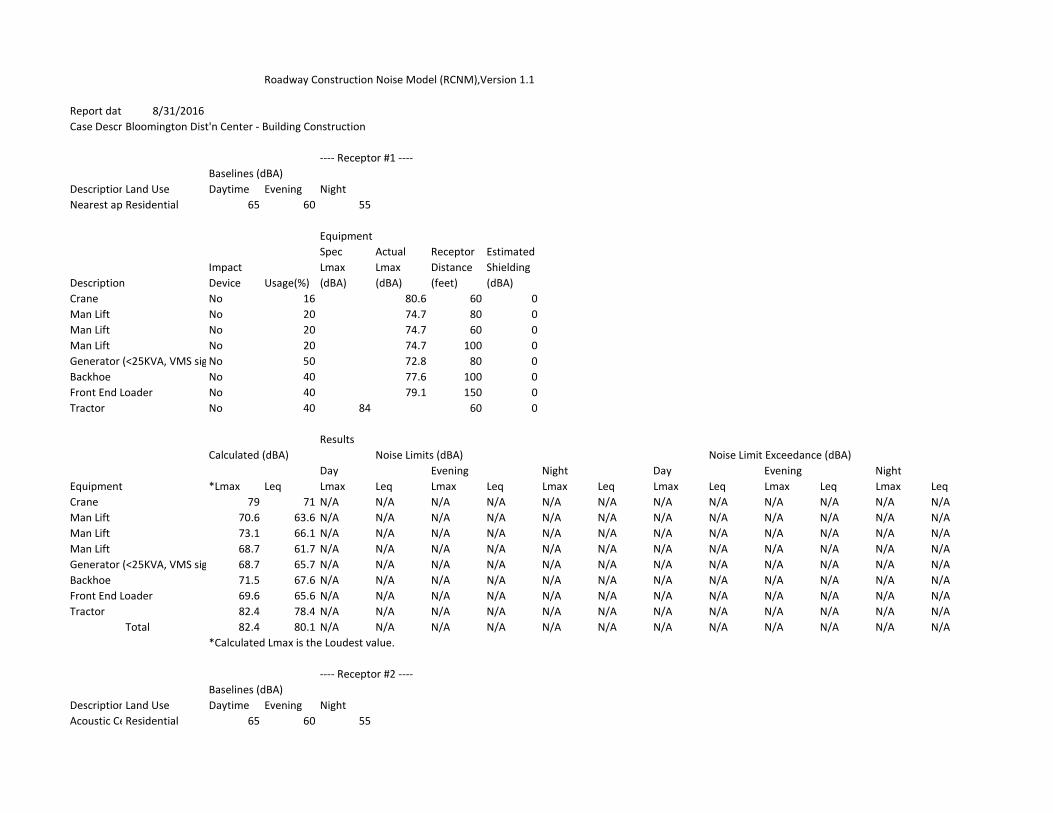
Roadway Construction Noise Model (RCNM),Version 1.1Report date: 8/31/2016Case Description:Bloomington Dist'n Center - Building Construction
---- Receptor #1 ----Baselines (dBA)
DescriptionLand Use Daytime Evening NightNearest approx 60'Residential 65 60 55
EquipmentSpec Actual Receptor Estimated
Impact Lmax Lmax Distance ShieldingDescription Device Usage(%) (dBA) (dBA) (feet) (dBA)Crane No 16 80.6 60 0Man Lift No 20 74.7 80 0Man Lift No 20 74.7 60 0Man Lift No 20 74.7 100 0Generator (<25KVA, VMS signs)No 50 72.8 80 0Backhoe No 40 77.6 100 0Front End Loader No 40 79.1 150 0Tractor No 40 84 60 0
ResultsCalculated (dBA) Noise Limits (dBA) Noise Limit Exceedance (dBA)
Day Evening Night Day Evening NightEquipment *Lmax Leq Lmax Leq Lmax Leq Lmax Leq Lmax Leq Lmax Leq Lmax LeqCrane 79 71 N/A N/A N/A N/A N/A N/A N/A N/A N/A N/A N/A N/AMan Lift 70.6 63.6 N/A N/A N/A N/A N/A N/A N/A N/A N/A N/A N/A N/AMan Lift 73.1 66.1 N/A N/A N/A N/A N/A N/A N/A N/A N/A N/A N/A N/AMan Lift 68.7 61.7 N/A N/A N/A N/A N/A N/A N/A N/A N/A N/A N/A N/AGenerator (<25KVA, VMS signs) 68.7 65.7 N/A N/A N/A N/A N/A N/A N/A N/A N/A N/A N/A N/ABackhoe 71.5 67.6 N/A N/A N/A N/A N/A N/A N/A N/A N/A N/A N/A N/AFront End Loader 69.6 65.6 N/A N/A N/A N/A N/A N/A N/A N/A N/A N/A N/A N/ATractor 82.4 78.4 N/A N/A N/A N/A N/A N/A N/A N/A N/A N/A N/A N/A
Total 82.4 80.1 N/A N/A N/A N/A N/A N/A N/A N/A N/A N/A N/A N/A*Calculated Lmax is the Loudest value.
---- Receptor #2 ----Baselines (dBA)
DescriptionLand Use Daytime Evening NightAcoustic Center 400'Residential 65 60 55
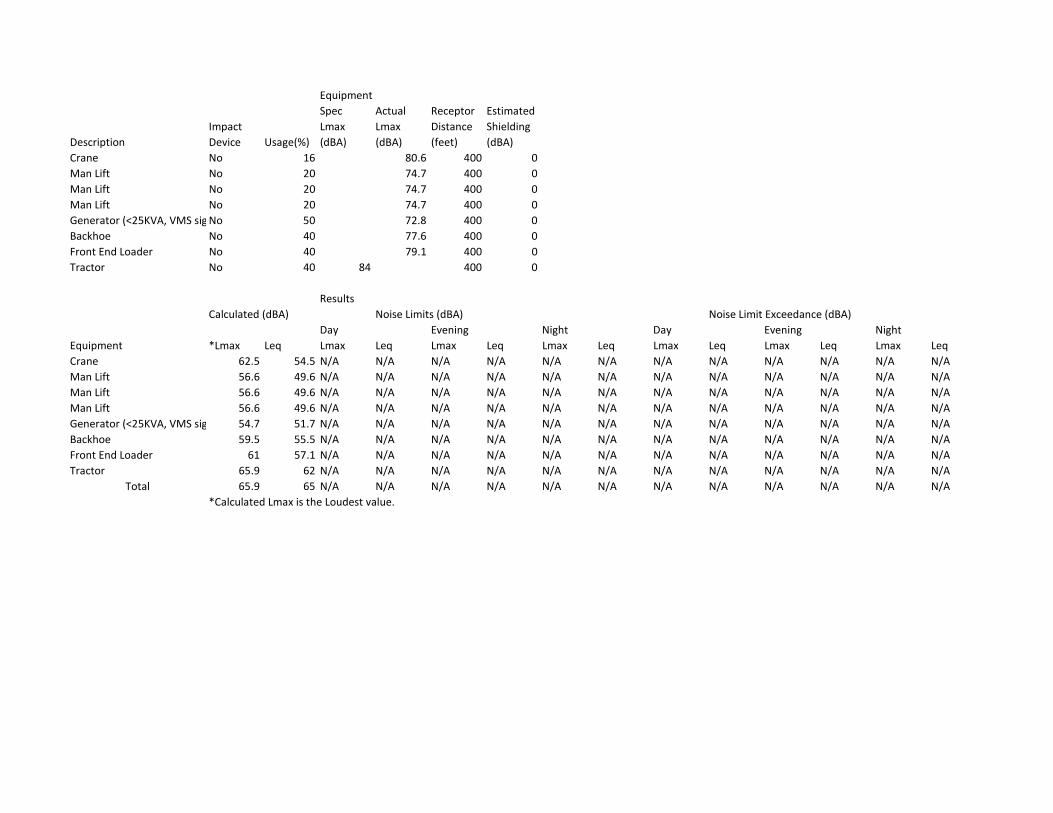
EquipmentSpec Actual Receptor Estimated
Impact Lmax Lmax Distance ShieldingDescription Device Usage(%) (dBA) (dBA) (feet) (dBA)Crane No 16 80.6 400 0Man Lift No 20 74.7 400 0Man Lift No 20 74.7 400 0Man Lift No 20 74.7 400 0Generator (<25KVA, VMS signs)No 50 72.8 400 0Backhoe No 40 77.6 400 0Front End Loader No 40 79.1 400 0Tractor No 40 84 400 0
ResultsCalculated (dBA) Noise Limits (dBA) Noise Limit Exceedance (dBA)
Day Evening Night Day Evening NightEquipment *Lmax Leq Lmax Leq Lmax Leq Lmax Leq Lmax Leq Lmax Leq Lmax LeqCrane 62.5 54.5 N/A N/A N/A N/A N/A N/A N/A N/A N/A N/A N/A N/AMan Lift 56.6 49.6 N/A N/A N/A N/A N/A N/A N/A N/A N/A N/A N/A N/AMan Lift 56.6 49.6 N/A N/A N/A N/A N/A N/A N/A N/A N/A N/A N/A N/AMan Lift 56.6 49.6 N/A N/A N/A N/A N/A N/A N/A N/A N/A N/A N/A N/AGenerator (<25KVA, VMS signs) 54.7 51.7 N/A N/A N/A N/A N/A N/A N/A N/A N/A N/A N/A N/ABackhoe 59.5 55.5 N/A N/A N/A N/A N/A N/A N/A N/A N/A N/A N/A N/AFront End Loader 61 57.1 N/A N/A N/A N/A N/A N/A N/A N/A N/A N/A N/A N/ATractor 65.9 62 N/A N/A N/A N/A N/A N/A N/A N/A N/A N/A N/A N/A
Total 65.9 65 N/A N/A N/A N/A N/A N/A N/A N/A N/A N/A N/A N/A*Calculated Lmax is the Loudest value.
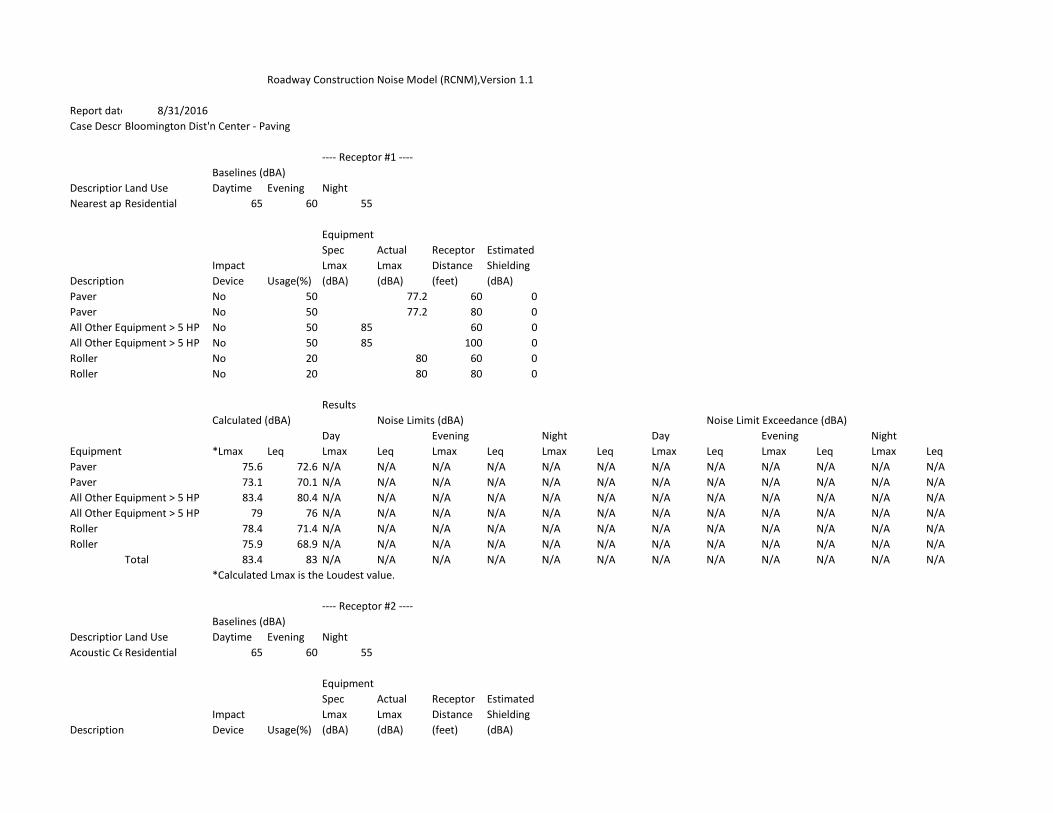
Roadway Construction Noise Model (RCNM),Version 1.1Report date: 8/31/2016Case Description:Bloomington Dist'n Center - Paving
---- Receptor #1 ----Baselines (dBA)
DescriptionLand Use Daytime Evening NightNearest approx 60'Residential 65 60 55
EquipmentSpec Actual Receptor Estimated
Impact Lmax Lmax Distance ShieldingDescription Device Usage(%) (dBA) (dBA) (feet) (dBA)Paver No 50 77.2 60 0Paver No 50 77.2 80 0All Other Equipment > 5 HP No 50 85 60 0All Other Equipment > 5 HP No 50 85 100 0Roller No 20 80 60 0Roller No 20 80 80 0
ResultsCalculated (dBA) Noise Limits (dBA) Noise Limit Exceedance (dBA)
Day Evening Night Day Evening NightEquipment *Lmax Leq Lmax Leq Lmax Leq Lmax Leq Lmax Leq Lmax Leq Lmax LeqPaver 75.6 72.6 N/A N/A N/A N/A N/A N/A N/A N/A N/A N/A N/A N/APaver 73.1 70.1 N/A N/A N/A N/A N/A N/A N/A N/A N/A N/A N/A N/AAll Other Equipment > 5 HP 83.4 80.4 N/A N/A N/A N/A N/A N/A N/A N/A N/A N/A N/A N/AAll Other Equipment > 5 HP 79 76 N/A N/A N/A N/A N/A N/A N/A N/A N/A N/A N/A N/ARoller 78.4 71.4 N/A N/A N/A N/A N/A N/A N/A N/A N/A N/A N/A N/ARoller 75.9 68.9 N/A N/A N/A N/A N/A N/A N/A N/A N/A N/A N/A N/A
Total 83.4 83 N/A N/A N/A N/A N/A N/A N/A N/A N/A N/A N/A N/A*Calculated Lmax is the Loudest value.
---- Receptor #2 ----Baselines (dBA)
DescriptionLand Use Daytime Evening NightAcoustic Center 400'Residential 65 60 55
EquipmentSpec Actual Receptor Estimated
Impact Lmax Lmax Distance ShieldingDescription Device Usage(%) (dBA) (dBA) (feet) (dBA)
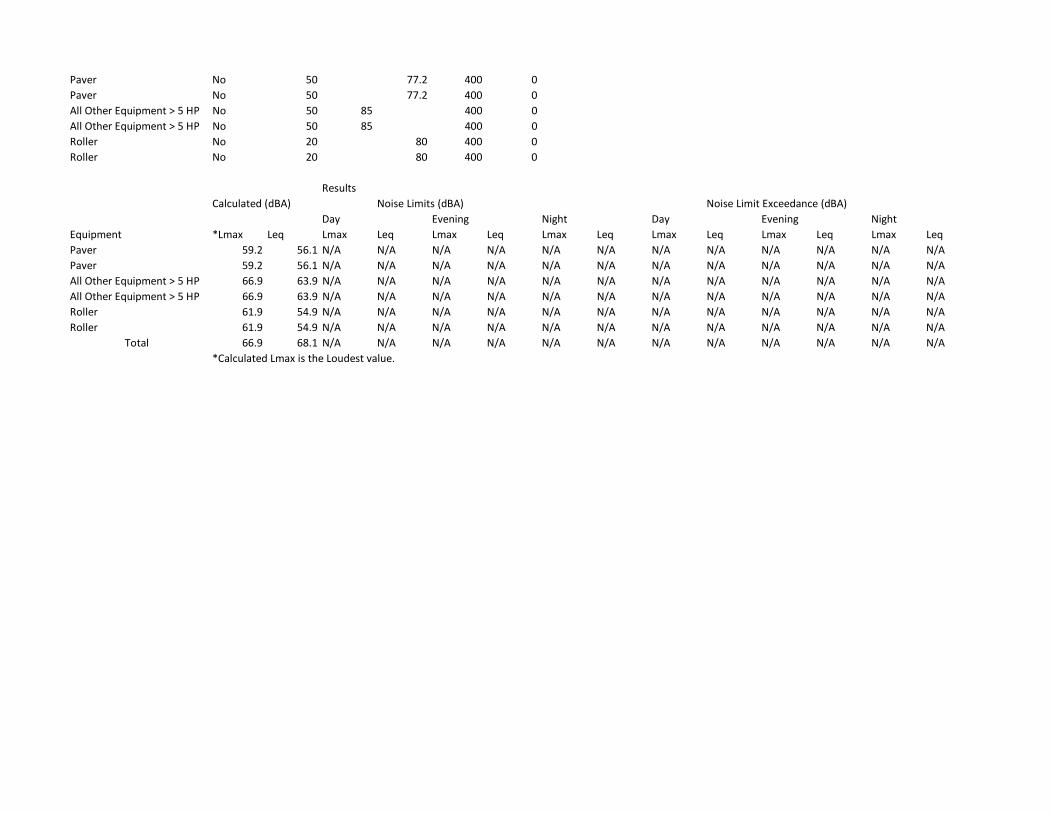
Paver No 50 77.2 400 0Paver No 50 77.2 400 0All Other Equipment > 5 HP No 50 85 400 0All Other Equipment > 5 HP No 50 85 400 0Roller No 20 80 400 0Roller No 20 80 400 0
ResultsCalculated (dBA) Noise Limits (dBA) Noise Limit Exceedance (dBA)
Day Evening Night Day Evening NightEquipment *Lmax Leq Lmax Leq Lmax Leq Lmax Leq Lmax Leq Lmax Leq Lmax LeqPaver 59.2 56.1 N/A N/A N/A N/A N/A N/A N/A N/A N/A N/A N/A N/APaver 59.2 56.1 N/A N/A N/A N/A N/A N/A N/A N/A N/A N/A N/A N/AAll Other Equipment > 5 HP 66.9 63.9 N/A N/A N/A N/A N/A N/A N/A N/A N/A N/A N/A N/AAll Other Equipment > 5 HP 66.9 63.9 N/A N/A N/A N/A N/A N/A N/A N/A N/A N/A N/A N/ARoller 61.9 54.9 N/A N/A N/A N/A N/A N/A N/A N/A N/A N/A N/A N/ARoller 61.9 54.9 N/A N/A N/A N/A N/A N/A N/A N/A N/A N/A N/A N/A
Total 66.9 68.1 N/A N/A N/A N/A N/A N/A N/A N/A N/A N/A N/A N/A*Calculated Lmax is the Loudest value.
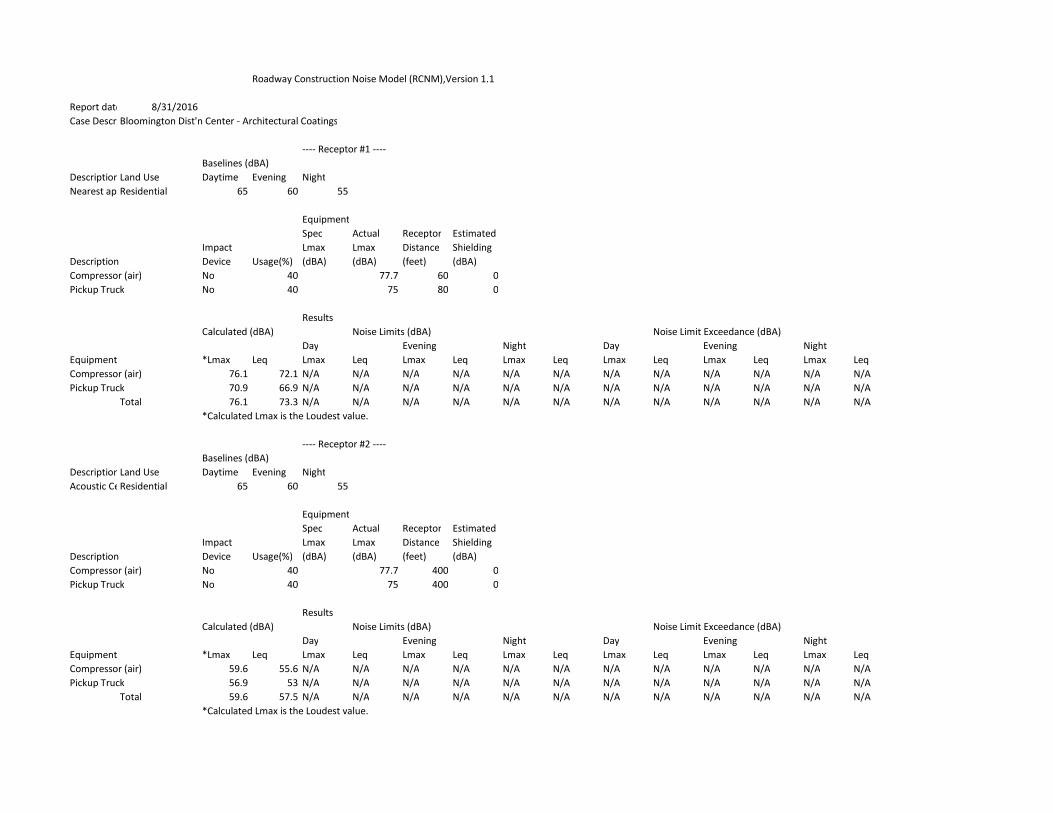
Roadway Construction Noise Model (RCNM),Version 1.1Report date: 8/31/2016Case Description:Bloomington Dist'n Center - Architectural Coatings
---- Receptor #1 ----Baselines (dBA)
DescriptionLand Use Daytime Evening NightNearest approx 60'Residential 65 60 55
EquipmentSpec Actual Receptor Estimated
Impact Lmax Lmax Distance ShieldingDescription Device Usage(%) (dBA) (dBA) (feet) (dBA)Compressor (air) No 40 77.7 60 0Pickup Truck No 40 75 80 0
ResultsCalculated (dBA) Noise Limits (dBA) Noise Limit Exceedance (dBA)
Day Evening Night Day Evening NightEquipment *Lmax Leq Lmax Leq Lmax Leq Lmax Leq Lmax Leq Lmax Leq Lmax LeqCompressor (air) 76.1 72.1 N/A N/A N/A N/A N/A N/A N/A N/A N/A N/A N/A N/APickup Truck 70.9 66.9 N/A N/A N/A N/A N/A N/A N/A N/A N/A N/A N/A N/A
Total 76.1 73.3 N/A N/A N/A N/A N/A N/A N/A N/A N/A N/A N/A N/A*Calculated Lmax is the Loudest value.
---- Receptor #2 ----Baselines (dBA)
DescriptionLand Use Daytime Evening NightAcoustic Center 400'Residential 65 60 55
EquipmentSpec Actual Receptor Estimated
Impact Lmax Lmax Distance ShieldingDescription Device Usage(%) (dBA) (dBA) (feet) (dBA)Compressor (air) No 40 77.7 400 0Pickup Truck No 40 75 400 0
ResultsCalculated (dBA) Noise Limits (dBA) Noise Limit Exceedance (dBA)
Day Evening Night Day Evening NightEquipment *Lmax Leq Lmax Leq Lmax Leq Lmax Leq Lmax Leq Lmax Leq Lmax LeqCompressor (air) 59.6 55.6 N/A N/A N/A N/A N/A N/A N/A N/A N/A N/A N/A N/APickup Truck 56.9 53 N/A N/A N/A N/A N/A N/A N/A N/A N/A N/A N/A N/A
Total 59.6 57.5 N/A N/A N/A N/A N/A N/A N/A N/A N/A N/A N/A N/A*Calculated Lmax is the Loudest value.

APPENDIX C
Traffic Noise Modeling Input and Output Files

Traffic Noise Model (TNM®)
Input/Output
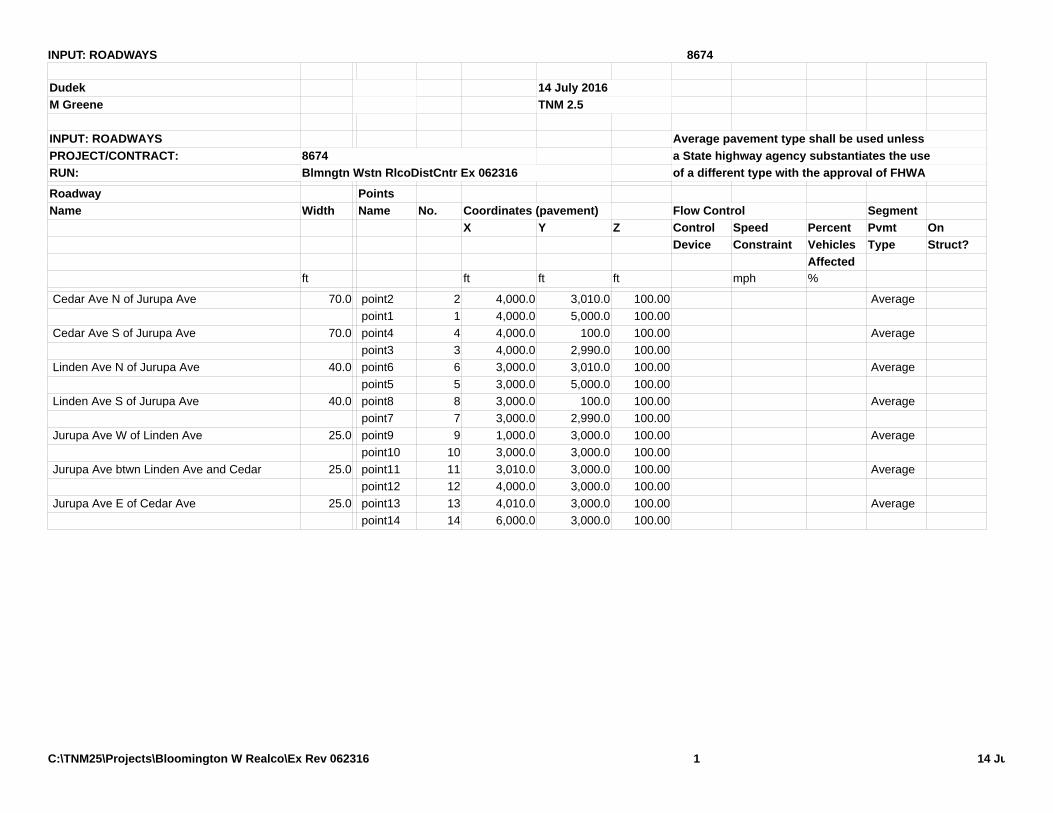
INPUT: ROADWAYS 8674
Dudek 14 July 2016 M Greene TNM 2.5
INPUT: ROADWAYS Average pavement type shall be used unlessPROJECT/CONTRACT: 8674 a State highway agency substantiates the useRUN: Blmngtn Wstn RlcoDistCntr Ex 062316 of a different type with the approval of FHWA
Roadway PointsName Width Name No. Coordinates (pavement) Flow Control Segment
X Y Z Control Speed Percent Pvmt OnDevice Constraint Vehicles Type Struct?
Affectedft ft ft ft mph %
Cedar Ave N of Jurupa Ave 70.0 point2 2 4,000.0 3,010.0 100.00 Average point1 1 4,000.0 5,000.0 100.00
Cedar Ave S of Jurupa Ave 70.0 point4 4 4,000.0 100.0 100.00 Average point3 3 4,000.0 2,990.0 100.00
Linden Ave N of Jurupa Ave 40.0 point6 6 3,000.0 3,010.0 100.00 Average point5 5 3,000.0 5,000.0 100.00
Linden Ave S of Jurupa Ave 40.0 point8 8 3,000.0 100.0 100.00 Average point7 7 3,000.0 2,990.0 100.00
Jurupa Ave W of Linden Ave 25.0 point9 9 1,000.0 3,000.0 100.00 Average point10 10 3,000.0 3,000.0 100.00
Jurupa Ave btwn Linden Ave and Cedar 25.0 point11 11 3,010.0 3,000.0 100.00 Average point12 12 4,000.0 3,000.0 100.00
Jurupa Ave E of Cedar Ave 25.0 point13 13 4,010.0 3,000.0 100.00 Average point14 14 6,000.0 3,000.0 100.00
C:\TNM25\Projects\Bloomington W Realco\Ex Rev 062316 1 14 Ju
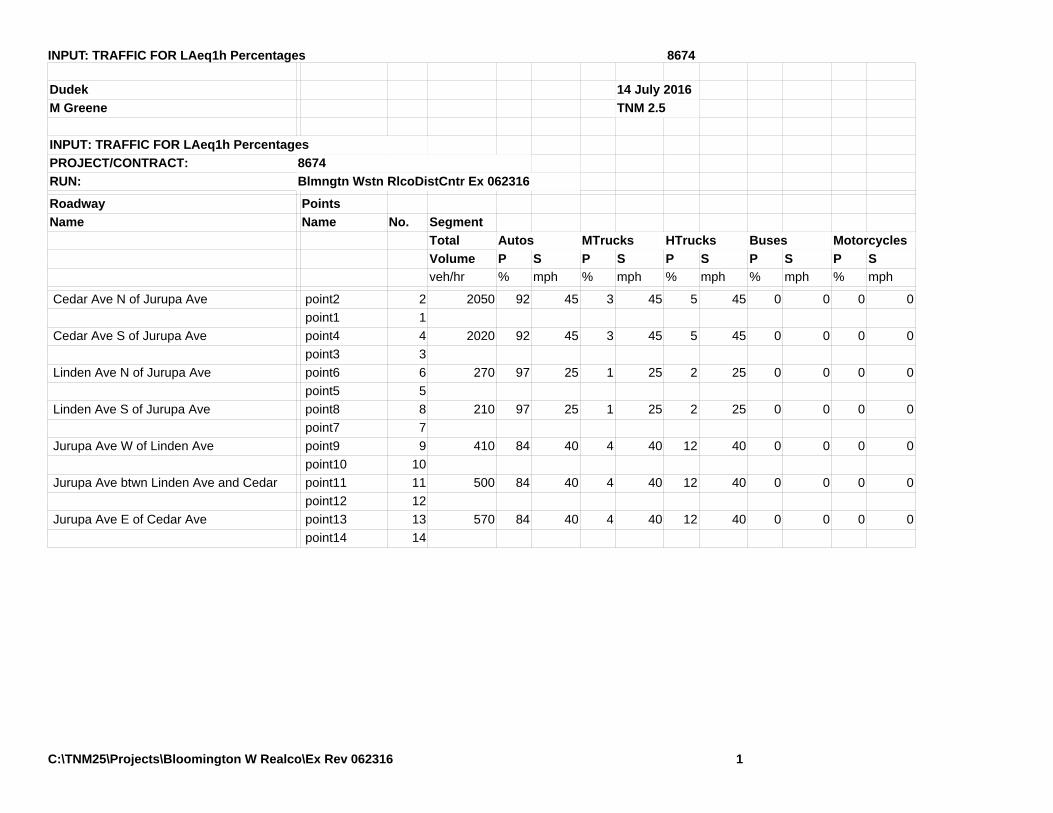
INPUT: TRAFFIC FOR LAeq1h Percentages 8674
Dudek 14 July 2016 M Greene TNM 2.5
INPUT: TRAFFIC FOR LAeq1h Percentages PROJECT/CONTRACT: 8674 RUN: Blmngtn Wstn RlcoDistCntr Ex 062316
Roadway PointsName Name No. Segment
Total Autos MTrucks HTrucks Buses Motorcycles Volume P S P S P S P S P Sveh/hr % mph % mph % mph % mph % mph
Cedar Ave N of Jurupa Ave point2 2 2050 92 45 3 45 5 45 0 0 0 0 point1 1
Cedar Ave S of Jurupa Ave point4 4 2020 92 45 3 45 5 45 0 0 0 0 point3 3
Linden Ave N of Jurupa Ave point6 6 270 97 25 1 25 2 25 0 0 0 0 point5 5
Linden Ave S of Jurupa Ave point8 8 210 97 25 1 25 2 25 0 0 0 0 point7 7
Jurupa Ave W of Linden Ave point9 9 410 84 40 4 40 12 40 0 0 0 0 point10 10
Jurupa Ave btwn Linden Ave and Cedar point11 11 500 84 40 4 40 12 40 0 0 0 0 point12 12
Jurupa Ave E of Cedar Ave point13 13 570 84 40 4 40 12 40 0 0 0 0 point14 14
C:\TNM25\Projects\Bloomington W Realco\Ex Rev 062316 1
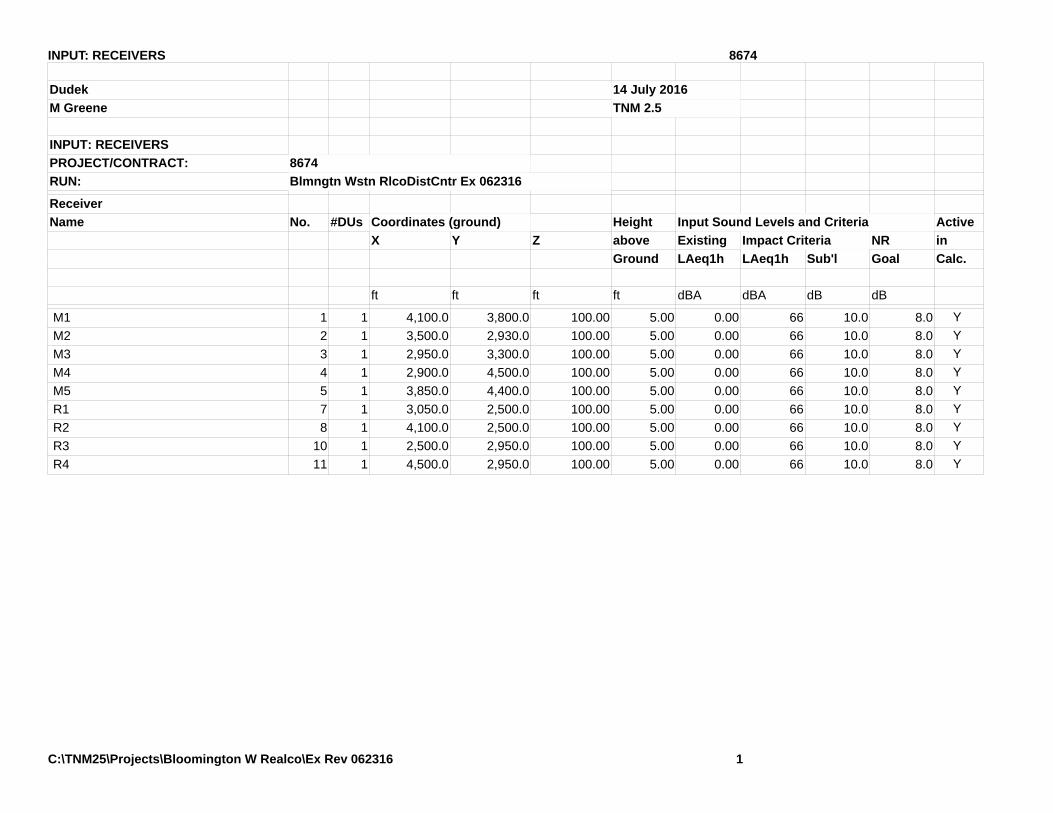
INPUT: RECEIVERS 8674
Dudek 14 July 2016 M Greene TNM 2.5
INPUT: RECEIVERS PROJECT/CONTRACT: 8674 RUN: Blmngtn Wstn RlcoDistCntr Ex 062316
ReceiverName No. #DUs Coordinates (ground) Height Input Sound Levels and Criteria Active
X Y Z above Existing Impact Criteria NR inGround LAeq1h LAeq1h Sub'l Goal Calc.
ft ft ft ft dBA dBA dB dB
M1 1 1 4,100.0 3,800.0 100.00 5.00 0.00 66 10.0 8.0 Y M2 2 1 3,500.0 2,930.0 100.00 5.00 0.00 66 10.0 8.0 Y M3 3 1 2,950.0 3,300.0 100.00 5.00 0.00 66 10.0 8.0 Y M4 4 1 2,900.0 4,500.0 100.00 5.00 0.00 66 10.0 8.0 Y M5 5 1 3,850.0 4,400.0 100.00 5.00 0.00 66 10.0 8.0 Y R1 7 1 3,050.0 2,500.0 100.00 5.00 0.00 66 10.0 8.0 Y R2 8 1 4,100.0 2,500.0 100.00 5.00 0.00 66 10.0 8.0 Y R3 10 1 2,500.0 2,950.0 100.00 5.00 0.00 66 10.0 8.0 Y R4 11 1 4,500.0 2,950.0 100.00 5.00 0.00 66 10.0 8.0 Y
C:\TNM25\Projects\Bloomington W Realco\Ex Rev 062316 1
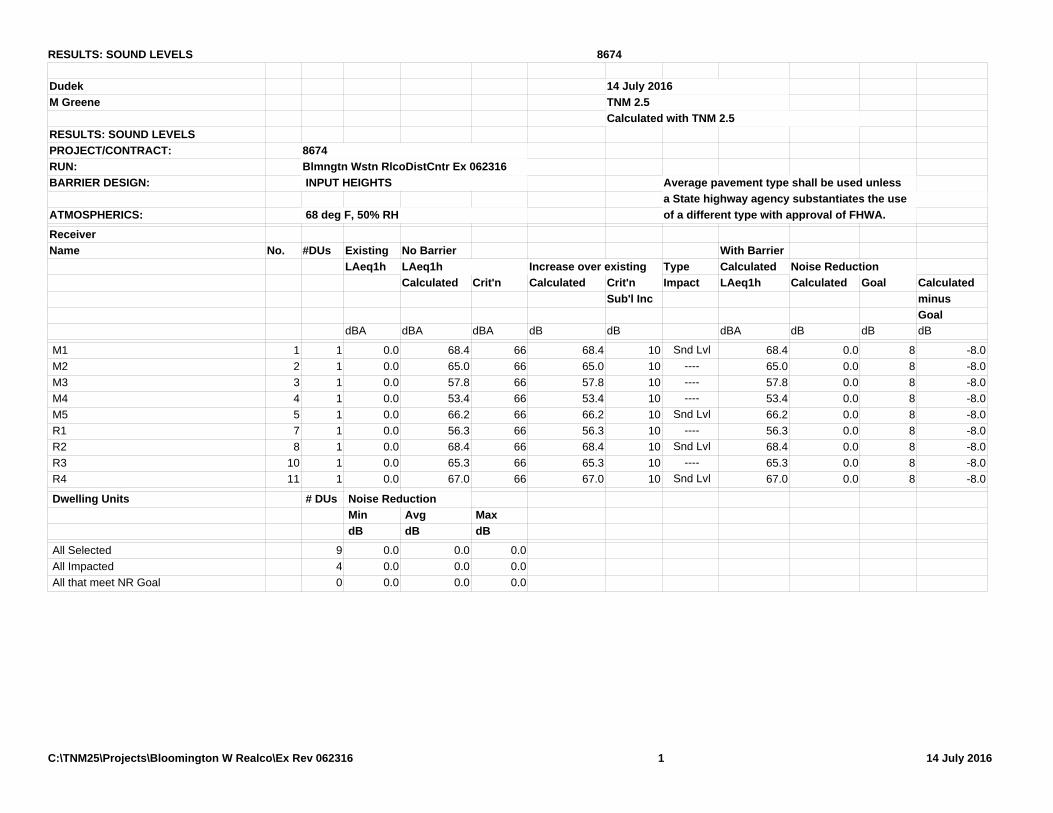
RESULTS: SOUND LEVELS 8674
Dudek 14 July 2016 M Greene TNM 2.5
Calculated with TNM 2.5 RESULTS: SOUND LEVELS PROJECT/CONTRACT: 8674 RUN: Blmngtn Wstn RlcoDistCntr Ex 062316 BARRIER DESIGN: INPUT HEIGHTS Average pavement type shall be used unless
a State highway agency substantiates the use ATMOSPHERICS: 68 deg F, 50% RH of a different type with approval of FHWA.
ReceiverName No. #DUs Existing No Barrier With Barrier
LAeq1h LAeq1h Increase over existing Type Calculated Noise ReductionCalculated Crit'n Calculated Crit'n Impact LAeq1h Calculated Goal Calculated
Sub'l Inc minusGoal
dBA dBA dBA dB dB dBA dB dB dB
M1 1 1 0.0 68.4 66 68.4 10 Snd Lvl 68.4 0.0 8 -8.0 M2 2 1 0.0 65.0 66 65.0 10 ---- 65.0 0.0 8 -8.0 M3 3 1 0.0 57.8 66 57.8 10 ---- 57.8 0.0 8 -8.0 M4 4 1 0.0 53.4 66 53.4 10 ---- 53.4 0.0 8 -8.0 M5 5 1 0.0 66.2 66 66.2 10 Snd Lvl 66.2 0.0 8 -8.0 R1 7 1 0.0 56.3 66 56.3 10 ---- 56.3 0.0 8 -8.0 R2 8 1 0.0 68.4 66 68.4 10 Snd Lvl 68.4 0.0 8 -8.0 R3 10 1 0.0 65.3 66 65.3 10 ---- 65.3 0.0 8 -8.0 R4 11 1 0.0 67.0 66 67.0 10 Snd Lvl 67.0 0.0 8 -8.0
Dwelling Units # DUs Noise Reduction Min Avg Max dB dB dB
All Selected 9 0.0 0.0 0.0 All Impacted 4 0.0 0.0 0.0 All that meet NR Goal 0 0.0 0.0 0.0
C:\TNM25\Projects\Bloomington W Realco\Ex Rev 062316 1 14 July 2016

INPUT: ROADWAYS 8674
Dudek 14 July 2016 M Greene TNM 2.5
INPUT: ROADWAYS Average pavement type shall be used unlessPROJECT/CONTRACT: 8674 a State highway agency substantiates the useRUN: BlmngtnRlcoDistCntr Ex w Prj 062316 of a different type with the approval of FHWA
Roadway PointsName Width Name No. Coordinates (pavement) Flow Control Segment
X Y Z Control Speed Percent Pvmt OnDevice Constraint Vehicles Type Struct?
Affectedft ft ft ft mph %
Cedar Ave N of Jurupa Ave 70.0 point2 2 4,000.0 3,010.0 100.00 Average point1 1 4,000.0 5,000.0 100.00
Cedar Ave S of Jurupa Ave 70.0 point4 4 4,000.0 100.0 100.00 Average point3 3 4,000.0 2,990.0 100.00
Linden Ave N of Jurupa Ave 40.0 point6 6 3,000.0 3,010.0 100.00 Average point5 5 3,000.0 5,000.0 100.00
Linden Ave S of Jurupa Ave 40.0 point8 8 3,000.0 100.0 100.00 Average point7 7 3,000.0 2,990.0 100.00
Jurupa Ave W of Linden Ave 25.0 point9 9 1,000.0 3,000.0 100.00 Average point10 10 3,000.0 3,000.0 100.00
Jurupa Ave btwn Linden Ave and Cedar 25.0 point11 11 3,010.0 3,000.0 100.00 Average point12 12 4,000.0 3,000.0 100.00
Jurupa Ave E of Cedar Ave 25.0 point13 13 4,010.0 3,000.0 100.00 Average point14 14 6,000.0 3,000.0 100.00
C:\TNM25\Projects\Bloomington W Realco\Ex w Proj Rev 062316 1
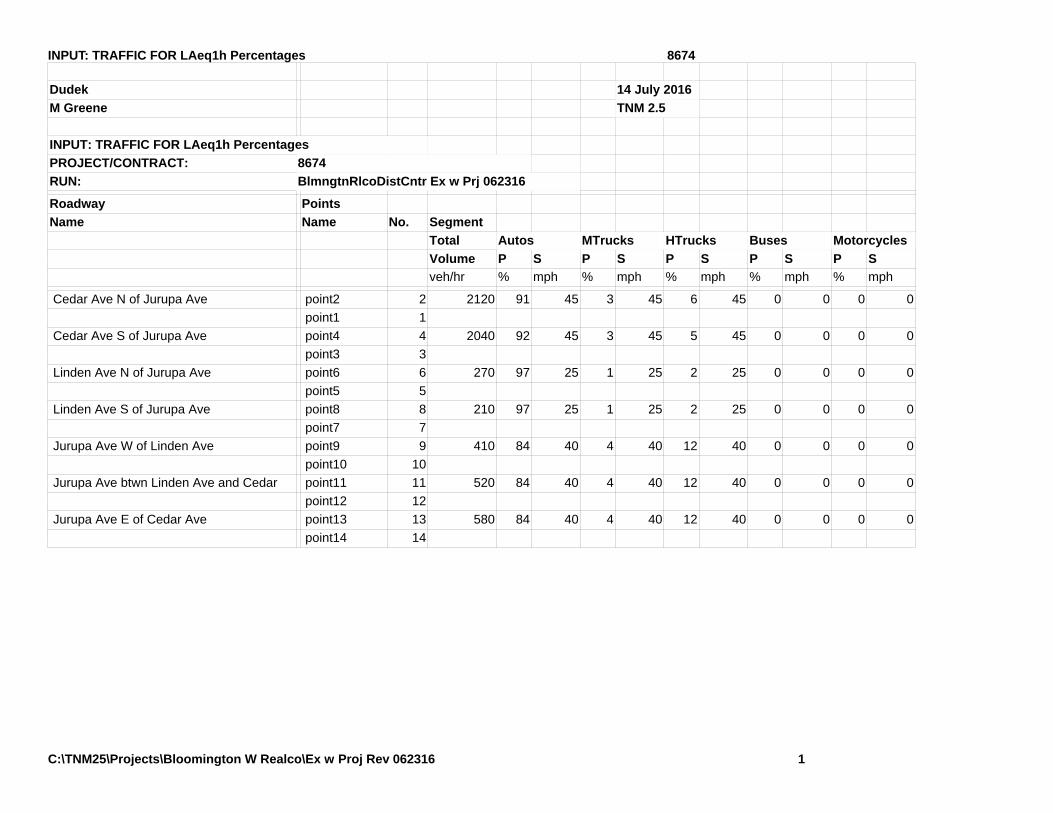
INPUT: TRAFFIC FOR LAeq1h Percentages 8674
Dudek 14 July 2016 M Greene TNM 2.5
INPUT: TRAFFIC FOR LAeq1h Percentages PROJECT/CONTRACT: 8674 RUN: BlmngtnRlcoDistCntr Ex w Prj 062316
Roadway PointsName Name No. Segment
Total Autos MTrucks HTrucks Buses Motorcycles Volume P S P S P S P S P Sveh/hr % mph % mph % mph % mph % mph
Cedar Ave N of Jurupa Ave point2 2 2120 91 45 3 45 6 45 0 0 0 0 point1 1
Cedar Ave S of Jurupa Ave point4 4 2040 92 45 3 45 5 45 0 0 0 0 point3 3
Linden Ave N of Jurupa Ave point6 6 270 97 25 1 25 2 25 0 0 0 0 point5 5
Linden Ave S of Jurupa Ave point8 8 210 97 25 1 25 2 25 0 0 0 0 point7 7
Jurupa Ave W of Linden Ave point9 9 410 84 40 4 40 12 40 0 0 0 0 point10 10
Jurupa Ave btwn Linden Ave and Cedar point11 11 520 84 40 4 40 12 40 0 0 0 0 point12 12
Jurupa Ave E of Cedar Ave point13 13 580 84 40 4 40 12 40 0 0 0 0 point14 14
C:\TNM25\Projects\Bloomington W Realco\Ex w Proj Rev 062316 1
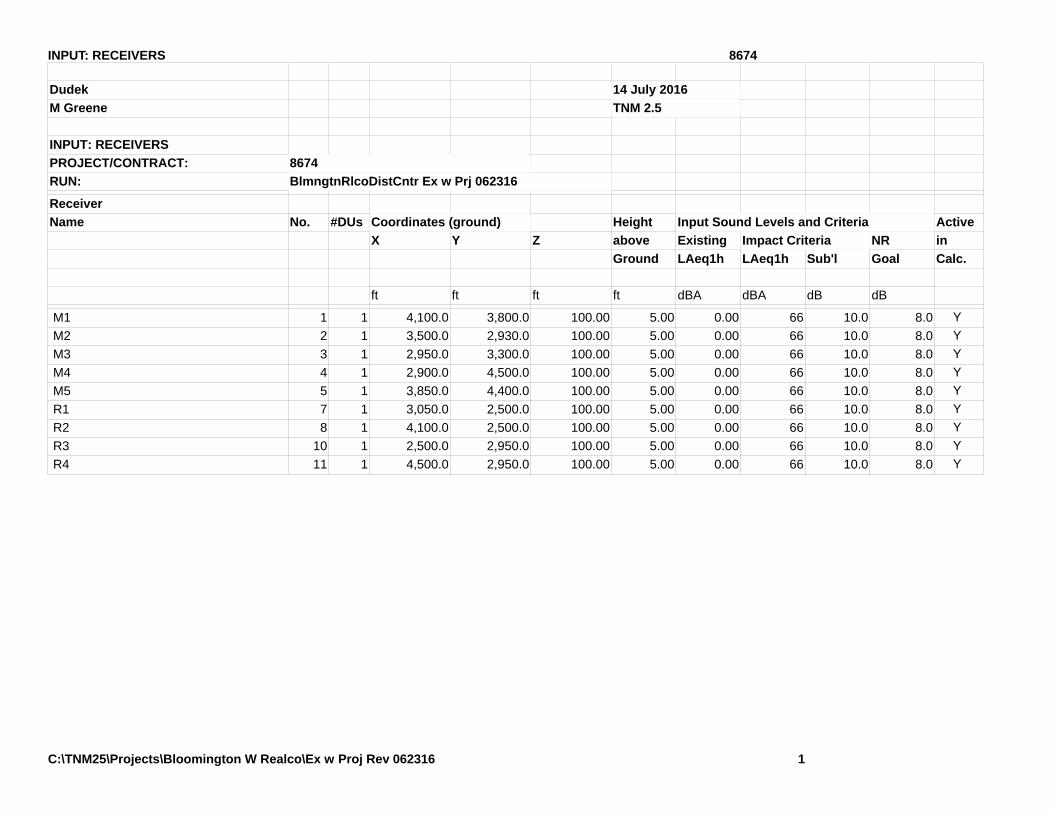
INPUT: RECEIVERS 8674
Dudek 14 July 2016 M Greene TNM 2.5
INPUT: RECEIVERS PROJECT/CONTRACT: 8674 RUN: BlmngtnRlcoDistCntr Ex w Prj 062316
ReceiverName No. #DUs Coordinates (ground) Height Input Sound Levels and Criteria Active
X Y Z above Existing Impact Criteria NR inGround LAeq1h LAeq1h Sub'l Goal Calc.
ft ft ft ft dBA dBA dB dB
M1 1 1 4,100.0 3,800.0 100.00 5.00 0.00 66 10.0 8.0 Y M2 2 1 3,500.0 2,930.0 100.00 5.00 0.00 66 10.0 8.0 Y M3 3 1 2,950.0 3,300.0 100.00 5.00 0.00 66 10.0 8.0 Y M4 4 1 2,900.0 4,500.0 100.00 5.00 0.00 66 10.0 8.0 Y M5 5 1 3,850.0 4,400.0 100.00 5.00 0.00 66 10.0 8.0 Y R1 7 1 3,050.0 2,500.0 100.00 5.00 0.00 66 10.0 8.0 Y R2 8 1 4,100.0 2,500.0 100.00 5.00 0.00 66 10.0 8.0 Y R3 10 1 2,500.0 2,950.0 100.00 5.00 0.00 66 10.0 8.0 Y R4 11 1 4,500.0 2,950.0 100.00 5.00 0.00 66 10.0 8.0 Y
C:\TNM25\Projects\Bloomington W Realco\Ex w Proj Rev 062316 1

RESULTS: SOUND LEVELS 8674
Dudek 14 July 2016 M Greene TNM 2.5
Calculated with TNM 2.5 RESULTS: SOUND LEVELS PROJECT/CONTRACT: 8674 RUN: BlmngtnRlcoDistCntr Ex w Prj 062316 BARRIER DESIGN: INPUT HEIGHTS Average pavement type shall be used unless
a State highway agency substantiates the use ATMOSPHERICS: 68 deg F, 50% RH of a different type with approval of FHWA.
ReceiverName No. #DUs Existing No Barrier With Barrier
LAeq1h LAeq1h Increase over existing Type Calculated Noise ReductionCalculated Crit'n Calculated Crit'n Impact LAeq1h Calculated Goal Calculated
Sub'l Inc minusGoal
dBA dBA dBA dB dB dBA dB dB dB
M1 1 1 0.0 68.8 66 68.8 10 Snd Lvl 68.8 0.0 8 -8.0 M2 2 1 0.0 65.2 66 65.2 10 ---- 65.2 0.0 8 -8.0 M3 3 1 0.0 57.8 66 57.8 10 ---- 57.8 0.0 8 -8.0 M4 4 1 0.0 53.4 66 53.4 10 ---- 53.4 0.0 8 -8.0 M5 5 1 0.0 66.6 66 66.6 10 Snd Lvl 66.6 0.0 8 -8.0 R1 7 1 0.0 56.4 66 56.4 10 ---- 56.4 0.0 8 -8.0 R2 8 1 0.0 68.5 66 68.5 10 Snd Lvl 68.5 0.0 8 -8.0 R3 10 1 0.0 65.3 66 65.3 10 ---- 65.3 0.0 8 -8.0 R4 11 1 0.0 67.1 66 67.1 10 Snd Lvl 67.1 0.0 8 -8.0
Dwelling Units # DUs Noise Reduction Min Avg Max dB dB dB
All Selected 9 0.0 0.0 0.0 All Impacted 4 0.0 0.0 0.0 All that meet NR Goal 0 0.0 0.0 0.0
C:\TNM25\Projects\Bloomington W Realco\Ex w Proj Rev 062316 1 14 Ju

INPUT: ROADWAYS 8674
Dudek 14 July 2016 M Greene TNM 2.5
INPUT: ROADWAYS Average pavement type shall be used unlessPROJECT/CONTRACT: 8674 a State highway agency substantiates the useRUN: BlmngtnRealco Dist Fut wo Prj 062316 of a different type with the approval of FHWA
Roadway PointsName Width Name No. Coordinates (pavement) Flow Control Segment
X Y Z Control Speed Percent Pvmt OnDevice Constraint Vehicles Type Struct?
Affectedft ft ft ft mph %
Cedar Ave N of Jurupa Ave 70.0 point2 2 4,000.0 3,010.0 100.00 Average point1 1 4,000.0 5,000.0 100.00
Cedar Ave S of Jurupa Ave 70.0 point4 4 4,000.0 100.0 100.00 Average point3 3 4,000.0 2,990.0 100.00
Linden Ave N of Jurupa Ave 40.0 point6 6 3,000.0 3,010.0 100.00 Average point5 5 3,000.0 5,000.0 100.00
Linden Ave S of Jurupa Ave 40.0 point8 8 3,000.0 100.0 100.00 Average point7 7 3,000.0 2,990.0 100.00
Jurupa Ave W of Linden Ave 25.0 point9 9 1,000.0 3,000.0 100.00 Average point10 10 3,000.0 3,000.0 100.00
Jurupa Ave btwn Linden Ave and Cedar 25.0 point11 11 3,010.0 3,000.0 100.00 Average point12 12 4,000.0 3,000.0 100.00
Jurupa Ave E of Cedar Ave 25.0 point13 13 4,010.0 3,000.0 100.00 Average point14 14 6,000.0 3,000.0 100.00
C:\TNM25\Projects\Bloomington W Realco\Fut wo Prj Rev 062316 1

INPUT: TRAFFIC FOR LAeq1h Percentages 8674
Dudek 14 July 2016 M Greene TNM 2.5
INPUT: TRAFFIC FOR LAeq1h Percentages PROJECT/CONTRACT: 8674 RUN: BlmngtnRealco Dist Fut wo Prj 062316
Roadway PointsName Name No. Segment
Total Autos MTrucks HTrucks Buses Motorcycles Volume P S P S P S P S P Sveh/hr % mph % mph % mph % mph % mph
Cedar Ave N of Jurupa Ave point2 2 2150 92 45 3 45 5 45 0 0 0 0 point1 1
Cedar Ave S of Jurupa Ave point4 4 2130 92 45 3 45 5 45 0 0 0 0 point3 3
Linden Ave N of Jurupa Ave point6 6 280 97 25 1 25 2 25 0 0 0 0 point5 5
Linden Ave S of Jurupa Ave point8 8 210 97 25 1 25 2 25 0 0 0 0 point7 7
Jurupa Ave W of Linden Ave point9 9 420 84 40 4 40 12 40 0 0 0 0 point10 10
Jurupa Ave btwn Linden Ave and Cedar point11 11 510 84 40 4 40 12 40 0 0 0 0 point12 12
Jurupa Ave E of Cedar Ave point13 13 630 84 40 4 40 12 40 0 0 0 0 point14 14
C:\TNM25\Projects\Bloomington W Realco\Fut wo Prj Rev 062316 1

INPUT: RECEIVERS 8674
Dudek 14 July 2016 M Greene TNM 2.5
INPUT: RECEIVERS PROJECT/CONTRACT: 8674 RUN: BlmngtnRealco Dist Fut wo Prj 062316
ReceiverName No. #DUs Coordinates (ground) Height Input Sound Levels and Criteria Active
X Y Z above Existing Impact Criteria NR inGround LAeq1h LAeq1h Sub'l Goal Calc.
ft ft ft ft dBA dBA dB dB
M1 1 1 4,100.0 3,800.0 100.00 5.00 0.00 66 10.0 8.0 Y M2 2 1 3,500.0 2,930.0 100.00 5.00 0.00 66 10.0 8.0 Y M3 3 1 2,950.0 3,300.0 100.00 5.00 0.00 66 10.0 8.0 Y M4 4 1 2,900.0 4,500.0 100.00 5.00 0.00 66 10.0 8.0 Y M5 5 1 3,850.0 4,400.0 100.00 5.00 0.00 66 10.0 8.0 Y R1 7 1 3,050.0 2,500.0 100.00 5.00 0.00 66 10.0 8.0 Y R2 8 1 4,100.0 2,500.0 100.00 5.00 0.00 66 10.0 8.0 Y R3 10 1 2,500.0 2,950.0 100.00 5.00 0.00 66 10.0 8.0 Y R4 11 1 4,500.0 2,950.0 100.00 5.00 0.00 66 10.0 8.0 Y
C:\TNM25\Projects\Bloomington W Realco\Fut wo Prj Rev 062316 1
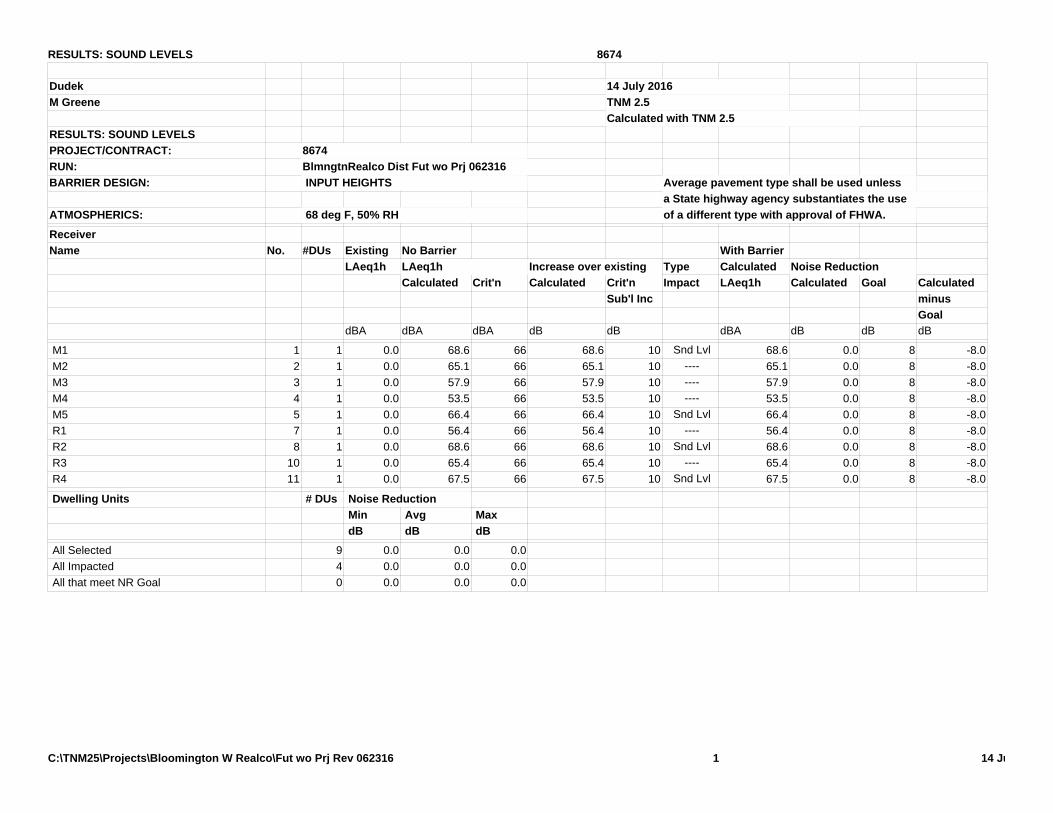
RESULTS: SOUND LEVELS 8674
Dudek 14 July 2016 M Greene TNM 2.5
Calculated with TNM 2.5 RESULTS: SOUND LEVELS PROJECT/CONTRACT: 8674 RUN: BlmngtnRealco Dist Fut wo Prj 062316 BARRIER DESIGN: INPUT HEIGHTS Average pavement type shall be used unless
a State highway agency substantiates the use ATMOSPHERICS: 68 deg F, 50% RH of a different type with approval of FHWA.
ReceiverName No. #DUs Existing No Barrier With Barrier
LAeq1h LAeq1h Increase over existing Type Calculated Noise ReductionCalculated Crit'n Calculated Crit'n Impact LAeq1h Calculated Goal Calculated
Sub'l Inc minusGoal
dBA dBA dBA dB dB dBA dB dB dB
M1 1 1 0.0 68.6 66 68.6 10 Snd Lvl 68.6 0.0 8 -8.0 M2 2 1 0.0 65.1 66 65.1 10 ---- 65.1 0.0 8 -8.0 M3 3 1 0.0 57.9 66 57.9 10 ---- 57.9 0.0 8 -8.0 M4 4 1 0.0 53.5 66 53.5 10 ---- 53.5 0.0 8 -8.0 M5 5 1 0.0 66.4 66 66.4 10 Snd Lvl 66.4 0.0 8 -8.0 R1 7 1 0.0 56.4 66 56.4 10 ---- 56.4 0.0 8 -8.0 R2 8 1 0.0 68.6 66 68.6 10 Snd Lvl 68.6 0.0 8 -8.0 R3 10 1 0.0 65.4 66 65.4 10 ---- 65.4 0.0 8 -8.0 R4 11 1 0.0 67.5 66 67.5 10 Snd Lvl 67.5 0.0 8 -8.0
Dwelling Units # DUs Noise Reduction Min Avg Max dB dB dB
All Selected 9 0.0 0.0 0.0 All Impacted 4 0.0 0.0 0.0 All that meet NR Goal 0 0.0 0.0 0.0
C:\TNM25\Projects\Bloomington W Realco\Fut wo Prj Rev 062316 1 14 Ju
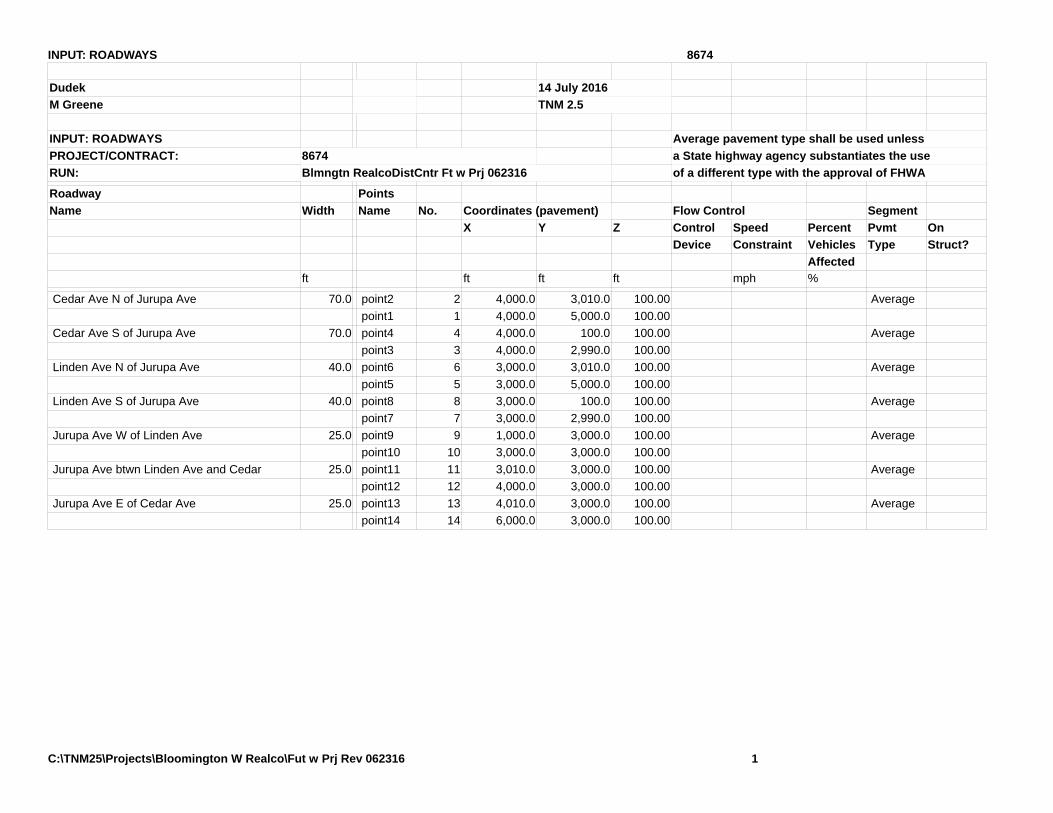
INPUT: ROADWAYS 8674
Dudek 14 July 2016 M Greene TNM 2.5
INPUT: ROADWAYS Average pavement type shall be used unlessPROJECT/CONTRACT: 8674 a State highway agency substantiates the useRUN: Blmngtn RealcoDistCntr Ft w Prj 062316 of a different type with the approval of FHWA
Roadway PointsName Width Name No. Coordinates (pavement) Flow Control Segment
X Y Z Control Speed Percent Pvmt OnDevice Constraint Vehicles Type Struct?
Affectedft ft ft ft mph %
Cedar Ave N of Jurupa Ave 70.0 point2 2 4,000.0 3,010.0 100.00 Average point1 1 4,000.0 5,000.0 100.00
Cedar Ave S of Jurupa Ave 70.0 point4 4 4,000.0 100.0 100.00 Average point3 3 4,000.0 2,990.0 100.00
Linden Ave N of Jurupa Ave 40.0 point6 6 3,000.0 3,010.0 100.00 Average point5 5 3,000.0 5,000.0 100.00
Linden Ave S of Jurupa Ave 40.0 point8 8 3,000.0 100.0 100.00 Average point7 7 3,000.0 2,990.0 100.00
Jurupa Ave W of Linden Ave 25.0 point9 9 1,000.0 3,000.0 100.00 Average point10 10 3,000.0 3,000.0 100.00
Jurupa Ave btwn Linden Ave and Cedar 25.0 point11 11 3,010.0 3,000.0 100.00 Average point12 12 4,000.0 3,000.0 100.00
Jurupa Ave E of Cedar Ave 25.0 point13 13 4,010.0 3,000.0 100.00 Average point14 14 6,000.0 3,000.0 100.00
C:\TNM25\Projects\Bloomington W Realco\Fut w Prj Rev 062316 1

INPUT: TRAFFIC FOR LAeq1h Percentages 8674
Dudek 14 July 2016 M Greene TNM 2.5
INPUT: TRAFFIC FOR LAeq1h Percentages PROJECT/CONTRACT: 8674 RUN: Blmngtn RealcoDistCntr Ft w Prj 062316
Roadway PointsName Name No. Segment
Total Autos MTrucks HTrucks Buses Motorcycles Volume P S P S P S P S P Sveh/hr % mph % mph % mph % mph % mph
Cedar Ave N of Jurupa Ave point2 2 2220 91 45 3 45 6 45 0 0 0 0 point1 1
Cedar Ave S of Jurupa Ave point4 4 2150 92 45 3 45 5 45 0 0 0 0 point3 3
Linden Ave N of Jurupa Ave point6 6 280 97 25 1 25 2 25 0 0 0 0 point5 5
Linden Ave S of Jurupa Ave point8 8 210 97 25 1 25 2 25 0 0 0 0 point7 7
Jurupa Ave W of Linden Ave point9 9 420 84 40 4 40 12 40 0 0 0 0 point10 10
Jurupa Ave btwn Linden Ave and Cedar point11 11 530 84 40 4 40 12 40 0 0 0 0 point12 12
Jurupa Ave E of Cedar Ave point13 13 640 84 40 4 40 12 40 0 0 0 0 point14 14
C:\TNM25\Projects\Bloomington W Realco\Fut w Prj Rev 062316 1
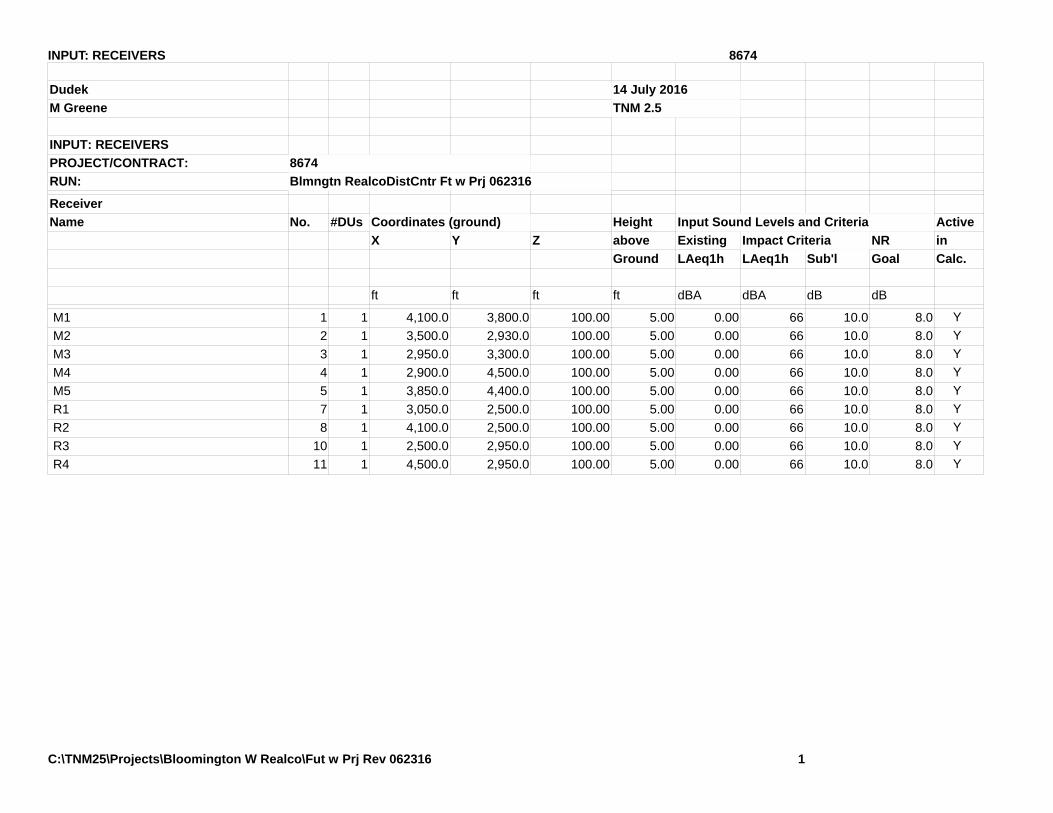
INPUT: RECEIVERS 8674
Dudek 14 July 2016 M Greene TNM 2.5
INPUT: RECEIVERS PROJECT/CONTRACT: 8674 RUN: Blmngtn RealcoDistCntr Ft w Prj 062316
ReceiverName No. #DUs Coordinates (ground) Height Input Sound Levels and Criteria Active
X Y Z above Existing Impact Criteria NR inGround LAeq1h LAeq1h Sub'l Goal Calc.
ft ft ft ft dBA dBA dB dB
M1 1 1 4,100.0 3,800.0 100.00 5.00 0.00 66 10.0 8.0 Y M2 2 1 3,500.0 2,930.0 100.00 5.00 0.00 66 10.0 8.0 Y M3 3 1 2,950.0 3,300.0 100.00 5.00 0.00 66 10.0 8.0 Y M4 4 1 2,900.0 4,500.0 100.00 5.00 0.00 66 10.0 8.0 Y M5 5 1 3,850.0 4,400.0 100.00 5.00 0.00 66 10.0 8.0 Y R1 7 1 3,050.0 2,500.0 100.00 5.00 0.00 66 10.0 8.0 Y R2 8 1 4,100.0 2,500.0 100.00 5.00 0.00 66 10.0 8.0 Y R3 10 1 2,500.0 2,950.0 100.00 5.00 0.00 66 10.0 8.0 Y R4 11 1 4,500.0 2,950.0 100.00 5.00 0.00 66 10.0 8.0 Y
C:\TNM25\Projects\Bloomington W Realco\Fut w Prj Rev 062316 1
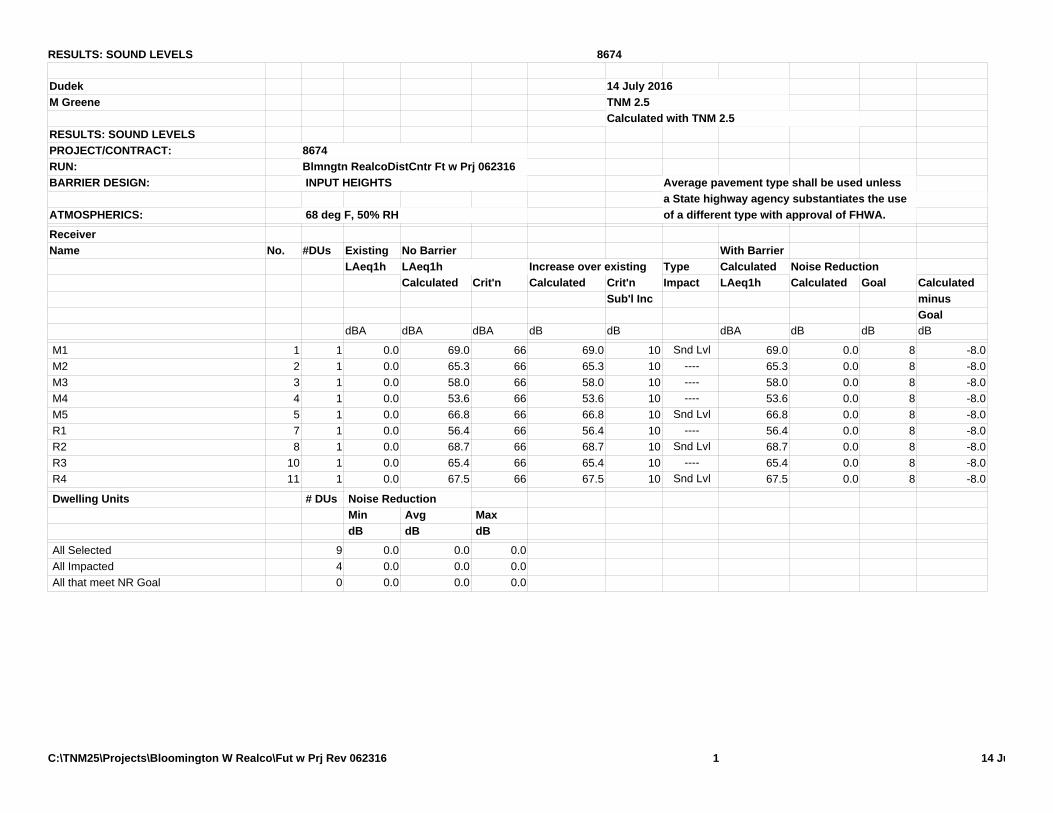
RESULTS: SOUND LEVELS 8674
Dudek 14 July 2016 M Greene TNM 2.5
Calculated with TNM 2.5 RESULTS: SOUND LEVELS PROJECT/CONTRACT: 8674 RUN: Blmngtn RealcoDistCntr Ft w Prj 062316 BARRIER DESIGN: INPUT HEIGHTS Average pavement type shall be used unless
a State highway agency substantiates the use ATMOSPHERICS: 68 deg F, 50% RH of a different type with approval of FHWA.
ReceiverName No. #DUs Existing No Barrier With Barrier
LAeq1h LAeq1h Increase over existing Type Calculated Noise ReductionCalculated Crit'n Calculated Crit'n Impact LAeq1h Calculated Goal Calculated
Sub'l Inc minusGoal
dBA dBA dBA dB dB dBA dB dB dB
M1 1 1 0.0 69.0 66 69.0 10 Snd Lvl 69.0 0.0 8 -8.0 M2 2 1 0.0 65.3 66 65.3 10 ---- 65.3 0.0 8 -8.0 M3 3 1 0.0 58.0 66 58.0 10 ---- 58.0 0.0 8 -8.0 M4 4 1 0.0 53.6 66 53.6 10 ---- 53.6 0.0 8 -8.0 M5 5 1 0.0 66.8 66 66.8 10 Snd Lvl 66.8 0.0 8 -8.0 R1 7 1 0.0 56.4 66 56.4 10 ---- 56.4 0.0 8 -8.0 R2 8 1 0.0 68.7 66 68.7 10 Snd Lvl 68.7 0.0 8 -8.0 R3 10 1 0.0 65.4 66 65.4 10 ---- 65.4 0.0 8 -8.0 R4 11 1 0.0 67.5 66 67.5 10 Snd Lvl 67.5 0.0 8 -8.0
Dwelling Units # DUs Noise Reduction Min Avg Max dB dB dB
All Selected 9 0.0 0.0 0.0 All Impacted 4 0.0 0.0 0.0 All that meet NR Goal 0 0.0 0.0 0.0
C:\TNM25\Projects\Bloomington W Realco\Fut w Prj Rev 062316 1 14 Ju

APPENDIX D
On-Site Noise Modeling Files

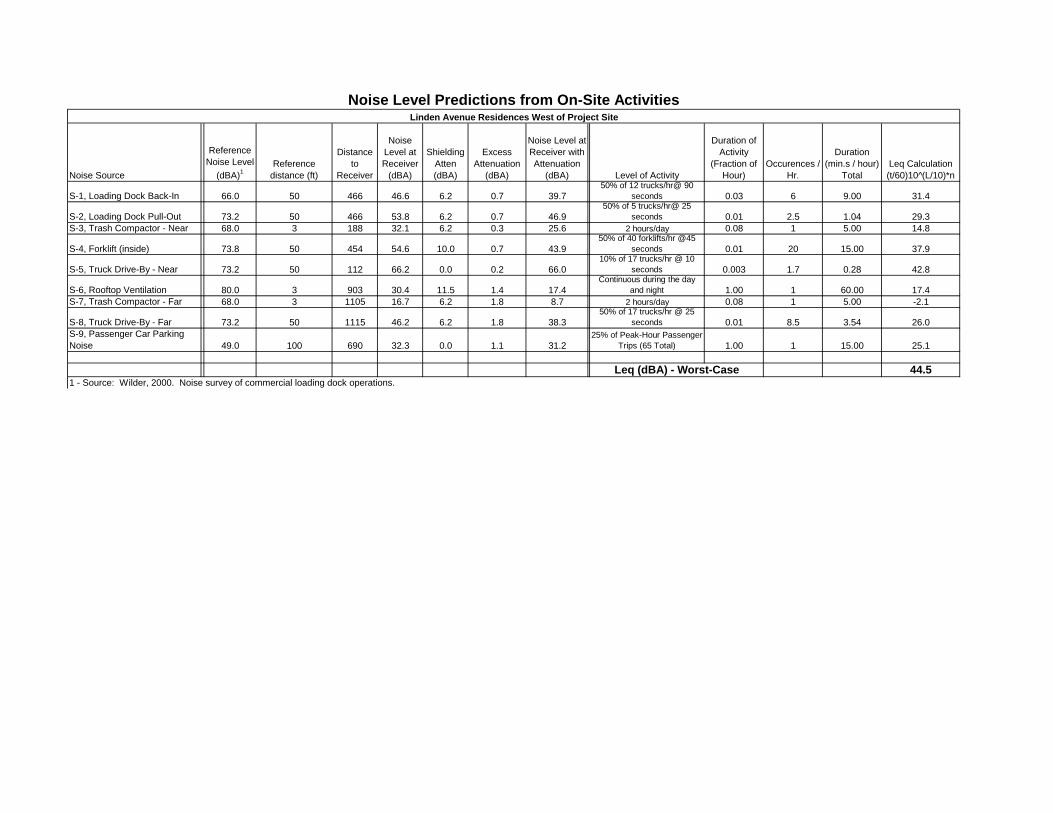
Noise Source
Reference Noise Level
(dBA)1Reference
distance (ft)
Distance to
Receiver
Noise Level at Receiver
(dBA)
Shielding Atten (dBA)
Excess Attenuation
(dBA)
Noise Level at Receiver with Attenuation
(dBA) Level of Activity
Duration of Activity
(Fraction of Hour)
Occurences / Hr.
Duration (min.s / hour)
TotalLeq Calculation (t/60)10 (̂L/10)*n
S-1, Loading Dock Back-In 66.0 50 466 46.6 6.2 0.7 39.750% of 12 trucks/hr@ 90
seconds 0.03 6 9.00 31.4
S-2, Loading Dock Pull-Out 73.2 50 466 53.8 6.2 0.7 46.950% of 5 trucks/hr@ 25
seconds 0.01 2.5 1.04 29.3S-3, Trash Compactor - Near 68.0 3 188 32.1 6.2 0.3 25.6 2 hours/day 0.08 1 5.00 14.8
S-4, Forklift (inside) 73.8 50 454 54.6 10.0 0.7 43.950% of 40 forklifts/hr @45
seconds 0.01 20 15.00 37.9
S-5, Truck Drive-By - Near 73.2 50 112 66.2 0.0 0.2 66.010% of 17 trucks/hr @ 10
seconds 0.003 1.7 0.28 42.8
S-6, Rooftop Ventilation 80.0 3 903 30.4 11.5 1.4 17.4Continuous during the day
and night 1.00 1 60.00 17.4S-7, Trash Compactor - Far 68.0 3 1105 16.7 6.2 1.8 8.7 2 hours/day 0.08 1 5.00 -2.1
S-8, Truck Drive-By - Far 73.2 50 1115 46.2 6.2 1.8 38.350% of 17 trucks/hr @ 25
seconds 0.01 8.5 3.54 26.0S-9, Passenger Car Parking Noise 49.0 100 690 32.3 0.0 1.1 31.2
25% of Peak-Hour Passenger Trips (65 Total) 1.00 1 15.00 25.1
44.5
Noise Level Predictions from On-Site ActivitiesLinden Avenue Residences West of Project Site
Leq (dBA) - Worst-Case1 - Source: Wilder, 2000. Noise survey of commercial loading dock operations.
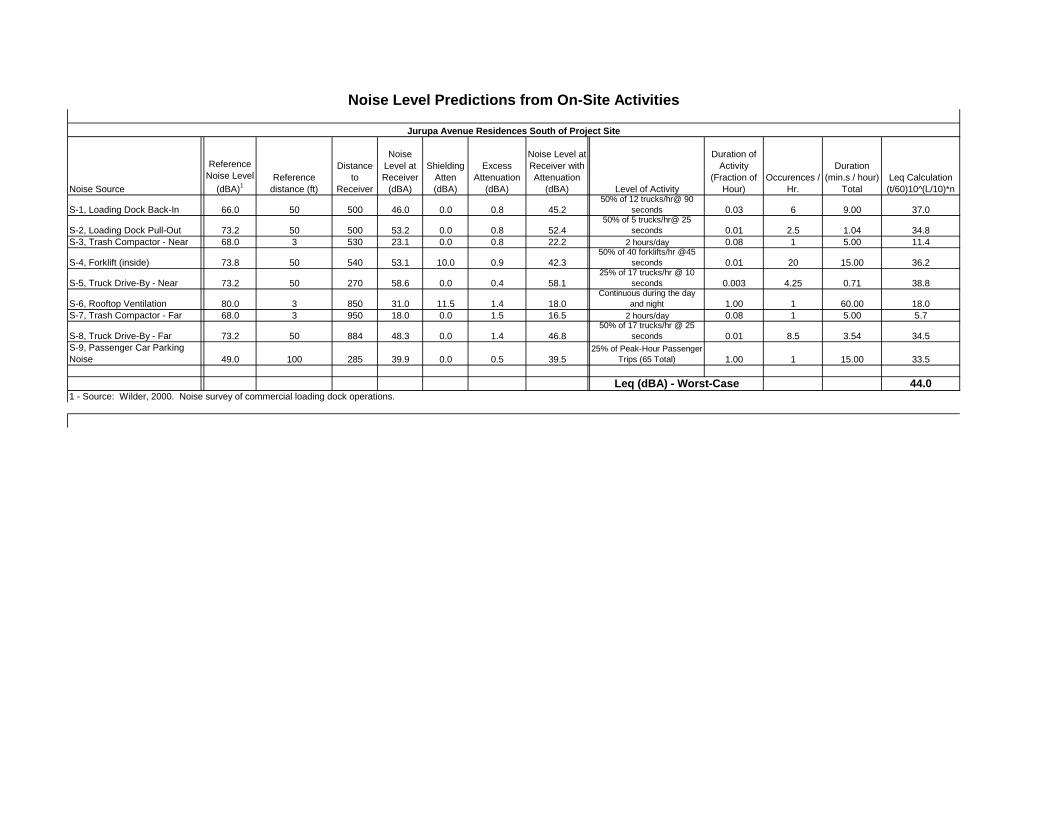
Noise Level Predictions from On-Site Activities
Noise Source
Reference Noise Level
(dBA)1Reference
distance (ft)
Distance to
Receiver
Noise Level at Receiver
(dBA)
Shielding Atten (dBA)
Excess Attenuation
(dBA)
Noise Level at Receiver with Attenuation
(dBA) Level of Activity
Duration of Activity
(Fraction of Hour)
Occurences / Hr.
Duration (min.s / hour)
TotalLeq Calculation (t/60)10 (̂L/10)*n
S-1, Loading Dock Back-In 66.0 50 500 46.0 0.0 0.8 45.250% of 12 trucks/hr@ 90
seconds 0.03 6 9.00 37.0
S-2, Loading Dock Pull-Out 73.2 50 500 53.2 0.0 0.8 52.450% of 5 trucks/hr@ 25
seconds 0.01 2.5 1.04 34.8S-3, Trash Compactor - Near 68.0 3 530 23.1 0.0 0.8 22.2 2 hours/day 0.08 1 5.00 11.4
S-4, Forklift (inside) 73.8 50 540 53.1 10.0 0.9 42.350% of 40 forklifts/hr @45
seconds 0.01 20 15.00 36.2
S-5, Truck Drive-By - Near 73.2 50 270 58.6 0.0 0.4 58.125% of 17 trucks/hr @ 10
seconds 0.003 4.25 0.71 38.8
S-6, Rooftop Ventilation 80.0 3 850 31.0 11.5 1.4 18.0Continuous during the day
and night 1.00 1 60.00 18.0S-7, Trash Compactor - Far 68.0 3 950 18.0 0.0 1.5 16.5 2 hours/day 0.08 1 5.00 5.7
S-8, Truck Drive-By - Far 73.2 50 884 48.3 0.0 1.4 46.850% of 17 trucks/hr @ 25
seconds 0.01 8.5 3.54 34.5S-9, Passenger Car Parking Noise 49.0 100 285 39.9 0.0 0.5 39.5
25% of Peak-Hour Passenger Trips (65 Total) 1.00 1 15.00 33.5
44.0
Jurupa Avenue Residences South of Project Site
Leq (dBA) - Worst-Case1 - Source: Wilder, 2000. Noise survey of commercial loading dock operations.
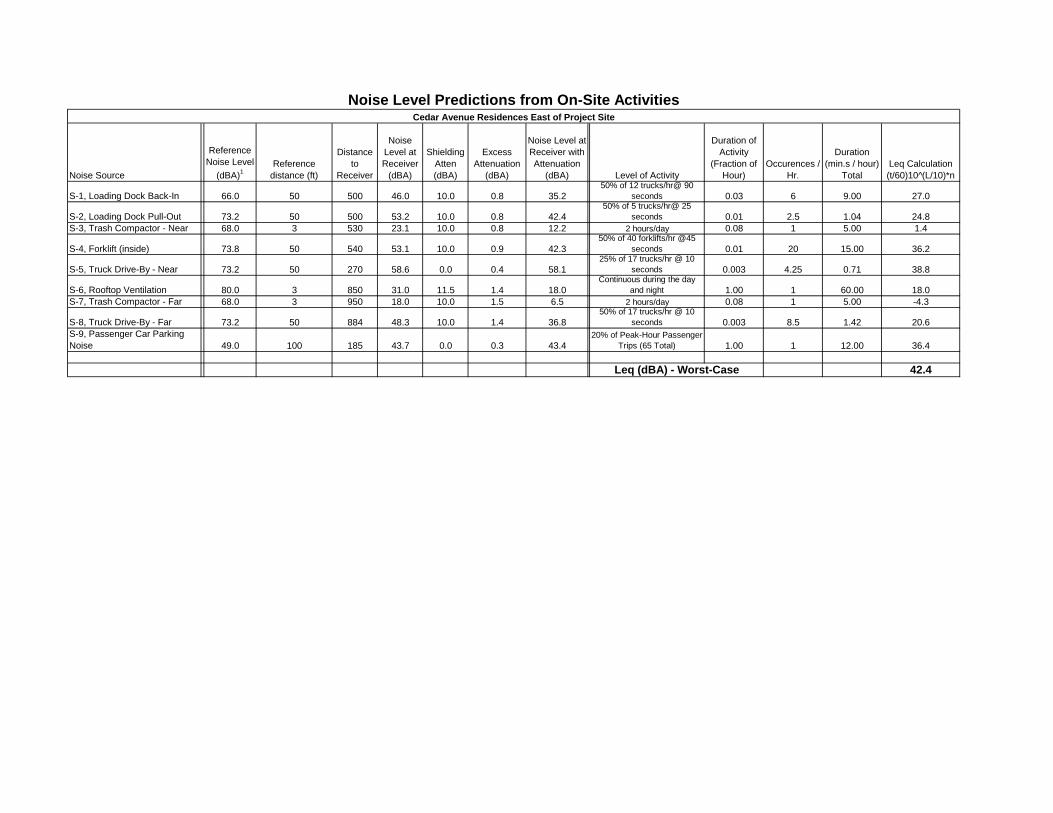
Noise Level Predictions from On-Site Activities
Noise Source
Reference Noise Level
(dBA)1Reference
distance (ft)
Distance to
Receiver
Noise Level at Receiver
(dBA)
Shielding Atten (dBA)
Excess Attenuation
(dBA)
Noise Level at Receiver with Attenuation
(dBA) Level of Activity
Duration of Activity
(Fraction of Hour)
Occurences / Hr.
Duration (min.s / hour)
TotalLeq Calculation (t/60)10 (̂L/10)*n
S-1, Loading Dock Back-In 66.0 50 500 46.0 10.0 0.8 35.250% of 12 trucks/hr@ 90
seconds 0.03 6 9.00 27.0
S-2, Loading Dock Pull-Out 73.2 50 500 53.2 10.0 0.8 42.450% of 5 trucks/hr@ 25
seconds 0.01 2.5 1.04 24.8S-3, Trash Compactor - Near 68.0 3 530 23.1 10.0 0.8 12.2 2 hours/day 0.08 1 5.00 1.4
S-4, Forklift (inside) 73.8 50 540 53.1 10.0 0.9 42.350% of 40 forklifts/hr @45
seconds 0.01 20 15.00 36.2
S-5, Truck Drive-By - Near 73.2 50 270 58.6 0.0 0.4 58.125% of 17 trucks/hr @ 10
seconds 0.003 4.25 0.71 38.8
S-6, Rooftop Ventilation 80.0 3 850 31.0 11.5 1.4 18.0Continuous during the day
and night 1.00 1 60.00 18.0S-7, Trash Compactor - Far 68.0 3 950 18.0 10.0 1.5 6.5 2 hours/day 0.08 1 5.00 -4.3
S-8, Truck Drive-By - Far 73.2 50 884 48.3 10.0 1.4 36.850% of 17 trucks/hr @ 10
seconds 0.003 8.5 1.42 20.6S-9, Passenger Car Parking Noise 49.0 100 185 43.7 0.0 0.3 43.4
20% of Peak-Hour Passenger Trips (65 Total) 1.00 1 12.00 36.4
42.4Leq (dBA) - Worst-Case
Cedar Avenue Residences East of Project Site
Noise Level Predictions from On-Site Activities1 - Source: Wilder, 2000. Noise survey of commercial loading dock operations.
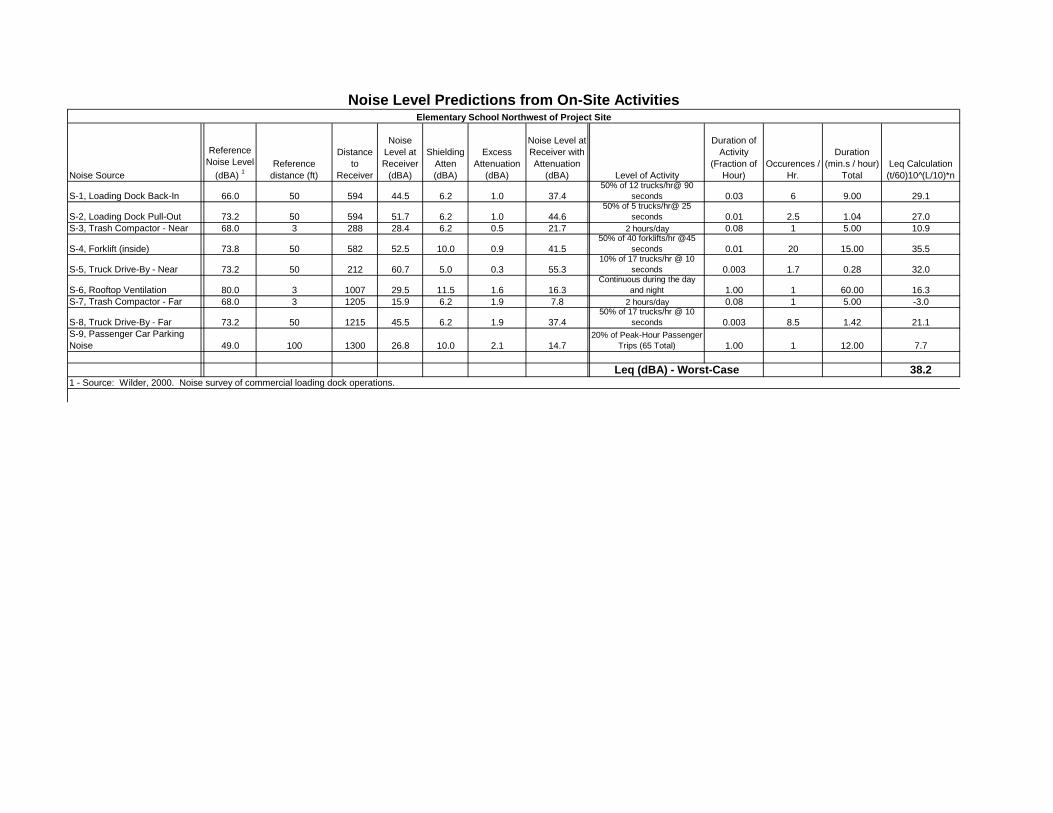
Noise Level Predictions from On-Site Activities
Noise Source
Reference Noise Level
(dBA) 1Reference
distance (ft)
Distance to
Receiver
Noise Level at Receiver
(dBA)
Shielding Atten (dBA)
Excess Attenuation
(dBA)
Noise Level at Receiver with Attenuation
(dBA) Level of Activity
Duration of Activity
(Fraction of Hour)
Occurences / Hr.
Duration (min.s / hour)
TotalLeq Calculation (t/60)10 (̂L/10)*n
S-1, Loading Dock Back-In 66.0 50 594 44.5 6.2 1.0 37.450% of 12 trucks/hr@ 90
seconds 0.03 6 9.00 29.1
S-2, Loading Dock Pull-Out 73.2 50 594 51.7 6.2 1.0 44.650% of 5 trucks/hr@ 25
seconds 0.01 2.5 1.04 27.0S-3, Trash Compactor - Near 68.0 3 288 28.4 6.2 0.5 21.7 2 hours/day 0.08 1 5.00 10.9
S-4, Forklift (inside) 73.8 50 582 52.5 10.0 0.9 41.550% of 40 forklifts/hr @45
seconds 0.01 20 15.00 35.5
S-5, Truck Drive-By - Near 73.2 50 212 60.7 5.0 0.3 55.310% of 17 trucks/hr @ 10
seconds 0.003 1.7 0.28 32.0
S-6, Rooftop Ventilation 80.0 3 1007 29.5 11.5 1.6 16.3Continuous during the day
and night 1.00 1 60.00 16.3S-7, Trash Compactor - Far 68.0 3 1205 15.9 6.2 1.9 7.8 2 hours/day 0.08 1 5.00 -3.0
S-8, Truck Drive-By - Far 73.2 50 1215 45.5 6.2 1.9 37.450% of 17 trucks/hr @ 10
seconds 0.003 8.5 1.42 21.1S-9, Passenger Car Parking Noise 49.0 100 1300 26.8 10.0 2.1 14.7
20% of Peak-Hour Passenger Trips (65 Total) 1.00 1 12.00 7.7
38.2
Elementary School Northwest of Project Site
Leq (dBA) - Worst-Case1 - Source: Wilder, 2000. Noise survey of commercial loading dock operations.

Noise Level Predictions from On-Site Activities
Noise Source
Reference Noise Level
(dBA)1Reference
distance (ft)
Distance to
Receiver
Noise Level at Receiver
(dBA)
Shielding Atten (dBA)
Excess Attenuation
(dBA)
Noise Level at Receiver with Attenuation
(dBA) Level of Activity
Duration of Activity
(Fraction of Hour)
Occurences / Hr.
Duration (min.s / hour)
TotalLeq Calculation (t/60)10 (̂L/10)*n
S-1, Loading Dock Back-In 66.0 50 727 42.7 6.2 1.2 35.450% of 12 trucks/hr@ 90
seconds 0.03 6 9.00 27.2
S-2, Loading Dock Pull-Out 73.2 50 727 49.9 6.2 1.2 42.650% of 5 trucks/hr@ 25
seconds 0.01 2.5 1.04 25.0S-3, Trash Compactor - Near 68.0 3 420 25.1 6.2 0.7 18.2 2 hours/day 0.08 1 5.00 7.4
S-4, Forklift (inside) 73.8 50 704 50.8 10.0 1.1 39.750% of 40 forklifts/hr @45
seconds 0.01 20 15.00 33.7
S-5, Truck Drive-By - Near 73.2 50 336 56.7 5.0 0.5 51.150% of 17 trucks/hr @ 10
seconds 0.003 8.5 1.42 34.8
S-6, Rooftop Ventilation 80.0 3 320 39.4 11.5 0.5 27.4Continuous during the day
and night 1.00 1 60.00 27.4S-7, Trash Compactor - Far 68.0 3 1250 15.6 6.2 2.0 7.4 2 hours/day 0.08 1 5.00 -3.4
S-8, Truck Drive-By - Far 73.2 50 590 51.8 5.0 0.9 45.825% of 17 trucks/hr @ 10
seconds 0.003 4.25 0.71 26.5S-9, Passenger Car Parking Noise 49.0 100 240 41.4 6.2 0.4 34.8
20% of Peak-Hour Passenger Trips (65 Total) 1.00 1 12.00 27.9
38.91 - Source: Wilder, 2000. Noise survey of commercial loading dock operations.
Leq (dBA) - Worst-Case
Church North of Project Site
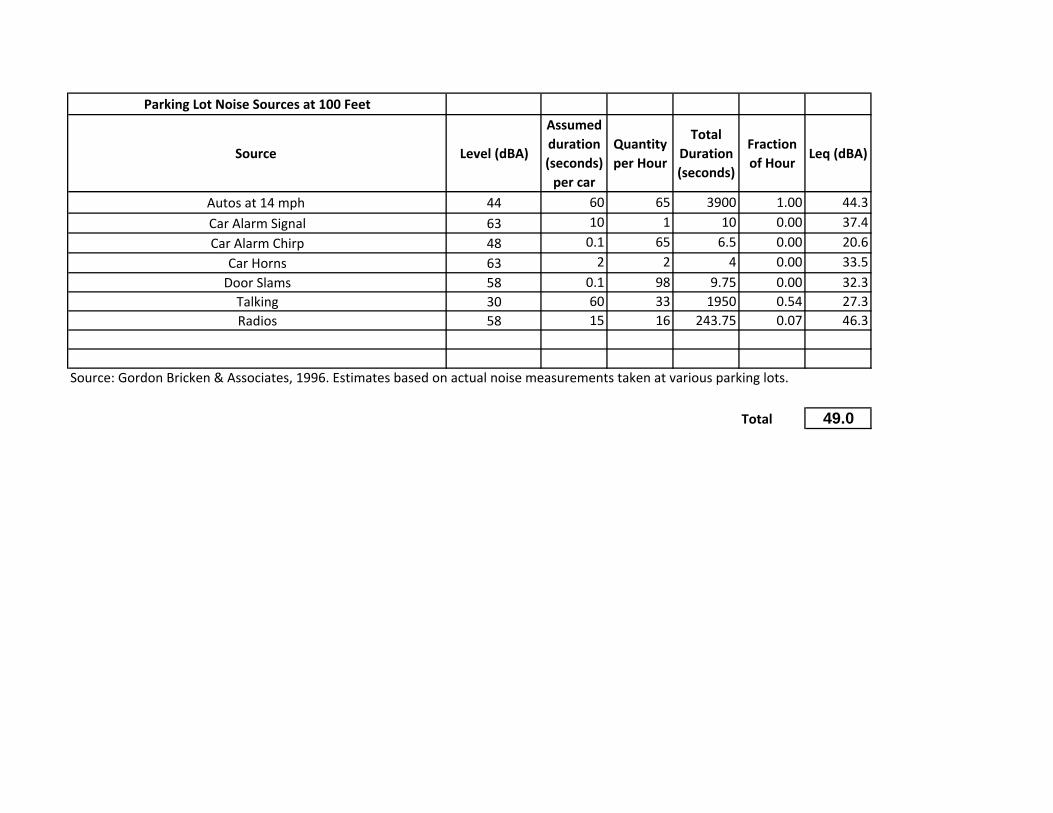
Parking Lot Noise Sources at 100 Feet
Source Level (dBA)
Assumed duration (seconds) per car
Quantity per Hour
Total Duration (seconds)
Fraction of Hour
Leq (dBA)
Autos at 14 mph 44 60 65 3900 1.00 44.3Car Alarm Signal 63 10 1 10 0.00 37.4Car Alarm Chirp 48 0.1 65 6.5 0.00 20.6
Car Horns 63 2 2 4 0.00 33.5Door Slams 58 0.1 98 9.75 0.00 32.3Talking 30 60 33 1950 0.54 27.3Radios 58 15 16 243.75 0.07 46.3
Source: Gordon Bricken & Associates, 1996. Estimates based on actual noise measurements taken at various parking lots.
Total 49.0
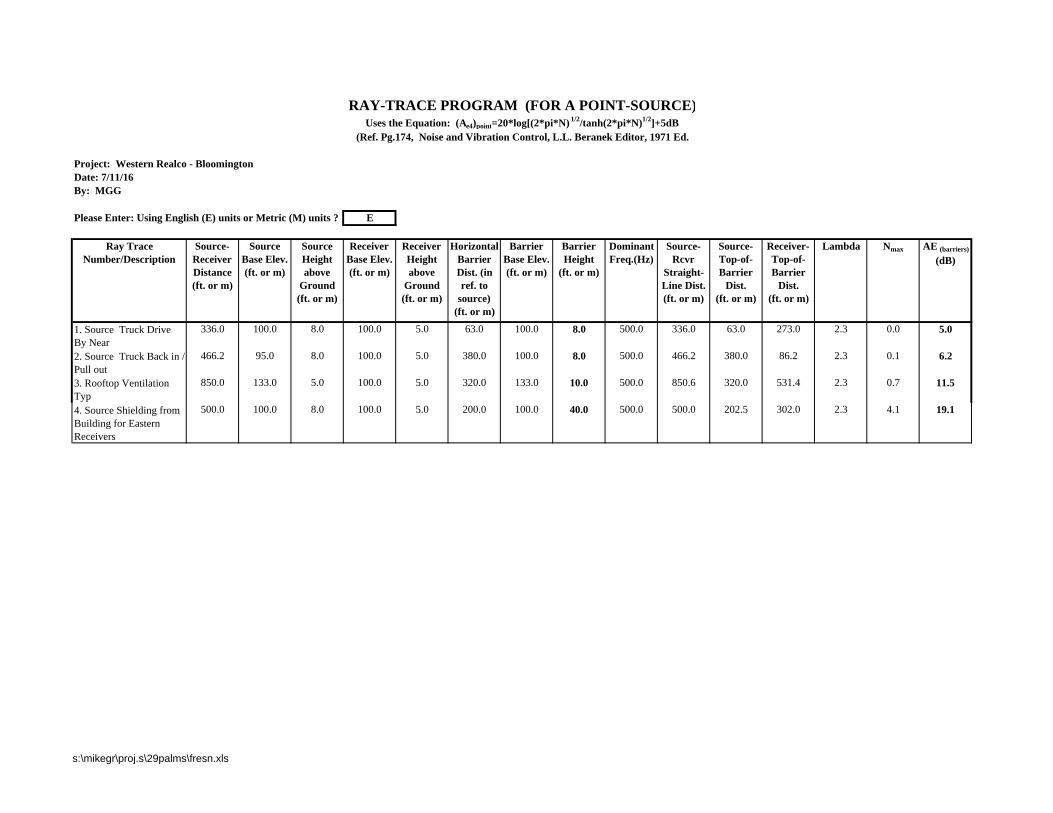
RAY-TRACE PROGRAM (FOR A POINT-SOURCE)Uses the Equation: (Ae4)point=20*log[(2*pi*N) 1/2/tanh(2*pi*N)1/2]+5dB
(Ref. Pg.174, Noise and Vibration Control, L.L. Beranek Editor, 1971 Ed.
Project: Western Realco - BloomingtonDate: 7/11/16By: MGG
Please Enter: Using English (E) units or Metric (M) units ? E
Ray Trace Number/Description
Source-Receiver Distance (ft. or m)
Source Base Elev. (ft. or m)
Source Height above
Ground (ft. or m)
Receiver Base Elev. (ft. or m)
Receiver Height above
Ground (ft. or m)
Horizontal Barrier Dist. (in ref. to
source) (ft. or m)
Barrier Base Elev. (ft. or m)
Barrier Height
(ft. or m)
Dominant Freq.(Hz)
Source-Rcvr
Straight-Line Dist. (ft. or m)
Source-Top-of-Barrier
Dist. (ft. or m)
Receiver-Top-of-Barrier
Dist. (ft. or m)
Lambda Nmax AE (barriers)
(dB)
1. Source Truck Drive By Near
336.0 100.0 8.0 100.0 5.0 63.0 100.0 8.0 500.0 336.0 63.0 273.0 2.3 0.0 5.0
2. Source Truck Back in / Pull out
466.2 95.0 8.0 100.0 5.0 380.0 100.0 8.0 500.0 466.2 380.0 86.2 2.3 0.1 6.2
3. Rooftop Ventilation Typ
850.0 133.0 5.0 100.0 5.0 320.0 133.0 10.0 500.0 850.6 320.0 531.4 2.3 0.7 11.5
4. Source Shielding from Building for Eastern Receivers
500.0 100.0 8.0 100.0 5.0 200.0 100.0 40.0 500.0 500.0 202.5 302.0 2.3 4.1 19.1
s:\mikegr\proj.s\29palms\fresn.xls
APPENDIX E
Resume

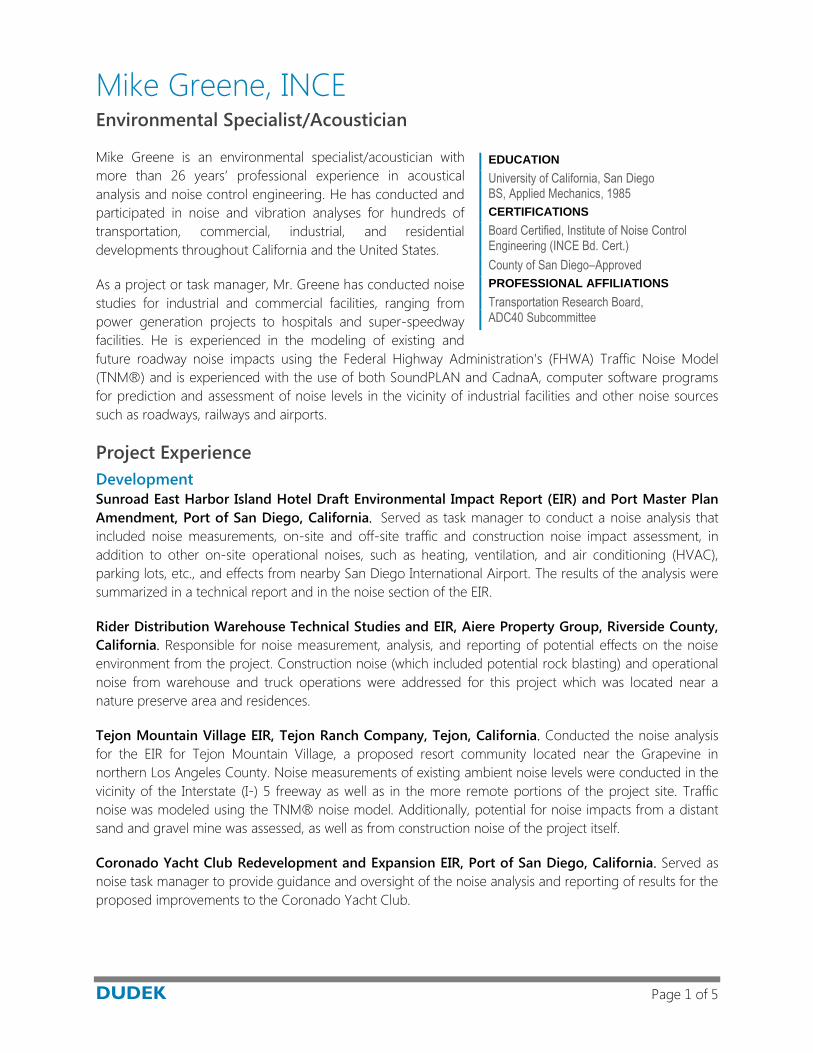
DUDEK Page 1 of 5
EDUCATION
University of California, San Diego BS, Applied Mechanics, 1985
CERTIFICATIONS
Board Certified, Institute of Noise Control Engineering (INCE Bd. Cert.)
County of San Diego–Approved
PROFESSIONAL AFFILIATIONS
Transportation Research Board, ADC40 Subcommittee
Mike Greene, INCE Environmental Specialist/Acoustician
Mike Greene is an environmental specialist/acoustician with
more than 26 years’ professional experience in acoustical
analysis and noise control engineering. He has conducted and
participated in noise and vibration analyses for hundreds of
transportation, commercial, industrial, and residential
developments throughout California and the United States.
As a project or task manager, Mr. Greene has conducted noise
studies for industrial and commercial facilities, ranging from
power generation projects to hospitals and super-speedway
facilities. He is experienced in the modeling of existing and
future roadway noise impacts using the Federal Highway Administration's (FHWA) Traffic Noise Model
(TNM®) and is experienced with the use of both SoundPLAN and CadnaA, computer software programs
for prediction and assessment of noise levels in the vicinity of industrial facilities and other noise sources
such as roadways, railways and airports.
Project Experience
Development
Sunroad East Harbor Island Hotel Draft Environmental Impact Report (EIR) and Port Master Plan
Amendment, Port of San Diego, California. Served as task manager to conduct a noise analysis that
included noise measurements, on-site and off-site traffic and construction noise impact assessment, in
addition to other on-site operational noises, such as heating, ventilation, and air conditioning (HVAC),
parking lots, etc., and effects from nearby San Diego International Airport. The results of the analysis were
summarized in a technical report and in the noise section of the EIR.
Rider Distribution Warehouse Technical Studies and EIR, Aiere Property Group, Riverside County,
California. Responsible for noise measurement, analysis, and reporting of potential effects on the noise
environment from the project. Construction noise (which included potential rock blasting) and operational
noise from warehouse and truck operations were addressed for this project which was located near a
nature preserve area and residences.
Tejon Mountain Village EIR, Tejon Ranch Company, Tejon, California. Conducted the noise analysis
for the EIR for Tejon Mountain Village, a proposed resort community located near the Grapevine in
northern Los Angeles County. Noise measurements of existing ambient noise levels were conducted in the
vicinity of the Interstate (I-) 5 freeway as well as in the more remote portions of the project site. Traffic
noise was modeled using the TNM® noise model. Additionally, potential for noise impacts from a distant
sand and gravel mine was assessed, as well as from construction noise of the project itself.
Coronado Yacht Club Redevelopment and Expansion EIR, Port of San Diego, California. Served as
noise task manager to provide guidance and oversight of the noise analysis and reporting of results for the
proposed improvements to the Coronado Yacht Club.
MIKE GREENE, INCE – CONTINUED
DUDEK Page 2 of 5
San Diego Convention Center EIR, Port of San Diego, California. Served as noise task manager to
provide guidance and oversight of the noise analysis and reporting of results for the proposed expansion
of the San Diego Convention Center. Issues included potential noise effects from construction activities as
well as proposed outdoor events overlooking the harbor and Coronado Island residents.
San Pedro Waterfront EIS (Environmental Impact Statement)/EIR, Port of Los Angeles, California.
As noise task manager, was responsible for the successful completion of the noise analysis. Managed and
supervised the noise measurements, modeling, analysis and results reporting. Primary issues of concern
included potential effects from traffic and construction noise.
Wilmington Waterfront EIR, Port of Los Angeles, California. Responsible for the successful completion
of the noise analysis for this complex project. Conducted and supervised the noise measurements,
modeling, analysis and results reporting, which involved analysis of potential effects from traffic, freight rail,
light rail, industrial and construction noise.
Education
EIR for Campus Master Plan and Student Housing, California State University, Dominguez Hills,
Carson, California. Responsible for the completion of the noise analysis and reporting for the project.
Supervised the noise measurements, modeling, analysis and results reporting, which involved analysis of
potential effects from traffic, on-campus facilities, and operations and construction noise.
Multiple School Projects, Los Angeles Unified School District, California. Noise analyses were
conducted for several proposed school construction projects as part of an on-call environmental consulting
contract for the district. Noise studies were conducted for L.A. Unified School District High Schools 13, 9, and
12. The analyses included noise measurements of ambient conditions and traffic noise impact analysis to
estimate potential noise effects at both existing noise-sensitive land uses and proposed on-site receptors.
Additionally, noise during construction and operation (such as from school athletic fields and stadiums) was
assessed. The results of the noise studies were summarized in noise technical reports.
Energy
Haynes Generating Station Units 3–6 Demolition Project, Los Angeles Department of Water and
Power (LADWP), Long Beach, California. The LADWP proposes to remove the existing Haynes
Generating Station electrical generation Units 3–6 from the Haynes facility site, making space for a
potential future repowering project. The proposed project would include the demolition of the units and
ancillary facilities. Dudek is preparing the noise analysis of potential noise and vibration impacts during the
demolition process, which is anticipated to be a 4-year endeavor.
Scattergood Generating Station Project, LADWP, El Segundo, California. Preparing the noise section
of the EIR for the final phase of the ongoing repower project. In conjunction with this work, Dudek has also
been providing direct support to LADWP staff in evaluating and conducting noise measurements of the
current noise environment, specifically relating to the recent installation of several new units and any
resultant noise increase in the noise levels at adjacent noise-sensitive land uses.
El Segundo Power Redevelopment Project, NRG/Dynegy, El Segundo, California. Conducted the
noise analysis for a proposed 630-megawatt (MW) power plant. Project would replace two aging power
units with a newer, more efficient combined-cycle (combustion turbines and steam turbine) plant.
MIKE GREENE, INCE – CONTINUED
DUDEK Page 3 of 5
Responsible for the preparation of the noise analysis, a section of the project's Application for Certification,
response to comments, and oral and written testimony before the California Energy Commission.
Weymouth Filtration Plant Solar Project, Metropolitan Water District, La Verne, California.
Conducted the noise study for the Initial Study/Mitigated Negative Declaration (IS/MND) for this project.
The primary issue with respect to noise from the project was potential effects at nearby residences and
other land uses from construction activities associated with the proposed project.
Lake Skinner Solar Project, Metropolitan Water District, Riverside County, California. Conducted the
noise study for the IS/MND for this project, located in Riverside County. The primary issue with respect to
noise was potential effects at adjacent residences from construction activities associated with the proposed
project.
OceanWay Secure Energy Project EIS/EIR for Woodside Natural Gas Deepwater Port, Amec Foster
Wheeler, Los Angeles County, California. Responsible for the noise and vibration section of the EIS/EIR
of this proposed liquefied natural gas (LNG) project. The potential noise/vibration effects of onshore
construction and operations were assessed with respect to local, state and federal standards.
Transportation
Meadowpass Road Extension EIR, City of Walnut, California. Responsible for the measurement,
analysis, and reporting. The primary issue for this project with respect to noise was potential effects from
traffic at nearby residences as a result of the construction of the road extension.
1-15 Widening from San Bernardino to 1-215 EIR/EIS, Transportation Commission, County of
Riverside, California. Potential noise increases at adjacent noise-sensitive land uses were addressed
pursuant to the FHWA and California Department of Transportation (Caltrans) guidelines. Noise
measurements were conducted at representative noise-sensitive land uses along the 43.5-mile project
alignment. Noise modeling (TNM® Version 2.5) was conducted in order to assess the changes in future
traffic noise levels resulting from the proposed improvements, to determine existing and future traffic noise
impacts and to provide noise abatement design guidance as needed. The results of the noise study were
summarized in a noise study report and noise abatement decision report pursuant to Caltrans Technical
Noise Supplement (TeNS) and noise protocol guidance.
State Route (SR-) 2 Freeway Terminus IS/Environmental Assessment (EA), Metro, Los Angeles,
California. As part of this joint National Environmental Policy Act (NEPA)/California Environmental Quality
Act (CEQA) document, the project was analyzed at an equal level of detail for the No Action alternative
and all five project alternatives. The analyses were conducted in accordance with guidelines set forth in the
Caltrans Traffic Noise Protocol and TeNS handbooks. The study included noise measurements of ambient
conditions adjacent to the project alignment, traffic noise impact analysis (using TNM® Version 2.5) to
estimate potential noise effects at existing noise-sensitive receptors, and noise during construction. Results
were summarized in a noise study report pursuant to Caltrans TeNS guidance.
Northern Canoga Extension of the Orange Line EIR, Metro, Reseda, California. Project entailed noise
measurements and subsequent noise analysis of Metro bus operations on rubberized asphalt concrete
(RAC) and non-RAC busway pavement to determine the benefit provided by RAC. Because differences in
the noise levels were not expected to be substantial and because of site conditions, the design of the
measurement setups was crucial. Site selection and details of the measurement procedures, including
MIKE GREENE, INCE – CONTINUED
DUDEK Page 4 of 5
coordination of a dedicated test bus and driver, was an important part of the study. Simultaneous
measurements at multiple locations were conducted from approximately 1 a.m. to 4 a.m. to reduce the
influence of background noise. Noise measurement methodology, analysis results, and conclusions were
summarized in a technical memorandum to the client.
Busway and Bus Rapid Transit Projects, Massachusetts Bay Transportation Authority, Boston.
Conducted and participated in noise analyses for Busway and Bus-Rapid Transit (BRT) projects using
Federal Transit Administration (FTA) methodologies and standards. The project involved the construction
of a proposed BRT project in downtown Boston. Analyzed potential noise and vibration impacts at
adjacent sensitive receptors from construction and operation using FTA methodologies. In addition,
worked on similar projects in Portland, Oregon, and near Dallas, Texas.
Water/Wastewater
New Evans Reservoir IS/MND, City of Riverside Public Utilities Department, California. Responsible
for the measurement, analysis, and reporting of noise for this IS/MND. The primary issue for this project
with respect to noise was construction (trenching) along the pipeline alignment adjacent to noisesensitive
land receptors.
Recycled Water System Capital Improvement Project EIR, Otay Water District, Otay Mesa,
California. Responsible for the noise analysis for this ongoing project involving the construction of three
recycled water pipelines by the Otay Water District. The potential effect of noise from construction
activities was the primary issue with regard to noise for this project. Noise levels at adjacent noisesensitive
uses were predicted and compared with relevant thresholds of significance, and mitigation measures were
recommended as necessary to reduce noise to a level below significance.
Publications
Burge, P., Martin, C., Greene, M. 2016. Greene, M. 2011. “Review and Comparison of State-Wide Policies
Across the U.S.” New England Noise-Con 2016. Institute of Noise Control Engineering.
Greene, M. 2015. “Infrasound and Low-Frequency Noise Measurements at a Solar Plant.” Inter-Noise 2015.
Institute of Noise Control Engineering
Greene, M., Hardie, P. 2015. “Rail Crossing Quiet Zones: Life-Cycle of a Project from the Noise
Perspective.” Inter-Noise 2015. Institute of Noise Control Engineering
Greene, M. 2011. “Noise Assessment of an Aquatics Facility in a Residential Area.” Joint Institute of Noise
Control EngineeringITransportation Research Board ADC 40 Annual Summer Conference.
Greene, M. 2011. “Shake, Rattle & Roll Revisited: Results of Two Vibration Measurement Studies Near
Large, Heavily-Traveled Freeways.” Joint Institute of Noise Control Engineering/Transportation
Research Board ADC 40 Annual Summer Conference.
Greene, M. 2009. “Shake, Rattle and Roll: Results of a Vibration Study Near a Large, Heavily-Traveled
Freeway.” Transportation Research Board ADC 40 Annual Summer Conference.
Greene, M. 2008. “Case Study and Lessons Learned: Preliminary Determination of Quiet Zone Benefitted
Area.” Transportation Research Board ADC 40 Annual Summer Conference.
MIKE GREENE, INCE – CONTINUED
DUDEK Page 5 of 5
Greene, M. 2008. “Does Installation of a Traffic Signal Cause Increased Traffic Noise? Pre- and Post-
Installation Noise Measurement Results.” Transportation Research Board ADC 40 Annual Summer
Conference.
Greene, M. 2004. “Multiple Analysis and Measurement Methods to Confirm the Absence of Noise Impacts
from a Power Plant.” Transportation Research Board and the National Conference on Noise
Control Engineering (NOISE-CON 2004).
Greene, M. 2002. “Typical Diurnal Traffic Noise Patterns for a Variety of Roadway Types.” Proceedings of
the 2002 International Congress and Exposition on Noise Control Engineering (Inter-Noise 2002).
Greene, M. 2002. “Comparison of Pile-Driver Noise from Various Pile-Driving Methods and Pile Types.”
Proceedings of the 2002 International Congress and Exposition on Noise Control Engineering
(Inter-Noise 2002).
Greene, M. 2000. “Determination of Insertion Loss for Classrooms at a High School.” Proceedings of the
140th Meeting of the Acoustical Society of America and the National Conference on Noise Control
Engineering (NOISE-CON 2000).
Greene, M. 1997. “Case Study: Noise Analysis of Operations from an Existing Mine at a Nearby Proposed
Residential/Recreational Development.” Proceedings of the 1997 National Conference on Noise
Control Engineering (NOISE-CON 1997).
Greene, M. 1991. “P.C. Based Program for Air Quality Calculations.” Proceedings of the Institute of
Environmental Sciences Technical Meeting.
