appendix - globe
TRANSCRIPT

GLOBE® 2018 Appendix - 1 Atmosphere
Site Definition Sheet
Clouds Data Sheet
Integrated 1-Day Data Sheet
Aerosols Data Sheet
Water Vapor Data Sheet
Digital Multi-Day Min/Max Data Sheet
Surface Temperature Data Sheet
Ozone Data Sheet
Observing Cloud Type
Glossary
Appendix
GLOBE® 2018 Appendix - 2 Atmosphere
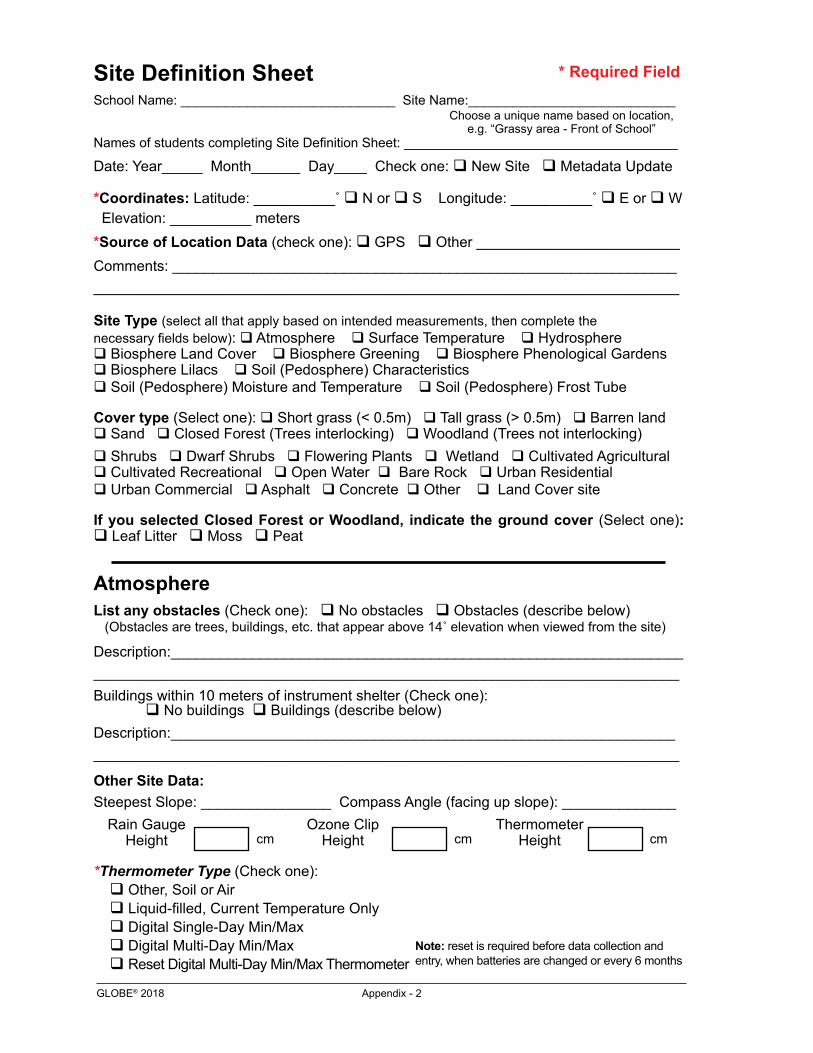
Site Definition SheetSchool Name: _____________________________ Site Name:____________________________
Names of students completing Site Definition Sheet: _____________________________________
Date: Year_____ Month______ Day____ Check one: q New Site q Metadata Update
*Coordinates: Latitude: __________˚ q N or q S Longitude: __________˚ q E or q W Elevation: __________ meters*Source of Location Data (check one): q GPS q Other _________________________Comments: ______________________________________________________________________________________________________________________________________
Site Type (select all that apply based on intended measurements, then complete the necessary fields below): q Atmosphere q Surface Temperature q Hydrosphere q Biosphere Land Cover q Biosphere Greening q Biosphere Phenological Gardens q Biosphere Lilacs q Soil (Pedosphere) Characteristics q Soil (Pedosphere) Moisture and Temperature q Soil (Pedosphere) Frost Tube
Cover type (Select one): q Short grass (< 0.5m) q Tall grass (> 0.5m) q Barren land q Sand q Closed Forest (Trees interlocking) q Woodland (Trees not interlocking) q Shrubs q Dwarf Shrubs q Flowering Plants q Wetland q Cultivated Agricultural q Cultivated Recreational q Open Water q Bare Rock q Urban Residential q Urban Commercial q Asphalt q Concrete q Other q Land Cover site
If you selected Closed Forest or Woodland, indicate the ground cover (Select one): q Leaf Litter q Moss q Peat
AtmosphereList any obstacles (Check one): q No obstacles q Obstacles (describe below) (Obstacles are trees, buildings, etc. that appear above 14˚ elevation when viewed from the site)
Description:_______________________________________________________________________________________________________________________________________Buildings within 10 meters of instrument shelter (Check one): q No buildings q Buildings (describe below) Description:______________________________________________________________________________________________________________________________________
Other Site Data:Steepest Slope: ________________ Compass Angle (facing up slope): ______________
*Thermometer Type (Check one): q Other, Soil or Air q Liquid-filled, Current Temperature Only q Digital Single-Day Min/Max q Digital Multi-Day Min/Max q Reset Digital Multi-Day Min/Max Thermometer
Rain Gauge Height
Ozone Clip Height
Thermometer Heightcm cm cm
* Required Field
Choose a unique name based on location, e.g. “Grassy area - Front of School”
Note: reset is required before data collection and entry, when batteries are changed or every 6 months
GLOBE® 2018 Appendix - 3 Atmosphere
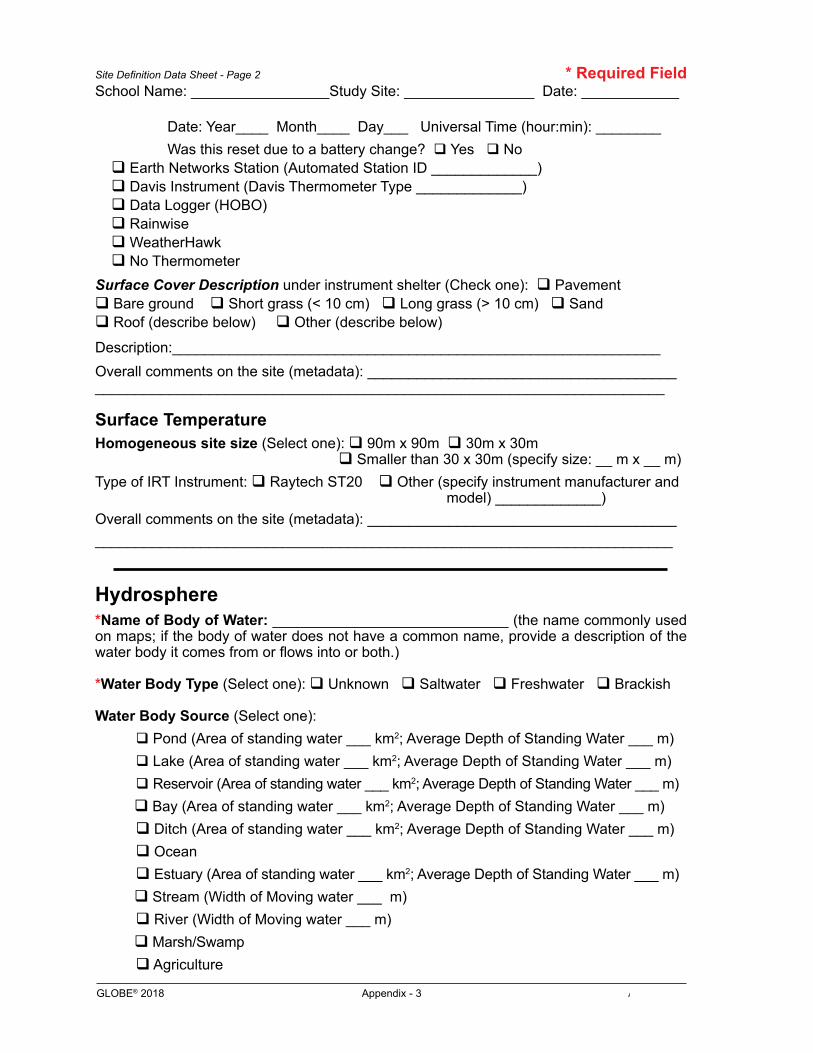
Site Definition Data Sheet - Page 2 * Required FieldSchool Name: _________________Study Site: ________________ Date: ____________
Date: Year____ Month____ Day___ Universal Time (hour:min): ________ Was this reset due to a battery change? q Yes q No q Earth Networks Station (Automated Station ID _____________) q Davis Instrument (Davis Thermometer Type _____________) q Data Logger (HOBO) q Rainwise q WeatherHawk q No Thermometer Surface Cover Description under instrument shelter (Check one): q Pavement q Bare ground q Short grass (< 10 cm) q Long grass (> 10 cm) q Sand q Roof (describe below) q Other (describe below)
Description:____________________________________________________________Overall comments on the site (metadata): ____________________________________________________________________________________________________________
Surface Temperature Homogeneous site size (Select one): q 90m x 90m q 30m x 30m q Smaller than 30 x 30m (specify size: __ m x __ m) Type of IRT Instrument: q Raytech ST20 q Other (specify instrument manufacturer and model) _____________)Overall comments on the site (metadata): _____________________________________________________________________________________________________________
Hydrosphere *Name of Body of Water: _____________________________ (the name commonly used on maps; if the body of water does not have a common name, provide a description of the water body it comes from or flows into or both.)
*Water Body Type (Select one): q Unknown q Saltwater q Freshwater q Brackish
Water Body Source (Select one): q Pond (Area of standing water ___ km2; Average Depth of Standing Water ___ m) q Lake (Area of standing water ___ km2; Average Depth of Standing Water ___ m) q Reservoir (Area of standing water ___ km2; Average Depth of Standing Water ___ m) q Bay (Area of standing water ___ km2; Average Depth of Standing Water ___ m) q Ditch (Area of standing water ___ km2; Average Depth of Standing Water ___ m) q Ocean q Estuary (Area of standing water ___ km2; Average Depth of Standing Water ___ m) q Stream (Width of Moving water ___ m) q River (Width of Moving water ___ m) q Marsh/Swamp q Agriculture

GLOBE® 2018 Appendix - 4 Atmosphere
q Puddles, animal and vehicle tracks q Other (Width of Moving water ___ m; Area of standing water ___ km2; Average Depth of Standing Water __ m) Water Sample Location: q Outlet q Bank q Bridge q Boat q Inlet q Pier Can you see the bottom? q Yes q No Channel/Bank Material: q Soil q Rock q Concrete q Vegetated BankBedrock: q Granite q Limestone q Volcanics q Mixed Sediments q UnknownFreshwater Habitats Present: q Rocky Substrate q Vegetated Banks q Mud Substrate q Sand Substrate q Submersed Vegetation q Logs Saltwater Habitats Present: q Rocky Shore q Sandy Shore q Mud Flats/Estuary
Overall comments on the site (metadata): _______________________________________ ________________________________________________________________________
BiosphereLand CoverMUC Description: Level 1: ___________________ Level 2: ______________________
Level 3: ___________________ Level 4: ______________________*MUC Code: ______ Overall comments on the site (metadata): _______________________________________ ________________________________________________________________________Greening
Are there multiple dominant species? q Yes q No
Primary PlantIs this plant in the understory? q Yes q No Vegetation Type (Select one): q Grass Genus: ________ q Tree Genus: _________ Species: ____________ q Shrub Genus: _________ Species: ___________Label: _________________________
Secondary PlantIs this plant in the understory? q Yes q No Vegetation Type (Select one): q Grass Genus: ________ q Tree Genus: _________ Species: ____________ q Shrub Genus: _________ Species: ___________Label: _________________________Tertiary PlantIs this plant in the understory? q Yes q No
Site Definition Data Sheet - Page 3 * Required Field
Note: Use the MUC Guide to determine the greatest level possible within the MUC system
School Name: _________________Study Site: ________________ Date: ____________
GLOBE® 2018 Appendix - 5 Atmosphere
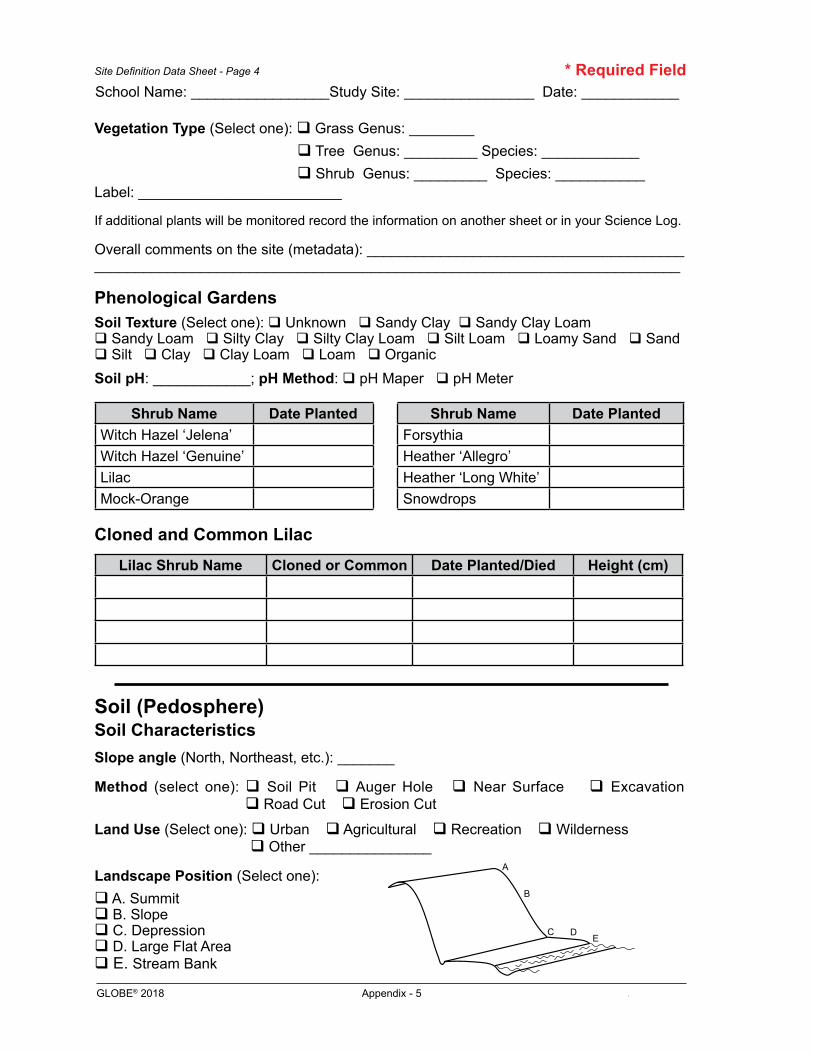
Vegetation Type (Select one): q Grass Genus: ________ q Tree Genus: _________ Species: ____________ q Shrub Genus: _________ Species: ___________Label: _________________________
If additional plants will be monitored record the information on another sheet or in your Science Log.
Overall comments on the site (metadata): _______________________________________ ________________________________________________________________________
Phenological GardensSoil Texture (Select one): q Unknown q Sandy Clay q Sandy Clay Loam q Sandy Loam q Silty Clay q Silty Clay Loam q Silt Loam q Loamy Sand q Sand q Silt q Clay q Clay Loam q Loam q Organic Soil pH: ____________; pH Method: q pH Maper q pH Meter
Shrub Name Date Planted Shrub Name Date PlantedWitch Hazel ‘Jelena’ ForsythiaWitch Hazel ‘Genuine’ Heather ‘Allegro’Lilac Heather ‘Long White’Mock-Orange Snowdrops
Cloned and Common LilacLilac Shrub Name Cloned or Common Date Planted/Died Height (cm)
Soil (Pedosphere) Soil Characteristics Slope angle (North, Northeast, etc.): _______
Method (select one): q Soil Pit q Auger Hole q Near Surface q Excavation q Road Cut q Erosion Cut
Land Use (Select one): q Urban q Agricultural q Recreation q Wilderness q Other _______________
Landscape Position (Select one):q A. Summit q B. Slope q C. Depression q D. Large Flat Area q E. Stream Bank
Site Definition Data Sheet - Page 4 * Required FieldSchool Name: _________________Study Site: ________________ Date: ____________
A
B
C DE
GLOBE® 2018 Appendix - 6 Atmosphere
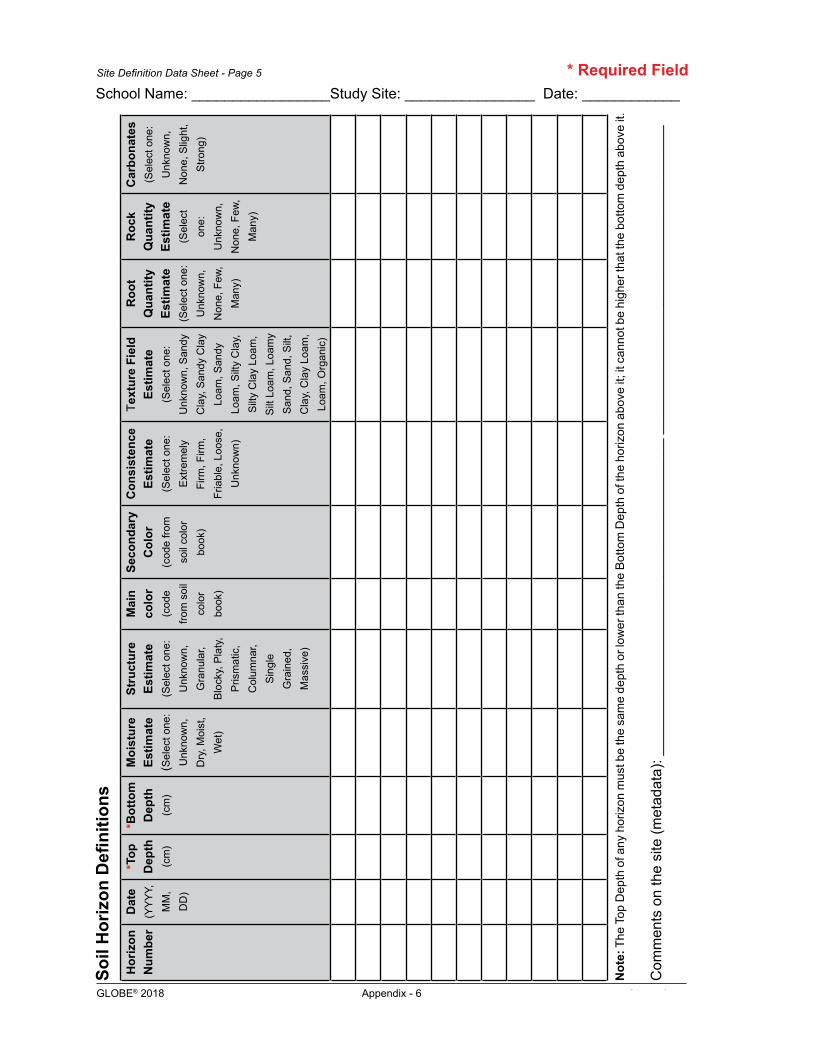
Site Definition Data Sheet - Page 5 * Required Field
Soil
Hor
izon
Defi
nitio
nsH
oriz
on
Num
ber
Dat
e(Y
YY
Y,
MM
, D
D)
*Top
D
epth
(c
m)
*Bot
tom
D
epth
(c
m)
Moi
stur
e Es
timat
e ( S
elec
t one
: U
nkno
wn,
D
ry, M
oist
, W
et)
Stru
ctur
eEs
timat
e(S
elec
t one
: U
nkno
wn,
G
ranu
lar,
Blo
cky,
Pla
ty,
Pris
mat
ic,
Col
umna
r, S
ingl
e
Gra
ined
, M
assi
ve)
Mai
n co
lor
(cod
e fro
m s
oil
colo
r bo
ok)
Seco
ndar
y C
olor
(c
ode
from
so
il co
lor
book
)
Con
sist
ence
Estim
ate
(Sel
ect o
ne:
Ext
rem
ely
Firm
, Firm
, Fr
iabl
e, L
oose
, U
nkno
wn)
Text
ure
Fiel
d Es
timat
e(S
elec
t one
: U
nkno
wn,
San
dy
Cla
y, S
andy
Cla
y Lo
am, S
andy
Lo
am, S
ilty
Cla
y,
Silt
y C
lay
Loam
, S
ilt L
oam
, Loa
my
San
d, S
and,
Silt
, C
lay,
Cla
y Lo
am,
Loam
, Org
anic
)
Roo
tQ
uant
ityEs
timat
e(S
elec
t one
: U
nkno
wn,
N
one,
Few
, M
any)
Roc
kQ
uant
ityEs
timat
e(S
elec
t on
e:
Unk
now
n,
Non
e, F
ew,
Man
y)
Car
bona
tes
(Sel
ect o
ne:
Unk
now
n,
Non
e, S
light
, S
trong
)
Not
e: T
he T
op D
epth
of a
ny h
oriz
on m
ust b
e th
e sa
me
dept
h or
low
er th
an th
e B
otto
m D
epth
of t
he h
oriz
on a
bove
it; i
t can
not b
e hi
gher
that
the
botto
m d
epth
abo
ve it
.
Com
men
ts o
n th
e si
te (m
etad
ata)
: ___
____
____
____
____
____
____
____
____
____
___
____
____
____
____
____
____
____
____
___
School Name: _________________Study Site: ________________ Date: ____________

GLOBE® 2018 Appendix - 7 Atmosphere
Site Definition Data Sheet - Page 6
North South East West
Photo number ________ Photo number ________ Photo number ________ Photo number ________
* Required Field
Parent Material (Select one): q Bedrock q Organic Material q Construction Material q Marine Deposits q Lake Deposits q Stream Deposits (Alluvium) q Wind Deposits (Loess) q Glacial Deposits (Glacial Till) q Volcanic Deposits q Loose Materials on Slope (Colluvium) q Don’t Know q Other ___________
Distance from Major Features: ______
Soil Moisture and Temperature
Surface State (Select one): q Natural q Plowed q Graded q Backfill q Compacted q Other ____________
Canopy Cover (Select one): q Open q Some Trees (within 30m) q Canopy Overhead
Overall comments on the site (metadata): _______________________________________ ________________________________________________________________________
Frost Tube:We recommend you also complete the atmosphere and surface temperature sections.
Date installed: ________________Height above ground (cm): _____ Depth below ground (cm): _____ Total length (cm): ____
Water body within 100m of site: q No qYes (complete below)
Water body type (Select one): q Unknown q Saltwater q Freshwater q Brackish
Direction to closest point of water: q N q NE q E q SE q S q SW q W q NW
Landscape Position (Choose one, see above in Soil Characteristics)
Overall comments on the site (metadata): _______________________________________________________________________________________________________________
Site Photos(record the appropriate photo number for easy identification during data entry)
Overall comments on the site (metadata): _______________________________________ ________________________________________________________________________
School Name: _________________Study Site: ________________ Date: ____________
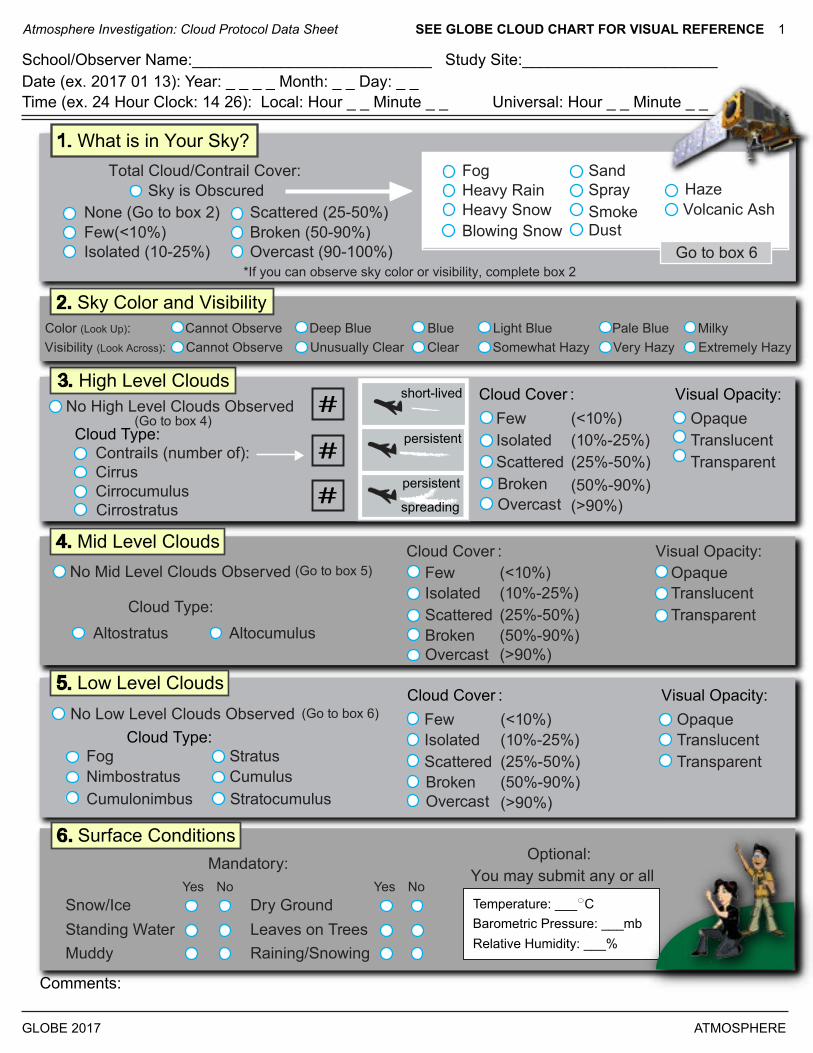
Atmosphere Investigation: Cloud Protocol Data Sheet SEE GLOBE CLOUD CHART FOR VISUAL REFERENCE 1
School/Observer Name:___________________________ Study Site:______________________Date (ex. 2017 01 13): Year: _ _ _ _ Month: _ _ Day: _ _Time (ex. 24 Hour Clock: 14 26): Local: Hour _ _ Minute _ _ Universal: Hour _ _ Minute _ _
Total Cloud/Contrail Cover: FogHeavy RainHeavy SnowBlowing Snow
SandSpraySmokeDust
Volcanic Ash Haze
1. What is in Your Sky?
3. High Level Clouds
Contrails (number of):CirrusCirrocumulus
Cloud Type:FewIsolatedScattered
(<10%)(10%-25%)(25%-50%)(50%-90%)(>90%)
Broken Overcast
Cloud Cover :OpaqueTranslucentTransparent
Visual Opacity:
persistent
short-lived
persistent
spreading
Color (Look Up): Cannot Observe Deep Blue Blue Light Blue Pale Blue Milky Visibility (Look Across): Cannot Observe Unusually Clear Clear Somewhat Hazy Very Hazy Extremely Hazy
Cirrostratus
4. Mid Level Clouds
AltostratusCloud Type:
FewIsolatedScattered
(<10%)(10%-25%)(25%-50%)(50%-90%)(>90%)
Broken Overcast
Cloud Cover :OpaqueTranslucentTransparent
Visual Opacity:
5. Low Level Clouds
FogNimbostratusCumulonimbus
Cloud Type:FewIsolatedScattered
(<10%)(10%-25%)(25%-50%)(50%-90%)(>90%)
Broken Overcast
StratusCumulus
Stratocumulus
Cloud Cover :OpaqueTranslucentTransparent
Visual Opacity:
6. Surface Conditions
Snow/IceStanding WaterMuddy
Dry Ground Leaves on Trees Raining/Snowing
Mandatory: Optional: You may submit any or all
Yes No Yes NoTemperature: ___ C Barometric Pressure: ___mb Relative Humidity: ___%
GLOBE 2017 ATMOSPHERE
2. Sky Color and Visibility
#
#
#
Go to box 6
No High Level Clouds Observed (Go to box 4)
No Mid Level Clouds Observed (Go to box 5)
No Low Level Clouds Observed (Go to box 6)
Comments:
Altocumulus
*If you can observe sky color or visibility, complete box 2
Sky is ObscuredNone (Go to box 2)Few(<10%)Isolated (10-25%)
Scattered (25-50%)Broken (50-90%)Overcast (90-100%)
GLOBE® 2018 Appendix - 9 Atmosphere
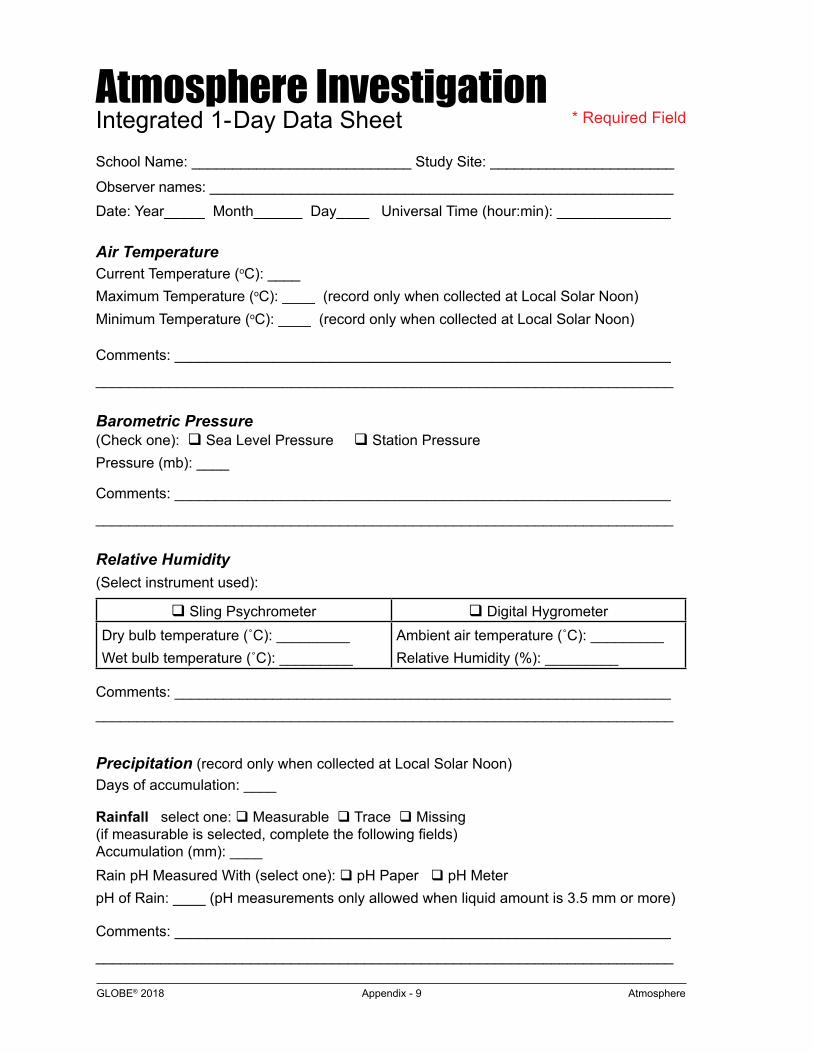
Atmosphere InvestigationIntegrated 1-Day Data Sheet
School Name: ___________________________ Study Site: _______________________
Observer names: _________________________________________________________Date: Year_____ Month______ Day____ Universal Time (hour:min): ______________
Air TemperatureCurrent Temperature (oC): ____ Maximum Temperature (oC): ____ (record only when collected at Local Solar Noon)Minimum Temperature (oC): ____ (record only when collected at Local Solar Noon)
Comments: _____________________________________________________________
_______________________________________________________________________
Barometric Pressure (Check one): q Sea Level Pressure q Station Pressure Pressure (mb): ____
Comments: _____________________________________________________________
_______________________________________________________________________
Relative Humidity(Select instrument used):
q Sling Psychrometer q Digital HygrometerDry bulb temperature (˚C): _________ Wet bulb temperature (˚C): _________
Ambient air temperature (˚C): _________ Relative Humidity (%): _________
Comments: ____________________________________________________________________________________________________________________________________
Precipitation (record only when collected at Local Solar Noon)Days of accumulation: ____
Rainfall select one: q Measurable q Trace q Missing (if measurable is selected, complete the following fields)Accumulation (mm): ____ Rain pH Measured With (select one): q pH Paper q pH MeterpH of Rain: ____ (pH measurements only allowed when liquid amount is 3.5 mm or more)
Comments: _____________________________________________________________
_______________________________________________________________________
* Required Field

GLOBE® 2018 Appendix - 10 Atmosphere
Atmosphere Investigation: Integrated 1-Day Data Sheet - Page 2
Study Site: ___________________ Date: ________________ Time (UT): ____________
New Snowfall
Sample 1 Sample 2 Sample 3Select one: q Measurable q Trace q Missing
Select one: q Measurable q Trace q Missing
Select one: q Measurable q Trace q Missing
If measurable, record amount (mm): ____
If measurable, record amount (mm): ____
If measurable, record amount (mm): ____
Rain Equivalent of New Snow Select one: q Measurable q Trace q Missing If measurable, record amount (mm): ____
Snowfall pH Measured with (select one): q pH Paper q pH Meter pH of New Snowfall: ____ (pH measurements only allowed when liquid amount is 3.5 mm or more)
Comments: _____________________________________________________________
_______________________________________________________________________
Snowpack
Sample 1 Sample 2 Sample 3Select one: q Measurable q Trace q Missing
Select one: q Measurable q Trace q Missing
Select one: q Measurable q Trace q Missing
If measurable, record amount (mm): ____
If measurable, record amount (mm): ____
If measurable, record amount (mm): ____
Rain Equivalent of Snowpack Select one: q Measurable q Trace q Missing If measurable, record amount (mm): ____
Snowpack pH Measured with (select one): q pH Paper q pH Meter Snowpack pH: ____ (pH measurements only allowed when liquid amount is 3.5 mm or more)
Comments: _____________________________________________________________
_______________________________________________________________________
Sky Conditions (next page):
* Required Field
GLOBE® 2018 Appendix - 11 Atmosphere
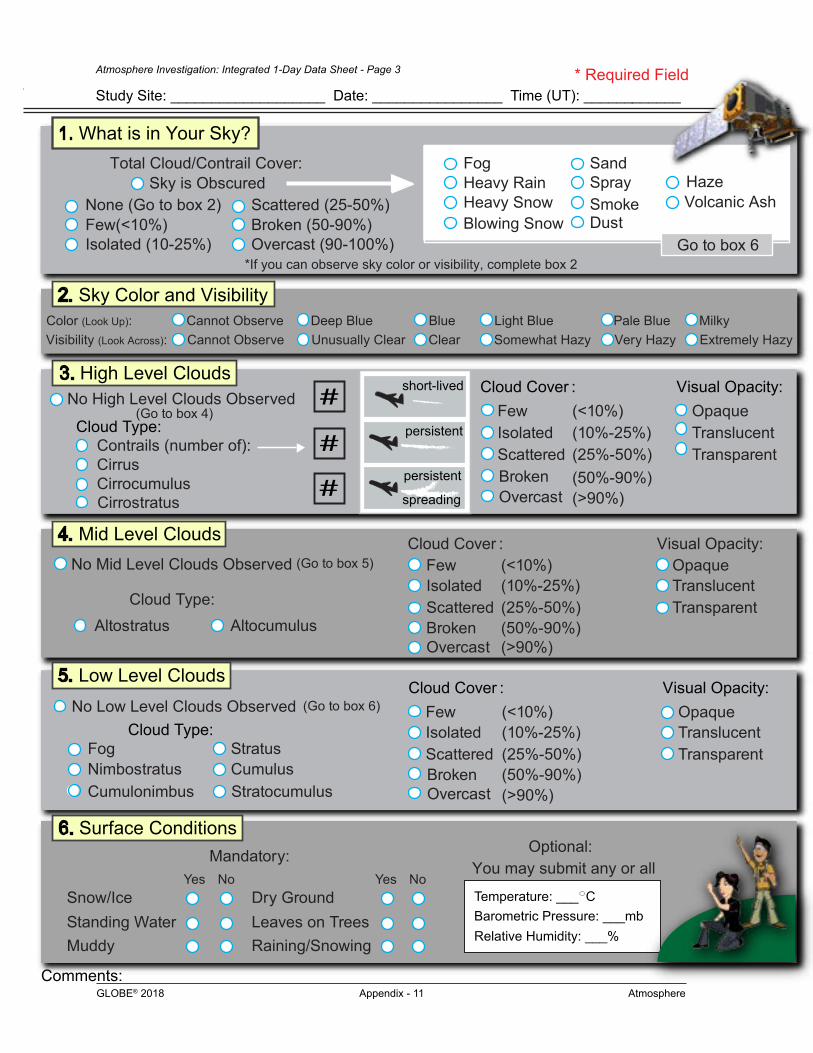
Atmosphere Investigation: Cloud Protocol Data Sheet SEE GLOBE CLOUD CHART FOR VISUAL REFERENCE 1
School/Observer Name:___________________________ Study Site:______________________Date (ex. 2017 01 13): Year: _ _ _ _ Month: _ _ Day: _ _Time (ex. 24 Hour Clock: 14 26): Local: Hour _ _ Minute _ _ Universal: Hour _ _ Minute _ _
Total Cloud/Contrail Cover: FogHeavy RainHeavy SnowBlowing Snow
SandSpraySmokeDust
Volcanic Ash Haze
1. What is in Your Sky?
3. High Level Clouds
Contrails (number of):CirrusCirrocumulus
Cloud Type:FewIsolatedScattered
(<10%)(10%-25%)(25%-50%)(50%-90%)(>90%)
Broken Overcast
Cloud Cover :OpaqueTranslucentTransparent
Visual Opacity:
persistent
short-lived
persistent
spreading
Color (Look Up): Cannot Observe Deep Blue Blue Light Blue Pale Blue Milky Visibility (Look Across): Cannot Observe Unusually Clear Clear Somewhat Hazy Very Hazy Extremely Hazy
Cirrostratus
4. Mid Level Clouds
AltostratusCloud Type:
FewIsolatedScattered
(<10%)(10%-25%)(25%-50%)(50%-90%)(>90%)
Broken Overcast
Cloud Cover :OpaqueTranslucentTransparent
Visual Opacity:
5. Low Level Clouds
FogNimbostratusCumulonimbus
Cloud Type:FewIsolatedScattered
(<10%)(10%-25%)(25%-50%)(50%-90%)(>90%)
Broken Overcast
StratusCumulus
Stratocumulus
Cloud Cover :OpaqueTranslucentTransparent
Visual Opacity:
6. Surface Conditions
Snow/IceStanding WaterMuddy
Dry Ground Leaves on Trees Raining/Snowing
Mandatory: Optional: You may submit any or all
Yes No Yes NoTemperature: ___ C Barometric Pressure: ___mb Relative Humidity: ___%
GLOBE 2017 ATMOSPHERE
2. Sky Color and Visibility
#
#
#
Go to box 6
No High Level Clouds Observed (Go to box 4)
No Mid Level Clouds Observed (Go to box 5)
No Low Level Clouds Observed (Go to box 6)
Comments:
Altocumulus
*If you can observe sky color or visibility, complete box 2
Sky is ObscuredNone (Go to box 2)Few(<10%)Isolated (10-25%)
Scattered (25-50%)Broken (50-90%)Overcast (90-100%)
Atmosphere Investigation: Integrated 1-Day Data Sheet - Page 3
Study Site: ___________________ Date: ________________ Time (UT): ____________* Required Field
GLOBE® 2018 Appendix - 12 AtmosphereGLOBE® 2017 Appendix - 12 Atmosphere
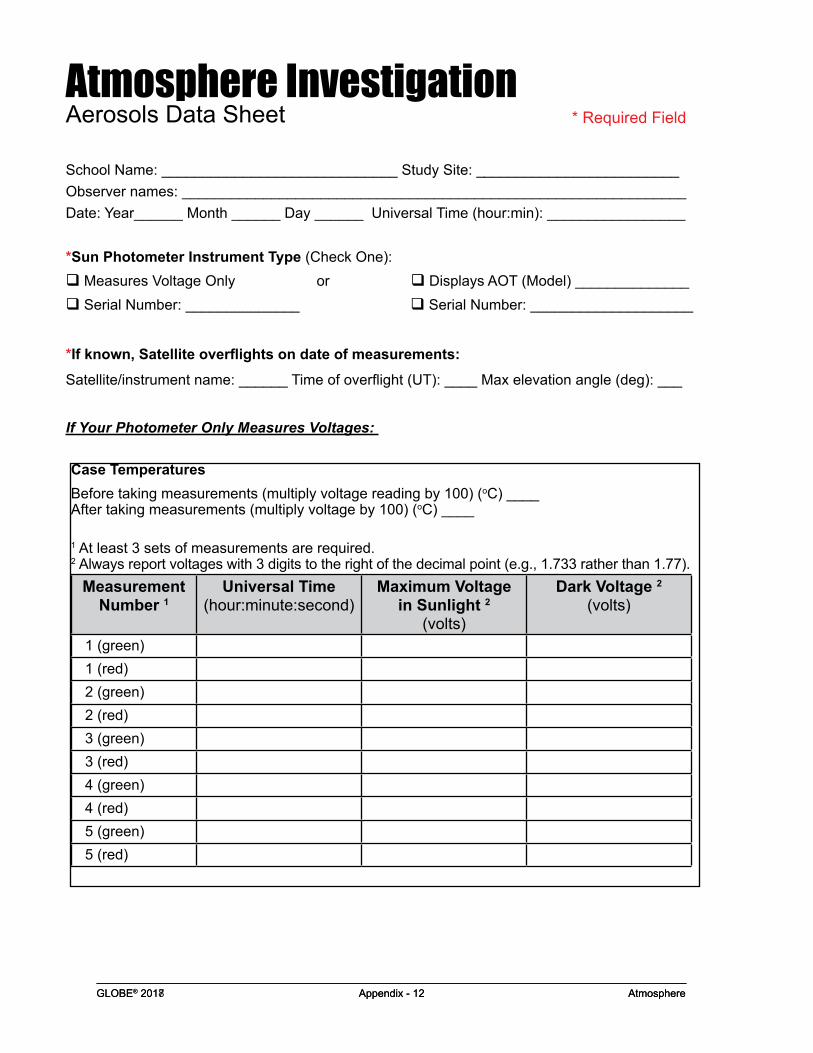
Atmosphere Investigation Aerosols Data Sheet
School Name: _____________________________ Study Site: _________________________Observer names: ______________________________________________________________Date: Year______ Month ______ Day ______ Universal Time (hour:min): _________________
*Sun Photometer Instrument Type (Check One): q Measures Voltage Only or q Displays AOT (Model) ______________q Serial Number: ______________ q Serial Number: ____________________
*If known, Satellite overflights on date of measurements:
Satellite/instrument name: ______ Time of overflight (UT): ____ Max elevation angle (deg): ___
If Your Photometer Only Measures Voltages:
* Required Field
Case Temperatures Before taking measurements (multiply voltage reading by 100) (oC) ____ After taking measurements (multiply voltage by 100) (oC) ____
1 At least 3 sets of measurements are required. 2 Always report voltages with 3 digits to the right of the decimal point (e.g., 1.733 rather than 1.77).
Measurement Number 1
Universal Time (hour:minute:second)
Maximum Voltage in Sunlight 2
(volts)
Dark Voltage 2 (volts)
1 (green) 1 (red) 2 (green) 2 (red) 3 (green) 3 (red) 4 (green) 4 (red) 5 (green) 5 (red)
GLOBE® 2018 Appendix - 13 AtmosphereGLOBE® 2017 Appendix - 13 Atmosphere
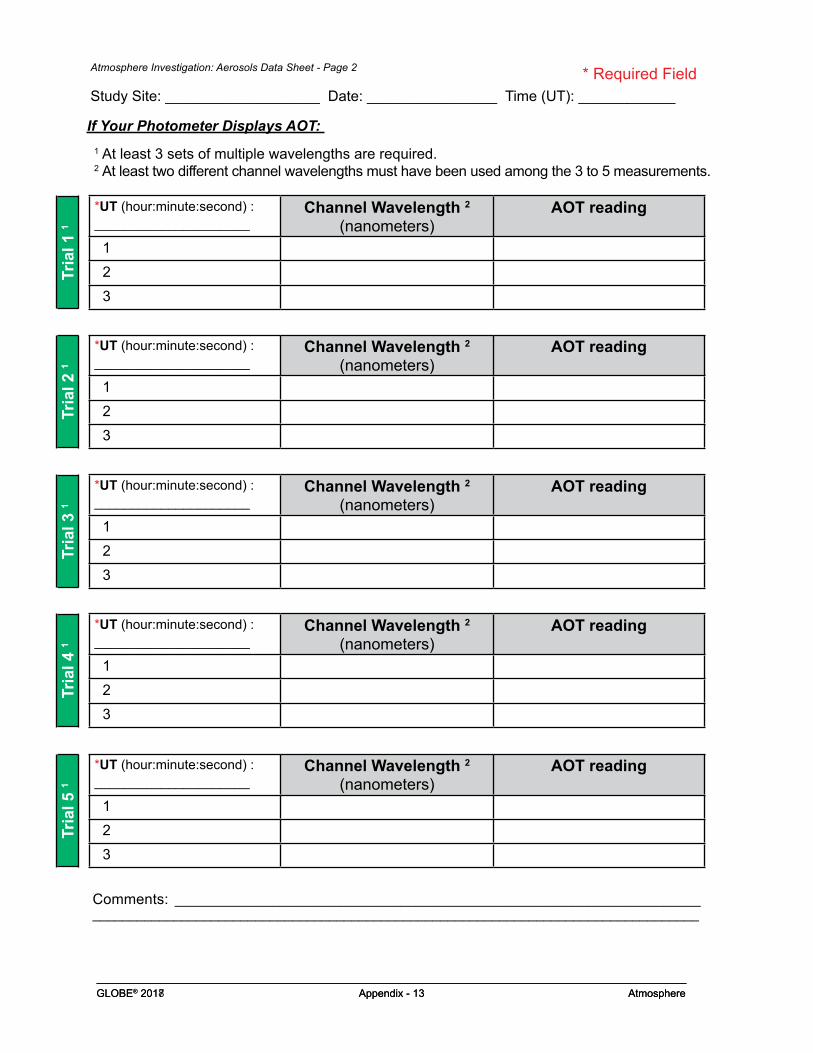
If Your Photometer Displays AOT: 1 At least 3 sets of multiple wavelengths are required. 2 At least two different channel wavelengths must have been used among the 3 to 5 measurements.
*UT (hour:minute:second) : _____________________
Channel Wavelength 2 (nanometers)
AOT reading
1 2 3
*UT (hour:minute:second) : _____________________
Channel Wavelength 2 (nanometers)
AOT reading
1 2 3
*UT (hour:minute:second) : _____________________
Channel Wavelength 2 (nanometers)
AOT reading
1 2 3
*UT (hour:minute:second) : _____________________
Channel Wavelength 2 (nanometers)
AOT reading
1 2 3
*UT (hour:minute:second) : _____________________
Channel Wavelength 2 (nanometers)
AOT reading
1 2 3
Atmosphere Investigation: Aerosols Data Sheet - Page 2
Study Site: ___________________ Date: ________________ Time (UT): ____________* Required Field
Comments: ______________________________________________________________________ __________________________________________________________________________________
Tria
l 1 1
Tria
l 3 1
Tria
l 2 1
Tria
l 4 1
Tria
l 5 1
GLOBE® 2018 Appendix - 14 Atmosphere
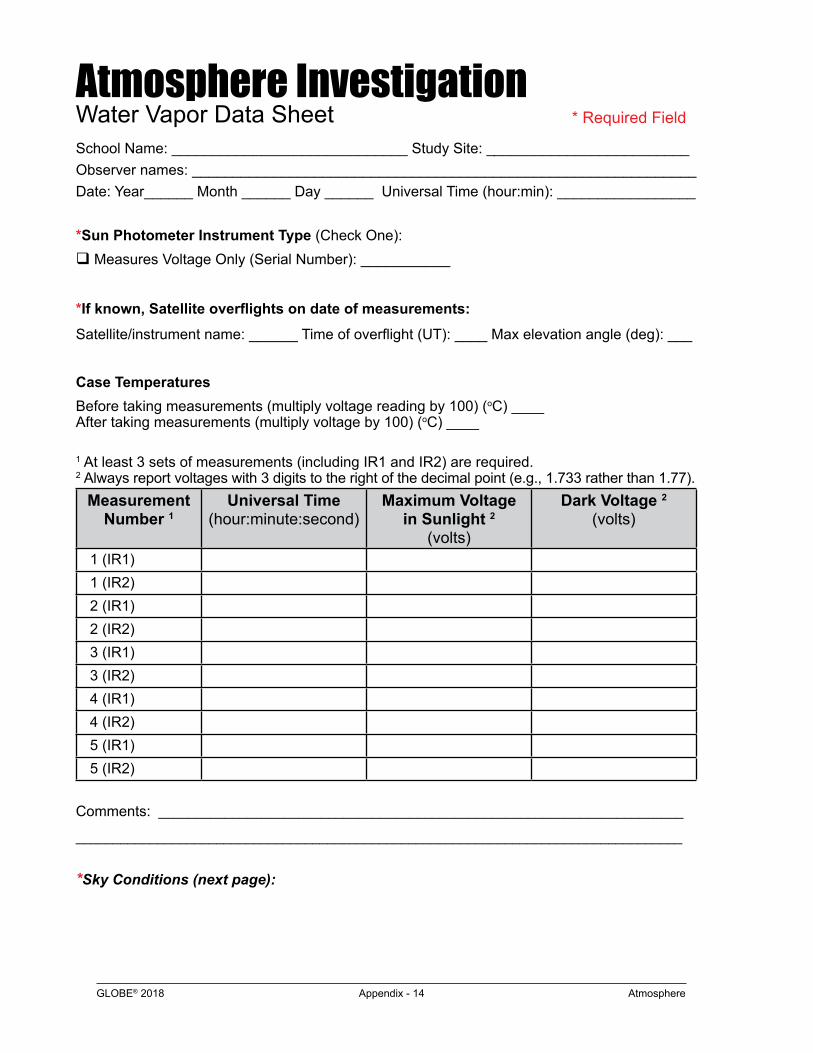
Atmosphere Investigation Water Vapor Data SheetSchool Name: _____________________________ Study Site: _________________________Observer names: ______________________________________________________________Date: Year______ Month ______ Day ______ Universal Time (hour:min): _________________
*Sun Photometer Instrument Type (Check One): q Measures Voltage Only (Serial Number): ___________
*If known, Satellite overflights on date of measurements:
Satellite/instrument name: ______ Time of overflight (UT): ____ Max elevation angle (deg): ___
Case Temperatures Before taking measurements (multiply voltage reading by 100) (oC) ____ After taking measurements (multiply voltage by 100) (oC) ____
1 At least 3 sets of measurements (including IR1 and IR2) are required. 2 Always report voltages with 3 digits to the right of the decimal point (e.g., 1.733 rather than 1.77).
Measurement Number 1
Universal Time (hour:minute:second)
Maximum Voltage in Sunlight 2
(volts)
Dark Voltage 2 (volts)
1 (IR1) 1 (IR2) 2 (IR1) 2 (IR2) 3 (IR1) 3 (IR2) 4 (IR1) 4 (IR2) 5 (IR1) 5 (IR2)
Comments: _______________________________________________________________________
__________________________________________________________________________________
*Sky Conditions (next page):
* Required Field

GLOBE® 2018 Appendix - 15 Atmosphere
Atmosphere Investigation: Cloud Protocol Data Sheet SEE GLOBE CLOUD CHART FOR VISUAL REFERENCE 1
School/Observer Name:___________________________ Study Site:______________________Date (ex. 2017 01 13): Year: _ _ _ _ Month: _ _ Day: _ _Time (ex. 24 Hour Clock: 14 26): Local: Hour _ _ Minute _ _ Universal: Hour _ _ Minute _ _
Total Cloud/Contrail Cover: FogHeavy RainHeavy SnowBlowing Snow
SandSpraySmokeDust
Volcanic Ash Haze
1. What is in Your Sky?
3. High Level Clouds
Contrails (number of):CirrusCirrocumulus
Cloud Type:FewIsolatedScattered
(<10%)(10%-25%)(25%-50%)(50%-90%)(>90%)
Broken Overcast
Cloud Cover :OpaqueTranslucentTransparent
Visual Opacity:
persistent
short-lived
persistent
spreading
Color (Look Up): Cannot Observe Deep Blue Blue Light Blue Pale Blue Milky Visibility (Look Across): Cannot Observe Unusually Clear Clear Somewhat Hazy Very Hazy Extremely Hazy
Cirrostratus
4. Mid Level Clouds
AltostratusCloud Type:
FewIsolatedScattered
(<10%)(10%-25%)(25%-50%)(50%-90%)(>90%)
Broken Overcast
Cloud Cover :OpaqueTranslucentTransparent
Visual Opacity:
5. Low Level Clouds
FogNimbostratusCumulonimbus
Cloud Type:FewIsolatedScattered
(<10%)(10%-25%)(25%-50%)(50%-90%)(>90%)
Broken Overcast
StratusCumulus
Stratocumulus
Cloud Cover :OpaqueTranslucentTransparent
Visual Opacity:
6. Surface Conditions
Snow/IceStanding WaterMuddy
Dry Ground Leaves on Trees Raining/Snowing
Mandatory: Optional: You may submit any or all
Yes No Yes NoTemperature: ___ C Barometric Pressure: ___mb Relative Humidity: ___%
GLOBE 2017 ATMOSPHERE
2. Sky Color and Visibility
#
#
#
Go to box 6
No High Level Clouds Observed (Go to box 4)
No Mid Level Clouds Observed (Go to box 5)
No Low Level Clouds Observed (Go to box 6)
Comments:
Altocumulus
*If you can observe sky color or visibility, complete box 2
Sky is ObscuredNone (Go to box 2)Few(<10%)Isolated (10-25%)
Scattered (25-50%)Broken (50-90%)Overcast (90-100%)
Atmosphere Investigation: Water Vapor Data Sheet - Page 2
Study Site: ___________________ Date: ________________ Time (UT): ____________* Required Field

GLOBE® 2018 Appendix - 16 Atmosphere
Atmosphere Investigation: Water Vapor Data Sheet - Page 3
Study Site: ___________________ Date: ________________ Time (UT): ____________
Comments: _______________________________________________________________
_________________________________________________________________________
Air TemperatureCurrent Temperature (˚C): ____
Comments: _______________________________________________________________
_________________________________________________________________________
Relative Humidity(Select instrument used):
q Sling Psychrometer q Digital HygrometerDry bulb temperature (˚C): _________ Wet bulb temperature (˚C): _________
Ambient air temperature (˚C): _________ Relative Humidity (%): _________
Comments: ____________________________________________________________________________________________________________________________________
*Barometric Pressure (Check one): q Sea Level Pressure q Station Pressure Pressure (mb): ____
Comments: _____________________________________________________________
_______________________________________________________________________
* Required Field
GLOBE® 2018 Appendix - 17 Atmosphere
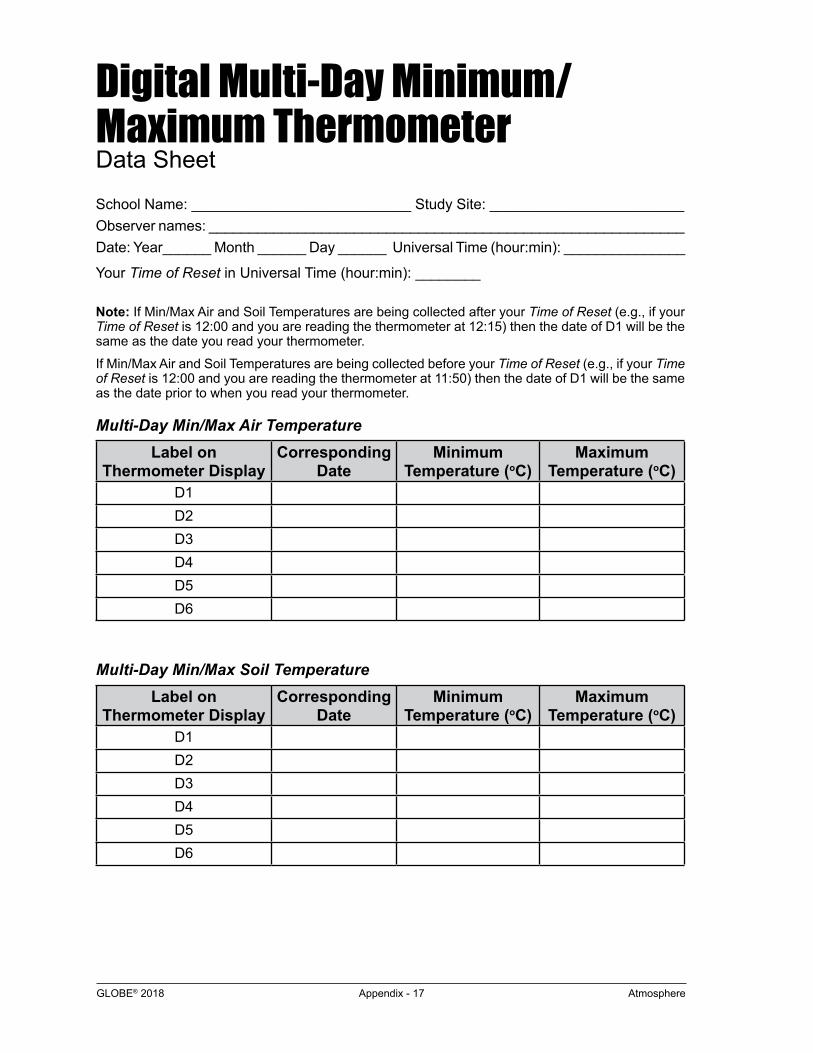
Digital Multi-Day Minimum/Maximum Thermometer Data Sheet
School Name: ___________________________ Study Site: ________________________Observer names: ___________________________________________________________Date: Year______ Month ______ Day ______ Universal Time (hour:min): _______________
Your Time of Reset in Universal Time (hour:min): ________
Note: If Min/Max Air and Soil Temperatures are being collected after your Time of Reset (e.g., if your Time of Reset is 12:00 and you are reading the thermometer at 12:15) then the date of D1 will be the same as the date you read your thermometer.
If Min/Max Air and Soil Temperatures are being collected before your Time of Reset (e.g., if your Time of Reset is 12:00 and you are reading the thermometer at 11:50) then the date of D1 will be the same as the date prior to when you read your thermometer.
Multi-Day Min/Max Air TemperatureLabel on
Thermometer DisplayCorresponding
DateMinimum
Temperature (oC)Maximum
Temperature (oC)D1D2D3D4D5D6
Multi-Day Min/Max Soil Temperature Label on
Thermometer DisplayCorresponding
DateMinimum
Temperature (oC)Maximum
Temperature (oC)D1D2D3D4D5D6
GLOBE® 2018 Appendix - 18 Atmosphere
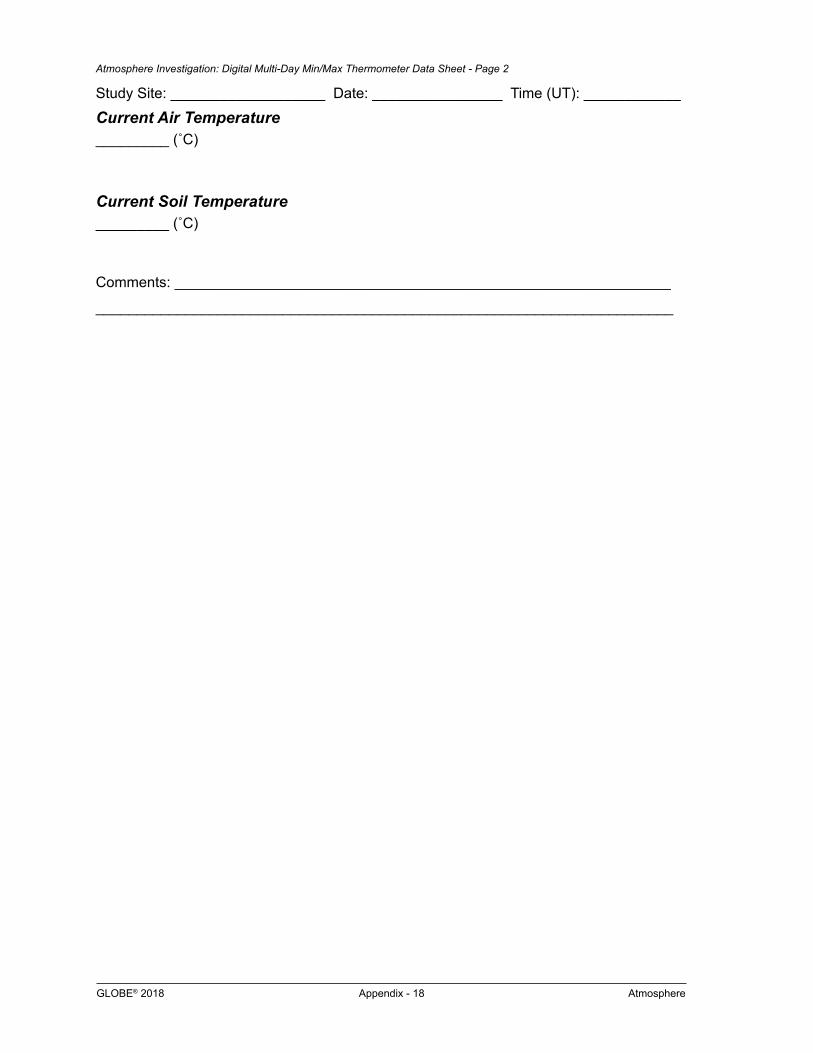
Current Air Temperature_________ (˚C)
Current Soil Temperature_________ (˚C)
Comments: _____________________________________________________________
_______________________________________________________________________
Atmosphere Investigation: Digital Multi-Day Min/Max Thermometer Data Sheet - Page 2
Study Site: ___________________ Date: ________________ Time (UT): ____________
GLOBE® 2018 Appendix - 19 Atmosphere
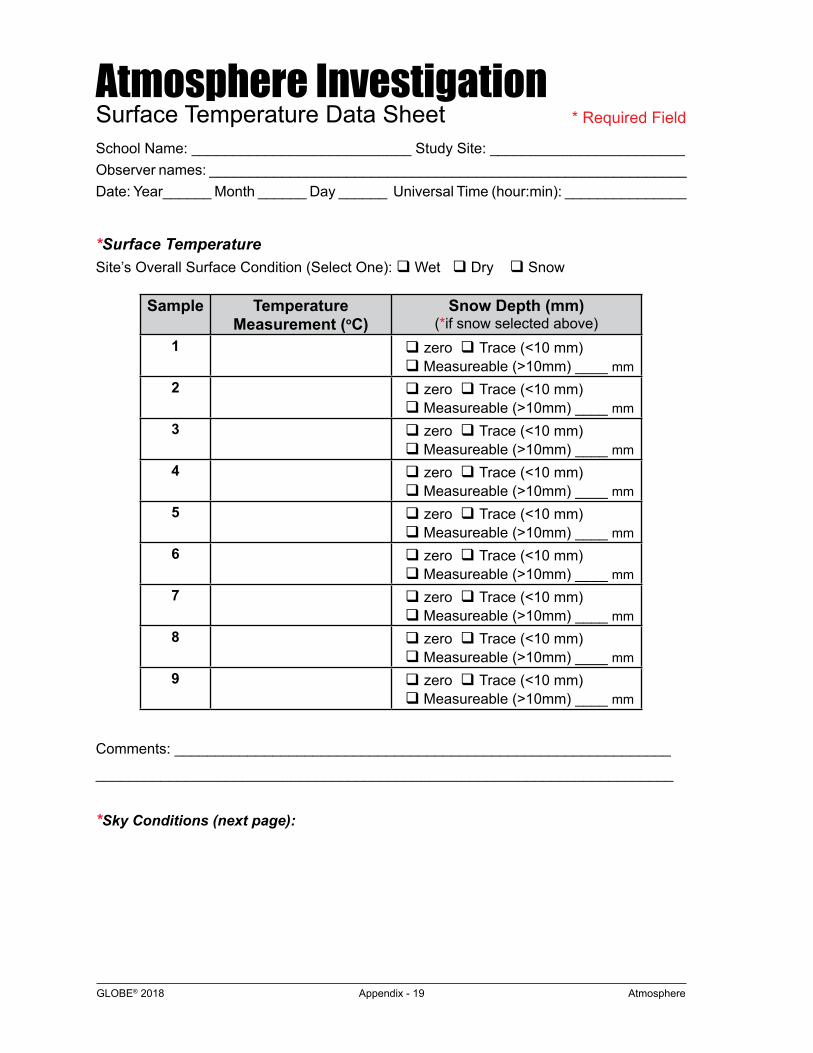
Atmosphere Investigation Surface Temperature Data SheetSchool Name: ___________________________ Study Site: ________________________Observer names: ___________________________________________________________Date: Year______ Month ______ Day ______ Universal Time (hour:min): _______________
*Surface TemperatureSite’s Overall Surface Condition (Select One): q Wet q Dry q Snow
Sample Temperature Measurement (oC)
Snow Depth (mm)(*if snow selected above)
1 q zero q Trace (<10 mm) q Measureable (>10mm) ____ mm
2 q zero q Trace (<10 mm) q Measureable (>10mm) ____ mm
3 q zero q Trace (<10 mm) q Measureable (>10mm) ____ mm
4 q zero q Trace (<10 mm) q Measureable (>10mm) ____ mm
5 q zero q Trace (<10 mm) q Measureable (>10mm) ____ mm
6 q zero q Trace (<10 mm) q Measureable (>10mm) ____ mm
7 q zero q Trace (<10 mm) q Measureable (>10mm) ____ mm
8 q zero q Trace (<10 mm) q Measureable (>10mm) ____ mm
9 q zero q Trace (<10 mm) q Measureable (>10mm) ____ mm
Comments: _____________________________________________________________
_______________________________________________________________________
*Sky Conditions (next page):
* Required Field

GLOBE® 2018 Appendix - 20 Atmosphere
Atmosphere Investigation: Cloud Protocol Data Sheet SEE GLOBE CLOUD CHART FOR VISUAL REFERENCE 1
School/Observer Name:___________________________ Study Site:______________________Date (ex. 2017 01 13): Year: _ _ _ _ Month: _ _ Day: _ _Time (ex. 24 Hour Clock: 14 26): Local: Hour _ _ Minute _ _ Universal: Hour _ _ Minute _ _
Total Cloud/Contrail Cover: FogHeavy RainHeavy SnowBlowing Snow
SandSpraySmokeDust
Volcanic Ash Haze
1. What is in Your Sky?
3. High Level Clouds
Contrails (number of):CirrusCirrocumulus
Cloud Type:FewIsolatedScattered
(<10%)(10%-25%)(25%-50%)(50%-90%)(>90%)
Broken Overcast
Cloud Cover :OpaqueTranslucentTransparent
Visual Opacity:
persistent
short-lived
persistent
spreading
Color (Look Up): Cannot Observe Deep Blue Blue Light Blue Pale Blue Milky Visibility (Look Across): Cannot Observe Unusually Clear Clear Somewhat Hazy Very Hazy Extremely Hazy
Cirrostratus
4. Mid Level Clouds
AltostratusCloud Type:
FewIsolatedScattered
(<10%)(10%-25%)(25%-50%)(50%-90%)(>90%)
Broken Overcast
Cloud Cover :OpaqueTranslucentTransparent
Visual Opacity:
5. Low Level Clouds
FogNimbostratusCumulonimbus
Cloud Type:FewIsolatedScattered
(<10%)(10%-25%)(25%-50%)(50%-90%)(>90%)
Broken Overcast
StratusCumulus
Stratocumulus
Cloud Cover :OpaqueTranslucentTransparent
Visual Opacity:
6. Surface Conditions
Snow/IceStanding WaterMuddy
Dry Ground Leaves on Trees Raining/Snowing
Mandatory: Optional: You may submit any or all
Yes No Yes NoTemperature: ___ C Barometric Pressure: ___mb Relative Humidity: ___%
GLOBE 2017 ATMOSPHERE
2. Sky Color and Visibility
#
#
#
Go to box 6
No High Level Clouds Observed (Go to box 4)
No Mid Level Clouds Observed (Go to box 5)
No Low Level Clouds Observed (Go to box 6)
Comments:
Altocumulus
*If you can observe sky color or visibility, complete box 2
Sky is ObscuredNone (Go to box 2)Few(<10%)Isolated (10-25%)
Scattered (25-50%)Broken (50-90%)Overcast (90-100%)
Atmosphere Investigation: Surface Temperature Data Sheet - Page 2
Study Site: ___________________ Date: ________________ Time (UT): ____________* Required Field

GLOBE® 2018 Appendix - 21 Atmosphere
Atmosphere Investigation Surface Ozone Data SheetSchool Name: ___________________________ Study Site: ________________________Observer names: ___________________________________________________________
Ozone Strip Exposed at: Date: Year______ Month ______ Day ______ Universal Time (hour:min): _______________
Ozone Strip Measured at: Date: Year______ Month ______ Day ______ Universal Time (hour:min): _______________
*Surface Ozone _____ (ppb)
Comments: ______________________________________________________________________________________________________________________________________
*Data (When Ozone Strip was Exposed)*Air Temperature (oC): _____
Relative Humidity(Select instrument used):
q Sling Psychrometer q Digital HygrometerDry bulb temperature (˚C): _________ Wet bulb temperature (˚C): _________
Ambient air temperature (˚C): _________ Relative Humidity (%): _________
Comments: ______________________________________________________________________________________________________________________________________
*Sky Conditions (next page):
* Required Field
GLOBE® 2018 Appendix - 22 Atmosphere
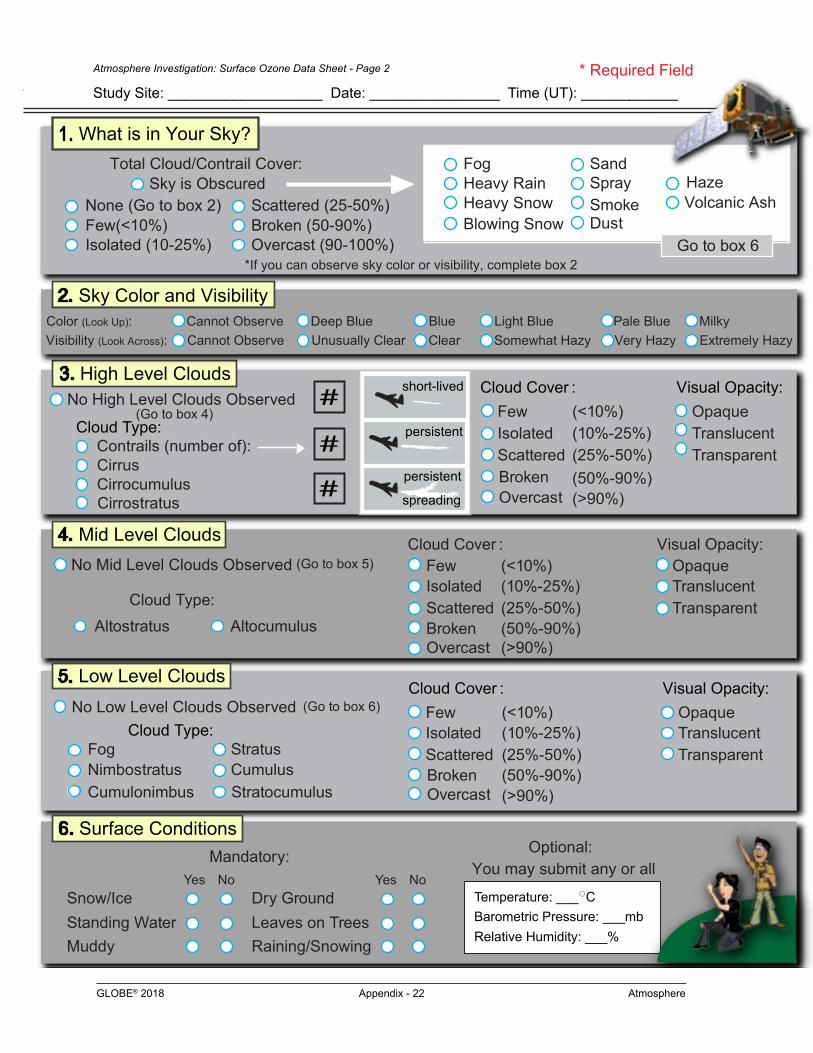
Atmosphere Investigation: Cloud Protocol Data Sheet SEE GLOBE CLOUD CHART FOR VISUAL REFERENCE 1
School/Observer Name:___________________________ Study Site:______________________Date (ex. 2017 01 13): Year: _ _ _ _ Month: _ _ Day: _ _Time (ex. 24 Hour Clock: 14 26): Local: Hour _ _ Minute _ _ Universal: Hour _ _ Minute _ _
Total Cloud/Contrail Cover: FogHeavy RainHeavy SnowBlowing Snow
SandSpraySmokeDust
Volcanic Ash Haze
1. What is in Your Sky?
3. High Level Clouds
Contrails (number of):CirrusCirrocumulus
Cloud Type:FewIsolatedScattered
(<10%)(10%-25%)(25%-50%)(50%-90%)(>90%)
Broken Overcast
Cloud Cover :OpaqueTranslucentTransparent
Visual Opacity:
persistent
short-lived
persistent
spreading
Color (Look Up): Cannot Observe Deep Blue Blue Light Blue Pale Blue Milky Visibility (Look Across): Cannot Observe Unusually Clear Clear Somewhat Hazy Very Hazy Extremely Hazy
Cirrostratus
4. Mid Level Clouds
AltostratusCloud Type:
FewIsolatedScattered
(<10%)(10%-25%)(25%-50%)(50%-90%)(>90%)
Broken Overcast
Cloud Cover :OpaqueTranslucentTransparent
Visual Opacity:
5. Low Level Clouds
FogNimbostratusCumulonimbus
Cloud Type:FewIsolatedScattered
(<10%)(10%-25%)(25%-50%)(50%-90%)(>90%)
Broken Overcast
StratusCumulus
Stratocumulus
Cloud Cover :OpaqueTranslucentTransparent
Visual Opacity:
6. Surface Conditions
Snow/IceStanding WaterMuddy
Dry Ground Leaves on Trees Raining/Snowing
Mandatory: Optional: You may submit any or all
Yes No Yes NoTemperature: ___ C Barometric Pressure: ___mb Relative Humidity: ___%
GLOBE 2017 ATMOSPHERE
2. Sky Color and Visibility
#
#
#
Go to box 6
No High Level Clouds Observed (Go to box 4)
No Mid Level Clouds Observed (Go to box 5)
No Low Level Clouds Observed (Go to box 6)
Comments:
Altocumulus
*If you can observe sky color or visibility, complete box 2
Sky is ObscuredNone (Go to box 2)Few(<10%)Isolated (10-25%)
Scattered (25-50%)Broken (50-90%)Overcast (90-100%)
Atmosphere Investigation: Surface Ozone Data Sheet - Page 2
Study Site: ___________________ Date: ________________ Time (UT): ____________* Required Field
GLOBE® 2018 Appendix - 23 Atmosphere
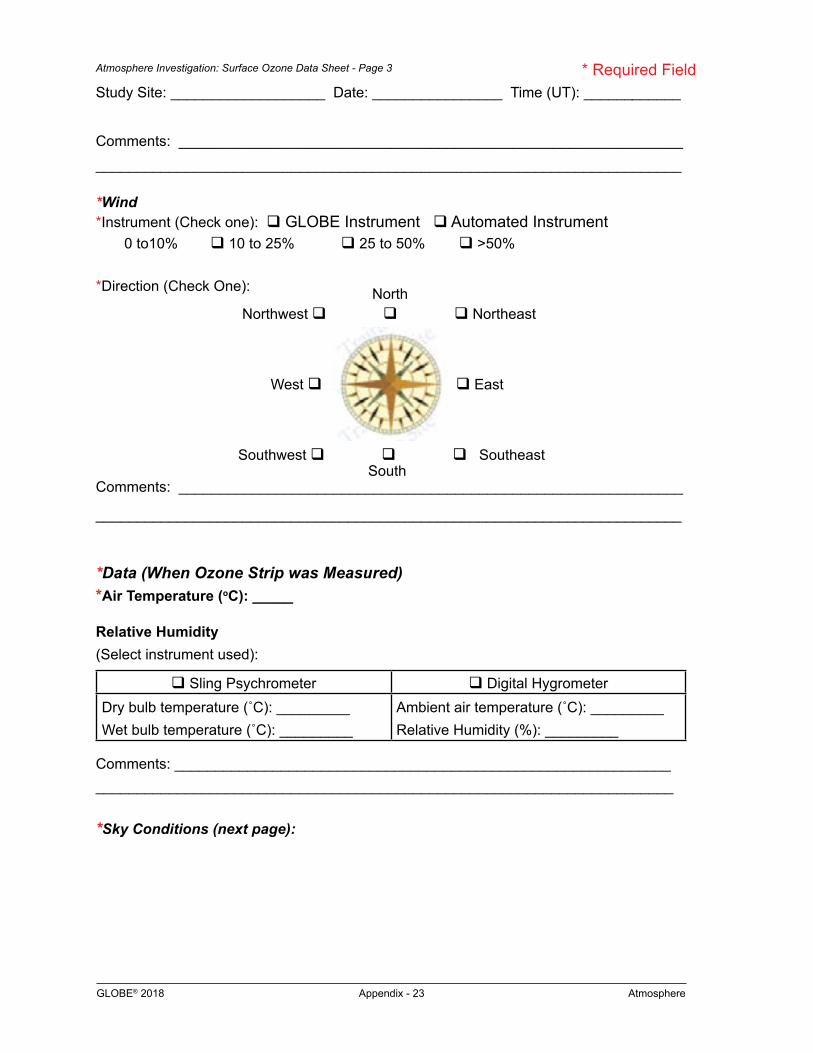
Comments: ______________________________________________________________________________________________________________________________________
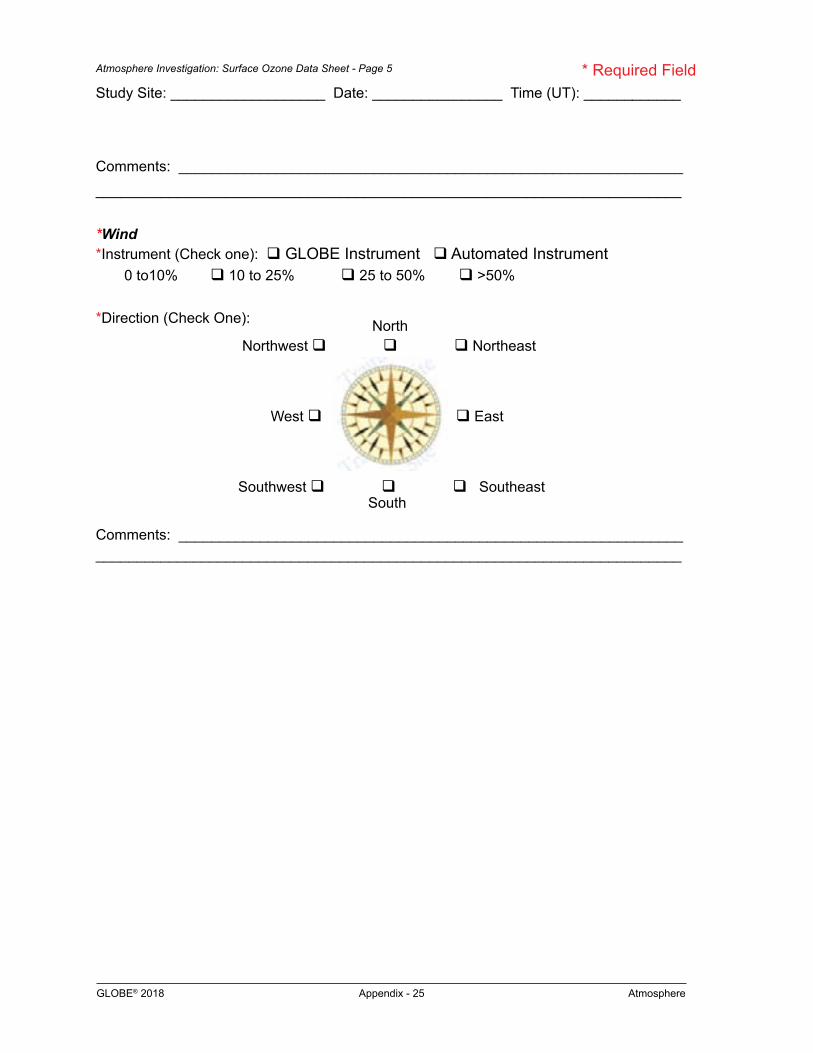
*Wind *Instrument (Check one): q GLOBE Instrument q Automated Instrument 0 to10% q 10 to 25% q 25 to 50% q >50%
*Direction (Check One): North
Northwest q q q Northeast
West q q East
Southwest q q q Southeast South Comments: ______________________________________________________________
________________________________________________________________________
*Data (When Ozone Strip was Measured)*Air Temperature (oC): _____
Relative Humidity(Select instrument used):
q Sling Psychrometer q Digital HygrometerDry bulb temperature (˚C): _________ Wet bulb temperature (˚C): _________
Ambient air temperature (˚C): _________ Relative Humidity (%): _________
Comments: ____________________________________________________________________________________________________________________________________
*Sky Conditions (next page):
Atmosphere Investigation: Surface Ozone Data Sheet - Page 3
Study Site: ___________________ Date: ________________ Time (UT): ____________* Required Field
GLOBE® 2018 Appendix - 24 Atmosphere
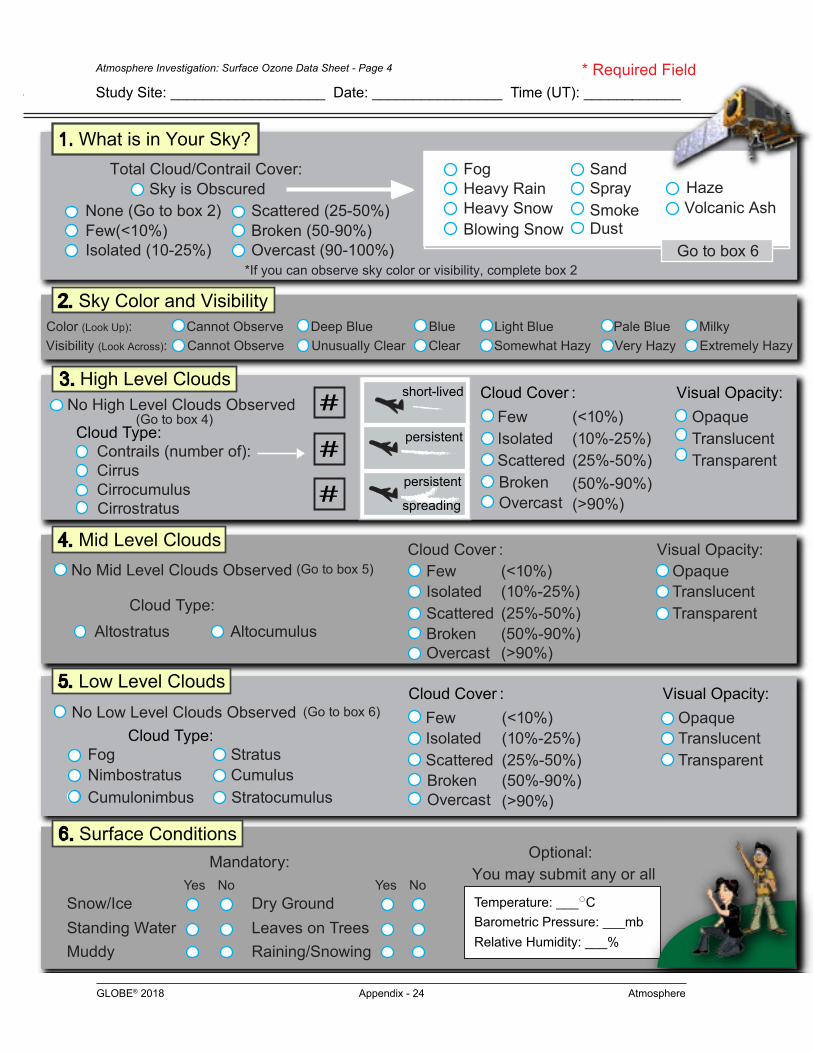
Atmosphere Investigation: Cloud Protocol Data Sheet SEE GLOBE CLOUD CHART FOR VISUAL REFERENCE 1
School/Observer Name:___________________________ Study Site:______________________Date (ex. 2017 01 13): Year: _ _ _ _ Month: _ _ Day: _ _Time (ex. 24 Hour Clock: 14 26): Local: Hour _ _ Minute _ _ Universal: Hour _ _ Minute _ _
Total Cloud/Contrail Cover: FogHeavy RainHeavy SnowBlowing Snow
SandSpraySmokeDust
Volcanic Ash Haze
1. What is in Your Sky?
3. High Level Clouds
Contrails (number of):CirrusCirrocumulus
Cloud Type:FewIsolatedScattered
(<10%)(10%-25%)(25%-50%)(50%-90%)(>90%)
Broken Overcast
Cloud Cover :OpaqueTranslucentTransparent
Visual Opacity:
persistent
short-lived
persistent
spreading
Color (Look Up): Cannot Observe Deep Blue Blue Light Blue Pale Blue Milky Visibility (Look Across): Cannot Observe Unusually Clear Clear Somewhat Hazy Very Hazy Extremely Hazy
Cirrostratus
4. Mid Level Clouds
AltostratusCloud Type:
FewIsolatedScattered
(<10%)(10%-25%)(25%-50%)(50%-90%)(>90%)
Broken Overcast
Cloud Cover :OpaqueTranslucentTransparent
Visual Opacity:
5. Low Level Clouds
FogNimbostratusCumulonimbus
Cloud Type:FewIsolatedScattered
(<10%)(10%-25%)(25%-50%)(50%-90%)(>90%)
Broken Overcast
StratusCumulus
Stratocumulus
Cloud Cover :OpaqueTranslucentTransparent
Visual Opacity:
6. Surface Conditions
Snow/IceStanding WaterMuddy
Dry Ground Leaves on Trees Raining/Snowing
Mandatory: Optional: You may submit any or all
Yes No Yes NoTemperature: ___ C Barometric Pressure: ___mb Relative Humidity: ___%
GLOBE 2017 ATMOSPHERE
2. Sky Color and Visibility
#
#
#
Go to box 6
No High Level Clouds Observed (Go to box 4)
No Mid Level Clouds Observed (Go to box 5)
No Low Level Clouds Observed (Go to box 6)
Comments:
Altocumulus
*If you can observe sky color or visibility, complete box 2
Sky is ObscuredNone (Go to box 2)Few(<10%)Isolated (10-25%)
Scattered (25-50%)Broken (50-90%)Overcast (90-100%)
Atmosphere Investigation: Surface Ozone Data Sheet - Page 4
Study Site: ___________________ Date: ________________ Time (UT): ____________* Required Field
GLOBE® 2018 Appendix - 25 Atmosphere
Comments: ______________________________________________________________________________________________________________________________________
*Wind *Instrument (Check one): q GLOBE Instrument q Automated Instrument 0 to10% q 10 to 25% q 25 to 50% q >50%
*Direction (Check One): North
Northwest q q q Northeast
West q q East
Southwest q q q Southeast South Comments: ______________________________________________________________________________________________________________________________________
Atmosphere Investigation: Surface Ozone Data Sheet - Page 5
Study Site: ___________________ Date: ________________ Time (UT): ____________* Required Field
GLOBE® 2018 Appendix - 26 Atmosphere
Observing Cloud Type
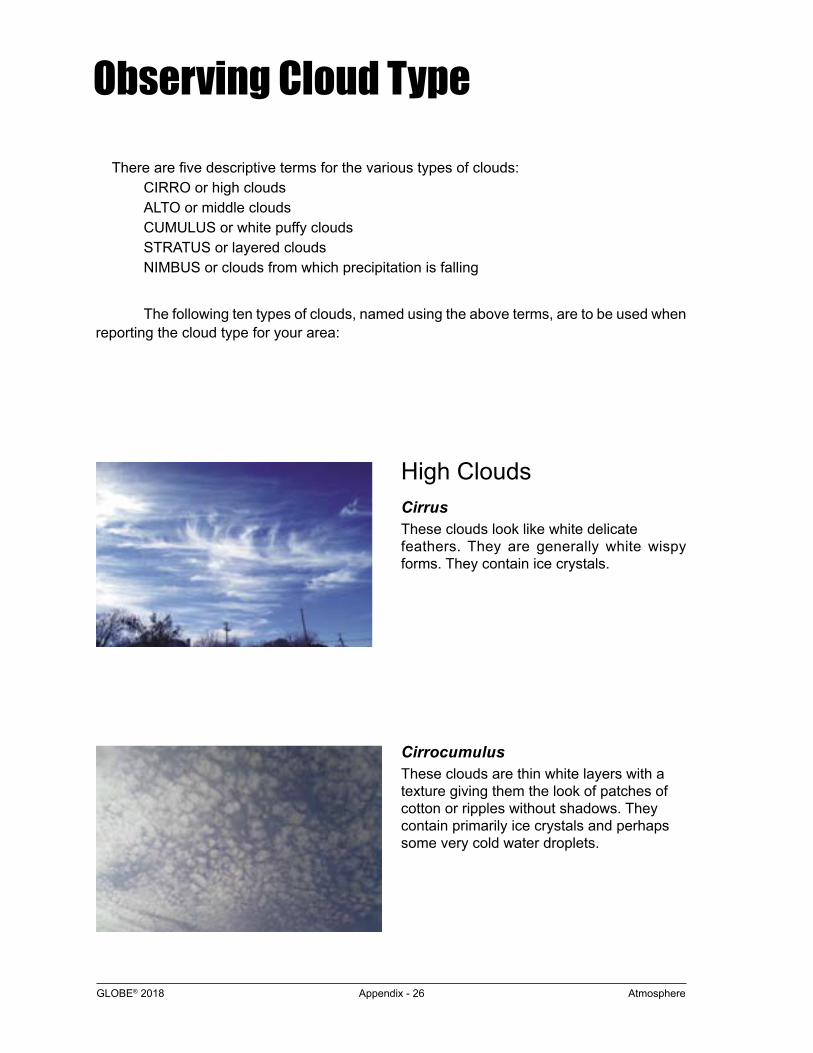
High CloudsCirrus These clouds look like white delicate feathers. They are generally white wispy forms. They contain ice crystals.
Cirrocumulus These clouds are thin white layers with a texture giving them the look of patches of cotton or ripples without shadows. They contain primarily ice crystals and perhaps some very cold water droplets.
There are five descriptive terms for the various types of clouds: CIRRO or high clouds ALTO or middle clouds CUMULUS or white puffy clouds STRATUS or layered clouds NIMBUS or clouds from which precipitation is falling
The following ten types of clouds, named using the above terms, are to be used when reporting the cloud type for your area:
GLOBE® 2018 Appendix - 27 Atmosphere
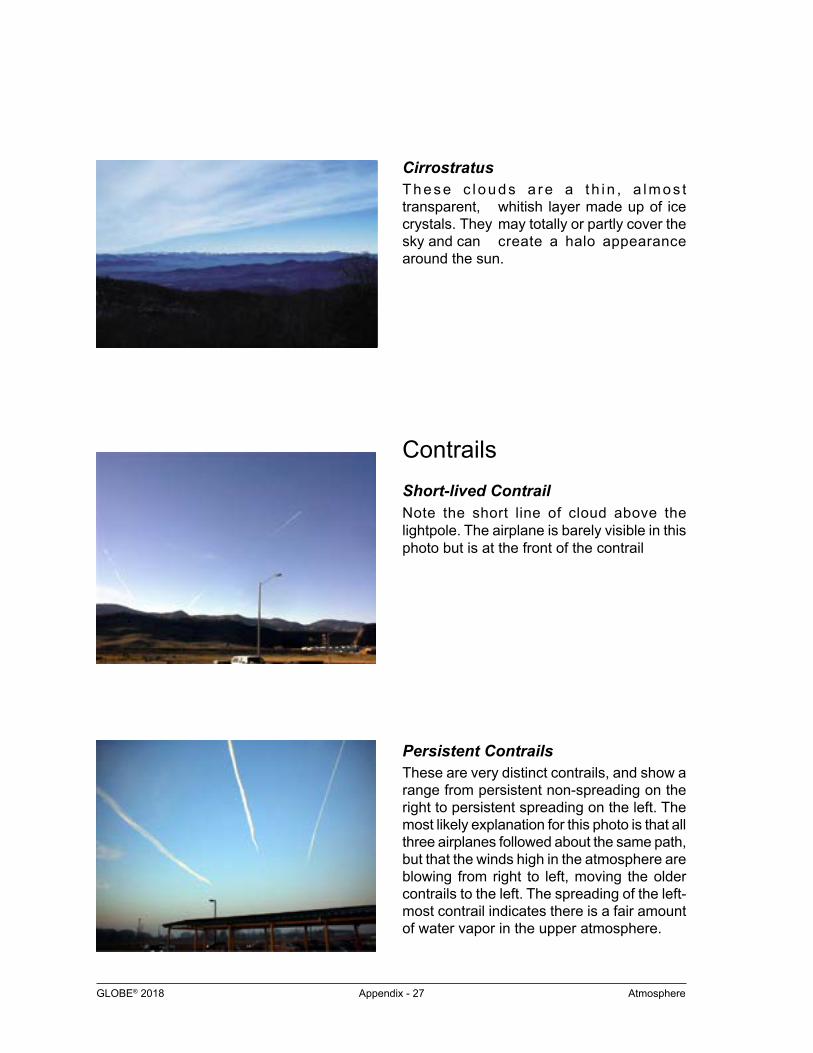
CirrostratusThese c l ouds a re a t h i n , a lmos t transparent, whitish layer made up of ice crystals. They may totally or partly cover the sky and can create a halo appearance around the sun.
ContrailsShort-lived ContrailNote the short line of cloud above the lightpole. The airplane is barely visible in this photo but is at the front of the contrail
Persistent ContrailsThese are very distinct contrails, and show a range from persistent non-spreading on the right to persistent spreading on the left. The most likely explanation for this photo is that all three airplanes followed about the same path, but that the winds high in the atmosphere are blowing from right to left, moving the older contrails to the left. The spreading of the left-most contrail indicates there is a fair amount of water vapor in the upper atmosphere.
GLOBE® 2018 Appendix - 28 Atmosphere
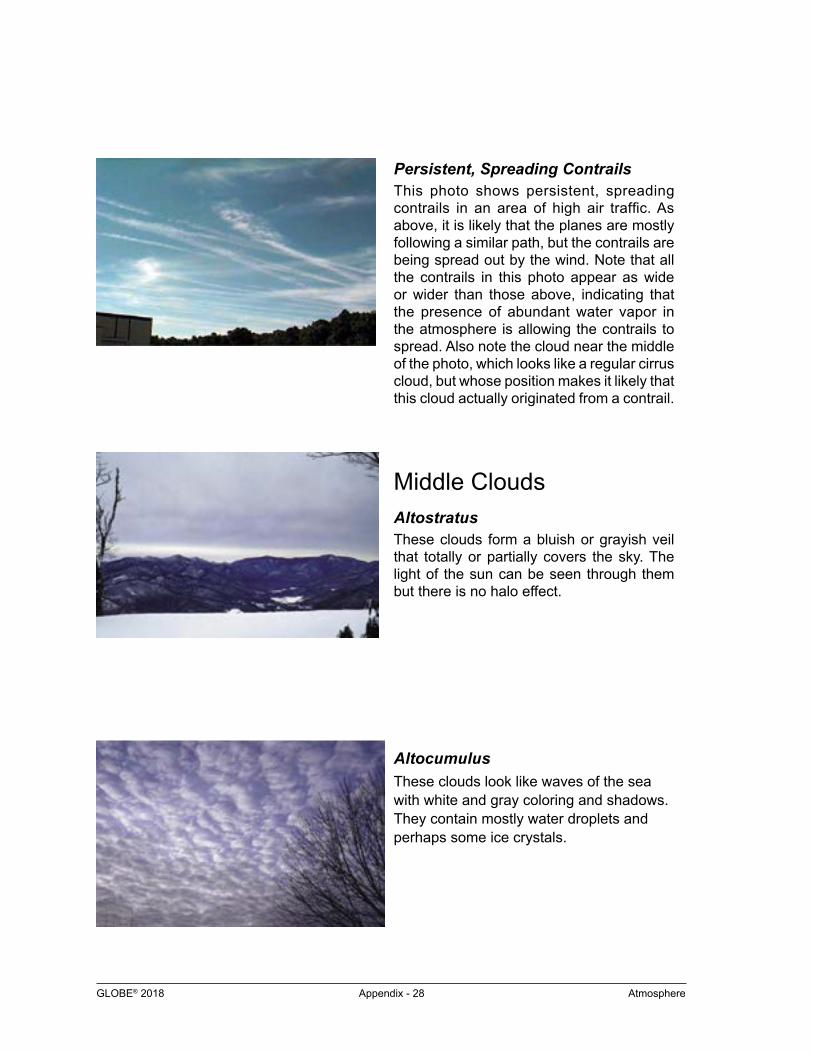
Persistent, Spreading ContrailsThis photo shows persistent, spreading contrails in an area of high air traffic. As above, it is likely that the planes are mostly following a similar path, but the contrails are being spread out by the wind. Note that all the contrails in this photo appear as wide or wider than those above, indicating that the presence of abundant water vapor in the atmosphere is allowing the contrails to spread. Also note the cloud near the middle of the photo, which looks like a regular cirrus cloud, but whose position makes it likely that this cloud actually originated from a contrail.
Middle CloudsAltostratusThese clouds form a bluish or grayish veil that totally or partially covers the sky. The light of the sun can be seen through them but there is no halo effect.
AltocumulusThese clouds look like waves of the sea with white and gray coloring and shadows. They contain mostly water droplets and perhaps some ice crystals.
GLOBE® 2018 Appendix - 29 Atmosphere
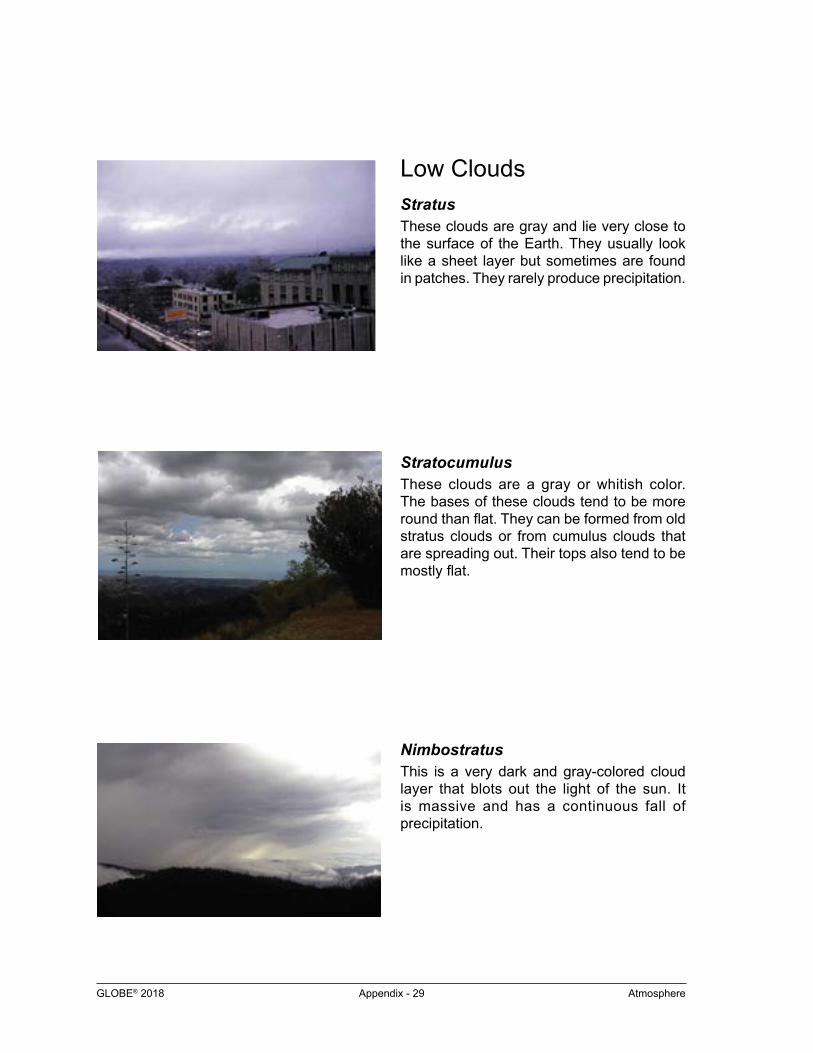
Low CloudsStratusThese clouds are gray and lie very close to the surface of the Earth. They usually look like a sheet layer but sometimes are found in patches. They rarely produce precipitation.
StratocumulusThese clouds are a gray or whitish color. The bases of these clouds tend to be more round than flat. They can be formed from old stratus clouds or from cumulus clouds that are spreading out. Their tops also tend to be mostly flat.
NimbostratusThis is a very dark and gray-colored cloud layer that blots out the light of the sun. It is massive and has a continuous fall of precipitation.
GLOBE® 2018 Appendix - 30 Atmosphere
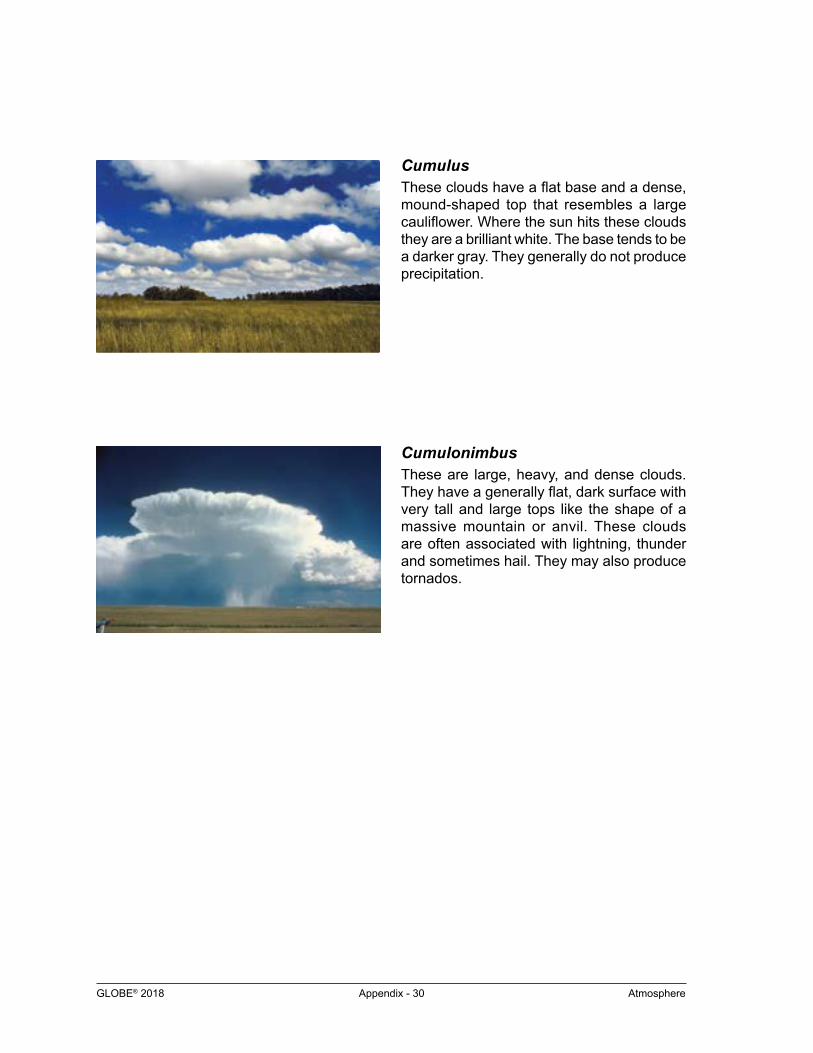
CumulusThese clouds have a flat base and a dense, mound-shaped top that resembles a large cauliflower. Where the sun hits these clouds they are a brilliant white. The base tends to be a darker gray. They generally do not produce precipitation.
CumulonimbusThese are large, heavy, and dense clouds. They have a generally flat, dark surface with very tall and large tops like the shape of a massive mountain or anvil. These clouds are often associated with lightning, thunder and sometimes hail. They may also produce tornados.
GLOBE® 2018 Appendix - 31 Atmosphere
Welcom
eIntroduction
Protocols
Learning ActivitiesA
ppendixGlossaryAbsolute Zero
The theoretical temperature at which matter has the least energy; the limit of how cold matter can get. If substances could be cooled to absolute zero they would not emit any electromagnetic radiation.
Absorption Radiation retained by an object and
converted to other forms of energyAcid Rain
Rain having a pH lower than 5.6, the pH of water in equilibrium with the current concentration of carbon dioxide in the air
Aerosols Liquid or solid particles suspended in
the atmosphere. Their sizes generally have linear dimensions in the range of 100-1000 nanometers (nm).
Air Mass A large volume of air (often covering
thousands of square kilometers) with temperature and humidity characteristics that vary little horizontally
Albedo The percentage of incoming radiation
(usually visible light) reflected back to space from a planet or object, its surface, or its cloud layers
Altimeter A barometer, normalized to standard
pressure, temperature and density, used to measure altitude by measuring atmospheric pressure. Altitude is determined by assuming all changes in pressure are due to a change in height relative to sea level. Altimeters are adapted to work over wide ranges of height above sea level and used in GLOBE to measure barometric pressure at elevations above 500 meters.
Ambient Air Air that is moving freely and not
part of a specific perturbation to the surrounding atmosphere (e.g., not part
of an exhaust plume, not smoke from a fire, not a dust cloud blown off a field)
Atmospheric Greenhouse Effect Warming of a planet by the
atmospheric absorption and re-emission of infrared radiation emitted from the surface of the planet by various gases in the atmosphere (i.e., greenhouse gases)
Barometer An instrument used to measure
atmospheric pressure Biological Diversity (biodiversity)
The variety of life in all its forms, levels and combinations that coexist in an ecosystem. At different scales this includes ecosystem diversity, species diversity, and genetic diversity. The degree of biodiversity is often used as an indicator of the health of the environment.
Blowing Dust Dust (soil particles smaller than sand)
suspended in the air that reduces visibility, or obscures part or all of the sky
Blowing Sand Sand suspended in the air that
reduces visibility, or obscures part or all of the sky
Blowing Snow Snow from the ground that the wind
blows into the air that reduces visibility, or obscures part or all of the sky
Carbon Monoxide Chemical compound of one oxygen
atom and one carbon atom primarily produced as product of incomplete combustion (chemical symbol: CO)
Ceiling The height of the base of the cloud
layer that covers more than 50% of the sky
Ceilometer An instrument used to determine the
height of the cloud base, which helps to indicates cloud type
GLOBE® 2018 Appendix - 32 Atmosphere
Welcom
eIntroduction
Protocols
Learning ActivitiesA
ppendix
Celsius Scale A temperature scale invented in
1742 by Swedish astronomer Anders Celsius. This scale defines the melting point of water ice as 0˚ C, and the boiling point of water as 100˚ C. Because of the 100-degree interval between these two points, this scale is sometimes called the “centigrade scale”.
Chemical Test Strip A piece of paper treated with special
chemicals that show a color change when exposed to ozone
Cirriform A cloud type formed of ice crystals at
high altitudes (greater than 6 km above sea level)
Climate Weather at a locality averaged over
some time period, plus extremes in weather behavior during a time period
Cloud Cover The percent of the sky covered by
clouds Compounds
Chemicals made of atoms from two or more elements
Concentration The number of molecules of a specific
gas in a unit volume relative to the sum of all the molecules in that volume, often reported as parts per million (ppm) or parts per billion (ppb)
Condensation The change of phase of a substance
from a vapor to a liquid. The process of condensation releases energy; this energy is known as latent heat
Conduction The transfer of heat through collisions
of the individual constituents of a substance (e.g., molecules, atoms) without the systematic movement of groups of these constituents. For example, if one end of a metal rod is heated, the heat will be conducted the length of the rod so that the other end will also increase in temperature.
Conduction can occur in solids, liquids, or gases (but is generally most efficient in solids).
Convection The transfer of heat by mass flow, that
is, large scale motion within a liquid or a gas of groups of constituents (e.g. molecules, atoms) that are relatively warmer or cooler than their surroundings. In the atmosphere convection mostly refers to vertical motions brought about by warm air rising and cooler air sinking.
Cumuliform A cloud type that is heaped, puffy,
banded, or otherwise is characterized by rounded features particularly on the top and sides
Density (D) The ratio of the mass (M) of a
substance to its volume (V) (D = M/V)Deposition
The process by which water vapor turns directly into ice on a surface without passing through the liquid phase
Dew Point Temperature The temperature at which the water
vapor begins to condense in air cooled at constant pressure. Dew Point Temperature is a measure of the amount of water vapor in air.
Diffuse Insolation Solar radiation that reaches Earth’s
surface by being scattered or reflected by components of Earth’s atmosphere (such as gases, clouds and aerosols)
Direct Insolation Solar radiation that reaches Earth’s
surface by passing directly through the atmosphere without interacting with the components of Earth’s atmosphere
Diurnal Cycle Refers to the 24 hours of the day, and
sometimes the changes that occur over that 24-hour time period
Drizzle Slow falling liquid precipitation made
up of droplets with diameters between
GLOBE® 2018 Appendix - 33 Atmosphere
Welcom
eIntroduction
Protocols
Learning ActivitiesA
ppendix
0.2 and 0.5 mm. Drizzle reduces visibility more than light rain because of the large numbers of very small drops
Dry Bulb Temperature The temperature on one of two
thermometers on a sling psychrometer; this temperature corresponds to the bulb which does not contain the water saturated wick
Ecosystem A community of different species
interacting with one another and with the chemical and physical factors making up their surroundings
El Niño El Niño refers to a prolonged
significant warming of surface waters in the central and eastern tropical Pacific Ocean and generally to the phenomena that accompany this warming.
Electromagnetic (EM) Radiation Energy waves produced by oscillating
or accelerating electric charges. EM waves have both electric and magnetic components. Unlike conduction and convection, EM waves do not need media like solids, liquids, or gases in order to transfer energy. Electromagnetic radiation can be arranged in a spectrum from very energetic short wavelengths (gamma rays, x-rays), to less energetic, very long wavelengths (microwaves and radio waves). Visible light is a small part of the electromagnetic spectrum that human eyes can see.
Elevation Angle The angular distance between the
horizon and an object in the sky, such as the sun. The zenith angle is 90˚ minus the elevation angle.
Evaporation The phase change of a substance
from a liquid to a gas Evapotranspiration
The transfer and transformation of liquid water from soil to air by the
combined processes of evaporation and transpiration by vegetation
Fahrenheit Scale A temperature scale invented by the
18th century German physicist Daniel Gabriel Fahrenheit. This scale defines the melting point of water ice as 32˚ F and the boiling point of water as 212˚
F. The United States is the only major country in the world still commonly using the Fahrenheit scale.
Fog A cloud in contact with Earth’s surface
Force (F) A push or pull
Freezing The process of water changing phase
from liquid to solid (ice)Freezing Rain and Freezing Drizzle
Supercooled water drops that freeze when they come in contact with cold surfaces
Front The narrow transition region between
two distinct air masses. A front is a region of changing wind direction, changing surface air pressure, and often results in the development of clouds and precipitation.
Frost The deposition of ice from water
vapor in the atmosphere directly onto surfaces such as grass or windows
Geostationary An object in orbit around Earth that
stays above a certain location on the planet; the object is generally located directly above the Equator at a fixed longitude.
Greenhouse Gas Any gas that causes heat to be
retained in the atmosphere and thereby causes the average temperature of the atmosphere to increase. Greenhouse gases are strong absorbers of infrared radiation. Examples of significant greenhouse gases are water vapor, carbon dioxide, nitrous oxide, methane, and chlorofluorocarbons.
GLOBE® 2018 Appendix - 34 Atmosphere
Welcom
eIntroduction
Protocols
Learning ActivitiesA
ppendix
Gravity The force of attraction among all
matter (e.g., gravity pulls each of us toward Earth’s center)
Greenwich Mean Time (GMT) The same reference time as Universal
Time (UT); the time at 0 degrees longitude (the prime meridian) that passes through Greenwich, England
Hail (also known as Hailstones) Precipitation in the form of irregular
balls of ice ranging in size from about 2 mm to 13 cm in diameter. The largest hailstones can only form in the most violent thunderstorms that have extremely strong updrafts (upward moving air).
Halo The optical phenomenon caused
when sunlight or moonlight is refracted through ice crystals, splitting the visible beam into its distinct colors. This occurs only with cirrostratus or thick cirrus clouds.
Haze The reduction of visibility by aerosols
in the atmosphere. Haze may cause the sky to appear milky white to yellowish, reddish, or brown, depending on whether the aerosol is wet or dry and depending on the size and nature of the particles which scatter the light.
Heat The total energy of motion of all of the
atoms and molecules that make up a substance
Heavy Rain Rain falling at such a great rate
(greater than 7.5 mm/hr) that it reduces visibility and obscures the view of the sky
Heavy Snow Falling snow that reduces visibility to
less than 400 meters and obscures the view of the sky
Hydrocarbons Compounds composed primarily of
carbon and hydrogen atoms. Gaseous
hydrocarbons occur in the atmosphere, (e.g., the compounds in natural gas, chemical species given off naturally by plants, and compounds that result from by-products of the combustion process).
Hydrologic Cycle The continuous flow of water through
the Earth system. The hydrologic cycle is composed of reservoirs of water (such as ice caps, oceans, atmospheric humidity, and aquifers) and fluxes or flows of water (such as evaporation, precipitation, river flow, and iceberg calving).
Hygrometer An instrument used to measure the
relative humidity of airIce Pellets
Same as sleet Infrared radiation
Light (electromagnetic radiation) with wavelengths ranging from just longer than visible light (0.7 micrometers) to just shorter than microwaves or radio waves (1000 micrometers). The amount of light thermally emitted by Earth’s surface and lower atmosphere peaks at wavelengths near 10 micrometers, and light in this portion of the infrared wavelength range is often referred to as thermal infrared.
In situ In place. Most of the atmospheric
measurements in GLOBE, such as temperature and ozone, are taken in situ; however, many of these quantities can also be measured remotely through the use of special satellites.
Insolation Incoming solar radiation
Interplanetary Medium The space between the planets that
contains electromagnetic radiation, electric and magnetic fields, ionized gas, neutral atoms, and microscopic dust particles. The characteristics of interplanetary space are primarily influenced by the sun and not by individual planets.
GLOBE® 2018 Appendix - 35 Atmosphere
Welcom
eIntroduction
Protocols
Learning ActivitiesA
ppendix
Inverse Relationship When two variables are related to each
other in an opposite way; for example, as one increases, the other decreases (e.g. x = 1/y)
Isobars Lines on a map connecting points of
equal pressureIsotherms
Lines on a map connecting points of equal temperature
Kelvin Scale A temperature scale named for British
physicist William Thomson Kelvin who proposed it in 1848. One Kelvin degree is equivalent to one Celsius degree. However, zero on the Kelvin scale is defined to be the temperature at which molecular energy is a minimum, also called “absolute zero”. The convention when writing temperatures in the Kelvin scale is to just use the letter K, omitting the degree symbol. Zero on the Kelvin scale corresponds to approximately –273˚ C.
La Niña A period of anomalous cooling of sea-
surface temperatures in the central and eastern tropical Pacific Ocean
Latent heat The heat used or released when water
changes phase between solid, liquid, and gas
Melting The process of a substance changing
phase from solid to liquidMesosphere
The third layer of the atmosphere above Earth’s surface, generally found between altitudes of 50 km and 80 85 km and characterized by temperature decreasing with altitude
Millibar A unit of barometric pressure
equivalent to one one-thousandth of a bar and equivalent to a hectopascal
Mixing Ratio A scientific term often used
synonymously with concentration. One example is the mass of water vapor in a sample of air divided by the total mass of air in the sample
Nitrogen Oxides The family of compounds comprised of
one or more nitrogen atoms and one or more oxygen atoms. Nitric oxide (NO) and Nitrogen dioxide (NO2) are both primarily products of combustion whereas nitrous oxide (N2O) is a primarily product of microbial activity in soils.
Optical thickness (also optical depth) A measure of how much particles
(aerosols) and gas molecules (air) impede the transmission of light through a gas at a specific wavelength. At an optical depth of one, the incoming light is attenuated to 1/e in intensity.
Ozone A highly reactive gas composed of 3
oxygen atoms that exists in varying amounts in the troposphere and stratosphere. Ozone is found naturally in the atmosphere as a result of breaking apart oxygen molecules (O2) into two oxygen atoms that combine with molecules of oxygen to form ozone (O3).
Ozone Layer The layer of the atmosphere in the
stratosphere and lower mesosphere that absorbs most incoming ultraviolet radiation
Ozone Optical Scanner An instrument used in GLOBE’s ozone
protocol that measures the color change on the chemical test strips and interprets this change as an ozone concentration in units of ppb
Pascal The unit of pressure equivalent to 1
Newton/meter-squared. 100 pascals equals one hectopascal which is a standard pressure unit used in GLOBE
GLOBE® 2018 Appendix - 36 Atmosphere
Welcom
eIntroduction
Protocols
Learning ActivitiesA
ppendix
pH Scale The system used to specify the range
of acidity or alkalinity of substances. On this scale, a substance with a pH of 7 is neutral. Substances with pH less than 7 are acidic; substances with pH greater than 7 are alkaline (or basic).
Phase Change The change in a substance from
one phase to another. Substances (elements and compounds) generally exist in one of three phases solid, liquid, and gas; For example, water vapor (gas) condensing into water (liquid). Substances undergoing phase changes take up or give off heat without changing temperature. (See Latent Heat)
Photolysis The break-up of an atmospheric
compound by light. For example, when ozone (O3) is formed in the atmosphere, it can be split into atomic oxygen (O) and molecular oxygen (O2) by ultraviolet sunlight.
Polar-Orbiting Satellite An artificial satellite (spacecraft that
orbits Earth) passing near or over the poles. This term usually refers to satellites in near-polar orbits that are designed so that their orbital plane maintains a constant angle (on average) with the line between the sun and Earth. These are called sun-synchronous satellites.
Pollutant A trace gas or aerosol that
contaminates the airppb
Parts per billion, a unit of measure of atmospheric trace gas concentration or mixing ratio; sometimes denoted ppbv (parts per billion by volume), which is how trace gas mixing ratios are normally defined.
Precipitable Water Vapor The depth of a planet-wide layer of
liquid water that would be formed if all the water vapor in a column
of atmosphere were condensed onto Earth’s surface. On average, the atmosphere contains about 2 centimeters of precipitable water vapor.
Precipitation Water in solid or liquid form that falls to
Earth’s surface from the atmospherePrecursor
A chemical necessary to reactions that form other compounds (e.g., nitric oxide is a precursor of ozone in the near-surface atmosphere)
Pressure Force per unit area; for the
atmosphere, it may be thought of as the weight of the column of air above a given area.
Radiation See “Electromagnetic Radiation”.
Rayleigh scattering Scattering of sunlight by molecules in
the atmosphere, named after the 19th century British physicist John William Strutt, the third Baron Rayleigh.
Reactive Chemicals Chemicals that will undergo chemical
reactions in the atmosphereReflection
The process by which radiation incident upon an object is directed at some fixed angle away from that object
Relative Air Mass The ratio of the amount of atmosphere
between an observer and the sun relative to the amount of atmosphere directly overhead. Relative air mass is directly related to solar elevation angle.
Relative Humidity A measure of the amount of water
vapor in a sample of air compared to the amount contained in an air sample at the same pressure and temperature saturated with water vapor
Satellite An object in orbit around a larger
celestial body

GLOBE® 2018 Appendix - 37 Atmosphere
Welcom
eIntroduction
Protocols
Learning ActivitiesA
ppendix
Scattering The process by which radiation
interacting with a substance is deflected in all directions
Sea Level Pressure Atmospheric pressure adjusted to the
value that would be measured if the measurement location were at sea level
Sea Spray Aerosols blown off the surface of a salt
water body under windy conditions, which may produce obstructions to visibility
Seasonal Cycle A periodic change in a variable that
occurs in tandem with Earth’s seasonsSensible Heat
The heat associated with a change in temperature of a substance as distinct from the heat associated with a phase change
Shower A type of precipitation event that is
typically of short duration, or occurs with frequent changes of intensity
Sleet Precipitation that at some point is in
liquid form, but freezes before reaching the ground
Sling Psychrometer A device consisting of two
thermometers, one of which has a dry bulb and the other of which has a bulb that is kept wet. The difference between the wet and dry bulb temperatures is used to calculate relative humidity.
Smog Air that contains a sufficient
combination of aerosols from water and combustion to be visible. Aerosols in smog may be produced indirectly by reactions among the gases present in combustion exhaust. Smog originated as a term combining the words smoke and fog and may reduce visibility in a similar way.
Smoke Air containing sufficient aerosols
produced by combustion to be visible, which may reduce visibility or obstruct views of the sky
Solar Noon The time at which the sun is at its
highest point in the sky (zenith) during a day
Specific Heat The amount of heat required to
raise the temperature of 1 gram of a substance by 1˚ C
Squall An intense or violent shower
accompanied by strong, gusty windsStation Pressure
The true atmospheric pressure, uncorrected to standard conditions at sea level. Weather reports generally give barometric pressure corrected to sea level, not station pressure.
Stratiform A cloud comprised of a single or
multiple horizontal layers; there is very little discernible structure to clouds of this type.
Stratosphere The second layer of the atmosphere
above Earth’s surface, generally characterized by temperature increasing with altitude. The stratosphere begins at altitudes ranging from about 8 km in the polar regions to 1618 km in the tropics and extends to altitudes of about 50 km where there is a local maximum in atmospheric temperature. The stratosphere contains most of the ozone found in the atmosphere.
Sublimation The transition of a substance directly
from the solid phase to the gas phase Sun Photometer
An instrument that measures the intensity of sunlight transmitted through the atmosphere within a narrow wavelength range
GLOBE® 2018 Appendix - 38 Atmosphere
Welcom
eIntroduction
Protocols
Learning ActivitiesA
ppendix
Supercooled Water Water with a temperature that is below
its freezing point but still in liquid formTemperature
A measure of the average energy of motion of all the atoms and molecules that make up a substance
Temperature Inversion An increase in temperature with height
in the troposphere, usually associated with a very stable air mass. Normally, temperature in the troposphere increases with height. When and where temperature increases with height, vertical mixing of the atmosphere is greatly decreased. This leads to the trapping of aerosols and trace gases from the surface being contained in the air near the surface. It also causes the atmosphere to be stratified in horizontal layers in the stratosphere, hence the name of this atmospheric layer.
Thermosphere The fourth layer of the atmosphere
above Earth’s surface. In the thermosphere, temperature increases greatly, ion concentrations become significant, and the dynamics of the atmosphere is virtually independent of the forces and phenomena associated with Earth’s surface and lower atmosphere. Most of the ionosphere is contained within the thermosphere and above the thermosphere is interplanetary space.
Thunderstorm A cumulonimbus cloud or family of
cumulonimbus clouds that produce lightning, and therefore, thunder. Thunderstorms are not always accompanied by precipitation reaching the ground.
Trace Gas Gases present in the atmosphere in
very small quantities, always less than one-tenth of one percent
Transpiration The process by which water vapor
escapes into the atmosphere through open stomata on plant leaf surfaces
Tropical Cyclone A low pressure system found in tropical
latitudes which may develop into a tropical storm, hurricane, and other similarly intense storm
Troposphere The lowest layer of the atmosphere
where almost all weather occurs. The troposphere contains about 80% of the atmosphere’s mass and is characterized by temperatures that normally decrease with altitude. The boundary of the troposphere and the stratosphere depends on latitude and season. It ranges from as low as 8 km over the poles to as high as 16-18 km in the tropics.
Ultraviolet A part of the electromagnetic spectrum
that is more energetic, and of shorter wavelengths than visible light; usually defined as radiation with wavelengths of 0.1 - 0.38 micrometers.
Universal Time (UT) The time at 0 degrees longitude (the
prime meridian); UT is the currently preferred term for this reference time, which is the same as GMT.
Visibility The distance over which an observer
can see and clearly identify an objectVisible Radiation
Light with wavelengths between about 0.38 and 0.7 micrometers that may be seen by humans. The sun emits its peak amount of energy in the visible portion of the electromagnetic spectrum.
Volcanic Ash Small particles of minerals, rock and
glass fragments ejected from volcanic eruptions. As aerosols they may reduce visibility or obscure a view of the sky. These particles often produce spectacular light scattering effects including colorful sunsets.
GLOBE® 2018 Appendix - 39 Atmosphere
Welcom
eIntroduction
Protocols
Learning ActivitiesA
ppendix
Water Cycle See Hydrologic Cycle.
Water Vapor The colorless, odorless, invisible,
gaseous form of water in the atmosphere
Wavelength (of light) A property of light that is inversely
proportional to its frequency and describes the distance from one wave peak to the following wave peak. Visible light lies in the wavelength range from about 0.38 micrometers (violet) to 0.7 micrometers (red). The peak sensitivity of the human eye is to light at a wavelength of about 0.5 micrometers (green), near the response wavelength of the green channel of the GLOBE sun photometer.
Weather The state of the atmosphere
at a particular place and time. Weather includes variables such as temperature, barometric pressure, wind, cloudiness, precipitation, and relative humidity.
Wet Bulb Depression The difference between the dry bulb
and wet bulb temperature readings on a sling psychrometer
Wet Bulb Temperature The temperature taken on a sling
psychrometer from the thermometer with its bulb covered in a wet wick, after slinging or whirling the psychrometer for the prescribed amount of time
Wet Deposition The depositing of gases or aerosols
from the atmosphere on to Earth’s surface through their incorporation in precipitation (rain drops, snowflakes, etc.). Sometimes the terms ‘rain out’ or ‘wash out’ are used in place of wet deposition.
Zenith Angle The angular distance between an
object in the sky, such as the sun, and an object directly overhead. Zenith angle is 90˚ minus the elevation angle.