appendix iv tramore drainage scheme marine outfall … · tramere marine outfall study 2eport 1.3...
TRANSCRIPT

APPENDIX IV
TRAMORE DRAINAGE SCHEMEMARINE OUTFALL STUDY 1991
BY
IRISH HYDRODATA
For
insp
ectio
n pur
pose
s only
.
Conse
nt of
copy
right
owne
r req
uired
for a
ny ot
her u
se.
EPA Export 26-07-2013:00:06:55

Document Ref: 673/91
TRAMORE DRAINAGE SCHEME
MARINE OUTFALL STUDY
REPORT
Prepared for:-
Waterford County Council,Arus Brugha,
Dungarvan,Co. Waterford.
Presented to:-
M.C. 0' Sullivan,Consulting Engineers,
Innishmore,Ballincollig,
Co. Cork.
Submitted by:-
Irish Hydrodata Limited,Rathmacullig West,
Ballygarvan,Co. Cork.
Tel: (021) 311255Fax: (021) 968604
21st November 1991
For
insp
ectio
n pur
pose
s only
.
Conse
nt of
copy
right
owne
r req
uired
for a
ny ot
her u
se.
EPA Export 26-07-2013:00:06:55

CHAPTER
1.
1.1
1.2
1.3
1.4
2.
2.1
2.2
2.3
2.4
2.5
2.6
3.
3.1
3.2
3.3
3.4
3.5
4.
CONTENTS
INTRODUCTION
Background to the StudyStudy BriefSummary of Field WorksNotation
OCEANOGRAPHIC CHARACTERISTICS OF AREA
Bathymetry and TopographyTides and Water Level ChangesWind ClimateTidal Streams and CurrentsDye Dispersion TestsDiscussion of Field Data
PREDICTIVE MODELS OF WATER QUALITY
OverviewTidal Circulation ModelsEffluent Dispersion ModelsReliability of Dispersion Modelling AnalysisAdditional Considerations
SUMMARY AND CONCLUSIONS
1
1
2
2
3
3
5
6
7
9
1011162533
35
References and Bibliography
Appendix 1:Appendix 2:
Annex Sections 1-13,Drawings: 673/1-4,
Data Analysis ResultsField Equipment Details
Model Output PlotsBathymetry and Dye Plume Trajectories
For
insp
ectio
n pur
pose
s only
.
Conse
nt of
copy
right
owne
r req
uired
for a
ny ot
her u
se.
EPA Export 26-07-2013:00:06:55

FIGURE
1.1
2.12.22.32.42.5a,b3.13.2
TABLE
2.12.2a,b3.13.23.33.4a,b3.5a,b3.6
3.7a,b3.83.9
3.10a,b3.11
3.13a,b3.14a,b3.153.16
4.1
LIST OF FIGURES
DESCRIPTION
Bathymetry of Tramore BayCoastal TopographyLocation of Survey InstrumentationI.M.S. Coastal Weather StationsCurrent Meter Data PlotTidal Streams in the Celtic SeaDye Release LocationsBeach Segment Areas used in Model
LIST OF TABLES
CONTENT
Tidal Statistics for Tramore BayWind Statistics (Roches Point)2D Flow Model Results3D Flow Model Results3F Flow Model - SE WindsEffluent Characteristics and Discharge RatesCalm Weather Shoreline Contaminant ConcentrationsChannel Outfall; Contaminant Concentrations, Onshore WindBay Outfalls; Contaminant Concentrations, Onshore WindEffect of Decay Time on Contaminant ConcentrationsEffect of Diffusion Coefficient on ContaminantConcentrationsBay Outfalls, Box Model Contaminant ConcentrationsChannel Outfall, Average Contaminant ConcentrationsChannel Outfall, Patch Model Contaminant ConcentrationsRinnashark Channel, Discharge CharacteristicsBay Outfalls, Predicted Initial DilutionsChannel Outfall, Predicted Initial DilutionsSummary of Maximum Coliform Concentrations
For
insp
ectio
n pur
pose
s only
.
Conse
nt of
copy
right
owne
r req
uired
for a
ny ot
her u
se.
EPA Export 26-07-2013:00:06:55

1. INTRODUCTION
1.1 BACKGROUND TO THE STUDY
1.2 STUDY BRIEF
1.3 SUMMARY OF FIELD WORKS
1.4 NOTATION
For
insp
ectio
n pur
pose
s only
.
Conse
nt of
copy
right
owne
r req
uired
for a
ny ot
her u
se.
EPA Export 26-07-2013:00:06:55

Tramare Marine Outfall Study Report
1. INTRODUCTION
1.1 BACKGROUND TO THE STUDY
During the past ten years work has been progressing on uprating andrefurbishing the drainage system in Tramore Town. This work has beenconducted under the auspices of the Tramore Sewerage Scheme preparedfor Waterford County Council by their Consulting Engineers, M.C. 0'Sullivan. The sewage installation is presently a pumped systemdischarging raw effluent via a short sea outfall located to the eastof the main bathing beach.
In the future it is envisaged that a treatment works will be built inTramore. The proposed works will provide for secondary treatment ofsewage in accordance with the E.C. Directive 91/271/EEC. TheConsulting Engineers are currently preparing an environmental impactassessment of the scheme and this report provides assistance on themarine outfall aspects.
Summaries of the findings are included in the main text while resultsof the more detailed analyses are presented in Appendix 1.
1.2 STUDY BRIEF
This marine survey was commissioned to assist with the planning of thetreatment works and to ensure that the appropriate measures would betaken to safeguard the future environmental quality of the bay. Thebathing strand has the potential for gaining the coveted EC Blue Flagaward (for bathing beaches maintaining high environmental standards).
The main objectives of the study as defined by M.C. 0' Sullivan wereto:-
- establish the basic dispersive characteristics of the bay waters;
- to assess the likely fate of treated municipal effluent dischargedwithin the confines of the bay.
The preliminary assessments of available data by the Engineer had ledto the conclusion of two possible marine outfall locations. One wasan extension of the existing short outfall out to the deeper watersin the middle of the bay, with a probable continuous discharge. Thesecond was a proposed new outfall positioned in the narrow tidal inletat the east end of the sand dunes (Rinnashark channel), with an ebbtide discharge.
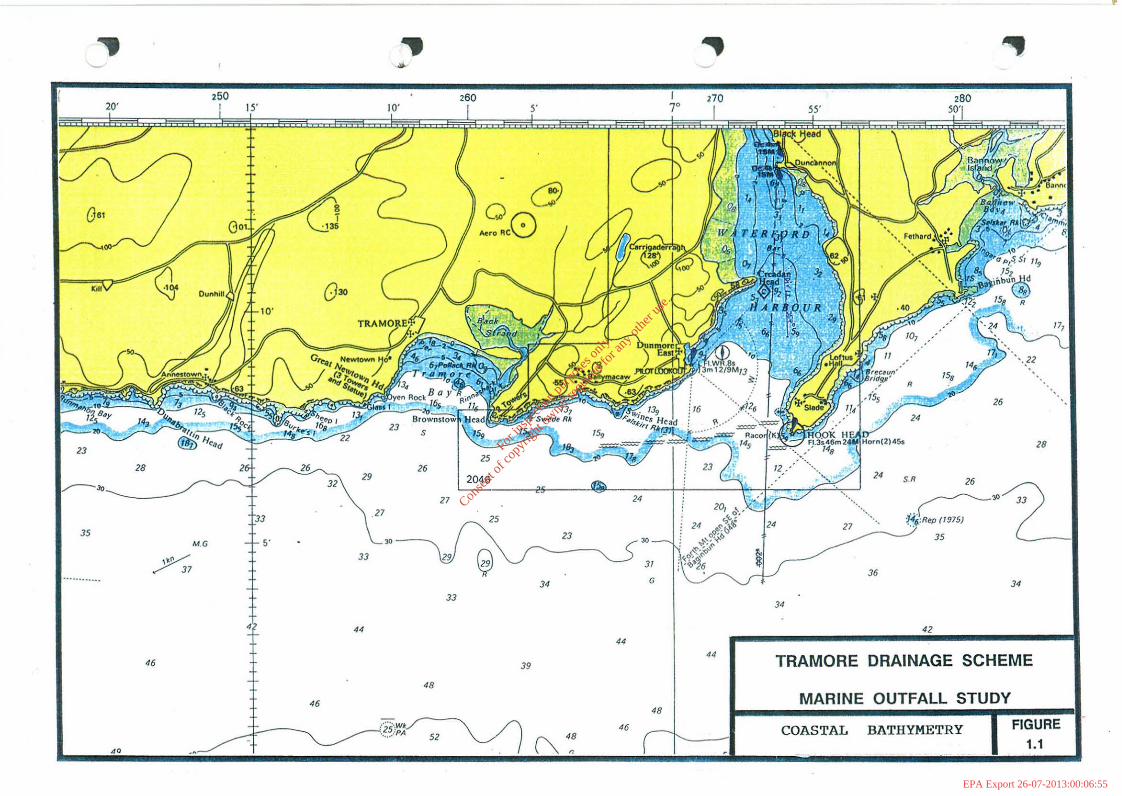
Figure 1.1 taken from a portion of Admiralty Chart No. 2049 shows thebay and the surrounding areas.
1
For
insp
ectio
n pur
pose
s only
.
Conse
nt of
copy
right
owne
r req
uired
for a
ny ot
her u
se.
EPA Export 26-07-2013:00:06:55

Tramere Marine Outfall Study 2eport
1.3 SUMMARY OF FIELD WORKS
Following a full review of available data and bearing in mind the
stated objectives of the study the following field works andinstrument installations were undertaken at various stages during "hesurvey period.
- deployment of recording tide, current and wind gauges for "heduration of the survey works.
- continuous (12.5 hour) dye dispersion and advection experime="s.One release from the proposed extension point of the exis"~ng
outfall (average tide) and two from the Rinnashark Channel (onespring and one neap tide).
- echo sounding within the bay area to provide more accuratebathymetric data to construct numerical models.
A diary of survey activities is presented in Appendix 1. Techn~:al
specifications of the instrumentation used are presented in Appe=~ix
2.
Short term field measurements are to an extent limited and can onl, bereliably used to quantify dispersion characteristics during condit~ons
similar to those during which they were observed. Thus to provide =ora broader understanding of the bay circulations and to investigate ~e
variability of the measured dispersive patterns for a wider range of
tidal and wind conditions comprehensive numerical modelling of :~e
proposed discharges was subsequently undertaken.
1.4 NOTATION
Throughout this report the following conventions and units are used.
Current speeds are presented in metres per second (m/s).directions are given in degrees relative to true northindicate the direction to which the current is flowing.
Curr=~t
(OT) a~d
Wind speed and direction are given in metres per seconddegrees true (oT). Note that wind direction refers to thefrom which the wind blows. (Note 1 knot = a.51m/s).
(m/s) anddirec:~on
Water depths are given in metres relative to Malin Head datum.
2
For
insp
ectio
n pur
pose
s only
.
Conse
nt of
copy
right
owne
r req
uired
for a
ny ot
her u
se.
EPA Export 26-07-2013:00:06:55
28
34
26
36
TRAMORE DRAINAGE SCHEME
4234
..
G
3/
44
23
34
QGJAeroRc8
L-- -~2255--J~3:> -2.24;---ti--:::~tt;~7j:::2:~24
20 . 5.R
'~' ' M21 (0e,<c.ti ".3O_1! ~,:f~bb-'; 2 -'. ,.~"3023 I
, <";'~o 7 _ 'R'P (0975')
:~~ ~- 35
3946
23 sf!1ij' "'~01C/ :r==- «
28 26J;\ 29 I 2046
\27
'33
\:~~5M.G 15
'
~33 29 0
37
33
1 44
•, .. ., 49- ..
,50 '60 I ,7020' I 15' 10' I 5' 7° I 55'
0<>
kIlt
35
G"
~.,
40
46
48
.r::::\ /\ 48!i5'~: 52 '-.../. I G r.
46
48MARINE OUTFALL STUDY
COASTAL BATHYMETRY FIGURE1.1
For
insp
ectio
n pur
pose
s only
.
Conse
nt of
copy
right
owne
r req
uired
for a
ny ot
her u
se.
EPA Export 26-07-2013:00:06:55

2.
2.1
2.2
2.2.12.2.22.2.32.2.4
2.3
2.4
2.5
OCEANOGRAPHIC CHARACTERISTICS OF THE AREA
TOPOGRAPHY AND BATHYMETRY
TIDE ·AND WATER LEVEL CHANGES
Astronomical TidesSeichesStorm SurgesCombination of Tide and Surges
WIND CLIMATE
TIDAL STREAMS AND CURRENTS
DYE DISPERSION TESTS
2.5.12.5.22.5.32.5.4
Survey DataSpring Tide Release Average Tide ReleaseAverage Tide Release
Rinnashark ChannelBay SiteRinnashark Channel
2.6 DISCUSSION OF FIELD DATA
For
insp
ectio
n pur
pose
s only
.
Conse
nt of
copy
right
owne
r req
uired
for a
ny ot
her u
se.
EPA Export 26-07-2013:00:06:55

Tramere Marine Outfall Study Report
2. OCEANOGRAPHIC CHARACTERISTICS OF THE AREA
2.1 TOPOGRAPHY AND BATHYMETRY
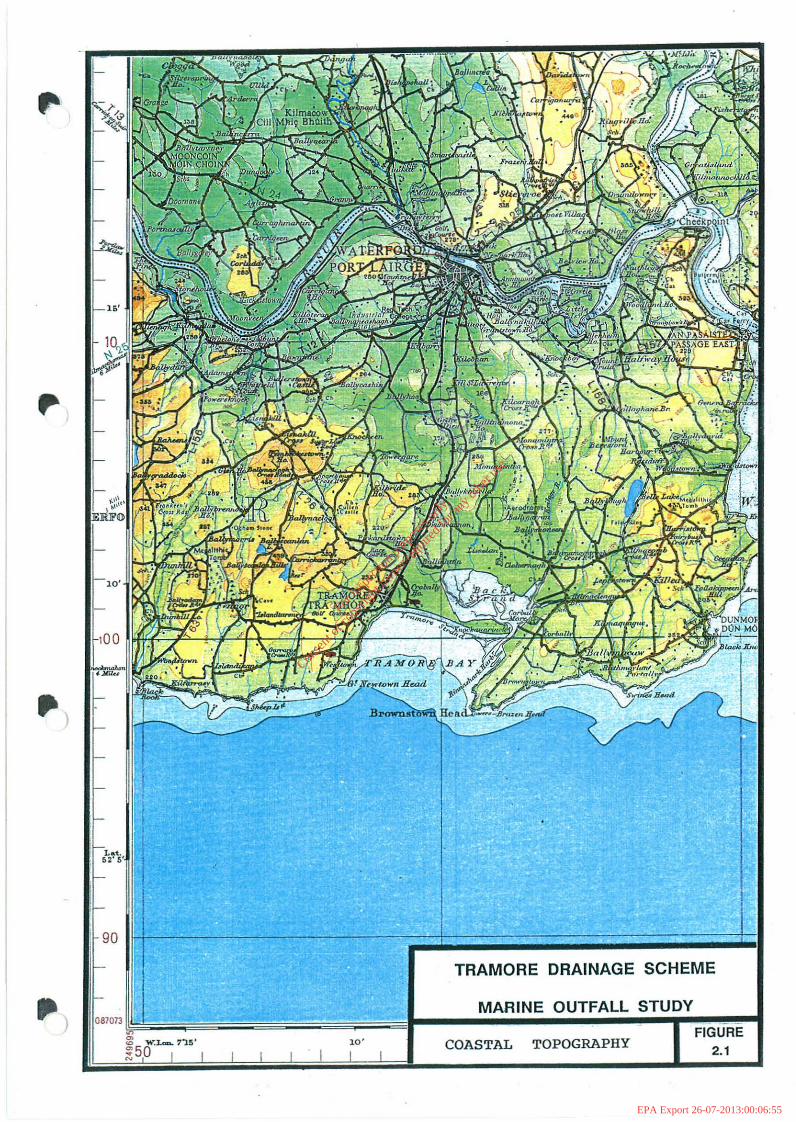
Tramore Bay is almost rectangular in shape, some 4.25km in length and3km wide, formed between Great Newtown Head to the west and BrownstownHead to the east (Figure 2.1). The axis of the bay lies just west ofdue south thus exposing the area to the full force of winter storms.The surrounding lands have four different coast types (ref: 35). Thewestern edge of the bay is predominantly composed of high rocky cliffswhich drop down to form a boulder clay cliff at the western end of thetown. The low lying bathing beach area is backed by a shingle stormridge which then leads onto the Burrows dune system stretching away tothe eastern corner of the bay. Behind the dunes is a salt marsh area(3km x 1.Skm) known as the Backstrand. A narrow tidal inlet (theRinnashark Channel) at the eastern end of these dunes allows tidalwaters in and out of the Backstrand. The eastern peninsula risesagain to high ground although the cliffs are not as sheer as thewestern edge.
The bathymetry of the region is characterised by a gently sloping(1:150) sea floor from the 20 metre depths at the bay entrance (Figure1.1) up to the shallow waters of Tramore Strand. Despite the flushingeffect of the Backstrand, the prevailing south-westerly winds havecaused a sand bar to accumulate at the narrow entrance which almostcompletely dries on a low water spring tide. Drawing no. 673/1enclosed with this report shows the results of a sounding surveyconducted during this study.
2.2 TIDE AND WATER LEVEL CHANGES
2.2.1 Astronomical Tides
The tidal regime in Tramore Bay is almost purely semidiurnal with twohigh waters (HW) and two low waters (LW) each day (24 hours). No datais available for Tramore in the Admiralty Tide Tables (ATT, ref: 3)though accurate predictions are available for the nearest standardport of Cobh. Approximate time and height corrections are alsoincluded for the secondary ports of Dungarvan Harbour and Dunmore Eastto the west and east of Tramore respectively.
As part of the study a recording tide gauge was deployed. The initialinstrument was a shore based recorder with a pressure sensor fitted ina temporary stilling well attached to the outside of the pier (toavoid 'drying out' problems at low tide) at Lady Elizabeth's Cove.However strong winds from the east during the first night ofdeployment caused some damage and it was obvious that without a majorstructural fabrication the safety of the stilling well could not be
3
For
insp
ectio
n pur
pose
s only
.
Conse
nt of
copy
right
owne
r req
uired
for a
ny ot
her u
se.
EPA Export 26-07-2013:00:06:55

Tramere Marine Outfall Study Report
guaranteed. In the absence of any further sheltered, non-dryinglocation being available in the bay area, a decision was taken toinstall an offshore tide gauge in conjunction with the recordingcurrent meter mooring.
A temporary tide pole established on Lady Elizabeth's Cove was used totransfer the land based height Ordnance datum to the offshore gauge.A harmonic analysis was performed on the data set (Appendix 1) andthis allowed the major features of the tidal statistics relative toOrdnance Datum (Malin) to be summarised in Table 2.1 and compared withthe Dungarvan Harbour and Dunmore East information.
Note that as the data covers a relatively short period the reliabilityof the mean sea level should be treated with caution. The ATT clearlystates that mean sea level (MSL) variations of up to +/-0.3m may beexpected to occur at times for periods of up to 1 month.
Level
Highest Astronomical Tide (HAT)Mean High Water Spring (MEWS)Mean High Water Neap (MHWN)Mean Sea level (MSL)Mean Low Water Neap (MLWN)Mean Low Water Spring (MLWS)Lowest Astronomical Tide (LAT)Table 2.1 - Tidal statistics (m)
2.2.2 Seiches
ATTDungarvan
Harbour
*1.81.0
*-1.2-1. 9
*relative to
Tramore
2.41.91.10.1
-0.9-1. 7
-2.3Malin Head
ATTDunmoreEast
*1.70.8
*-1. 3-2.0
*datum.(* No Data).
The short data record from the tide gauge at Lady Elizabeth's Coveshowed a pattern of small oscillations imposed on the main tidalsignal particularly around the high and low waters (Appendix 1).These effects were also noted in manual tidal records taken during thebathymetric survey. These small level changes (approx. O.lm) are dueto the natural periods of oscillation of the bay. The standing wavesformed in Tramore were observed to have periods of around 20 minutes.
2.2.3 Storm Surges
A storm surge refers to a rise in water levels above expected tidallyinduced values due to the action of wind stress on the water surface.It normally also includes that rise in level which results from thedecrease in atmospheric pressures associated with low pressure weathersystems. In the absence of any site specific data recourse was made to
4
For
insp
ectio
n pur
pose
s only
.
Conse
nt of
copy
right
owne
r req
uired
for a
ny ot
her u
se.
EPA Export 26-07-2013:00:06:55

Tramore Marine Outfall Study Report
results obtained from the Institute of Oceanographic Sciences (UK)continental shelf storm surge model. This predicts the 50-year stormsurge elevation for a grid point outside Tramore Bay to be to.75metres (ref:17).
2.2.4 Combination of Tides and Surges
In the most pessimistic case the 50 year surge level is assumed tocoincide with the highest astronomical tide giving an extreme stillwater level of 2.4m + 0.75m = 3.1Sm 0.0. (Malin).
However from comparisons with model results and observed data atseveral ports around the perimeter of the Irish and U.K. coastlines,Flather (ref: 17) has been able to refine this rather negativeapproach and estimate the more probable extreme level reached due to acombination of tide and surge. Overall it appears that thecombination of a mean spring tide (MHWS) and 50 year surge gives anestimate of the 100 year level which should be accurate to within 10%,with a slight tendency to overestimation.
Probable Tramore 100 year still-water level
= 1.9m + 0.75m
2.65m 0.0. (Malin)
(i.e. 0.25m higher than H.A.T.)
2.3 WIND CLIMATE
The Irish Meteorological Service network of land based coastalsynoptic stations comprises a total of 8 sites at which reliable,calibrated measurements of wind speed and direction (plus otherparameters) have been collected over varying periods between 1940 todate. Tramore is situated approximately midway between the stationsat Roches Point, Co. Cork and Rosslare, Co. Wexford. As the bay issurrounded by some areas of high ground which afford varying degreesof shelter a recording anemometer was installed for the duration offield works. The instrument, located on a 10m mast at the municipaldump entrance just behind the bathing strand, was used to provideaccurate short term data for interpretation of oceanographicmeasurements (Figure 2.2).
The long term wind patterns observed in the bay area will be similarto those experienced at Roche's Point and Rosslare (Figure 2.3, ref:33) except that the high lands along the east and west perimeters ofthe bay will afford some shelter or funnelling effects depending on
5
For
insp
ectio
n pur
pose
s only
.
Conse
nt of
copy
right
owne
r req
uired
for a
ny ot
her u
se.
EPA Export 26-07-2013:00:06:55

Tramore Marine Outfall Study Report
wind direction. In this regard it is probable that the wind data for
Roche's Point would be most likely to represent the wind regimeexperienced at Tramore.
Of particular relevance to the siting of a marine outfall is thefrequency and strength of the onshore winds during the summer bathingmonths. These aspects are discussed further in section 3.3. Ananalysis of the Roche's Point data (appendix 1) provided thestatistical information presented in Tables 2.2a,b below.
Table 2.2a - Percentage of onshore winds(figure 2.3) at Roche's Point, years 1963
MonthMayJuneJulyAugust
South West South16.6 19.317.8 18.518.0 18.815.8 15.1
South East
11. 99.47.6
12.0from sectors 110 0 T to 250 0 T
- 1979.
2.4
Month South West South South EastMay 5.7 4.6 1.2June 3.8 2.6 0 . 2July 3.0 2.1 3.0
August 3.6 2.1 0.9Table 2.2b - Percentage of onshore winds from sectors 110 0 T to 250 0 Tand greater than 17 knots (8.5m/s, F5+) in Roche's Point, years 1963 1979.
TIDAL STREAMS AND CURRENTS
Some drogue tracking studies had been conducted in the north-easterncorner of the bay by the Consulting Engineers in 1976 and 1990.However due to the sparsity of any further verifiable current data,measurements were conducted as part of the study. An Interocean S4electromagnetic recording current meter was moored for two weeks, 1.0metres above the seabed, approximately in the middle of the bay (atthe proposed extension point of the existing outfa11,figure 2.2).During the bathymetric survey it was noticed that this location wasrather rocky and the mooring was therefore moved further inshore ontoan area with a 'clean' sandy bottom. Statistical plots of the dataanalyses are presented in Appendix 1 and as the time series plot(Figure 2.4) clearly shows, the tidal currents are very weak. For the
first five days the rocky outcrops were Obviously providing asheltering effect but even on the clear bottom an average speed of
only 3.65 cm/sec (0.07 kts) was recorded.
The current directions recorded were also rather erratic and untypicalof the well defined ebb and flood directions usually associated with
coastal regions. On some days there were good examples of a rotary
6
For
insp
ectio
n pur
pose
s only
.
Conse
nt of
copy
right
owne
r req
uired
for a
ny ot
her u
se.
EPA Export 26-07-2013:00:06:55

Tramere Marine Outfall Study Report
change of direction, predominantly in a clockwise fashion.
The dominant directions associated with the flow are towards thesector 020 0 T to 1500 T accounting for 64% and 250 0 T to 290 0 T for 17% ofthe recorded data. The remaining 19% of directions are evenlydistributed. The most consistent feature of the observed currentpattern is a flow towards the Rinnashark channel for a 3 hour periodbefore high water. Strongest speeds were recorded during this timethough generally these were much lower than dye experiments (section2.5) suggested.
2.5 DYE DISPERSION TESTS
2.5.1 Survey Data
Three separate continuous dye release and tracking exercises wereaccomplished to provide information on the likely trajectory ofeffluent plumes on the ebb and flood tides. An FMI dosing pump wasused to deliver a continuous accurate flow of Rhodamin B dye solutionover the discharge period, while a Turner Designs 10 fluorometer wasutilised to track the dye. In each of the cases the dye dispersedhorizontally and vertically to form an ever larger and more diluteplume/patch advecting through the bay in the direction of the tidalcurrents. The dye was tracked until low levels were reached or untilno further useful information would be observed.
2.5.2 15th June Spring Tide - Rinnashark Channel Release
This release was accomplished from the narrow entrance to theBackstrand. The dosing boat was moored in the middle of the channel
and pumping started as soon as the ebb tide flow was observed to
commence (0915 hrs). At the end of the ebb tide an attempt was madeto reach the dosing boat and cease the discharge. However despite thevery shallow draft of the tracking launch, no channel could be foundacross the sand bar which had almost completely 'dried out'. As soonas the rising flood tide allowed the dosing pump was stopped (1750hrs) .
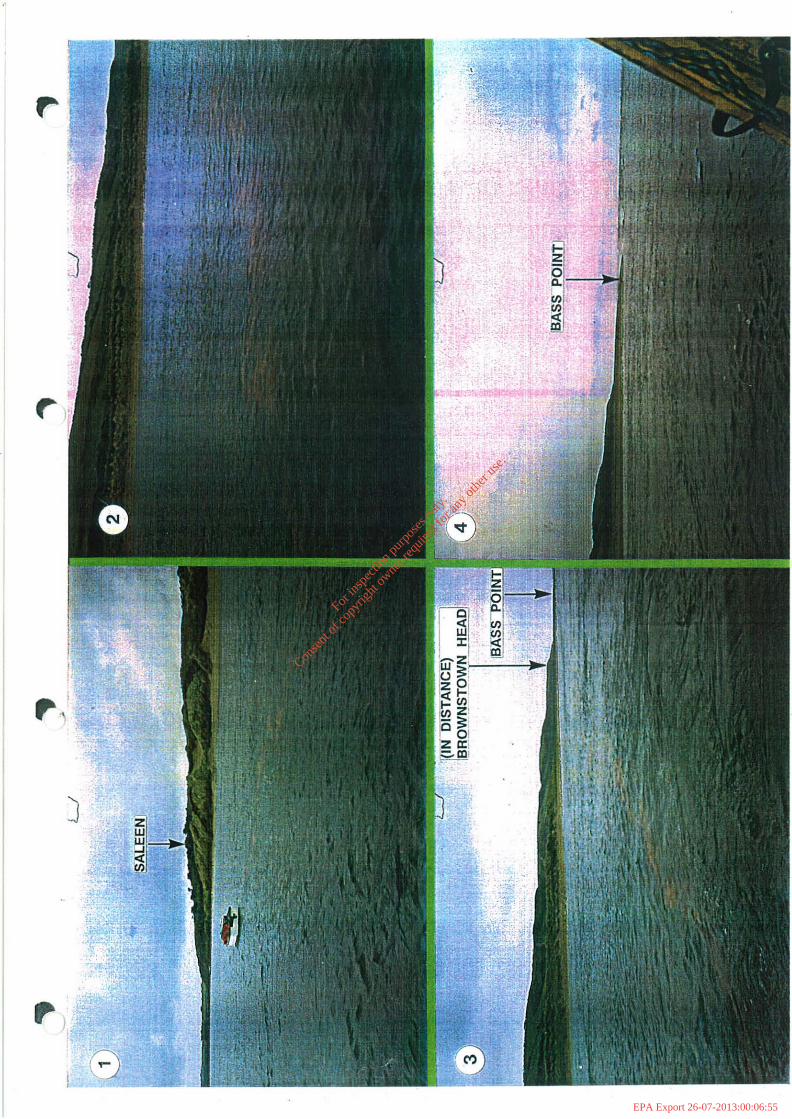
The results were very encouraging from the bathing strand point ofview in that the dye kept very close to the eastern side of the baybefore rounding Brownstown Head to be carried away eastwards by thestronger coastal tidal currents. A westerly wind, although only
5m/sec, will have assisted the plumes trajectory along the east sideof the bay. Tracking of the plume progress and in particular theareas of maximum concentration was impeded by its closeness to therocky shore. The results are presented in drawing no. 673/2.Photographs of the release and the ebbing plume are shown in plates 14.
7
For
insp
ectio
n pur
pose
s only
.
Conse
nt of
copy
right
owne
r req
uired
for a
ny ot
her u
se.
EPA Export 26-07-2013:00:06:55

2.5.3 19th June Average Tide - Bay Release
Tramore Marine Outfall Study Report
This release was accomplished from the middle of the bay approximately1600m from the HW mark over a 12.5 hour calm weather period. Itprovided an good data set to confirm the qualitative observations madeduring the survey program.
The results are presented on drawing no. 673/3. The continuous dosingwas commenced at 0900 hrs (flood tide, HW-3 hrs). One hour later a
thin plume of dye about 700m long was tracked heading directly towards
the Rinnashark channel (photographs No.5 and 6). This plume rotated
slowly clockwise and expanded as the flood tide continued such that by
high water (midday) the main axis of orientation was towards
Brownstown Head.
From high water through to low water (1730 hrs) the plume stayed in
this area expanding in width but not being advected by tidal currents
in any particular direction. A patch of concentrated dye also formed
around the dosing boat as the dye discharge continued (photograph 7).
Clearly observed at this time were several 'tide-lines' (fronts) in
the bay with various flotsam, jellyfish etc. accumulating along thelines. The dye patch was also restricted by these tide lines
preferring to remain in the 'bay waters' rather than dilute into the
offshore coastal waters.
At the start of the next flood tide (1930 hrs, HW-5 hours) the plumefrom the dosing vessel stretched some 1100 metres directly towards the
town (photograph 8). Subsequently it slowly again rotated clockwise
towards the Rinnashark channel and expanded in width. The following
day the whole bay was searched for residual dye concentrations and
very low values were found in the shallow waters right across the main
bathing beach and in front of the dunes.
2.5.4 20th June - Average Tide Rinnashark Channel Release
A further ebb tide release was conducted from the Rinnashark Channel
narrows and the results are presented on drawing no. 673/4. Once
again the dye kept close to the western edge of the bay after exiting
the channel, but midway down the bay turned to travel in a south
westerly direction out into the coastal waters. The moderate (F4-5)easterly wind which prevailed during the day would have assisted thistrajectory and possibly moved the influence of the stronger coastaltidal currents further into the bay itself.
2.6 DISCUSSION OF FIELD DATA
The most interesting features of the site are the direction of tidal
flows. The field data has clearly shown that at the start of ebb, the
8
For
insp
ectio
n pur
pose
s only
.
Conse
nt of
copy
right
owne
r req
uired
for a
ny ot
her u
se.
EPA Export 26-07-2013:00:06:55

Tramore Marine Outfall Study Report
tide flows towards Brownstown Head in a south easterly direction.principal flood direction follows the opposite path and flows inthe south east past Brownstown Head and on towards Tramore town.
Thefrom
These patterns are at odds with those expected from the generaldirection of tidal propagation in the Celtic Sea the associatedcurrent patterns (ref: 6, figures 2.5a,b). A possible explanation isthat a large scale coastal eddy may develop along the Waterford coastduring times of maximum tidal flow. This eddy would rotateanticlockwise during the flood tide and clockwise during the ebb. Theresulting tidal directions in Tramore Bay would be in keeping withthose observed during the study.
While the presence of an eddy does account for the main features it islikely to be an over-simplification of a complex coastal flow pattern.Without more extensive field data it is not possible to develop a morecomprehensive explanation.
The field data has also clearly confirmed one of the reasons whyTramore has proved such a popular tourist resort; the absence of anysignificant currents which would be dangerous to swimmers. Therecording current meter data, the dye dispersion results and generalinformation obtained from the local fishermen all confirmed that incalm weather conditions the bay is a very low energy regime. Clearlyit is a 'bay' in the true sense, almost completely cut-off from thestronger tidal currents observed off the south coast.
For the disposal of treated effluent from a marine outfall located inthe centre of the bay this is not ideal because it implies limitedflushing. Therefore a worst case scenario is that a steady statesituation will develop where effluent input is balanced simply bynatural decay. This aspect is covered in more detail in the modellingsection. The proposed alternative discharge point in the Rinnasharkchannel has a significant advantage however, in that at the releasetime of high water the general movement of bay waters, although slow,are in the easterly direction of their rotation. This will tend tokeep effluent close to the eastern edge of the bay and away from themain bathing beach.
9
For
insp
ectio
n pur
pose
s only
.
Conse
nt of
copy
right
owne
r req
uired
for a
ny ot
her u
se.
EPA Export 26-07-2013:00:06:55
90
TRAMORE DRAINAGE SCHEME
TOPOGRAPHYCOASTAL10'
087073~'==i;~~~~~~S==;;;;;i!~d__...;M~A;;.R;,;,;1N~E.O;.;;;U.;,T,;.F,;,;A;,;;L;,;;LIIIS;;T,;.;,U.D';'Y__--1FIGURE
2.1
For
insp
ectio
n pur
pose
s only
.
Conse
nt of
copy
right
owne
r req
uired
for a
ny ot
her u
se.
EPA Export 26-07-2013:00:06:55

/#/~ ~ !~///Mii{~. /j N
~~/://// ///:/0 ,Back Strand . / 'fj I ~/
J .~
--~(
"~---
TRAMORE BAY OUTFALL SURVEY
LOCATION OF INSTRUMENTS
Scale: 1/50000
FIGURE 2.2
For
insp
ectio
n pur
pose
s only
.
Conse
nt of
copy
right
owne
r req
uired
for a
ny ot
her u
se.
EPA Export 26-07-2013:00:06:55

VALENTIA OBSERVATORY
"ROCHE'S POINT
1,,1. " l"qUl"I D I lU lS lD lS ...1 \ , 1 I I lui. oi IpttO
1..,lorl tort'D-ll, H1101
S-I 1,11'1 III ex mort mtlrtSlU<.•, I, & J or _.
TRAMORE DRAINAGE SCHEME
MARINE OUTFALL STUDY
WEATHER STATIONS FIGURE2.3
For
insp
ectio
n pur
pose
s only
.
Conse
nt of
copy
right
owne
r req
uired
for a
ny ot
her u
se.
EPA Export 26-07-2013:00:06:55

TRAlvl0RE TOWN MARINE OUTFALL STUDY
CURRENT SPEED AND DIRECTION
20 II I I J I I [LOCATiON 1 LOCATION 2
I
,JW~MI ~~I ~.
r--U 15 fQ)(I)
""'E~ 10 I-
oww0.. 5(I)
o ~~~~_--"'-L-'---.:IC~~15/06 21/06 24/06
-
·UUfiLWi~~~27/06
, J
(..
I T,
}ill
, I I1-
, .
I ,I 1 ~I-~ , ,,,., .
I II ~lIIi I "I .' I ', . I.' i i
I "V , Jill1MT I~",' III~ III Iii
! ,'i I ~ ~~, I I ! i \ ~II r~ ,'~ , I i .-L I~I ' ,~,
1-
360
315r--(I)Q)
270Q)>-Q)
225Q)
-0~
180Z0
135I-0
90wD:::
0 45
o15/06 18/06 21/06
DATE
24/06 27/06 1991
FIGURE 2.4
For
insp
ectio
n pur
pose
s only
.
Conse
nt of
copy
right
owne
r req
uired
for a
ny ot
her u
se.
EPA Export 26-07-2013:00:06:55

~
--.
".....
g
>•,.,0
\
\
\
\
\
\
-_•.....•__..... _ .......1:
N
For
insp
ectio
n pur
pose
s only
.
Conse
nt of
copy
right
owne
r req
uired
for a
ny ot
her u
se.
EPA Export 26-07-2013:00:06:55
G_-..........-
For
insp
ectio
n pur
pose
s only
.
Conse
nt of
copy
right
owne
r req
uired
for a
ny ot
her u
se.
EPA Export 26-07-2013:00:06:55

J ~00:0::JlD
-, [If' <r- 0:,
f-
..JWZZ<J:'0
~---0:<J:(J)
<zza:
,,t,r
'. ,
W'0:'0':E'[2If-
")
'Ul'::rw
0>
0:
,0
0:
,0
:JJi=lDIW
W
'0:
lD
10';:5
I:;;1<
::J
'0:
W
f->0:s
For
insp
ectio
n pur
pose
s only
.
Conse
nt of
copy
right
owne
r req
uired
for a
ny ot
her u
se.
EPA Export 26-07-2013:00:06:55

3
3.1
3.1.13.1. 2
3.2
3.2.13.2.23.2.3
PREDICTIVE MODELS OF WATER QUALITY
OVERVIEW
Objectives and RequirementsModelling Approach and Methods
TIDAL CIRCULATION MODELS
2D Coastal Circulation Model3D Coastal Circulation ModelEffects of Wind on Circulation Patterns
3.3 EFFLUENT DISPERSION MODELS
3.3.13.3.23.3.33.3.43.3.5
3.4
3.4.13.4.2
Outfall Sites and Modelling OptionsCalibration of the Dispersion ModelValidation of the Dispersion ModelComparison of Outfall OptionsEffects of Onshore Winds on Outfall Options
RELIABILITY OF DISPERSION MODELLING ANALYSIS
Model Sensitivity AnalysisComparisons with General Models
3.5 ADDITIONAL CONSIDERATIONS
3.5.1 Initial Dilutions - Near Field Model
For
insp
ectio
n pur
pose
s only
.
Conse
nt of
copy
right
owne
r req
uired
for a
ny ot
her u
se.
EPA Export 26-07-2013:00:06:55

Tramere Marine Outfall Study Report
3 PREDICTIVE MODELS OF WATER QUALITY
3.1 OVERVIEW
3.1.1 OBJECTIVES AND REQUIREMENTS
The purpose of the model analysis was to establish the likely effectsof the proposed municipal waste discharges on the coastal waterquality. Faecal coliforms were taken as the contaminant most relevantto the study and the principal indicator of water quality.
The main requirements of the models were that they should be sitespecific and capable of incorporating real bathymetry, topography andtidal variations.
3.1.2 MODELLING APPROACH AND METHODS
a) Hydrodynamics
A two dimensional depth averaged flow model (M2D) was first used tosimulate the tidal circulations in the study area. The model is basedon a finite difference solution of the equations of motion of fluidflow and incorporates non-linear effects, wind induced currents anddrying bank features (ref:28). Essentially the area to be modelled isdivided up into a large number of discrete cells which represent theshape and bathymetry of the site. Boundary conditions are thenapplied in the form of tidal oscillations and the equations of motionsolved for each cell at successive time steps. The predicted speed,direction and elevation data can be then compared with field results.
A three dimensional version of the circulation model (M3D) wasemployed for particular tidal situations. This model was also used toprovide a more accurate representation of wind effects close to theshoreline.
b) Dispersion of Effluent
The principal models used for predicting the effluent dispersionpatterns are based on the concept of particle tracking (LPTM). Withthis technique, the continuum of dispersed contaminant is simulated bya cloud of discrete particles. Horizontal movement is provided by theinput of a velocity field (from the flow model) and then theapplication of a suitable numerical advection scheme. Diffusion issimulated by a statistical 'random walk' process which, for example inone dimension allows a particle to step a +/- distance (d) at each time
. step with equal probability. Decay is modelled by the random removal
10
For
insp
ectio
n pur
pose
s only
.
Conse
nt of
copy
right
owne
r req
uired
for a
ny ot
her u
se.
EPA Export 26-07-2013:00:06:55
Tramare Marine Outfall Study Report
of particles at each time step appropriate to the decay rate (ref:27).
Two and three dimensional versions of the models were used asrequired.
Several other less specific dispersion models were employed as a checkon the consistency of the principal modelling approach. These includedbox model, a Gaussian patch model (PLU7) and a diffuser jet model(IJP, ref:29).
d) Calibration and Verification
(i) Hydrodynamic Models
The mechanics of water flow are particularly amenable to mathematical
analysis by finite difference solutions as employed in M2D/M3D.Calibration is achieved by comparing predicted current speeds withfield measurements and adjusting model coefficients as required. The
method is robust in that once bathymetry and tidal elevations arespecified to a reasonable accuracy and typical model coefficientsemployed good predictions will be achieved without the need forspecific adjustments. The validation process involves comparingcalibrated model results with a separate field data set and isdiscussed in a later section.
(ii) Dispersion Models
Dispersion models are more sensitive to variations in coefficients and
can produce widely different predictions under similar tidalconditions. Thus the calibration and verification are more involved
and relies on field data. Dye and drogue measurements provide themain information against which predictions can be assessed. Dyetrack data were the principal method used at Tramore and these weresupplemented with drogue data recorded by M.C. 0' Sullivan during 1976and 1990.
3.2 TIDAL CIRCULATION MODELS
3.2.1 2D COASTAL CIRCULATION MODEL
The tidal current patterns in Tramore Bay were first simulated withthe 2 dimensional flow model at a 100m x 100m cell resolution. Thismodel covered an area of some 35km2 and included the entire outer bayand the Backstrand. This area is shown schematically in Plots l.a &1.2 which are included with this report.
Bathymetric data for the model was taken from Admiralty chart 2049,
M.C. 0' Sullivan drawing nO. 65/3520/2A and hydrographic measurements
11
For
insp
ectio
n pur
pose
s only
.
Conse
nt of
copy
right
owne
r req
uired
for a
ny ot
her u
se.
EPA Export 26-07-2013:00:06:56

Tramore Marine Outfall Study Report
made during this study. In the first instance boundary conditions
were taken from co-tidal charts (ref:4) and other documentedreferences. These suggested typical spring tidal amplitudes ofapproximately 1.8m on the boundaries with a phase difference of 1 0
(time difference = 2 minutes) between Great Newtown and BrownstownHeads.
Several model runs were conducted for a range of boundary parametersto obtain simulations equivalent to observed mean neap and mean spring
tides. The effects of variations in these parameters (phase andamplitude) both seawards and parallel to the coast on the openboundaries was investigated. As no significant differences were notedwithin the survey area it was decided to adopt model representationswith fixed amplitudes on the western and eastern boundaries and aclosed southern boundary. The general flow patterns obtained wereconsistent with these observed during the field works and the possibleformation of a coastal gyre as discussed in section 2.6.
The appropriate tidal amplitude figures were obtained by an iterativeprocess whereby the differences were adjusted until the predictedspeeds in the bay resembled the data recorded at the current metersite. No adjustments were made to other model parameters. Figures forcurrent speed are given in Table 3.1. These show reasonable agreementfor the flood tide. On the ebb tide the model predicts higher speedsthan were measured and the comparison is not as good. This isbelieved to be due to the inability of the model to reproduce thecomplex tidal rotational pattern which develops in the bay (see
section 2.4). The implications are discussed in a later section.
Model* R.C.M.** Model/R.C.M.m/s m/s
Flood 0.08 0.08-0.10 100%- 80%Ebb 0.08 0.04-0.06 200%-133%* Depth averaged, ** adjusted to depth averaged via nower law formula.
Table 3.1. - 2D Flow model - Comparison of model speeds andmeasured speeds at recording current meter (R.C.M.) locationfor an average tide.
The general validity of the model simulations in the Rinnasharkchannel area were confirmed by comparing predicted values with drogue
track data recorded by M.C. 0' Sullivan in 1976 and 1990 (drawings65/3520,2A,8A). These showed reasonable agreement both in speed anddirection patterns. However as the model was not run with the specificwind and tide conditions which prevailed during the drogue trackingthe results are not directly comparable.
12
For
insp
ectio
n pur
pose
s only
.
Conse
nt of
copy
right
owne
r req
uired
for a
ny ot
her u
se.
EPA Export 26-07-2013:00:06:56

Tramore Marine Outfall Study Report
Vector diagrams of the model output at 12 times during an average
tidal cycle are shown in Plots 2.1 to 2.12. These illustrate thedominant features of the bay circulations and are consistent with thepatterns observed from the dye releases. The formation of the jetfrom the Rinnashark channel is evident on the ebb tide as is thestrong flow past Brownstown Head. Note that the model boundariesrestrict the flow in this outer area and the local patterns are notnecessary reproduced accurately.
3.2.2 3D COASTAL CIRCULATION MODEL
The two dimensional model M2D provides a single depth averagedestimate of current speed and direction at each cell. In reality thesurface current will be faster than that near the bottom where bedfriction retards the flow. While it is widely accepted that thisvariation can be adequately described by a power law profile (ref:ll)no general simplification can be applied to the directional changeswith depths. This feature is thus best evaluated with a full
representation of the flow field.
A three dimensional flow model (M3D, ref:31) was therefore establishedfor specific cases (i.e. onshore wind) where the validity andreliability of the 2D approach could be questionable. The modelemployed a depth grid similar to that used for the 2D model describedin the previous section. Minor adjustments were made to the Backstrandarea and the Rinnashark channel. These limited the extensive dryingareas (which produce a high computational overhead) though the mass
flux of water was maintained. Four cells were utilised in thevertical, the thickness of each cell being one quarter of the waterdepth.
Boundary conditions similar to those employed in the 2D grid wereused. Results for the model cell at the current meter/bay dye releaselocation (figure 3.1) are presented in Table 3.2. For the floodingtide these compare favourably both with previous predictions and field
results. The ebb tide speeds are higher than those recorded on thecurrent meter though they are similar to surface values (O.15m/s)noted during the dye release of 19/6/91. Weather conditions were good
on this occasion and results should compare very well with modelpredictions. Vector diagrams for the surface layer and near bed layer
are shown in Plots 3.1 to 3.4. These illustrate the variations that
occur with depth.
13
For
insp
ectio
n pur
pose
s only
.
Conse
nt of
copy
right
owne
r req
uired
for a
ny ot
her u
se.
EPA Export 26-07-2013:00:06:56
Tramore Marine Outfall Study Report
MODEL LAYER (m/ s ) RCM (m/ s )
1 2 3 4 BottomFlood Speed .078 .078 .075 .064 0.07-0.09(HW-1) Dim. 110 111 114 117 050-140Ebb Speed .125 .121 .110 .090 0.03-0.05(LW-1) Dim.* 272 273 272 272 250-270Table 3.2 - Variations (surface to bottom) in 3D model peakspeed (m/s) and direction (OT) predictions and comparison withcurrent meter data for an average tide. Note that model layer 4should be compared with ReM data. Water depth = 10m (* Accounts
for < 20~ of ebb flows and occurs late in ebb).
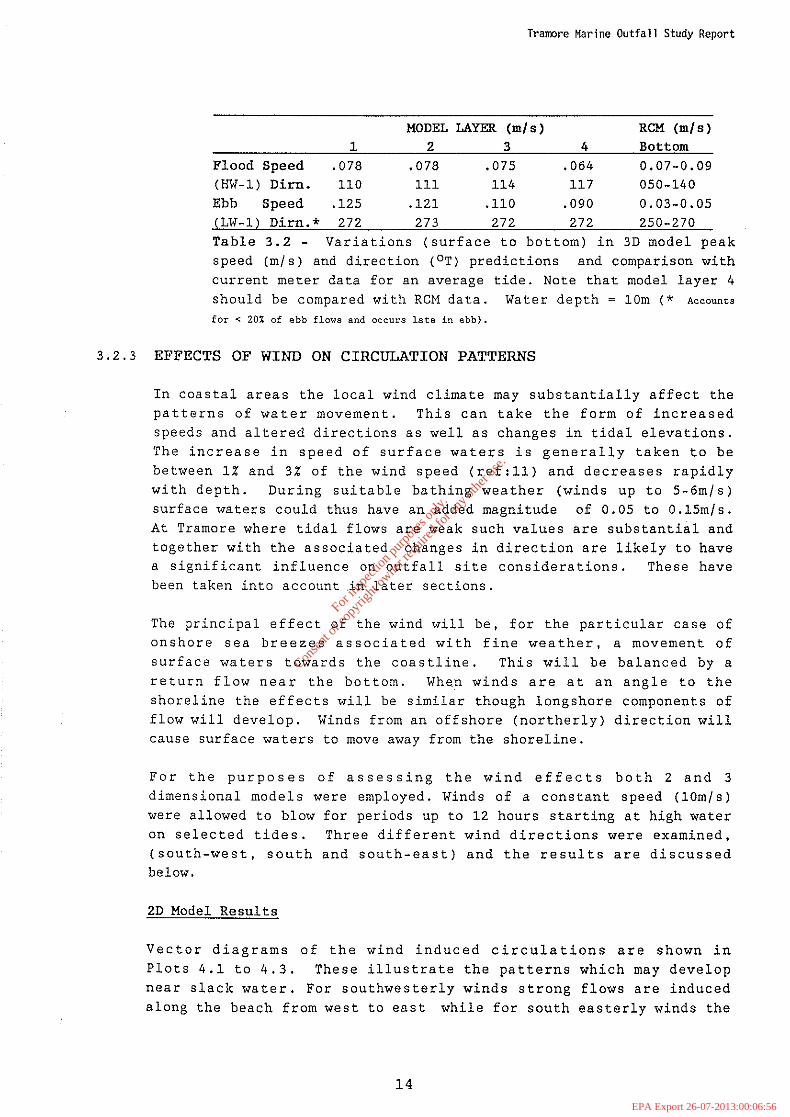
3.2.3 EFFECTS OF WIND ON CIRCULATION PATTERNS
In coastal areas the local wind climate may substantially affect thepatterns of water movement. This can take the form of increasedspeeds and altered directions as well as changes in tidal elevations.The increase in speed of surface waters is generally taken to bebetween 1% and 3% of the wind speed (ref:11) and decreases rapidlywith depth. During suitable bathing weather (winds up to 5-6m/s)surface waters could thus have an added magnitude of 0.05 to 0.15m/s.At Tramore where tidal flows are weak such values are substantial andtogether with the associated changes in direction are likely to havea significant influence on outfall site considerations. These havebeen taken into account in later sections.
The principal effect of the wind will be, for the particular case ofonshore sea breezes associated with fine weather, a movement ofsurface waters towards the coastline. This will be balanced by areturn flow near the bottom. When winds are at an angle to theshoreline the effects will be similar though longshore components offlow will develop. Winds from an offshore (northerly) direction willcause surface waters to move away from the shoreline.
For the purposes of assessing the wind effects both 2 and 3dimensional models were employed. Winds of a constant speed (10m/s)were allowed to blow for periods up to 12 hours starting at high wateron selected tides. Three different wind directions were examined,(south-west, south and south-east) and the results are discussedbelow.
2D Model Results
Vector diagrams of the wind induced circulations are shown inPlots 4.1 to 4.3. These illustrate the patterns which may developnear slack water. For southwesterly winds strong flows are inducedalong the beach from west to east while for south easterly winds the
14
For
insp
ectio
n pur
pose
s only
.
Conse
nt of
copy
right
owne
r req
uired
for a
ny ot
her u
se.
EPA Export 26-07-2013:00:06:56
Tramore Mar;ne Outfall Study Report
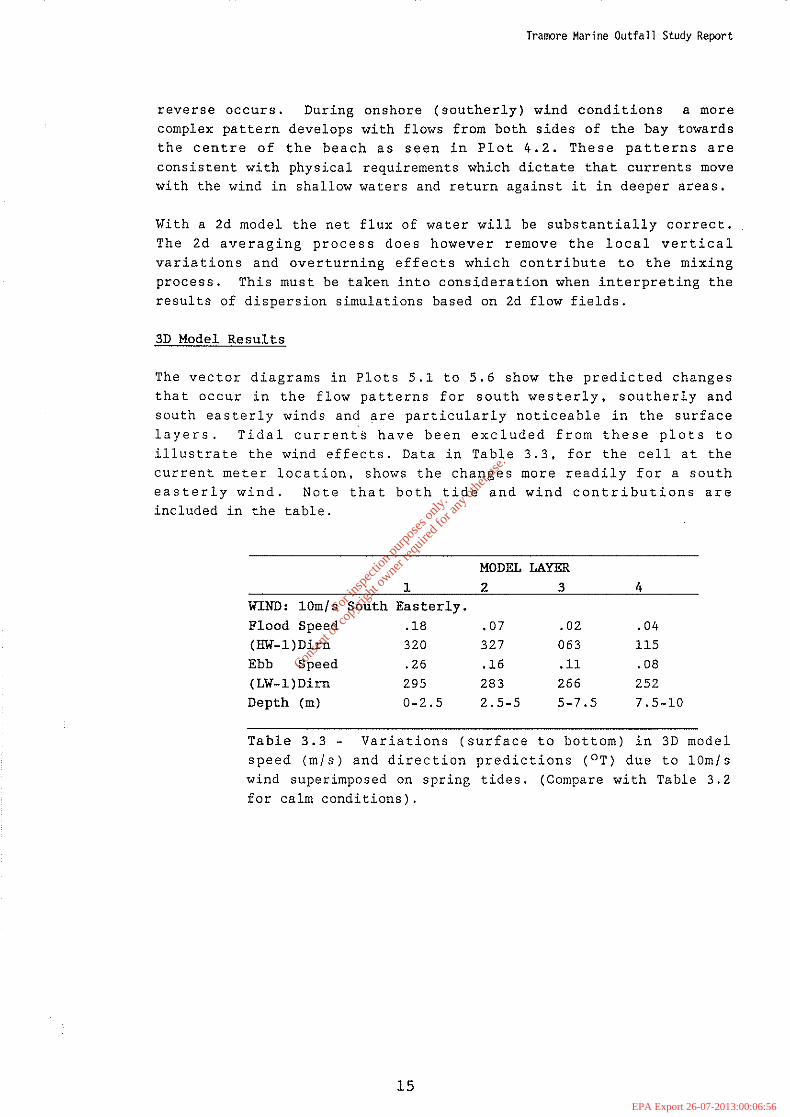
reverse occurs. During onshore (southerly) wind conditions a morecomplex pattern develops with flows from both sides of the bay towardsthe centre of the beach as seen in Plot 4.2. These patterns areconsistent with physical requirements which dictate that currents movewith the wind in shallow waters and return against it in deeper areas.
With a 2d model the net flux of water will be substantially correct.The 2d averaging process does however remove the local verticalvariations and overturning effects which contribute to the mixingprocess. This must be taken into consideration when interpreting theresults of dispersion simulations based on 2d flow fields.
3D Model Results
The vector diagrams in Plots 5.1 to 5.6 show the predicted changesthat occur in the flow patterns for south westerly, southerly and
south easterly winds and are particularly noticeable in the surfacelayers. Tidal currents have been excluded from these plots toillustrate the wind effects. Data in Table 3.3, for the cell at thecurrent meter location, shows the changes more readily for a southeasterly wind. Note that both tide and wind contributions areincluded in the table.
MODEL LAYER
1 2 3 4WIND: lOm/s South Easterly.
Flood Speed .18 .07 .02 .04(lIW-l)Dirn 320 327 063 115Ebb Speed .26 .16 .11 .08(LW-l)Dirn 295 283 266 252Depth (m) 0-2.5 2.5-5 5-7.5 7.5-10
Table 3.3 - Variations (surface to bottom) in 3D modelspeed (m/s) and direction predictions (oT) due to 10m/swind superimposed on spring tides. (Compare with Table 3.2
for calm conditions).
15
For
insp
ectio
n pur
pose
s only
.
Conse
nt of
copy
right
owne
r req
uired
for a
ny ot
her u
se.
EPA Export 26-07-2013:00:06:56

Tramore Marine Outfall Study Report
3.3 EFFLUENT DISPERSION MODELS
3.3.1 OUTFALL SITES AND MODELLING OPTIONS
Potential Outfall Sites
The consulting engineers identified two locations adjacent to the townwhich could provide suitable sites for the proposed marine outfall.These options are illustrated in figure 3.1 and can be described as:-
(A) an outfall 4.3km east of the town into the Rinnashark Channel termed 'Channel Outfall'; this would be an intermittentdischarge;
(B) an outfall from the beach 2.0km east of the town - termed 'BayOutfall'; two outfall lengths, IOOOm and l500m, were examined.This would be a continuous discharge.
Modelling Options
Simulations of the dispersion of discharges from each location wereconducted with the particle tracking model. For the channel outfall(A) an ebb tide release was adopted while for the bay outfalls (B)continuous releases were employed. In each case unit sourceequivalents were employed to generate relative concentrations andallow for intercomparison of results. Simulations were made for calmweather, spring and neap tides and an assumed effluent decay time(Tgo) of 12 hours.
Results were compared with measured dye data to test the validity ofthe modelling approach and assess the likely variability of thepredictions. The discharge from the channel outfall (A) was subjectedto a sensitivity analysis to further assess how predicted coliformconcentrations are likely to vary with decay time (TgO) and change indispersion coefficients.
Other relevant aspects of the coastal dispersion characteristics wereexamined with the aid of general models. These included the formationof concentrated surface plumes and averaged background concentrations.The effects of various diffuser configurations and associated initialdilutions. in the immediate vicinity of the discharge points, the nearfield, were also examined. Note that generallly in the far-field,where full mixing has been achieved, concentrations are independent ofthe near-field conditions.
16
For
insp
ectio
n pur
pose
s only
.
Conse
nt of
copy
right
owne
r req
uired
for a
ny ot
her u
se.
EPA Export 26-07-2013:00:06:56

Tramore Marine Outfall Study Report
Effluent Flow Rates and Characteristics
Information on the effluent characteristics provided by the consultingengineers are outlined in Tables 3.4a,b. Data for the future highseason loadings were used in preparing the faecal coliformconcentrations which are presented with unit source values in thefollowing sections. For the channel outfall it was assumed 12 hoursequivalent of the D.W.F. is discharged over a 3h period. For the bayoutfal1s a continuous flow of l.5xD.W.F. was assumed. This is atypical daylight flow and allows for the short duration peaks thatoccur in a municipal sewerage system.
Population All High D.W.F. D.W.F
Equivalent Year Season (m3 /d) (m3 / s)Present: 7000 15000 3400 0.039Future: 10000 20000 4500 0.052Table 3.4a - Projected population and effluent flow rates.
ParameterFaecal Coliforms:Faecal Strep:Decay Time:
Raw Effluent9.6x10 6 j100ml5.0xl06 jlOOml
Treated Effluent1. Oxl0 6 jlOOml8.0xl04 /lOOmlTgo = 12 hours
Table 3.4b - Effluent bacterial characteristics.
3.3.2 CALIBRATION OF THE DISPERSION MODEL
Dispersion in shallow coastal waters results from a combination ofphysical mechanisms. These principally relate to the current and th€manner in which it varies both vertically and laterally. The greaterthe 'velocity shear' the more rapid will be the dilution of theeffluent. In the particle tracking model the longitudinal dispersionis governed principally by the velocity field which is input from theflow model. The lateral dispersion in the model can be adjusted byvarying the diffusion coefficient (Kx )' This coefficient varies fromsite to site but is generally found to be in the range of 0.lm2js to1.Om2js for coastal waters.
Initial calibration of the model was achieved by simulating thechannel release and comparing the spread of the plume with theobserved spread of the dye plumes. A diffusivity of 0.25m2 js was foundto produce results similar to the field observations and this valuewas adopted. The higher value of 0.5m2 js produced an excessivelylarge plume whereas with the lower value of 0.lm2 js the model plumedid not disperse adequately. This aspect is discussed further insection 3.4.
17
For
insp
ectio
n pur
pose
s only
.
Conse
nt of
copy
right
owne
r req
uired
for a
ny ot
her u
se.
EPA Export 26-07-2013:00:06:56
Tramere Marine Outfall Study Report
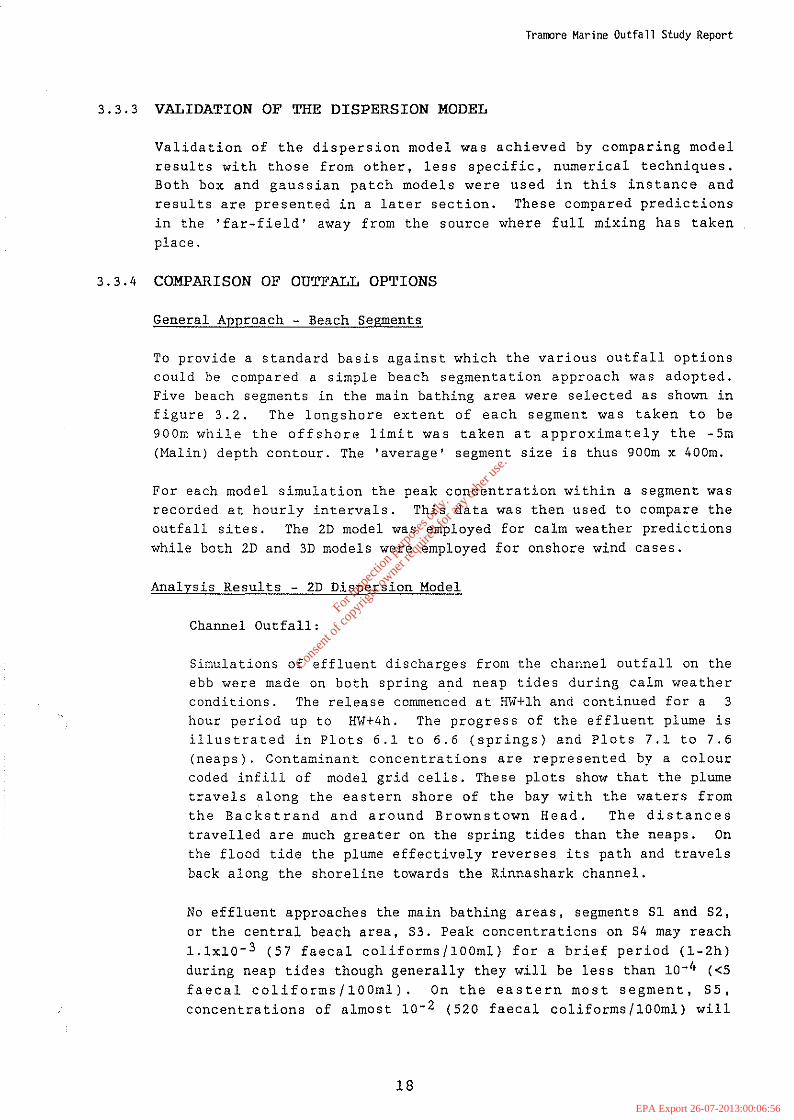
3. 3.3 VALIDATION OF THE DISPERSION MODEL
Validation of the dispersion model was achieved by comparing modelresults with those from other, less specific, numerical techniques.Both box and gaussian patch models were used in this instance andresults are presented in a later section. These compared predictionsin the 'far-field' away from the source where full mixing has takenplace.
3.3.4 COMPARISON OF OUTFALL OPTIONS
General Approach - Beach Segments
To provide a standard basis against which the various outfall optionscould be compared a simple beach segmentation approach was adopted.Five beach segments in the main bathing area were selected as shown infigure 3.2. The longshore extent of each segment was taken to be900m while the offshore limit was taken at approximately the -5m(Malin) depth contour. The 'average' segment size is thus 900m x 400m.
For each model simulation the peak concentration within a segment wasrecorded at hourly intervals. This data was then used to compare theoutfall sites. The 2D model was employed for calm weather predictionswhile both 2D and 3D models were employed for onshore wind cases.
Analysis Results - 2D Dispersion Model
Channel Outfall:
Simulations of effluent discharges from the channel outfall on theebb were made on both spring and neap tides during calm weatherconditions. The release commenced at HW+1h and continued for a 3hour period up to HW+4h. The progress of the effluent plume isillustrated in Plots 6.1 to 6.6 (springs) and Plots 7.1 to 7.6(neaps). Contaminant concentrations are represented by a colourcoded infi11 of model grid cells. These plots show that the plumetravels along the eastern shore of the bay with the waters fromthe Backstrand and around Brownstown Head. The distancestravelled are much greater on the spring tides than the neaps. Onthe flood tide the plume effectively reverses its path and travelsback along the shoreline towards the Rinnashark channel.
No effluent approaches the main bathing areas, segments Sl and S2,or the central beach area, 83. Peak concentrations on 84 may reach1.1xIO- 3 (57 faecal coliforms/100ml) for a brief period (1-2h)during neap tides though generally they will be less than 10-4 «5faecal coliforms/100ml). On the eastern most segment, 85,concentrations of almost 10- 2 (520 faecal coliforms/100ml) will
18
For
insp
ectio
n pur
pose
s only
.
Conse
nt of
copy
right
owne
r req
uired
for a
ny ot
her u
se.
EPA Export 26-07-2013:00:06:56

Tramore Marine Outfall Study Report
occur frequently though as the plots show this will be in theregion adjacent to the channel. Some contaminated waters returnto the Backstrand area on the flood tide. Peak concentrationswill be of the order of 10- 3 (- 52 faecal coliform/lOOml). Theresults are summarised in Table 3.5a,b.
Notes:
(A) The unit source strength method allows the bacterialconcentrations associated with any source to be determined. Forexample if a unit discharge (flow = lm3/s, concentration = 1) isdiluted to beach concentration of 10- 2 , then for a discharge of0.052m3 /s with 10 6 faecal coliforms per 100mi (10 10 per m3 ) thebacterial concentration will be (10- 2 ) x (0.052) x (10 10 ) = 520faecal coliforms/lOOml.
(B) For the timed release (3h) from this outfall the sourcestrength was taken to be 4 units per second. This assumes thatover a tidal period the average flow to the sewer is equal to thedesign dry weather flow (D.W.F.).
(C) The model may indicate unrealistically high concentrations invery shallow areas where drying or reflooding of a cell hasrecently occurred. Here the water depth may be as little as O.lmand therefore several particles entering the cell simultaneouslyby means of the random diffusion method employed in the model maydistort the results.
Bay Outfalls:
Simulations were made of discharges from 1000m and l500m chainageson the bay outfall line. These were for calm conditions springand neap tides and a decay time of l2h. Diagrams indicating theposition of the developing effluent plume (i.e. start of releaseat high water) during spring tides are shown in Plots 8.1 to 8.10.These provide a graphical indication of areas affected.
For the l500m outfall the model predicts that effluent will notapproach the main town beaches (i.e segments Sl and 82). Howeveron the flood tide concentrations of 1.6xlO-4 to 1.3xlO- 3 (coliformequivalents 13 to 101 faecal coliforms/per 100ml) could berecorded off the beach segments S3, 84 and S5. Some effluentwill also enter the Backstrand on the flooding tide. This willhave a low concentration of about 6xlO- 4 « 50 faecalcoliforms/lOOml) (figures 8.1 to 8.7).
A discharge from the 1000m outfall (figures 8.8 to 8.10) willfollow a similar pattern to that from the l500m point. Again
19
For
insp
ectio
n pur
pose
s only
.
Conse
nt of
copy
right
owne
r req
uired
for a
ny ot
her u
se.
EPA Export 26-07-2013:00:06:56

Tramere Marine Outfall Study Report
during calm weather the model predicts that no effluent will reachthe main town beach (segments 81 and 82) while off segments 83,84and 85 concentrations may reach 1.lxlO- 2 (858 faecalcoliforms!lOOml). Average concentrations in the Backstrand will be10- 4 ( < 10 faecal coliforms!lOOml). The results are summarisedin Table 3.5a,b. Plots 9.1 to 9.4 show the positions of the plumefor neap tide conditions.
Notes
(A). The outfall pipe lengths for the bay outfall is based onshoreline details as indicated in 0.5. 6 Inch 8heet 26. This mapwas prepared in 1922-1923 and does not take account of recentcoastal changes. Therefore the 'true' outfall length may besomewhat different.
(B). For the bay outfalls the source strength used was a unit persecond. The resultant concentrations are thus equivalent to thosearising from a continuous discharge at the dry weather flow(D.W.F.). In calculating the associated bacteria concentrations ahigher flow of 1.5 x D.W.F. was adopted. This allows for the peakdischarges that occur at times during the day. If such a peakoccurred at a particular stage of the tide then the short termconcentrations within the plume, and therefore the shorelinelevels, could be higher than would be obtained using only the dryweather flow.
(C). In the model concentrations are determined from the numberof particles within a cell volume at a given time. The resultsare thus averaged over the volume and are not the same as peaklevels which could occur in a concentrated surface plume. Thissituation does not arise for the channel outfall and for the bayoutfalls when critical conditions such as onshore wind arise theincreased mixing in the nearshore zone should prevent theformation of such plumes. The spatial resolution of the model(100m x 100m) should also ensure that predictions are realistic atthe shoreline.
20
For
insp
ectio
n pur
pose
s only
.
Conse
nt of
copy
right
owne
r req
uired
for a
ny ot
her u
se.
EPA Export 26-07-2013:00:06:56

BeachSegment
SITE AChannel
Outfall
Tramore Mar;ne Outfall Study Report
Option/LengthSITE B (Bay)
1000m 1500m
4.0xI0- 4
5.9xl0- 3
8PRING TIDES8182838485NEAP TIDES81828384 1.lxlO- 3
85 8.3xl0- 3
5.1xl0- 3
1.1xl0- 2
2.6xl0- 3
8.1xl0- 4
1.6x10- 4
1. 3xl0- 3
7.9xl0- 4
Table 3.5a - Maximum contaminant concentration (units/m3 ) atbeach segments during calm weather. (Based on a continuousrelease of 1 unit per second from the bay outfalls and 4 unitsper second for 3h from the channel outfall).
BeachSegment
Outfall
SITE AChannel
Option/Length
SITE1000m
B (Bay)1500m
8PRING TIDES81
82 400S3 858 1384 21 203 10185 307 63 62NEAP TIDES81828384 5785 432
Table 3.5b - Maximum faecal coliform concentration (nos/l00ml)
at beach segments during calm weather for a continuous flow of1.5xD.W.F. from the bay outfalls and a 12 hour equivalentdischarge of lxD.W.F. from the channel outfall released over a3 hour period.
21
For
insp
ectio
n pur
pose
s only
.
Conse
nt of
copy
right
owne
r req
uired
for a
ny ot
her u
se.
EPA Export 26-07-2013:00:06:56

Tramore Marine Outfall Study Report
3.3.5 EFFECTS OF ONSHORE WINDS ON OUTFALL SITE SELECTION
The particular case of onshore winds and how they affect the shorelinebacterial concentrations are obviously important given the status ofthe bathing beach at Tramore. The simulation of this situation is nottrivial as the circulation processes in the nearshore region arecomplex and model predictions difficult to verify. However, it isstill possible to get a general indication of the likely maximumconcentrations by incorporating appropriate modifications into themodels.
For the purposes of assessing the wind effects both the 2D and 3Dmodels were employed. Winds of a constant speed (10m/s) were allowedto blow for periods up to 12 hours starting at high water on selectedtides as outlined in 3.2.3. A number of different wind directionswere examined. These results are discussed in the following sections.
2D Model Approach
The semi-enclosed nature of Tramore Bay allowed the wind drivencirculations to be investigated with the 2d flow model. The flowpatterns, together with the particle tracking model, were used tosimulate the fate of effluent discharges from the potential outfallsites. To ensure that 'worst case' conditions were obtained at themain bathing beach a south easterly wind and the calm weatherdiffusion coefficient (0.25m2 /s) were used. The effect of this lowdiffusion coefficient was to limit the effluent spreading (which isnormally substantially enhanced by wind and associated wave action)and thus produce over estimates of peak values. In practice theonshore wind will promote increased mixing, particularly near theshoreline, and peak values will be reduced.
Channel Outfall:
Graphical output from the simulation of the channel outfallrelease are illustrated in Plots 10.1 to 10.4. These show theprogress of the effluent plume as it becomes entrained in thelongshore current and is carried towards Tramore town. The peakconcentrations on the various segments arising from this plume aregiven in Table 3.6. Note that the south-easterly wind isconsidered to be worst case as during both south-westerly andsoutherly winds the longshore flow does not approach the town(Plots 4.1 to 4.3).
22
For
insp
ectio
n pur
pose
s only
.
Conse
nt of
copy
right
owne
r req
uired
for a
ny ot
her u
se.
EPA Export 26-07-2013:00:06:56

Tramore Marine Outfall Study Report
Beach Segment Sl S2 S3 S4 S5Concentration(units/m3 ) 5.6xlO- 3 4.8x10- 3 6.2x10- 3 9.4x10- 3 3.1x10- 2
Max Coliform Conc.(nos/100ml) 291 250 325 490 1612*
Table 3.6 - Channel Outfall: Predicted maximum shorelineconcentrations for an average tide and combined with a southeasterly wind of 10m/s. (coliform numbers based on 12 hours of 1x D.W.F. discharge over a 3h period (* At channel end of segment only).
Bay Outfalls:
The 2d model is not suited to investigating the fate of dischargesfrom the bay outfalls in this instance. This is a result of the2d averaging which eliminates vertical overturning motion.
Effectively the strong longshore flows prevent effluent
approaching the beach and thus misleading results are obtained.An illustration of this situation is shown in Plots 10.5, 10.6.The more usual approach for investigating offshore outfalls with2D models is to neglect the wind induced circulations andparametarise the increased mixing with a high diffusioncoefficient (ref:10). However this method only works when thetidal currents are greater than the wind induced flows.
3D Model Approach
In the three dimensional modelling approach the effects of onshorewinds were treated separately to the tidal motion. Thissimplification was made as the tidal currents are small compared tothose which can be generated by the wind (up to 3% of the winds
speed). Simulations of a surface release of contaminant from the bayoutfalls produced the results indicated in Table 3.7. Plumetrajectories from a 1500m outfall, for the case of onshore wind are
indicated in Plots 11.1 to 11.3. Similar results for a 1000m outfallare shown in Plots 11.4 to 11.6. From these results it is seen thatmaximum levels, particularly in the areas adjacent to the outfall(i.e. S2-S4), will reach 1560 faecal coliforms/100ml for the 1000m
outfall and 780 faecal coliforms/100ml for the 1500m outfall. Noteagain that in evaluating the coliform concentrations the source flowhas been taken to be 1.5 times the D.W.F.
23
For
insp
ectio
n pur
pose
s only
.
Conse
nt of
copy
right
owne
r req
uired
for a
ny ot
her u
se.
EPA Export 26-07-2013:00:06:56

Tramore Marine Outfall Study Report
Wind Sl S2 S3 S4 SS
1000m OutfallSouth WesterlySoutherlySouth EasterlylS00m OutfallSouth WesterlySoutherlySouth Easterly
8.0x10- 4 7. OxlO- 3 5. Ox10- 3
6.0xlO- 3 2.0x10- 2 2.0x10- 2 -8.0x10- 3 9.0x10- 3 9.0x10- 4 -
4.0x10- 3 3. Ox10- 3
5.0x10- 3 1.0x10⁻² -1. Ox10- 4 1. Ox10-'4 1. Ox10- 4 -
Table 3.7a - 3D Model, Bay Outfalls - Shoreline contaminantconcentrations. (Based on a continuous release of 1 unit persecond) .
Wind Sl S2 S3 S4 SS
1000m OutfallSouth Westerly 63 550 390Southerly 468 1560 1560South Easterly 624 702 63lS00m OutfallSouth Westerly 312 234Southerly 390 780South Easterly <50 <50 <SO
Table 3.7b - 3D Model, Bay Outfalls - Shoreline faecal coliformconcentrations (nos/100ml) for a flow of l.SxD.W.F.
Reliability of Wind Modelling
Models of wind induced current can give a reasonable indication of theflow patterns which may develop during specific conditions. Howeverthe approach does have limitations. The principal factor affecting thereliability is the shape of the coast. In exposed areas where thecoastline is generally straight the artificial boundaries of themodel will affect the flow. In enclosed or semi-enclosed areas wherecontinuity of flow dominates and provided the model boundaries are anadequate distance from the region of interest the bathymetric effectsshould dominate and give acceptable predictions.
Additional factors which affect the realism of the simulation are theimposition of a constant wind field over the model area. In practicethis wind field will be varying both with time and with spatialposition. The contributions to the resulting wind induced currentarising from these sources are difficult to quantify.
24
For
insp
ectio
n pur
pose
s only
.
Conse
nt of
copy
right
owne
r req
uired
for a
ny ot
her u
se.
EPA Export 26-07-2013:00:06:56

Tramore Marine Outfall Study Report
At Tramore it would be expected that a south-easterly wind would havemore of an effect on the discharges from the bay outfalls than thechannel outfall which lies in the lee of the Brownstown headland.This sheltering cannot be reproduced in the model with the result thatmore of the effluent plume from the channel discharge travels towardsthe main bathing beach as shown in Plots 10.1 to 10.4 than would do soin reality. Therefore in this instance the model effectively presentsa worst case situation.
3.4 RELIABILITY OF DISPERSION MODELLING ANALYSIS
The information presented in the previous sections provide estimatesof the likely contaminant considerations within the survey area andhow they vary with time and outfall siting. In addition to thevariability predicted by the modelling methods other physical factorscombine to introduce further local uncertainty in the results. Theseeffects can be quantified by investigating the sensitivity of themodelling methods and also comparing results with less specificcalculations. These aspects are discussed in the following sections.
3.4.1 MODEL SENSITIVITY ANALYSIS
Results from the particle tracking model have indicated how thebacterial concentrations will vary depending on the siting of theoutfall. For these comparisons all the model variables have been heldconstant and only the discharge position changed. While the valuesemployed are best estimates based on the field results it isillustrative to examine how the predictions may change if these areadjusted.
The main variables are:
coliform source concentration;coliform decay time;lateral diffusion coefficient.
Coliform Source Concentration
The coliform concentrations of raw municipal effluent can be veryvariable ranging from (typically) lxl0 6 to 50xl0 6 faecal coliformsper lOOmIs (ref:ll,39). Therefore for the evaluation process atypical value of 10xl0 6 faecal coliforms per 100ml was adopted for raweffluent and lxl0 6 per 100ml for treated effluent. The model outputsare linearly related to the coliform concentration and thus avariation in source strength will bring about a corresponding changein the surrounding water concentrations.
25
For
insp
ectio
n pur
pose
s only
.
Conse
nt of
copy
right
owne
r req
uired
for a
ny ot
her u
se.
EPA Export 26-07-2013:00:06:56

Tramere Marine Outfall Study Report
Coliform Decay Time
The decay times of bacteria has been the subject of extensive resea=chover the past 40 years. Other than to confirm the principal fac~ors
effecting the decay rate little consensus of results has beenachieved. Typical T90 values are now taken as somewhere betwee~ 2hand 20h (ref:38). In the summertime sunlight is the main cause ofbacterial mortality and thus decay times of 2-6h can be expec~ed
during the day. At night bacteria may remain alive much longer
particularly if the waters are relatively warm and thus decay t~es
could reach l2h or more. During the colder months water tempera~~re
may be the predominant factor in determining mortality as the amc~t
of sunlight is limited. Decay times of 6-l2h would be expected inthese situations.
In Tramore Bay the combination of clear waters and shallow bathyme~=y
will assist bacterial mortality during the summer bathing season.
Therefore the 12h value adopted is likely to be conservative andrepresentative of 'worst case' conditions.
The relationship between concentration and decay time is not linearand therefore for comparison purposes the model must be re-run .~th
appropriate decay times. This has been done for the channel out:alloption (site A) and the results are presented graphically in Plots12.1 to 12.4. A further comparison in terms of the peak pl~~e
concentration is given in table 3.8.
PeakConcentrations
Low Water
High Water
4h
3.2x10- 3
4.7xI0- 5
Decay Time (TgO)l2h
7.5xlO- 3
2.9x10- 4
20h
1.Ox10- 2
1.OxlO- 3
Table 3.8 - Effect of decay time (T90) on peak concentrations in ~je
effluent plume (Note concentrations are recorded at the same spa~~al
location).
Variability of Diffusion Coefficients
In a coastal area the diffusion coefficients can vary significar.~ly
from place to place. This arises because at any location mixing isthe result of a unique combination of depth, tidal characteristi:s,fluid properties, sea bed type and exposure to wind and wave action.It is generally not possible to measure the local variation direc~ly
and thus data for a particular area obtained from dye experiments
provides an empirical representation of the diffusion coefficient wi~h
26
For
insp
ectio
n pur
pose
s only
.
Conse
nt of
copy
right
owne
r req
uired
for a
ny ot
her u
se.
EPA Export 26-07-2013:00:06:56

Tramore Marine Outfall Study Report
a single fixed value. Values could be in the range 0.1 - 1.Om2!s(lateral) though typically would be less than 0.5m2 js. The value of0.25m2 js used earlier in this report (section 3.3.2) was found to givegood model comparisons with observed dye trajectories.
To establish how this variability might affect the predicted bacteriallevels it was necessary to re-run the models using different values.The results of simulations for the channel outfall, one withKx~o.lm2js (little spreading) and Kx~0.5m2js (more spreading) arepresented in Plots 13.1 to 13.4. These should be compared with theresults for Kx=0.25 m2 js already presented in Plots 6.1 to 6.7. Peakconcentrations in the plume at high and low waters are compared inTable 3.9.
PeakConcentration
Diffusion Coefficient (Ky )
Low WaterHigh Water
7.8xlO- 3
1.2xlO-47.5xlO- 3
2.9xIO- 47.6xlO- 3
3.8xlO-4
Table 3.9 Effect of diffusion coefficient on peak concentrationsin the effluent plume (Note concentrations are recorded at the samespatial location).
Summary of Sensitivity Analysis Results
Of the model variables considered the effluent source concentrationwill have the most significant effect on the shoreline bacteriallevels. Being linearly related a change in input values will produce asimilar change in predicted values. If for example the sourcestrength changes by a factor of 2 then the predicted values throughoutthe model will change by the same amount.
The analysis has shown that predicted peak values are not verysensitive to changes in decay time and diffusion coefficient. For theset of cases considered the variation is probably within a factor of2-3. Thus for a given effluent source strength and allowing for thevariability of the coefficients the model results will be accurate towithin a factor of 2-3.
27
For
insp
ectio
n pur
pose
s only
.
Conse
nt of
copy
right
owne
r req
uired
for a
ny ot
her u
se.
EPA Export 26-07-2013:00:06:56

Tramore Marine Outfall Study Report
3.4.2 COMPARISONS WITH GENERAL MODELS
Average Bacterial Concentrations Box Model
Estimates of the average bacterial concentration within the wider bayarea can be made with the aid of a simple box model. The results aregenerally indicative of likely shoreline levels and serve as aconfirmation of the more complex model results. This model alsoallows the overall effects of outfall length, tidal range andbacterial decay to be rapidly assessed. The concentrations are notindicative of background levels in the outer bay since full mixingwill never occur and local areas of high concentrations (i.e. plumes)will be observed. They are however indicative of background levels inthe Backstrand under certain circumstances.
With the box model method effluent from the town (via either the bayor the channel outfalls) is assumed to discharge into an enclosed box.For the bay outfall the box is defined as the tidal prism consistingof the water volume inshore of the outfall location and extendingalongshore for one tidal excursion (the distance travelled by a waterparticle from one slack water to the next). Thus the volume, Vbox' ofthe tidal prism is given by:-
Vbox ~ (h/2)L E
where L = outfall length, h = water depth, E = tidal excursion.
A similar argument is applied to the channel outfall where the boxvolume is determined by the Backstrand volume. The box is assumedfully mixed and no mixing is permitted with the open sea. Theaverage concentration Cbox is then a steady state balance betweeninput from the. source (J units / second) and natural mortality of thebacteria expressed in terms of their TgO decay time. It is given bythe equation:-
Cmax = J TgO / 2.3Vbox
Bay Outfall:
Three different outfall lengths have been examined for the bayoutfall and results are presented in Table 3.l0a,b for comparativepurposes. These indicate that an increase in the outfall lengthfrom lOOOm to l500m will reduce the average bacterialconcentration by a factor of 2. The variation introduced by thespring - neap tidal cycle is a further factor of between 1 and 2.
28
For
insp
ectio
n pur
pose
s only
.
Conse
nt of
copy
right
owne
r req
uired
for a
ny ot
her u
se.
EPA Export 26-07-2013:00:06:56
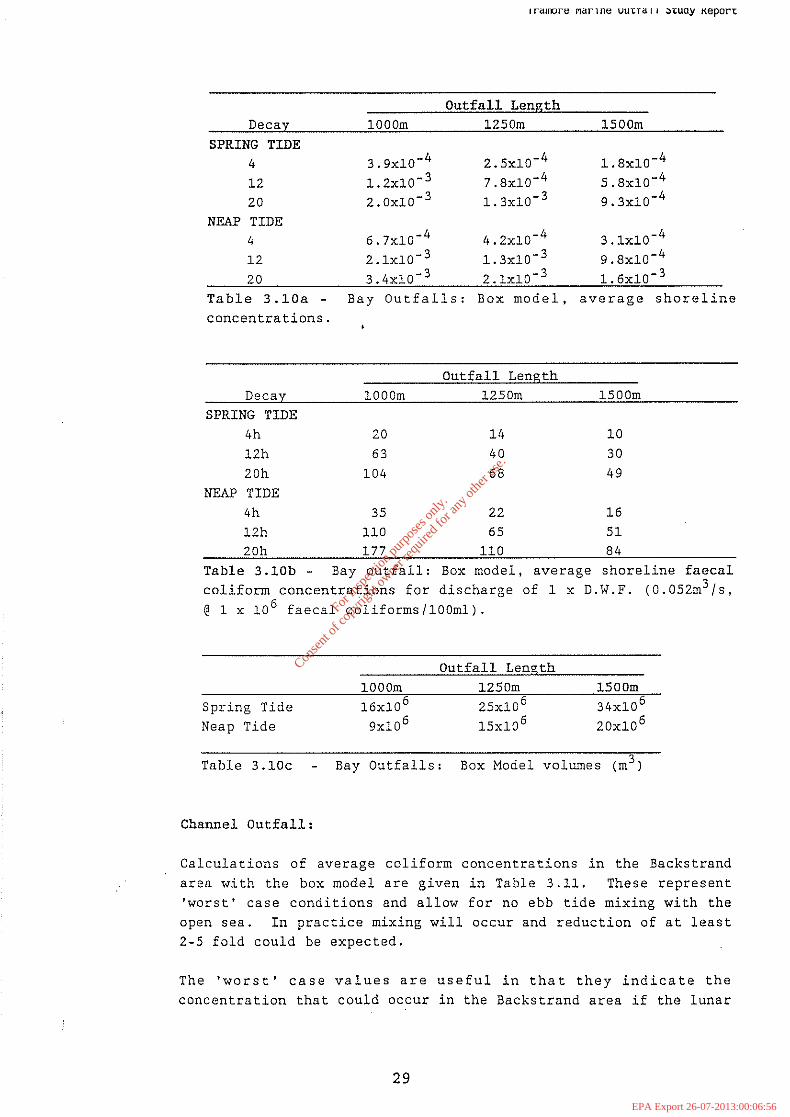
I rall()re Mar 1ne UUl::Ta I I ')l::uay KepOr1:
Outfall LengthDecay 1000m 1250m 1500m
SPRING TIDE4 3.9x10⁻⁴ 2.5x10⁻⁴ 1. 8x10⁻⁴
12 1. 2x10- 3 7.8x10- 4 5.8x10- 4
20 2.0x10- 3 1. 3x10- 3 9.3x10- 4
NEAP TIDE4 6.7x10- 4 4.2x10- 4 3.1x10⁻⁴
12 2.1x10- 3 1. 3x10- 3 9.8x10- 4
20 3.4x10- 3 2.1x10- 3 1.6x10- 3
Table 3.10a - Bay Outfalls: Box model, average shorelineconcentrations.
Outfall LengthDecay 1000m 1250m 1500m
SPRING TIDE4h 20 14 1012h 63 40 3020h 104 68 49
NEAP TIDE4h 35 22 1612h 110 65 5120h 177 110 84
Table 3.10b - Bay outfall: Box model, average shoreline faecalcoliform concentrations for discharge of 1 x D.W.F. (0.052m3/s,@1 x 10 6 faecal coliforms/100ml).
Outfall Length
Spring TideNeap Tide
lOOOm 1250m 1500m
Table 3.10c
Channel Outfall:
Bay Outfalls: Box Model volumes (m3)
Calculations of average coliform concentrations in the Backstrandarea with the box model are given in Table 3.11. These represent'worst' case conditions and allow for no ebb tide mixing with theopen sea. In practice mixing will occur and reduction of at least2-5 fold could be expected.
The 'worst' case values are useful in that they indicate theconcentration that could occur in the Backstrand area if the lunar
29
For
insp
ectio
n pur
pose
s only
.
Conse
nt of
copy
right
owne
r req
uired
for a
ny ot
her u
se.
EPA Export 26-07-2013:00:06:56

Tramere Marine Outfall Study Report
clock controlling the tidal discharge malfunctioned. In such
circumstances treated effluent could be released during part ofthe flood tide period giving rise to concentrations similar tothose indicated in the table.
Spring Tide ~N~e~a~p~T~~~'d~e _
Unit Source Coliforms Unit Source Coliforms4h 8.3x10- 4 43 2.1x10- 3 110
1Zh 2.5xI0- 3 130 8.3x10- 3 430ZOh 4.2x10- 3 220 I.Ox10- 2 5ZOTable 3.11 - Channel Outfall: Backstrand area, average
contaminant concentrations for unit source (units{m3 ) and faecalcoliform concentrations ({100ml) for the D.W.F.
Gaussian Patch Model
A 3D Gaussian patch model (PLU7) was used to estimate effluentconcentrations resulting from the proposed outfa1ls. This model
predicts the distribution of a decaying contaminant in a sea ofconstant depth, arising from a continuous source. The continuoussource is synthesised by the summation of many infinitesimally smallreleases. This method is analogous to the field dye experiments inthat each release is allowed to advect and disperse like a dye plume.Basic assumptions are that the patch may be described by a threedimensional gaussian concentration distribution, the velocity fieldis uniform over the water depth and that the vertical component of thewater velocity is zero. Thus while the model incorporates thefeatures of the site it does not represent its true characteristicsand results (particularly shoreline values) would be leGs reliablethan those indicated by the particle tracking models.
Bay Outfalls:
Predicted shoreline concentrations for a 1000m and 1500m outfallsare given in Tables 3.1Za,b. Current speeds, water depths anddispersion rates are based on field measurements.
Sl S2BEACH SEGMENT
S3 S4 S5
5.9x10- 3
2.6x10- 34.4x10- 3
3.5xlO- 33.3x10- 3
3.6xIO- 38.6x10- 3
1. 8x10- 33.1x10- 4
3.8x10- 5
SPRING TIDES1000m1500mNEAP TIDES1000m >lx10- 6 5. 5x10- 3 4. Ox10- 3 8. Ox10- 3 5. 7x10- 3
l500m >lx10- 6 1.6x10⁻⁴ 2.3x10- 3 3.7x10- 3 2.3x10- 3
Table 3.12a Bay Outfall: Predicted peak shorelinecontaminant concentrations for a unit effluent source, T90~12h.
30
For
insp
ectio
n pur
pose
s only
.
Conse
nt of
copy
right
owne
r req
uired
for a
ny ot
her u
se.
EPA Export 26-07-2013:00:06:56
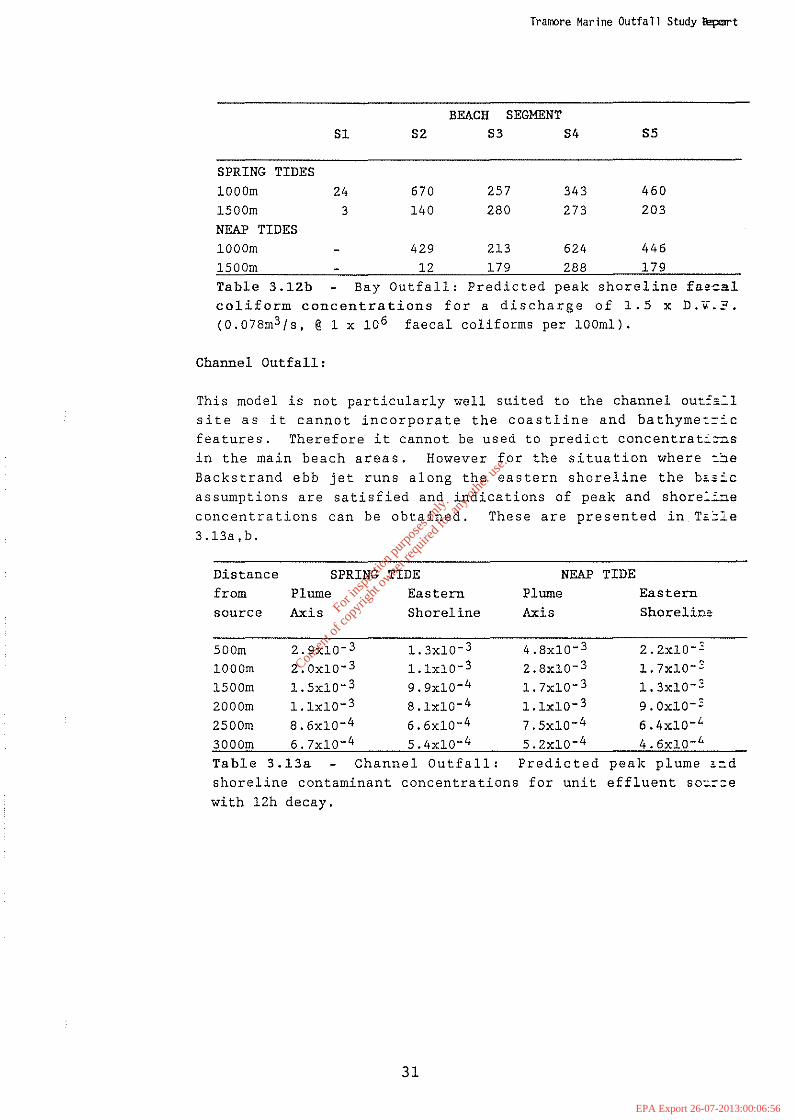
Tramere Marine Outfall Study~t
Sl S2BEACH SEGMENT
S3 S4 S5
460203
343273
257280
670140
243
SPRING TIDES1000ml500mNEAP TIDES1000m 429 213 624 446l500m 12 179 288 179Table 3.12b Bay Outfall: Predicted peak shoreline fae~al
coliform concentrations for a discharge of 1.5 x D.•. ?(0.078m3 /s. @ 1 x 10⁶ faecal coliforms per 100ml).
Channel Outfall:
This model is not particularly well suited to the channel out:;:lsite as it cannot incorporate the coastline and bathyme:=~c
features. Therefore it cannot be used to predict concentrat~=ns
in the main beach areas. However for the situation where ~~e
Backstrand ebb jet runs along the eastern shoreline the b~~~c
assumptions are satisfied and indications of peak and shore:~e
concentrations can be obtained. These are presented in T~=le
3.l3a.b.
Distancefromsource
SPRING TIDEPlume EasternAxis Shoreline
NEAP
PlumeAxis
TIDEEasternShoreline
SOOm 2.9xIO- 3 1.3xlO- 3 4.8x10- 3
1000m 2.0xIO- 3 1.1xIO- 3 2.8xlO- 3
l500m 1. 5xlO- 3 9. 9xIO- 4 1. 7x10- 3
2000m 1.1xlO- 3 8.1xlO- 4 1.1xlO- 3
2500m 8. 6xlO- 4 6. 6xlO- 4 7. 5x10- 4
3000m 6. 7xIO- 4 S. 4x10- 4 5. 2x10- 4
2.2xlO-;1. 7xIO-;1. 3xlO-;9.0x10-;
6.4x10- L
4.6xIO- L
Table 3.13a Channel Outfall: Predictedshoreline contaminant concentrations for unitwith 12h decay.
peak plume !::deffluent so==e
31
For
insp
ectio
n pur
pose
s only
.
Conse
nt of
copy
right
owne
r req
uired
for a
ny ot
her u
se.
EPA Export 26-07-2013:00:06:56

Tramore Mar;ne Outfall Study Report
Distancefromsource
SPRING TIDEPlume EasternAxis Shoreline
NEAP
PlumeAxis
TIDEEasternShoreline
500m 609 273 1008 4621000m 420 231 588 3571500m 315 208 357 2732000m 231 170 231 1892500m 181 138 157 1343000m 141 113 109 97Table 3.13b Channel Outfall: Predicted peak plume andeastern shoreline coliform concentrations for a 3h discharge(.21m3/s, 1x10⁶ faecal coliforms/100ml).
Channel Outfall Mixing Model
In a previous preliminary report on Tramore seweage treatment(ref:37) M.C. 0' Sullivan examined the potential for dilutionof a channel discharge with the aid of a numerical model. Thismodel computed the flow of water from the Backstrand throughthe Rinnashark channel at intervals of 20 minutes during thetidal cycle. Results from this model, for spring and neaptides, are presented in Tables 3.12a and 3.12b. From thisdata, and assuming full mixing, M.C. 0' Sullivan thencalculated that the average dilution over the 3h dischargeperiod would be 1 in 2409 on springs and I in 664 on neaptides. The corresponding average faecal coliformconcentrations would be 86 and 313 per 100ml respectively.Note that this model does not allow for decay of thecontaminant.
Summary of Comparison
Both results from the box model and the plume model compare reasonablywell with the concentrations indicated by the particle tracking model.The box model predicts average 'shoreline' concentrations of 2.1x10- 3
for a 1000m outfall while the gaussian patch model gives a peak valueof 8.6x10- 3 . For a similar case the particle tracking model gives amaximum shoreline concentration of 1.lx10-2 . Corresponding faecalcoliform concentrations for the design figures are 110, 670 and 858.The channel mixing model employed by M.C. 0' Sullivan also suggeststhat peak coliform concentrations will be approximately 313 per 100ml.
From the calculation methods employed it would be expected that boththe particle and patch models would give highest values while the boxand channel mixing models, because of their averaging, would give thelowest estimates. Both the particle model and patch model would be
32
For
insp
ectio
n pur
pose
s only
.
Conse
nt of
copy
right
owne
r req
uired
for a
ny ot
her u
se.
EPA Export 26-07-2013:00:06:56

Tramore Marine Outfall Study Report
expected to give similar results. The particle model, because of itsaccurate representation of the bathymetry and current field, would beconsidered the most realistic and thus these values were used for
evaluation purposes.
Within the limits of the methods, the results are considered to be inclose agreement. Overall these results, together with the sensitivity
analysis, suggests that for a given set of input parameters theparticle tracking model will predict the average contaminant
concentrations to within a factor of 2-3 of the 'true' values.
3.5 ADDITIONAL CONSIDERATIONS
3.5.1 INITIAL DILUTIONS - NEAR FIELD MODEL (IJP)
The region adjacent to the outfall, the 'near-field' is important interms of the initial dilutions and diffuser design, though it
generally has no major influences on the far-field concentrations.
Poor initial dilutions can precipitate the formation of surfaceslicks, discolouration and odours. Standard practice is to ensurevalues of 50 - 100 fold are achieved to minimise the occurrence of anysuch near-field problems. (ref: 41) .
An analytical model (IJP) was used to provide an approximation of the
near field dynamics of the plume. The model (ref:29) solves thesteady state integral equations which describe the conservationequations (e.g. momentum, mass, buoyancy) defining the trajectory,dimensions and dilution factor of the effluent stream.
Bay Outfalls
Results from the model simulations are presented in Table 3.15 andshow the achievable range of dilutions for various combinations ofdiffuser configuration, water depth and ambient current speed.
In the absence of current the buoyant plume of treated effluentrises to the surface and will achieve a minimum initial dilution
of 38 for an outfall with a 5 port diffuser. When current ispresent the plume will be carried along for a short distance
before surfacing. For an ambient velocity of 0.05m/s the plume
would achieve a dilution of 170+. The effluent flow is assumed tobe 0.052m3/s which corresponds to the ultimate design dry weatherflow (D.W.F.). Comparative figures for a peak flow of 6 x D.W.F.
are also presented.
33
For
insp
ectio
n pur
pose
s only
.
Conse
nt of
copy
right
owne
r req
uired
for a
ny ot
her u
se.
EPA Export 26-07-2013:00:06:56
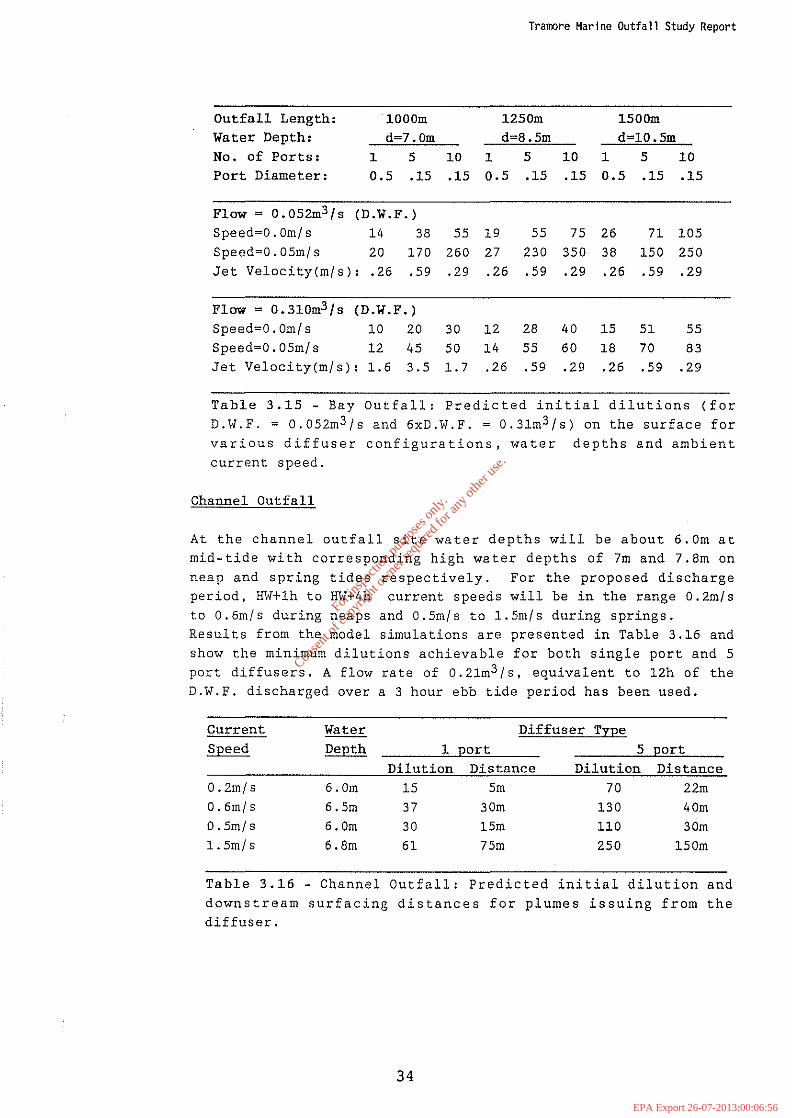
Tramere Marine Outfall Study Report
Outfall Length: 1000m 1250m 1500mWater Depth: d=7. Om d=8.5m d=10 .5m
No. of Ports: 1 5 10 1 5 10 1 5 10Port Diameter: 0.5 .15 .15 0.5 .15 .15 0.5 .15 .15
Flaw = 0.052m3/s (D.W.F.)Speed=O.Om/s 14 38 55 19 55 75 26 71 105Speed=0.05m/s 20 170 260 27 230 350 38 150 250Jet Velocity(m/s): .26 .59 .29 .26 .59 .29 .26 .59 .29
Flaw = 0.310m3/s (D.W.F.)Speed=O. Om/ s 10 20 30 12 28 40 15 51 55Speed=O. 05m/ s 12 45 50 14 55 60 18 70 83Jet Velocity(m/s): 1.6 3.5 1.7 .26 .59 .29 .26 .59 .29
Table 3.15 - Bay Outfall: Predicted initial dilutions (for
D.W.F. = 0.052m3 /s and 6xD.W.F. = 0.31m3 /s) on the surface for
various diffuser configurations, water depths and ambient
current speed.
Channel Outfall
At the channel outfall site water depths will be about 6.0m atmid-tide with corresponding high water depths of 7m and 7.8m on
neap and spring tides respectively. For the proposed dischargeperiod, HW+1h to HW+4h current speeds will be in the range 0.2m/s
to 0.6m/s during neaps and 0.5m/s to 1.5m/s during springs.Results from the model simulations are presented in Table 3.16 and
show the minimum dilutions achievable for both single port and 5
port diffusers. A flow rate of 0.21m3 /s. equivalent to 12h of the
D.W.F. discharged over a 3 hour ebb tide period has been used.
Current
Speed
O. 2m/ s
O. 6m/ sO. 5m/ s
1. 5m/ s
Water Diffuser Type
Depth 1 port 5 port
Dilution Distance Dilution Distance
6.0m 15 5m 70 22m6.5m 37 30m 130 40m6.0m 30 15m 110 30m6.8m 61 75m 250 150m
Table 3.16 - Channel Outfall: Predicted initial dilution and
downstream surfacing distances for plumes issuing from thediffuser.
34
For
insp
ectio
n pur
pose
s only
.
Conse
nt of
copy
right
owne
r req
uired
for a
ny ot
her u
se.
EPA Export 26-07-2013:00:06:56

MEAN SPRING· 3.7 ffi. RANGE NEAP TIDE . 1.9 ffi. RANGE
TIME TIDE BS Xsec DISC VEL TIME TIDE BS Xsec DISC VEL
(hrs) (mOD) VOL mA 3 mA 2 mA 3/s m/s (hrs) (mOD) VOL mA 3 mA 2 mA 3/s m/ s
-5.67 -2.08 300 148 1.10 0.01 -5.67 -1.17 56800 252 184.50 0.73
-5.33 -2.05 400 151 0.02 0.00 -5.33 -1.16 65100 256 10.96 0.04
-5.00 -1.98 500 157 0.05 0.00 -5.00 -1.13 73400 261 6.83 0.03
-4.66 -1.89 700 168 0.11 0.00 -4.66 -1.10 90100 267 6.99 0.03
-4.33 -1.74 1000 185 0.18 0.00 -4.33 -1.04 130400 278 13.60 0.05
-4.00 -1.52 40100 211 0.27 0.00 -4.00 -0.95 201900 295 33.93 0.12
-3.66 -1.22 163200 245 32.86 0.13 -3.66 -0.83 311900 316 60.17 0.19
-3.33 -0.89 444100 305 100.63 0.33 -3.33 -0.69 451400 341 89.93 0.26
-3.00 -0.55 914700 364 236.46 0.65 -3.00 -0.56 675200 364 117.37 0.32
-2.66 -0.22 1636100 424 396.06 0.93 -2.66 -0.42 860100 392 188.43 0.48
-2.33 0.10 2613200 481 589.41 1.23 -2.33 -0.29 1263400 414 151.03 0.36
-2.00 0.44 3690500 546 822.49 1.51 -2.00 -0.15 1447100 445 339.51 0.76
-1. 66 0.71 4877300 603 906.84 1.50 -1. 66 -0.04 1802900 463 154.59 0.33
-1. 33 0.97 5989400 662 969.59 1.46 -1. 33 0.06 2012300 483 290.73 0.60
-1.00 1.18 7009400 712 936.07 1. 31 -1. 00 0.14 2219300 497 176.22 0.36
-0.66 1.36 7829700 757 858.60 1.13 -0.66 0.22 2425000 513 174.26 0.34
-0.33 1.49 8711300 790 670.19 0.85 -0.33 0.27 2569500 523 168.07 0.32
0.00 1.58 8699500 821 742.07 0.90 0.00 0.31 2596000 531 121. 60 0.23
0.33 H\l 1.62 8474200 826 -9.90 0.00 0.33 0.32 2556500 534 22.34 0.04
0.67 1.58 8082700 816 -189.63 -0.22 0.67 0.31 2448900 531 -33.22 -0.05
1.00 1.51 7468700 799 -319.86 -0.39 1.00 0.28 2252400 525 -87.88 -0.16
1. 33 1. 36 6594800 766 -516.84 -0.66 1.33 0.22 1992000 513 -165.43 -0.31
1. 67 1.16 5493800 724 -735.61 -1.01 1.67 0.13 1693800 495 -219.22 -0.43
2.00 0.90 4391200 669 -899.44 -1.33 2.00 0.03 1421200 477 -243.57 -0.50 \ Discharge
2.33 0.64 3287700 614 -928.16 -1.50 Discharge 2.33 -0.07 1048900 459 -229.46 -0.49 Period
2.67 0.36 2239800 556 -928.85 -1.66 Period 2.67 -0.18 840100 434 -313.35 -0.71
3.00 0.07 1319100 499 -856.10 -1.71 3.00 -0.30 598600 412 _170.56 -0.40
3.33 -0.26 637000 436 -775.01 -1. 77 3.33 -0.44 450700 384 _203.32 -0.52
3.67 -0.55 169700 377 -574.11 -1.51 3.67 -0.56 345500 364 -124.44 -0.33
4.00 -0.81 80600 312 -381.80 -1. 21 4.00 -0.66 241300 346 -85.94 -0.24
4.33 -1. 07 23100 273 -74.97 -0.26 4.33 -0.77 178300 326 -87.73 -0.26
4.67 -1.32 1000 231 -48.43 -0.20 4.67 -0.87 130300 309 -53.06 -0.16
5.00 -1.53 700 210 -18.02 -0.08 5.00 -0.95 92400 295 -39.14 -0.12
5.33 -1.72 500 188 -0.22 0.00 5.33 -1.03 79000 280 -31.93 -0.10
5.67 -1.85 400 173 -0.15 0.00 5.67 -1.08 65000 271 -11.29 _0.03
6.00 -1. 96 300 160 -0.12 0.00 6.00 -1.13 56900 261 -11. 40 -0.03
6.40 -2.03 300 152 -0.06 0.00 6.40 - -1.16 54100 256 -6.78 -0.02
-2.08 148 -0.01 0.00 -1.17 254 -1. 97 0.00
TABLE 3.14a TABLE 3.14b
For
insp
ectio
n pur
pose
s only
.
Conse
nt of
copy
right
owne
r req
uired
for a
ny ot
her u
se.
EPA Export 26-07-2013:00:06:56

/
T RAM 0 R E/i"t1
""~-~-
PROPOSED OUTFALL DISCHARGE POINTS.
TRAMORE
'----MODEL AREA
BAY OUTFALL SURVEY Scale: 1/50000
FIGURE 3.1
For
insp
ectio
n pur
pose
s only
.
Conse
nt of
copy
right
owne
r req
uired
for a
ny ot
her u
se.
EPA Export 26-07-2013:00:06:56

,'-"
,'-"
,"
22
/#~/~§;~
Back Strand
!N
"-
"--------BEACH SEGMENTS
TRAMORE BAY
~
MODEL AREA
OUTFALL SURVEY Sc-ale: 1/50000
FIGURE 3.2
For
insp
ectio
n pur
pose
s only
.
Conse
nt of
copy
right
owne
r req
uired
for a
ny ot
her u
se.
EPA Export 26-07-2013:00:06:56

4. SUMMARY AND CONCLUSIONS
For
insp
ectio
n pur
pose
s only
.
Conse
nt of
copy
right
owne
r req
uired
for a
ny ot
her u
se.
EPA Export 26-07-2013:00:06:56

4.
4.1
4.2
4.3
4.4
4.5
Tramore Marine Outfall Study Report
SUMMARY & CONCLUSIONS
This report presents the findings of a study of the water circulationpatterns in Tramore Bay. The study sought to establish the principalcharacteristics of the area and its capacity to assimilate treatedmunicipal waste water discharged from the town sewerage scheme .
.Field measurements have shown the bay to possess a complex rotational
tidal pattern with the dominant ebb direction towards Brownstown Head.
The currents are otherwise weak and poorly defined with the exception
of along the eastern shoreline. Here flows to and from the extensive
Backstrand area produce a well defined tidal jet and high current
speeds occur in the narrow Rinnashark channel. A shallow sand bar,which has formed across the entrance, serves to maintain the highspeeds and further enhance the local mixing characteristics.
Numerical models of the bay and surrounding coastal waters wereestablished to assist with the evaluation of field data and extend itto cover wider range of tide and wind conditions. Both two and threedimensional flow models were employed. The complex circulations
proved difficult to simulate in a consistent manner over the wholemodel area and therefore emphasis was placed on ensuring that within
the bay itself models reproduced measured patterns. Recorded data
from dye releases, a current meter and drogue tracks were used forcomparison purposes. The reasonably good agreement allowed the
methods to be used with confidence.
A particle tracking dispersion model was used to investigate theeffects of discharges from potential outfall sites. These included an
ebb tide release into the Rinnashark channel and a continuous
discharge from an outfall located in the centre of the bay (an
extension to the existing outfall). Two outfall lengths (1000m and
1500m) were considered for this site. The results were subsequen"ly
compared with more general methods to confirm the reliability andaccuracy of the modelling method. A sensitivity analysis was thenconducted to establish the significances of the general variability in
model parameters (representing the dispersion processes) and theireffect on predictions.
To assist with quantifying the effects of the outfall options thebeach area was divided into five segments of equal length (900m)
starting at Tramore town (51) and extending to the Rinnashark channel
(55). The Backstrand and the eastern shoreline of the bay were
considered separately.
4.6 The results have allowed general conclusions to be drawn as regards
the effect of each outfall in terms of the coliform concentrations on
the bathing beaches. These have been discussed in detail in the
35
For
insp
ectio
n pur
pose
s only
.
Conse
nt of
copy
right
owne
r req
uired
for a
ny ot
her u
se.
EPA Export 26-07-2013:00:06:56

4.7
4.8
4.9
4.10
Tramare Mar;ne Outfall Study Report
preceeding chapter and results are summarised again in Table 4.1 forboth calm and onshore wind concentrations.
During calm weather an ebb tide discharge from the channel out:3llwill travel along the eastern shoreline entrained in the plume ofwaters from the Backstrand. The high volume flux and fast flo~ng
currents will ensure rapid dilution so that peak concentrations on ~e
shoreline (eastern) will reach only 500 faecal coliforms/lOOmls andgenerally be significantly less. This outfall will principally af:ect
beach segment 85 and peak concentrations will be approximately ~32
faecal coliforms/IOO mI. 80me effluent may reach the eastern ene of
segment 84 for a brief period, however concentrations will be low and
are unlikely to exceed 60 faecal coliforms/lOOml. The model stue~es
have shown that a significant proportion of the waters from ~he
Backstrand may be returned on the subsequent flood tide. Thus dUe~~g
neaps, when tidal excursions are lowest, average colif::rmconcentrations in the Backstrand water will reach 50 per lOamI a~d
possibly be higher in local areas.
The bay outfalls discharge into an area where the currents are ~3k
and thus limited initial dilution will be available. During calmweather both outfalls will result in effluent reaching beach segme~ts
82 - 85. Maximum faecal coliform concentrations of about 858 ~er
lOamI could result on 83 from the 1000m outfall while for the l5JOmoutfall values would not be expected to exceed 101 per lOamI. On
spring tides some of the effluent will enter the Backstrand. ~he
amounts will be small though local concentrations of 50 fae:3l
coliforms per lOamI could be expected. These outfalls will have anegligible effect on the eastern shoreline.
As the tidal currents are weak wind induced circulations will ass~e
greater significance and be responsible for water exchange a~d
shoreline contamination. Onshore wind conditions are thus ~he
principal factor which will determine the suitability of an out:alllocation. For the channel release the south-easterly wind is rr~st
critical. The associated longshore current will carry the efflcantplume along the beach and peak coliform concentrations of up to ~90
faecal coliforms per lOamI can be expected on segment 84. Winds !eomthe south-easterly sector can be expected to occur for 9.6% of ~he
time during the June-August bathing season. This figure represe~~s
all wind speeds from the sector. The stronger winds, greater t~an
force 5 (8.5m/s), which are more significant in terms of outfalldischarges would occur on average 1.4% of the time.
For the bay outfalls southerly winds produce the most critical case.The buoyant effluent plume will be carried rapidly towards the besch
in the surface waters and for a 1000m outfall concentrations in excess
of 1560 per lOamI can be expected on segments 82 and 83. Closer to
36
For
insp
ectio
n pur
pose
s only
.
Conse
nt of
copy
right
owne
r req
uired
for a
ny ot
her u
se.
EPA Export 26-07-2013:00:06:56
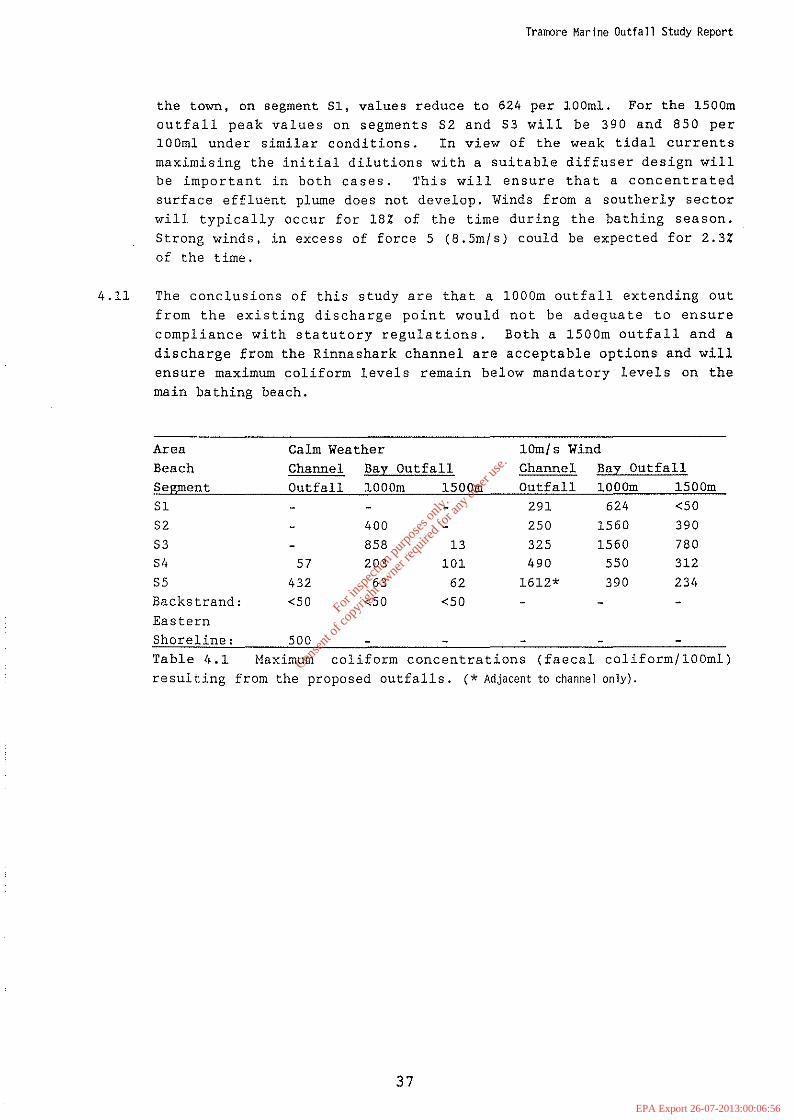
4.11
Tramore Marine Outfall Study Report
the town, on segment Sl, values reduce to 624 per 100ml. For the 1500m
outfall peak values on segments S2 and S3 will be 390 and 850 per100ml under similar conditions. In view of the weak tidal currents
maximising the initial dilutions with a suitable diffuser design willbe important in both cases. This will ensure that a concentrated
surface effluent plume does not develop. Winds from a southerly sector
will typically occur for 18% of the time during the bathing season.
Strong winds, in excess of force 5 (8.5m/s) could be expected for 2.3%
of the time.
The conclusions of this study are that a 1000m outfall extending out
from the existing discharge point would not be adequate to ensure
compliance with statutory regulations. Both a 1500m outfall and a
discharge from the Rinnashark channel are acceptable options and will
ensure maximum coliform levels remain below mandatory levels on the
main bathing beach.
Area Calm Weather 10m/s Wind
Beach Channel Bay Outfall Channel Bay Outfall
Segment Outfall 1000m 1500m Outfall 1000m 1500m
Sl 291 624 <50
S2 400 250 1560 390
S3 858 13 325 1560 78054 57 203 101 490 550 312
S5 432 63 62 1612* 390 234
Backstrand: <50 <50 <50
EasternShoreline: 500
Table 4.1 Maximum coliform concentrations (faecal coliform/lOamI)
resulting from the proposed outfalls. (* Adjacent to channel only).
37
For
insp
ectio
n pur
pose
s only
.
Conse
nt of
copy
right
owne
r req
uired
for a
ny ot
her u
se.
EPA Export 26-07-2013:00:06:56

Tramore Marine Outfall Study Report
References & Bibliography
1. Abraham, G., 1963,
Jet Diffusion in Stagnant Ambient F1uid.De1ft Hyd. Lab. Pub1.No.29.
2. Admiralty, 1968,
Irish Coasts Pilot. The Hydrographer of the Navy, London.
3. Admiralty, 1991,
Admiralty Tide Tables. The Hydrographer of the Navy, Taunton.
4. Admiralty, 1980,
Chart 5058 - Cotida1 and Co-range lines for the British Isles andadjacent waters.
5. Admiralty, 1983,
Chart 7049, Old Head of Kinsale to Tuskar Rock.
6. Admiralty, 1974
Tidal Stream Atlas for the Irish Sea, NP 256.
7. Agg, A.R. & Wakeford, A.C., 1971,
Field Studies of Jet Dilution of Sewage at Sea Outfalls. Instn.Publ. Hlth. Engrs. J. 1972, 71,pp 126-149.
8. Alcook, G.A., 1984,
Parameterising extreme still water levels and waves in design levelstudies. lOS Report No. 83,. 95pp.
9. Barnes D., et a1. 1981
Water and Wastewater Engineering Systems: Pitman PublishersLondon Ltd.
10. Bowden, K.F., 1965,
Horizontal Mixing in the sea due to a shearing current, J. Fluid
Mech., Vol. 21, part 2, pp 83-95.
11. British Standards Institution, (BS 6349, 1984),
Code of Practice for Maritime Structures. BS6349: Part 1: General
Criteria.
12. Brooks, N.H., 1975,
Dispersion in Hydrologic and Coastal Environments. California
Inst. of Tech., Rept. No. KH-R-29.
For
insp
ectio
n pur
pose
s only
.
Conse
nt of
copy
right
owne
r req
uired
for a
ny ot
her u
se.
EPA Export 26-07-2013:00:06:56

Tramore Marine Outfall Study Report
13 Cabelli, V.J., 1980,
A Health Effects Data Base for the Derivation of MicrobialGuidelines for Municipal Sewage Effluents. Coastal DischargesConference, Institute of Civil Engineers, London.
14. Carter, H.H., 1975,Predictions of Far-Field Exclusion Areas and Effects. Dischargeof Sewage from Sea Outfalls. Pergamon Press 1975.
15. Charlton, J.A., 1980,Application of EEC Bathing Water Standards to the Design of SeaOutfalls. Prog. Wat. Tech., Vol 12, No.1.
16. Cooper, V.A. and Lack, J.J., 1988,Marine Treatment of Sewage and Sludge.
Institution of Civil Engineers, 1987.
Proceedings of Conference,
Thomas Telford, London.
17. Davies, A.M. and Flather, R,A., 1987,Computing Extreme Meteorologically Induced Currents, withApplication to the Northwest European Continental Shelf, ContinentalShelf Research Volume 7, No.7 pp 643-683, 1987.
18. EC, 1976, (76/160/EEC),Council Directive of 8 December 1975 on the quality of bathingwater.
19. EC, 1978, (78/659/EEC),
Council Directive of 18 July 1978 on the quality of freshwatersneeding protection or improvement in order to support fish life.
20 EC, 1979, (79/923/EEC),
Council Directive of 30 October 1979 on the quality required ofshellfish waters.
21 EC, 1991, (91/271/EEC),Council Directive of 18th April 1991 concerning municipal wastewater treatment.
22. Fischer, H.B., et aI, 1979,Mixing In Inland and Coastal Waters, Academic Press, New York, 1979.
23 Francis, P.E., 1986,
Numerical Wave Models as a Source of Data for Marine Climatology.Oceanology, Volume, 6 Society for Underwater Technology Graham andTrotman.
For
insp
ectio
n pur
pose
s only
.
Conse
nt of
copy
right
owne
r req
uired
for a
ny ot
her u
se.
EPA Export 26-07-2013:00:06:56
Tramore Marine Outfall Study Report
24. Gould, D.J. and Munro, D., 1980,Relevance of Microbial Mortality to Outfall Design. CoastalDischarges - Engineering Aspects and Experience. Proceedings ofConference, Instit. of Civil Engineers, London, 1980.
25. Dempsey, P. Lack, T.J. 1989,Environmental Impact Assessment of Coastal Schemes.Long Sea Outfalls. Proc. Conf. I.C.E., 1988.
Published in
26. Hearn, C.J. and Hunter, J.R., 1986,Modelling Wind-Driven Flow in Shallow Systems on the South-WestAustralian Coast, In: Numerical Modelling - Applications to MarineSystems. (Ed. J. Noye) , North-Holland.
27. Hunter, J.R., 1986,The Application of Lagrangian Particle-Tracking Techniques toModelling of Dispersion in the Sea, In: Numerical Modelling Applications to Marine Systems (Ed. J. Noye), North Holland.
28. Hunter, J.R., 1987b,User manual for numerical hydrodynamic models of marine systems andassociated plotting package, Centre for Marine Science andTechnology, Curtin University of Technology, Report C87-2.
29. Hunter, J.R., 1985,Simulation of Marine Outfalls Centre for Marine Science andTechnology, Western Australia Inst. of Technology, Report C85- 4.
30. Hunter, J.R., 1981,The prediction of pollutant concentrations, Unit for Coastal andEstuarine Studies, University College of North Wales, Report U81-3.
31 Hunter, J.R., 1990,User Manual for Three Dimensional Numerical Hydrodynamic andDispersion Model. CSIRO Division of Oceanography OME-24/007.
32. Minister for the Environment, 1988,National Bathing Water Quality Standards, European Communities(Quality of Bathing Water) Regulations 1988.
33. Meteorological Service,Meteorological data for coastal land stations: Rosslare, CorkAirport and Roches Point.
34. Newton, J.R., 1965,Factors affecting slick formation at marine sewage outfalls. InPollution Criteria for Estuaries,. Techno Press, London.
For
insp
ectio
n pur
pose
s only
.
Conse
nt of
copy
right
owne
r req
uired
for a
ny ot
her u
se.
EPA Export 26-07-2013:00:06:56

Tramore Marine Outfall Study Report
35 0 Flynn, J.J., 1991,
Coastal Erosion in County Waterford. Proceedings of SeminarEngineering for Coastal Protection. Institution of Engineers of
Ireland.
36. 0' Neill, J.G., 1989,Field Techniques for the Validation of Bacterial Decay andDispersion Models. Published in Hydraulic and EnvironmentalModelling. Ed Falconer et al., Gower.
37. 0' Sullivan, M.C. 1990Tramore Sewage Treatment, Preliminary Report 1990. Prepared forWaterford County Council.
38. Pugh, D.T., 1987,Tides, Surges and Mean Sea Level. A handbook for Engineers and
Scientists, Wiley & Son.
39. Reynolds, J.M., 1980,Design & Construction of Sea Bed Outfalls. Coastal Discharges
Engineering Aspects and Experiences. Institution of CivilEngineers, London.
40. Smith, R.W., 1989,Review of Recent Developments in mixing and dispersion in Hydraulicand Environmental Modelling of Coastal, Estuarine and River Watersed, R.A. Falconer et al., Gower.
41. T.C.E.W.Q.S., 1978,Water Quality Guidelines Memorandum No. 1 to the Minister for theEnvironment, Technical Committee on Effluent and Water QualityStandards, 1978.
42. White, W.R. & Agg, A.R., 1974,Outlet Design Proceedings of Sewage Discharge from Sea Outfalls,
Pergamon Press.
For
insp
ectio
n pur
pose
s only
.
Conse
nt of
copy
right
owne
r req
uired
for a
ny ot
her u
se.
EPA Export 26-07-2013:00:06:56