appendix o sample of copyright page
TRANSCRIPT

THE IMPACT OF PERCEIVED ORGANISATIONAL
SUPPORT ON EMPLOYEE RETENTION AND
SUCCESSFUL ORGANISATION MANAGEMENT
}
}
} at least three spacing (in 17-point)
}
} By
} One Spacing Chan Kailin
}
} five spacing }
}
}
This research project is supervised by:
}
} two spacing
Mr. Mahendra Kumar A/L Chelliah
Lecturer the position title of the supervisor
Department of Accountancy
Faculty of Accountancy and Management

Page 2 of 113
APPENDIX O SAMPLE OF COPYRIGHT PAGE
}
}
}
}
}
}
}
}
}
}
} 3” from the top margin
} the year of submission
}
}
Copyright @ 2019
ALL RIGHTS RESERVED. No part of this paper may be reproduced, stored in a retrieval
system, or transmitted in any form or by any means, graphic, electronic, mechanical,
photocopying, recording, scanning, or otherwise, without the prior consent of the authors.

Page 3 of 113
APPENDIX P SAMPLE OF DECALRATION PAGE
}
}
} 1” from the top margin
}
DECLARATION (in 12-point font)
}
}
} five spacing (in 12-point font)
}
}
I hereby declare that:
(1) This Research Project is the end result of my own work and that due
acknowledgement has been given in the references to all sources of information be
they printed, electronic, or personal.
(2) No portion of this research project has been submitted in support of any application
for any other degree or qualification of this or any other university, or other institutes
of learning.
(3) The word count of this research report is 18041.
}
}
} eight spacing
}
}
}
}
}
Name of Student: CHAN KAILIN
Student ID: 12UKM05936
Signature: ___________________________
Date: 04.10.2019

Page 4 of 113
TABLE OF CONTENTS
Page
Copyright Page …………………………………………………………………….... ii
Declaration ………………………………………………………………………….. iii
Table of Contents ……………………………………………………………………. vi

Page 5 of 113
CHAPTER 1 INTRODUCTION ………………………………………………. 7
1.1 Introduction
1.2 The Research Conceptual Framework
1.3 The Purpose of Study
1.4 Research Problem
1.5 Research Questions
1.6 Research Objectives
1.7 Research Hypotheses
1.8 Scope of the Study
1.9 Significance of Study
1.10 Chapter Layout
1.11 Conclusion
CHAPTER 2 LITERATURE REVIEW ..……………………………………… 20
2.1 Introduction
2.2 Perceived Organisational Support
2.3 Employee Retention
2.4 Organisation Commitment
2.5 Research Framework
2.6 Hypotheses Development
2.7 Conclusion
CHAPTER 3 METHODOLOGY ..……………………………………. 38
3.1 Introduction
3.2 Data Collection
3.3 Target Population
3.4 Sampling Frame & Sampling Location
3.5 Sample Size
3.6 Data Collection Procedure
3.7 Pretest Stage
3.8 Final Stage
3.9 Construct Measurement
CHAPTER 4 DATA ANALYSIS ..……………………………………. 47
4.1 Introduction
4.2 Descriptive Analysis
4.3 Multivariate Analysis
4.4 Codebook (Demographic)
4.5 Codebook (Construct)
4.6 Data Interpretation

Page 6 of 113
CHAPTER 5 CONCLUSION ..……………………………………. 97
5.1 Introduction
5.2 Limitation
5.3 Recommendation
References ………………………………………………………………………….. 107
List of Figures:
Figure 1. The Research Conceptual Framework
Figure 2. Research Route 1
Figure 3. Research Route 2
Figure 4. Research Route 3
Figure 5. Research Conceptual Framework on POS antecedent
Figure 6. Research Conceptual Framework on POS Consequences
List of Tables:
Table 1. The Variables
Table 2. 2017 Aon Hewitt – Trends in Global Employee Engagement Report
Table 3. Findings from Kurtessis, Eisenberger, Ford, Buffardi, Stewart and Adis (2015)
Table 4. Variables from POS
Table 5. Findings of factor loadings – Iqbal, Sehresh, Hashmi and Maryam Saeed (2015)
Table 6. Wickramasinghe and Perera (2012)
Table 7. Codebook of SPSS (Demographic Variables)
Table 8. Codebook of SPSS (Construct)
Table 9. Descriptive Analysis
Table 10. Educational Qualification

Page 7 of 113
CHAPTER 1 Chapter heading, 16-point in bold } double single spacing
}
INTRODUCTION Chapter heading, 16-point in bold
}
} triple single spacing
1.1 Introduction
The study of this research topic is very much related to the organisational behavior concept,
human resource management and also to a broader area of organisational management. By end
of this research, researcher will be able to bring an enlightenment related to the study areas,
that is advantageous to the employers, employees and also students who are interested in the
similar topic.
This chapter will illustrate on the research insight of this study to enable understanding into the
concepts and relationships of ‘Perceived Organisational Support Theory’, ‘Employee
Retention’, and ‘Successful Organisational Management’. This chapter also introduces the
flow relating to how the research idea was established, the data collection planning was
explained, and the methods of approaching the target respondents.
The independent variable, in this case refer to the perceived organisational supports, are being
examined on how it may affect the dependent variables, such as employee retention and also
the organisational management. Along the processes of investigation, researcher has found that
there is another important element that exists in the conceptual research framework relationship,
which known as “organizational commitment”, this element was seen as another dependent
variables in this study. This element of construct may also be viewed as a variable that is having
a mediating role towards the end result of successful organisation management.

Page 8 of 113
In a research, the important function of variables will work as a direction to determine whether
which of the variables will be tested for the relationship in between one another, or which
variable that will work as a fixed construct in an experiment.
Variables Constructs
Independent / Predictor Perceived Organisational Support
Dependent / Outcome Employee Retention
Organisation Commitment
Organisation Management
Table 1. The Variables of Study
1.2 The Research Conceptual Framework
Figure 1. The Research Conceptual Framework
The research framework is referring to the set of theoretical idea which were the route of
research towards the getting the research questions derived by the researcher being answered,
explained by Abraham, Schneider and Brocke (2019). Hence, in this study, the researcher had
drafted the research conceptual framework as shown in the above diagram.
The below will be a few research routes that rooted from the general concept of the main
research framework.
Perceived Organisation
Support (POS)
Employee Retention (ER)
Successful Organisational Management
Organisational Commitment

Page 9 of 113
1.2.1 Research Route 1
Perceived Organisation Support → Employee Retention →
Successful Organisational Management
Figure 2. Research Route 1
The above is the first route being interpreted with the available research questions established
and the research idea in step by step to approach the final stage of conclusion building. This
part of the research conceptualises that the perceived organisation support (POS) will directly
affect the employee retention (ER) and further helping the organisation to maintain the
successful management activities within the institution.
In other words, this also means that if an employee was made happy with good treatment from
the organisation, then they will most likely commit a mutual agreement between the employee
and the organisation to have remained themselves in the organisation and keep contributing
their efforts in the organisation. With this situation working as a precedent, the organisation
shall be able to foresee a successful in their human resource management.
1.2.2 Research Route 2
Perceived Organisation Support → Employee Retention → Organisational Commitment →
Successful Organisation Management
Figure 3. Research Route 2
Literally, this research route 2 give an insight that all the research constructs work positively
towards the outcome, which is the same as in research route 1: a successful organisation
management.
This research pathway means that when an employee perceived positively on the support that
the organisation had invested on them, they will most likely to react positively by having
reduced or no turnover intention. Additionally, they will be much committed towards their
organisation by spending more efforts into helping the organisational operation. And the final
outcome, still inviting the favourable successful organisation management.

Page 10 of 113
1.2.3 Research Route 3
Perceived Organisation
Support (POS)
↓
Organisation Commitment
(OC)
→ Employee Retention
(ER) →
Successful
Organisation
Management
Figure 4. Research Route 3
This research pathway deters that whenever an employee was positively stimulated for the
perceived organisational support in the working environment, then the stimulation will also
work significantly towards their commitment with the organisation they served with. The
positive relationship between the variables will bring benefit to the employee retention judging
from the perspective that it was a human resource management strategy, that will enable the
successful organisation management.
1.3 The Purpose of Study
The research framework in this study plan to investigate the below questions:
1. With the Perceived Organisational Support, can it affect the employee retention?
2. Further to had the employee retention, whether the organisational management can be
a success?
3. What has made the organisation (employees) to be successfully managed?
Employees are seen as the important asset in an organisation, without them the organisational
operations might be at risk, in terms of its competitive advantage to survive, financial
sustainability and the organisation’s fame in the market. Observing the importance of
employees in an organisation, it is concluded that they shall be treated well with necessary
support from the organisation. This is to enhance the high level of perceived organisational
support (POS) and which will further boost the employee retention of workers group.
Page 11 of 113
An organisation will not succeed in the competitive business environment, without the strive
from the employees. And in terms of barter system concept, employees contributing their effort
in hope that they will get something repaid. Observing from the circumstances of today industry,
the return can be referred to something in material, or something in symbolic. Eisenberger et.
al. (1986) defined that material rewards are those referring pay, position in career path, bonuses
and etc. The scholars also defined that the symbolic returns may refer to praises, recognition,
good word and pleasant working climate within the work place.
In this study, first we will investigate if perceived organizational support obligated by
employee will affect the retention behavior to stay within the organisation. Secondly, we will
examine if the employee retention in the organisation may contribute positively towards the
organisational management. Researcher will investigate whether there is direct impact of
perceived organizational support on the employee retention and organisational management.
There consists of tangible and intangible types of organizational support. Researcher is to look
into the types of organisational support that is perceived by the employees who work within
Malaysia and at the same time the statistics can tell which of the organisational support
categories contribute most into employee retention.
Employee retention was seen as a human resource management that will bring the benefit into
the organisational management in view that people is the important agent that operates the
functions in the organisation. As described from the research theoretical framework, employee
retention is a strategic human resource management which can directly influence the
organisational management and its success in reaching the general goal exclaimed in vision
and mission of an organisation. Subsequently, this chain of relationship can be achieved with
the mediating role of organisational commitment.
Organisational commitment is the behavioral outcome from employees who associated highly
in perceived organizational support Shore and Wayne (1993). Organisational commitment is
the psychological connection in between an employee with the organisation they serve. Good
organisation commitment is a linkage that is beneficial to both the employee and the
organisation. Organisation will get a competitive advantage in such a way that they will be
sustainable and getting economic outcome; while employees will be beneficial in terms of

Page 12 of 113
gaining a rewarding salary to help them in sustaining the life and providing the family a better
living.
In this research, we will try to find out how employees in Malaysia from different functions
will be perceiving on the organisational support that they have entitled in their organisation.
From the perceived organizational support, researcher will find out which type of the
organisational support plays the most important role on the retention or turnover from the
organisation. In this research also, researcher plan to figure out in what way the perceived
organisational support and employee retention will works for the successful organisational
management.
The study of this research will reveal the linkage of successful organisation management with
committed employees, when they perceived a high level of organisation support. This
understanding was interpreted using the outcome based inverted direction from the general
conceptual framework built at the early stage of the study.
Research was established as researcher has observed a trend that employees in Malaysia are
found to be unlikely will be recommending the workplace they are currently serving to their
contacts. At worst, they have withholding to the principle of “work less is best” in their
organisation. The table below signifies how the employee in Malaysia perceptible on the
employee engagement within their organisation.
South East Asia Country Employee Engagement Percentages (%)
China 67%
Thailand 65%
Philippines 65%
Indonesia 61%
Singapore 59%
Malaysia 59%
Table 2. Aon’s 2017 Trends in Global Employee Engagement Report
Retrieved from Malaymail (8th May 2017)

Page 13 of 113
Prashant Chadha, the Managing Director in Aon Hewitt, Malaysia and Brunei at then, year
2017, exclaimed that these statistics also disclose that organisations are having talent losing at
a worrying stage especially in this globalisation era, where competition between businesses are
extreme. He then expressed, it is only when the organisation is able to retain the talent then
they will be able to survive and excel in the game. The statement was seen as a conditions for
the smooth success of an organisation.
Aon Hewitt is a global leader in providing the consultation related to human resource matters.
In terms of the types of consultation works provided, it includes providing the measurement,
development, strategizing in helping the partner organisation to achieve business results
practically.
Other than providing a practical consultation, Aon Hewitt is also actively involved in the
research works in all areas with regards to human resource management. The research outcome
obtained by Aon Hewitt can give insights into various of industry real cases, and with the
analysis of strong databases, this can actually be supportive to the decision making processes
of the organisation, especially in terms of the organisational behavior aspects which is vague
but are still able to be studied with supporting data analysis.
1.4 Research Problem
In this section, researcher will elaborate on how the research idea has been derived, and what
issue that researcher can identify from the main perspective of organisation behaviour. This
section is not only illustrating the problem that researcher can identified, but at the same time,
they are representing the issues that most of the working personnel are facing in Malaysia, as
well as other part of the worlds, as picked up from the research findings from the other region
of the world.
Researcher had personally encountered a few incidences that is much related with organisation
behaviour. Through the empirical experience and observations, researcher found that there
seems to be a worrying trend in related to perceived organisational support, employee retention
strategy and also the most important, how the organisation can achieve the main target of
sustainability.

Page 14 of 113
As education has been more and more universalised, together with the technology of borderless
knowledge sharing through the fast speed optical fibre Internet, technologically advanced
gadgets, people has been turning to become more knowledgeable and more intellectual. This
scenario has boost people to be more aware on the supports they obtained from the organisation
they served. Once observations they perceived has matched with the cognitive information they
obtained, the human will analyse and evaluate the organisational support, whether that equally
valued with the sacrifices they have committed.
The experiences encountered by researcher were observed and been recorded for a continuation
of research purpose. The scenarios were then narrated with the study supported from the other
scholars with the similar topic of study.
Researcher has personally thought that, once a knowledgeable worker’s mind has registered
that they do not perceived good support from the organisation they are serving at, this will
followingly affecting the worker’s decision to stay longer with the organisation. Once a worker
decided to leave the organisation, this will create a domino’s effect on the management and
also the organisation’s competency to survive in the market.
Loosing a talent can be seen as a problem to the organisation as they will need more funding
in recruiting new blood, training the new employee before capable to run the operation
smoothly.
While managing human resources that is new to the organisation culture, researcher observed
that the management level may foresee a certain difficulty level in handling the new employees.
This is at this stage that, the organisational support perceived by the employee will play a role
as an employee retention strategy.
In the research data compiled by the Institute of Labour Market Information and Analysis
(ILMIA), entitled: Jobs, Salaries and Vacancies, 2017, the Malaysia Government had noted
that the average turnover rate was at 20%, and in between, involuntary turnover has contributed
to a 6% of statistics. The annual statistics reading had informed a situation that turnover
intention has been somewhat creating the instability in terms of helping with the nation’s
economic.

Page 15 of 113
1.5 Research Questions
Researcher has established with a few research questions to give the direction of this
research:3rd heading, 12-point in bold
} one-and-a-half spacing
Question 1:
What are the types of organizational support that is strongly perceived by employees in
Malaysia – (tangible or intangible).
Question 2:
Does perceived organizational support works as employee retention strategy in an organisation?
Question 3:
Does the perceived organisational support impacting the organisational management?
Question 4:
Does there exists any mediating elements in between perceived organizational support,
employee retention and achieving successful organizational management?
1.6 Research Objectives 2nd heading, 14-point in bold
ne-and-a-half spacing
The researcher aims to achieve the below research objectives:
Objective 1:
To examine the type of organisational support that is contributing most towards the employee
retention in Malaysia context.
Objective 2:
To examine that perceived organisational support will directly contribute in employee retention
for an organisation.
Objective 3:
To examine that perceived organisational support will indirectly contribute to organizational
management.

Page 16 of 113
Objective 4:
To examine if there is any mediating element in achieving successful organizational
management.
Research Hypotheses
Research hypotheses are developed with the reference on the research questions:
Hypotheses 1
H1 – The tangible and intangible organisational support both positively perceived by
Malaysian workers.
Hypotheses 2
H2 – The perceived organisational support correlate positively towards the employee retention
in an organisation.
Hypotheses 3
H3 – The perceived organisational support is positively affecting the organisation management.
Hypotheses 4
H4 – There is mediating role of organisational commitment in achieving successful
organisation management.
1.8 Scope of Study
There are already ample studies on perceived organisational support theory, as early as in Year
1986. Along the years until this 3rd millennium, there are ample studies done on this topic and
findings have been explored in its’ direct impact on employee retention too. However, there is
a gap in between past studies and current studies of to what extent is the advantage that
perceived organizational support and employee retention strategy will bring to the organisation.
Hence, this research plan to narrow down the area of study, to find out if perceived
organisational support can be determined as a tool in employee retention strategy. And further,
Page 17 of 113
if this study is to be able to prove that perceived organisational support is also contributing to
organisational management, in which this will be bringing the exponential advantage to the
organisation.
The scope of this research is to bridge the gap in between the existing studies that are available
theoretically in academia with the empirical observation in Malaysia organisation. The study
is also carrying the purpose to enable enlightenment to the management level in an organisation
on the importance of this topic in organisation behavior and empirically, how it can benefit the
operations of the organisation.
1.9 Significance of Study
The pioneer scholar that came out with the theory of perceived organizational support in Year
1986 are Eisenberger, Hutchison and Sowa (1986). The scholars have stated that perceived
organizational support will be influenced by different aspects of an employee’s treatment by
the organisation, and in the other way round, will affect the employee’s perception on the
organisational motives underlying the treatment.
Significance of study section is to speaks on how this study will be able to benefit to the society,
especially to the specific audience of this research study. This study aims to enlighten the
management hierarchical level in an organisation, to realise that people is an important aspect
in operationalise the strategic planning in an organisation, to have further understand the
fulfillment of Maslow’s needs with working.
In understanding the reciprocation theory with the perceived organisation support theory, the
management in an organisation shall know how to well compensate the employees who had
spent time in contributing the energy in helping the organisation to grow, to achieve its target
and also the most important, to beat the obstacles in the competitive business environment.
This study also plans to benefit the society, in terms of how it is able to educate the public on
the topic of organisation behavior. This is also an information and knowledge sharing platform
to enable understanding that it is the right to anticipate something rewarding after a hard work.
Readers will be able to identify that hard work in helping the organisation to achieve the

Page 18 of 113
targeted goal shall not be taken advantage at. These hard work shall come in return with
something which may be beneficial to the workers and shall be treated as a win and win
situation.
This study is also useful for enlightening the human resource department’s needs for each
organisation to further establish the retention strategy, and to always be sensitive when there
are peculiar statistics of turnover within the organisation. This is also especially useful for the
different business unit in the organisation. When there are substantially high turnover or any
other employees matter, it means that there could be some issue related to organisational
behavior started to get infestation.
1.10 Chapter Layout
Chapter 1 Introduction
This chapter demonstrates the main idea of the research topic and giving an idea of how the
flow of the study will be leading.
Chapter 2 Literature Review
This chapter shares on the research findings from the researchers and scholars from the past
throughout now.
Chapter 3 Methodology
This chapter discusses on the methods of data compilation and also the analysis run on testing
the reliability and its statistics.
Chapter 4 Data Analysis
This chapter will transfer all collected data into the useful statistics which is able to be
interpreted in a manner that is understandable in words by readers.
Chapter 5 Recommendation, Limitation, Future Research and Conclusion
This chapter shall cover the few sections that will discuss on the limitation encountered when
conducting this study, recommendation in terms of future research and recommendation to
organisation from the findings and a conclusion as a summary wrap up of the research.

Page 19 of 113
1.11 Conclusion
In conclusion, this chapter was seen as a fundamental ground to introduce the research related
information and also to enable a site view of the whole research project. The researcher aim to
provide a brief information of this study to the readers in general and in brief which may help
the understanding when moving further into the following chapters.

Page 20 of 113
CHAPTER 2 Chapter heading, 16-point in bold } double single spacing
}
LITERATURE REVIEW Chapter heading, 16-point
in bold
}
} triple single spacing
2.1 Introduction
This section aims to elaborate on the theoretical and empirical findings from the previous
researchers and treated as a review on the secondary data. Literature review chapter will also
aim to provide a significant of study into this research and enable further discussion from the
understanding gained. This section will be reviewing onto the different aspects of ‘Perceived
Organisation Support’, ‘Employee Retention’, ‘Organisation Maanagement’ and finally
‘Organisation Commitment’.
Deriving from the understanding enhanced from literature reviewing, hypotheses were then
developed to look into the relationship between each of the construct and also what influence
from the independent variables can play an effect on the dependent variables. The independent
variables which also known as the predicting variables, and dependent variables are also known
as the outcome variables.
Reviewing on the past literatures are considered as an action to study on a group of secondary
data, which were a ready information gathered from past researchers. Secondary data are viable
for the establishment of primary data collection using the existing research scales, especially
in this current study.

Page 21 of 113
2.2 Perceived Organisation Support (POS)
Organisation Support Theory was first discovered by Eisenberger, Huntington, Hutchison and
Sowa in the year of 1986. The scholars had spelt out that employees will perceived in terms of
the extent on how the organisation will appraise or valuing their contributions and whether
their well beings are taken care of.
Organisational Support Theory was interpreted to involve the socioemotional attributes, social
exchanges, self enhancement, job enhancement opportunities, well being of employees and
also the values they have received in terms of labour contribution.
Socioemotional as referred to Thompson and Virmani (2011), it means the aspect that is
concerning with the convergence of social and emotional development for a person.
Socioemotional benefits can includes the increase of esteem, approval and caring, when the
socioemotional needs fulfilled, according to researchers Blau (1964), Eisenberger, Huntington,
Hutchison and Sowa (1986), Gould (1979), Levinson (1965), Mowday, Porter and Steers
(1982), Rousseua and Parks (1993), Armeli, Eisenberger, Fasolo and Lynch (1998).
Investigation conducted with the basis of Organisational Support Theory, allowed researchers
to find out antecedents of POS and its consequences that will affect organisation, noted by
Kurtessis, Eisenberger, Ford, Buffardi, Stewart & Adis (2015).
Antecedents Treatment by organisation member Abusive supervision
Consideration and Initiating
structure
Leader-member exchange
Supervisor & coworker
supportiveness
Transformational and
transactional leadership
Employee- organisation relationship
quality
Fairness
Perceived organizational politics

Page 22 of 113
Psychological contracts
Value congruence with the
organisation
Human resource practices and job
conditions
Job security, flexible and family
supportive work practices
Developmental opportunities
Work role characteristics
Outcomes Orientation toward the organisation and
work
Affective organizational
commitment
Economic and social exchange
with the organisation
Felt obligation and normative
commitment
Job involvement
Organisational identification
Performance-reward expectancy
Trust
Subjective well being Positive psychological well being
Negative psychological well being
Behavioral outcomes In role performance
Organisational citizenship
behavior
Counterproductive work behavior
Withdrawal
Table 3. Findings from Kurtessis, Eisenberger, Ford, Buffardi, Stewart & Adis (2015).
As suggested, POS will increase employees’ positive conceptual towards the organisation
socioemotional exchange and therefore boosting the trust, and favourable affective
commitment in the organisation. Whenever employees perceived a high level of organisational
support, they will feel obligated and be more engaging with the organisation, and thus they will
retain in the organisation. The end result of this chain effect is that, the well committed

Page 23 of 113
employees will consider the organisation’s goal as their own goal, they will strive for the best
in helping the organisation to grow and succeed. In other words, this group of employees are
also a group that will be well managed.
In 2014, researchers Wickramasinghe and Perera mentioned that how an employee sees
themselves treated by their organisation is crucial in deciding how the employees will behave
attitudinally in return towards their organisation. This attitude was seen more like a repaying
nature of human, a return of good favour will be given when they have receive something good
in general. This concept is well matching the research scope previously.
There is a common argument derived from the past studies that, perceived organizational
support is a perception from the employees of the awareness on the equality exchanges between
job rewards with the contributions from employees. In which, this has also been derived from
Blau (1964) in his reciprocal exchange theory. And this theory has sufficed the financial
concept of “equilibrium” principle, where adopting an example an employee who had been
well paid will contribute to the satisfactory extent in work environment.
Dawley, Andrews and Bucklew (2008) stated that the job remuneration perceived by
employees are an indication on how much the organisation values them on the work they have
done and in return, how the employees’ well being are taken care of by their organisation.

Page 24 of 113
Figure 5. Research Framework on antecedent (POS) of Krishnan and Sheela Mary (2012)
Interpreting from the diagram, we can see that scholars Krishnan and Sheela Mary (2012) had
depicted a few of the antecedents of Perceived Organisational Support which are highly
concerned at from the employees. Speaking this, we can say that monetary rewards shall not
be the sole indicator for the employees to judge on the organisational support they have
received or will be looking into at. Even for the monetary reward, employees nowadays will
start to have comparison after certain duration of service. For any monetary reward that they
have judged that it was under paid, or not well paid, employees will consider to terminate the
mutual contract of work relationship with the organisation.
Employees have spent more than eight hours of the day time in sacrificing the time working
for the organisation, in hope to get something in return which will be able to support the life of
their family. Hence, when rewards are not equal, from the cognition of the employees, this will
further affecting their psychological mind to have turnover intention.

Page 25 of 113
Nowadays, when supporting the family has been crucial, especially for women employees, they
are hoping that there shall be child care support in helping them to cope with the young child
while having sacrificing their day time to contribute in the organisation.
Perceived organizational support, whether financial or non-financial; whether tangible or
intangible has been adopted to enhance expectancy of rewards whenever contributions given
in helping the organisation to achieve goals. This continuous relationship indicating employee
retention and also successful organizational management.
Financial support or tangible reward can be referred to something received in monetary terms,
ie. Salary increase, subsidise and bonus. Non financial or intangible support may be referred to
the praises, good comment.
POS was found to deliver a significant impact on the employee retention, Arshadi and Hayavi
(2013). This is when the employees see themselves were valued at by their organisation and
this will affect their intention to be retained in the organisation. Concluded by Ajmal, Bashir,
Abrar and Khan (2015), POS will increase the commitment within the organisation. Same goes
with Iqbal and Hashmi (2015); Hassan and Hassan (2015); Mitchell, Gagne, Beaudryand Dyer
(2012); Robert, Robin, Hutchison and Sowa (1986) observed that POS will be benefiting in
employee retention.
As the educational system has been more advances today, more and more employees are
cognitively well aware on the concept of ‘perceived organisational support’. Employees are
judging their employers from time to time, they will be evaluating the return received from the
hard work they have contributed in the organisation. And since this is a globalised era, Internet
has provided a fast channel in information and knowledge sharing. Job seekers will be able to
know which organisation that is providing a good support for its employees, and this is an
attracting point to retain employees to be more committed and having more continuous effost
in the organisation.
An employee who had displayed certain efforts in an organisation will be judging on the
rewards that they have perceived from their organisation. The perceiveness is referring to the

Page 26 of 113
awareness on whether they will be appreciated by their organisation. This is also acted as a
motivation for continuous service towards the organisation.
In modern days, employees not only highly looked at the monetary rewarding system, but they
are also concerning on the ergonomic working environment where their mentality within the
work environment shall be motivating and healthy.
The tangible and intangible organisational supports were both regarded highly in this study and
from here, the first hypothesis was built.
Hypothesis 1
H1 – The tangible and intangible organisational support both positively perceived by
Malaysian workers.

Page 27 of 113
Figure 6. Research framework on consequences (POS) of Krishnan and Sheela Mary (2012).
The findings from Krishnan and Sheela Mary (2012) had suggested that if the perceived
organisational support theory was not fulfilled between the relationship of organisation and
employees, then there might be consequences that the employees might commit into one of the
negative activities, ie. turnover, voluntary withdrawal, absences, not committed in work, bad
mental health and etc.

Page 28 of 113
Table 4. Variables of Perceived Organisational Support from Kurtessis, Eisenberger, Ford,
Buffardi, Stewart and Adis (2015)
Sharing the similar from Kurtessis, Eisenberger, Ford, Buffardi, Stewart and Adis (2015), the
scholars also concluded on a few items and the expected outcomes for perceived organisational
support. Reviewing them, there is understanding that employees will be determining on their
intention to stay with an organisation judging from the perceived organisational support they
get. And among all, the positive outcomes that wee may expect from the well perceived
organisational support is nonetheless productivity, commitment and performance.
Hence, in view of the importance of perceived organisational support theory, it shall be
determined as an important human resource management strategy, which is to retain an
employee rather than concentrating into recruiting. Though both have also been equally
important towards the organisation. Yet, retention is always out weigh the other due to its cost

Page 29 of 113
advantage to the financial system of the organisation. The following will be a discussion on the
‘employee retention’.
Table 5. Findings from factor analysis by Iqbal, Sehresh, Hashmi and Maryam Saeed (2015)

Page 30 of 113
2.3 Employee Retention
Employee retention is considered as a human resource management strategy, which means to
have some attraction to keep the employee in keep working in an organisation.
The 3Rs concept for employee retention which shared by Nazia and Begum (2013), Kundu and
Lata (2017) are:
1. Reward;
2. Recognition; and
3. Respect.
Observing these constructs, we can say that the 3Rs are actually relate closely with the
perceived organisation support.
Walker in 2001 has came out with 7 factors that are encouraging to the employee retention:
Taken from the holistic view of the constructs, employee engagement by the supportive
measurement is a strategy for retaining employees in an organisation.
Scholars of Management Science has always stressed that getting and retaining talents have
become equally crucial for organisations with the consideration that it is one of the key
determinants to measure how well the organisation can achieve its goals, its strengths in the
competitive work environment, Kennedy and Daim (2010).
Organisational supportive work climate of perceived organisation support can cultivate work
engagement behavior and thus positively related to employee retention. The benefits that come
from employee retention will includes reduction in waiting time for another new employee to

Page 31 of 113
get familiarise with the operations. In terms of budgeting, employee retention is a good strategy
to help keep down the training cost and financially helping the organisation with production
line to have smoother output rates.
Figure 7. Conceptual framework of Iqbal, Sehresh, Hashmi and Maryam Saeed (2015)
Iqbal et. al. (2015) had studied on the relationship between Perceived Organisational Support
(POS), Psychological Empowerment (PE) and Employee Retention (ER). The results are well
justified with the research framework earlier, in which perceived organisational support will
directly influencing the employee retention. This is also the theorised idea that the researcher
had came out with in this study.
There have been ample studies from different perspectives of world, be it Western as the first
theorist, and it has been proven that employee retention is directly impacted by perceived
organisational support, regardless of its employees’ nations, cultures or some other criterion.
This is especially clear to be examined at in Malaysia context, that is the main reason the
researcher had been depicting ‘employees working under the organisation in Malaysia’ rather
than calling all respondents as ‘Malaysian employees’. This is also derived from the
researcher’s observation that, nowadays, there are many expatriates that work in Malaysia, in
conjunction with the Malaysia Government’s campaign to make Malaysia as a second home in
living.
Referring to the review and justifications from the other researchers, the second hypothesis for
this study is then came out:

Page 32 of 113
Hypothesis 2
H2 – The perceived organisational support correlate positively towards the employee retention
in an organisation.
Successful Organisational Management
An important indicator for employee retention is the commitment behavior towards the
organisation, Curtis and Wright (2001). The employees with the strong sense of commitment
will sees themselves as the member in the organisation and this is beneficial in organizational
management.
Dibble (1999) observed that further to employee retention, and development of highly skilled
and valued employees is the priority in the human resource management strategy.
In this study, organizational commitment has been explored to have a linking with the outcome
of successful organizational management. When retained employee is satisfied and committed,
they will be the human resource who can be seen as well
Figure 8. Wickramasinghe and Perera (2012)

Page 33 of 113
Table 6. Wickramasinghe and Perera (2012)
Referring to the theorized framework from other scholars, the third hypothesis generated:
Hypothesis 3
H3 – The perceived organisational support is positively affecting the organisation management.
2.4 Organisational Commitment
Derived from perceived organisation support, and employee retention, the commitment
behavior will arise. In the Organisational Commitment Questionnaire of Meyer and Allen;
Mowday, Steers and Porter (1979) has concluded that organizational commitment affect
productivity, absentism and turnover. Turnover defined as an action by employee which
voluntarily withdrawn from the organisation.
Scholars Griffeth and Hom (1995); Griffeth, Hom and Gaertner (2000) had regarded
organizational commitment as an important predictor for employee turnover. Employee

Page 34 of 113
turnover is an action initiated by the employee themselves to voluntarily withdrawn from the
organisation.
Newman, Thanacoody and Hui (2012) also quoted from early researchers, Eisenberger, Fasolo
and Davis-LaMastro (1990), Wayne, Shore and Liden (1997), Rhoades, Eisenberger and
Armeli (2001) had state clear that from the main principles of social exchange theory, future
study can expect that Perceived Organisational Support correlate positively towards affective
organizational commitment.
The tenets suggested that organisational commitment is a social emotional agreement from the
employees towards their organisation. This was seen as a beneficial relationship which will
enable the easy managing from the organisation towards the group of employees with this
nature. Resulting that there will be elimination of employees problem which will only bring
down the performance and reputation of the organisation.
Theoretically and empirically speaking, the affectionate relationship will eliminate negative
issues involving with employees’ attitudes.

Page 35 of 113

Page 36 of 113
Hypothesis 4
H4 – There is mediating role of organisational commitment in achieving successful
organisation management.
2.5 Research Framework
Research framework was established as such that questionnaires collected will be analyses with
SPSS. Data were entered, reliability were tested, factor analysis done, multiple regression
conducted, factor analysis conducted.
Descriptive statistics on the demographic were looked into as well.
Perceived Organisation
Support (POS)
Employee Retention (ER)
Successful Organisational Management
Organisational Commitment

Page 37 of 113
2.6 Hypotheses Development
Deriving from the theoretical research framework, hypotheses were build:
Hypothesis 1
H1 – The tangible organizational support plays the role as employee retention strategy.
Hypothesis 2
H2 - The intangible organizational support plays the role as employee retention strategy.
Hypothesis 3
H3 – The tangible organizational support is beneficial to successful organizational management.
Hypothesis 4
H4 – The intangible organizational support is beneficial to successful organizational
management.
2.7 Conclusion
Wrapping up Chapter 2, we can say that this gives clear insight on how the research had been
developed and designed. Firstly, the research needs were identified, which is to close the gap
of how perceived organizational support and employee retention can be beneficial to a larger
extend. And at the same time, we will want to find out, if the perceived organizational support
will be a strategic tool in employee retention. Further, we want to influence the concept of
organisation in Malaysia, to let them understand that employees are an asset rather than a
dispensable labour that can easily be replaced.

Page 38 of 113
CHAPTER 3 Chapter heading, 16-point in bold } double single spacing
}
METHODOLOGY Chapter heading, 16-point in bold
}
} triple single spacing
3.1 Introduction
Methodology refers to the methods researchers used in this study to collect data, to analyse
data and to enter data. Data were entered into SPSS, and analyses developed with the same
system. The questionnaires were developed using the tested scales from other scholars in this
field of study.
3.2 Data Collection Methods
The primary data was collected by distribution of questionnaires using Google Form among
working personnel in Malaysia which were conveniently reached within the contacts of
researchers. The invitations of participation via the link were sent out as many as possible in
social media platform, ie. WhatsApps, Facebook, and also through the individual emails to
respondents from a few insitutions.
Respondents were communicated that their participation is voluntarily and all data collection
will be conducted anonymously. There will be no monetary compensation upon the submission
of their responses.
The Google Form consisting the cover note, the UTAR Personal Data Statement, the section
that requires demographic information such as age group, gender, tenure with the organisation,
educational qualification. The next section of the questionnaires are mainly questions for the
data collection with reference to the tested scales developed by other researchers.

Page 39 of 113
3.3 Target Population
Researcher had targeted respondents who work in organization currently located in Malaysia
at the point when the data compilation was conducted via Google form questionnaires. The
main reason that researcher reaching out to the targeted respondents who is currently working
in the organization located within Malaysia is to look at how this issue perceived in Malaysia
context. When researcher conduct a study in Malaysia context, we will know, if this
organization behavior subject is a worldwide matter.
As can be detected from the respondents’ working area, high percentage of respondents are
actually worked in an organization situated in Klang Valley, Malaysia. Reason of this
concentrated targeted population is due to researcher is adopting the convenient sampling
method in obtaining the raw data from whom the contacts that researcher is having. Researcher
had approached the ex-colleagues, course mates during undergraduate study in contributing
their thoughts and also to reach out to their contacts, whom, mostly are now working in Klang
Valley.
In this study, researcher had approached to those from the category of employee, rather than
those from the employer category. The requirement of employed staff shall be those who
worked for an organization, to be able to test the organization behavior with the main topic in
‘perceived organizational support’, ‘employee retention’, ‘organisation commitment’, and
‘successful organisation management’. Hence, in this case, researcher has screened out those
contact who is a freelancer, that they do not serve an organisation.
Another reason that researcher had approached to only employee category of respondents is
considering to the topic of survey, the topic is mainly viewing from the perspective of how an
employee think. And from what has been perceived by employee, what effect that the
organisation will foresee, and what shall the organisation strategise themselves to avoid from
falling into the pitfall.
Page 40 of 113
3.4 Sampling Frame and Sampling Location
The research was aiming to target only working personnel that work within Malaysia,
regardless of the gender, tenure and educational level. The sampling frame for this study is
rather more flexible, as long as fulfilling the requirement that they are the working personnel
who work in an organisation, within Malaysia. From the researcher’s point of justification, all
working personnel will be able to provide a constructive feedback, or comment of what they
have perceived in this topic to enable more overall analysis of studying.
The sampling location that the researcher picked, has been based on the conveniences of data
compilation. Sampling was compiled via the online method, using the technology of Google
form which enable the compilation in electronic copy rather than the printed copy. Electronic
copy of sampling method was seen to be much environmentally friendly. The link for the
Google form was circulated via Whatsapps, Facebook and also emails.
3.5 Sample Size
As much as possible of links with questionnaires developed in Google Form were disseminated,
however there are a total of 100 responses collected at the end of the survey period. That was
deemed a success to get 100 responses in a short period of time, at the situation where
researcher had faced the time constraint while compiling the primary data.
Researcher had learnt that in order to compile for an approximately 200 responses, which is as
targeted at the early of the research, there shall be more time allocated to compile the primary
data. There shall be at least a three months duration designated just for reaching out to the
respondents including the prompting, and also to approach those who are not in researcher’s
contact list.

Page 41 of 113
3.6 Data Collection Procedure
Firstly, the research proposal established with the development of research objectives, research
questions and also the hypotheses.
Secondly, the scales of constructs adopted from the previous researchers and scholars to be
further establish into research questionnaires.
Thirdly, the research questionnaires developed for the collection of primary data.
Fourth, the data collected from the Google form were then tabulated with the SPSS and the
results were analysed.
In between, ethics clearance was also obtained its approval from the UTAR.
3.7 The Pretest Stage of Research
Prior to come out with the idea on a specific topic for this proper study, researcher has been
researching on the topic under organisational behavior. And linking with own understanding
from the worklife experiences, researcher noticed that there is still huge impact of ‘perceived
organisational support’ plays onto the employees, and towards the organisation at large.
Analysing if to get the win – win situation, all types of support from the organisation is highly
regarded at. With the increase of intelligence cognitively of the workers today at this era of
globalisation, researcher see that this piece of organisational behavior has been looked at as
imperatively crucial. In this new era that is globalised, knowledge and information sharing has
no border in between each other and it is travelling fast with just one click from the technology
device. This situation is especially true, when we are having high speed optical cable to transmit
the data, if talking about the Internet.
After determining that this research will be studying under the topic of perceived organisational
support, ample readings were done to have more understanding on various discussions, prior

Page 42 of 113
research works, prior findings including the theory, the findings and other substances related
to research and this topic.
Theories from scholars were examined at, and researcher conducted many discussions with the
other researchers for getting insight into the study before coming out with the research
questions for establishing research skeleton for own study.
After feedback or comment gained from the first batch of pilot testing proof readers, some
extensive corrections were made to further revise the disseminated version so that it will be
literally make sense to the respondents when they are answering the questions.
Part of the reason for the derived of research interest in this current topic is, researcher had felt
that while as an employee who has relentlessly contributing the effort and time in an
organisation, it is also obligated fair that employee shall be treated fairly well by the
organisation as a return. This is similar to the born concept of barter system which is also
practicably carried out when human has no trading unit in gold, or the monetary terms. In here,
we have found out that this concept was explained by Blau’s reciprocity theory.
When workers contributed the time, efforts and knowledge, they will highly hoping to get back
something in return which we may utilised as a tool to upgrade own and family life. (Researcher
had opted to use the pronoun of ‘wee’ here, depicting the same thoughts as other who is also a
worker under an organisation).
Reliability tested scales from other scholars were gathered and certain questions were picked
out to be included into the survey questionnaires for this study considering its matching in this
society. Questionnaires to be completed within 15 minutes of duration were developed, and
being distributed to a few respondents to test out the experience in survey responses, proof
reading and also to eliminate complexity under the Malaysia context.
Data collection action is then started by disseminating the survey links to the contact list of
researcher, WhatsApp contact list, posting onto social media platform and also through a blast
mail within a few institutions in Klang Valley. As researcher had originated from Penang Island,
the survey link is also circulated among Penangists and had contributed as the second large
responded grouping. The major group of respondents in this survey are contributed by

Page 43 of 113
employees who work within Klang Valley. This is because researcher had developed friends
list and contacts while being a worker in Klang Valley for 9 years since year 2010.
3.8 The Final Stage of Research
Responses collected using Google form are then summarized using the Excel document
spreadsheet. All information obtained will then be tabulated into the SPSS software for the
purpose of running the analyses which will be presented in this study.
After the results generated from SPSS, analyses conducted. This is to empirically review the
observed patterns and outcome in this study with the theories spelt out by other scholars. Ample
readings were also committed so that more knowledge built up to enhance the interpretation
into this research.
Discussions were established with other researchers who are conducting research in another
field under the same postgraduate programme. This is as the purpose of knowledge sharing and
in conjunction with information exchanges so that the right paper procedure adhered to.
3.9 Constructs Measurement
Perceived Organisational Support
The original scales with 36 items was developed by Eisenberger and partners in 1986.
Cronbach’s Alpha of .97 was achieved by Eisenberger and partners. And the scales with 16
items was then improved and tested its reliability. In this study, researchers adopted the latest
8 items scales for testing the POS outcomes of employees.

Page 44 of 113
Initially, in Year 1986, the ‘Perceived Organisational Support Theory’ was first found by the
researchers, Eisenberger, Huntington, Hutchison and Sowa. At that time, the group of
companion researchers had come out with a measurement scales of 36 items. And in the later
years, they have noted that the similar effectiveness has been proven even when the
measurement scales decreased to 16 items. At the most recent findings, the researchers have
confirmed that even the 8 items scales play a similar function.
Considering that the 8 items scales not only beneficial in terms of promising a shorten
questionnaires answering duration, but also will be effectively testing the respondents’
perceived organisational supports they enjoyed from the organisation they are serving. Hence,
the 8 items scales were adopted for the simplicity, precisely and conveniences towards the
respondents, whose time is valuable as we are targeting working personnel.
Researcher had concern that when there are too many items of questionnaires, there are certain
risks administered. When respondents lost their patience, they might be answering the
questions in a way that is not truly and appropriately representing their thoughts. When there
are situations where a few questions are actually leading to a research findings but it were just
merely a different in the questionnaires styles, wordings and reverted methods, respondents
might get confused and providing the answers that are contradicting and thus affected the
research study analyses.
Employee Retention
Four items from the scales developed by Kyndt, Dochy, Michielsen and Moeyaert were used
in this study questionnaires. The previous study shows a Cronbach’s Alpha α of .91.
Similarly, the scholars Kyndt, Dochy, Michielsen and Moeyaert (2009) scales of employee
retention was originally having eleven items for measurement. When found that there are a few
of the questions that actually redundantly interpreted the same meaning, hence, researcher had
decided to drop those that are deemed complicated and redundant.

Page 45 of 113
Organisational Commitment
The affective commitment scale developed by Meyer and Allen (1997) was used. Other
scholars’ research findings using Cronbach’s α is .85.
The scales used including the below:

Page 46 of 113
The scales are being transformed into questions with answer sought from the 7 points Likert
Scale being 1 as ‘strongly agree’ and 7 as ‘strongly disagree’.

Page 47 of 113
CHAPTER 4 Chapter heading, 16-point in bold } double single spacing
}
DATA ANALYSIS AND FINDINGS Chapter heading, 16-
point in bold
}
} triple single spacing
4.1 Introduction
This chapter will present the analyses and statistical data developed from SPSS obtained from
the primary data of questionnaires survey. There are 101 samples successfully collected after
‘Ethics Clearance’ approval given by UTAR Scientific and Ethical Review Committee (SERC)
to conduct data collection through the survey method.
Generally explaining, the data compiled by the researcher from the 101 respondents through
the questionnaires in Google form were tabulated into the SPSS software system. Analyses
were conducted with the SPSS using the descriptive analysis, and multivariate analysis.
Data generated were then examined closely so that the statistics can be interpreted into a series
of explanation which can justify the hypotheses developed from the research questions in
Chapter 2.
4.2 Descriptive analysis
Descriptive statistics is also known as the summary statistics, these data play a function to
communicate the specification of a data in a better way which can be comprehended to enable
in depth understanding from the researcher, reader and user.
Descriptive analyses in this study were referring to the variables of:
1. Categorical Variables – variables that are able to be grouped.
1.1 Dichotomous variables - gender

Page 48 of 113
1.2 Polychotomous variables – job status
2. Continuous Variables – variables that are continuously running in the sense of having
descending or ascending order.
Example: Age
4.3 Multivariate Analysis
Multivariate analysis is able to estimate an outcome for a continuous variable. Multiple
regression shows the analyses on the relationship between each of the constructs, in the terms
of research, it was seen as the identifier for the predictor or outcome which are statistically
correlate with each other with the (p≤ .05). If (p > .05), then it will be determined as statistically
insignificant, in which to say that it is irrelevant.
4.4 Code Book for the SPSS Data Entry – Demographic
While entering information into SPSS, researcher had defined the codes for each of the data
in the questionnaires listed for reference, as below:
Category 0 1 2 3 4 5
Gender
Mal
e
Fem
ale
- - - -
Age Group
20 -
29
30 -
39
40 -
49
50 -
59
60 -
69
-

Page 49 of 113
Category 0 1 2 3 4 5
Type of Organisation P
ubli
c
Pri
vat
e
Sem
i-G
over
nm
ent
Non-P
rofi
t O
rgan
isat
ion
- -
Employment Status
Pro
bat
ionar
y
Contr
act
Sta
ff
Fre
elan
cer
Confi
rmed
Per
man
ent
Sta
ff
- - Tenure
< 6
month
s
6 m
onth
s – 1
yea
r
1 y
ear
1 d
ay –
5 y
ears
5 y
ears
1 d
ay –
10 y
ears
> 1
0 y
ears

Page 50 of 113
Category 0 1 2 3 4 5
Education
qualification
PhD
/ D
oct
ora
te
Mas
ter
Deg
ree
Und
ergra
duat
e D
egre
e
Dip
lom
a
ST
PM
Job Nature
Adm
in
Engin
eeri
ng
Aca
dem
ic
Art
ist
Med
ical
Ban
kin
g
Job Level
Man
agem
ent
Junio
r E
xec
uti
ve
Sen
ior
Ex
ecuti
ve
Sen
ior
Man
agem
ent
- -
Table 7. Code Book for SPSS Data Entry (Demographic Variables)

Page 51 of 113
4.5 Code Book for the SPSS Data Entry – Constructs
Constructs 1 2 3 4 5 6 7
POS 1 S
trongly
Agre
e
Agre
e
More
or
Les
s A
gre
e
Undec
ided
More
or
Les
s D
isag
ree
Dis
agre
e
Str
ongly
Dis
agre
e
POS 2
POS 3
ER 1
ER 2
ER 3
OM 1
OM 2
OM 3
Table 8. Code Book for SPSS Data Entry (Construct)
Reference to the acronyms of constructs:
Acronyms Scales Reference
POS 1 Perceived organisational support
POS 2
POS 3
ER 1 Employee retention
ER 2
ER 3
OM 1 Organisational management
OM 2
OM 3

Page 52 of 113
Correlations
Descriptive Statistics
Mean Std. Deviation N
POS1 3.6634 1.52497 101
POS2 3.6733 1.49739 101
POS3 4.9010 5.29623 101
ER1 3.9604 1.93350 101
ER2 3.1400 1.88036 100
ER3 3.4554 1.83589 101
OC1 3.6832 1.69665 101
OC2 3.4554 1.59703 101
OC3 3.3663 1.50148 101
Researcher had computed the 101 sample answers that are using 7 point Likert scales into SPSS,
and the information of ‘Mean’ and ‘Standard deviation’ are developed. We can see that each of
the constructs are not far deviating from each other. Except that in POS 3, there could be some
error happening in the data.
Correlations
POS1 POS2 POS3 ER1 ER2 ER3 OC1 OC2 OC3
POS1 Pearson
Correlation
1 .678** -.179 -.252* .404** .452** .527** .503** .578**
Sig. (2-tailed) .000 .074 .011 .000 .000 .000 .000 .000
Sum of
Squares and
Cross-
products
232.554 154.891 -144.366 -74.347 114.480 126.485 136.228 122.485 132.455
Covariance 2.326 1.549 -1.444 -.743 1.156 1.265 1.362 1.225 1.325
N 101 101 101 101 100 101 101 101 101
POS2 Pearson
Correlation
.678** 1 -.189 -.222* .402** .462** .628** .598** .539**
Sig. (2-tailed) .000 .058 .026 .000 .000 .000 .000 .000
Sum of
Squares and
Cross-
products
154.891 224.218 -150.267 -64.307 112.620 127.030 159.545 143.030 121.089
Covariance 1.549 2.242 -1.503 -.643 1.138 1.270 1.595 1.430 1.211
N 101 101 101 101 100 101 101 101 101

Page 53 of 113
POS3 Pearson
Correlation
-.179 -.189 1 .084 -.072 -.008 -.237* -.218* -.207*
Sig. (2-tailed) .074 .058 .406 .479 .939 .017 .028 .038
Sum of
Squares and
Cross-
products
-
144.366
-
150.267
2805.010 85.604 -70.880 -7.446 -
213.168
-
184.446
-
164.337
Covariance -1.444 -1.503 28.050 .856 -.716 -.074 -2.132 -1.844 -1.643
N 101 101 101 101 100 101 101 101 101
ER1 Pearson
Correlation
-.252* -.222* .084 1 -.184 -.288** -.318** -.399** -.253*
Sig. (2-tailed) .011 .026 .406 .067 .004 .001 .000 .011
Sum of
Squares and
Cross-
products
-74.347 -64.307 85.604 373.842 -66.440 -
102.178
-
104.267
-
123.178
-73.535
Covariance -.743 -.643 .856 3.738 -.671 -1.022 -1.043 -1.232 -.735
N 101 101 101 101 100 101 101 101 101
ER2 Pearson
Correlation
.404** .402** -.072 -.184 1 .509** .448** .474** .316**
Sig. (2-tailed) .000 .000 .479 .067 .000 .000 .000 .001
Sum of
Squares and
Cross-
products
114.480 112.620 -70.880 -66.440 350.040 174.700 141.620 141.560 88.820
Covariance 1.156 1.138 -.716 -.671 3.536 1.765 1.431 1.430 .897
N 100 100 100 100 100 100 100 100 100
ER3 Pearson
Correlation
.452** .462** -.008 -.288** .509** 1 .644** .662** .628**
Sig. (2-tailed) .000 .000 .939 .004 .000 .000 .000 .000
Sum of
Squares and
Cross-
products
126.485 127.030 -7.446 -
102.178
174.700 337.050 200.574 194.050 173.149
Covariance 1.265 1.270 -.074 -1.022 1.765 3.370 2.006 1.940 1.731
N 101 101 101 101 100 101 101 101 101
OC1 Pearson
Correlation
.527** .628** -.237* -.318** .448** .644** 1 .833** .753**
Sig. (2-tailed) .000 .000 .017 .001 .000 .000 .000 .000

Page 54 of 113
Sum of
Squares and
Cross-
products
136.228 159.545 -213.168 -
104.267
141.620 200.574 287.861 225.574 191.723
Covariance 1.362 1.595 -2.132 -1.043 1.431 2.006 2.879 2.256 1.917
N 101 101 101 101 100 101 101 101 101
OC2 Pearson
Correlation
.503** .598** -.218* -.399** .474** .662** .833** 1 .693**
Sig. (2-tailed) .000 .000 .028 .000 .000 .000 .000 .000
Sum of
Squares and
Cross-
products
122.485 143.030 -184.446 -
123.178
141.560 194.050 225.574 255.050 166.149
Covariance 1.225 1.430 -1.844 -1.232 1.430 1.940 2.256 2.550 1.661
N 101 101 101 101 100 101 101 101 101
OC3 Pearson
Correlation
.578** .539** -.207* -.253* .316** .628** .753** .693** 1
Sig. (2-tailed) .000 .000 .038 .011 .001 .000 .000 .000
Sum of
Squares and
Cross-
products
132.455 121.089 -164.337 -73.535 88.820 173.149 191.723 166.149 225.446
Covariance 1.325 1.211 -1.643 -.735 .897 1.731 1.917 1.661 2.254
N 101 101 101 101 100 101 101 101 101
**. Correlation is significant at the 0.01 level (2-tailed).
*. Correlation is significant at the 0.05 level (2-tailed).

Page 55 of 113
Frequencies
Statistics
Gender Age
Organisatio
n
Employmen
t Tenure
Educatio
n Job Level
N Valid 101 101 101 100 101 101 90 91
Missing 0 0 0 1 0 0 11 10
Mean .4950 1.5050 1.1089 2.4300 2.3663 1.0693 1.6889 1.1978
Std. Error of Mean .05000 .09812 .06880 .09771 .10966 .09362 .13560 .10273
Median .4950a 1.4110a 1.0244a 2.6364a 2.3939a .9857a 1.6129a 1.2364a
Mode .00 1.00 1.00 3.00 2.00 1.00 2.00 2.00
Std. Deviation .50247 .98614 .69139 .97706 1.10202 .94082 1.28644 .98002
Variance .252 .972 .478 .955 1.214 .885 1.655 .960
Skewness .020 .688 1.520 -1.358 -.270 .595 .865 -.048
Std. Error of
Skewness
.240 .240 .240 .241 .240 .240 .254 .253
Kurtosis -2.040 .063 3.048 .299 -.304 -.151 1.131 -1.394
Std. Error of Kurtosis .476 .476 .476 .478 .476 .476 .503 .500
Range 1.00 4.00 3.00 3.00 4.00 4.00 5.00 3.00
Minimum .00 .00 .00 .00 .00 .00 .00 .00
Maximum 1.00 4.00 3.00 3.00 4.00 4.00 5.00 3.00
Sum 50.00 152.00 112.00 243.00 239.00 108.00 152.00 109.00
a. Calculated from grouped data.
Observing from the results tabling as the above, we can see that mostly all descriptive variables
are valid, except the variables of ‘job type’ and ‘job level’ are both having observable missing
data. This is due to the vast varieties of job type and job level that had been communicated by
the respondents’ organisation differently from researcher.

Page 56 of 113
Frequency Table
Gender
Frequency Percent Valid Percent
Cumulative
Percent
Valid Male 51 50.5 50.5 50.5
Female 50 49.5 49.5 100.0
Total 101 100.0 100.0
Page 57 of 113
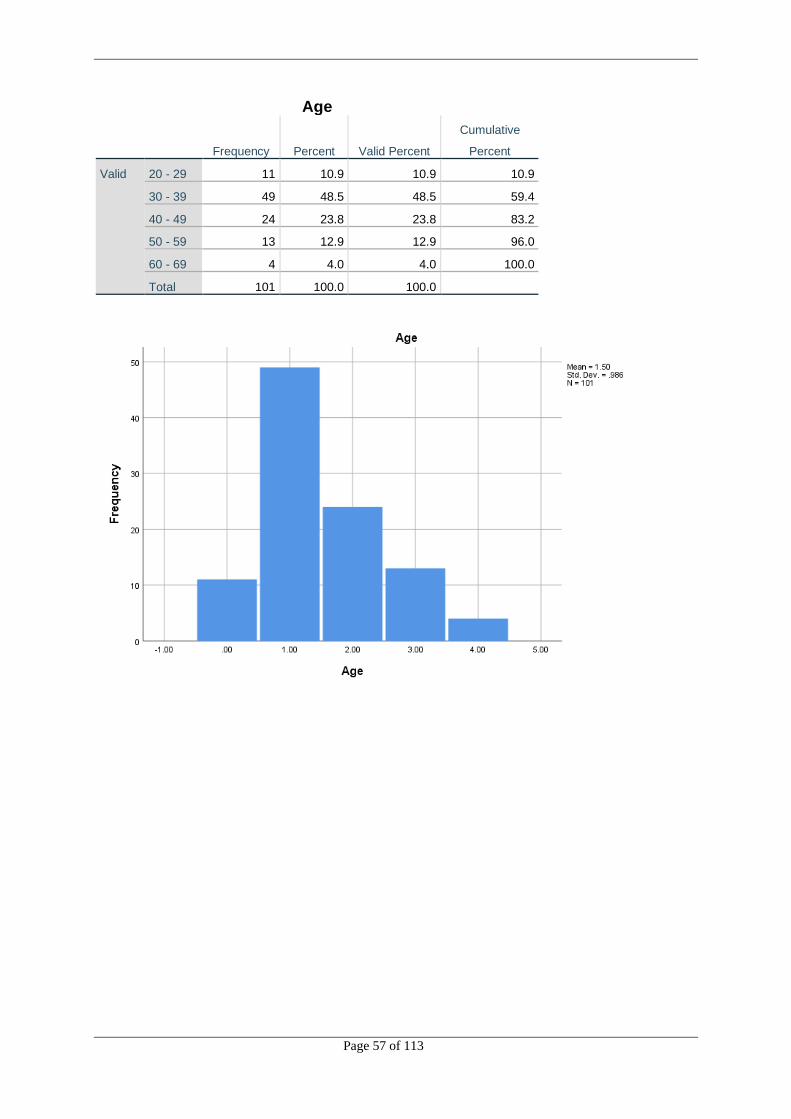
Age
Frequency Percent Valid Percent
Cumulative
Percent
Valid 20 - 29 11 10.9 10.9 10.9
30 - 39 49 48.5 48.5 59.4
40 - 49 24 23.8 23.8 83.2
50 - 59 13 12.9 12.9 96.0
60 - 69 4 4.0 4.0 100.0
Total 101 100.0 100.0

Page 58 of 113
Organisation
Frequency Percent Valid Percent
Cumulative
Percent
Valid Public 10 9.9 9.9 9.9
Private 79 78.2 78.2 88.1
Semi-Government 3 3.0 3.0 91.1
Non-profit organisation 9 8.9 8.9 100.0
Total 101 100.0 100.0

Page 59 of 113
Employment
Frequency Percent Valid Percent
Cumulative
Percent
Valid Probationary 6 5.9 6.0 6.0
Contract Staff 17 16.8 17.0 23.0
Freelancer 5 5.0 5.0 28.0
Confirmed permanent staff 72 71.3 72.0 100.0
Total 100 99.0 100.0
Missing System 1 1.0
Total 101 100.0

Page 60 of 113
Tenure
Frequency Percent Valid Percent
Cumulative
Percent
Valid Less than 6 months 7 6.9 6.9 6.9
6 months - 1 year 10 9.9 9.9 16.8
1 year 1 day - 5 years 41 40.6 40.6 57.4
5 years 1 day - 10 years 25 24.8 24.8 82.2
More than 10 years 18 17.8 17.8 100.0
Total 101 100.0 100.0

Page 61 of 113
Education
Frequency Percent Valid Percent
Cumulative
Percent
Valid PhD/Doctoral 32 31.7 31.7 31.7
Master/Postgraduate 38 37.6 37.6 69.3
Degree 24 23.8 23.8 93.1
Diploma 6 5.9 5.9 99.0
STPM 1 1.0 1.0 100.0
Total 101 100.0 100.0
Page 62 of 113
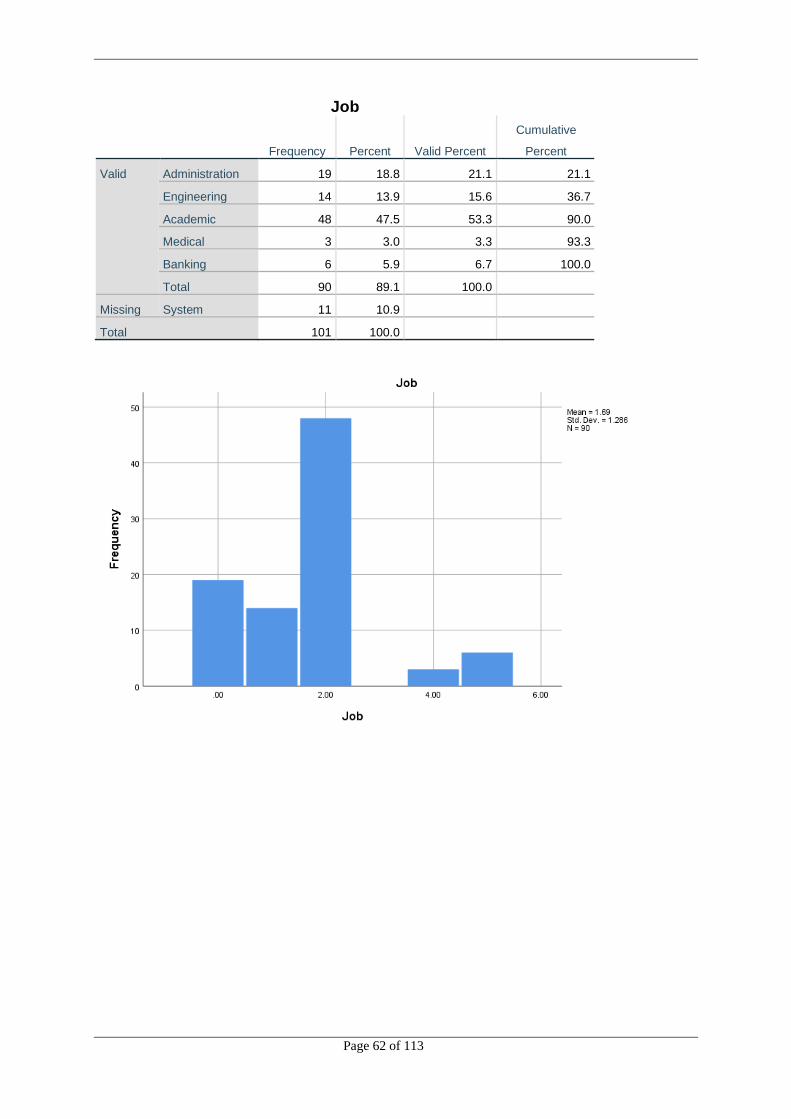
Job
Frequency Percent Valid Percent
Cumulative
Percent
Valid Administration 19 18.8 21.1 21.1
Engineering 14 13.9 15.6 36.7
Academic 48 47.5 53.3 90.0
Medical 3 3.0 3.3 93.3
Banking 6 5.9 6.7 100.0
Total 90 89.1 100.0
Missing System 11 10.9
Total 101 100.0

Page 63 of 113
Level
Frequency Percent Valid Percent
Cumulative
Percent
Valid Management 31 30.7 34.1 34.1
Junior Executive 16 15.8 17.6 51.6
Senior Executive 39 38.6 42.9 94.5
Senior Management 5 5.0 5.5 100.0
Total 91 90.1 100.0
Missing System 10 9.9
Total 101 100.0

Page 64 of 113
3.6 Data Interpretation
Gender
Referring to the generated data set, we can see that this study was responded equally from both
the gender, and we are saying that this study treated both gender as equally and the responses
from both genders contributed greatly to this study. This data set gives an unbiased examination
for both the male and female. Though in this study researcher does not plan to have a survey if
different gender depict differently on the constructs of perceived organisational behavior,
employee retention, organisation management and also the organisational commitment.
Frequency Percent
Valid Male 51 50.5
Female 50 49.5
Total 101 100.0
Age Group
Looking at the age group which had contributed largely from the group of 30 – 39 that
constituted a 48.5 % from all 101 responded samples, this group consists of those Generation
Y (born in between 1980 – 1994) are considered as the population that was firstly exposed with
the idea of globalisation. The responses from this group of employees is identified as justifiable
in looking at the physical and psychological rights as in this study due to the characteristics of
the group been known to be more vocal and knowledgeable. This situation is opposite and seen
a change compared to the age group of baby boomers (1944 – 1964) in which they are seen as
a more obedient employees.
Page 65 of 113
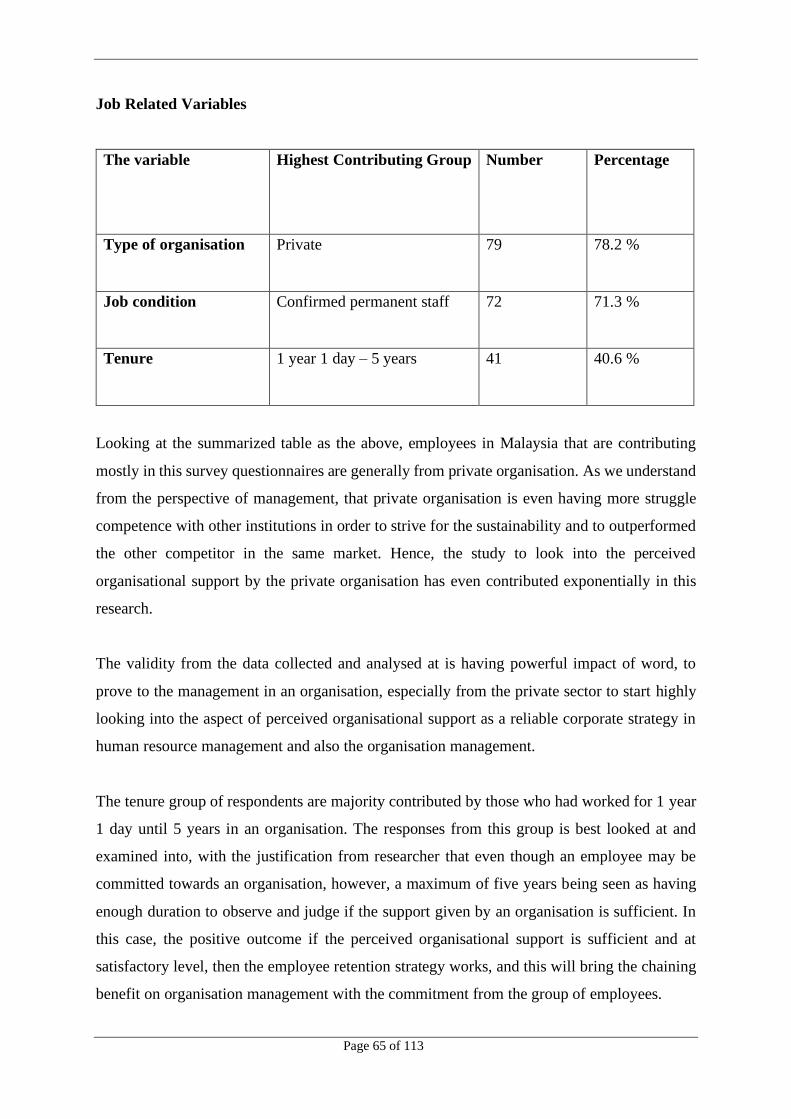
Job Related Variables
The variable Highest Contributing Group Number Percentage
Type of organisation Private 79 78.2 %
Job condition Confirmed permanent staff 72 71.3 %
Tenure 1 year 1 day – 5 years 41 40.6 %
Looking at the summarized table as the above, employees in Malaysia that are contributing
mostly in this survey questionnaires are generally from private organisation. As we understand
from the perspective of management, that private organisation is even having more struggle
competence with other institutions in order to strive for the sustainability and to outperformed
the other competitor in the same market. Hence, the study to look into the perceived
organisational support by the private organisation has even contributed exponentially in this
research.
The validity from the data collected and analysed at is having powerful impact of word, to
prove to the management in an organisation, especially from the private sector to start highly
looking into the aspect of perceived organisational support as a reliable corporate strategy in
human resource management and also the organisation management.
The tenure group of respondents are majority contributed by those who had worked for 1 year
1 day until 5 years in an organisation. The responses from this group is best looked at and
examined into, with the justification from researcher that even though an employee may be
committed towards an organisation, however, a maximum of five years being seen as having
enough duration to observe and judge if the support given by an organisation is sufficient. In
this case, the positive outcome if the perceived organisational support is sufficient and at
satisfactory level, then the employee retention strategy works, and this will bring the chaining
benefit on organisation management with the commitment from the group of employees.

Page 66 of 113
Tenure variables were designed in such a way that is not having equivalent interval in between,
due to consideration as elaborated below, targeting each of the continuous variables:
Tenure Justification of consideration
< 6 months Commonly that is the duration for a probationary period.
If a fresh employee perceived that they are not being
supported well by the organisation, majority will choose to
leave the organisation when their terms of leaving the
organisation is short, ie. 2 weeks or 1 week.
6 months - 1 year Some organisation or profession still having the probationary
period up to 1 year. Similar justification and area of
consideration as the above.
Judging from experience, there are also contributing factor
that causes voluntary turnover from an employee once they
have learnt the organisational behaviour within the
organisation. The group of employees may utilise some time
in practically adjusting themselves, for any failure of
adjustment, employees will choose to voluntarily withdraw
themselves.
1 year 1 day – 5 years Fairly well adjustment period for exploration, tackling
challenges and solving obstacles.
5 years 1 day – 10 years Loyalty duration. Adjusted and might work on for the long
service award, as observed from certain institutions.
> 10 years Loyalty duration. This might going for longer tenure with the
organisation.
Table 9. Descriptive Analysis of Tenure

Page 67 of 113
In this study, due to having observable error or missing data for the variables of job level and
type of job, hence researcher is not looking into the data studying nor making any conclusion.
Education Qualification
Respondents for this study came from well educated group, and hence the data collected
matched with the speculation from researcher, that due to the globalisation era, there are
increasing in knowledge worker or, they are the employees that are able to realise the legal
rights of one’s own. These group of adequately high educated employees are seen as
informative candidates who are qualified in judgmental evaluation and thus, the research data
collected can be said having its validity and reliability. This is notable, when respondents are
having the knowledge and language proficiency in understanding the questionnaires and are
able to make a justifiable evaluation. These are able to help researcher in data collection and
data interpretation; this is evident by minimal missing data in the samples.
Variable Level Number Percentage
Education
Qualification
PhD / Doctorate 32 31.7 %
Master Degree 38 37.6 %
Bachelor Degree 21 23.8 %
Sum 91 93.1 %
Total samples 101 100%
Table 10.Variable ‘Education Qualification’

Page 68 of 113
Descriptives
Descriptive Statistics
N Minimum Maximum Mean Std. Deviation
POS1 101 1.00 7.00 3.6634 1.52497
POS2 101 1.00 7.00 3.6733 1.49739
POS3 101 1.00 7.00 4.9010 5.29623
ER1 101 1.00 7.00 3.9604 1.93350
ER2 100 1.00 7.00 3.1400 1.88036
ER3 101 1.00 7.00 3.4554 1.83589
OC1 101 1.00 7.00 3.6832 1.69665
OC2 101 1.00 7.00 3.4554 1.59703
OC3 101 1.00 7.00 3.3663 1.50148
Valid N (listwise) 100
Descriptives
Descriptive Statistics
N
Rang
e
Minimu
m
Maximu
m Sum Mean
Std.
Deviati
on
Varian
ce Skewness Kurtosis
Statist
ic
Statist
ic
Statisti
c Statistic
Statist
ic
Statist
ic
Std.
Error
Statisti
c
Statisti
c
Statist
ic
Std
.
Err
or
Statist
ic
Std
.
Err
or
POS1 101 6.00 1.00 7.00 370.0
0
3.663
4
.151
74
1.5249
7
2.326 .468 .24
0
-.305 .47
6
POS2 101 6.00 1.00 7.00 371.0
0
3.673
3
.149
00
1.4973
9
2.242 .341 .24
0
-.437 .47
6
POS3 101 54.00 1.00 55.00 495.0
0
4.901
0
.527
00
5.2962
3
28.050 8.596 .24
0
81.95
7
.47
6
ER1 101 6.00 1.00 7.00 400.0
0
3.960
4
.192
39
1.9335
0
3.738 -.045 .24
0
-
1.009
.47
6
ER2 100 6.00 1.00 7.00 314.0
0
3.140
0
.188
04
1.8803
6
3.536 .770 .24
1
-.459 .47
8
ER3 101 6.00 1.00 7.00 349.0
0
3.455
4
.182
68
1.8358
9
3.370 .508 .24
0
-.717 .47
6

Page 69 of 113
OC1 101 6.00 1.00 7.00 372.0
0
3.683
2
.168
82
1.6966
5
2.879 .424 .24
0
-.682 .47
6
OC2 101 6.00 1.00 7.00 349.0
0
3.455
4
.158
91
1.5970
3
2.550 .781 .24
0
-.099 .47
6
OC3 101 6.00 1.00 7.00 340.0
0
3.366
3
.149
40
1.5014
8
2.254 .724 .24
0
-.151 .47
6
Valid
N
(listwis
e)
100
Frequencies
Statistics
POS1 POS2 POS3 ER1 ER2 ER3 OC1 OC2 OC3
N Valid 101 101 101 101 100 101 101 101 101
Missing 0 0 0 0 1 0 0 0 0
Mean 3.6634 3.6733 4.9010 3.9604 3.1400 3.4554 3.6832 3.4554 3.3663
Std. Error of Mean .15174 .14900 .52700 .19239 .18804 .18268 .16882 .15891 .14940
Median 3.5532a 3.5745a 4.5641a 4.0476a 2.7111a 3.2162a 3.4878a 3.1739a 3.1087a
Mode 4.00 3.00 6.00 4.00 2.00 2.00 3.00 2.00 2.00
Std. Deviation 1.52497 1.49739 5.29623 1.93350 1.88036 1.83589 1.69665 1.59703 1.50148
Variance 2.326 2.242 28.050 3.738 3.536 3.370 2.879 2.550 2.254
Skewness .468 .341 8.596 -.045 .770 .508 .424 .781 .724
Std. Error of
Skewness
.240 .240 .240 .240 .241 .240 .240 .240 .240
Kurtosis -.305 -.437 81.957 -1.009 -.459 -.717 -.682 -.099 -.151
Std. Error of
Kurtosis
.476 .476 .476 .476 .478 .476 .476 .476 .476
Range 6.00 6.00 54.00 6.00 6.00 6.00 6.00 6.00 6.00
Minimum 1.00 1.00 1.00 1.00 1.00 1.00 1.00 1.00 1.00
Maximum 7.00 7.00 55.00 7.00 7.00 7.00 7.00 7.00 7.00
Sum 370.00 371.00 495.00 400.00 314.00 349.00 372.00 349.00 340.00
a. Calculated from grouped data.

Page 70 of 113
Frequency Table
POS1
Frequency Percent Valid Percent
Cumulative
Percent
Valid Strongly Agree 4 4.0 4.0 4.0
Agree 23 22.8 22.8 26.7
More or less agree 21 20.8 20.8 47.5
Undecided 26 25.7 25.7 73.3
More or less disagree 16 15.8 15.8 89.1
Disagree 4 4.0 4.0 93.1
Strongly disagree 7 6.9 6.9 100.0
Total 101 100.0 100.0
POS2
Frequency Percent Valid Percent
Cumulative
Percent
Valid Strongly Agree 5 5.0 5.0 5.0
Agree 19 18.8 18.8 23.8
More or less agree 26 25.7 25.7 49.5
Undecided 21 20.8 20.8 70.3
More or less disagree 19 18.8 18.8 89.1
Disagree 6 5.9 5.9 95.0
Strongly disagree 5 5.0 5.0 100.0
Total 101 100.0 100.0
POS3
Frequency Percent Valid Percent
Cumulative
Percent
Valid Strongly agree 6 5.9 5.9 5.9
Agree 8 7.9 7.9 13.9
More or less agree 16 15.8 15.8 29.7
Undecided 19 18.8 18.8 48.5
More or less disagree 20 19.8 19.8 68.3
Disagree 23 22.8 22.8 91.1
Strongly disagree 8 7.9 7.9 99.0
55.00 1 1.0 1.0 100.0
Total 101 100.0 100.0

Page 71 of 113
ER1
Frequency Percent Valid Percent
Cumulative
Percent
Valid Strongly agree 16 15.8 15.8 15.8
Agree 12 11.9 11.9 27.7
More or less agree 6 5.9 5.9 33.7
Undecided 31 30.7 30.7 64.4
More or less disagree 11 10.9 10.9 75.2
Disagree 12 11.9 11.9 87.1
Strongly disagree 13 12.9 12.9 100.0
Total 101 100.0 100.0
ER2
Frequency Percent Valid Percent
Cumulative
Percent
Valid Strongly agree 20 19.8 20.0 20.0
Agree 28 27.7 28.0 48.0
More or less agree 17 16.8 17.0 65.0
Undecided 12 11.9 12.0 77.0
More or less disagree 9 8.9 9.0 86.0
Disagree 4 4.0 4.0 90.0
Strongly disagree 10 9.9 10.0 100.0
Total 100 99.0 100.0
Missing System 1 1.0
Total 101 100.0
ER3
Frequency Percent Valid Percent
Cumulative
Percent
Valid Strongly agree 14 13.9 13.9 13.9
Agree 25 24.8 24.8 38.6
More or less agree 15 14.9 14.9 53.5
Undecided 22 21.8 21.8 75.2
More or less disagree 8 7.9 7.9 83.2
Disagree 7 6.9 6.9 90.1
Strongly disagree 10 9.9 9.9 100.0
Total 101 100.0 100.0

Page 72 of 113
OC1
Frequency Percent Valid Percent
Cumulative
Percent
Valid Strongly agree 7 6.9 6.9 6.9
Agree 22 21.8 21.8 28.7
More or less agree 23 22.8 22.8 51.5
Undecided 18 17.8 17.8 69.3
More or less disagree 15 14.9 14.9 84.2
Disagree 7 6.9 6.9 91.1
Strongly disagree 9 8.9 8.9 100.0
Total 101 100.0 100.0
OC2
Frequency Percent Valid Percent
Cumulative
Percent
Valid Strongly agree 5 5.0 5.0 5.0
Agree 28 27.7 27.7 32.7
More or less agree 27 26.7 26.7 59.4
Undecided 19 18.8 18.8 78.2
More or less disagree 9 8.9 8.9 87.1
Disagree 5 5.0 5.0 92.1
Strongly disagree 8 7.9 7.9 100.0
Total 101 100.0 100.0
OC3
Frequency Percent Valid Percent
Cumulative
Percent
Valid Strongly agree 5 5.0 5.0 5.0
Agree 29 28.7 28.7 33.7
More or less agree 28 27.7 27.7 61.4
Undecided 18 17.8 17.8 79.2
More or less disagree 9 8.9 8.9 88.1
Disagree 8 7.9 7.9 96.0
Strongly disagree 4 4.0 4.0 100.0
Total 101 100.0 100.0

Page 73 of 113
Regression
Variables Entered/Removeda
Model
Variables
Entered
Variables
Removed Method
1 OC3, ER1, ER2,
ER3, OC2,
OC1b
. Enter
a. Dependent Variable: POS1
b. All requested variables entered.
Model Summaryb
Model R R Square
Adjusted R
Square
Std. Error of the
Estimate
1 .634a .402 .363 1.21589
a. Predictors: (Constant), OC3, ER1, ER2, ER3, OC2, OC1
b. Dependent Variable: POS1
ANOVAa
Model Sum of Squares df Mean Square F Sig.
1 Regression 92.271 6 15.378 10.402 .000b
Residual 137.489 93 1.478
Total 229.760 99
a. Dependent Variable: POS1
b. Predictors: (Constant), OC3, ER1, ER2, ER3, OC2, OC1
Coefficientsa
Model
Unstandardized Coefficients
Standardized
Coefficients
t Sig. B Std. Error Beta
1 (Constant) 1.631 .505 3.233 .002
ER1 -.061 .069 -.078 -.884 .379
ER2 .172 .078 .212 2.191 .031
ER3 .001 .099 .002 .013 .989
OC1 .109 .149 .122 .735 .464
OC2 -.015 .152 -.016 -.098 .922
OC3 .415 .131 .410 3.153 .002
a. Dependent Variable: POS1

Page 74 of 113
Residuals Statisticsa
Minimum Maximum Mean Std. Deviation N
Predicted Value 1.8877 6.3422 3.6800 .96542 100
Std. Predicted Value -1.857 2.758 .000 1.000 100
Standard Error of Predicted
Value
.133 .588 .302 .111 100
Adjusted Predicted Value 1.9373 6.4857 3.6818 .97261 100
Residual -3.10914 3.36991 .00000 1.17847 100
Std. Residual -2.557 2.772 .000 .969 100
Stud. Residual -2.634 2.809 -.001 1.011 100
Deleted Residual -3.29854 3.46272 -.00178 1.28427 100
Stud. Deleted Residual -2.723 2.921 .000 1.023 100
Mahal. Distance .192 22.149 5.940 4.985 100
Cook's Distance .000 .150 .013 .026 100
Centered Leverage Value .002 .224 .060 .050 100
a. Dependent Variable: POS1
Charts

Page 75 of 113
Regression
Variables Entered/Removeda
Model
Variables
Entered
Variables
Removed Method
1 OC3, ER1, ER2,
ER3, OC2,
OC1b
. Enter
a. Dependent Variable: POS2
b. All requested variables entered.
Model Summaryb
Model R R Square
Adjusted R
Square
Std. Error of the
Estimate
1 .658a .432 .396 1.16948
a. Predictors: (Constant), OC3, ER1, ER2, ER3, OC2, OC1
b. Dependent Variable: POS2

Page 76 of 113
ANOVAa
Model Sum of Squares df Mean Square F Sig.
1 Regression 96.915 6 16.153 11.810 .000b
Residual 127.195 93 1.368
Total 224.110 99
a. Dependent Variable: POS2
b. Predictors: (Constant), OC3, ER1, ER2, ER3, OC2, OC1
Coefficientsa
Model
Unstandardized Coefficients
Standardized
Coefficients
t Sig. B Std. Error Beta
1 (Constant) 1.241 .485 2.557 .012
ER1 .007 .066 .009 .101 .920
ER2 .112 .075 .140 1.489 .140
ER3 -.022 .095 -.027 -.234 .816
OC1 .287 .143 .325 2.008 .047
OC2 .173 .146 .185 1.185 .239
OC3 .140 .126 .141 1.109 .270
a. Dependent Variable: POS2
Residuals Statisticsa
Minimum Maximum Mean Std. Deviation N
Predicted Value 1.9654 6.1038 3.6700 .98942 100
Std. Predicted Value -1.723 2.460 .000 1.000 100
Standard Error of Predicted
Value
.128 .565 .291 .107 100
Adjusted Predicted Value 1.9248 6.1997 3.6728 .99334 100
Residual -3.29572 3.42034 .00000 1.13349 100
Std. Residual -2.818 2.925 .000 .969 100
Stud. Residual -2.903 2.998 -.001 1.012 100
Deleted Residual -3.49648 3.59368 -.00284 1.23757 100
Stud. Deleted Residual -3.027 3.137 -.001 1.025 100
Mahal. Distance .192 22.149 5.940 4.985 100
Cook's Distance .000 .140 .014 .023 100
Centered Leverage Value .002 .224 .060 .050 100
a. Dependent Variable: POS2

Page 77 of 113
Charts

Page 78 of 113
Regression
Variables Entered/Removeda
Model
Variables
Entered
Variables
Removed Method
1 OC3, ER1, ER2,
ER3, OC2,
OC1b
. Enter
a. Dependent Variable: POS3
b. All requested variables entered.
Model Summaryb
Model R R Square
Adjusted R
Square
Std. Error of the
Estimate
1 .334a .111 .054 5.17359
a. Predictors: (Constant), OC3, ER1, ER2, ER3, OC2, OC1
b. Dependent Variable: POS3
ANOVAa
Model Sum of Squares df Mean Square F Sig.
1 Regression 312.119 6 52.020 1.944 .082b
Residual 2489.241 93 26.766
Total 2801.360 99
a. Dependent Variable: POS3
b. Predictors: (Constant), OC3, ER1, ER2, ER3, OC2, OC1
Coefficientsa
Model
Unstandardized Coefficients
Standardized
Coefficients
t Sig. B Std. Error Beta
1 (Constant) 7.524 2.147 3.504 .001
ER1 .034 .292 .013 .118 .907
ER2 -.096 .333 -.034 -.287 .775
ER3 .969 .420 .336 2.308 .023
OC1 -.540 .633 -.172 -.853 .396
OC2 -.550 .647 -.166 -.850 .398
OC3 -.563 .559 -.160 -1.007 .317

Page 79 of 113
a. Dependent Variable: POS3
Casewise Diagnosticsa
Case Number Std. Residual POS3 Predicted Value Residual
47 8.746 55.00 9.7511 45.24889
a. Dependent Variable: POS3
Residuals Statisticsa
Minimum Maximum Mean Std. Deviation N
Predicted Value 1.1606 9.7511 4.9200 1.77559 100
Std. Predicted Value -2.117 2.721 .000 1.000 100
Standard Error of Predicted
Value
.565 2.501 1.286 .471 100
Adjusted Predicted Value .6549 10.3783 4.9001 1.87301 100
Residual -8.01295 45.24889 .00000 5.01436 100
Std. Residual -1.549 8.746 .000 .969 100
Stud. Residual -1.676 9.298 .002 1.028 100
Deleted Residual -9.37831 51.13911 .01992 5.64577 100
Stud. Deleted Residual -1.692 34.853 .257 3.520 100
Mahal. Distance .192 22.149 5.940 4.985 100
Cook's Distance .000 1.608 .019 .161 100
Centered Leverage Value .002 .224 .060 .050 100
a. Dependent Variable: POS3

Page 80 of 113
Charts

Page 81 of 113
Regression
Variables Entered/Removeda
Model
Variables
Entered
Variables
Removed Method
1 POS3, POS1,
POS2b
. Enter
a. Dependent Variable: ER1
b. All requested variables entered.
Model Summaryb
Model R R Square
Adjusted R
Square
Std. Error of the
Estimate
1 .264a .069 .041 1.89374
a. Predictors: (Constant), POS3, POS1, POS2
b. Dependent Variable: ER1
ANOVAa
Model Sum of Squares df Mean Square F Sig.
1 Regression 25.976 3 8.659 2.414 .071b
Residual 347.866 97 3.586
Total 373.842 100
a. Dependent Variable: ER1
b. Predictors: (Constant), POS3, POS1, POS2
Coefficientsa
Model
Unstandardized Coefficients
Standardized
Coefficients
t Sig. B Std. Error Beta
1 (Constant) 5.188 .606 8.563 .000
POS1 -.234 .169 -.185 -1.383 .170
POS2 -.117 .173 -.090 -.675 .501
POS3 .012 .037 .033 .334 .739
a. Dependent Variable: ER1

Page 82 of 113
Residuals Statisticsa
Minimum Maximum Mean Std. Deviation N
Predicted Value 2.7425 4.9223 3.9604 .50966 101
Std. Predicted Value -2.390 1.887 .000 1.000 101
Standard Error of Predicted
Value
.195 1.822 .332 .180 101
Adjusted Predicted Value 2.6640 27.3325 4.1828 2.38148 101
Residual -3.66443 3.53093 .00000 1.86512 101
Std. Residual -1.935 1.865 .000 .985 101
Stud. Residual -3.500 1.883 -.025 1.058 101
Deleted Residual -24.33250 3.60095 -.22244 3.09609 101
Stud. Deleted Residual -3.725 1.908 -.028 1.071 101
Mahal. Distance .073 91.589 2.970 9.136 101
Cook's Distance .000 38.211 .388 3.801 101
Centered Leverage Value .001 .916 .030 .091 101
a. Dependent Variable: ER1
Charts

Page 83 of 113
Regression
Variables Entered/Removeda
Model
Variables
Entered
Variables
Removed Method
1 POS3, POS1,
POS2b
. Enter
a. Dependent Variable: ER2
b. All requested variables entered.
Model Summaryb
Model R R Square
Adjusted R
Square
Std. Error of the
Estimate
1 .439a .193 .168 1.71540
a. Predictors: (Constant), POS3, POS1, POS2
b. Dependent Variable: ER2
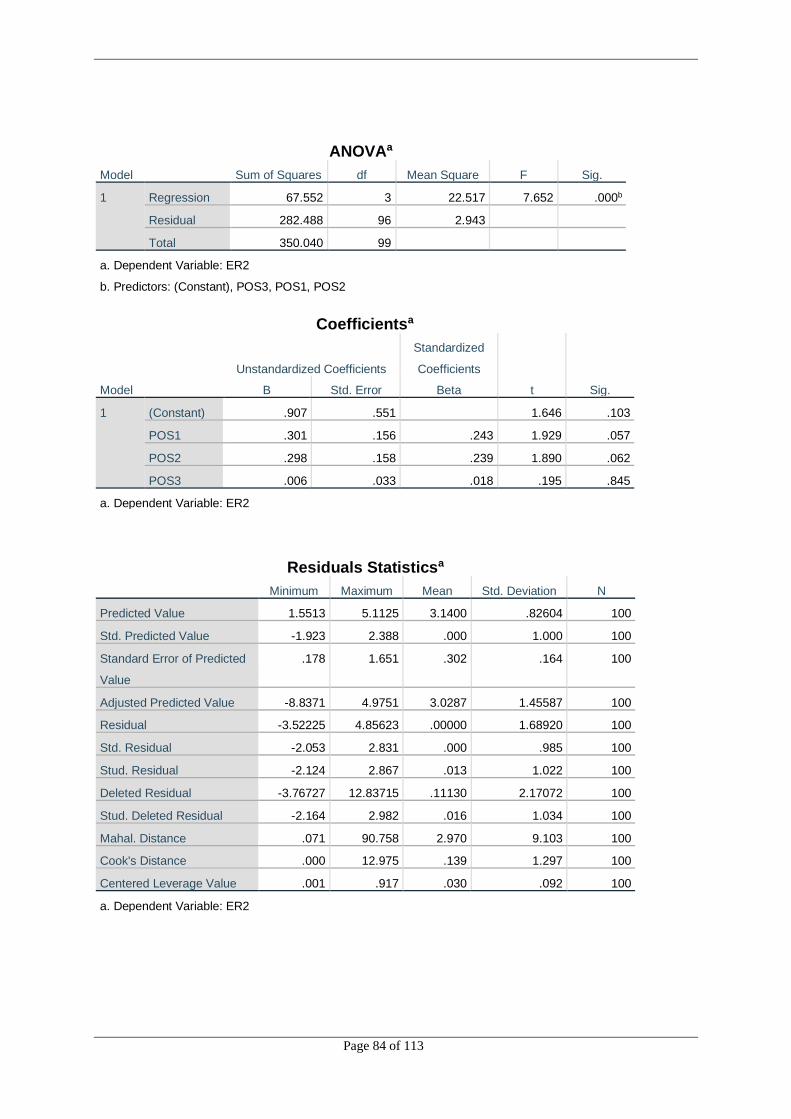
Page 84 of 113
ANOVAa
Model Sum of Squares df Mean Square F Sig.
1 Regression 67.552 3 22.517 7.652 .000b
Residual 282.488 96 2.943
Total 350.040 99
a. Dependent Variable: ER2
b. Predictors: (Constant), POS3, POS1, POS2
Coefficientsa
Model
Unstandardized Coefficients
Standardized
Coefficients
t Sig. B Std. Error Beta
1 (Constant) .907 .551 1.646 .103
POS1 .301 .156 .243 1.929 .057
POS2 .298 .158 .239 1.890 .062
POS3 .006 .033 .018 .195 .845
a. Dependent Variable: ER2
Residuals Statisticsa
Minimum Maximum Mean Std. Deviation N
Predicted Value 1.5513 5.1125 3.1400 .82604 100
Std. Predicted Value -1.923 2.388 .000 1.000 100
Standard Error of Predicted
Value
.178 1.651 .302 .164 100
Adjusted Predicted Value -8.8371 4.9751 3.0287 1.45587 100
Residual -3.52225 4.85623 .00000 1.68920 100
Std. Residual -2.053 2.831 .000 .985 100
Stud. Residual -2.124 2.867 .013 1.022 100
Deleted Residual -3.76727 12.83715 .11130 2.17072 100
Stud. Deleted Residual -2.164 2.982 .016 1.034 100
Mahal. Distance .071 90.758 2.970 9.103 100
Cook's Distance .000 12.975 .139 1.297 100
Centered Leverage Value .001 .917 .030 .092 100
a. Dependent Variable: ER2

Page 85 of 113
Charts

Page 86 of 113
Regression
Variables Entered/Removeda
Model
Variables
Entered
Variables
Removed Method
1 POS3, POS1,
POS2b
. Enter
a. Dependent Variable: ER3
b. All requested variables entered.
Model Summaryb
Model R R Square
Adjusted R
Square
Std. Error of the
Estimate
1 .508a .258 .235 1.60576
a. Predictors: (Constant), POS3, POS1, POS2
b. Dependent Variable: ER3
ANOVAa
Model Sum of Squares df Mean Square F Sig.
1 Regression 86.940 3 28.980 11.239 .000b
Residual 250.110 97 2.578
Total 337.050 100
a. Dependent Variable: ER3
b. Predictors: (Constant), POS3, POS1, POS2
Coefficientsa
Model
Unstandardized Coefficients
Standardized
Coefficients
t Sig. B Std. Error Beta
1 (Constant) .768 .514 1.495 .138
POS1 .319 .144 .265 2.223 .029
POS2 .368 .147 .300 2.513 .014
POS3 .034 .031 .097 1.083 .282
a. Dependent Variable: ER3

Page 87 of 113
Casewise Diagnosticsa
Case Number Std. Residual ER3 Predicted Value Residual
5 3.004 7.00 2.1771 4.82291
a. Dependent Variable: ER3
Residuals Statisticsa
Minimum Maximum Mean Std. Deviation N
Predicted Value 1.6904 5.6493 3.4554 .93242 101
Std. Predicted Value -1.893 2.353 .000 1.000 101
Standard Error of Predicted
Value
.166 1.545 .281 .152 101
Adjusted Predicted Value -11.8575 5.5509 3.2905 1.77945 101
Residual -3.45699 4.82291 .00000 1.58149 101
Std. Residual -2.153 3.004 .000 .985 101
Stud. Residual -2.207 3.057 .022 1.043 101
Deleted Residual -3.63429 17.85752 .16495 2.41305 101
Stud. Deleted Residual -2.253 3.199 .026 1.059 101
Mahal. Distance .073 91.589 2.970 9.136 101
Cook's Distance .000 28.624 .292 2.847 101
Centered Leverage Value .001 .916 .030 .091 101
a. Dependent Variable: ER3

Page 88 of 113
Charts

Page 89 of 113
Regression
Variables Entered/Removeda
Model
Variables
Entered
Variables
Removed Method
1 POS3, POS1,
POS2b
. Enter
a. Dependent Variable: OC1
b. All requested variables entered.
Model Summaryb
Model R R Square
Adjusted R
Square
Std. Error of the
Estimate
1 .652a .425 .408 1.30577
a. Predictors: (Constant), POS3, POS1, POS2
b. Dependent Variable: OC1
ANOVAa
Model Sum of Squares df Mean Square F Sig.
1 Regression 122.472 3 40.824 23.943 .000b
Residual 165.389 97 1.705
Total 287.861 100
a. Dependent Variable: OC1
b. Predictors: (Constant), POS3, POS1, POS2
Coefficientsa
Model
Unstandardized Coefficients
Standardized
Coefficients
t Sig. B Std. Error Beta
1 (Constant) 1.117 .418 2.674 .009
POS1 .195 .117 .176 1.673 .098
POS2 .552 .119 .487 4.632 .000
POS3 -.036 .025 -.113 -1.444 .152
a. Dependent Variable: OC1

Page 90 of 113
Residuals Statisticsa
Minimum Maximum Mean Std. Deviation N
Predicted Value 1.3604 6.3141 3.6832 1.10667 101
Std. Predicted Value -2.099 2.377 .000 1.000 101
Standard Error of Predicted
Value
.135 1.256 .229 .124 101
Adjusted Predicted Value -6.6188 6.2636 3.6034 1.49039 101
Residual -2.99849 3.38981 .00000 1.28604 101
Std. Residual -2.296 2.596 .000 .985 101
Stud. Residual -2.351 2.659 .013 1.017 101
Deleted Residual -3.14732 8.61880 .07979 1.58284 101
Stud. Deleted Residual -2.408 2.748 .015 1.028 101
Mahal. Distance .073 91.589 2.970 9.136 101
Cook's Distance .000 10.083 .109 1.003 101
Centered Leverage Value .001 .916 .030 .091 101
a. Dependent Variable: OC1
Charts

Page 91 of 113
Regression
Variables Entered/Removeda
Model
Variables
Entered
Variables
Removed Method
1 POS3, POS1,
POS2b
. Enter
a. Dependent Variable: OC2
b. All requested variables entered.
Model Summaryb
Model R R Square
Adjusted R
Square
Std. Error of the
Estimate
1 .620a .385 .366 1.27186
a. Predictors: (Constant), POS3, POS1, POS2
b. Dependent Variable: OC2
ANOVAa
Model Sum of Squares df Mean Square F Sig.
1 Regression 98.140 3 32.713 20.223 .000b
Residual 156.910 97 1.618
Total 255.050 100
a. Dependent Variable: OC2
b. Predictors: (Constant), POS3, POS1, POS2
Coefficientsa
Model
Unstandardized Coefficients
Standardized
Coefficients
t Sig. B Std. Error Beta
1 (Constant) 1.132 .407 2.783 .006
POS1 .179 .114 .171 1.572 .119
POS2 .494 .116 .463 4.256 .000
POS3 -.030 .025 -.100 -1.227 .223
a. Dependent Variable: OC2

Page 92 of 113
Residuals Statisticsa
Minimum Maximum Mean Std. Deviation N
Predicted Value 1.4973 5.8136 3.4554 .99065 101
Std. Predicted Value -1.977 2.380 .000 1.000 101
Standard Error of Predicted
Value
.131 1.224 .223 .121 101
Adjusted Predicted Value -4.7736 5.7264 3.3914 1.27030 101
Residual -2.91318 3.55324 .00000 1.25264 101
Std. Residual -2.290 2.794 .000 .985 101
Stud. Residual -2.315 2.829 .011 1.014 101
Deleted Residual -2.97524 6.77359 .06404 1.46630 101
Stud. Deleted Residual -2.369 2.938 .014 1.029 101
Mahal. Distance .073 91.589 2.970 9.136 101
Cook's Distance .000 6.565 .075 .653 101
Centered Leverage Value .001 .916 .030 .091 101
a. Dependent Variable: OC2
Charts

Page 93 of 113
Regression
Variables Entered/Removeda
Model
Variables
Entered
Variables
Removed Method
1 POS3, POS1,
POS2b
. Enter
a. Dependent Variable: OC3
b. All requested variables entered.
Model Summaryb
Model R R Square
Adjusted R
Square
Std. Error of the
Estimate
1 .618a .382 .363 1.19875
a. Predictors: (Constant), POS3, POS1, POS2
b. Dependent Variable: OC3
ANOVAa
Model Sum of Squares df Mean Square F Sig.
1 Regression 86.055 3 28.685 19.962 .000b
Residual 139.390 97 1.437
Total 225.446 100
a. Dependent Variable: OC3
b. Predictors: (Constant), POS3, POS1, POS2
Coefficientsa
Model
Unstandardized Coefficients
Standardized
Coefficients
t Sig. B Std. Error Beta
1 (Constant) 1.138 .384 2.969 .004
POS1 .381 .107 .387 3.549 .001
POS2 .260 .109 .260 2.379 .019
POS3 -.025 .023 -.088 -1.084 .281
a. Dependent Variable: OC3

Page 94 of 113
Casewise Diagnosticsa
Case Number Std. Residual OC3 Predicted Value Residual
87 3.111 6.00 2.2701 3.72991
a. Dependent Variable: OC3
Residuals Statisticsa
Minimum Maximum Mean Std. Deviation N
Predicted Value 1.6041 5.6001 3.3663 .92766 101
Std. Predicted Value -1.900 2.408 .000 1.000 101
Standard Error of Predicted
Value
.124 1.153 .210 .114 101
Adjusted Predicted Value -2.2642 5.7178 3.3249 1.07130 101
Residual -2.52842 3.72991 .00000 1.18064 101
Std. Residual -2.109 3.111 .000 .985 101
Stud. Residual -2.147 3.150 .008 1.007 101
Deleted Residual -2.61930 4.26423 .04140 1.29608 101
Stud. Deleted Residual -2.188 3.308 .012 1.022 101
Mahal. Distance .073 91.589 2.970 9.136 101
Cook's Distance .000 2.929 .038 .291 101
Centered Leverage Value .001 .916 .030 .091 101
a. Dependent Variable: OC3
Charts

Page 95 of 113
Data Interpretation
Evaluating from the data collection and statistics generated reports from SPSS,
we can say that perceived organisational support is significantly related to the
dependent variables in this study – employee retention, organisation commitment
and organisation support.
All data from the 100 samples are depicting a statistically significant relationship
between the dependent and individual variables. These statistics has shown the
relationship between each of the variables and had proved its positive relationship.
Looking at the data generally, regardless of its respondents’ gender, age group,
educational qualification, job type, job level and tenure serving the organisation,
human nature to perceived the organisational support is the same. All human
beings when sacrificing the time, energy and efforts, they are in hope to get back
something equivalent in return. This is similar to the thought to having something
equal value in return.
Data shows the preference on the organisational support was not only limited to
monetary terms, but also the fulfilment of psychological needs in terms of the
recognition, and the praises.
Data is also showing that highly perceived organisational support will definitely
affecting the employee retention concept. When there is high perceived
organisational support, the employees will also be more committed. Hence, this
relationship is highly regarded as positively correlate within each other. And the
statistically significant relationship means the higher the perceiveness on
organisational support, the higher the organisation commitment, and the higher

Page 96 of 113
chance the employees will be retained in an organisation to contribute in good
organisation management.

Page 97 of 113
CHAPTER 5 Chapter heading, 16-point in bold } double single spacing
}
RECOMMENDATION AND CONCLUSION Chapter
heading, 16-point in bold
}
} triple single spacing
Introduction
This chapter will wrap up the findings in this study, and summarized the results from the pool
of data and histograms.
Evaluating from the demographic characteristics, the common criterion are respondents are
employees in Malaysia, and respondents are working personnel working under an organisation.
The almost equal percentages of respondents are sought from the Male and the Female working
personnel.
Discussion
The Perceived Organisational Support, Employee Retention, and Organisational Commitment
can be predicted with the observations from the beliefs came to employees based on:
1. The action of support delivered by the direct hierarchical superior, in which referred to
as the personification of the organisation; and
2. The rewards received by employees based on the discretion of the agent of the
organisation.
Organisation behavior topic is an interesting topic to looked into at any point of time,
considering its usefulness to the organisation. The higher hierarchical management shall be
realizing the importance on this topic and keep updating their human resource information
maintenance system, so that all management level staffs to have a unanimous voice of thought.
Page 98 of 113
The middle management shall speaks the same as what the higher management spelt out in
terms of the perceived organisational support, employee retention strategy and also the
organisation management. This concern was made due to the observation from researcher that,
usually employees will personificationed the organisation in every matter faced. This is
especially clear, when we are explaining this situation that it is the manager that is carrying out
the execution of instruction, goal, vision and mission from their organisation.
With the concept that all actions related with the organisation was actually carried out by
manager of each business unit. Supposed, if the business unit manager is having a wrongful or
selfish thought towards the employees, then the whole idea in organisational support perceived
by employees will be deviating from the targeted goal of the organisation. This is seen as a
diverted channel within the organisation. This situation will be bringing negativity towards the
organisation as a whole.
When having the gap that each of the business unit manager might act differently, or either
having wrong interpretation with the targeted organisational goal, the impact is huge. For
example, if the culture within a business unit is more towards deficit management, then this
might cause some decrease in morality of the team. If certain business units are adhering to the
merit management then this will boost the psychological health among its employee. The
differences may cause imbalance in the organisation. Even though the action was committed
by the human, who is the business unit manager, however, the impact was suffered by the
organisation whenever there is human resource problems.
Hence, the top management in the organisation shall look into a set of corporate governance to
help shape the best practices to be unanimously carried out in their execution. Other employees
shall be adopted as the watch dog for any irregularity or misfunctioning of the goal.
As we have more and more educational opportunity around, and also the knowledge sharing
platform that is borderless with Internet of Things, hence human resource nowadays are more
concern on the organisational support they perceived. For any condition if, in their awareness,
the organisational support perceived is not equal to what they have sacrificed, the employees

Page 99 of 113
will be having the intention to turnover, or voluntarily withdrawing the contract of work
between employee and the organisation.
Once an employee who is experienced leave the organisation, then the organisation will have
to allocate fund for recruitment exercise again. This activity was seen as not been cost effective
in the perspectives of management. This means that, more time will be utilized to source for
the next suitable candidate in running the operational task. And, in this juncture, the speed of
the operationalise task will be slowing down due to limitation of manpower. This is causing
the negative impact on the production outcome. And as the end result, the organisation might
require more production time in coming out with the end product. Corporate financially
speaking, this is not a viable strategy or solution, comparably between recruiting for new staff
or retaining the experience existing staff.
There should be a research team on organisational behavior within the organisation, and from
time to time to collectively examining at the human resource data to pick out any odd cases
that requires investigation, or attention as a long term solution.
Upon achieving the employee retention, then only the organisation will be better in tackling
for a sustainable survival under the competitive industry. This can avoid that the organisation
being required and merged into from another industry dictator. In order to sustain, retaining the
experienced worker is as much important as having the cost effective in corporate financial for
the competitive advantage in the market.
When perceiving that there is a great support from the organisation, employees will most likely
committed to retain within the organisation. A highly committed employees will be like having
a good mutual agreement from them towards the organisation. The committed employees will
be undeniably spend more effort that is uncountable in helping the organisation to achieve the
target or goal setting.
That is what to say that, an organisation with highly committed employees will be beneficial
for the organisation management to have an easily managed population of people. When the
employees felt indulged with the organisational support they hope for, they will most likely be
obedient, helpful and harmonious in the organisation. For example, to manage this group of
Page 100 of 113
employees will take less effort and obstacles, as well as less time spent on instructions or the
problem solving in facing the X workers.
When the employees are happy, they will most likely be retained in an organisation, helping
the organisation to have cost budgeting in talent management. The existing talent will be able
to invest on the entrepreneurial characteristics within them and thus helping the organisation
to source for new venture or new surviving tools.
Hence, in terms of the corporate governance on the employee retention strategy, the board or
the top management shall be highly looking into to draft out the governing criterion in helping
all levels in the organisation to be able to execute the goal and instructions correctly.
Limitation and Implication
Along the processes to conduct the research studies, researchers found that perceived
organizational support, employee retention, organizational management and organizational
commitment are difficult to coined on their relationship as they are seen as having an effect
among each other. The relationships of the four topics are a broad study that should involve
larger population in order to test on Malaysia ground. With the larger population then it gives
the precise condition in Malaysia that is able to help the human resource management in this
labour market.
As early as in 1965, Levinson had noticed that employees tend to personified on the
organisation and sees that all actions carried out by the management as a representation of the
organisation. Hence, this has aroused the further ambiguity as to whether researchers shall
narrow down to a specific population to get a precise study and data from an organisation.
Furthermore, organisation could have a lot of small business unit with which the management’s
personality and characteristics are different, and thus will further affect the outcome of the
constructs.
The limitation experienced by the researcher during this study is that there is query as to
whether each business unit are also representable for the research, with the concern that each

Page 101 of 113
business unit manager might act differently or having a different set of characteristics. There
shall be more reading and research done to define if the different business unit will be
appropriate to be depicted as a smaller population that is representing the broad industry on the
market. This concern was based on the justification that sample sizing of representation using
smaller population.
Researcher felt that approaching the higher management and the human resource department
is a challenge and thus a limitation in terms of authority in being given the approval to access
such sensitive information. However, approaching this piece of archival data will enable
exponentially useful data to researcher as all the data compiled within human resource
department are referred to as practically true cases for case studies and case analyses. This is
indeed a long term research and solution provided will be much practicable.
Organisational behavior is a broad area of study, and narrowing down to the research topic will
actually eliminating more constructs being identified. The identification of factors might be
important in leading the direction of the research.
To examine on the cognitive behavior, a specific set of measurement scales shall be proposed
and verified at. Observing from the current studies and throughout the research period,
researcher finds that it is especially uncontrollable and not contributing to a great extent when
respondents are choosing the answer of ‘undecided’ using the 7 points Likert scales. This will
cause variability of data and researcher will be finding difficulties in interpreting an actual
condition.
There is only a sole researcher that is making the research facing hiccups. Research team shall
be consisted of expertise from different persepctives, ie. Psychological, Management Science
background, corporate governance and etc.
At this stage, researcher can conclude that all research hypotheses tested significant, and
relevant with the findings. The data from the research shows a strong support in the
hypotheses developed, and the researcher trust that they are significantly related positively.

Page 102 of 113
Hypothesis 1 – Positively significant
H1 – The tangible and intangible organisational support both positively perceived by
Malaysian workers.
Hypothesis 2 – Positively significant
H2 – The perceived organisational support correlate positively towards the employee retention
in an organisation.
Hypothesis 3 – Positively significant
H3 – The perceived organisational support is positively affecting the organisation management.
Hypothesis 4 – Positively significant
H4 – There is mediating role of organisational commitment in achieving successful
organisation management.
Judging from the research data, and also justifying from the previous literatures from other
scholars that are matching with what this study had found out, researcher is hereby confirmed
that all hypotheses that were built up at the pre-test stage are significantly correlate.

Page 103 of 113
Recommendation for Future Study
For future studies, it is recommended that broader population been targeted in the sample size
in order to get a more precise trend that is happening in Malaysia.
Also, it is recommended in the future studies, to looked into the organizational commitment
and employee engagement constructs that will be much related to organizational management.
And thus, we opined that in order to examine the Perceived Organisational Support, Employee
Retention, Organisation Commitment and Organisation Management, “people” is the
independent variable to be limited as the new research idea.
In the future studies, it is recommended to have joint collaboration with expertise from different
areas, such as Psychological, Management, Corporate Strategy, Cultural Studies, Corporate
Governance and etc. This is for the consideration that each of the aspects spelt out in the
research questions will be able to be examined at by the subject experts, and to close the gap
for better production scholarly.
In the future studies, it will be much beneficial, if the archival data can be obtained in a real
life case, for example, from the top management in an organisation or even from their human
resource department. This is because theory shall always be tested empirically on its validity
and practicability.

Page 104 of 113
Conclusion
In conclusion, this study has found out that there is a positive relationship between perceived
organizational support with employee retention. There is positive relationship between the
employee retention and successful organizational management. There is positive relationship
between perceived organizational support with organizational management.
Throughout the study also, researchers have found that there is a mediating construct –
organizational commitment that functions as a booster from employee retention and works
positively for organizational management.
In conclusion, awareness at the top management of the organisation shall be always in an alert
stage on the heat topic of organisation behavior. The top management, and also the manager
for each of the business unit shall always be empathy in dealing with the human nature and
also be open minded in receiving more suggestion to further improve how the communication,
interaction and operation in an organisation.
There shall be more open minded communication channel, ie the bottom up channel which will
enable the hearing support towards the employees. There are also ample types of support,
differently required by people with different needs and characteristics. Hence, a transparent
feedback system shall be adopted to enhance healthy communication. The traditional method
of communication, of which feedback can be interacted, of which tiny voices will be able to be
heard, shall be exercised and put into practice.
One way communication will slowly extinct and not working in this new technology age. Vice
versa, the bottom up feedback and more communication channel shall be built up. When
communication is not uttered, then there might be possibility that something negative will
happened and spread. This is especially true, when the employees who have no way in letting
out any frustration will turn the communication channel in an inappropriate and public way.
Ended up, the reputation of the organisation affected even though that may be something not
verifiable and is a rumours. This is matching to the saying that when a thousand people are
literally talking on the same thing, then even a rumours will be turning to be a truth.

Page 105 of 113
In this new era, retaining the committed employees are regarded as a new strategy in helping
the organisation to grow. The growth shall be inclusive of employees and they shall be
receiving training which will further motivate them, helping them to cope with any challenges
in work environment, is an important support psychologically required by employees.
As more and more women has came out from the role of house wives and solely as child care
givers, to make a living in a shared responsibility under the roof. And, to encourage for
diversified in the work area with the balance mixture of man and women power, a child care
support will be as important as other financial assistance. Child care support can include the
establishment of child care centre at the near by work area, or even the support for the flexibility
in terms of work hour. This is to enhance the strong perceiveness of organisational support for
women, so that they may be able to success in the career and also not leaving behind the family
needs.
There are also cases where, educational support for those knowledge seeker, who is highly
interested into learning, to upgrade their own selves and at the same time will contribute their
knowledge to the organisation, in return of the good favour. This will be seen as a double
winning situation where both parties will be getting what they longing at. And in return, the
outcome can be observed advantageously.
There shall be a platform where the organisation is able to support employees with low morale,
or to get some counselling session to enhance healthy mentality. This support is heavily
required with the consideration that more and more psychological burden for human in tackling
to daily stresses.
A governing body which will be acting individually for responsible in investigation of human
issues shall be established. Sometimes, mobbing, bullying, are the political cultures within an
organisation that are indirectly affecting the turnover intentions. Hence, an individual domain
will be important so that report can be made by the victimized employees without fear. And a
justiced and transparent decision from the governing body can be entrusted.
Tremendous supports from the organisation in helping every employees to cope with the work
life or family life challenges are important as a retention strategy. And from here, a

Page 106 of 113
commitment will be established from within the employees which will work as if the mutual
agreement of the employees to stay within an organisation and contribute further.
Sometimes, the organisation shall be considering the leader member exchange (LMX) activity
which has newly theorized in the near 10 years. The exchanges will enable the understanding
of the responsibilities from the two parties.

Page 107 of 113
Reference
Abraham, R., Schneider, J., & vom Brocke, J. (2019). Data governance: A conceptual
framework, structured review, and research agenda. International Journal of
Information Management, 49, 424-438.
Ahmad, A., Rehman, M. A., Haq, I., Jam, F. A., Ghafoor, M. B., & Azeem, M. U. (2010).
Organisational support and psychological empowerment. European Journal of Social
Sciences, 17(2), 186-192.
Allen, N. J., & Meyer, J. P. (1990). The measurement and antecedents of affective, continuance
and normative commitment to the organization. Journal of occupational psychology.
Allen, D., Shore, L., & Griffeth, R. (1999). A model of perceived organizational
support. Unpublished manuscript, University of Memphis and Georgia State University.
Allen, D. G., Shore, L. M., & Griffeth, R. W. (2003). The role of perceived organizational
support and supportive human resource practices in the turnover process. Journal of
management, 29(1), 99-118.
Armeli, S., Eisenberger, R., Fasolo, P., & Lynch, P. (1998). Perceived organizational support
and police performance: The moderating influence of socioemotional needs. Journal of
applied psychology, 83(2), 288.
Burke, R. J., & Ng, E. (2006). The changing nature of work and organizations: Implications
for human resource management. Human Resource Management Review, 16(2), 86-94.
Chin, C. L. (2018). The Influence of Job Satisfaction on Employee Turnover Intention in the
Manufacturing Industry of Malaysia. Journal of Arts & Social Sciences, 1(2), 53-63.
Curtis, S., & Wright, D. (2001). Retaining employees-fastest track to commitment.
Management Research News, 24(8), 59-64.

Page 108 of 113
Dawley, D. D., Andrews, M. C., & Bucklew, N. S. (2008). Mentoring, supervisor support, and
perceived
organizational support: what matters most?. Leadership & Organization Development
Journal, 29(3), 235-247.
Dibble, S. (1999). Keeping your valuable employees: Retention strategies for your
organisation’s most
important resource. New York: Wiley.
Eisenberger, R., Huntington, R., Hutchison, S., & Sowa, D. (1986). Perceived organizational
support. Journal of Applied psychology, 71(3), 500.
Eisenberger, R., Fasolo, P., & Davis-LaMastro, V. (1990). Perceived organizational support
and employee
diligence, commitment, and innovation. Journal of applied psychology, 75(1), 51.
Eisenberger, R., Armeli, S., Rexwinkel, B., Lynch, P. D., & Rhoades, L. (2001). Reciprocation
of perceived
organizational support. Journal of applied psychology, 86(1), 42.
Eisenberger, R., Stinglhamber, F., Vandenberghe, C., Sucharski, I. L., & Rhoades, L. (2002).
Perceived
supervisor support: Contributions to perceived organizational support and employee
retention. Journal of applied psychology, 87(3), 565.
Frank, F. D., Finnegan, R. P., & Taylor, C. R. (2004). The race for talent: Retaining and
engaging workers
in the 21st century. Human resource planning, 27(3).
Fuqua, D. R., Hellman, C. M., & Worley, J. A. (2009). The survey of perceived organisational
support: which
Page 109 of 113
measure should we use?. SA Journal of Industrial Psychology, 35(1), 1-5.
Gaertner, K. N., & Nollen, S. D. (1989). Career experiences, perceptions of employment
practices, and
psychological commitment to the organization. Human relations, 42(11), 975-991.
Gregersen, H. (1992). Commitments to a parent company and a local work unit during
repatriation. Personnel Psychology, 45(1), 29-54.
Hackett, R. D., Bycio, P., & Hausdorf, P. A. (1994). Further assessments of Meyer and Allen's
(1991)
three-component model of organizational commitment. Journal of applied
psychology, 79(1),
15.
Iqbal, S., & Hashmi, M. S. (2015). Impact of perceived organizational support on employee
retention
with mediating role of psychological empowerment. Pakistan Journal of Commerce
and Social
Sciences (PJCSS), 9(1), 18-34.
Johnston, M. P. (2017). Secondary data analysis: A method of which the time has
come. Qualitative
and quantitative methods in libraries, 3(3), 619-626.
Khan, R. U., & Ghufran, H. (2018). The Mediating Role of Perceived Organizational
Support between Qualitative Job Insecurity, Organizational Citizenship Behavior and Job
Performance. J Entrepren Organiz Manag, 7(228), 2.
Kinnear, L., & Sutherland, M. (2000). Determinants of organisational commitment amongst
knowledge
workers. South African journal of business management, 31(3), 106-112.
Page 110 of 113
Krishnan, J., & Mary, V. S. (2012). Perceived organisational support–an overview on its
antecedents and
consequences. International Journal of Multidisciplinary Research, 2(4), 1-13.
Kundu, S. C., & Lata, K. (2017). Effects of supportive work environment on employee
retention: Mediating
role of organizational engagement. International Journal of Organizational
Analysis, 25(4), 703-722.
Kurtessis, J. N., Eisenberger, R., Ford, M. T., Buffardi, L. C., Stewart, K. A., & Adis, C. S.
(2017). Perceived
organizational support: A meta-analytic evaluation of organizational support
theory. Journal of
management, 43(6), 1854-1884.
Kyndt, E., Dochy, F., Michielsen, M., & Moeyaert, B. (2009). Employee retention:
Organisational and
personal perspectives. Vocations and Learning, 2(3), 195-215.
Levinson, H. (1965). Reciprocation: The relationship between man and
organization. Administrative
science quarterly, 370-390.
Liden, R. C., Bauer, T. N., & Erdogan, B. (2004). The role of leader-member exchange in the
dynamic
relationship between employer and employee: Implications for employee socialization,
leaders, and
organizations. The employment relationship: Examining psychological and contextual
perspectives,
226-250.

Page 111 of 113
Loi, R., Hang‐Yue, N., & Foley, S. (2006). Linking employees' justice perceptions to
organizational
commitment and intention to leave: The mediating role of perceived organizational
support. Journal
of Occupational and Organizational Psychology, 79(1), 101-120.
Meyer, J. P., & Allen, N. J. (1991). A three-component conceptualization of organizational
commitment. Human resource management review, 1(1), 61-89.
Meyer, J. P., & Allen, N. J. (1997). Commitment in the workplace: Theory, research, and
application. Sage.
Mottaz, C. J. (1988). Determinants of organizational commitment. Human relations, 41(6),
467-482.
Mowday, R. T., Steers, R. M., & Porter, L. W. (1979). The measurement of organizational
commitment. Journal of vocational behavior, 14(2), 224-247.
Nazia, S., & Begum, B. (2013). Employee retention practices in Indian corporate–a study of
select
MNCs. International Journal of Engineering and Management Practices, 4(3), 361-
368.
Neves, P., & Eisenberger, R. (2014). Perceived organizational support and risk taking. Journal
of
managerial psychology, 29(2), 187-205.
Rhoades, L., Eisenberger, R., & Armeli, S. (2001). Affective commitment to the organization:
The
contribution of perceived organizational support. Journal of applied psychology, 86(5),
825.

Page 112 of 113
Rhoades, L., & Eisenberger, R. (2002). Perceived organizational support: a review of the
literature. Journal
of applied psychology, 87(4), 698.
Rousseau, D. (1995). Psychological contracts in organizations: Understanding written and
unwritten
agreements. Sage publications.
Roy, B. (2015). A study on employee retention factors in the Indian banking industry–An
empirical
Study. International Journal of Advance Research in Computer Science and
Management
Studies, 3(3), 346-352.
Salman, A., Ahmad, N., & Matin, F. (2014). Factors affecting on employees retention in
banking sector: An
investigation from Karachi. European Journal of Business and Management, 6(37),
2222-1905.
Samuel, M. O., & Chipunza, C. (2009). Employee retention and turnover: Using motivational
variables as a
panacea. African journal of business management, 3(9), 410-415.
Shah, M., & Asad, M. (2018). Effect of motivation on employee retention: Mediating role of
perceived
organizational support. European Online Journal of Natural and Social Sciences, 7(2),
511-520.
Shore, L. M., & Wayne, S. J. (1993). Commitment and employee behavior: Comparison of
affective
commitment and continuance commitment with perceived organizational
support. Journal of
applied psychology, 78(5), 774.

Page 113 of 113
Tumwesigye, G. (2010). The relationship between perceived organisational support and
turnover intentions
in a developing country: The mediating role of organisational commitment. African
Journal of
Business Management, 4(6), 942-952.
Walker, J. W. (2001) Zero defections? Human Resource Planning. 24(1), 6-8.
Wann-Yih, W., & Htaik, S. (2011, July). The Impacts of perceived organizational support, job
satisfaction,
and organizational commitment on job performance in hotel industry. In The 11th
International DSI
and the 16th APDSI Joint Meeting, Taipei, Taiwan, July (Vol. 12).
Wayne, S. J., Shore, L. M., & Liden, R. C. (1997). Perceived organizational support and leader-
member
exchange: A social exchange perspective. Academy of Management journal, 40(1), 82-
111.
Wickramasinghe, V., & Perera, S. (2014). Effects of perceived organisation support, employee
engagement
and organisation citizenship behaviour on quality performance. Total Quality
Management &
Business Excellence, 25(11-12), 1280-1294.
Zampetakis, L. A., Beldekos, P., & Moustakis, V. S. (2009). ‘‘Day-to-day” entrepreneurship
within
organisations: The role of trait Emotional Intelligence and Perceived Organisational
Support. European Management Journal, 27(3), 165-175.
Institute of Labour Market Information and Analysis (ILMIA), Ministry of Human Resources
https://www.ilmia.gov.my/ebook/research/ILMIA_ArtcFREP1_2019_NER2018.pdf