application and interpretation of zero and short-span ... · application and interpretation of zero...
TRANSCRIPT

Application and interpretation of zero and short-span testing on nanofibre sheet materials Swambabu Varanasi, Hui Hui Chiam and Warren Batchelor
KEYWORDS: Weibull analysis, Fracture surfaces,
SEM, Fibre dimensions, Residual span, Zero span tensile
test
ABSTRACT: This paper investigates the use of zero-
span testing to measure the tensile strength of cellulose
nanofibre sheets. The mechanical strength of cellulose
nanofibre paper is a key property but tensile strength
measurement requires a substantial amount test material,
whereas a zero/short span test needs much less material.
Sheets made from cellulose nanofibres, microfibrillated
cellulose (MFC) and northern bleached softwood fibres
were tested at spans ranging from 0 to 0.6 mm and tensile
strength spans of 50 and 100 mm. For the cellulose
nanofibres or the MFC sheets, strength was constant with
span from 0 to 0.6 mm when tested dry and negligible
when tested wet, except at zero span. The sheets made
from the softwood fibres showed significant strength
when tested wet at all spans from 0 to 0.6 mm. The
results showed that for nanofibre materials, the zero or
short span strength is measuring sheet tensile strength at a
smaller sample length. The strength of the nanofibre
sheets at 50 or 100 mm was smaller than at zero/short
span due to sample size effects and Poisson contraction.
The effects of starch and grammage on strength were also
studied.
ADDRESS OF THE AUTHORS: Swambabu
Varanasi ([email protected]), Hui Hui Chiam
([email protected]), Warren Batchelor
Australian Pulp and Paper Institute, Department of
Chemical Engineering, Monash University, Australia
Corresponding author: Warren Batchelor
Nanofibre materials are currently a topic of intense
research, with particular emphasis on cellulose nanofibres
(Eichhorn et al. 2010; Siró, Plackett 2010) as they are
potentially a cheap, abundant nanofibre material that can
be produced from a wide range of sources including
wood, bacteria, sugar beet, potato, hemp and flax, wheat
straw and bamboo. Cellulose nanofibres can be used as
alternative for synthetic polymers in various applications
because of their excellent properties, such as very high
strength, low coefficient of thermal expansion and low
gas permeability. Cellulose nanofibre sheets are of great
interest in packaging, filter, membrane and biomedical
applications.
While the mechanical strength of cellulose nanofibre
paper is a key property to measure, there may be issues
with mechanical testing of cellulose nanofibre sheets. If
the standards for paper testing are applied, the area of
sample required for a single test is 15 mm wide and either
100 or 180 mm long. The average strength is calculated
from at least 10 successful tests, rejecting all samples that
break at the jaws or prematurely due to sample
misalignment. This requires a substantial amount of test
material. This can be a significant issue given that
filtration times for forming range from 45 minutes
(Sehaqui et al. 2010) to 3-4 hours (Nogi et al. 2009) when
using a fine pore size filter and given that cellulose
nanofibres are still usually made with laboratory
equipment, producing a few dry grams per batch.
Zero/short span testing is done with the jaws of the
tester starting together or at a prescribed small span apart.
The testing is rapid and the actual area tested for each
zero-span test is no more than 2 mm x the tester jaw
width of either 15 or 25 mm. The most recent automated
tester (Gatari 2003; Pulmac 2012) uses only 210 cm x 2.5
cm strips to complete 24 tests in around 5 minutes. The
test has widespread acceptance within the field of paper
research as a measurement of the average fibre strength in
a sheet (Van Den Akker et al. 1958), although the
mechanics of the test and the relationship between fibre
and sheet properties and the final result have been
debated (Batchelor et al. 2006).
While the test is called the zero-span test, the label is
something of a misnomer. Although not measured as part
of the standard test, the jaws in a zero-span tester can be
instrumented to measure the displacement between the
jaws during the test. Results on a Swedish never-dried
unbleached softwood kraft showed that displacement
between the jaws increased continuously during the test,
with the final displacement at failure ranging from 33 m
for a sample made from unrefined fibres to 49 m for a
sample made from fibres refined for 6000 revolutions in a
PFI mill (Batchelor, Westerlind 2003). For the sample
made from the unrefined fibres, the span strained under
the jaw was estimated to be approximately constant at
210m for most of the test, before rising to 300 m at the
end of the test. This span under the jaw that is being
strained is sometimes called the residual span (Boucai
1971a; Boucai 1971b; Cowan, Cowdrey 1974).
The mechanism of stress transfer under the jaws is still
not clear. (Cowan 1975) postulated that transfer was
entirely through frictional shear at the jaw surfaces and
thus that the span under the jaws should continuously
increase with the load applied during the test. However
this simple model was contradicted by the measurements
described above indicating a constant span under the jaws
for most of the test (Batchelor, Westerlind 2003). This
suggests a stick-slip type stress transfer mechanisms with
a zone in from the edge of the jaw where slippage takes
place and stress transfer is via friction, together with a
sticking point, where stress transfer is from shear alone.
Modelling of stress transfer through shear either with or
without slippage (Hagglund et al. 2004) has shown that
the shear transfer will produce a non-uniform stress field
through the thickness of the sheet, which itself depends
on the sheet mechanical properties. This non-uniform
stress field will reduce sheet strength as sheet thickness
PAPER PHYSICS
Nordic Pulp and Paper Research Journal Vol 27 no.2/2012 343

increases with grammage. However, while there is
excellent experimental evidence of the importance of this
non-uniform stress field for the zero-span strength
measured on very thick samples (Hagglund et al. 2004), it
seems likely that the non-uniform stress field is less
important for samples of grammages of 60 gsm and less.
Reducing sample grammage from 60 gsm to 30 gsm has
either produced no change (softwood bleached sulphite,
bleached “gumwood” (Wink, Van Eperen, 1962),
bleached softwood kraft, birch kraft and softwood TMP
(Seth et al. 1989)) or small increases in strength of 5%
(bleached and unbleached softwood kraft (Batchelor et al
2006, Joshi et al 2007)) and 15% (unbleached softwood
kraft (Seth et al. 1989)). Further reducing sample
grammage from 30 gsm to 10 gsm was observed to
reduce strength by 10% (Wink, Van Eperen 1962),
probably due to the effects of formation. These results
suggest that a strength which is close to independent of
the sample geometry can be obtained provided that the
sample thickness is small compared to the residual span
over which stress transfer takes place.
It is the purpose of this paper to investigate the use of
zero and short span tensile testing as an alternate measure
of tensile strength for cellulose nanofibre sheets,
requiring less time and material to measure sheet
strength.
Experimental method Materials and material characterisation
Two nanofibre materials were tested. The starting
material was micro-fibrillar cellulose (MFC) sourced
from Daicell Finechem (Celish KY-100S) and was a
mixture of longer, wider fibres and cellulose nanofibres.
MFC was micro fibrillated by a special manufacturing
process from highly refined, pure fibre raw material. This
material was supplied never dried with 25% solid
content.
The second material consisted almost entirely of
cellulose nanofibres and was prepared by separating the
long fibres from the starting material by filtration. This
method was described in more detail in (Zhang et al.
2012). The MFC sample was diluted to 0.5 wt% solids
and filtered through a filter mesh having 100 µm opening
placed on Büchner funnel. Filtrate from the filter contains
the nanofibres, while the larger and wider fibres were
retained on the filter fabric. Once the fabric filters
became clogged, they were washed and reused.
Following filtration, the filtrate was centrifuged at 5000
rpm for 15 minutes. After centrifuging, the supernatant
was discarded and only the nanofibres collected at the
bottom of each tube were collected. The concentrated
nanofibres were then stored in never dried form at 50C
until required for sheet-making. Yield of the separation
process was 20%.
For comparison, sheets were also made from NIST
reference material 8495- Northern Bleached Softwood
Kraft (Ampulski 2001).
Starch (Cationic Tapioca Starch DS 0.03-0.04) sourced
from Corn Products (Thailand) Co. Ltd was used as
strength additive for both NIST fibres and the MFC
fibres. A starch suspension was prepared with a
concentration of 4 wt%. The suspension was heated and
stirred continuously at 90 until it formed a uniform
viscous solution. This solution was added to the
suspension which is used for preparing sheets with
concentration of 0.16 g of starch per g of fibres.
Characterization
Scanning electron microscopy (SEM) images of nano-
fibers were taken using Field Emission Scanning Electron
Microscopy, JEOL7001F FEG SEM, in order to measure
the diameter distribution of nanofibres. A drop of nano-
fibre suspension was cast on a metal plate, which was
then coated with platinum and used for SEM analysis.
Estimates of nanofibre aspect ratios were made by
sedimentation experiments. This method was described in
more detail in (Zhang et al. 2012). The method was
adapted for nanofibre suspensions from calibration curves
published for wood pulps by (Martinez et al. 2001). 250
ml of nanofibre suspensions were decanted into
measuring cylinders. The suspension was agitated to
suspend the fibres completely in the cylinder, and then
the fibres were allowed to settle. Once the fibres settled
down completely, the height of sediment in the cylinder
was measured.
Sheet preparation
Two sets of sheets were prepared from each material, one
without any additives, while the second sheet used cat-
ionic starch to improve the bonding between the fibres.
Sheets were made both at 30 gsm and 60 gsm to
investigate the effect of the test conditions on the results
(Batchelor et al. 2006).
A Standard British Hand Sheet Maker was used to
prepare non-woven nanofibre sheets from both MFC and
nanofibres. A solids concentration of 0.5 wt% was used
for both 60 gsm and 30 gsm sheets. The full volume of
the forming suspension was mixed thoroughly and
carefully poured into the forming chamber after which
vacuum was applied to enhance the filtration.
The nanofibre sheets formed by filtration were placed
between blotting papers and dried using an automatic
sheet dryer at 91 . Drying took around 10 minutes. MFC
sheets were placed between the blotting papers and dried
at room condition under restraint to avoid shrinkage.
After drying, nanofibre sheets were placed in a
conditioned room maintained at 23 and 50% RH for at
least 24 hours before testing.
A Moving Belt Sheet Former (Raisanen et al. 1995; Xu,
Parker 2000) was used to prepare square (22x22 cm2)
non-woven sheets from the NIST reference material. A
solids concentration of 0.1 wt% was used make both 60
gsm and 30 gsm sheets. The sheet former uses a moving
belt with machined holes running over a stationary
vacuum box to simulate the type of vacuum pulses
typically found in industrial sheet forming. First, the sus-
pension was poured into a chamber sealed at the bottom
with plastic sheeting, with a fixed filter underneath the
sheeting. The moving belt was then started and the plastic
sheeting was rapidly removed to expose the suspension to
vacuum. Sheets were dried under ambient conditions for
24 hours and were then conditioned at 23 and 50% RH
for 24 hours before testing.
PAPER PHYSICS
344 Nordic Pulp and Paper Research Journal Vol 27 no.2/2012

Mechanical tests
A Pulmac Troubleshooter was used for zero/short-span
testing. All samples were cut into 2 cm wide ×0.5 cm
long samples with the length being the testing direction.
Three samples were needed for each test; one sample was
placed in the central clamping area of the tester and two
other samples were placed under the two back steps of
the clamping jaws to ensure proper jaw alignment under
pressure. After each test, the samples were removed and
replaced. This procedure was undertaken to minimise the
amount of sample required for testing.
Before the zero/short-span testing, optimum clamping
pressures were determined. It is the pressure which
minimizes sample slippage from under the jaw without
inducing excessive fibre damage. It was determined by
plotting the clamping pressure curve which showed an
increasing average sample failure load with increasing
clamping pressure up to a plateau region. Optimum
clamping pressure is in the early plateau region. Further
increasing clamping pressure will damage fibres and
reduce the failure load. An optimum clamping pressure of
60 psi was used for softwood samples and 70 psi was
used for both MFC and nanofibre samples.
For the wet zero/short-span testing, the dry samples
were thoroughly soaked in a tray of water and placed
between blotting papers to remove excessive water before
testing. The testing procedures were the same as the dry
testing. Spans of 0, 0.1, 0.2, 0.4 and 0.6 mm were used
for both dry and wet tests.
The breaking load was calculated from the calibration
supplied with the instrument of failure load (kg force) =
(P-P0) ×0.362, where P is the internal pressure pushing
the jaws apart at sample’s failure, psi, and P0 is the
pressure required to overcome the “zero” load from the
jaw spring at any given span, and 0.362 is the instrument
constant.
Tensile testing was performed using an Instron Tensile
Tester (Model 5566). Samples were cut into strips of size
140 mm×15 mm. Both dry and wet tensile tests were
conducted at 50 and 100 mm span. Preparation of
samples for a wet tensile test was the same as for a wet
zero/short-span test.
Results for all zero/short-span and tensile tests are
presented as tensile index, i.e. the force per unit width
divided by the grammage (g/m2) of the sample.
Cut strips from short span tests and tensile tests were
coated with 1 nm thick platinum to observe the fracture
surfaces using a JEOL7001F FEG SEM. Samples were
loaded vertically. Fracture surfaces were imaged at 10 inclinations.
The surfaces of the sheets were also imaged to measure
the MFC and nanofibre diameters. The measurements
were performed using ImageJ.
Results and discussion Fibre characterisation
Figs 1 and 2 show the SEM images and distributions of
fibre diameter for MFC and nanofibre samples,
respectively. Minimum diameter, maximum diameter,
mean diameter, and standard deviation, number of fibres
measured (count) and bin width are reported for each
material. Fig 1 shows that MFC sample contains a few
clumps and large fibres. These clumps and large fibres
were mostly removed through filtration. However, a few
larger fibres remained in the nanofibre sample due to
inefficiency in the filtration. The majority of the
nanofibre sample contains fibres of width less than 100
nm and the mean diameter of nanofibres sample is 51 nm.
Table 1 shows the mean diameter, the aspect ratio of
MFC, nanofibres and NIST softwood, as well as the fibre
length either measured (NIST sample) or the calculated
from the diameter and aspect ratio (MFC and nanofibre
samples). As it was impossible to measure the length of
nanofibres from SEM image, aspect ratio was estimated
using sedimentation method reported in (Zhang et al.
2012) and adapted from (Martinez et al. 2001).
Fig 1 SEM image and diameter distribution for MFC sample.
Fig 2 SEM image and diameter distribution of Nanofibres
PAPER PHYSICS
Nordic Pulp and Paper Research Journal Vol 27 no.2/2012 345

Table 1 Diameter and Aspect ratios of three materials used
Sample Mean Diameter (µm)
Aspect Ratio
Mean length (µm)
Micro-fibrillar cellulose 0.073 147 10.73 Cellulose Nanofibre 0.051 138 7 NIST softwood (Joshi et al. 2011)
27.8 72 2000
Mechanical test results
The results for the NIST softwood sheets are shown in
Fig 3. The data including means and standard deviations
are given in Table A1, while the sheet density data are
listed in Table A4. There are a number of points to note
in this figure. The zero-span wet strength is less than dry
strength for all samples. There are three competing
explanations in the literature. One explanation (Cowan,
Cowdrey 1974) is that the reduction with wetting is
caused by a residual span under jaws, i.e. a distance in
from the jaw edge over which the load is transferred into
the sample. These authors extrapolated dry and wet
curves versus span to determine the negative span at
which they cross and called this the residual span. This
compares to (Gurnagul, Page 1989) where the reduction
in strength is due to plasticising effect of water on the
fibres, which reduces their strength. This mechanism was
based on the observation that the difference between dry
and rewetted zero-span strength increases with decreasing
yield. A third explanation (Mohlin, Alfredsson 1990) is
that fibre defects such as kink or curl increase the dry
strength compared to the wet because the bonds around a
defect allow for stress to be transferred around the defect.
It is possible that all three mechanisms are contributing.
Wet zero and short span strength linearly decreases as
function of span for all samples. This is consistent with
the analysis of (Batchelor 2003; Boucai 1971b; Michie
1963), where it was shown that the wet zero-span
strength decreases approximately linearly with span,
provided that the span is much less than the length of the
fibre. In the case of a distribution of fibre lengths, such as
is typical with wood pulp samples, it can be shown that
the slope of the decrease with span is linearly related to
the average length of load-bearing element in the sheet
(Batchelor 2003). The reduction in wet short-span
strength with span is because the major contribution to
the wet zero and short span strength is from fibres which
are gripped by both jaws and thus will be loaded to
failure. As the span increases, this fraction of fibres will
decrease and thus reduce the overall strength. The
assumption is that wet fibres that are not gripped by both
jaws will be unable to transfer stress between the jaws
through the fibre-fibre bonds. The wet tensile strength at
either 50 or 100 mm is extremely small, indicating that
the wet fibre-fibre bonds are extremely weak in these
samples.
The dry zero and short span data shows some reduction
with span, particularly at 0.6 mm for the 60 gsm samples
with or without starch addition. The effect of span is
much smaller than when testing wet as the fibre-fibre
bonds are much stronger dry than wet and those fibres
that are only gripped by one jaw can still transfer load
through their bonds to other fibres.
The data for the 30 gsm sheets is generally lower than
the data for the 60 gsm sheets. As discussed in the
introduction, this contradicts previous data where zero-
span strength increased (Batchelor et al. 2006; Joshi et al.
2007) or stayed constant (Wink, Van Eperen 1962; Seth
et al. 1989) with decreasing grammage. However this
trend does match that observed for tensile strength
(I'Anson, Sampson 2007) which increases with
grammage up to maximum at 60 gsm, due to formation
effects being more important at lower grammage.
Although it should be noted that our data showed no
effect of grammage for the tensile strength at either 50
and 100 mm spans.
Starch addition increases dry paper tensile strength,
consistent with many previous studies. The effect is
approximately the same at either 50 or 100 mm spans.
However, no effect of starch on dry zero span strength
could be observed. There may have been some effects at
the longest short span of 0.6 mm, but more testing would
be needed to conclusively show this. There is no evidence
of starch improving the wet strength at any span. All this
data is consistent with the starch improving dry, but not
the wet, fibre-fibre bond strength and having no effect on
fibre strength. Thus starch has the largest effect for long
span tensile tests, where fibre-fibre bonding is important
and possibly some effects at short-span where fibre-fibre
bonding is only important for those fibres which are
gripped by one jaw but not two jaws.
Fig 4 shows the results for the tensile testing of the
MFC and nanofibre sheets. The data including means and
standard deviations are given in Tables A2 and A3, while
the sheet density data are listed in Table A4. There are
some significant differences between these results and the
NIST softwood results shown in Fig 3.
The first interesting point to note is the wet zero-span
strength for all samples is over 30 Nm/g, for all samples
except for the 30 gsm MFC sheets. Two explanations
could be considered. Firstly, this behaviour might be
evidence that these samples contain large enough fibres
to bridge the residual span under the jaws required to load
the sample, such as occurs with the NIST sample. It is not
known what this span is, although displacement
measurements on a softwood sample suggested a span of
between 300-350 m (Batchelor, Westerlind 2003).
However, none of the SEM and sedimentation
measurements for these samples show evidence of fibres
that long. In addition, the nanofibre sheets have exactly
the same strength as the MFC sheet despite the
nanofibres having been processed from the MFC sample
to remove the larger fibres. The most likely explanation is
that pressure applied by jaws increases the normal force
at fibre-fibre contacts, and thus greatly increases the
fibre-fibre friction when under load. This process will
significantly improve the bonding between the fibres,
PAPER PHYSICS
346 Nordic Pulp and Paper Research Journal Vol 27 no.2/2012

which would be weaker than when dry but sufficient to
give the sheet some strength.
Fig 3 Zero, short and tensile span measurements for softwood sheets. The error bars show the 95% confidence intervals of the measurements
Fig 4 Zero, short and tensile span measurements for micro fibrillated cellulose and nanofibres sheets.
This evidence suggests that two of the three current
explanations (Cowan, Cowdrey 1974; Gurnagul, Page
1989) as to why the wet-zero- span strength is less than
the dry zero-span strength could both be incomplete. The
wet zero-span strength will include significant
contributions from friction from fibre-fibre bonds for
fibres that are held by one jaw only. This will contribute
to the wet zero-span of all samples and may change with
pulp yield. It also cannot be assumed that the difference
between zero and short-span strength is due to fibre
length effects, raising doubts about the extrapolation
method proposed by (Cowan, Cowdrey 1974) to
determine residual span or using the zero and short span
data to infer information about the fibre or load-bearing
element lengths (Batchelor 2003; Boucai 1971b; Michie
1963).
At all other spans, except zero, wet tensile strength is
close to zero. The wet frictional force under pressure
suggested for the zero-span tests will not apply at short
span as failure will occur in the short span, rather than
under the jaws. In addition, there is no observable
difference between results at short span and results for
tensile measurements. It should be noted that
uncertainties of the zero and short span results are
relatively high as the pressure needed to drive jaws apart
without a sample is most of the measured pressure at
failure.
Given that wet short-span and tensile strength
measurements give similar results for MFC and nanofibre
samples, then the mechanisms of stress transfer in the
samples could be similar. That is, in the short-span test
there are no fibres bridging between jaws, just as in the
50 and 100 mm tensile tests. The scale is different but the
mode of loading is the same where force is transferred
through the fibre-fibre bonds to apply load to the fibres.
Thus short span strength is measuring sheet tensile
strength, but at a smaller span.
This hypothesis is also supported by the dry zero and
short span and tensile strength data. Although there are
some fluctuations in the data, there is no reduction in
strength as span increases for zero/short-span strength.
Strength is approximately constant, in contrast to the
NIST results shown in Fig 3, which showed a reduction
in strength when testing with a short-span of 0.4 and 0.6
mm, compared to the zero-span strength. In addition, the
reduction in strength from a short-span of 0.6 mm to a
span of 50 mm is much less for these samples than for the
NIST softwood samples where the tensile strength at 50
mm span is much less than half that of the zero-span
strength for all samples. All of this suggests that in zero-
span testing, as in short-span testing, the fibres from the
MFC or nanofibre sheets are never gripped by both jaws
and thus that load always has to be transferred through
fibre-fibre bonds to load a sample to failure.
SEM results
Figs 5 and 6 show little quantitative difference between
the appearances of the nanofibre sheet fracture line tested
at any span. In each figure there is the occasional larger
fibre that has been pulled out across the fracture line but
otherwise the fracture line appears very sharp. Part of the
reason for this is that many of the fibres must be too
small to be separately observable in these images. Figs 5
and 6 show little quantitative difference between the
fracture lines of samples tested either wet or dry or with
different spans. The implications for the failure
mechanism of these samples deserve further study. Fig 7
shows microscope images of the fracture lines of the
samples made from the NIST softwood fibres. There are
only a few fibres, mostly not in the direction of loading,
that have been pulled-out from one side of the fracture
line for the zero-span test. In contrast the fracture line of
the test at the 0.1 mm span shows many fibres that have
been pulled out.
PAPER PHYSICS
Nordic Pulp and Paper Research Journal Vol 27 no.2/2012 347

Fig 5 Fracture line images from sheets made from Nanofibres. top left – from dry zero span test, top right – from dry 0.6 span test, bottom left – from wet zero span test, bottom right – from wet 0.1 span test
Fig 6 Fracture line images of dry and wet tensile test with 50 mm gap between jaws for sheets made from Nanofibres.
Fig 7 Fracture line images of zero span and short span (0.1 mm) test for sheets made from NIST reference material, tested dry.
PAPER PHYSICS
348 Nordic Pulp and Paper Research Journal Vol 27 no.2/2012

Discussion and analysis
All the evidence so far points to the conclusion that for
nanofibre sheets, the zero-span test is measuring the
tensile strength, but at a greatly shortened length scale.
There then remains the question as to why the
measurements at different length scales give different
values. The first point is that the tensile samples with
dimensions 100 mmx15mm are subject to Poisson
contraction under tensile loading, whereas the zero and
short span measurements are not, given the span under
the jaws is much smaller than the sample width. If the
sample width was greatly reduced to allow Poisson
contraction then the measured zero-span strength with
Poisson contraction, Zp, would be lower than the zero-
span strength without Poisson contraction, Znp. If the
strain at failure is assumed to be the same in the two
cases then the two are related by 21p npZ Z
where is the Poisson ratio (Page 1969). This
assumption has been used in the derivation of the Page
equation for tensile strength (Page 1969). Experimentally
Poisson’s ratio for dry paper is approximately 1/3 (Page
1969), which yields 8 /9p npZ Z . Thus the zero and
short-span strength should be multiplied by 8/9 to
properly compare the strength values with each other.
The results of this data correction of the zero/short-span
strength and comparison with the tensile strength are
shown in Fig 8.
Fig 8 shows that there is a maximum reduction of 27%
in strength between a short span of 0.6 mm and a tensile
span of 50 mm for all MFC and nanofibre samples while
the corresponding minimum reduction in strength for the
NIST sample was 42% for one sample, while for the
other two samples the strength was more than halved.
This is consistent with the predominant contribution to
the load in the zero/short-span test of the NIST softwood
sample being the direct loading of fibres to failure, while
for the MFC and nanofibre sample the contributions of
both bond and fibre strength are important.
There then remains the question of why there is a
reduction in strength with span. One piece of further
evidence is that there is for all samples, except the 30
gsm NIST sample, a small additional reduction in
strength between 50 mm and 100 mm spans. These
results are then explainable via Weibull failure analysis
(see eg (Gregersen et al. 1998; I'Anson, Sampson 2007;
Uesaka et al. 2001; Wathen et al. 2006)) for applications
in the testing of paper), where local areas in a sample
have a strength distribution. Failure at the weakest point
in the sample means larger samples have lower strength
(Gregersen 1998).
Conclusion It has been established that zero/short span test can be
used instead of standard tensile test to measure the tensile
strength for nanofibre sheets. This is because there are no
fibres bridging between and directly gripped by both
jaws, just as in case of tensile tests. The zero/short-span
test cannot be used as alternative method for measuring
Fig 8 Tensile index from zero and short span tests multiplied by (8/9) and Tensile index from tensile test.
tensile strength for the NIST softwood sample because
fibres are longer than distance between jaws. Starch
addition increased dry paper tensile strength for sheets
made from the NIST softwood fibres but had no effect on
strength for the sheets made from the MFC sample.
Acknowledgements
Warren Batchelor would like to acknowledge many valuable discussions about the zero and short span test with Dr. Bo Westerlind from the SCA Research Centre and Mid-Sweden University. We acknowledge the financial support of the Australian Research Council, Australian Paper, Nopco Australasia, Norske Skog, SCA Hygiene Australasia and Visy through Linkage Project Grants LP0989823 and LP0990526. Swambabu Varanasi would like to acknowledge the support of Monash University through a Monash Graduate Scholarship. The authors would like to acknowledge the facilities used with the Monash Centre for Electron Microscopy. Authors would like to thank Javindu Hathurusinghe for helping us with experiments.
Literature
Ampulski, R.S. (2001): Report of Investigation Reference Materials 8495 Northern Softwood Bleached Kraft 8496 Eucalyptus Hardwood Bleached Kraft, National Institute of Standards and Technology Gaithersburg, MD.
Batchelor, W.J. (2003): Determination of Load-Bearing Element Length in Paper Using Zero/Short Span Tensile Testing, TAPPI Journal 2(8), 3-7.
Batchelor, W.J. and Westerlind, B.S. (2003): Measurement of short span stress-strain curves of paper, Nordic Pulp & Paper Research Journal 18(1), 44-50.
Batchelor, W.J., Westerlind, B.S., Hagglund, R. and Gradin, P. (2006): Effect of test conditions on measured loads and displacements in zero span testing, TAPPI Journal 5(10), 3-8.
Boucai, E. (1971a): Zero-Span Tensile Test and Fibre Strength, Pulp and Paper Magazine of Canada 72(10), 73-76.
Boucai, E. (1971b): The zero-span test: its relation to fibre properties, In International Paper Physics Conference, Mont Gabriel, QC, pp. 3-5.
Cowan, W.F. (1975): Short span tensile analysis, Pulmac Instruments, Montreal, Canada.
PAPER PHYSICS
Nordic Pulp and Paper Research Journal Vol 27 no.2/2012 349

Cowan, W.F. and Cowdrey, E.J.K. (1974): Evaluation of paper strength components by short-span tensile analysis, TAPPI J. 57(2), 90-93.
Eichhorn, S., Dufresne, A., Aranguren, M., Marcovich, N., Capadona, J., Rowan, S., Weder, C., Thielemans, W., Roman, M., Renneckar, S., Gindl, W., Veigel, S., Keckes, J., Yano, H., Abe, K., Nogi, M., Nakagaito, A., Mangalam, A., Simonsen, J., Benight, A., Bismarck, A., Berglund, L. and Peijs, T. (2010): Review: current international research into cellulose nanofibres and nanocomposites, Journal of Materials Science 45(1), 1-33.
Gatari, J.W.(2003): An Experimental Analysis of the Zero and Short Span tensile tests, MSc. Thesis, Chalmers University of Technology, Gothenburg, Sweden.
Gregersen, O.W. (1998): On the assessment of effective paper web strength, Norges Teknisk-Naturvitenskapelige Universitet, Trondheim.
Gregersen, O.W., Hansen, A. and Helle, T. (1998): Evaluation of newsprint strength and runnability using Weibull statistics, In Progress in Paper Physics Seminar, Vancouver, pp. D1.
Gurnagul, N. and Page, D.H. (1989): The difference between dry and rewetted zero-span tensile strength of paper, TAPPI J. 72(12), 164-167.
Hagglund, R., Gradin, P.A. and Tarakameh, D. (2004): Some aspects on the zero-span tensile test, Exp. Mech. 44(4), 365-374.
I'Anson, S.J. and Sampson, W.W. (2007): Competing Weibull and stress-transfer influences on the specific tensile strength of a bonded fibrous network, Composites Science and Technology 67(7-8), 1650-1658.
Joshi, K., Batchelor, W. and Rasid, K. (2011): Investigation of the effect of drying and refining on the fiber–fiber shear bond strength measured using tensile fracture line analysis of sheets weakened by acid gas exposure, Cellulose 18(6), 1407-1421.
Joshi, K.V., Batchelor, W.J., Parker, I.H. and Nguyen, K.L. (2007): A new method for Shear Bond Strength Measurement. In W. J. Batchelor (Ed.), Proc. International Paper Physics Conference, Gold Coast Appita, City, pp. 7-13.
Martinez, D. M., Buckley, K., S, S. J., Lindstrom, A., Thiruvengadaswamy, R., Olson, J. A., Ruth, T. J.and Kerekes, R. J. (2001): Characterizing the mobility of papermaking fibres during sedimentation, 12th Fundamental Research Symposium, Oxford, 2001, pp. 225-254.
Mohlin, U.-B. and Alfredsson, C. (1990): Fibre deformation and its implications in pulp characterization, Nordic Pulp Paper Res. J. 5(4), 172-179.
Michie, R.I.C. (1963): Nonwoven Fabric Studies Part II: The Relationship between Bonding Strength and the Variation of Fabric Strength with Jaw Span, Textile Res. J. 33(6), 403-411.
Nogi, M., Iwamoto, S., Nakagaito, A.N. and Yano, H. (2009): Optically Transparent Nanofiber Paper, Advanced Materials 21(16), 1595-1598.
Page, D.H. (1969): A Theory for the Tensile Strength of Paper, Tappi 52(4), 674-681.
Pulmac (2012): http://pulmac.ca/zerospan.php. Accessed : 26-03-2012
Raisanen, K.O., Paulapuro, H. and Karrila, S.J. (1995): The effects of retention aids, drainage conditions, and pretreatment of slurry on high-vacuum dewatering - a laboratory study, TAPPI Journal 78(4), 140-147.
Sehaqui, H., Liu, A., Zhou, Q. and Berglund, L.A. (2010): Fast Preparation Procedure for Large, Flat Cellulose and Cellulose/Inorganic Nanopaper Structures, Biomacromolecules 11(9), 2195-2198.
Seth, R.S., Jantunen, J.T. and Moss, C.S. (1989): The Effect of Grammage on Sheet Properties, Appita J. 42(1), 43-48.
Siró, I. and Plackett, D. (2010): Microfibrillated cellulose and new nanocomposite materials: A review, Cellulose 17(3), 459-494.
Uesaka, T., Ferahi, M., Hristopulos, D., Deng, N. and Moss, C. (2001): Factors Controlling Pressroom Runnability of Paper, In Transactions 12th Fundamental Research Symposium The Pulp and Paper Fundamental Research Society, Oxford, pp. 1423-1440.
Van Den Akker, J.A., Lathrop, A.L., Voelker, M.H. and Dearth, L.R. (1958): Importance of Fiber Strength to Sheet Strength, Tappi 41(8), 416-425.
Wathen, R., Rosti, J., Alava, M., Salminen, L. and Joutsimo, O. (2006): Fiber strength and zero-span strength statistics - some considerations, Nordic Pulp & Paper Research Journal 21(2), 193-201.
Xu, L. and Parker, I. (2000): Simulating the forming process with the Moving Belt Drainage Former, Appita Journal 53(4), 282-286.
Wink, W.A. and Van Eperen, R.H. (1962): The development of an improved zero-span tensile test, Tappi 45(1), 10-24.
Zhang, L., Batchelor, W., Varanasi, S., Tsuzuki, T. and Wang, X. (2012): Effect of cellulose nanofiber dimensions on sheet forming through filtration, Cellulose, 19(2), 561-574.
PAPER PHYSICS
350 Nordic Pulp and Paper Research Journal Vol 27 no.2/2012
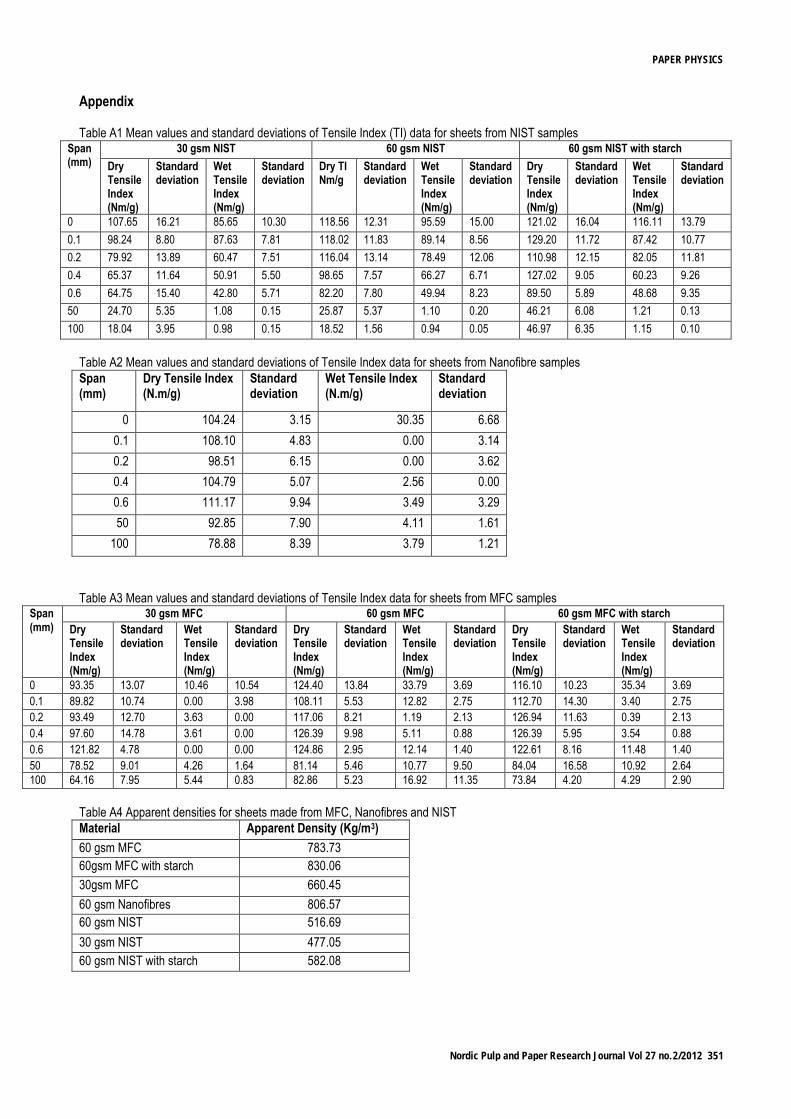
Appendix
Table A1 Mean values and standard deviations of Tensile Index (TI) data for sheets from NIST samples Span (mm)
30 gsm NIST 60 gsm NIST 60 gsm NIST with starch
Dry Tensile Index (Nm/g)
Standard deviation
Wet Tensile Index (Nm/g)
Standard deviation
Dry TI Nm/g
Standard deviation
Wet Tensile Index (Nm/g)
Standard deviation
Dry Tensile Index (Nm/g)
Standard deviation
Wet Tensile Index (Nm/g)
Standard deviation
0 107.65 16.21 85.65 10.30 118.56 12.31 95.59 15.00 121.02 16.04 116.11 13.79
0.1 98.24 8.80 87.63 7.81 118.02 11.83 89.14 8.56 129.20 11.72 87.42 10.77
0.2 79.92 13.89 60.47 7.51 116.04 13.14 78.49 12.06 110.98 12.15 82.05 11.81
0.4 65.37 11.64 50.91 5.50 98.65 7.57 66.27 6.71 127.02 9.05 60.23 9.26
0.6 64.75 15.40 42.80 5.71 82.20 7.80 49.94 8.23 89.50 5.89 48.68 9.35
50 24.70 5.35 1.08 0.15 25.87 5.37 1.10 0.20 46.21 6.08 1.21 0.13
100 18.04 3.95 0.98 0.15 18.52 1.56 0.94 0.05 46.97 6.35 1.15 0.10
Table A2 Mean values and standard deviations of Tensile Index data for sheets from Nanofibre samples
Span (mm)
Dry Tensile Index (N.m/g)
Standard deviation
Wet Tensile Index (N.m/g)
Standard deviation
0 104.24 3.15 30.35 6.68
0.1 108.10 4.83 0.00 3.14
0.2 98.51 6.15 0.00 3.62
0.4 104.79 5.07 2.56 0.00
0.6 111.17 9.94 3.49 3.29
50 92.85 7.90 4.11 1.61
100 78.88 8.39 3.79 1.21
Table A3 Mean values and standard deviations of Tensile Index data for sheets from MFC samples Span (mm)
30 gsm MFC 60 gsm MFC 60 gsm MFC with starch
Dry Tensile Index (Nm/g)
Standard deviation
Wet Tensile Index (Nm/g)
Standard deviation
Dry Tensile Index (Nm/g)
Standard deviation
Wet Tensile Index (Nm/g)
Standard deviation
Dry Tensile Index (Nm/g)
Standard deviation
Wet Tensile Index (Nm/g)
Standard deviation
0 93.35 13.07 10.46 10.54 124.40 13.84 33.79 3.69 116.10 10.23 35.34 3.69
0.1 89.82 10.74 0.00 3.98 108.11 5.53 12.82 2.75 112.70 14.30 3.40 2.75
0.2 93.49 12.70 3.63 0.00 117.06 8.21 1.19 2.13 126.94 11.63 0.39 2.13
0.4 97.60 14.78 3.61 0.00 126.39 9.98 5.11 0.88 126.39 5.95 3.54 0.88
0.6 121.82 4.78 0.00 0.00 124.86 2.95 12.14 1.40 122.61 8.16 11.48 1.40
50 78.52 9.01 4.26 1.64 81.14 5.46 10.77 9.50 84.04 16.58 10.92 2.64
100 64.16 7.95 5.44 0.83 82.86 5.23 16.92 11.35 73.84 4.20 4.29 2.90
Table A4 Apparent densities for sheets made from MFC, Nanofibres and NIST
Material Apparent Density (Kg/m3)
60 gsm MFC 783.73
60gsm MFC with starch 830.06
30gsm MFC 660.45
60 gsm Nanofibres 806.57
60 gsm NIST 516.69
30 gsm NIST 477.05
60 gsm NIST with starch 582.08
PAPER PHYSICS
Nordic Pulp and Paper Research Journal Vol 27 no.2/2012 351