application for social programs: the role of local ...epu/acegd2015/papers/veroniquegille.pdf ·...
TRANSCRIPT

Application for social programs: the role of localpolitics and caste networks in affirmative action in India
Veronique Gille∗
August 2015
Abstract
India’s affirmative action programs are among the largest in the world. In the public sector,
up to 49.5% of the jobs are reserved for low castes. However, the recruitment is highly dis-
cretionary, so it is difficult for low-castes without connections to access these jobs and thereby
benefit from affirmative action. This paper studies the impact of having someone from the same
caste as local elected leader on the probability of applying for jobs reserved for low castes in
the public sector in India. The identification strategy exploits the political reservation system
at the village level that determines the caste group of the person in power. Using data from
36 villages from South India, I find that households are more likely to apply when the village
council president is from their caste group. The evidence suggests that the impact comes from
the council president using his connections to help his caste-fellows.
Keywords: India, affirmative action, caste, political reservations
JEL Classification Numbers: I38, O12, P48
∗Universite catholique de Louvain, Voie du Roman Pays 34, B-1348 Louvain-la-Neuve, Belgium,[email protected].
1

1 Introduction
Past discrimination against certain people on the basis of their ethnicity, religion or gender hashad an important impact on current inequalities. Because those groups were restricted to certainoccupations or deprived from certain rights, today, they are lagging behind in terms of socio-economic outcomes. This is for example the case for the African Americans in the US, the Malayin Malaysia, the indigenous population in Brazil or women all over the world. Nowdays, in orderto support these groups a lot of countries have set up affirmative action programs.
In India, where certain individuals were discriminated against because of their caste,1 affir-mative action programs are implemented on a very large scale. The extent of affirmative actionis particularly sizeable in public employment where since Independence, depending on the State,between 22.5% and 49.5% of the jobs in the public sector have been reserved for low castes. How-ever, each year a non-marginal proportion of these quotas remains unfilled and low castes are stillunderrepresented in the public sector. There are two main reasons for that. The first reason isthat the candidates are often not considered as “suitable” (Jaffrelot, 2011). The second reason, onwhich this paper focuses, is that it is not easy to access these jobs, due to a highly discretionaryrecruitment process. Chandra (2004) reports that except for high skilled positions, which are filledby competitive exams, a high proportion of the employees at low skilled positions, which consti-tute almost 95% of the jobs in the public sector, are recruited directly by the concerned offices.This discretion in hiring makes it difficult for low castes individuals without connections to accessthese jobs and therefore benefit from provisions under reservations in the public sector. Chandra(2004) describes the case of an untouchable in a village in Uttar Pradesh, who is eligible for quo-tas in public sector employment but does not even try to benefit from them because “had he triedto escape his circumstances by securing regular employment in the public sector, he would haveneeded “contacts””. This difficulty in getting benefits from the State without connections not onlyconcerns quotas in public employment, but a large range of public programs. Therefore, interme-diaries are commonly used to mediate people’s access to State institutions (Witsoe, 2012). Amongthese intermediaries, political leaders, who have power over administrative decisions as they cantransfer bureaucrats to different positions (Chandra, 2004; Iyer and Mani, 2012), play an importantrole.
The question this paper is concerned with is if households that are better connected to theState through their caste networks have an easier access to reserved jobs in the public sector. Thisquestion is explored using the village census and the village survey of the ARIS-REDS data for36 villages distributed across three States in South India. Because these data do not indicate ifhouseholds got the job after applying, I study the impact of caste networks on application for
1Section 2 provides an overview of the organization of the social system in India.
2

reserved jobs. In particular, I study the impact of having someone from the same caste as a localelected leader on the probability of applying for reserved jobs in the public sector. How wouldlocal elected leaders help their caste members for reserved jobs? In India elected leaders do nothave the legal power to attribute administrative jobs. In practice, however, they have a certaincontrol over bureaucrats. Local elected leaders, because of their connections to higher level electedleaders or political parties can play the role of intermediaries between their caste members and thebureaucrats.
As caste groups that have elected leaders may have different characteristics than caste groupswithout, I exploit an institutional feature of India created by a reform in 1993 to identify the effect.This reform created a three-tier government system with elected councils at the village level, calledGram Panchayats. This reform also established that the position of village council president, calledpradhan, has to be reserved for low castes by rotation across villages.
To look at the impact of having someone from the same caste group as pradhan I thereforelook at the impact of having the position of pradhan reserved for the same caste group. As theattribution of political reservations to a specific caste group in a specific village at given pointin time is partially determined by village level characteristics,2 I focus on intra-village variationacross caste groups in the probability of applying for reserved jobs in the public sector. Thisspecification controls for village level characteristics but caste groups in villages with politicalreservations and without political reservations may still differ in their unobservable characteristics.To check if caste level unobservables are driving the results, I use a panel specification based on arecall question. I also conduct a falsification test. These robustness checks provide evidence thatthe results are unlikely to be driven by caste unobservables at the village level.
To shed further light on what drives the effect, I study if the impact is driven by membersfrom the same subcaste, called jati. The identification strategy also uses the political reservationstatus of the village, which now serves as an instrument. Although the political reservation statusof the village might be correlated to caste level characteristics, it is unlikely to be correlated tojatis’ unobservable characteristics because there are several jatis per caste in each village. Theidentification strategy differs from above in that the political reservation status of the pradhan seatno longer functions as a proxy for the caste group of the pradhan.
I document that sharing the caste group of the pradhan increases households’ application forreserved jobs in the public sector, and that this impact is driven by members from the same sub-caste. Further analysis suggests that the impact comes from the pradhan helping the application ofmembers from his caste group to be processed. Indeed, the application rate of members from the
2Whereas every village gets political reservations for each caste group at the same frequency, the sequence inwhich villages get political reservations is not random, therefore leading to systematic differences across villages intheir observable characteristics (Dunning and Nilekani, 2013). This point will be further explained in section 4.1.
3

same jati as the pradhan only increases in villages where the pradhan is himself well connected, andconsequently able to help his caste fellows. The results do not provide support for other channelssuch as improved self-confidence or better access to information.
The fact that elected political leaders favor their own group in the distribution of benefits hasbeen well documented in the literature. Looking at the impact of electoral reservations for sched-uled castes (SC) and scheduled tribes (ST) at the State level in India, Pande (2003) finds that theyhave increased redistribution of resources in favor of these groups. The same pattern has beenobserved at a more local level. Besley et al. (2004) show that intra-village allocation of publicgoods shifts towards low castes when the seat of the pradhan is reserved for low castes. Similarly,Chattopadhyay and Duflo (2004) find that female pradhans distribute public goods which are morerelevant to the needs of women. Mu and Zhang (2014) show that in China elected village headsfavor their home natural village in ressource allocation.
There is less empirical evidence in the economics literature on how having someone from thesame group in power changes the behavior of individuals because they expect different returnsfrom their actions or because they feel more confident to do so. Among the exceptions, Markussenand Tarp (2014) show that households that have political connections tend to invest more in landimprovement in Vietnam. In India Beaman et al. (2009) find that female reservations for the seat ofpradhan lead to an increase in the proportion of female candidates in successive elections. Ghani etal. (2014) find an increase in women’s entrepreneurship following the implementation of politicalreservations for women.
This paper provides new empirical evidence of the impact of elected leaders on the behaviorof individuals sharing their identity. Whereas the previous literature has mainly focused on theimpact of political leaders’ identity on the distribution of public goods, this paper studies a differentkind of public benefit, namely quotas for low castes for jobs in the public sector and studies howthe identity of political leaders affects people’s application behavior. This policy is the biggestaffirmative action program in the world, but little is known about the mechanisms underlyingpeople’s application. This paper therefore sheds some light onto the determinants of applicationsfor reserved jobs in the public sector.
The rest of the paper is organized as follows: section 2 provides some information on thecaste system and caste-based affirmative action programs. Section 3 describes the data. Section4 explains the empirical strategy, shows the main results and explores the channels. Section 5concludes.
4

2 Contextual background
Affirmative action policies in India are due to, and based on, the caste system. To understand thepolicy studied in this paper, this section provides basic information on the caste system beforegiving a quick overview of the evolution of reservations in public employment.
2.1 The caste system and the need for reservations
The Indian society is stratified according to a caste system. The organization of the caste systemis hierarchical, and is governed by the concept of purity. People at the top of the hierarchy areconsidered to be pure, whereas people at the bottom are considered to be impure and therefore“untouchable”. The caste system goes hand in hand with a division of occupations across jatis,where each jatis has a traditional occupation. Hierarchically low jatis traditionally have menialjobs such as scavenging or laundering. Membership to a specific jati is hereditary and endogomyis practiced, such that it is very difficult, not to say impossible, to escape one’s caste.
Because the caste system in itself does not allow for social mobility, the caste group at thebottom of the social hierarchy, the “untouchables”, also called dalits, have always been the mosteconomically disadvantaged group. And because of their impurity, they were and still are sufferingfrom discrimination: for centuries they had been obliged to live in specific areas of villages andwere banned from using common goods such as wells or places of worship.
At Independence, under the lead of Dr. Ambedkar himself a dalit, the principal of affirmativeaction was introduced in the Constitution. The dalits, referred to as the “Scheduled Castes” (SC),and the indigenous people of India, referred to as the “Scheduled Tribes” (ST), were provided withrespectively 15% and 7.5% quotas in public employment and in institutions of higher education.The other low castes, also economically poor and socially backward but not suffering from thestigma of untouchability, were not entitled to affirmative action. But a door was left open for themin the Constitution where they were referred to as the “Other Backward Classes” (OBC).3
2.2 The evolution of reservations for low castes in public employment
Whereas reservations in public employment for SC and ST were quickly implemented and ac-cepted, reservations in public employment for OBC were subjected to several twists and turns andwere extremely diverse across States. There have been reserved jobs in the public sector for OBCin the Southern States prior to Independence. During the post-Independence period, several otherStates adopted reservations in public employment for OBC. However, the turning point was the
3For the purpose of clarity, in the rest of the paper “caste” refers to the caste group, namely SC, ST and OBC, and“jati” refers to the the hereditary and endogamous subcaste group.
5

“Mandal Commission” of 1979 which recommended 27% quotas in the public sector for OBC.This recommendation was implemented by the Central Government in 1993. Most of the Statesfollowed the Central Government and implemented reservations in public employement for OBCin their own services, the most recent State being West Bengal which only implemented reserva-tions in the public sector for Muslim OBC in 2012.
Currently, there are employment quotas in the public sector (central and State Government) forSC, ST and OBC in every State.
3 Data and descriptive statistics
The data used to conduct this study are from the 2006 round of the Additional Rural IncomesSurvey and Rural Economic and Demographic Survey (ARIS-REDS) from the National Council ofApplied Economic Research (NCAER). Since 1971, the NCAER has been conducting householdsurveys along with village surveys in 259 villages in the 17 major States of India.
Out of the 259 villages where the survey has been conducted, I focus on a subsample forwhich the jati of the pradhan is available.4 This is the case for 36 villages situated in three States:Andhra Pradesh, Karnataka and Maharashtra. In those villages, I focus on households from castesbenefitting from reservations in public employment, namely SC, ST and OBC. The final sampleis composed of 13,198 households. Robustness checks on specifications which do not use thejati of the pradhan are conducted with a larger sample that includes all the States with politicalreservations for OBC5 and reservations for OBC in State government jobs. The additional Statesin this sample are Chhatisgarh, Gujarat, Rajasthan, Tamil Nadu and Uttar Pradesh.
The village survey provides the reservation status of the pradhan position for three periods:current pradhan, previous pradhan and previous to previous pradhan. Table 1 summarizes the in-formation for the reduced sample and the larger sample used for robustness checks. Two importantpoints are to be noted: first, OBC benefit the most from pradhan’s reservation. Each electoral term,almost half of the reserved pradhan seats are reserved for OBC. Second, the number of reservedseats constitute between 40 and 50% of the total number of seats for the larger sample and up to68% for the reduced sample.
4The data do not directly provide the jati of the pradhan, but indicate the name and several socio-demographicindicators along with the electoral score of all the candidates to the seat of pradhan. We also know for all the villagemembers if they were candidate for the seat of pradhan. The jati of the pradhan can be deduced in two specific institu-tional contexts: when the pradhan is elected among the Gram Panchayat members as in Maharashtra and Karnataka,because the data indicate the jati of panchayat members, or when the Gram Panchayat is composed of only one village,in which case we can match the pradhan to the village listing.
5Although reservations for SC and ST for the pradhan position are imposed by the Constitution, political reserva-tions for OBC are allowed but not mandatory. Therefore, not all States have implemented political reservations forOBC.
6

Table 1: Villages political reservation status
Reduced sample Full samplePradhan position current previous previous current previous previousreserved for to previous to previous
# % # % # % # % # % # %SC 2 6% 5 14% 8 22% 14 10% 17 12% 22 17%ST 3 8% 0 0 % 4 11% 11 7% 8 5% 5 4%OBC 17 47% 19 53% 11 31% 47 32% 40 27% 25 19%Total Reserved 22 61% 24 67% 23 64% 72 49% 65 45% 52 40%Non Reserved 14 39% 12 33% 13 36% 75 51% 81 55% 79 60%Total 36 100% 36 100% 36 100% 147 100% 146 100% 131 100%The table indicates the number of villages where the seat of pradhan is reserved for SC, ST or OBC, in thereduced sample and the full sample, for current, previous and previous to previous Gram Panchayat.
The village listing, which lists all the households in the surveyed villages, provides the infor-mation about application for reserved jobs in the public sector along with several demographiccharacteristics. In particular, households were asked “Have you or any member of your familytaken advantage of provisions under reservations to seek employment” in the current year of thesurvey and 10 years prior. This is the answer to this question that I use to analyse the role of thepradhan in affirmative action and that I will refer to in the rest of the paper as “having applied fora reserved job”.
Table 2 provides descriptive statistics for the most important variables for the reduced (RS) andfull sample (FS). The two samples are pretty similar, except for the application rate for reservedjobs which is much higher in the full sample: 4.7% of the households declare having applied forreserved jobs in 1996 and 4.4% in 2006 in the RS, compared to 8.7% in 1996 and 11.7% in 2006in the FS.6 Concerning the pradhan, the percentage of households that live in a reserved GramPanchayat is high (49% in the RS, 42 % in the FS). However, the percentage of households havinga pradhan seat reserved for their caste group is lower (34% in the RS, 26% in the FS) . The OBCare the one that benefit the most from reservations in the pradhan seat: 31% have an OBC pradhanin the RS and 21% in the FS . On the contrary, only 1% (3% in the FS) of the SC and 1% (2% in theFS) of the ST have a pradhan seat reserved for their caste group. This small percentage is due tothe small proportion of villages that have a pradhan seat reserved for SC and ST. The demographiccharacteristics are very similar across samples. They show that low castes are poor and have littleeducation. On average, household heads have not completed primary schooling, and landholdingsare small.
6This difference is likely to be due to the fact that the RS only includes States from the south of India, whereasthe FS also includes States from the north. However, section 4 shows that the findings are robust to the use of the fullsample.
7
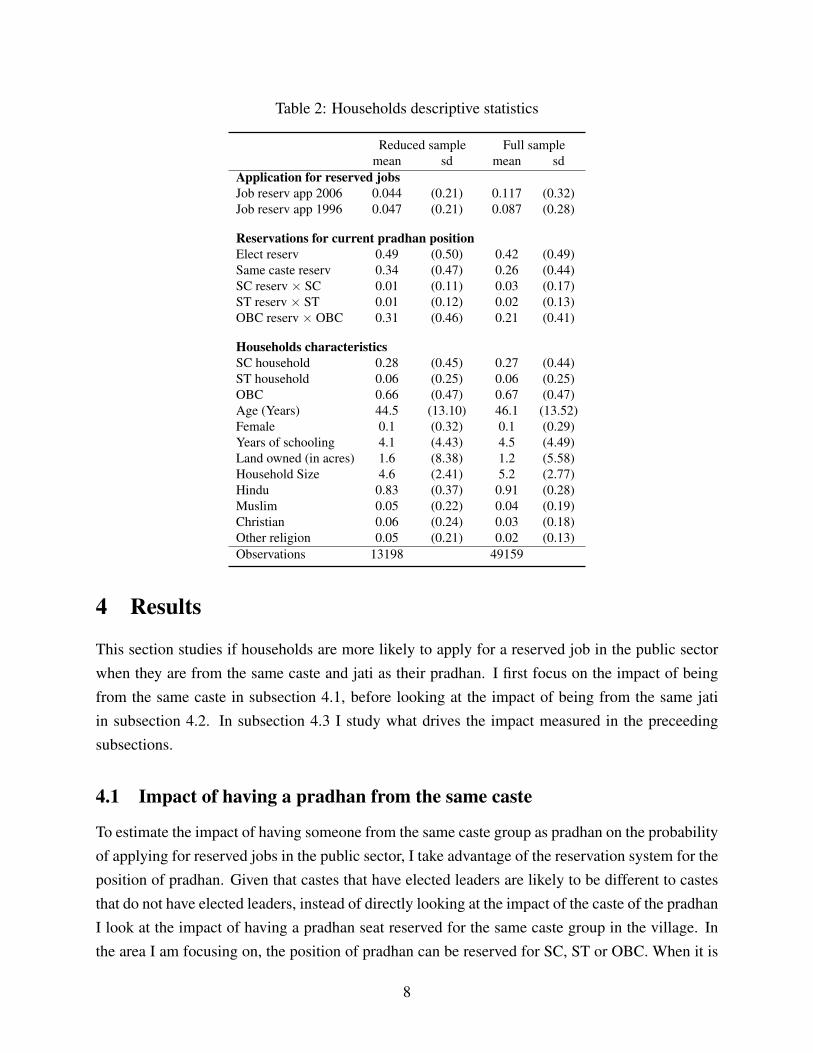
Table 2: Households descriptive statistics
Reduced sample Full samplemean sd mean sd
Application for reserved jobsJob reserv app 2006 0.044 (0.21) 0.117 (0.32)Job reserv app 1996 0.047 (0.21) 0.087 (0.28)
Reservations for current pradhan positionElect reserv 0.49 (0.50) 0.42 (0.49)Same caste reserv 0.34 (0.47) 0.26 (0.44)SC reserv × SC 0.01 (0.11) 0.03 (0.17)ST reserv × ST 0.01 (0.12) 0.02 (0.13)OBC reserv × OBC 0.31 (0.46) 0.21 (0.41)
Households characteristicsSC household 0.28 (0.45) 0.27 (0.44)ST household 0.06 (0.25) 0.06 (0.25)OBC 0.66 (0.47) 0.67 (0.47)Age (Years) 44.5 (13.10) 46.1 (13.52)Female 0.1 (0.32) 0.1 (0.29)Years of schooling 4.1 (4.43) 4.5 (4.49)Land owned (in acres) 1.6 (8.38) 1.2 (5.58)Household Size 4.6 (2.41) 5.2 (2.77)Hindu 0.83 (0.37) 0.91 (0.28)Muslim 0.05 (0.22) 0.04 (0.19)Christian 0.06 (0.24) 0.03 (0.18)Other religion 0.05 (0.21) 0.02 (0.13)Observations 13198 49159
4 Results
This section studies if households are more likely to apply for a reserved job in the public sectorwhen they are from the same caste and jati as their pradhan. I first focus on the impact of beingfrom the same caste in subsection 4.1, before looking at the impact of being from the same jatiin subsection 4.2. In subsection 4.3 I study what drives the impact measured in the preceedingsubsections.
4.1 Impact of having a pradhan from the same caste
To estimate the impact of having someone from the same caste group as pradhan on the probabilityof applying for reserved jobs in the public sector, I take advantage of the reservation system for theposition of pradhan. Given that castes that have elected leaders are likely to be different to castesthat do not have elected leaders, instead of directly looking at the impact of the caste of the pradhanI look at the impact of having a pradhan seat reserved for the same caste group in the village. Inthe area I am focusing on, the position of pradhan can be reserved for SC, ST or OBC. When it is
8

not reserved, anyone from any caste group can be a candidate. In practice, low castes are rarelyelected when the pradhan seat is not reserved. In my sample, only 2 out of 14 pradhans are lowcastes in the unreserved villages.
How does the system of electoral reservations work? Regarding the number of villages wherethe position of pradhan has to be reserved at each electoral term, The 73rd amendment of theConstitution, which introduced the policy, specifies that “the number of offices of Chairpersonsreserved for the Scheduled Castes and Scheduled Tribes in the Panchayats at each level in anyState shall bear, as nearly as may be, the same proportion to the total number of such offices in thePanchayats at each level as the population of the Scheduled Castes in the State or of the ScheduledTribes in the State bears to the total population of the State”. For OBC, States do not have toprovide reservations for the seat of pradhan but, for those who choose to, the number of seats tobe reserved is also determined by law. In Karnataka and Andhra Pradesh, 1/3 of the seats forChairpersons are to be reserved for OBC, and in Maharashtra it is 27%. In practice, in most Statesthe proportion of pradhan seats to be reserved for each caste group is determined at the block level(i.e. subdistrict) and is approximately equal to the share that they represent in the population of theblock.7
Once the number of villages that will have a seat reserved for the position of pradhan has beendetermined, how are the villages chosen? The 73rd Amendment specifies that the reserved seatshave to be allocated by “rotation” across Gram Panchayats, but the order in which each GramPanchayat gets electoral reservations is not specified in the text. In practice, Gram Panchayats areclassified according to a specific criterion, which often is the size of the population considered ineach Gram Panchayat.8 In Karnataka, for example, for the attribution of reserved seats for SCGram Panchayats are listed in descending order of their SC population. At each election the blocklevel bureaucrats go down the list to allocate the reserved seats (Dunning and Nilekani, 2013). Thestrategy is the same for OBC reservations in Bihar, except that Gram Panchayats are classified indescending order of their total population, given that the size of the OBC population is not known.So even if the frequency at which Gram Panchayats get reservations for a specific caste is thesame for every Gram Panchayat, the fact that they get reservation at a specific electoral term isnot random, because the order of allocation is determined by a Gram Panchayat level criterion.In a cross-sectional setting, villages with reservations are therefore not similar to villages withoutreservations and the causal effect of having a pradhan from the same caste cannot be identified.
To mitigate this problem, in subsection 4.1.1 I use the same identification strategy as Besley etal. (2004), who add village dummies to their specification. Once controlling for village dummies,households characteristics are similar across villages with and without reservations (see table 10
7The exact OBC population is not known, because since 1931 the census does not provide statistics per caste.8However, the criteria is not known for all States.
9
in the appendix). As this specification does not control for caste level unobservables in the village,I also conduct a falsification test that checks if political reservation status of the villages are corre-lated with previous reserved jobs applications. To further check if caste level unobservables in thevillage are driving the impact, in subsection 4.1.2 I exploit the panel dimension of the data. Thisstrategy allows me to include household level fixed-effects that control for any unobservables thatare fixed over time.
4.1.1 Cross-sectionnal evidence
In the cross-sectional specification, the effect is estimated with village dummies. The villagedummies capture all the village-level unobservables which may be correlated with the reservationstatus of the village and with the rate of application for reservations in the public sector of membersfrom this village. The impact of having a pradhan from the same caste group on reserved jobsapplications is therefore only identified from within village variation in political reservation. Theempirical specification is as follows:
Yhcv = β0 +β1Xhcv +β2RESERVcv +αv + εhcv (1)
where Yhcv is equal to one if a member from household h of caste c (namely SC, ST or OBC)in village v applied to reserved jobs in the public sector. Xhcv are household level variables.9
RESERVcv is a dummy variable equal to one if the pradhan’s position is reserved for the castegroup of the household. The village dummies αv control for the unobservables at the village levelthat may be correlated with the reservation status of the village and εhcv is an error term. I alsocontrol in most specifications for caste characteristics at the village level.10 The standard errorsare clustered at the level of RESERVcv, that is at the level of caste in the village.
Table 3 shows the results of the estimation of equation 1. Column 1 looks at the impact ofpolitical reservations for SC, ST and OBC, and shows that having a pradhan from the same castehas a positive impact on the probability of members from this caste to apply for reserved jobs.Columns 2, 3 and 4 decompose the impact for the different castes. Column 2 and 3 show thathaving a pradhan who is a SC or a ST does not increase the probability of applying for reservedjobs of SC and ST.11 However, having an OBC pradhan for OBC households has a strong andpositive impact on their probability of applying for reserved jobs (column 4). The probability ofgetting political reservations for a given Gram Panchayat is likely to be correlated with caste level
9Age and education level of the household head, land owned, household size, caste and religion.10The caste level controls are the household level controls aggregated at the caste in the village level, i.e. age,
education, land owned, household size and the total population of the caste in the village.11The number of reserved villages for SC and ST in this sample is very small (cf table 1), but the same regressions
on the larger sample (not shown here) confirm these results.
10

Tabl
e3:
OL
Ses
timat
ion
ofap
plic
atio
nto
rese
rved
jobs
Dep
enda
ntva
riab
leA
pplic
atio
nfo
rres
erve
djo
bsin
2006
10ye
ars
ago
(1)
(2)
(3)
(4)
(5)
(6)
(7)
Age
(Yea
rs)
0.00
0757
***
0.00
0755
***
0.00
0754
***
0.00
0756
***
0.00
0810
***
0.00
0978
***
0.00
104*
**(0
.000
224)
(0.0
0022
4)(0
.000
224)
(0.0
0022
5)(0
.000
238)
(0.0
0029
5)(0
.000
360)
Yea
rsof
scho
olin
g0.
0036
6***
0.00
365*
**0.
0036
5***
0.00
366*
**0.
0037
3***
0.01
05**
*0.
0049
0***
(0.0
0126
)(0
.001
26)
(0.0
0126
)(0
.001
26)
(0.0
0134
)(0
.000
900)
(0.0
0147
)
Lan
dow
ned
inac
res
0.00
164
0.00
176
0.00
178
0.00
162
0.00
138
-0.0
0012
90.
0001
36(i
nlo
g)(0
.002
79)
(0.0
0279
)(0
.002
79)
(0.0
0279
)(0
.003
00)
(0.0
0335
)(0
.003
74)
Hou
seho
ldSi
ze0.
0004
830.
0004
800.
0004
800.
0004
850.
0006
020.
0199
***
0.00
196*
(0.0
0123
)(0
.001
23)
(0.0
0123
)(0
.001
23)
(0.0
0129
)(0
.003
07)
(0.0
0110
)
STho
useh
old
-0.0
188*
*-0
.016
4*-0
.017
5**
-0.0
185*
*-0
.019
6**
0.00
626
0.01
22(0
.007
41)
(0.0
0831
)(0
.008
73)
(0.0
0724
)(0
.009
22)
(0.0
0854
)(0
.020
4)
OB
C-0
.015
1**
-0.0
0712
-0.0
0809
-0.0
177*
**-0
.022
6***
-0.0
298*
**0.
0096
4(0
.006
04)
(0.0
0732
)(0
.007
46)
(0.0
0620
)(0
.007
68)
(0.0
0714
)(0
.010
4)
Sam
eca
ste
rese
rv0.
0215
***
(0.0
0756
)
SCre
serv
×SC
0.02
62(0
.016
0)
STre
serv
×ST
-0.0
0719
(0.0
179)
OB
Cre
serv
×O
BC
0.02
51**
*0.
0357
***
0.01
73**
*-0
.005
22(0
.008
67)
(0.0
0766
)(0
.006
65)
(0.0
139)
Rel
igio
ndu
mm
ies
Yes
Yes
Yes
Yes
Yes
Yes
Yes
Cas
teco
ntro
lsY
esY
esY
esY
esY
esY
esY
esV
illag
edu
mm
ies
Yes
Yes
Yes
Yes
Yes
Yes
Yes
OB
C×
Dis
tric
tDum
mie
sN
oN
oN
oN
oY
esY
esN
oO
bser
vatio
ns13
198
1319
813
198
1319
812
246
4915
913
198
r20.
060
0.06
00.
060
0.06
00.
060
0.15
90.
139
*p<
0.1,
**p<
0.05
,***
p<
0.01
.R
obus
tsta
ndar
der
rors
are
corr
ecte
dfo
rcl
uste
ring
atth
eca
ste
inth
evi
llage
leve
l.T
hesa
mpl
esin
colu
mns
5an
d6
excl
ude
dist
rict
sw
here
ther
eis
only
one
villa
gefo
rwhi
chda
taar
eav
aila
ble,
toke
epso
me
vari
a-tio
nw
hen
the
inte
ract
ion
term
betw
een
OB
Can
ddi
stri
ctdu
mm
ies
isad
ded.
Col
umn
6us
esth
eex
tend
edsa
mpl
e.T
heca
ste
leve
lcon
trol
sar
eth
eho
useh
old
leve
lcon
trol
sag
greg
ated
atth
eca
ste
leve
l,i.e
.ag
e,ed
ucat
ion,
land
owne
d,ho
useh
old
size
and
the
tota
lpop
ulat
ion
ofth
eca
ste
inth
evi
llage
.
11

characteristics in the other Gram Panchayats of the block.12 However, I cannot control for castedummies at the block level because there are not enough villages per block in the sample. Asa proxy in column 5 and 6 I control for district dummies interacted with OBC, which take intoaccount caste unobservables at the district level. Once controlling for this, households from eachcaste group are not significantly different in terms of observables in reserved and unreserved GramPanchayat (see table 10 in the appendix). The coefficient is similar to the previous specifications,so the impact does not seem to be driven by caste unobservables. I can also use the larger sample,as the information on the jati of the pradhan is not used. Column 6 shows that the results hold withthe larger sample. Finally, column 7 reports the result from a falsification test. If the impact isdriven by caste unobservables at the village level, we would expect the interaction term betweenreservations for OBC and the OBC dummy to be also positively correlated with the probabilityof applying for reserved jobs 10 years ago. However, this is not the case. The coefficient on theinteraction term is close to 0 and is not significant.
A possible explanation for why we did not find any impact of having a SC or ST pradhan andapplying for reserved jobs for SC and ST relates to the fact that pradhans can only help their castefellows to get reserved jobs if she/he is herself/himself well connected (see section 4.3.1 for furtherexplanation). As OBC are often quite numerous at the district or State level, OBC pradhans mightbe more likely to have a bigger caste network on which they can rely on outside the village.
4.1.2 Panel evidence
Table 4 provides further evidence of the robustness of the impact by using a panel specification.In the survey, households were asked about their application for reserved jobs at the time of thesurvey (2006) and ten years prior (therefore 1996). For most villages, the data also provide theinformation on reservations for the seat of pradhan for previous to previous election. As electionshappen every five years, this provides information about reservations for the seat of pradhan tenyear ago. I am therefore able to study the impact in a panel setting with households fixed effects,where the identification comes from villages where there was a change in the reservation status ofthe pradhan seat. Households who have moved into the village after 1996 are excluded, as well ashouseholds whose head has changed. Because the data do not have a real panel structure, I am notable to control for households’ characteristics that vary over time. But I allow the impact of thehouseholds’ characteristics to vary over time by interacting the household’s characteristics with atime dummy. I also take into account time-varying village level unobservables by controlling for
12As explained previously, the fact that a Gram Panchayat gets political reservation for a certain group at a certainpoint in time depends on its position on the list, which itself depends on the distribution of caste level characteristicsin the other Gram Panchayats of the block. The probability of getting political reservation consequently depends onthe SC, ST and OBC characteristics in the other Gram Panchayat.
12

village dummies interacted with the time dummy.
Table 4: Fixed-effects estimation of application for reserved jobs
Application for reserved jobs
(1) (2) (3) (4) (5)Same caste reserv 0.0179***
(0.00547)
SC reserv × SC 0.00718(0.0141)
ST reserv × ST -0.0334(0.0286)
OBC reserv × OBC 0.0354*** 0.0165**(0.00805) (0.00712)
Time dummy Yes Yes Yes Yes YesTime dummy × HH controls Yes Yes Yes Yes YesTime dummy × Village dummies Yes Yes Yes Yes YesHouseholds FE Yes Yes Yes Yes YesObservations 9662 9662 9662 9662 31371r2 0.008 0.007 0.007 0.009 0.016
* p < 0.1, ** p < 0.05, *** p < 0.01. Robust standard errors are corrected for clustering at thehousehold level.
The results are very similar to the ones in table 3. Column 1 shows that households livingin villages where the pradhan seat is reserved for their caste group are more likely to apply forreserved jobs. Columns 2, 3 and 4 show that there is no impact for SC and ST and that the impactis driven by OBC households. Column 5 shows that this impact is robust when using the largersample. The estimated magnitude of the impact is very similar to the cross-sectional specifications.
Both specifications (cross-section and panel) show that there is a significant and positive impactof having an OBC pradhan on the probability of OBC households of applying for reserved jobs.The following section considers the question at a more disaggregated level, the jati level.
4.2 Impact of having a pradhan from the same jati
Section 4.1 underlines that low-caste households are more likely to apply for reserved jobs in thepublic sector when the pradhan seat is reserved, and therefore occupied, by a low caste. But who isconcerned among low castes households? Does the positive impact of having a low-caste pradhanconcerns any household or is it limited to the close social group of the pradhan, that is his jati?Whatever the channel at stake here, the answer is not straightforward. While most of the literatureunderlines that the jati is still the real group of reference in contemporary India (Damodaran, 2008;
13
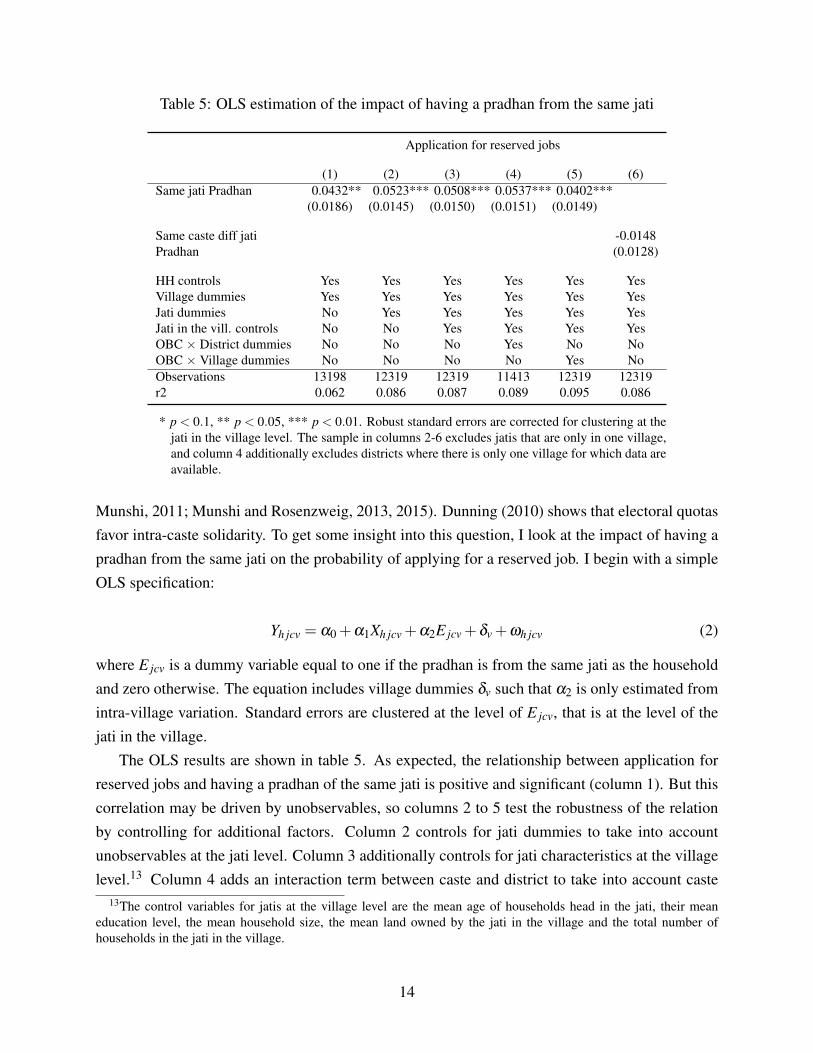
Table 5: OLS estimation of the impact of having a pradhan from the same jati
Application for reserved jobs
(1) (2) (3) (4) (5) (6)Same jati Pradhan 0.0432** 0.0523*** 0.0508*** 0.0537*** 0.0402***
(0.0186) (0.0145) (0.0150) (0.0151) (0.0149)
Same caste diff jati -0.0148Pradhan (0.0128)
HH controls Yes Yes Yes Yes Yes YesVillage dummies Yes Yes Yes Yes Yes YesJati dummies No Yes Yes Yes Yes YesJati in the vill. controls No No Yes Yes Yes YesOBC × District dummies No No No Yes No NoOBC × Village dummies No No No No Yes NoObservations 13198 12319 12319 11413 12319 12319r2 0.062 0.086 0.087 0.089 0.095 0.086
* p < 0.1, ** p < 0.05, *** p < 0.01. Robust standard errors are corrected for clustering at thejati in the village level. The sample in columns 2-6 excludes jatis that are only in one village,and column 4 additionally excludes districts where there is only one village for which data areavailable.
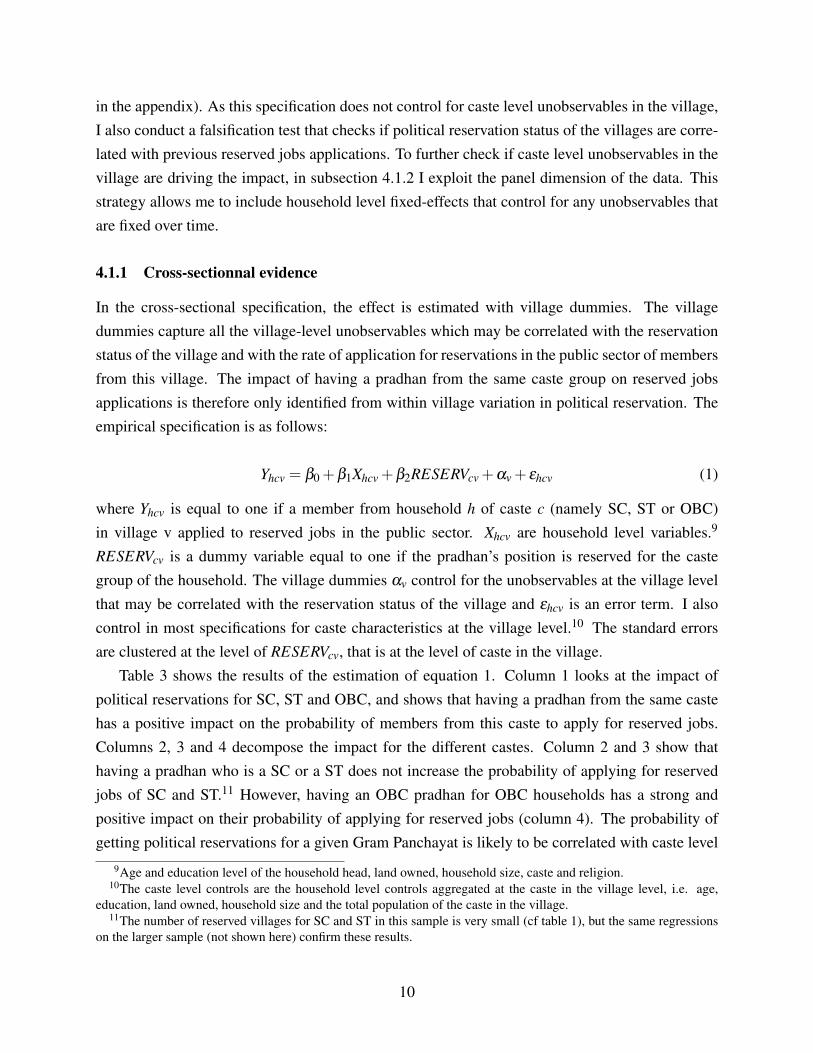
Munshi, 2011; Munshi and Rosenzweig, 2013, 2015). Dunning (2010) shows that electoral quotasfavor intra-caste solidarity. To get some insight into this question, I look at the impact of having apradhan from the same jati on the probability of applying for a reserved job. I begin with a simpleOLS specification:
Yh jcv = α0 +α1Xh jcv +α2E jcv +δv +ωh jcv (2)
where E jcv is a dummy variable equal to one if the pradhan is from the same jati as the householdand zero otherwise. The equation includes village dummies δv such that α2 is only estimated fromintra-village variation. Standard errors are clustered at the level of E jcv, that is at the level of thejati in the village.
The OLS results are shown in table 5. As expected, the relationship between application forreserved jobs and having a pradhan of the same jati is positive and significant (column 1). But thiscorrelation may be driven by unobservables, so columns 2 to 5 test the robustness of the relationby controlling for additional factors. Column 2 controls for jati dummies to take into accountunobservables at the jati level. Column 3 additionally controls for jati characteristics at the villagelevel.13 Column 4 adds an interaction term between caste and district to take into account caste
13The control variables for jatis at the village level are the mean age of households head in the jati, their meaneducation level, the mean household size, the mean land owned by the jati in the village and the total number ofhouseholds in the jati in the village.
14

unobservables at the district level. As there is variation among households from the same caste,it is also possible to add an interaction term between caste and village to take into account casteunobservables at the village level (column 5), in which case the impact is solely estimated fromwithin caste in the village variation. In all the specifications, having a pradhan from the same jati ispositively correlated with applications for reserved jobs. The coefficient on the jati of the pradhanis quite stable, between 0.04 and 0.06. Finally, if the impact of the pradhan only goes through jatinetworks, we also expect that having a pradhan from the same caste group but a different jati willhave no impact. Column 7 shows the results. The coefficient is not significantly different fromzero, showing that the increase in low castes applications for reserved jobs when the pradhan isalso a low caste is fully driven by an increase among households from the same jati.
The relationship between having a pradhan from the same jati and application for reservedjobs is robust to the addition of controls, and the magnitude of the impact is bigger than whenthe impact is estimated at the caste level. Moreover, once various demographic and geographicalcharacteristics are accounted for, having a pradhan from the same caste but not from the samejati is not significantly correlated with application for reserved jobs. These results are consistentwith the hypothesis that the impact measured in tables 3 and 4 is an intra-jati effect. However,having a pradhan from the same jati may be correlated with characteristics of the jati in the villagethat cannot be observed and controlled for. So the coefficient in table 5 may not be consistentlyestimated by OLS. Therefore, the impact is now estimated using instrumental variables based onthe political reservation status of the village. The first stage is as follows:
E jcv = π0 +π1Xh jcv +π2RESERVcv +π3(RESERVcv ×PROPjcv)+π4PROPjcv +φ j +ρv +ψh jcv
(3)The second stage is:
Yh jcv = λ0 +λ1Xh jcv +λ2E jcv +λ3PROPjcv +Φ j +wv + vh jcv (4)
The variable of interest, E jcv is instrumented with two instruments. The first instrument is a dummyvariable (RESERVcv) which indicates if there is political reservation for the caste group from whichthe household is from. Namely, the variable is equal to 1 if the household is OBC and the seat ofpradhan is reserved for OBC and similarly for SC and ST. As seen in section 4.1, the fact that thereis political reservation for a specific caste group in the electoral term that is considered here maynot be independent of caste level characteristics in village and in the block. However, becauseeach caste group in a village is composed of several jatis, political reservations are not likely to becorrelated with jati level characteristics in the village. It is therefore a valid instrument for E jcv
and is expected to have a positive impact on E jcv.
15

The second instrument is the interaction of the reservation status of the caste group with the pro-portion of households that the jati represents in the village (RESERVcv ×PROPjcv).14 Householdsfrom jatis that belong to a caste for whom the seat of pradhan is reserved (i.e. RESERVcv = 1),have a probability of having a member of their jati as pradhan that increases with the populationstrength of their jati in the village, because population strength increases the probability of beingelected. RESERVcv×PROPjcv is therefore also expected to have a positive impact on the probabil-ity of having a pradhan from the same jati. Because in itself the jati’s population may also impactthe probability of applying for reserved jobs, I control for PROPjcv in both stages. The secondstage is similar to the OLS specification, but the impact of having a pradhan from the same jati isestimated with its predicted value E jcv. Standard errors are clustered at the level of the caste in thevillage.
Table 6: IV estimation of the impact of having a pradhan from the same jati
Dependant variable Application for reserved jobs
(1) (2) (3) (4) (5) (6)First stage Sec. stage First stage Sec. stage First stage Sec. stage
Same jati Pradhan 0.0645*** 0.0587*** 0.0435**(0.0174) (0.0183) (0.0180)
Same caste reserv 0.164** 0.172** 0.215**(0.0809) (0.0794) (0.0878)
Prop jati × 1.072*** 1.024*** 1.025***Same caste reserv (0.317) (0.317) (0.340)
Prop jati -0.205 -0.0674*** -0.0670 -0.0965*** 0.367 -0.0234(0.227) (0.0252) (0.254) (0.0318) (0.310) (0.0338)
Jati dummies Yes Yes Yes Yes Yes YesVillage dummies Yes Yes Yes Yes Yes YesHH controls Yes Yes Yes Yes Yes YesJati in the vill. controls No No Yes Yes Yes YesOBC × District dummies No No No No Yes YesObservations 12319 12319 12319 12319 11413 11413r2 0.355 0.011 0.374 0.012 0.552 0.015Instruments F-test 16.00 15.94 17.98Hansen J-test (p-value) 0.189 0.152 0.148
* p < 0.1, ** p < 0.05, *** p < 0.01. Robust standard errors are corrected for clustering at the level ofthe caste in the village. The sample only uses households from jatis present in at least two villages. Incolumns 5 and 6 the sample is further restricted to districts where there are at least two villages.
Results are shown in table 6. The table shows three different specifications, where I allow thecontrols to vary. In columns 1 and 2 the only controls are household level controls, jati dummies
14PROPjcv is the number of households from the same jati in the village divided by the total number of householdsin the village.
16

and village dummies. Column 3 and 4 additionally control for jati in the village variables and incolumn 5 and 6 an interaction term between OBC and district is added. In the three first stages,the two instruments have a strong and positive impact on the probability that the household hasa pradhan from the same jati. The p-value of the Hansen J-statistics also shows that the validityof the overidentifying restriction of the instruments cannot be rejected. Looking at the secondstages, having a pradhan from the same jati has a significantly positive impact on the probabilityof applying for reserved jobs in the three specifications. The impact is quite large, with an increaseof application for reserved jobs between 4 and 7 percentage points, which is also similar to whatwas estimated in the OLS regressions.
4.3 What drives the impact?
The fact that having a pradhan from the same jati enhances application for reserved jobs can be dueto different factors. What inspired this paper is the idea that having a pradhan from the same jatimakes it easier to access reserved jobs because the pradhan has political connections that he usesto help households from his jati. But other channels might explain the impact. The pradhan mayincrease the self-confidence of his jati fellows by showing that a low caste individual is able to holda prestigious position. Or it can be simply related to information sharing. Having someone fromthe jati in a position with easier access to information may in practice help to apply for reservedjobs. In this section, I discuss these three channels and provide evidence that the help to accessState institutions is the channel that is supported by the data.
4.3.1 “Patronage democracy”
The first channel that I am exploring in this section is the one where the pradhan acts as an inter-mediary to help his jati fellows to get access to reserved jobs. Political science and anthropologicalliteratures have emphasized that politicians in India have great power over the distribution of re-sources because they control the bureaucracy (for a more detailed description of the phenomenon,see Chandra, 2004). This “patronage” system makes it complicated for poor people without con-nections to access State resources. Consequently, in rural India, there is an extensive usage ofintermediaries (Manor, 2000; Witsoe, 2012). The pradhan plays an important role in this interme-diation. Dunning and Nilekani (2013), in a survey of 512 villages in three Indian States (Karnataka,Rajasthan and Bihar), asked “to whom a hypothetical citizen would most likely turn for help gettingaccess to a government benefit or service”. 73% of the respondents answered the council president.They were also asked “who has the most power to provide access to the desired service”. To thisquestion 43% identified the council president.
However, there may be a discrepancy between what individuals believe the pradhan can do
17
and what he can do in practice. Indeed, the pradhan can only help his jati fellows to get reservedjobs in the administration if he is himself well connected. While high castes are historically wellconnected to the State and the political sphere, for low castes accessing power at a very local levelit may not be the case. One way pradhans get access to higher levels of bureaucracy is throughpolitical parties. Political parties get involved in pradhans’ elections by financing their campaigns.In my sample, 2/3 of the pradhans currently in office have been financially supported for theircampaigns by a political party. The proportion is the same for SC, ST and OBC pradhans.
Table 7: Party support and reserved jobs application
Dependant variable: Application for reserved jobs
(1) (2) (3) (4)Estimation method: OLS OLS OLS IVOBC reserv × -0.0465*OBC (0.0269)
OBC reserv × 0.0816***Party × OBC (0.0271)
Same jati Pradhan -0.00235 -0.0154 -0.0280(0.0112) (0.0217) (0.0281)
Same jati Pradhan 0.0752** 0.0901*** 0.101***× Party (0.0296) (0.0200) (0.0253)
HH controls Yes Yes Yes YesVillage dummies Yes Yes Yes YesOBC × Party Yes No No NoCaste in the vill. controls Yes No No NoJati in the vill controls No No Yes YesJati dummies No No Yes YesObservations 13198 13198 12319 12319r2 0.061 0.064 0.088 0.013
* p < 0.1, ** p < 0.05, *** p < 0.01. Robust standard errors are cor-rected for clustering at the caste (column 1), jati (columns 2 and 3) inthe village level or caste at the village level (column 4). The sample incolumns 3 and 4 only uses households from jatis present in at least twovillages.
I test the hypothesis that the positive impact of having a pradhan from the same jati is due tothe pradhan helping households to get access to the State by looking at whether the impact differsacross pradhans financed by political parties and other pradhans. Namely, I interact the variable ofinterest with a dummy variable equal to one if the pradhan’s campaign was financed by a politicalparty and zero otherwise. If the impact is due to patronage, then we expect the interaction term to bepositive and significant. Table 7 shows the results for different specifications. Column 1 reproducesthe results of the caste-level estimation in OLS; columns 2 and 3 show the OLS estimation of the
18

jati-level estimation, and column 4 shows the IV estimation of the jati-level estimation.15 In thefour specifications the results are similar: the pradhan only has a positive impact on applicationfor reserved jobs when his campaign was financed by a political party. In column 1 the impactseems negative for villages with OBC pradhan that were not supported by a political party, butthis result is not robust when looking at the jati level specification. So it is only when the pradhanis connected to a political party that OBC are more likely to apply for reserved jobs. This resultstrongly supports the hypothesis of households being more likely to apply for reserved jobs whenthey know that their pradhan can actually help them get the job.
But one can also think about other channels playing a role in the impact. In the two followingsubsections I question the channels of self-confidence and of information sharing.
4.3.2 An increase in self-confidence?
Another reason why pradhans would enhance applications for reserved jobs is self-confidence.Having a pradhan from the same caste group may change the belief of what individuals think theycan achieve and in particular what they can achieve professionally.
Psychology literature underlines that social identity impacts performance because people tendto behave according to stereotypes. In the context of India Hoff and Pandey (2006) show that lowcaste students perform less well when their caste is made salient than when they are anonymous. Itis therefore possible that low castes negatively self-select themselves by not applying to reservedjobs because they think they cannot get them, and that low castes pradhans offset this negativeself-selection by serving as role models.
There is indeed evidence that stereotypes in India are changing and that political reservationshave a long lasting impact on the way people consider discriminated groups and on the way theyconsider themselves. Bhavnani (2009) and Beaman et al. (2009) show that quotas for women inGram Panchayats change the probability that they run for office in unreserved panchayat and thatthey are elected. Similarly, reported crimes against women in India have increased with the imple-mentation of reservations for women in Gram Panchayats, because the police is more willing torecord those crimes, but also because women feel more confident to report them (Iyer et al., 2012).Beaman et al. (2012) show that political reservations for women increase educational aspirationsfor parents and girls. Chauchard (2014) provides evidence that having experienced a low castepradhan diminishes discrimination against low castes in the village, and that this is partly due toa change in how their social status is perceived. He further underlines that the way they evaluatetheir own social status is positively changed.
15In the IV specification, both the “same jati pradhan” variable and the interaction term are instrumented. Thestrategy used is the one recommended by Angrist and Pischke (2008). More details are provided in the appendix aswell as the two first-stage estimation results.
19

Table 8: The self-confidence channel
Dependant variable: Discrimination App job reserv
(1) (2) (3) (4)Estimation method: OLS OLS IV OLSOBC reserv × -0.0371 0.0216**OBC (0.0268) (0.00872)
Same jati Pradhan -0.0130 -0.0528(0.0216) (0.0449)
OBC prev Reserv -0.0271**× OBC (0.0121)
HH controls Yes Yes Yes YesVillage dummies Yes Yes Yes YesCaste in the vill. controls Yes No No YesJati in the vill controls No Yes Yes NoJati dummies No Yes Yes NoObservations 13198 12319 12319 13198r2 0.207 0.214 0.003 0.061
* p < 0.1, ** p < 0.05, *** p < 0.01. Robust standard errors are correctedfor clustering at the caste (columns 1, 3 and 4) and jati (column 2) at the vil-lage level. The sample in columns 3 and 4 only has jatis present in at leasttwo villages. The dependent variable in columns 1 to 3 is a dummy variableequal to one if a member of the household has suffered from discriminationwhile seeking jobs or has been prevented from entering a street in the villageor a place of worship because of her/his caste.
However, several results in this paper do not support the interpretation of the positive impactof having someone from the same jati/caste as pradhan as a “confidence impact”. First, as it wasshown in table 3 before, the impact is restricted to the OBC and not SC and ST. Whereas we wouldexpect that the role model channel has principally an impact on castes at the very bottom of thehierarchy, SC-ST pradhans do not have an impact on the application rate for reserved jobs of theircaste fellows. In columns 1, 2 and 3 of table 8, I also provide evidence that political reservations didnot seem to have changed the way OBC feel discriminated.16 Finally, column 4 in table 8 studiesthe impact of previous reservations in elections for OBC. If the increased probability of applyingfor reserved jobs is due to an increased self-confidence, then we would expect the effect to last.However, the impact of previous political reservations is negative. This result underlines that theimpact of having an OBC pradhan increases the application rate of OBC during the electoral term,but decreases it afterwards. It shows that the impact is related to the pradhan being currently in
16Households were asked if they have been discriminated against because of their caste while seeking job, or if theyhave been prevented from entering any street or place of worship within the village. The discrimination variable is adummy variable equal to one if they answered yes to at least one of these questions.
20

power, which is coherent with a patronage effect where the pradhan can help when he is in powerbut is powerless afterwards. Under this interpretation, households that had a pradhan from thesame caste in the previous electoral term apply less to reserved jobs in the current electoral term,because they applied in the previous electoral term when they had a pradhan from their caste inpower.
4.3.3 The information channel
The positive impact of having a pradhan from the same caste/jati may also come from a transfer ofinformation from the pradhan to his network. Applying for reserved jobs is a complicated process.It requires to know how to get a “caste certificate”, which proves the caste identity of the applicant,and how to apply for quotas. The pradhan, because he is connected outside the village, may be asource of information for his caste/jati.
Table 9: The information channel
Dependant variable: Appl. for reserv. seats in school Appl. for reserved jobs
(1) (2) (3) (4) (5) (6)Estimation method: OLS OLS IV OLS OLS IVOBC reserv × 0.0301 0.0495***OBC (0.0227) (0.0153)
OBC reserv × -0.00526**OBC × Years of schooling (0.00264)
OBC × Years 0.00316of schooling (0.00226)
Same jati Pradhan 0.00527 0.0253 0.0674*** 0.0546**(0.0196) (0.0381) (0.0166) (0.0219)
Same jati Pradhan -0.00336** 0.000440× Years of schooling (0.00163) (0.00257)
HH controls Yes Yes Yes Yes Yes YesVillage dummies Yes Yes Yes Yes Yes YesCaste in the vill. controls Yes No No Yes No NoJati in the vill controls No Yes Yes No Yes YesJati dummies No Yes Yes No Yes YesObservations 13198 12319 12319 13198 12319 12319r2 0.299 0.329 0.006 0.062 0.088 0.012
* p < 0.1, ** p < 0.05, *** p < 0.01. Robust standard errors are corrected for clustering at the caste(columns 1, 3 and 4) and jati (column 2) at the village level. The sample in columns 3 and 4 onlyhas jatis present in at least two villages. The dependent variable in columns 1 to 3 is a dummy vari-able equal to one if a member of the household has suffered from discrimination while seeking jobsor has been prevented from entering a street in the village or a place of worship because of her/hiscaste.
21

But again, several results do not support the information channel as being the main channeldriving the impact. First of all, if the pradhan is a source of information for his network andthis is what increases the application to reserved jobs, then we expect that the same happens toapplication to reserved seats in schools.17 Applying for reserved seats in schools also requires acaste certificate, as well as a knowledge of the procedure. The only way in which application forreserved jobs and application for reserved seats in schools differ is through the admission process.Whereas access to reserved seats in schools is given through an anonymous competitive exam, theprocess to get a reserved job is discretionary. Table 9 shows the results of the same regression butthe dependent variable is now application to reserved seats in schools. As we can see in columns1 to 3, there is no impact of having a pradhan from the same jati/caste on application for reservedseats in schools. Therefore, the impact of having a pradhan from the same jati on application forreserved jobs does not seem to come from a better access to information. One additional argumentis that access to information is related to education (see for example Foster and Rosenzweig, 1995,for India). If the information channel is driving the impact, we expect that the impact of the pradhandecreases with the education level of the household’s head. The rationale behind the second point isthat the amount of information required from the pradhan should decrease with education, becauseeducated households already have good access to information. Columns 3 to 6 in table 9 showthe results of interacting the education level of the household’s head with the variable of interest.Here the results are more ambiguous: the impact of having a pradhan from the same caste for OBCseems to diminish with the education level of the household’s head (column 4). But this result isnot robust when I only consider households from the same jati as the pradhan: the interaction termis significant in column 5 but not in column 6.
5 Conclusion
The central empirical finding in this paper is that sharing the ethnic group (jati) of the villagecouncil president increases households’ propensity of applying for reserved jobs in the publicsector. The use of the electoral quota system, which determines the caste group of the councilpresident, along with several specification robustness checks allow me to rule out that the relationis driven by caste or jatis’ specific unobservables. The interpretation that is the most consistent withthe data is that it is due to a “patronage” system, where the council president helps the members ofhis jati to access reserved jobs in the public sector. Further data analysis for alternative explanationssuggests that improved self-confidence or information sharing do not constitute a channel.
These findings have important policy implications. Although India is the country with thelargest affirmative action program, many countries implement quotas for discriminated groups.
17Low castes also benefit from quotas in higher education institutions.
22

One conclusion from this paper is that the implementation conditions matter a lot for the successof affirmative action. In this specific context, the fact that the hiring process is discretionary andthat politicians have important power over bureaucrats does not provide equal opportunities ofaccess to every eligible people. In practice, the reservation policy in the public sector is morebeneficial to already connected people (who supposedly need less help) than to the very poor. Theway this policy is implemented seems to have consequences conflicting with the original purposesof affirmative action policies.
Acknowledgements
I am grateful for very useful comments from Kaivan Munshi, Liam Wren Luis, Flore Gubert andCatherine Bros. I also thank participants from seminars at Paris 1 Pantheon Sorbonne University,Catholic University of Louvain and from conferences at Cambridge University and University Col-lege London. I acknowledge support for this research from the European Research Council underthe European Union’s Seventh Framework Programme (FP7/2007-2013) / ERC grant agreement269831 and the French Ministry of Education.
23

Appendix A
Table 10: Conditional differences in means across reservation status
SC ST OBCPanel A:Conditional on village dummiesAge -0.90 (-0.93) 0.36 (0.36) 0.01 (0.05)Sex -0.00 (-0.13) 0.01 (0.41) -0.00 (-0.31)Years of educ -0.36 (-1.08) 0.06 (0.18) -0.22** (-2.27)HH size 0.10 (0.60) 0.07 (0.40) 0.04 (0.75)Land -0.33 (-0.40) -0.31 (-1.45) -0.13 (-0.74)Agr activity 0.04 (1.51) 0.05** (2.16) -0.01 (-1.06)
Panel B:Conditional on village dummies & OBC × district dummiesAge -0.96 (-0.99) 0.06 (0.06) -0.03 (-0.10)Sex -0.01 (-0.24) 0.00 (0.16) 0.00 (0.08)Years of educ -0.22 (-0.68) 0.36 (1.21) -0.04 (-0.37)HH size 0.16 (0.94) 0.12 (0.63) 0.02 (0.43)Land -0.10 (-0.12) -0.25 (-1.18) -0.05 (-0.29)Agr activity 0.04 (1.42) 0.03 (1.48) -0.00 (-0.41)
Observations 3394 837 8015
* p < 0.1, ** p < 0.05, *** p < 0.01. The table compares the meansof various household level variables across villages with differentreservation status for the position of pradhan, once controlling forvillage dummies (panel A) and OBC × district dummies (panel B).For example, column 1 compares variables means in villages wherethe pradhan position is reserved for SC with variables means in vil-lages where the pradhan is not reserved for SC. t statistics are inparentheses.
24

Appendix B
The strategy to instrument the variable “Having a pradhan of the same jati” and its interactionwith the variable indicating if the pradhan’s campaign was financed by a political party in section4.3.1 or with education in section 4.3.3 follows the suggestion in Angrist and Pischke (2008). Iprovide hereafter the details for the estimation in section 4.3.1, but the strategy is exactly the samein section 4.3.3. I first estimate
E jcv = π0 +π1Xh jcv +π2RESERVcv +π3(RESERVcv ×PROPjcv)+π4PROPjcv +φ j +ρv +ψh jcv
(5)as in section 4.2. I then use the predicted value, E jcv from (5), and its interaction with the dummyindicating if the campaign was financed by a political party PARTYv×E jcv as instruments in the twofirst-stage estimations of E jcv and PARTYv ×E jcv respectively (6) and (7) below, in a conventional2SLS procedure.
E jcv = δ0 +δ1Xh jcv +δ2E jcv +δ3PARTYv × E jcv +δ4PROPjcv + γ j +ηv + ιh jcv (6)
PARTYv ×E jcv = ε0 + ε1Xh jcv + ε2E jcv + ε3PARTYv × E jcv + ε4PROPjcv +κ j +µv +νh jcv (7)
γ j and κ j are jati dummies, ηv and µv are village dummies and ιh jcv and νh jcv are error terms.The estimation results of equations (6) and (7), as well as the first-stage estimations for the IVestimation in section 4.3.3 are reported in table 11. The estimation of (5) is not reported because itis the same as in table 6.
25

Table 11: First-stage estimations
First-stages table 7 First-stages table 9
(1) (2) (3) (4)E jcv PARTYjcv ×E jcv E jcv educh jcv ×E jcv
E jcv 0.969*** 0.159 1.002*** 1.110(0.196) (0.126) (0.178) (0.994)
PARTYjcv × E jcv 0.0543 0.889***(0.130) (0.0873)
educh jcv × E jcv 0.00192 0.730***(0.00119) (0.0732)
HH controls Yes Yes Yes YesVillage dummies Yes Yes Yes YesJati dummies Yes Yes Yes YesJati in the vill controls Yes Yes Yes YesObservations 12319 12319 12319 12319r2 0.375 0.574 0.374 0.610
* p < 0.1, ** p < 0.05, *** p < 0.01. Robust standard errors are corrected for clus-tering at caste at the village level. The sample only uses households from jatispresent in at least two villages.
26

References
Angrist, Joshua D and Jorn-Steffen Pischke, Mostly harmless econometrics: An empiricist’s
companion, Princeton University Press, 2008.
Beaman, Lori, Esther Duflo, Rohini Pande, and Petia Topalova, “Female leadership raisesaspirations and educational attainment for girls: A policy experiment in India,” Science, 2012,335 (6068), 582–586.
, Raghabendra Chattopadhyay, Esther Duflo, Rohini Pande, and Petia Topalova, “Powerfulwomen: does exposure reduce bias?,” Quarterly Journal of Economics, 2009, 124 (4), 1497–1540.
Besley, Timothy, Rohini Pande, Lupin Rahman, and Vijayendra Rao, “The politics of publicgood provision: Evidence from Indian local governments,” Journal of the European Economic
Association, 2004, 2 (2-3), 416–426.
Bhavnani, Rikhil R, “Do electoral quotas work after they are withdrawn? Evidence from a naturalexperiment in India,” American Political Science Review, 2009, 103 (1), 23–35.
Chandra, Kanchan, Why ethnic parties succeed: Patronage and ethnic head counts in India,Cambridge University Press, 2004.
Chattopadhyay, Raghabendra and Esther Duflo, “Women as policy makers: Evidence from arandomized policy experiment in India,” Econometrica, 2004, 72 (5), 1409–1443.
Chauchard, Simon, “Can Descriptive Representation Change Beliefs about a Stigmatized Group?Evidence from Rural India,” American Political Science Review, 5 2014, 108, 403–422.
Damodaran, Harish, India’s new capitalists: Caste, business, and industry in a modern nation,Palgrave Macmillan, 2008.
Dunning, Thad, “Do quotas promote ethnic solidarity? Field and natural experimental evidencefrom India,” working paper, Yale University 2010.
and Janhavi Nilekani, “Ethnic Quotas and Political Mobilization: Caste, Parties, and Distri-bution in Indian Village Councils,” American Political Science Review, 2013, pp. 1–22.
Foster, Andrew D and Mark R Rosenzweig, “Learning by Doing and Learning from Others:Human Capital and Technical Change in Agriculture,” Journal of Political Economy, 1995, 103
(6), 1176–1209.
27

Ghani, Ejaz, William R. Kerr, and Stephen D. O’Connell, “Political reservations and women’sentrepreneurship in India,” Journal of Development Economics, 2014, 108, 138 – 153.
Hoff, Karla and Priyanka Pandey, “Discrimination, Social Identity, and Durable Inequalities,”American Economic Review, September 2006, 96 (2), 206–211.
Iyer, Lakshmi, Anandi Mani, Prachi Mishra, and Petia Topalova, “The power of politicalvoice: women’s political representation and crime in India,” American Economic Journal: Ap-
plied Economics, 2012, 4 (4), 165–193.
and , “Traveling agents: political change and bureaucratic turnover in India,” Review of
Economics and Statistics, 2012, 94 (3), 723–739.
Jaffrelot, Christophe, Religion, Caste, and Politics in India, Columbia University Press, 2011.
Manor, James, “Small-Time Political Fixers in India’s States: “Towel over Armpit”,” Asian Sur-
vey, 2000, 40 (5), 816–835.
Markussen, Thomas and Finn Tarp, “Political connections and land-related investment in ruralVietnam,” Journal of Development Economics, 2014, 110, 291 – 302. Land and Property Rights.
Mu, Ren and Xiaobo Zhang, “Do elected leaders in a limited democracy have real power? Evi-dence from rural China,” Journal of Development Economics, 2014, 107, 17 – 27.
Munshi, Kaivan, “Strength in numbers: Networks as a solution to occupational traps,” The Review
of Economic Studies, 2011, 78 (3), 1069–1101.
and Mark Rosenzweig, “Networks, Commitment, and Competence: Caste in Indian LocalPolitics,” Technical Report, National Bureau of Economic Research 2013.
and , “Networks and Misallocation: Insurance, Migration, and the Rural-Urban Wage Gap,”Working Paper 2015.
Pande, Rohini, “Can mandated political representation increase policy influence for disadvantagedminorities? Theory and evidence from India,” The American Economic Review, 2003, 93 (4),1132–1151.
Witsoe, Jeffrey, “Everyday Corruption and the Political Mediation of the Indian State,” Economic
& Political Weekly, 2012, 47 (6), 47.
28