application intelligence report - … · — or air — is a global research project that examines...
TRANSCRIPT

Analyzing the Relationship Between Human Behavior, Security and the Applications that Drive Us
APPLICATIONINTELLIGENCE REPORT

APPLICATION INTELLIGENCE REPORT
www.a10networks.com 2
Disclaimer This document does not create any express or implied warranty about A10 Networks or about its products or services, including but not limited to fitness for a particular use and non infringement. A10 Networks has made reasonable efforts to verify that the information contained herein is accurate, but A10 Networks assumes no responsibility for its use. All information is provided “as-is.” The product specifications and features described in this publication are based on the latest information available; however, specifications are subject to change without notice, and certain features may not be available upon initial product release. Contact A10 Networks for current information regarding its products or services. A10 Networks’ products and services are subject to A10 Networks’ standard terms and conditions.
FOREWORD ......................................................................................................................................3
THE APP-BLENDED LIFE ..................................................................................................................4
THE NEW DIGITAL OXYGEN ..............................................................................................................6‘I Can’t Live Without Apps’ ................................................................................................................................................6
Are Apps a Basic Human Necessity? .............................................................................................................................7
Type Versus Talk ................................................................................................................................................................9
The Naked Truth .............................................................................................................................................................. 11
SECURITY AWARENESS .................................................................................................................13Security A Thought, But Only at First .......................................................................................................................... 13
Prioritizing Application Security ................................................................................................................................... 15
Perception: ‘Someone Else Will Protect Me’ .............................................................................................................. 16
Which Devices Are Safest? ............................................................................................................................................ 17
Leave Your House Unlocked? Or Your Phone? .......................................................................................................... 18
The Weakest Link: Mobile Phones or IoT Devices? .................................................................................................. 20
THE MODERN-LIFE CRISIS .............................................................................................................22Identity Theft - The New Normal? ................................................................................................................................ 22
Hacked, Lost and Stolen ................................................................................................................................................ 24
Physical to Digital ............................................................................................................................................................ 26
What’s the Password? .................................................................................................................................................... 27
DEVICE PREFERENCES ..................................................................................................................29Understanding Employee Preferences ....................................................................................................................... 29
In the Event of Emergency ........................................................................................................................................... 31
PATH TO A STRONGER, FASTER AND SAFER ENTERPRISE ...........................................................32For Business Leaders ..................................................................................................................................................... 33
For IT & Security Leaders ............................................................................................................................................... 34
METHODOLOGY .............................................................................................................................35
TABLE OF CONTENTS

APPLICATION INTELLIGENCE REPORT
www.a10networks.com 3
The A10 Application Intelligence Report — or AIR — is a global research project that
examines the use of apps, behavioral implications
on personal security, and the potential effect on
corporate security as employee tendencies occur
within the work environment.
Commissioned by A10 Networks, the research for
AIR was conducted independently by strategic
research firm Provoke Insights. More than 2,000
full-time professionals and IT decision-makers
in 10 countries were surveyed, ranging from
companies of various sizes and industries.
At its core, AIR is an academic, objective
and socially aware initiative to further global
understanding of user tendencies and attitudes
toward application use and security.
This is raw data from real people.
FOREWORD

APPLICATION INTELLIGENCE REPORT
www.a10networks.com 4
For nearly a decade, the term application has been synonymous with software — addicting, useful and powerful — conveniently located on smartphones.
And while apps are typically accessed through connected devices, the term application applies to many types of software, services, tools and clients across a wide range of platforms, Internet of Things (IoT) devices, vehicles, appliances, electronics and more.
Apps are integral to the modern lifestyle. Imagine going a length of time without access to personal or work apps. We feel discomfort and are alarmingly uneasy without them.
To many, they’re considered as necessary as their wallet, keys or shoes — and as this study shows, maybe more so.
This is the app-blended life, where personal and work lives are no longer balanced and compartmentalized. We use personal apps at work, business apps at home, and many cross both thresholds.
But this digital bond introduces many dependencies, vulnerabilities and concerns for people, developers and businesses alike.
THE APP-BLENDED LIFE

APPLICATION INTELLIGENCE REPORT
www.a10networks.com 5
THREAT LANDSCAPE WILL GROW WITH IOT EXPLOSION Our reliance on apps will only continue to grow, particularly as IoT connectivity expands. By 2020, 11.6 billion mobile devices will be in use. By that same time, more than 20.7 billion IoT devices are expected across both consumer and enterprise spaces.
WORK AND PERSONAL LIVES CONNECTED Because of our connection to apps, there’s no longer a distinction between work and personal lives in the digital world. This introduces threats across work networks — whether employees connect in the office or via VPN from remote locations. SECURITY CONSIDERATIONS NOT ALIGNING WITH BEHAVIOR Time and time again, we analyzed data that indicated users are thinking about application security, but then their behavior (e.g., download it, use it, etc.) contradicted their intuition or intentions. This is a critical challenge for the enterprise.
AGE STILL A FACTOR But not how you may think. Sure, younger generations lead app-blended lives and are tied to their mobile devices. Likely a byproduct of unfamiliarity, older users are more cautious.
TOO MUCH TRUST AND FAMILIARITY Our reliance on apps and connectivity is fostering familiarity, from which builds unfounded trust and introduces apathy. Most users now lack diligence around security and their general app behavior. Not only are most users more careless, but they are also more accepting that they’ll be compromised. This exponentially introduces more risk to themselves, co-workers, friends and family. Employees are too trusting of the apps — often assuming someone else down the line has responsibly protected them.
BEHAVIOR IMPACTING ENTERPRISE SECURITY Based on global data about device preference, application use and security behavior, it’s clear that user behavior is affecting the enterprise’s ability to build and maintain an effective security posture. Threat actors consistently probe corporate networks for vulnerabilities in security devices, applications, user behavior, policy and more. The threats come via a variety of vectors all with similar goals in mind: compromise your network, steal data and damage your business.

The street is dark. You’re lost and on foot. Look to your phone — 2 percent remaining. No ride-sharing for you. Fifteen years ago, you hail a cab. You find a local restaurant to ask for help. You track down a payphone and call a friend. You locate a map.
Today? You’re without direction. Literally.
Granted, not all apps are smartphone-based, but the parallels to our reliance on applications of all types remain. This dependence is confirmed in our data.
More than four out of five respondents globally consider apps integral to their personal or business lives, with more than eight of 10 (86 percent) citing either “I cannot live without apps” or it would “be a struggle” to live without them.
The findings raise questions about how applications — for business and personal use alike — have evolved to the point where they are now part of our modern, “digital DNA.”
‘I CAN’T LIVE WITHOUT APPS’
THE NEW DIGITAL OXYGEN
APPLICATION INTELLIGENCE REPORT
www.a10networks.com 7
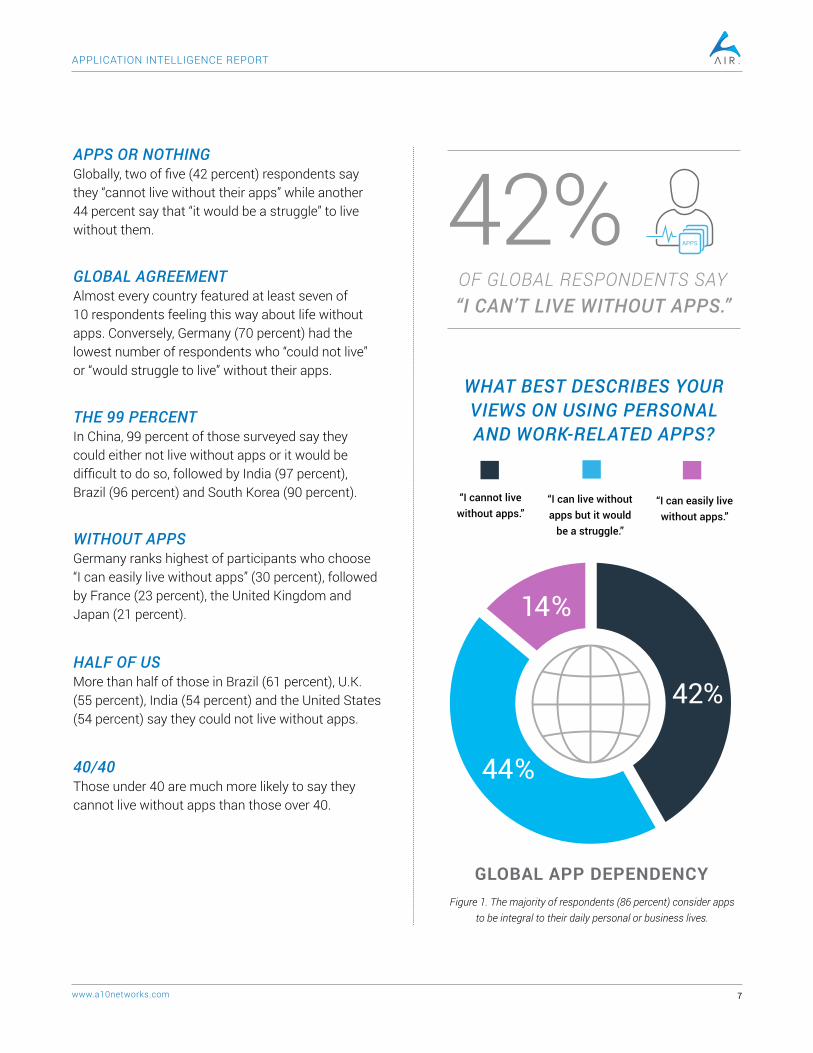
APPS OR NOTHING Globally, two of five (42 percent) respondents say they “cannot live without their apps” while another 44 percent say that “it would be a struggle” to live without them.
GLOBAL AGREEMENT Almost every country featured at least seven of 10 respondents feeling this way about life without apps. Conversely, Germany (70 percent) had the lowest number of respondents who “could not live” or “would struggle to live” without their apps.
THE 99 PERCENT In China, 99 percent of those surveyed say they could either not live without apps or it would be difficult to do so, followed by India (97 percent), Brazil (96 percent) and South Korea (90 percent).
WITHOUT APPS Germany ranks highest of participants who choose “I can easily live without apps” (30 percent), followed by France (23 percent), the United Kingdom and Japan (21 percent).
HALF OF US
More than half of those in Brazil (61 percent), U.K. (55 percent), India (54 percent) and the United States (54 percent) say they could not live without apps.
40/40
Those under 40 are much more likely to say they cannot live without apps than those over 40.
42% OF GLOBAL RESPONDENTS SAY “I CAN’T LIVE WITHOUT APPS.”
GLOBAL APP DEPENDENCY
“I cannot live without apps.”
“I can live without apps but it would
be a struggle.”
“I can easily live without apps.”
Figure 1. The majority of respondents (86 percent) consider apps to be integral to their daily personal or business lives.
42%
44%
14%
WHAT BEST DESCRIBES YOUR VIEWS ON USING PERSONAL AND WORK-RELATED APPS?
APPS

APPLICATION INTELLIGENCE REPORT
www.a10networks.com 8
Have you gone a day without water? Fasted for a night? Left home without your phone? For many, these scenarios are very much in the same category. The impact of apps on our lives, as a basic human resource, is not outlandish.
To truly understand the importance apps have in our lives, compare them to basic necessities.
Surprisingly, half of all global participants say apps are equally important — or almost as important — as breathing, eating and drinking. Responses did trend in certain regions, but overall the sentiment is globally consistent.
That begs the question, which oxygen is more vital: real oxygen or “digital oxygen?” Despite the hyperbole, to many, apps are that integral to daily lifestyles.
ARE APPS A BASIC HUMAN NECESSITY?
HALF OF ALL GLOBAL PARTICIPANTS SAY APPS ARE EQUALLY IMPORTANT, OR ALMOST AS IMPORTANT, AS BREATHING, EATING AND DRINKING.
APPS ARE CRITICAL At least two of three respondents in India (68 percent), South Korea (68 percent) and China (66 percent) claim apps to be as significant — or nearly so — as breathing, eating and drinking. EQUAL FOOTING Of those who believe apps are equally as important as breathing, eating and drinking, India (38 percent) ranks the highest, along with Brazil (33 percent) and China (31 percent).
GIVE US THE BASICS Meanwhile, Japan (26 percent), Germany (37 percent) and France (41 percent) claim to need apps the least when compared to other basic human necessities.
WISDOM WITH AGE Those over 40 are more likely to say that apps are not as important as breathing, eating and drinking.
THE NEW GENERATIONSHowever, younger respondents are more likely to say apps are equally as important.
50% APPS
APPLICATION INTELLIGENCE REPORT
www.a10networks.com 9
Not as ImportantEqually ImportantAlmost as Important
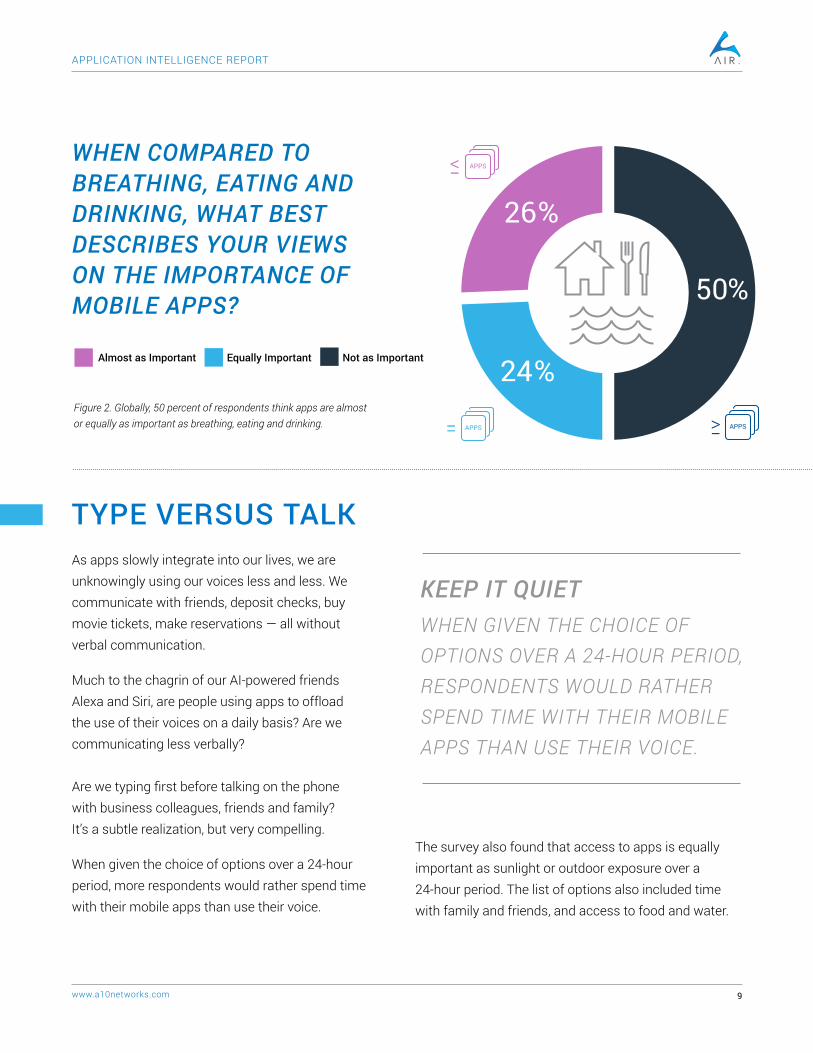
Figure 2. Globally, 50 percent of respondents think apps are almost or equally as important as breathing, eating and drinking.
As apps slowly integrate into our lives, we are unknowingly using our voices less and less. We communicate with friends, deposit checks, buy movie tickets, make reservations — all without verbal communication.
Much to the chagrin of our AI-powered friends Alexa and Siri, are people using apps to offload the use of their voices on a daily basis? Are we communicating less verbally? Are we typing first before talking on the phone with business colleagues, friends and family? It’s a subtle realization, but very compelling.
When given the choice of options over a 24-hour period, more respondents would rather spend time with their mobile apps than use their voice.
TYPE VERSUS TALK
KEEP IT QUIET WHEN GIVEN THE CHOICE OF OPTIONS OVER A 24-HOUR PERIOD, RESPONDENTS WOULD RATHER SPEND TIME WITH THEIR MOBILE APPS THAN USE THEIR VOICE.
50%
24%
26%
The survey also found that access to apps is equally important as sunlight or outdoor exposure over a 24-hour period. The list of options also included time with family and friends, and access to food and water.
WHEN COMPARED TO BREATHING, EATING AND DRINKING, WHAT BEST DESCRIBES YOUR VIEWS ON THE IMPORTANCE OF MOBILE APPS?
APPS
APPSAPPS

APPLICATION INTELLIGENCE REPORT
www.a10networks.com 10
FAMILY FIRST The option to spend time with family and friends scores highest (44 percent), along with access to food and water (30 percent).
CLOSE RACE What’s striking is the relatively low percentages of people who would choose nourishment and socialization with family and friends over apps. The differences are not resounding.
APPS AND WATER In India, access to apps (16 percent) almost scores higher than access to water (17 percent).
HIGH AND LOW Of the countries surveyed, access to apps scores highest in South Korea (19 percent), China (17 percent) and India (16 percent). Access to apps scores lowest in Japan (4 percent); France, Germany and the U.K. all had 6 percent.
OVERRATED APPS Only in four instances did app usage score lower than both using one’s voice or access to sunlight: France, Germany, U.K. and Japan.
AGE DIFFERENCES A small percentage of those over 40 choose the option to spend time with their apps over any of the other options — although more respondents older than 40 still choose to use apps over their voices.
Friends and Family
Food and Water
Access to Apps
Sunlight / Outdoors
Use of Voice
Figure 3. If only given one choice for the next 24 hours, 44 percent of respondents would choose time with a significant other, family and friends over food/water (30 percent), access to apps (10 percent), sunlight/outdoor exposure (10 percent) and the ability to use their voice (6 percent).
44%
30%
10%
10%6%
IN THE NEXT 24 HOURS, IF YOU WERE ONLY ALLOWED TO HAVE ACCESS TO ONE OF THE FOLLOWING, WHICH ONE WOULD YOU CHOOSE?
APPS
ESSENTIALS IN A 24-HOUR PERIOD

APPLICATION INTELLIGENCE REPORT
www.a10networks.com 11
When do you feel most vulnerable? Speaking in front of large groups? Lost? Divulging private details about your life? Exposed physically in some manner?
One can ask any number of hypothetical questions, but when people actually associate the loss of access to apps with private or personal discomfort, it’s telling.
Queries like these weren’t included to be wacky or funny — although, some of that did come through — but rather to test people’s sense of digital privacy and vulnerability against their physical boundaries.
Would you rather be more vulnerable in public physically or online? Naturally, everyone would experience some discomfort and embarrassment walking around in public with no pants. This is a stark baseline to measure the importance of apps and the devices that power them.
AIR findings reveal that smartphones and apps — as accessibility tools used in everyday life — are now a priority over wearing clothing. Close to half would rather dismiss insecurities about their bodies than reveal sensitive information on smartphones. They prefer to expose themselves physically than digitally.
It’s a modern transformation that would have been unheard of two decades ago.
THE NAKED TRUTH
ALMOST HALF OF RESPONDENTS WOULD RATHER LOSE THEIR PANTS OVER THEIR SMARTPHONE, CAR KEYS OR WALLET/PURSE.
46%
APPLICATION INTELLIGENCE REPORT
www.a10networks.com 12
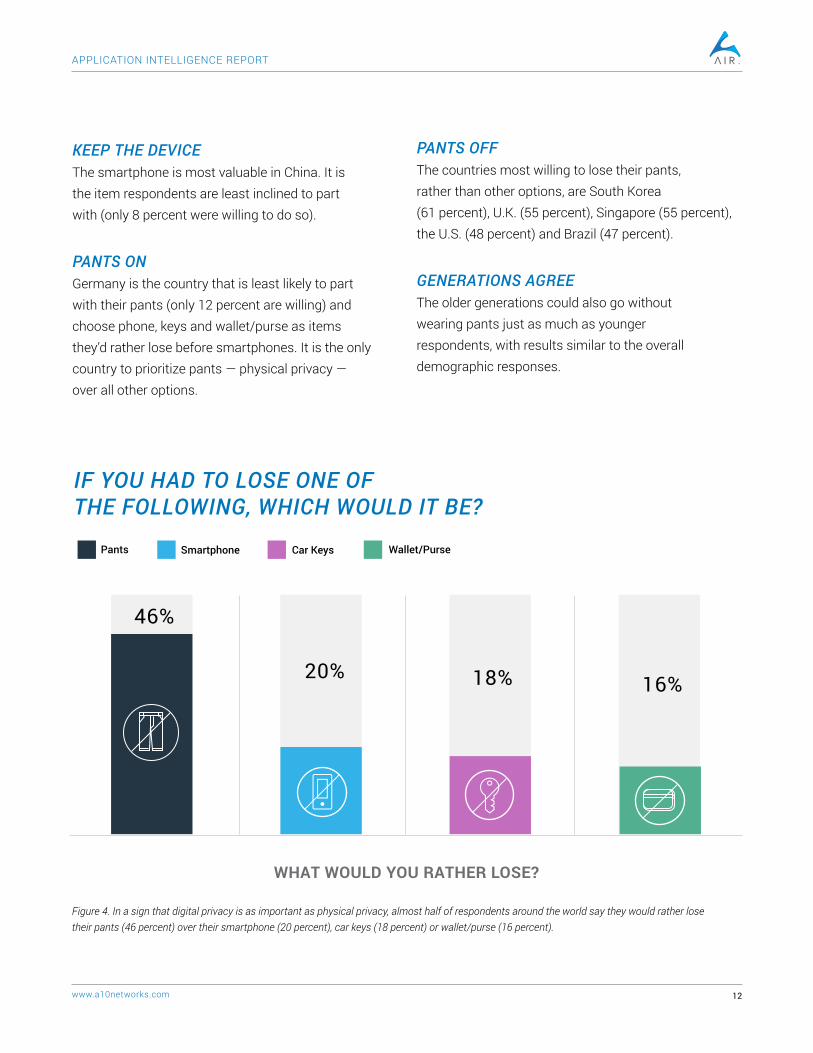
KEEP THE DEVICE The smartphone is most valuable in China. It is the item respondents are least inclined to part with (only 8 percent were willing to do so).
PANTS ON Germany is the country that is least likely to part with their pants (only 12 percent are willing) and choose phone, keys and wallet/purse as items they’d rather lose before smartphones. It is the only country to prioritize pants — physical privacy — over all other options.
PANTS OFF The countries most willing to lose their pants, rather than other options, are South Korea (61 percent), U.K. (55 percent), Singapore (55 percent), the U.S. (48 percent) and Brazil (47 percent).
GENERATIONS AGREE The older generations could also go without wearing pants just as much as younger respondents, with results similar to the overall demographic responses.
Pants Smartphone Car Keys Wallet/Purse
Figure 4. In a sign that digital privacy is as important as physical privacy, almost half of respondents around the world say they would rather lose their pants (46 percent) over their smartphone (20 percent), car keys (18 percent) or wallet/purse (16 percent).
WHAT WOULD YOU RATHER LOSE?
IF YOU HAD TO LOSE ONE OF THE FOLLOWING, WHICH WOULD IT BE?
46%
18%20% 16%

APPLICATION INTELLIGENCE REPORT
www.a10networks.com 13
This internal dialogue may sound familiar: “Is this app secure? Maybe? The reviews look good. Should I download it? I really want it, but ...”
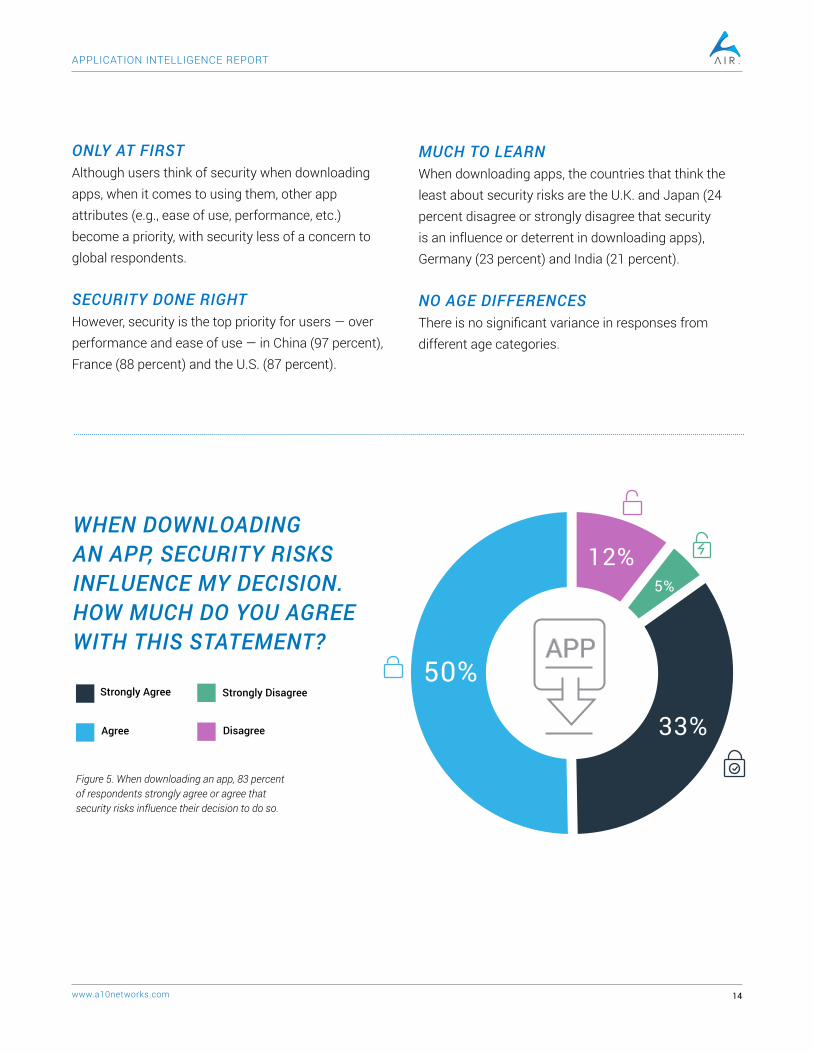
It’s a decision that’s made — knowingly or not — millions of times a day. We’re preconditioned to hand over personal information to developers without much more than app reviews and the trust of the device manufacturers that designed the OS. When downloading an app for work or personal use, more than four out of five (83 percent) either agree or strongly agree that security risks influence their decision to do so.
SECURITY A THOUGHT, BUT ONLY AT FIRST
SECURITY AWARENESS
Just under one out of five (17 percent) don’t think security is a concern at all when downloading apps.
In the lifecycle of apps, security is thought of more regularly when the user first downloads it, but becomes less of a thought from that point forward.
People still use apps even though they know or may think that they’re not always safe. And although users may claim they think about security, their intentions aren’t necessarily aligning with their behavior or actions.
APPLICATION INTELLIGENCE REPORT
www.a10networks.com 14
ONLY AT FIRST Although users think of security when downloading apps, when it comes to using them, other app attributes (e.g., ease of use, performance, etc.) become a priority, with security less of a concern to global respondents. SECURITY DONE RIGHT However, security is the top priority for users — over performance and ease of use — in China (97 percent), France (88 percent) and the U.S. (87 percent).
Figure 5. When downloading an app, 83 percent of respondents strongly agree or agree that security risks influence their decision to do so.
WHEN DOWNLOADING AN APP, SECURITY RISKS INFLUENCE MY DECISION. HOW MUCH DO YOU AGREE WITH THIS STATEMENT?
MUCH TO LEARN When downloading apps, the countries that think the least about security risks are the U.K. and Japan (24 percent disagree or strongly disagree that security is an influence or deterrent in downloading apps), Germany (23 percent) and India (21 percent). NO AGE DIFFERENCES There is no significant variance in responses from different age categories.
Strongly Agree
Agree Disagree
Strongly Disagree50%
33%
12%5%

APPLICATION INTELLIGENCE REPORT
www.a10networks.com 15
Based on data in the previous section, it appears that users are taking security seriously. That’s a good start.
However, once an app is downloaded, the priority of security falls below other attributes. Only one in four (24 percent) think of security as the most important attribute, ranking behind performance (32 percent) and ease of use (24 percent), but ahead of user interface (16 percent).
It is evident that security is not a top priority among respondents compared to the user experience. People are willing to accept the risks in deference to performance and ease of use.
This is a reality IT must contend with every day. Ultimately, if people are using personal apps with weak security — particularly in business or corporate environments — they become the lowest common denominator and a point of entry for threat actors. And if work apps have weaknesses, they become liabilities as well. Users simply can’t think about personal and work apps separately.
PRIORITIZING APPLICATION SECURITY
1/4ONLY ONE IN FOUR THINK SECURITY IS THE MOST IMPORTANT APP ATTRIBUTE, RANKING BEHIND PERFORMANCE AND EASE OF USE.
SAFER WITH AGE As people age, security becomes a larger concern when using apps.
AGES DIVIDED The 21-30 demographic scores lowest when ranking security as their top concern (19 percent). For respondents over 50, that number is nearly twice as high (34 percent).
SECURITY BEFORE DOWNLOADING Respondents from China (97 percent), followed by France (88 percent), U.S. (87 percent), Brazil (86 percent) and South Korea (84 percent) are the most conscientious when first downloading an app.
SECURITY DURING USE China (35 percent), Brazil (32 percent) and Japan (30 percent) rank security as the most important attribute when actually using an app.

APPLICATION INTELLIGENCE REPORT
www.a10networks.com 16
Figure 6. As users age, app security and ease of use are priorities. For younger respondents, performance is most important — and by a wide margin.
WHEN ACCESSING AN APP, WHICH ATTRIBUTE DO YOU CONSIDER MOST IMPORTANT?
Performance User InterfaceEase of Use Security
The app-blended life is never more apparent than when you contrast changing user behavior within both environments. Are users more cautious with work apps? More casual with personal apps? Do they care who designed or secured the app?
AIR found that employees think about security more with personal apps than business apps. That said, nearly half (47 percent) expect to be protected from cyberattacks by either their company or third-party app developers.
And even though they think app developers may not have security as their top priority — or have the proficiency to build secure apps at all — people still download apps and take their chances. It’s a risk for businesses and users alike.
BUSINESS IS SAFE Forty percent of employees are less concerned about security risks when using business apps as compared to personal apps.
NOT A PRIORITY More than two out of five (43 percent) AIR respondents do not believe security is the top priority for third-party app developers.
IN-HOUSE SKILL When it comes to their own company, only half (53 percent) of AIR respondents think their in-house app developers have the skills to build safe business apps for them.
PERCEPTION: ‘SOMEONE ELSE WILL PROTECT ME’
21 - 30 31 - 40 41 - 50 51+
50%
40%
30%
20%
10%
0
APP ATTRIBUTE IMPORTANCE BY AGE

APPLICATION INTELLIGENCE REPORT
www.a10networks.com 17
WHEN DO YOU THINK ABOUT SECURITY RISKS MORE?
When Using Both
When Using Personal Apps
When Using Business Apps
I Don’t Think About Security When Using Apps
Figure 7. Global respondents are less concerned about security risks when using business apps (17 percent) as compared to personal apps (32 percent). However, their low perceptions about the ability of both in-house and third-party developers are very similar.
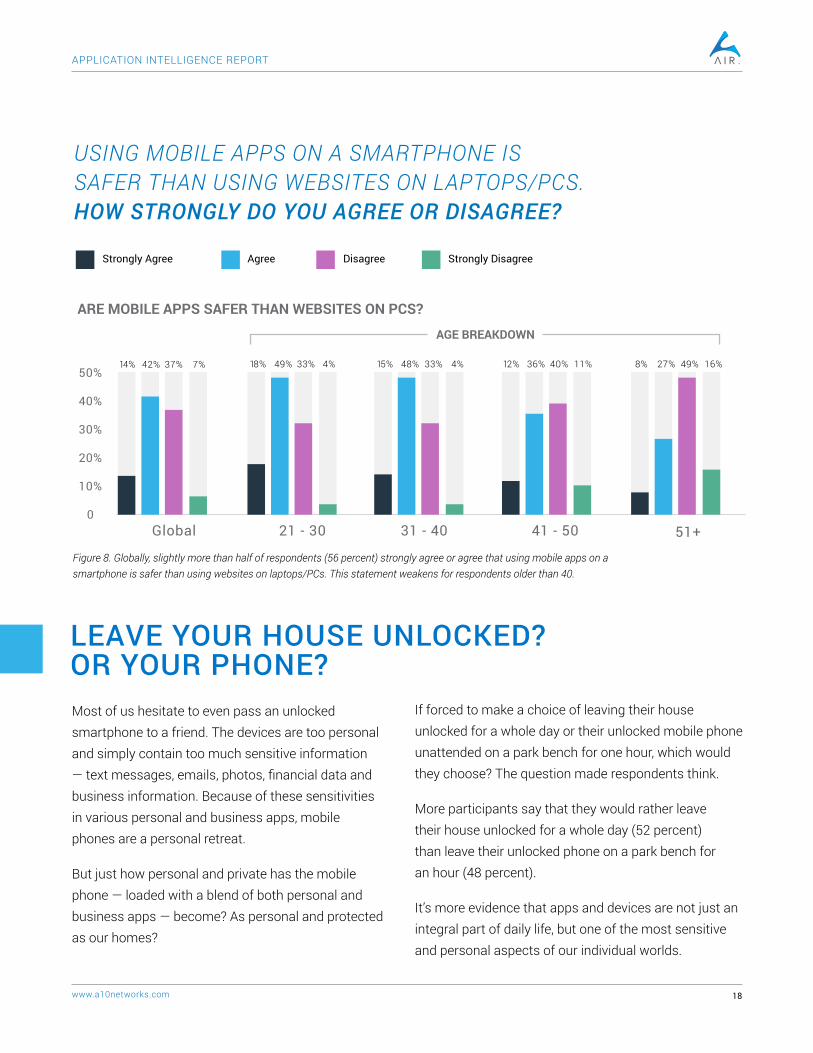
It’s largely believed that mobile devices are more secure than traditional desktops and laptop PCs. The former were designed in an era of connectivity and known cyberthreats, so they include more safeguards — vetting processes, sandboxed OS, secure elements, etc. — to defend against malware and other advanced threats (though they still have vulnerabilities).
Awareness of device security is largely split. Slightly more than half (56 percent) of respondents either agree or strongly agree that using mobile apps on a smartphone is safer than using websites on laptops/PCs.
Whatever device the individual uses most — whether a smartphone or laptop/PC — tends to be the device they think is safest. A false sense of security, perhaps?
TEAM PC Older generations show a much stronger preference toward laptops/PCs, with 65 percent believing those devices to be safer.
TEAM SMARTPHONE In the 21-30 age range, it’s almost the exact opposite — 67 percent of that group believes mobile phones are the safer device.
GEOGRAPHIC TRUST Brazil shows the strongest preference toward mobile device security, with 77 percent of respondents saying they believe mobile apps are safer than accessing websites on PCs, followed by India (76 percent) and the U.S. (63 percent).
UNSURE ABOUT MOBILE Japan (69 percent) and Germany (59 percent) show the largest beliefs that laptops/PCs are the more secure device.
WHICH DEVICES ARE SAFEST?
43%
8%
17%
32%
APPLICATION INTELLIGENCE REPORT
www.a10networks.com 18
Figure 8. Globally, slightly more than half of respondents (56 percent) strongly agree or agree that using mobile apps on a smartphone is safer than using websites on laptops/PCs. This statement weakens for respondents older than 40.
Most of us hesitate to even pass an unlocked smartphone to a friend. The devices are too personal and simply contain too much sensitive information — text messages, emails, photos, financial data and business information. Because of these sensitivities in various personal and business apps, mobile phones are a personal retreat.
But just how personal and private has the mobile phone — loaded with a blend of both personal and business apps — become? As personal and protected as our homes?
LEAVE YOUR HOUSE UNLOCKED? OR YOUR PHONE?
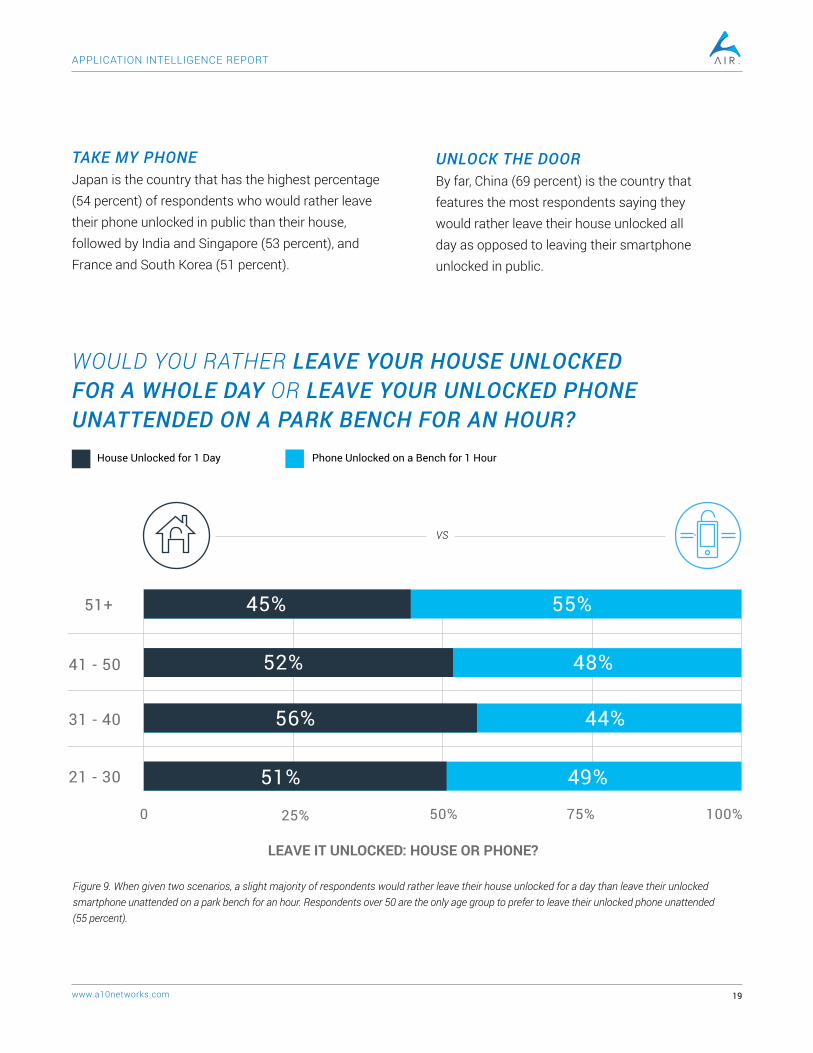
If forced to make a choice of leaving their house unlocked for a whole day or their unlocked mobile phone unattended on a park bench for one hour, which would they choose? The question made respondents think.
More participants say that they would rather leave their house unlocked for a whole day (52 percent) than leave their unlocked phone on a park bench for an hour (48 percent).
It’s more evidence that apps and devices are not just an integral part of daily life, but one of the most sensitive and personal aspects of our individual worlds.
USING MOBILE APPS ON A SMARTPHONE IS SAFER THAN USING WEBSITES ON LAPTOPS/PCS. HOW STRONGLY DO YOU AGREE OR DISAGREE?
Strongly Agree Strongly DisagreeAgree Disagree
21 - 30Global 31 - 40 41 - 50 51+
14% 18% 15% 12% 8%11%42% 37% 49% 48% 33%33% 4%4%7% 36% 40% 27% 49% 16%
ARE MOBILE APPS SAFER THAN WEBSITES ON PCS?
AGE BREAKDOWN
50%
40%
30%
20%
10%
0
APPLICATION INTELLIGENCE REPORT
www.a10networks.com 19
TAKE MY PHONE Japan is the country that has the highest percentage (54 percent) of respondents who would rather leave their phone unlocked in public than their house, followed by India and Singapore (53 percent), and France and South Korea (51 percent).
WOULD YOU RATHER LEAVE YOUR HOUSE UNLOCKED FOR A WHOLE DAY OR LEAVE YOUR UNLOCKED PHONE UNATTENDED ON A PARK BENCH FOR AN HOUR?
Figure 9. When given two scenarios, a slight majority of respondents would rather leave their house unlocked for a day than leave their unlocked smartphone unattended on a park bench for an hour. Respondents over 50 are the only age group to prefer to leave their unlocked phone unattended (55 percent).
UNLOCK THE DOOR By far, China (69 percent) is the country that features the most respondents saying they would rather leave their house unlocked all day as opposed to leaving their smartphone unlocked in public.
House Unlocked for 1 Day
VS
Phone Unlocked on a Bench for 1 Hour
55%45%
52%
56%
51%
44%
49%
48%
21 - 30
31 - 40
41 - 50
51+
0 50% 100%75%25%
LEAVE IT UNLOCKED: HOUSE OR PHONE?

APPLICATION INTELLIGENCE REPORT
www.a10networks.com 20
AIR raises questions about whether perceptions are reality. After all, misperceptions can result in poor decisions or greater risk for individuals and employers.
Even though many of today’s devices are connected to the Internet, most employees don’t think about threats, potential attacks and privacy for smart TVs, streaming devices, appliances and cameras located within corporate environments. Each and every connected device that transmits data from applications introduces a potential risk, greatly expanding the number of attack vectors IT organizations must defend.
Do IoT device manufacturers (e.g., cars, video cameras, appliances) have the experience or even incentive to implement proper security controls into their connected products? This lack of awareness — from users, manufacturers and businesses alike — makes IoT devices more susceptible to cyberattacks.
Any unsecured IoT device can potentially be used to create botnets that launch terabit-sized DDoS attacks. In October 2016, the Mirai malware helped threat actors compromise unsecured IoT devices to launch global DDoS attacks that surpassed 1 Tbps thresholds. It was emblematic of the DDoS of Things.
THE WEAKEST LINK: MOBILE PHONES OR IOT DEVICES?
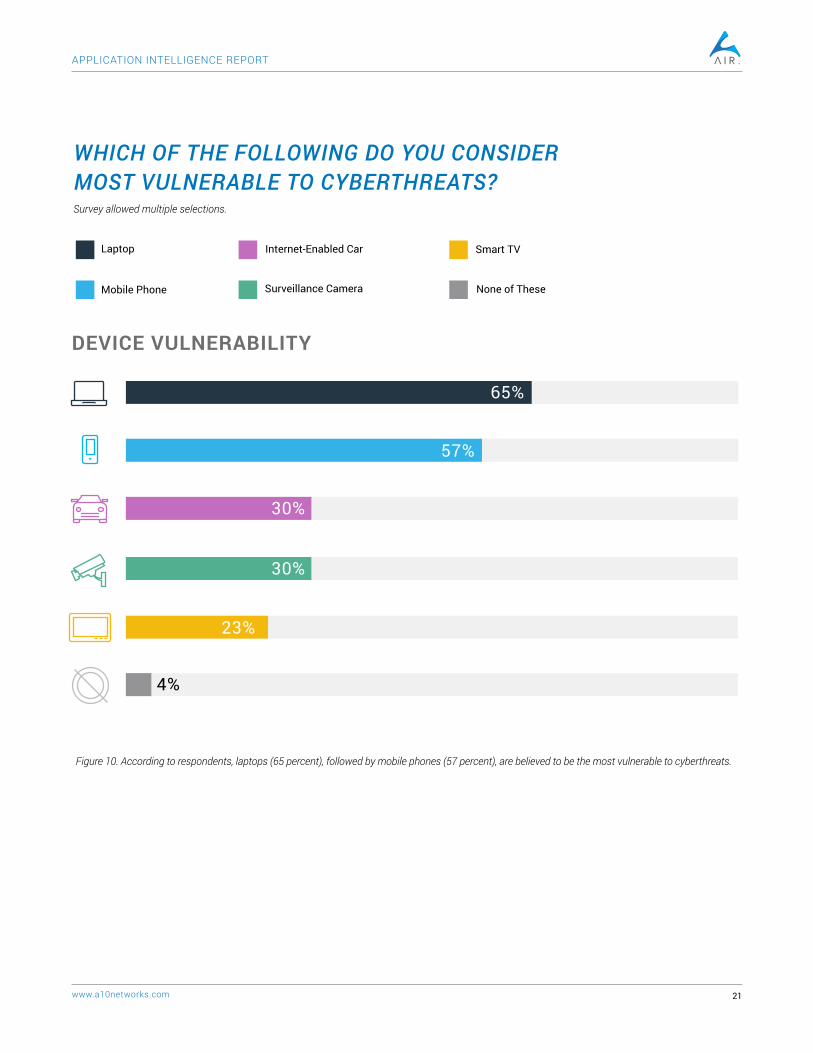
GETTING IT RIGHT Laptops are almost unanimously (65 percent globally) considered the most vulnerable device — only South Korea (58 percent) and Germany (59 percent) thought mobile phones to be a greater risk. UNSURE ABOUT MOBILE China, the U.S. and Singapore all see phones as a higher risk than other countries, but still consider laptops a greater cyberthreat. CAMERA-AWARE China is most aware of the vulnerability of surveillance cameras, with more than half (54 percent) stating that cameras are a potential cyberthreat. Unfortunately, half is still far too short of ideal security awareness and highlights the direness of the situation. NOT FAR BEHIND Japan (38 percent) and South Korea (32 percent) are the other countries most aware of camera vulnerabilities.
Even if the weakest link is through your home network, this can be a backdoor to breach enterprise environments, take down services or compromise apps.
APPLICATION INTELLIGENCE REPORT
www.a10networks.com 21
WHICH OF THE FOLLOWING DO YOU CONSIDER MOST VULNERABLE TO CYBERTHREATS?
DEVICE VULNERABILITY
Figure 10. According to respondents, laptops (65 percent), followed by mobile phones (57 percent), are believed to be the most vulnerable to cyberthreats.
Survey allowed multiple selections.
Laptop Internet-Enabled Car
Surveillance CameraMobile Phone
Smart TV
None of These
65%
57%
30%
30%
23%
4%
APPLICATION INTELLIGENCE REPORT
www.a10networks.com 22
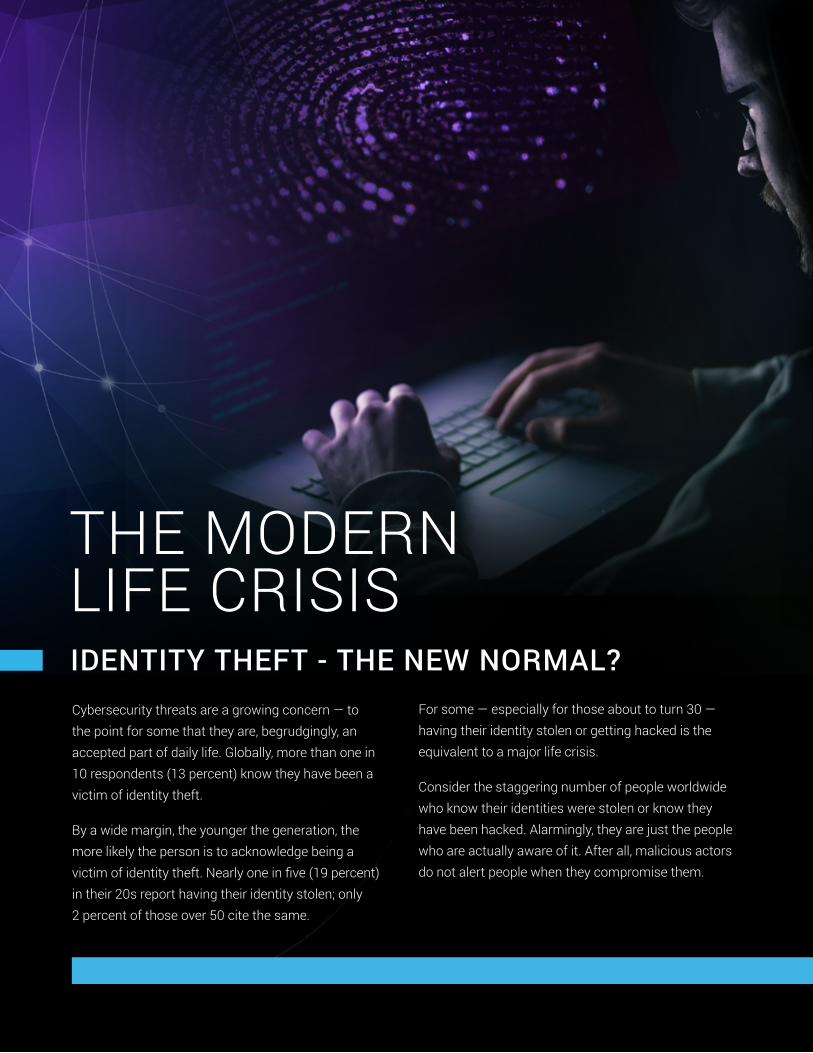
Cybersecurity threats are a growing concern — to the point for some that they are, begrudgingly, an accepted part of daily life. Globally, more than one in 10 respondents (13 percent) know they have been a victim of identity theft.
By a wide margin, the younger the generation, the more likely the person is to acknowledge being a victim of identity theft. Nearly one in five (19 percent) in their 20s report having their identity stolen; only 2 percent of those over 50 cite the same.
IDENTITY THEFT - THE NEW NORMAL?
THE MODERN LIFE CRISIS
For some — especially for those about to turn 30 — having their identity stolen or getting hacked is the equivalent to a major life crisis.
Consider the staggering number of people worldwide who know their identities were stolen or know they have been hacked. Alarmingly, they are just the people who are actually aware of it. After all, malicious actors do not alert people when they compromise them.

APPLICATION INTELLIGENCE REPORT
www.a10networks.com 23
RITE OF PASSAGE Nearly one in five between ages 21 and 30 has had their identity stolen — only 2 percent of those over 50 cite the same.
NOT ME Almost half of respondents (47 percent) say they have had their identity or device stolen, been hacked or lost a device with business and personal information on it.
Figure 11. A fifth of respondents have lost their mobile device or computer (21 percent). Almost the same proportion know that their device or computer has been hacked (20 percent).
WHICH OF THE FOLLOWING HAS HAPPENED TO YOU? Survey allowed multiple selections.
MORE THAN HALF OF RESPONDENTS SAY THEY WEREN’T THE VICTIM OF A HACK OR THEFT. ARE THEY LUCKY OR DO THEY JUST NOT KNOW ABOUT IT YET?53%
EXPERIENCES WITH SECURITY ISSUES
I Am Not A Victim
Mobile Device/Computer Stolen
Mobile Device/Computer Hacked
Identity Stolen
Mobile Device/Computer Lost
BILLIONS DEFRAUDED In China, nearly two out of five respondents (39 percent) have had their identity stolen.
THE SECOND TIER Respondents in South Korea (23 percent), followed by the U.S. (16 percent), feature the second and third highest rates of acknowledged identity thefts.
KNOWING IS THE KEY Respondents in France and Germany (5 percent) report the lowest rates of known identity theft.
53%
13%
14%
20%
21%

APPLICATION INTELLIGENCE REPORT
www.a10networks.com 24
There’s only one thing worse than having your mobile device or computer hacked and your privacy violated. It’s not knowing.
While AIR uncovered an alarming number of device hacks and identity theft victims, the concerning information is hidden in the number of users who have no idea that their device or identities have been compromised.
But they’re not alone. Even Fortune 500 companies — with multimillion-dollar cybersecurity budgets — struggle to know if, and, or when they’ve been breached or compromised.
According to the 2016 SANS Incident Response Survey, roughly 21 percent of qualified responders stated that their time to detection — or “dwell time” — was two to seven days. That said, 40 percent noted that they could detect an incident or breach in less than 24 hours. Conversely, 2 percent of organizations reported their average dwell time is more than a year.
Coupled with concerns around casual app use within corporate networks, the challenges continue to mount for network and security operations teams.
Investigating users at a micro level, AIR reveals that one in five (20 percent) global respondents know they have had their mobile device or computer hacked. Almost one in three under 30 years old (31 percent) know they have been hacked.
HACKED, LOST & STOLEN
The study also found that younger respondents are more careless with their personal devices. In many cases, these are employees who lose work-issued devices that store sensitive business data and intellectual property.
These statistics are illuminating to IT organizations and employers alike as they strive to manage risk and protect employees, data and assets.
THESE STATISTICS ARE ILLUMINATING TO I.T. ORGANIZATIONS AND EMPLOYERS ALIKE AS THEY STRIVE TO MANAGE RISK AND PROTECT EMPLOYEES, DATA AND ASSETS.

APPLICATION INTELLIGENCE REPORT
www.a10networks.com 25
30 SOMETHINGS Almost one in three under 30 (31 percent) has been hacked, although only one in five (22 percent) in their 30s report the same experience.
SAFER LATER Fourteen percent of those in their 40s and 11 percent in their 50s claim to be a hacking victim.
HACKING’S PERSONAL In China, nearly three in 10 respondents (29 percent) have had their personal device hacked.
HIGHEST NUMBERS South Korea has the second highest rate of known hacking instances (27 percent) in the study, along with the U.S. and U.K. (both 24 percent).
LOWEST NUMBERS Japan (10 percent) and India (16 percent) cite the lowest percentage of participants who know they have been hacked.
LOST Younger generations are more careless with their personal devices, as one in three (34 percent) of those under 30 has lost their mobile device or computer.
OR STOLEN One in four (24 percent) of the 30-and-under age group has had their mobile device stolen at one time.
Figure 12. Respondents 40 years and under are more likely to be aware that they have suffered multiple security issues. These numbers increase for those 30 years and under. More than three quarters of those 51 or older say they have never suffered any of the security issues posed.
WHICH OF THE FOLLOWING HAS HAPPENED TO YOU? Survey allowed multiple selections.
21 - 30 31 - 40 41 - 50 51+
Lost Mobile Device or Computer
Hacked Mobile Device or Computer
Stolen Mobile Device or Computer
Stolen Identity
I Am Not a Victim
100%
75%
50%
25%
0
SECURITY EVENTS BY AGE

APPLICATION INTELLIGENCE REPORT
www.a10networks.com 26
Theft of physical property was once a lucrative endeavor for criminals and nefarious characters. And while some maintain a lifestyle funded by larceny, the true value is now in digital identities, sensitive information, data and the devices that store them.
Criminals understand this trend, too. So much so, the majority of respondents believe there’s a better probability their mobile device will be hacked than their car or house burglarized — combined.
Nearly three out of five respondents (59 percent) believe that having their mobile device hacked and business and personal information stolen is more realistic than having their car broken into or their home burglarized.
PHYSICAL TO DIGITAL THE NEW REALITY A higher percentage of global participants think it’s more likely to have their phone or identity stolen than the combined total of those who think having their vehicle or home burglarized is the higher probability.
SMARTPHONE CONCERNS Respondents in China (86 percent) lead all countries with the belief their mobile phone is likely to be hacked, followed by Singapore (80 percent), South Korea (69 percent) and Japan (68 percent).
IT’S INEVITABLE Of that same group of countries, seven (to almost nine) of 10 respondents represent a significant number of people who are resigned to the fact that they are or will be compromised.
Device Hacked
Car Break-In
Home Burglarized
Figure 13. More than half of respondents (59 percent) believe there is a higher chance of having their business and personal information stolen from a mobile device hack than having their car broken into (25 percent) or their residence burglarized (16 percent).
WHICH DO YOU THINK IS MOST LIKELY TO OCCUR? 16%
59%25%

APPLICATION INTELLIGENCE REPORT
www.a10networks.com 27
While the password is a legacy form of “strong” authentication, it’s still the most common form of security — a basic first step. Unfortunately, it’s also the practice users have the most apathy toward, particularly considering the number of passwords we’re forced to manage.
On average, each user must remember and manage 150 passwords for online accounts, according to password management vendor Dashlane. By 2020, that number is expected to reach 300.
Do people think about the passwords and identities they expose when downloading apps for business or personal use? Do they still keep passwords on yellow sticky notes like they did during the dawn of the Internet?
While multifactor and biometric authentication have made inroads for securing sensitive applications (e.g., healthcare, banking, etc.), poor password behavior leaves both users and enterprises extremely vulnerable.
For example, one in 10 (11 percent) of AIR respondents say they never change their passwords for their mobile apps, while another three out of 10 (29 percent) use the same password for the majority of their apps. Fewer than one in five (17 percent) follow security best practices by applying a different password for every app.
TRENDING YOUNG From a demographic standpoint, younger respondents are more careless with passwords.
YOUNG VS. WISE Fifty percent of the 21-30 demographic either never change passwords or use the same password for the majority of their apps, compared with only 26 percent of those over 50 who do so.
WHAT’S THE PASSWORD?
POOR PASSWORD BEHAVIOR LEAVES BOTH USERS AND ENTERPRISES EXTREMELY VULNERABLE.

APPLICATION INTELLIGENCE REPORT
www.a10networks.com 28
All Apps Majority of Apps
Some AppsCommonly Used Apps
I Always Use Different
Passwords
COMPLETE THE FOLLOWING SENTENCE: “I USE THE SAME PASSWORD FOR ...
Figure 14. Responsible password use is largely fragmented. The outliers who either always use the same password or never use the same password demonstrate the awareness gap in end-user security behavior.
11%20% 17%
22%29%
35%
30%
25%
20%
15%
10%
5%
0
USE OF UNIQUE PASSWORDS
MIX IT UP Germany leads the countries in security best practices with the most number of respondents who use different passwords for every app. However, that figure — 34 percent — is still relatively low when considering the number of respondents in Germany who use unique passwords for each app.
MORE DILIGENCE REQUIRED South Korea (52 percent) features the largest number of respondents who either never change their passwords or use the same one for the majority of their apps. The U.S. (49 percent), Brazil (44 percent) and France (44 percent) follow.
APPLICATION INTELLIGENCE REPORT
www.a10networks.com 29
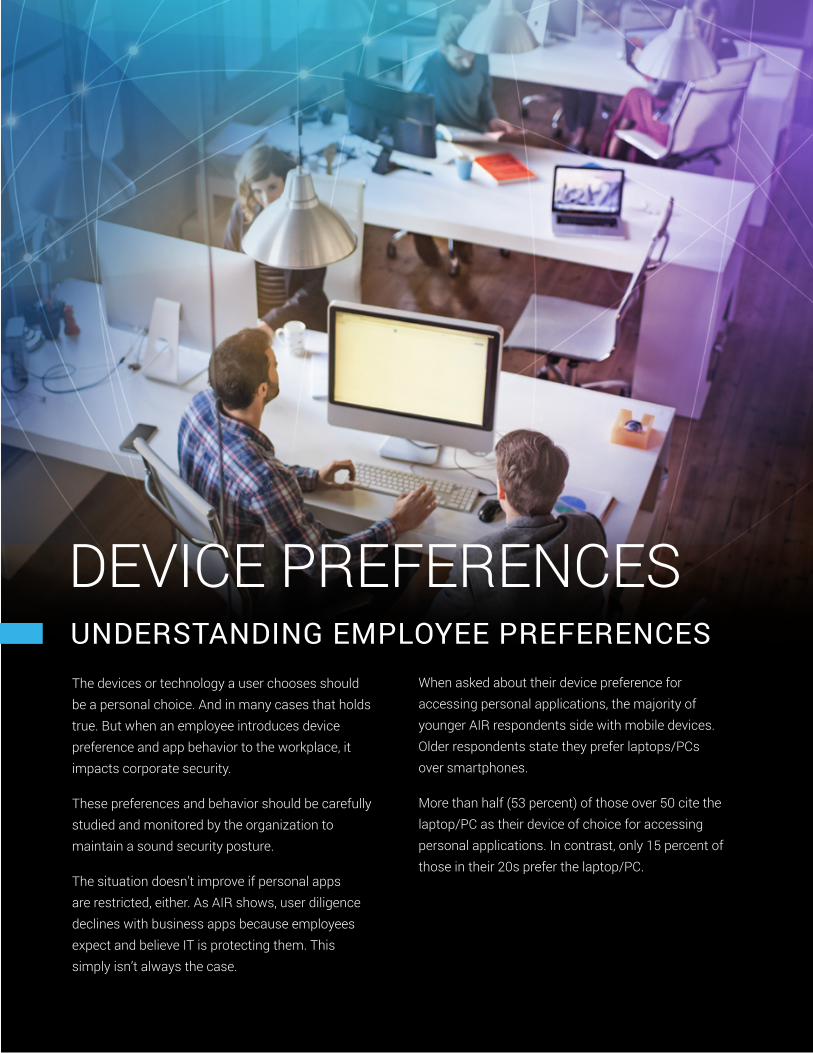
The devices or technology a user chooses should be a personal choice. And in many cases that holds true. But when an employee introduces device preference and app behavior to the workplace, it impacts corporate security.
These preferences and behavior should be carefully studied and monitored by the organization to maintain a sound security posture.
The situation doesn’t improve if personal apps are restricted, either. As AIR shows, user diligence declines with business apps because employees expect and believe IT is protecting them. This simply isn’t always the case.
UNDERSTANDING EMPLOYEE PREFERENCES
DEVICE PREFERENCES
When asked about their device preference for accessing personal applications, the majority of younger AIR respondents side with mobile devices. Older respondents state they prefer laptops/PCs over smartphones.
More than half (53 percent) of those over 50 cite the laptop/PC as their device of choice for accessing personal applications. In contrast, only 15 percent of those in their 20s prefer the laptop/PC.

APPLICATION INTELLIGENCE REPORT
www.a10networks.com 30
THE CHOSEN ONE The smartphone is clearly the device of choice for the younger generation; nearly three out of four (72 percent) in the 21-30 age range cite smartphones as their primary device for app access.
STRONG PREFERENCE The over-50 demographic shows the least amount of interest in apps accessed via smartphone, with one in five (20 percent) stating they “do not prefer using mobile apps” to applications and websites on laptops or desktops.
NOT FOR US Of the 21-30 age demographic, zero respondents say they preferred laptops/desktops to mobile apps. If it hasn’t already happened, the preference toward mobile apps — and the behavior that comes with it — will continue to penetrate corporate environments.
THE PREFERENCE TOWARD MOBILE APPS — AND THE BEHAVIOR THAT COMES WITH IT — WILL CONTINUE TO PENETRATE CORPORATE ENVIRONMENTS.
WHEN ACCESSING APPLICATIONS FOR PERSONAL USE, WHICH OF THE FOLLOWING DO YOU TYPICALLY USE MORE?
Mobile Phones About the SamePC/Laptops
Figure 15. Younger age groups are more likely to access apps via mobile phones, while older segments prefer PC/laptops for personal application use.
PREFERRED DEVICE FOR APPS
13%
15%22% 32%
53%
72%63%
53%32%
15% 15% 15%
21 - 30 31 - 40 41 - 50 51+

APPLICATION INTELLIGENCE REPORT
www.a10networks.com 31
The hypothetical has played out in everyone’s mind. In a true emergency (e.g., fire, flood, etc.), if you had to leave your house in a rush and could only save one item, what would it be?
More respondents (45 percent) will grab their smartphone on the way out of their homes over a safe with important documents (36 percent), their personal photo albums (12 percent), or a desktop or laptop (7 percent).
IN THE EVENT OF EMERGENCY
MORE RESPONDENTS WOULD CHOOSE THEIR SMARTPHONE ON THE WAY OUT OF THEIR HOMES OVER IMPORTANT DOCUMENTS, PHOTO ALBUMS OR A DESKTOP/LAPTOP.45%
WE CHOOSE THE PHONE China again ranks highest in their preference of smartphones (74 percent) over any other options in an emergency, followed by India (54 percent), South Korea (52 percent) and Singapore (50 percent).
IF YOU HAD TO LEAVE YOUR HOME IN AN EMERGENCY — AND YOU COULD ONLY TAKE ONE OF THE FOLLOWING WITH YOU — WHICH WOULD IT BE?
Figure 16. In the event of an emergency, 45 percent of respondents would take their smartphone over their safe of important documents (36 percent), photo albums (12 percent) or desktop/laptops (7 percent).
Smartphone Safe/Important Documents
Desktop/Laptop Photo Album
SAFE BET Participants least likely to grab their phone on the way out come from France (29 percent) and the U.S. (31 percent), who are much more likely to take their safes instead.
IT’S ON OUR PHONES The laptop/desktop scores lowest (7 percent globally) among items that respondents will take in an emergency, indicating that smartphones continue to be the digital device of choice. Zero percent in India choose the laptop/desktop as an option.
HEAVY, BUT VALUABLE The over-50 demographic is the only group that chooses something other than their smartphone — in this case, a safe with important documents is their leading preference.
45%
36%
12%7%

APPLICATION INTELLIGENCE REPORT
www.a10networks.com 32
PATH TO A STRONGER, FASTER AND SAFER ENTERPRISEThe A10 Application Intelligence Report has a straightforward yet complex objective: Spotlight the evolution of human interaction with applications as a way to anticipate malicious and negligent threats so IT organizations can make smarter, strategic decisions on protecting themselves, employees and business apps.
AIR provides recommendations for business and IT/security leaders to evaluate how the behavior of employees, developers, contractors, customers and guests affects the security posture of their organizations.
Simultaneously assessing security posture against insider threats and external threat actors provides a well-rounded view to properly measure and balance corporate risk, make product purchase decisions and implement appropriate corporate security policies.
For in-depth data, infographics, commentary, videos and more, visit A10Networks.com/AIR
MORE OF THE STORY

APPLICATION INTELLIGENCE REPORT
www.a10networks.com 33
STUDY THE BLENDED LIFE Even though apps are core to modern life, a significant amount of the global workforce remains careless about their use, particularly when blended across personal and work settings. Employees can introduce unseen risk and new threats to corporate security.
Examine this lifestyle and implement findings into core risk management strategies that complement investment in security solutions.
IMPLEMENT TOP-DOWN SECURITY Sustainable and consistent cybersecurity starts with culture. To implement this culture correctly, an organization requires buy-in from the top. It doesn’t necessarily have to be the CEO, founder or the board of directors, either. It should, however, be someone with enough clout, respect and power to launch a culture change without being forced to reverse direction at the first sign of adversity. Patience is key.
EVOLVE FROM IT HERO CULTURE TO A SECURE CORPORATE CULTURE In the corporate environment, employees often believe someone else is protecting them. In fact, they expect it. In most cases, this expectation and accountability falls to IT. A lack of shared accountability among employees and IT organizations weakens the corporate security posture. Ensure employees are taking personal responsibility about their behavior, which will help unburden IT staff as the overwhelmed heroes.
BUILD 360-DEGREE AWARENESS Security concerns cannot be solved by technology alone. Businesses can protect themselves — and their applications — by educating employees about personal and corporate risks. But this isn’t a one-way venture. Security awareness and accountability must be expected of regular employees, developers, contractors and leadership. Each should be keenly aware of how their work and personal behaviors affect the business.
FOR BUSINESS LEADERS
APPLICATION INTELLIGENCE REPORT
www.a10networks.com 34
IMPROVE APP VISIBILITY Use real-time, per-application data to proactively identify issues, streamline troubleshooting and meet capacity requirements to deliver superior user experiences. Incorporating solutions that provide centrally managed visibility and analytics ensures applications perform efficiently across all environments.
REMOVE SECURITY BLIND SPOTS Extending the visibility requirement further, assume the corporate network is contested space. Most malicious activity will be hiding in encrypted traffic. Use sound SSL decryption solutions to responsibly detect, inspect and mitigate both inbound and outbound traffic. Leave no doubt.
ENSURE APP PERFORMANCE While security awareness may be slowly growing among many AIR respondents, in most cases its prioritization still takes a back seat to performance, ease of use and other app requirements. It goes without saying that businesses need both — app performance and security.
Implement proper secure application delivery and central management solutions to ensure agile, fast, yet protected application performance. Continually optimize performance via per-application statistics and rich traffic analysis.
IMPLEMENT CONTROL ACROSS ANY AND ALL ENVIRONMENTS Consistently secure and manage applications, regardless of their location. Centralize analytics-driven control of secure application services across any underlying infrastructure — from traditional on-premise data centers to public, private and hybrid clouds.
FOR IT & SECURITY LEADERS

APPLICATION INTELLIGENCE REPORT
www.a10networks.com 35
FULL-TIME PROFESSIONALS
• 21 years of age or older • Full-time employee • Works at a company with 100-plus employees • Does not work in IT or non-profit, military, government, education or social services sectors
IT DECISION-MAKERS
• 21 years of age or older • Works in IT • Full-time employee • Works at a company with 100-plus employees • Decision-maker in IT solutions • Does not work in non-profit, military, government, education or social services sectors
A10 Networks commissioned Provoke Insights, a U.S.-based market research firm, to survey more than 2,000 non-IT and IT professionals in 10 countries: Brazil, China, France, Germany, United Kingdom, India, Japan, Singapore, South Korea and the United States.
Provoke Insights conducted two anonymous, 15-minute online surveys — one among full-time professionals and another with IT decision-makers.
METHODOLOGYTOTAL RESPONSES: 2,037 | COUNTRIES: 10 | SEGMENTS: 2
NOTES • Surveys were conducted in February 2017.
• Both surveys were translated into local languages and fielded in 10 countries, with at least 100 completes for each sub group in each country.
• A total of 2,037 people were surveyed; 1,030 full-time employees and 1,007 IT decision-makers.
• Statistical differences between country subgroups were tested at 95 percent confidence level.

APPLICATION INTELLIGENCE REPORT
ABOUT AIR
The Application Intelligence Report (AIR) is a global research project that examines the behavior and attitudes of the global workforce toward the use of business and personal apps, and their impact on personal and corporate security. AIR was commissioned by A10 Networks and conducted independently by strategic research firm Provoke Insights. It involves more than 2,000 business and IT professionals in 10 countries, with the intent to provide education for employers that can help them reassess corporate policies, make smart product investment decisions and ultimately protect their businesses — and their applications — by simply becoming more aware of the behavior of their employees.
©2017 A10 Networks, Inc. All rights reserved. A10 Networks, the A10 Networks logo, ACOS, Thunder and SSL Insight are trademarks or registered trademarks of A10 Networks, Inc. in the United States and other countries. All other trademarks are property of their respective owners. A10 Networks assumes no responsibility for any inaccuracies in this document. A10 Networks reserves the right to change, modify, transfer, or otherwise revise this publication without notice. For the full list of trademarks, visit: www.a10networks.com/a10-trademarks.
LEARN MORE ABOUT A10 NETWORKS
CONTACT USa10networks.com/contact Part Number: A10-WP-21142-EN-01 MAY 2017