application of fluid inclusion and rock-gas analysis in - deep blue
TRANSCRIPT

Journal of Geochemical Exploration, 25 (1986) 201--215 201 Elsevier Science Publishers B.V., Amsterdam -- Printed in The Netherlands
APPLICATION OF FLUID INCLUSION AND ROCK-GAS ANALYSIS IN MINERAL EXPLORATION
STEPHEN E. KESLER, PATRICIA S. HAYNES, MICHAEL Z. CREECH and JONATHAN A. GORMAN
Department of Geological Sciences, University of Michigan, Ann Arbor, MI 48109, U.S.A.
(Received December 24, 1984; revised and accepted June 28, 1985)
ABSTRACT
Kesler, S.E., Haynes, P.S., Creech, M.Z. and Gorman, J.A., 1986. Application of fluid in- clusion and rock-gas analysis in mineral exploration. In: C.E. Nichols (Editor), Explo- ration for Ore Deposits of the North American Cordillera. J. Geochem. Explor., 25: 201--215.
Gases are known to form haloes around presently active geothermal systems and might be useful in exploration for older, extinct hydrothermal systems. Gases from such ex- tinct hydrothermal systems can be liberated for analysis from fluid inclusions in hydro- thermal minerals by thermal decrepitation or they can be desorbed from alteration mineral surfaces by heating. The most abundant of these gases, besides HsO, are usually CO2, CH4, CO and N s. We have used a gas chromatograph to analyze these gases in fluid inclusions in jasperoid around the Pueblo Viejo gold-silver deposit, in vein minerals from the Creede silver-lead-zinc deposit, and from clays in the alteration cap overlying veins at Creede to test for gas haloes useful in exploration. At Pueblo Viejo CO s abundances in the jasperoid range from less than 1 mole percent (with respect to the system CH4-CO 2- CO-N2-H20 ) in the ore zone to as much as 6 mole percent in surrounding, barren jasperoid. Fluid inclusion analyses at Creede suggest that a drop in the CO 2 content of the fluid may relate to ore deposition and clay directly above veins has large amounts of ad- sorbed CO s . These results suggest that primary gas abundances exhibit patterns in and around hydrothermal ore deposits that can be used in mineral exploration.
INTRODUCTION
Surveys have shown that gases form haloes around geothermal zones and volcanoes (Stoiber and Rose, 1974; Hinkle and Harms, 1978) and it is rea- sonable to assume that similar gas haloes existed around the extinct geother- mal systems that generated many hydrothermal ore deposits. Records of the gases in extinct hydrothermal systems will be preserved in primary fluid in- clusions in hydrothermal minerals and, possibly, as gases adsorbed on ore and alteration minerals. Variations in the relative abundances of some of these gases such as CO2 and H2S should reflect variations in temperature, pressure, or the location of chemical processes such as boiling or wall-rock reaction, all of which can control ore deposition in hydrothermal systems
0375-6742/86/$03.50 © 1986 Elsevier Science Publishers B.V.

202
(Drummond, 1981). Thus, gas haloes might be useful in exploration of hydrothermal systems.
Efforts to use optical studies of fluid inclusions in mineral exploration have been made by Nash (1976) and discussed by Roedder (1977). Smith and Peach (1949) attempted to apply thermal decrepitation, a bulk-inclusion analysis method, to exploration early in the history of fluid inclusion re- search and Burlinson et al. (1983) recently revived this approach with appar- ent success. In studies of gases adsorbed onto mineral surfaces, Norman (1981) found high sulfur concentrations in hydrous alteration minerals from sulfide ore deposits and Palin and Norman (1982) reported CO2 enrichment and H2S depletion in phyllosilicate minerals above the buried Copper Flat porphyry deposit of New Mexico, while CO decreased with increasing dis- tance from the orebody.
We report here a series of preliminary evaluations of the usefulness of fluid inclusion and rock-gas analysis to mineral exploration at the Pueblo Viejo gold-silver hot-spring deposit in the Dominican Republic and the Creede, Colorado precious and base metal veins. We have reported elsewhere on the distribution of inclusion gases in quartz veins in the Porcupine gold camp of northern Ontario, where these gases provide a strong anomaly ap- proximately 1 km wide over the McIntyre-HoUinger deposit (Smith and Kesler, 1985). Bulk analysis of fluid inclusions, the method used in this study, is clearly more rapid and less expensive than traditional optical studies of fluid inclusions and it yields direct compositional data. It is subject, however, to complications caused by the analysis of a sample containing both primary and secondary inclusions where the secondary inclusions might dilute or mask the primary compositional zoning. We freely acknowledge this complication but suggest that similar problems are present in most geo- chemical exploration samples. The challenge in geochemical exploration is to obtain meaningful data from bulk analyses of this sort, if possible, and to go on to more cosily, detailed analytical determinations only where useful data cannot be obtained less expensively. There almost certainly are many hydro- thermal systems in which compositional variations in one gram samples are adequate to delineate inclusion gas anomalies and our goal at this point is to determine which deposit types, in which geological environments, yield the best anomalies and where inclusion gas analyses can be most helpful in geo- chemical exploration.
ANALYSIS OF INCLUSION GASES
Inclusion gases can be released for analysis either by decrepitation or crushing. In general, thermal decrepitation of inclusion-bearing material is preferable because gases released during crushing are adsorbed readily onto newly broken mineral surfaces (Barker and Torkelson, 1975). For our fluid inclusion analyses we use material crushed to -20 /+60 mesh. Crushed quartz

203
and jasperoid samples are soaked in aqua regia overnight to remove fine- grained carbonate or sulfide inclusions, which can decompose to produce gases at high temperature. Most organic material, which might produce CH4, CO2, or other gases on heating can be removed from contaminated samples by soaking in .acetonitrile (CH3CN) (Alexandrovska et al., 1980). Care should be taken not to breathe acetonitrile vapor. In general the filling tem- perature or homogenization temperature of fluid inclusions can be used as a guide for the temperature at which the inclusion should be decrepitated for release of gases, with the decrepitation temperature being 50--100 ° above the inclusion filling temperature (Leroy, 1979). In cases where the inclusions have not been studied optically in the material, or where confirmation of actual inclusion decrepitation temperature is desired, step-heating tests, in which the material is heated at 50 or 100 ° intervals and released gases are analyzed can be used to determine the appropriate temperature for gas re- lease.
For all fluid inclusion analyses reported here 1 g of crushed sample was decrepitated in a Vycor glass tube and the evolved gases introduced into a Tracor 560 gas chromatograph by means of a helium carrier and switching valves (Fig. 1). Samples were allowed to decrepitate for 15 minutes in a helium atmosphere. To prevent condensation of H20 during analysis all ex- traction lines and valves were heated to above 100°C. Two columns were used to separate the gases: a 50--75°C temperature programmed 6 foot X %" stainless steel front column, and a 3 foot × 1A" stainless steel back column cooled to - 7 8 ° C (Fig. 2). A - 7 8 ° C cold trap was placed between the two columns to prevent H20 from entering the back column and to delay the passage of CO2 and CH4. Both columns were packed with 60/80 mesh Chromosorb 102 (Johns-Manville Corp.). Generally similar analytical ar- rangements have been used by Cuney et al. (1976), Malakhov (1977), and Behar and Pineau (1979).
GAS CHROMATOGRAPH
x, ~ .,-. COLD TRAP COLD FURNACE s ~ ", COLUMN
OVEN CHROMATOGRAM
Fig. 1. Schema t i c d iagram of gas c h r o m a t o g r a p h i c system. TCD = Thermal Conduc t iv i ty De tec to r .

204
LO Sample station showing mole percent CO 2
iiiiiiii: Ore zones
Lorge dasperoid zones
0 1 2 K M I I I
2
7 v ~ P-
EGRO ORE BODY
77i!iiii , t l ;- " ;t
MOORE ORE BODY "-I~l-<l ~',/- 4 ,, " ,-.\ ~ 0 5 i P ~ J ~ < ~.~ ~ \
ALTERED UPPER LOS RANCHOS FM 1 ~ v z. L r ~ ,~ "<,.2.1 '~ r ' 2 8 < >\
0 > ,', .4 ' ' LOWER LOS RANCHOS FM ~ ~ -7
Fig. 2. Schematic geologic map of the Los Ranchos Formation showing location of Pueblo Viejo ore zones and jasperoid (after Kesler et al., 1981). Sample locations used in this study are shown along with CO 2 gas contents.
In the results reported here all analyses were carried out with a Tracor thermal conductivi ty detector (TCD). With a helium carrier gas, a 3.5-ml mixture (at standard P and T) of N2, CO, CH4, CO2 and H20 could be separ- ated with detect ion limits of 10 -9 moles for CO2 and CH4, 7 X 10 -9 moles for N2 and CO, and 5 X 10-~moles for H20. Reproducibil i ty was +15% for CH4 and CO2 and +20% for CO, N2, and H20. A standard gas mixture custom manufactured by Scott Specialty Gas Inc. (Troy, Mich.), was used to stan- dardize for N~, CO, CH4, and COs while dehydrat ion of BaC12 "6H20 pro- vided standard amounts of H20.
PUEBLO VIEJO
Pueblo Viejo, a 125-m.y.-old gold-silver acid:sulfate deposit in the Domini- can Republic, provides an excellent example of a geologic environment in

205
which gas analysis could be useful in exploration. The large oxide gold-silver orebody {Russell et al., 1981) and the underlying sulfide zone (Kesler et al., 1981) are in the upper part of the early Cretaceous Los Ranchos Formation. Outcrops of the upper Los Ranchos Formation, which cover an area of about 15 km 2 around the Pueblo Viejo deposit, consist of rock that has been completely altered to advanced argillic assemblages with ledges and zones of massive jasperoid {Fig. 2). Where the Pueblo Viejo deposit has been explored
TABLE 1
Bulk fluid inclusion gas analyses from Pueblo Viejo
Lab Sample t~mole/g mole % # number
CO~ CO N 2 H20 CO 2 CO N~ H~O
1 RD-77-27 0.04 0.01 0.07 5.4 0.7 0.2 1.3 97.8 2 PK-7 0.09 0.02 0.02 13.0 0.7 0.2 0.2 99.0 3 T-6-4 0.20 0.05 0.12 17.8 1.1 0.3 0.7 97.9 4 RD-72-140 0.10 0.03 -- 8.0 1.2 0.3 -- 98.4 5# DDH-173-120 0.04 0.02 0.19 6.9 0.5 0.3 2.7 96.5 6# DDH-163-192 0.19 0.11 -- 94.6 0.2 0.1 - - 99.7 7* RD-77-23 0.09 0.02 0.04 17.3 0.5 0.1 0.2 98.9 8 SH-I-1 0.05 -- 0.04 6.5 0.8 - - 0.6 98.5 9 RD-77-12 0.08 0.01 0.05 3.8 2.1 0.3 1.2 96.5
10 RD-72-130 0.08 0.03 0.13 6.2 1.2 0.5 2.0 96.3 11 RD-72-219 0.20 0.06 0.11 10.1 1.9 0.6 1.1 96.4 12" RD-72-235 0.05 0.02 0.02 5.2 0.8 0.4 0.4 98.2 13 RD-73-249 0.16 0.13 0.12 5.2 2.9 2.3 2.2 92.7 14 RD~77-15 0.24 0.06 0.03 8.1 2.8 0.7 0.3 96.1 15 RD-72-100 0.06 0.02 0.08 3.2 1.8 0.5 2.7 95.1 16 RD-72-109 0.09 0.02 0.12 3.8 2.2 0.5 2.9 94.5 17 RD-73-42 0.06 0.02 0.13 4.0 1.5 0.5 3.1 94.9 18 RD-73-108 0.17 0.05 0.01 14.7 1.1 0.3 0.1 98.5 19 RD-72-253 0.18 0.05 0.08 5.7 3.0 0.8 1.3 94.8 20 RD-72-163 0.16 0.04 0.01 11.2 1.4 0.3 0.1 98.0 21 RD-73-172 0.02 0.06 0.14 3.9 2.8 1.4 3.3 92.4 22 X-2 0.09 0.03 0.10 4.9 1.8 0.7 2.0 95.5 23 X-3 0.32 0.19 0.03 32.7 1.0 0.6 0.1 98.4 24 X-5 0.03 0.01 0.01 4.9 0.5 0.2 0.1 99.2 25 X-6 0.07 0.01 0.09 6.3 1.1 0.2 1.4 97.3 26 X-7 0.05 0.01 0.05 7.3 0.7 0.1 0.7 98.6 27 X-8 0.08 0.03 0.23 5.3 1.5 0.5 4.1 94.0 28 X-9 0.33 0.10 0.33 7.0 4.3 1,3 4.2 90.2 29 X-10 0.04 0.01 0.01 2.1 2.0 0.6 0.6 96.7 30 X-11 0.22 0.03 0.08 3.2 6.2 1.0 2.3 90.5 31 X-12 0.12 0.04 0.03 3.4 3.4 1.1 0.9 94.5 32 X-13 0.05 0.01 0.04 1.9 2.6 0.7 2.0 94.7 33 X-14 0.07 0.02 0.05 3.2 2.0 0.5 1.5 96.0
*Sample contained 0.2 mole % CH 4. All other samples contained <0.1 mole % C H 4.
#Diamond drill hole samples, f rom depths of 120 and 192 m.
206
at depth, this jasperoid and advanced argillic alteration narrows downward to form a funnel-shaped zone that crosscuts a calcite~pidote-chlorite assem- blage that resulted from earlier seafloor alteration. Samples of soil, weather- ed rock, and jasperoid from throughout this area of altered rock provide relatively restricted anomalies when analyzed for gold and silver.
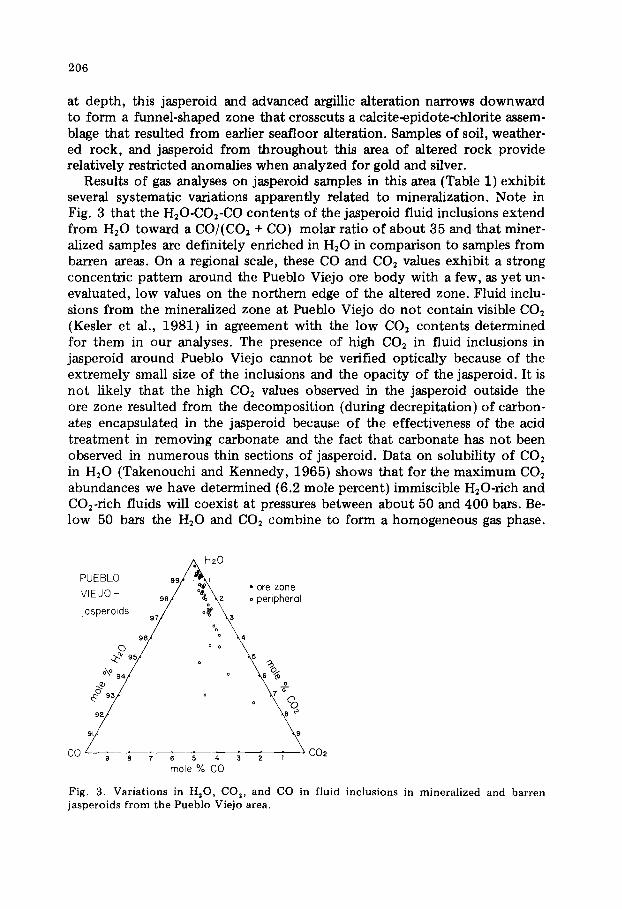
Results of gas analyses on jasperoid samples in this area (Table 1) exhibit several systematic variations apparently related to mineralization. Note in Fig. 3 that the H20-CO2-CO contents of the jasperoid fluid inclusions extend from H20 toward a CO/(CO2 + CO) molar ratio of about 35 and that miner- alized samples are definitely enriched in H20 in comparison to samples from barren areas. On a regional scale, these CO and CO2 values exhibit a strong concentric pattern around the Pueblo Viejo ore body with a few, as yet un- evaluated, low values on the northern edge of the altered zone. Fluid inclu- sions from the mineralized zone at Pueblo Viejo do not contain visible CO2 (Kesler et al., 1981) in agreement with the low CO2 contents determined for them in our analyses. The presence of high CO2 in fluid inclusions in jasperoid around Pueblo Viejo cannot be verified optically because of the extremely small size of the inclusions and the opacity of the jasperoid. It is not likely that the high CO2 values observed in the jasperoid outside the ore zone resulted from the decomposit ion (during decrepitation) of carbon- ates encapsulated in the jasperoid because of the effectiveness of the acid t reatment in removing carbonate and the fact that carbonate has not been observed in numerous thin sections of jasperoid. Data on solubility of CO2 in H20 (Takenouchi and Kennedy, 1965) shows that for the maximum CO2 abundances we have determined (6.2 mole percent) immiscible H20-rich and CO2-rich fluids will coexist at pressures between about 50 and 400 bars. Be- low 50 bars the H20 and CO2 combine to form a homogeneous gas phase.
//~ H20 PUEBLO 99/" .~l~, VIEJO- 98/ ;~¢X'~X2 [ ;reei;~nre, josperoids ¢ o~ ,~
o 7 °:
°o °2,0 oo/\ . . . . . . . . 9 8 7 6 5 4 3 2 1
mole % CO C02
Fig. 3. Var ia t ions in H20 , CO2, and CO in fluid inclus ions in minera l ized and bar ren jaspero ids f rom the Pueb lo Viejo area.

207
Pressures in and around Pueblo Viejo were probably at or below 50 bars in the upper part of the deposit (Kesler et al., 1981) suggesting that these high- CO~ fluids represent a gas phase permeating the upper part of the mineral- izing system. The source of this CO: is unclear at present; it could have been derived by boiling of the mineralizing solutions or by later remobilization of CO: from underlying calcite-bearing volcanic units, which are at a shallow depth beneath areas peripheral to the Pueblo Viejo deposit, but at greater depths (300 m) below the ore zone (Kesler et al., 1981).
C R E E D E
The Creede district is located in the Central San Juan caldera complex, part of the San Juan volcanic field of southwestern Colorado (Steven and Eaton, 1975). Silver mineralization, 24.6 -+ 0.3 m.y. in age (Bethke et al., 1976), occurs in a set of north-northwest-trending veins. Major production in the district has come from the Amethyst , Bulldog Mountain, OH and P veins. The northern part of the district is characterized by relatively high base metal contents and, on the OH vein, is capped by a thick zone of clay alteration, which becomes discontinuous just south of the area of our study on the OH vein (Fig. 4). Mineralization at Creede occurred in several stages (Fig. 5) now represented by individual layers in crustified veins. In the area of our study, Stage 1 layers within the veins correlate with the A stage of Bethke and Rye (1979) and are barren of silver mineralization. Stage 2a vein material (B stage of Bethke and Rye) contains the bulk of the Ag mineraliza- tion. Stage 2b vein material is barren, but Stage 2c (D stage of Bethke and Rye) has minor silver values. The Bethke and Rye C stage has been recog- nized only in the northern parts of the OH, P, and Amethyst veins so far (Bethke and Rye, 1979) and is not represented by our Stage 2b (J.A. Gor- man, unpubl, data). The clay cap that overlies this zone of mineralization is thought to have been formed when the boiling that caused ore deposition re- leased volatiles that rose into the overlying rock and condensed to form acid water that altered the rock (Barton et al., 1977).
I1,000
Elevation {feet} I0,000
OH-AMETHYST VEIN SYSTEM NORTH SOUTH
Present surface ~ ~-- ~o'oo
Ameth:/st 5 level ~ : L _ - - - - - . . . . , S t u d y ~ FEET ~ " : ~ - - - " area
OH section -~- Amethyst sec t ion- p
Fig. 4. P ro jec t ion of the s o u t h e r n par t of the OH vein and the s o u t h e r n A m e t h y s t vein o n t o a long sec t ion , looking no r theas t . A m e t h y s t 5 level s h o w n for re fe rence to Fig. 9. R e d r a w n f rom Bar ton et al., 1977.

208
PARAGENETIC SEQUENCE
STAGE la lb
Quar tz r:~;:.~:~:~:~:~
Chalcedony
Amethys t
Rhodochros i te ~::~:~ ~!~i~ ]
Base metals I l
Aq
2a
I
/
/
I
/
2b 2c
I I
[ I
E--1
Fig. 5. Paragenetic sequence in the southern part of the OH vein for minerals used in this s tudy (exclusive of il l i te-smectite), base metals and Ag. See text for relat ion of this scheme to published paragenetic sequences for o ther parts of the Creede vein system.
Ore shoots in the OH vein are effectively hidden by this clay cap and we at tempted to evaluate whether gas analyses could be used to delineate zones of underlying boiling which might have produced ore shoots. To test this possibility, we analyzed both vein and clay cap material. To characterize the gas content of the mineralizing solution we analyzed fluid inclusion gases from vein quartz, chalcedony, amethyst , rhodochrosite and barite (Table 2). Note in Fig. 6 that the CO2/(CO2 + H20) ratio of gases evolved from these in- clusions varies greatly. There is a sharp drop in CO2 content of the fluid from Stage 1 to Stage 2a and an even further drop to the barren Stage 2b. Stage 2c samples, representing minor silver mineralization, exhibit wide variations in CO2 content. These variations are consistent with the findings of Wetlaufer (1978) who saw no geochemical difference between the early, carbonate de- positing fluids (our Stage 1) and later fluids (Stage 2) except possibly higher CO2 pressures during carbonate deposition. It is not clear whether the varia- tions in CO2 content we observe reflect boiling in the Creede system. Regard- less of this uncertainty, it appears that large variations in CO2 contents of the mineralizing fluid (as indicated by our bulk inclusion analyses) correlate with precious metal deposition. Since CO2 is readily adsorbed onto mineral sur- faces we have at tempted to determine whether CO~ haloes could be observed in clays from the clay cap and whether their abundance could be related to the distribution of ore shoots.
The mixed layer illite-smectite (Horton, 1983) found in the clay cap at Creede is best developed in pumice fragments which are essentially complete- ly altered. A 0.2--0.3 g disaggregated sample of this clay was tested for gas adsorption characteristics by heating it to 300°C for 30 minutes in a stream of helium to clean off adsorbed gases. This material was then split into thirds, which were treated as explained in Table 3. The results of these tests indicate that the illite-smectite could be degassed effectively at 300°C and that CO2 and H~O are quickly adsorbed by the clay even at low tempera-

209
TABLE 2
Bulk fluid inclusion gas analyses f rom Creede vein material. All samples except 2, 3, 5 and 20 conta ined a trace of CH 4 (<0 .005 umole /g)
Stage Lab Loca t ion Mineral ~mole /g CO: × 100
# CO: + H:O CO 2 CO N 2 H:O
l a 20 19000 x-cut quar tz 1.14 0.01 nd 17.5 6.1 22 JAG 13 quar tz 0.57 0.04 nd 22.8 2.5
l b 14 19000 x-cut rhodochr . 1.29 0.01 0.07 16.8 7.1 15 JAG 13 rhodochr . 3.90 0.04 nd 42.8 8.4 17 JAG 13 ame thys t 0.54 0.04 nd 7.0 7.1 18 19000 x-cut rhodochr . 2.84 0.01 nd 38.4 6.9
2a 1 JAG 12 83 quar tz 0.14 0.01 0.06 13.1 1.1 2 DDH 25 170 ame thys t 0.05 0.02 0.03 4.1 1.2
10 D D H 1 2 A 1 2 1 ame thys t 0.24 0.02 0.09 5.9 3.8 12 JAG AMY 7-83 ame thys t 0.23 0.05 0.20 17.4 1.3 13 DDH 24 166 quartz 0.29 0.07 0.34 24.5 1.2
2b 4 LCD chalcedony 0.14 0.04 0.25 10.3 1.4 5 D D H C 4 5 174 quar tz 0.07 0.02 0.06 37.5 0.2 7 D D H 1 2 A 1 3 8 quartz 0.03 0.01 0.05 3.3 0.8 8 DDH C70 120 quar tz 0.02 trace 0.05 4.3 0.4
11 D D H C 4 5 102 quar tz 0.02 0.01 0.06 6.6 0.3 16 C66 117 barite 0.14 0.02 nd 21.1 0.6
2c 9 LCD ame thys t trace trace 0.05 0.6 0.5 19 45 sump amethys t 1.07 0.09 nd 27.2 3.8 21 19000 x-cut ame thys t 0.89 0.03 nd 3.0 22.8
nd = not de te rmined . rhodochr . = rhodochros i t e
FLUID INCLUSIONS
n=20
0 2 4 6 B 22
C02/(C02+H20) x I00
Fig. 6. Histogram of CO2/(CO 2 + H20) molar ratio for 20 bulk fluid inclusion analyses on Creede vein material . Pa t te rns are the same as were used in Fig. 5 to deno te paragenet ic stages.

210
T A B L E 3
G a s e s d e s o r b e d f r o m three spl i ts o f C r e e d e c lay af ter it w a s d e g a s s e d in a s t r e a m o f He at 3 0 0 ° C for 30 m i n u t e s . All a m o u n t s g iven as 10 -~ m o l e s o f gas per gram of c lay
C o n d i t i o n s o f f u r t h e r t r e a t m e n t CH 4 CO: CO H : O
1) hea ted 20 m i n u t e s at 3 0 0 ° C in he l i um - - 0.2 -- - -
2) le f t o v e r n i g h t in lab air 0.007 0.3 - - 80.0
3) left ove rn igh t in gas c o n t a i n i n g 1 m o l e % CH, , CO2, CO in h e l i u m 0 .003 1.2 - - - -
tures. Step heating tests, in which gases evolved from Creede illite-smectite were analyzed at 100°C intervals from 100 to 500°C (Fig. 7) were used to determine the appropriate temperature to evolve gases from the clay for analyses. Note Jn Fig. 7 that very large amounts of H:O but little else were released between 100 and 200°C from the illite-smectite. Between 400 and 500 ° C, a large amount of CH4 was released as well as some hydrocarbons not shown here. These results agree well with differential thermal analyses of clay which show the loss of loosely held water below 200°C but no loss of structurally bound OH until about 550°C (Mackenzie, 1957). Accordingly, we have collected and analyzed gases evolved between 200 and 400°C (Table
STEP HEAT PGL-505 ( T, °C vs gos yield, 10 -e mole
cf) (]9 -6 E
L9
b
.10 .08 .06 .04 .02
I
I I
2 0 0 4 0 0 6 0 0
.5 -
I
.4 - " - I C02
.3- ci
°'I -h .1 - I I I 0 200 400 600
20
15
10
5
0
.O8
F - I H~O
! ~ - - ~ I~T~ .06 :> t .04
.02
200 400 600
T (°C
t N2
I
2O0 40O 6OO
Fig. 7. Resu l t s o f s t e p - h e a t i n g c lay C D U 23-415. The gas e v o l v e d b e t w e e n 2 0 0 and 4 0 0 ° C w a s a n a l y z e d in this s t u d y .
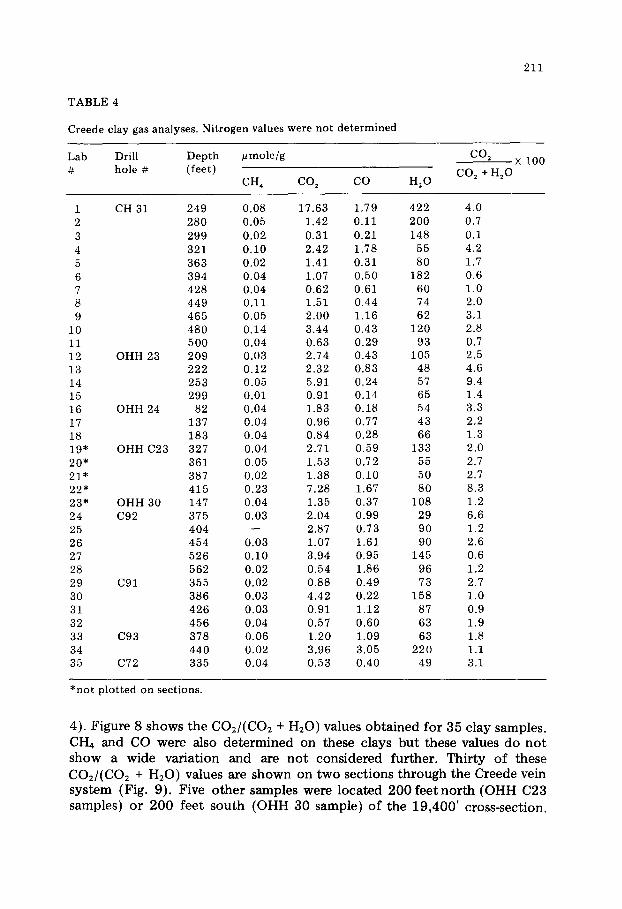
TABLE 4
Creede clay gas analyses. Nitrogen values were not determined
211
Lab Drill Depth ~mole/g # hole # (feet)
CH 4 CO 2 CO H:O
CO2 × 100
CO 2 + H~O
1 CH 31 249 0.08 17.63 1.79 422 4,0 2 280 0.05 1.42 0.11 200 0,7 3 299 0.02 0.31 0.21 148 0.1 4 321 0,10 2.42 1,78 55 4.2 5 363 0,02 1.41 0.31 80 1,7 6 394 0.04 1.07 0.50 182 0.6 7 428 0,04 0.62 0.61 60 1,0 8 449 0,11 1.51 0.44 74 2,0 9 465 0.05 2.00 1.16 62 3,1
10 480 0.14 3.44 0.43 120 2.8 11 500 0,04 0.63 0.29 93 0.7 12 OHH 23 209 0.03 2.74 0,43 105 2,5 13 222 0.12 2.32 0.83 48 4.6 14 253 0.05 5.91 0,24 57 9.4 15 299 0.01 0.91 0.14 65 1.4 16 OHH 24 82 0.04 1.83 0.18 54 3.3 17 137 0.04 0.96 0.77 43 2.2 18 183 0.04 0.84 0.28 66 1.3 19" OHH C23 327 0.04 2.71 0.59 133 2,0 20* 361 0.05 1.53 0.72 55 2.7 21" 387 0.02 1.38 0.10 50 2,7 22* 415 0.23 7.28 1.67 80 8.3 23* OHH 30 147 0.04 1.35 0.37 108 1.2 24 C92 375 0.03 2.04 0.99 29 6.6 25 404 -- 2.87 0.73 90 1.2 26 454 0.03 1.07 1.61 90 2.6 27 526 0.10 3.94 0.95 145 0.6 28 562 0.02 0.54 1.86 96 1.2 29 C91 355 0.02 0.88 0.49 73 2.7 30 386 0.03 4.42 0.22 158 1.0 31 426 0,03 0.91 1.12 87 0.9 32 456 0.04 0.57 0.60 63 1.9 33 C93 378 0.06 1.20 1.09 63 1.8 34 440 0.02 3.96 3.05 220 1.1 35 C72 335 0.04 0.53 0.40 49 3,1
*not plotted on sections.
4). F i g u r e 8 s h o w s t h e CO2/ (CO2 + H 2 0 ) va lues o b t a i n e d f o r 35 c l ay samples .
CH4 and CO w e r e a lso d e t e r m i n e d on t h e s e c lays b u t t h e s e va lues d o n o t
s h o w a w i d e v a r i a t i o n a n d are n o t c o n s i d e r e d f u r t h e r . T h i r t y o f t h e s e
CO2/ (CO2 + H 2 0 ) va lues are s h o w n on t w o s e c t i o n s t h r o u g h t h e C r e e d e ve in
s y s t e m (Fig . 9) . F i v e o t h e r s a m p l e s w e r e l o c a t e d 2 0 0 f e e t n o r t h ( O H H C23
s a m p l e s ) o r 2 0 0 f e e t s o u t h ( O H H 30 s a m p l e ) o f t h e 1 9 , 4 0 0 ' c ro s s - s ec t i on .

212
6 - O
> ~ 4 .
J~ o
• 2 -
2
CLAYS
F- ~ n= 35
2 3 4 5 6 7
C02x100/(C02 + H20)
S 9
Fig. 8. Histogram of COJ(CO~ + H~O) molar ratio for 35 clay desorption analyses from Creede clay cap material
• 1 . 4
..:.:....
4 .Oii~ii:
0 . I • •0 .7
19,400
;S SECTION
<ING NORTH
20 '
18,800 CROSS t 1.2 SECTION, LOOKING • 0 . 6
NORTH i!~i!, i 6 • 1.9
• I!2! : ^ ......... :i~.' 6 6 .~. ii!~ '.!ii!i!i : • .u
I 1 - -
4-0' I I OH VEIN
COz x lO0 ~ > _ 2 . 0
C02 + HzO ~ > 4.0
Fig. 9. Projection of subsurface drill holes to 2 east--west cross-sections on the OH vein. The Amethyst 5 level (see Fig. 4) is approximately 120' and 240' below the centers of the 19,400' and 18,800 ~ cross-sections, respectively.

213
The top part of Fig. 9 shows the uppermost portion of an oreshoot where it dies out and the clay cap alteration covers it. Here we see high carbon- dioxide values directly above the vein and intermediate to high values above and in the vein. Two high values to the north of the main vein suggest the presence of a vein split in this area. On cross-section 18,800', located south of cross-section 19,400' and closer to the area of structural complexity where the OH vein nears the Amethyst vein, the relationship is not as well observed possibly because there is a set of mineralized structures here rather than a single vein.
It is by no means certain that this CO2 enrichment in clays above and in the hanging wall around the Creede veins resulted directly from processes that formed ore in the ore shoots. Although this is an attractive explanation, it is also possible that the CO2 resulted from more recent weathering or al- teration of carbonate minerals in the underlying vein system which released CO: that accumulated in the overlying clay cap. In this case, the presence of CO2 anomalies in the clay cap would correlate with the abundance of car- bonates and possibly sulfides to produce acid groundwater in the underlying vein system.
CONCLUSIONS
The gas analysis surveys described here demonstrate that wide composi- tional variations are observed in gases from fluid inclusions and in clays developed by alteration, and that these compositional variations can be cor- related with the distribution of mineralization in the systems. It appears that these gas patterns are relatively subtle, with peak to background ratios of 2 to 10 and therefore that they could be most useful in conjunction with other geochemical or geophysical surveys or in areas where more conven- tional surveys provide no guidance.
ACKNOWLEDGEMENTS
We are grateful to the operating companies at the properties discussed here, Rosario Dominicana and Pioneer Nuclear, for support during sample collection. Assistance with various aspects of the analyses and interpretations was kindly provided by P.L. Cloke and M. Gardner.
REFERENCES
Alexandrovska, E.S., Bannikova, L'.A. and Sushchevskaya, T.M., 1980. Errors in gas anal- ysis in thermal expansion of inclusions. Geokhimya, 1980, pp. 1710--1716 (in Rus- sian, translated in Geochem. Int., 17: 66--71).
Barker, C.G. and Torkelson, B.E., 1975. Gas adsorption on crushed quartz and basalt. Geochim. Cosmochim. Acta, 39: 212--218.

214
Barton, P.B., Jr., Bethke, P.M. and Roedder, E., 1977. Environment of ore deposition in the Creede mining district, San Juan Mountains, Colorado: Pt. III. Progress toward interpretation of the chemistry of the ore-forming fluid for the OH vein. Econ. Geol., 72: 1--24.
Behar, F. and Pineau, F., 1979. Analyse de CO2, H~O, hidrocarbones des inclusions fluides par chromatographie en phase gazeuse: Application aux fentex Alpines et aux noches metamorphiques. Bull. Mineral., 102: 611--621.
Bethke, P.M., Barton, P.B., Jr., Lanphere, M.A. and Steven, T.A., 1976. Environment of ore deposition in the Creede mining district, San Juan Mountains, Colorado. II. Age of mineralization. Econ. Geol., 71: 1006--1011.
Bethke, P.M. and Rye, R.O., 1979. Environment of ore deposition in the Creede mining district, San Juan Mountains, Colorado: Part IV. Source of fluids from hydrogen, oxygen, and carbon isotope studies. Econ. Geol., 74: 1832--1851.
Burlinson, K., Dubessy, J.C., Hladky, G. and Wilkins, R.W.T., 1983. The use of fluid de- crepitometry to distinguish mineralized and barren quartz veins in the Aberfoyle tin- tungsten mine area, Tasmania. J. Geochem. Explor., 19: 319--333.
Cuney, M., Pagel, M. and Touret, J., 1976. L'analyse des gaz des inclusions fluides par chromatographie en phase gazeuse. Bull. Soc. Fr. Mineral. Cristallogr., 99:169--177 (abstract in English).
Drummond, S.E., Jr., 1981. Boiling and mixing of hydrothermal fluids: chemical effects on mineral precipitation. Ph.D. thesis, Univ. of Arizona, 380 pp. (unpubl.).
Hinkle, M.E. and Harms, T.F., 1978. CS2 and COS in soil gas at the Roosevelt Hot Springs known geothermal resource area, Beaver County, Utah. J. Res. U.S. Geol. Surv., 6: 571- 578.
Horton, D., 1983. Argillic alteration associated with the Amethyst vein system, Creede mining district, Colorado. Ph.D. thesis, Univ. of Illinois at Urbana-Champaign, 335 pp. (unpubl.).
Kesler, S.E.~ Russell, N., Seaward, M., Rivera, J., McCurdy, K., Cumming, G.L. and Sutter, J.F., 1981, Geology and geochemistry of sulfide mineralization underlying the Pueblo Viejo gold-silver oxide deposit, Dominican Republic. Econ. Geol., 76: 1096-- 1117.
Leroy, J., 1979. Contribution ~i l'~italonnage de la pression interne des inclusions fluides lors de leur d~cr~pitation. Bull. Mineral., 102: 584--593.
Mackenzie, R.C. (Editor), 1957. The Differential Analysis of Clays. Min. Soc., London. Malakhov, V.V., 1977. Investigation of gas- l iquid inclusions in minerals by gas chroma-
tography. Geokhimya, 8 :1192- -1198 (in Russian; translated in Geochem. Int., 14(4): 142--147.
Nash, J.T., 1976. Fluid inclusion petrology -- data from porphyry copper deposits and applications to exploration. U.S. Geol. Surv., Prof. Pap. 907-D, 16 pp.
Norman, D.I., 1981. Gases in the mica minerals: A possible exploration tool for hydro- thermal ore deposits (abstr.). Geol. Soc. Am., Abstr. with Programs, 13 (7): 520.
Palin, J.M. and Norman, D.I., 1982. Volatiles in phyllosilicates, Copper Flat Porphyry Deposit, southwest New Mexico -- A potential exploration tool. Geol. Soc. Am., Abstr. with Programs, 14(4): 223.
Roedder, E., 1977. Fluid inclusions as tools in mineral exploration. Econ. Geol., 72: 503---525.
Russell, N., Seaward, M., Rivera, J.A., McCurdy, K., Kesler, S.E. and Cloke, P.L., 1981. Geology and geochemistry of the Pueblo Viejo gold-silver oxide ore deposit, Domini- can Republic. Trans., Inst. Min. Metal., Sec. B., 85: B153--B162.
Smith, F.G. and Peach, P.A., 1949. Apparatus for the recording of decrepitat ion in miner- als. Econ. Geol., 44: 449--454.
Smith, T.J. and Kesler, S.E., 1985. Wallrock alteration, lithogeochemical and fluid inclu- sion zonation patterns at the McIntyre--Hollinger gold deposit, Timmins, Ontario. Can. Inst. Min. Metall., 34: 85--94.

215
Steven, T.A. and Eaton, G.P., 1975. Environment of ore deposition in the Creede mining district, San Juan Mountains, Colorado: I. Geologic, hydrologic and geophysical set- ting. Econ. Geol., 70: 1023--1037.
Stoiber, R.E. and Rose, W.I., Jr., 1974. C1, F, and SO2 in Central American volcanic gases. Bull. Volcanol., 37: 454--460.
Takenouchi, S. and Kennedy, G.S., 1965. The solubility of carbon dioxide in NaC1 solu- tions at high temperatures and pressures. Am. J. Sci., 263: 445--454.
Wetlaufer, P.H., 1978. Chemical similarities of hydrothermal fluids from diverse sources, Creede Ag-Pb-Zn-Cu district, San Juan Mountains, Colorado. Geol. Soc. Am., Abstr. Programs, 10(6): 515.