application of multi criteria decision maki ng … · application of multi criteria decision maki...
TRANSCRIPT

* Corresponding author. Tel.: +98 9143450999; Fax: +98 4432773920 E-mail address: [email protected] (A. Doniavi) © 2016 Growing Science Ltd. All rights reserved. doi: 10.5267/j.dsl.2016.2.005
Decision Science Letters 5 (2016) 349–360
Contents lists available at GrowingScience
Decision Science Letters
homepage: www.GrowingScience.com/dsl
Application of multi criteria decision making methods to select sheet hydroforming process parameters
Vahid Modanloo, Ali Doniavi* and Rezgar Hasanzadeh
Mechanical Engineering Department, Faculty of Engineering, Urmia University, Urmia, Iran
C H R O N I C L E A B S T R A C T
Article history: Received October 25, 2015 Received in revised format: February 12, 2016 Accepted February 22, 2016 Available online Februray 22 2016
The present study endeavors to show an application of the multi objective optimization on the basis of ratio analysis (MOORA) method and technique for order performance by similarity to ideal solution (TOPSIS) method to select optimal process parameters in sheet hydroforming process. The right choice of the process parameters is critical to produce a final part with proper quality. In order to meet this characteristic, the important properties are the cup final thickness (FT), required forming force (FF) and radial stress (RS) at cup wall region. Nine alternatives for selecting the process parameters were taken into consideration based on Taguchi L9 orthogonal array. The limit drawing ratio (LDR), maximum pressure and prebulge pressure were selected as input variables. To solve the problem of process parameters’ selection, the two mentioned methods were used. A compromised weighting approach composed of Entropy and analytic hierarchy process (AHP) methods were used to weight all criteria. The alternatives ranking were performed using MOORA and TOPSIS methods and then the results were compared. The results achieved in both of the assessment represent that the alternative number 3, leads to the best multi performance features of the process among the 9 experiments. In this experiment LDR is 1.81, maximum pressure and prebulge pressure are 37 MPa and 15 MPa, respectively.
Growing Science Ltd. All rights reserved.6© 201
Keywords: Process parameters selection Multi criteria decision making method Weighting Ranking Sheet hydroforming
1. Introduction
Nowadays, producing sheet metal parts with adequate quality, high order performance and light weight is the most important challenge in aerospace and automotive industries. In order to fabricate sheet metal products, several methods are normally used in different industries such as spinning, electromagnetic forming, hot stamping, deep drawing and hydroforming. Among these methods, sheet hydroforming provides producing final cups with good surface quality and high dimensional accuracy (Palumbo et al., 2006). On the other hand, one of the main disadvantages of this technology is the need for more forming force compared with conventional deep drawing. In the sheet hydroforming process, the hydraulic pressure is used instead of a female die to deform the sheet into a desired profile. Design
350
approaches based on trial and error, leads to increase time and cost. As a result, process parameters selection has a notable importance in design and development of the products. Many attempts have been done in optimizing the process parameters of hydroforming. In this regard, various methods have been reported including response surface methodology (RSM) (Ahmadi-Brooghani et al., 2014), Taguchi method (TM) (Sharma & Rout, 2009), Genetic Algorithm (GA) (Zhang & Ge, 2013), artificial neural network (ANN) (Singh & Kumar, 2004), simulated annealing (SA) algorithm (Peng et al., 2008) and hybrid methods (Shahrajabian et al., 2011). Multi criteria decision making (MCDM) methods are widely used in material selection problem. These methods select the best option among a large number of alternatives and criteria (Chatterjee & Chakraborty, 2012). In recent years, plenty of MCDM methods have been presented by researches such as TOPSIS (Shanian & Savadogo, 2006), VIKOR (Jahan et al., 2011), ELECTRE (Shanian & Savadogo, 2006), Ashby approach (Rashedi et al., 2012) and MOORA (Karande & Chakraborty, 2012) to enhance the design process efficiency. However, a study due to the process parameters selection for sheet hydroforming using MCDM methods was not found in the literature to the best knowledge of the authors. In the current work, a systematic model for process parameters selection is proposed to help the sheet hydroforming process designers. At first, all criteria were weighted using a compromised weighting method, composed of the Entropy and analytical process (AHP) methods. Afterwards, the alternatives (trial condition) were ranked using MOORA and TOPSIS methods in order to determine the optimal level of process parameters regarding to different criteria. 2. Definition of the decision making problem
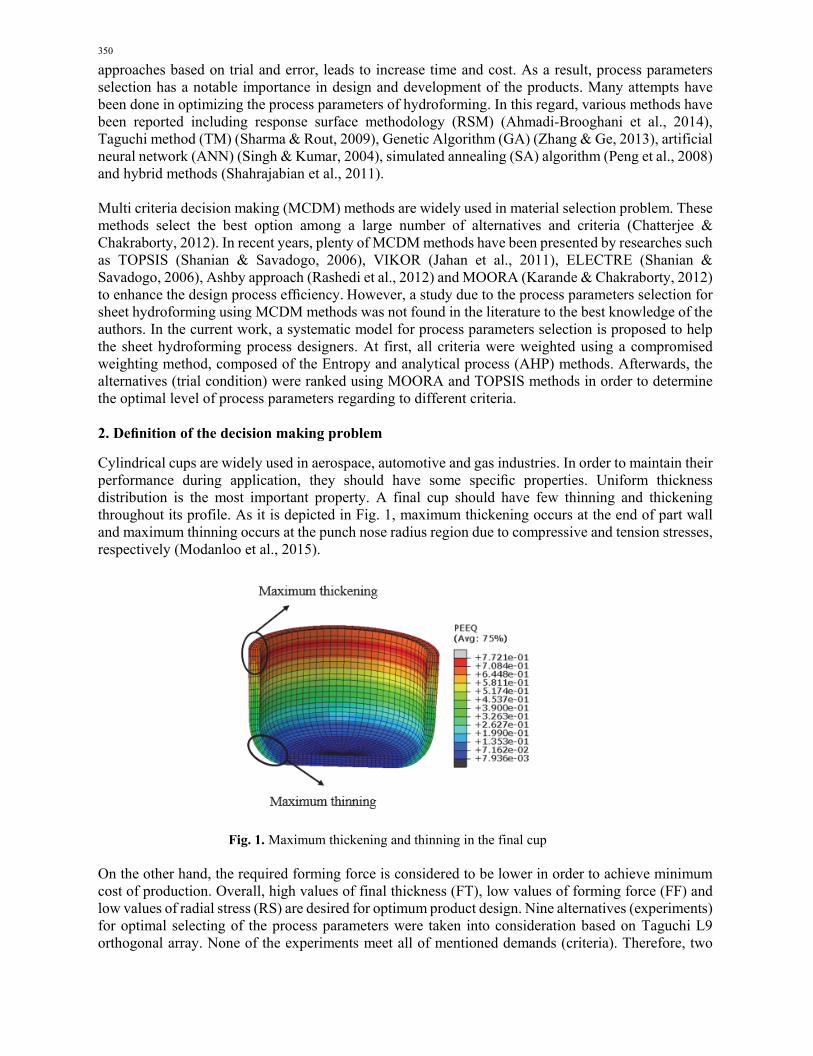
Cylindrical cups are widely used in aerospace, automotive and gas industries. In order to maintain their performance during application, they should have some specific properties. Uniform thickness distribution is the most important property. A final cup should have few thinning and thickening throughout its profile. As it is depicted in Fig. 1, maximum thickening occurs at the end of part wall and maximum thinning occurs at the punch nose radius region due to compressive and tension stresses, respectively (Modanloo et al., 2015).
Fig. 1. Maximum thickening and thinning in the final cup On the other hand, the required forming force is considered to be lower in order to achieve minimum cost of production. Overall, high values of final thickness (FT), low values of forming force (FF) and low values of radial stress (RS) are desired for optimum product design. Nine alternatives (experiments) for optimal selecting of the process parameters were taken into consideration based on Taguchi L9 orthogonal array. None of the experiments meet all of mentioned demands (criteria). Therefore, two
V. Modanloo et al. / Decision Science Letters 5 (2016)
351
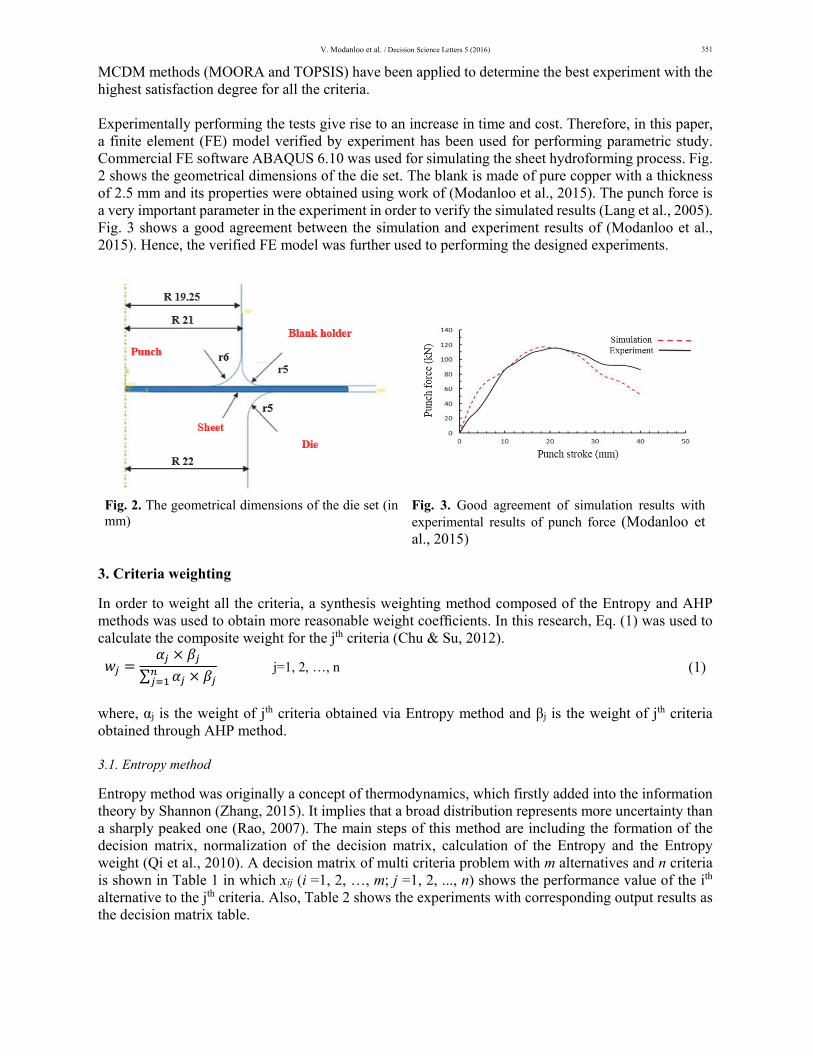
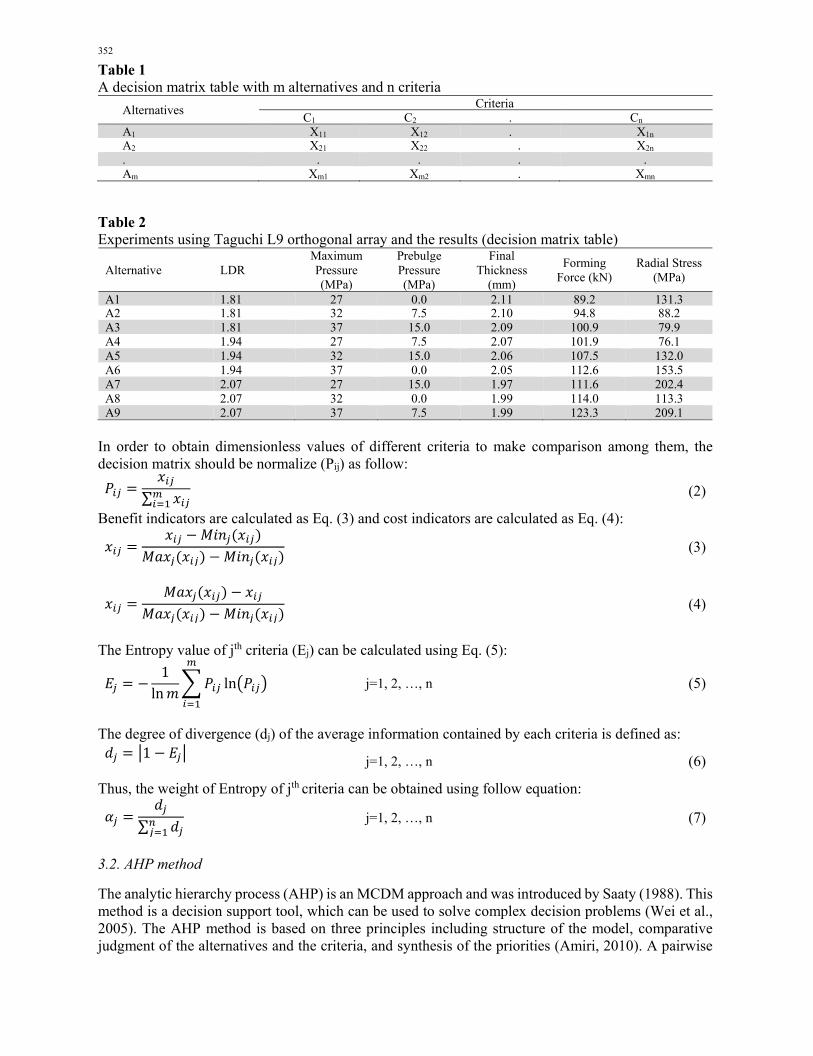
MCDM methods (MOORA and TOPSIS) have been applied to determine the best experiment with the highest satisfaction degree for all the criteria. Experimentally performing the tests give rise to an increase in time and cost. Therefore, in this paper, a finite element (FE) model verified by experiment has been used for performing parametric study. Commercial FE software ABAQUS 6.10 was used for simulating the sheet hydroforming process. Fig. 2 shows the geometrical dimensions of the die set. The blank is made of pure copper with a thickness of 2.5 mm and its properties were obtained using work of (Modanloo et al., 2015). The punch force is a very important parameter in the experiment in order to verify the simulated results (Lang et al., 2005). Fig. 3 shows a good agreement between the simulation and experiment results of (Modanloo et al., 2015). Hence, the verified FE model was further used to performing the designed experiments.
Fig. 2. The geometrical dimensions of the die set (in mm)
Fig. 3. Good agreement of simulation results with experimental results of punch force (Modanloo et al., 2015)
3. Criteria weighting
In order to weight all the criteria, a synthesis weighting method composed of the Entropy and AHP methods was used to obtain more reasonable weight coefficients. In this research, Eq. (1) was used to calculate the composite weight for the jth criteria (Chu & Su, 2012).
(1) j=1, 2, …, n ∑
where, αj is the weight of jth criteria obtained via Entropy method and βj is the weight of jth criteria obtained through AHP method.
3.1. Entropy method
Entropy method was originally a concept of thermodynamics, which firstly added into the information theory by Shannon (Zhang, 2015). It implies that a broad distribution represents more uncertainty than a sharply peaked one (Rao, 2007). The main steps of this method are including the formation of the decision matrix, normalization of the decision matrix, calculation of the Entropy and the Entropy weight (Qi et al., 2010). A decision matrix of multi criteria problem with m alternatives and n criteria is shown in Table 1 in which xij (i =1, 2, …, m; j =1, 2, ..., n) shows the performance value of the ith alternative to the jth criteria. Also, Table 2 shows the experiments with corresponding output results as the decision matrix table.
352
Table 1 A decision matrix table with m alternatives and n criteria
Alternatives CriteriaC1 C2 . Cn
A1 X11 X12 . X1n
A2 X21 X22 . X2n
. . . . . Am Xm1 Xm2 . Xmn
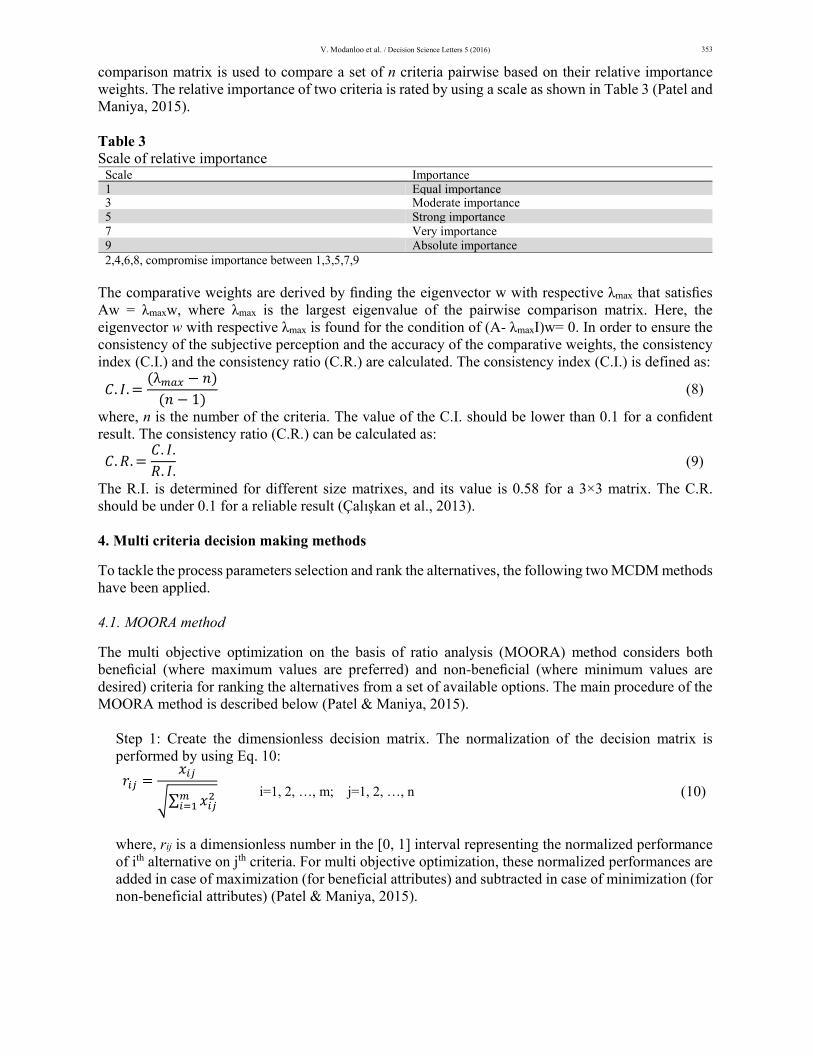
Table 2 Experiments using Taguchi L9 orthogonal array and the results (decision matrix table)
Alternative LDR Maximum Pressure (MPa)
Prebulge Pressure (MPa)
Final Thickness
(mm)
Forming Force (kN)
Radial Stress (MPa)
A1 1.81 27 0.0 2.11 89.2 131.3A2 1.81 32 7.5 2.10 94.8 88.2A3 1.81 37 15.0 2.09 100.9 79.9A4 1.94 27 7.5 2.07 101.9 76.1A5 1.94 32 15.0 2.06 107.5 132.0A6 1.94 37 0.0 2.05 112.6 153.5A7 2.07 27 15.0 1.97 111.6 202.4A8 2.07 32 0.0 1.99 114.0 113.3A9 2.07 37 7.5 1.99 123.3 209.1
In order to obtain dimensionless values of different criteria to make comparison among them, the decision matrix should be normalize (Pij) as follow:
(2) ∑Benefit indicators are calculated as Eq. (3) and cost indicators are calculated as Eq. (4):
(3)
(4)
The Entropy value of jth criteria (Ej) can be calculated using Eq. (5):
(5) j=1, 2, …, n 1
lnln
The degree of divergence (dj) of the average information contained by each criteria is defined as:
(6) j=1, 2, …, n 1
Thus, the weight of Entropy of jth criteria can be obtained using follow equation:
(7) j=1, 2, …, n ∑
3.2. AHP method
The analytic hierarchy process (AHP) is an MCDM approach and was introduced by Saaty (1988). This method is a decision support tool, which can be used to solve complex decision problems (Wei et al., 2005). The AHP method is based on three principles including structure of the model, comparative judgment of the alternatives and the criteria, and synthesis of the priorities (Amiri, 2010). A pairwise
V. Modanloo et al. / Decision Science Letters 5 (2016)
353
comparison matrix is used to compare a set of n criteria pairwise based on their relative importance weights. The relative importance of two criteria is rated by using a scale as shown in Table 3 (Patel and Maniya, 2015).
Table 3 Scale of relative importance
Scale Importance1 Equal importance3 Moderate importance5 Strong importance7 Very importance9 Absolute importance2,4,6,8, compromise importance between 1,3,5,7,9
The comparative weights are derived by finding the eigenvector w with respective λmax that satisfies Aw = λmaxw, where λmax is the largest eigenvalue of the pairwise comparison matrix. Here, the eigenvector w with respective λmax is found for the condition of (A- λmaxI)w= 0. In order to ensure the consistency of the subjective perception and the accuracy of the comparative weights, the consistency index (C.I.) and the consistency ratio (C.R.) are calculated. The consistency index (C.I.) is defined as:
(8) . .λ
1where, n is the number of the criteria. The value of the C.I. should be lower than 0.1 for a confident result. The consistency ratio (C.R.) can be calculated as:
(9) . .. .. .
The R.I. is determined for different size matrixes, and its value is 0.58 for a 3×3 matrix. The C.R. should be under 0.1 for a reliable result (Çalışkan et al., 2013).
4. Multi criteria decision making methods
To tackle the process parameters selection and rank the alternatives, the following two MCDM methods have been applied.
4.1. MOORA method
The multi objective optimization on the basis of ratio analysis (MOORA) method considers both beneficial (where maximum values are preferred) and non-beneficial (where minimum values are desired) criteria for ranking the alternatives from a set of available options. The main procedure of the MOORA method is described below (Patel & Maniya, 2015).
Step 1: Create the dimensionless decision matrix. The normalization of the decision matrix is performed by using Eq. 10:
(10) i=1, 2, …, m; j=1, 2, …, n ∑
where, rij is a dimensionless number in the [0, 1] interval representing the normalized performance of ith alternative on jth criteria. For multi objective optimization, these normalized performances are added in case of maximization (for beneficial attributes) and subtracted in case of minimization (for non-beneficial attributes) (Patel & Maniya, 2015).
354
Step 2: Determine the assessment value of ith alternative with respect to all the criteria as following equation in which g is the number of criteria to be maximized, (n-g) is the number of criteria to be minimized, wj is the compromised weight and yi is the assessment value (Patel & Maniya, 2015).
(11) j=1, 2, …, n
The higher values of yi mean that the rank is better.
4.2. TOPSIS method
Technique for order performance by similarity to ideal solution (TOPSIS) method is based on the idea that the best alternative should have the shortest distance from an ideal solution and was introduced by Yoon and Hwang (1980). The steps of this method are summarized below (Çalışkan et al., 2013):
Step 1: Construct the normalized decision matrix. This step is similar to first step of MOORA method using Eq. 10. Step 2: Construct the weighted normalized decision matrix. The columns of the normalized decision matrix are multiplied by the related weights (wj) obtained from Eq. (1). The weighted normalized decision matrix is defined as:
(12) i=1, 2, …, m; j=1, 2, …, n
Step 3: The ideal and negative ideal solutions are determined respectively, as follows:
(13), , … , ∈ , ∈ , 1, 2, … ,
(14) , , … , ∈ , ∈ , 1, 2, … ,
where K and , are the index set of benefit criteria and the index set of cost criteria, respectively. Step 4: Compute the distances from the ideal and negative solutions. These two Euclidean distances for each alternative are calculated as follows:
(15) i=1, 2, …, m; j=1, 2, …, n
.
(16) i=1, 2, …, m; j=1, 2, …, n
.
Step 5: Calculate the relative closeness to the ideal solution. The relative closeness of an alternative to the ideal solution is indicated by:
(17) i=1, 2, …, m; 0 1
The best alternative is determined by the one with the highest Ci value.
V. Modanloo et al. / Decision Science Letters 5 (2016)
355
5. Results and discussion
In order to show the applicability of MOORA and TOPSIS methods with respect to the weighting methods of Entropy and AHP, the process parameters selection for sheet hydroforming was considered. The various steps involved in mentioned methods were discussed above. At first, weights of different criteria were determined using the Entropy and AHP methods and then the MCDM methods were applied to solve the problem.
5.1. Criteria weighting
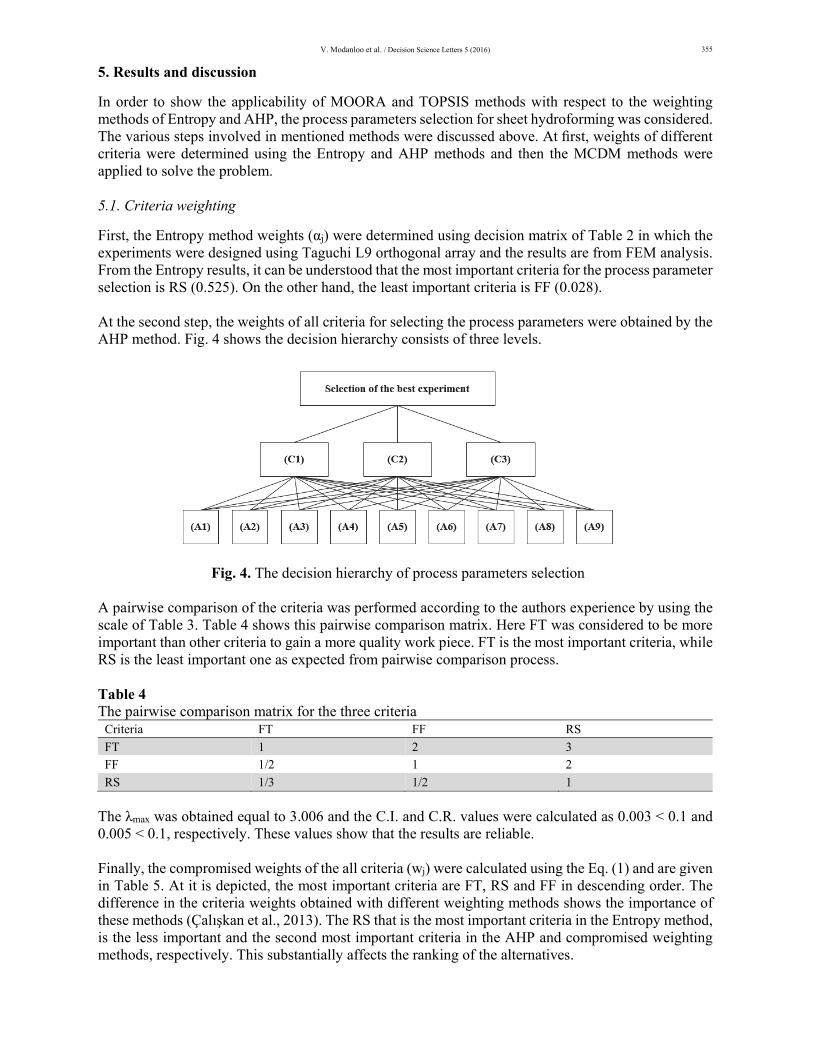
First, the Entropy method weights (αj) were determined using decision matrix of Table 2 in which the experiments were designed using Taguchi L9 orthogonal array and the results are from FEM analysis. From the Entropy results, it can be understood that the most important criteria for the process parameter selection is RS (0.525). On the other hand, the least important criteria is FF (0.028). At the second step, the weights of all criteria for selecting the process parameters were obtained by the AHP method. Fig. 4 shows the decision hierarchy consists of three levels.
Fig. 4. The decision hierarchy of process parameters selection A pairwise comparison of the criteria was performed according to the authors experience by using the scale of Table 3. Table 4 shows this pairwise comparison matrix. Here FT was considered to be more important than other criteria to gain a more quality work piece. FT is the most important criteria, while RS is the least important one as expected from pairwise comparison process.
Table 4 The pairwise comparison matrix for the three criteria
Criteria FT FF RS
FT 1 2 3
FF 1/2 1 2
RS 1/3 1/2 1
The λmax was obtained equal to 3.006 and the C.I. and C.R. values were calculated as 0.003 < 0.1 and 0.005 < 0.1, respectively. These values show that the results are reliable. Finally, the compromised weights of the all criteria (wj) were calculated using the Eq. (1) and are given in Table 5. At it is depicted, the most important criteria are FT, RS and FF in descending order. The difference in the criteria weights obtained with different weighting methods shows the importance of these methods (Çalışkan et al., 2013). The RS that is the most important criteria in the Entropy method, is the less important and the second most important criteria in the AHP and compromised weighting methods, respectively. This substantially affects the ranking of the alternatives.
356
Table 5 Criteria weighting by the Entropy (αj), AHP (βj) and compromised weighting (wj) methods
FT FF RS αj 0.447 0.028 0.525 βj 0.540 0.297 0.163 wj 0.720 0.025 0.255
5.2. MOORA method
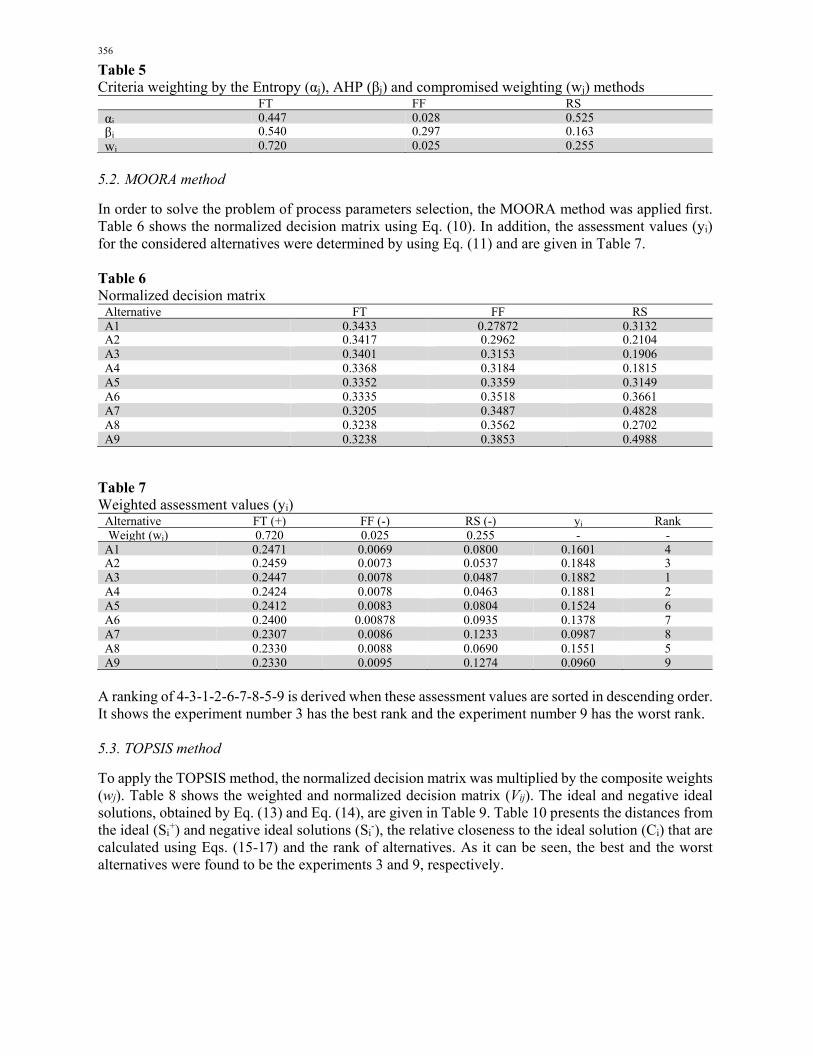
In order to solve the problem of process parameters selection, the MOORA method was applied first. Table 6 shows the normalized decision matrix using Eq. (10). In addition, the assessment values (yi) for the considered alternatives were determined by using Eq. (11) and are given in Table 7.
Table 6 Normalized decision matrix
Alternative FT FF RS A1 0.3433 0.27872 0.3132A2 0.3417 0.2962 0.2104A3 0.3401 0.3153 0.1906A4 0.3368 0.3184 0.1815A5 0.3352 0.3359 0.3149A6 0.3335 0.3518 0.3661A7 0.3205 0.3487 0.4828A8 0.3238 0.3562 0.2702A9 0.3238 0.3853 0.4988
Table 7 Weighted assessment values (yi)
Alternative FT (+) FF (-) RS (-) yi Rank Weight (wj) 0.720 0.025 0.255 - -A1 0.2471 0.0069 0.0800 0.1601 4A2 0.2459 0.0073 0.0537 0.1848 3A3 0.2447 0.0078 0.0487 0.1882 1A4 0.2424 0.0078 0.0463 0.1881 2A5 0.2412 0.0083 0.0804 0.1524 6A6 0.2400 0.00878 0.0935 0.1378 7A7 0.2307 0.0086 0.1233 0.0987 8A8 0.2330 0.0088 0.0690 0.1551 5A9 0.2330 0.0095 0.1274 0.0960 9
A ranking of 4-3-1-2-6-7-8-5-9 is derived when these assessment values are sorted in descending order. It shows the experiment number 3 has the best rank and the experiment number 9 has the worst rank.
5.3. TOPSIS method
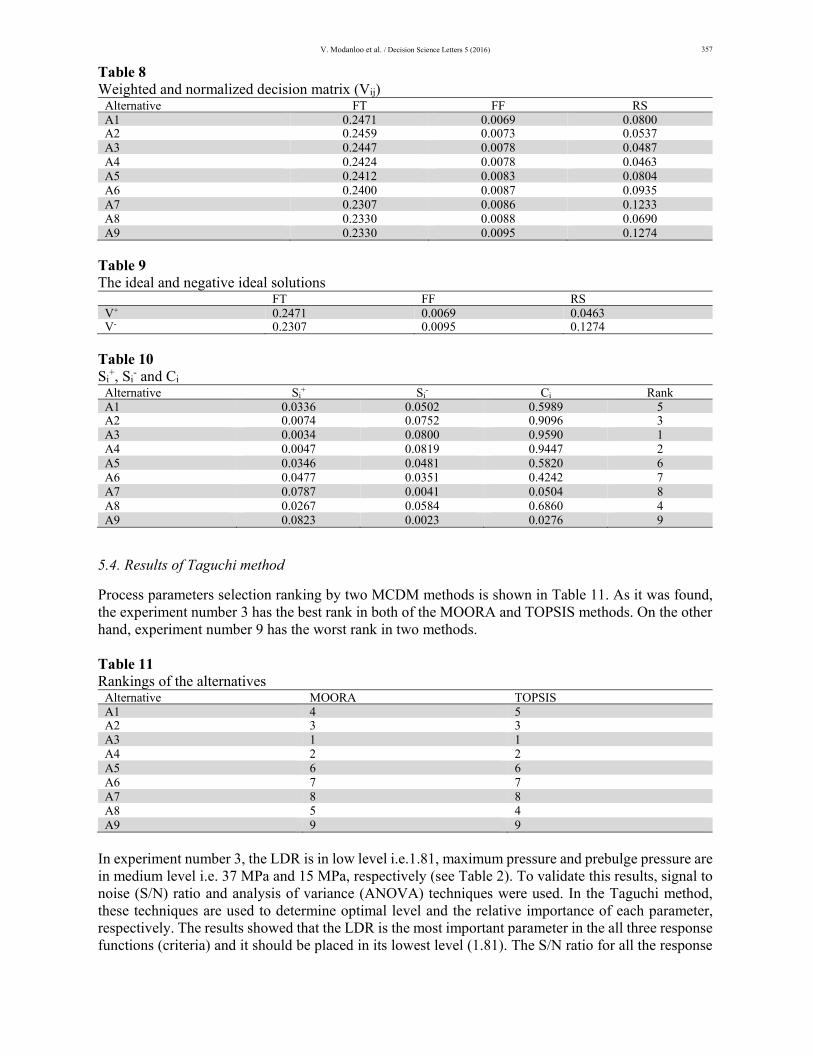
To apply the TOPSIS method, the normalized decision matrix was multiplied by the composite weights (wj). Table 8 shows the weighted and normalized decision matrix (Vij). The ideal and negative ideal solutions, obtained by Eq. (13) and Eq. (14), are given in Table 9. Table 10 presents the distances from the ideal (Si
+) and negative ideal solutions (Si-), the relative closeness to the ideal solution (Ci) that are
calculated using Eqs. (15-17) and the rank of alternatives. As it can be seen, the best and the worst alternatives were found to be the experiments 3 and 9, respectively.
V. Modanloo et al. / Decision Science Letters 5 (2016)
357
Table 8 Weighted and normalized decision matrix (Vij)
Alternative FT FF RS A1 0.2471 0.0069 0.0800A2 0.2459 0.0073 0.0537A3 0.2447 0.0078 0.0487A4 0.2424 0.0078 0.0463A5 0.2412 0.0083 0.0804A6 0.2400 0.0087 0.0935A7 0.2307 0.0086 0.1233A8 0.2330 0.0088 0.0690A9 0.2330 0.0095 0.1274
Table 9 The ideal and negative ideal solutions
FT FF RS V+ 0.2471 0.0069 0.0463 V- 0.2307 0.0095 0.1274
Table 10 Si
+, Si- and Ci
Alternative Si+ Si
- Ci RankA1 0.0336 0.0502 0.5989 5A2 0.0074 0.0752 0.9096 3A3 0.0034 0.0800 0.9590 1A4 0.0047 0.0819 0.9447 2A5 0.0346 0.0481 0.5820 6A6 0.0477 0.0351 0.4242 7A7 0.0787 0.0041 0.0504 8A8 0.0267 0.0584 0.6860 4A9 0.0823 0.0023 0.0276 9
5.4. Results of Taguchi method
Process parameters selection ranking by two MCDM methods is shown in Table 11. As it was found, the experiment number 3 has the best rank in both of the MOORA and TOPSIS methods. On the other hand, experiment number 9 has the worst rank in two methods.
Table 11 Rankings of the alternatives
Alternative MOORA TOPSISA1 4 5A2 3 3A3 1 1A4 2 2A5 6 6A6 7 7A7 8 8A8 5 4A9 9 9
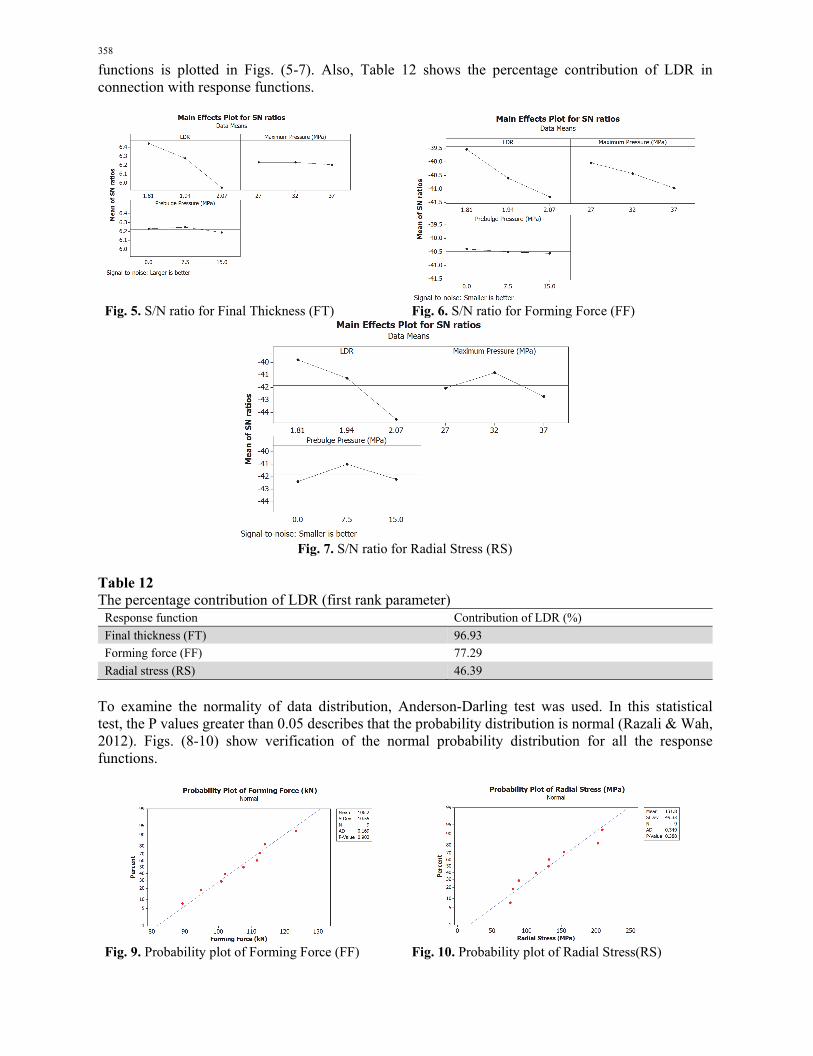
In experiment number 3, the LDR is in low level i.e.1.81, maximum pressure and prebulge pressure are in medium level i.e. 37 MPa and 15 MPa, respectively (see Table 2). To validate this results, signal to noise (S/N) ratio and analysis of variance (ANOVA) techniques were used. In the Taguchi method, these techniques are used to determine optimal level and the relative importance of each parameter, respectively. The results showed that the LDR is the most important parameter in the all three response functions (criteria) and it should be placed in its lowest level (1.81). The S/N ratio for all the response
358
functions is plotted in Figs. (5-7). Also, Table 12 shows the percentage contribution of LDR in connection with response functions.
Fig. 5. S/N ratio for Final Thickness (FT) Fig. 6. S/N ratio for Forming Force (FF)
Fig. 7. S/N ratio for Radial Stress (RS)
Table 12 The percentage contribution of LDR (first rank parameter)
Response function Contribution of LDR (%)
Final thickness (FT) 96.93
Forming force (FF) 77.29
Radial stress (RS) 46.39
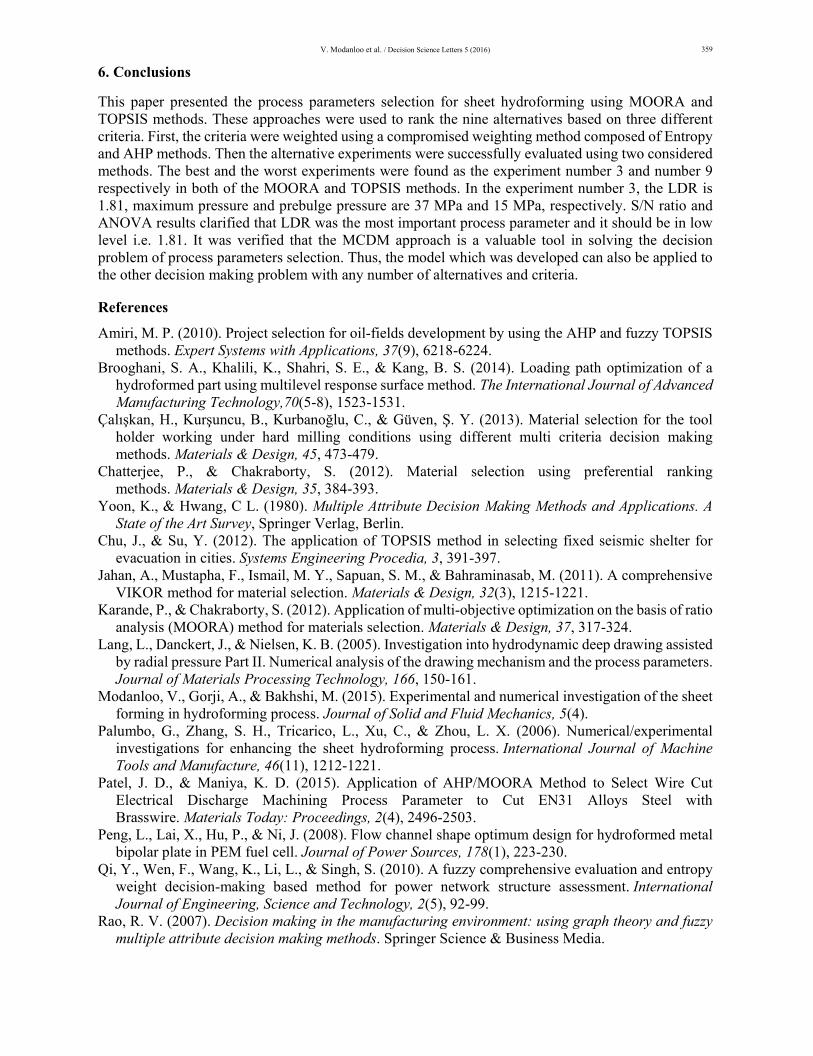
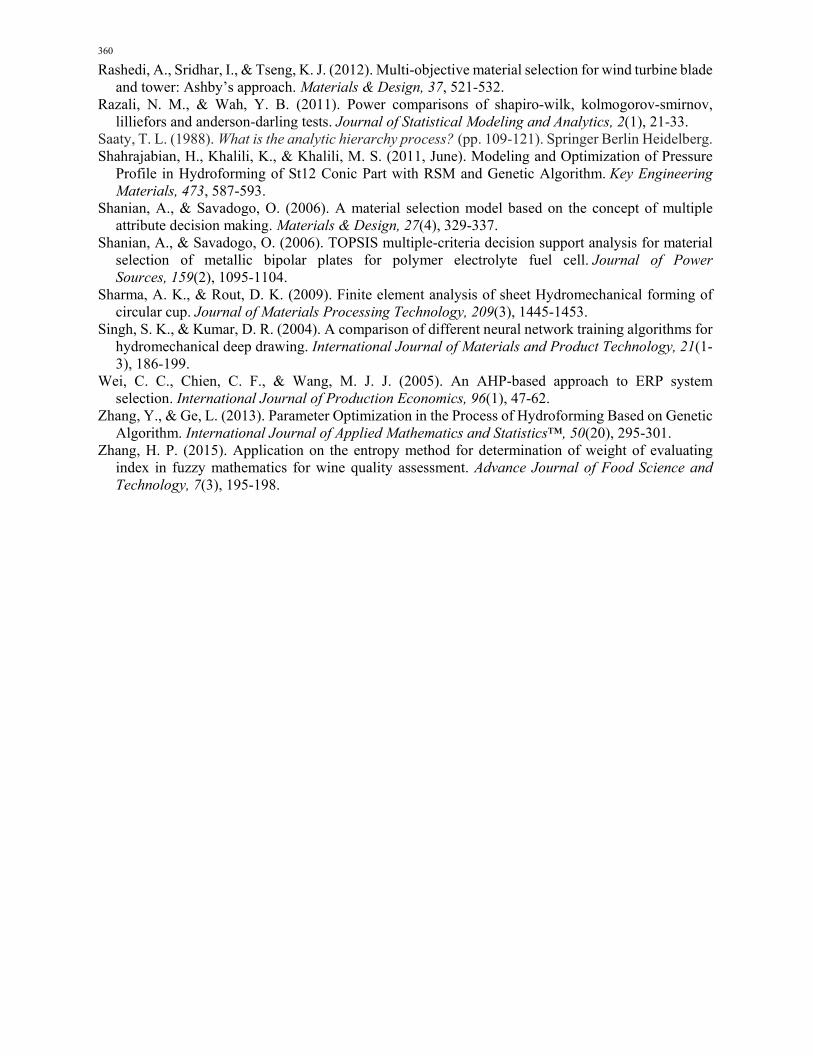
To examine the normality of data distribution, Anderson-Darling test was used. In this statistical test, the P values greater than 0.05 describes that the probability distribution is normal (Razali & Wah, 2012). Figs. (8-10) show verification of the normal probability distribution for all the response functions.
Fig. 9. Probability plot of Forming Force (FF) Fig. 10. Probability plot of Radial Stress(RS)
V. Modanloo et al. / Decision Science Letters 5 (2016)
359
6. Conclusions
This paper presented the process parameters selection for sheet hydroforming using MOORA and TOPSIS methods. These approaches were used to rank the nine alternatives based on three different criteria. First, the criteria were weighted using a compromised weighting method composed of Entropy and AHP methods. Then the alternative experiments were successfully evaluated using two considered methods. The best and the worst experiments were found as the experiment number 3 and number 9 respectively in both of the MOORA and TOPSIS methods. In the experiment number 3, the LDR is 1.81, maximum pressure and prebulge pressure are 37 MPa and 15 MPa, respectively. S/N ratio and ANOVA results clarified that LDR was the most important process parameter and it should be in low level i.e. 1.81. It was verified that the MCDM approach is a valuable tool in solving the decision problem of process parameters selection. Thus, the model which was developed can also be applied to the other decision making problem with any number of alternatives and criteria.
References
Amiri, M. P. (2010). Project selection for oil-fields development by using the AHP and fuzzy TOPSIS methods. Expert Systems with Applications, 37(9), 6218-6224.
Brooghani, S. A., Khalili, K., Shahri, S. E., & Kang, B. S. (2014). Loading path optimization of a hydroformed part using multilevel response surface method. The International Journal of Advanced Manufacturing Technology,70(5-8), 1523-1531.
Çalışkan, H., Kurşuncu, B., Kurbanoğlu, C., & Güven, Ş. Y. (2013). Material selection for the tool holder working under hard milling conditions using different multi criteria decision making methods. Materials & Design, 45, 473-479.
Chatterjee, P., & Chakraborty, S. (2012). Material selection using preferential ranking methods. Materials & Design, 35, 384-393.
Yoon, K., & Hwang, C L. (1980). Multiple Attribute Decision Making Methods and Applications. A State of the Art Survey, Springer Verlag, Berlin.
Chu, J., & Su, Y. (2012). The application of TOPSIS method in selecting fixed seismic shelter for evacuation in cities. Systems Engineering Procedia, 3, 391-397.
Jahan, A., Mustapha, F., Ismail, M. Y., Sapuan, S. M., & Bahraminasab, M. (2011). A comprehensive VIKOR method for material selection. Materials & Design, 32(3), 1215-1221.
Karande, P., & Chakraborty, S. (2012). Application of multi-objective optimization on the basis of ratio analysis (MOORA) method for materials selection. Materials & Design, 37, 317-324.
Lang, L., Danckert, J., & Nielsen, K. B. (2005). Investigation into hydrodynamic deep drawing assisted by radial pressure Part II. Numerical analysis of the drawing mechanism and the process parameters. Journal of Materials Processing Technology, 166, 150-161.
Modanloo, V., Gorji, A., & Bakhshi, M. (2015). Experimental and numerical investigation of the sheet forming in hydroforming process. Journal of Solid and Fluid Mechanics, 5(4).
Palumbo, G., Zhang, S. H., Tricarico, L., Xu, C., & Zhou, L. X. (2006). Numerical/experimental investigations for enhancing the sheet hydroforming process. International Journal of Machine Tools and Manufacture, 46(11), 1212-1221.
Patel, J. D., & Maniya, K. D. (2015). Application of AHP/MOORA Method to Select Wire Cut Electrical Discharge Machining Process Parameter to Cut EN31 Alloys Steel with Brasswire. Materials Today: Proceedings, 2(4), 2496-2503.
Peng, L., Lai, X., Hu, P., & Ni, J. (2008). Flow channel shape optimum design for hydroformed metal bipolar plate in PEM fuel cell. Journal of Power Sources, 178(1), 223-230.
Qi, Y., Wen, F., Wang, K., Li, L., & Singh, S. (2010). A fuzzy comprehensive evaluation and entropy weight decision-making based method for power network structure assessment. International Journal of Engineering, Science and Technology, 2(5), 92-99.
Rao, R. V. (2007). Decision making in the manufacturing environment: using graph theory and fuzzy multiple attribute decision making methods. Springer Science & Business Media.
360
Rashedi, A., Sridhar, I., & Tseng, K. J. (2012). Multi-objective material selection for wind turbine blade and tower: Ashby’s approach. Materials & Design, 37, 521-532.
Razali, N. M., & Wah, Y. B. (2011). Power comparisons of shapiro-wilk, kolmogorov-smirnov, lilliefors and anderson-darling tests. Journal of Statistical Modeling and Analytics, 2(1), 21-33.
Saaty, T. L. (1988). What is the analytic hierarchy process? (pp. 109-121). Springer Berlin Heidelberg. Shahrajabian, H., Khalili, K., & Khalili, M. S. (2011, June). Modeling and Optimization of Pressure
Profile in Hydroforming of St12 Conic Part with RSM and Genetic Algorithm. Key Engineering Materials, 473, 587-593.
Shanian, A., & Savadogo, O. (2006). A material selection model based on the concept of multiple attribute decision making. Materials & Design, 27(4), 329-337.
Shanian, A., & Savadogo, O. (2006). TOPSIS multiple-criteria decision support analysis for material selection of metallic bipolar plates for polymer electrolyte fuel cell. Journal of Power Sources, 159(2), 1095-1104.
Sharma, A. K., & Rout, D. K. (2009). Finite element analysis of sheet Hydromechanical forming of circular cup. Journal of Materials Processing Technology, 209(3), 1445-1453.
Singh, S. K., & Kumar, D. R. (2004). A comparison of different neural network training algorithms for hydromechanical deep drawing. International Journal of Materials and Product Technology, 21(1-3), 186-199.
Wei, C. C., Chien, C. F., & Wang, M. J. J. (2005). An AHP-based approach to ERP system selection. International Journal of Production Economics, 96(1), 47-62.
Zhang, Y., & Ge, L. (2013). Parameter Optimization in the Process of Hydroforming Based on Genetic Algorithm. International Journal of Applied Mathematics and Statistics™, 50(20), 295-301.
Zhang, H. P. (2015). Application on the entropy method for determination of weight of evaluating index in fuzzy mathematics for wine quality assessment. Advance Journal of Food Science and Technology, 7(3), 195-198.