application of synthetic jets to reduce stator flow
TRANSCRIPT

Edward P. Braunscheidel, Dennis E. Culley, and Khairul B.M.Q. ZamanGlenn Research Center, Cleveland, Ohio
Application of Synthetic Jets to Reduce Stator Flow Separation in a Low Speed Axial Compressor
NASA/TM—2008-215145
December 2008
AIAA–2008–0602

NASA STI Program . . . in Profi le
Since its founding, NASA has been dedicated to the advancement of aeronautics and space science. The NASA Scientifi c and Technical Information (STI) program plays a key part in helping NASA maintain this important role.
The NASA STI Program operates under the auspices of the Agency Chief Information Offi cer. It collects, organizes, provides for archiving, and disseminates NASA’s STI. The NASA STI program provides access to the NASA Aeronautics and Space Database and its public interface, the NASA Technical Reports Server, thus providing one of the largest collections of aeronautical and space science STI in the world. Results are published in both non-NASA channels and by NASA in the NASA STI Report Series, which includes the following report types: • TECHNICAL PUBLICATION. Reports of
completed research or a major signifi cant phase of research that present the results of NASA programs and include extensive data or theoretical analysis. Includes compilations of signifi cant scientifi c and technical data and information deemed to be of continuing reference value. NASA counterpart of peer-reviewed formal professional papers but has less stringent limitations on manuscript length and extent of graphic presentations.
• TECHNICAL MEMORANDUM. Scientifi c
and technical fi ndings that are preliminary or of specialized interest, e.g., quick release reports, working papers, and bibliographies that contain minimal annotation. Does not contain extensive analysis.
• CONTRACTOR REPORT. Scientifi c and
technical fi ndings by NASA-sponsored contractors and grantees.
• CONFERENCE PUBLICATION. Collected
papers from scientifi c and technical conferences, symposia, seminars, or other meetings sponsored or cosponsored by NASA.
• SPECIAL PUBLICATION. Scientifi c,
technical, or historical information from NASA programs, projects, and missions, often concerned with subjects having substantial public interest.
• TECHNICAL TRANSLATION. English-
language translations of foreign scientifi c and technical material pertinent to NASA’s mission.
Specialized services also include creating custom thesauri, building customized databases, organizing and publishing research results.
For more information about the NASA STI program, see the following:
• Access the NASA STI program home page at http://www.sti.nasa.gov
• E-mail your question via the Internet to help@
sti.nasa.gov • Fax your question to the NASA STI Help Desk
at 301–621–0134 • Telephone the NASA STI Help Desk at 301–621–0390 • Write to:
NASA Center for AeroSpace Information (CASI) 7115 Standard Drive Hanover, MD 21076–1320

Edward P. Braunscheidel, Dennis E. Culley, and Khairul B.M.Q. ZamanGlenn Research Center, Cleveland, Ohio
Application of Synthetic Jets to Reduce Stator Flow Separation in a Low Speed Axial Compressor
NASA/TM—2008-215145
December 2008
AIAA–2008–0602
National Aeronautics andSpace Administration
Glenn Research CenterCleveland, Ohio 44135
Prepared for the46th Aerospace Science Meeting and Exhibitsponsored by the American Institute of Aeronautics and AstronauticsReno, Nevada, January 7–10, 2008

Acknowledgments
The work reported in this paper was performed under the Fundamental Aeronautics Program, Subsonic Fixed Wing Project at NASA Glenn Research Center. The authors would like to thank Gerard Welch and Michael Hathaway for their technical guidance. Special thanks are also extended to the test cell support staff; Richardo Torres, Rick Senyitko, Edith Parrott, Pete
Pachlhofer and Richard Brokopp for their dedication and expertise which enabled us to execute our research.
Available from
NASA Center for Aerospace Information7115 Standard DriveHanover, MD 21076–1320
National Technical Information Service5285 Port Royal RoadSpringfi eld, VA 22161
Available electronically at http://gltrs.grc.nasa.gov
This work was sponsored by the Fundamental Aeronautics Program at the NASA Glenn Research Center.
Level of Review: This material has been technically reviewed by technical management.

NASA/TM—2008-215145 1
Application of Synthetic Jets to Reduce Stator Flow Separation in a Low Speed Axial Compressor
Edward P. Braunscheidel, Dennis E. Culley, and Khairul B.M.Q. Zaman
National Aeronautics and Space Administration Glenn Research Center Cleveland, Ohio 44135
Abstract Flow control using synthetic jet injection has been applied in a low speed axial compressor. The
synthetic jets were applied from the suction surface of a stator vane via a span-wise row of slots pitched in the streamwise direction. Actuation was provided externally from acoustic drivers coupled to the vane tip via flexible tubing. The acoustic resonance characteristics of the system, and the resultant jet velocities were obtained. The effects on the separated flow field for various jet velocities and frequencies were explored. Total pressure loss reductions across the vane passage were measured. The effect of synthetic jet injection was shown to be comparable to that of pulsatory injection with mass addition for stator vanes which had separated flow. While only a weak dependence of the beneficial effect was noted based on the excitation frequency, a strong dependence on the amplitude was observed at all frequencies.
Nomenclature Ajet total slot area on vane suction surface c chord Cpt total pressure coefficient = ( ) ( )22/1/ tiprefref UPP ρ− Cμ momentum coefficient c’μ unsteady momentum coefficient based on RMS velocity f excitation frequency, Hz F+ non-dimensional forcing frequency = 1UfL L distance from injection location to vane trailing edge = 0.65c P total pressure P1 area-averaged total pressure upstream of the vane passage P2 area-averaged total pressure downstream of the vane passage p1 area-averaged static pressure upstream of the vane s span
1U mean free stream velocity upstream of the vane passage Umax peak velocity at slot exit Urms RMS velocity at slot exit Utip rotor tip speed Vrms RMS voltage delivered to acoustic driver γ ratio of specific heats ρ density ϕ flow coefficient (defined in text) ω total pressure loss coefficient (defined in text)
Subscripts
ref reference condition at plenum inlet

NASA/TM—2008-215145 2
Introduction The application of flow control to the turbomachinery environment has drawn increasing interest in
recent years as a potential method of boosting overall aircraft engine performance. This interest has been spurred by the dramatic effects demonstrated by external flow control applications in which unsteady injection has been shown to generate large eddy structures that greatly enhance mixing between the boundary layer and fluid from the freestream (ref. 1). Siefert, et al. (ref. 2) found that for a given level of mixing the injected massflow could be reduced by an order of magnitude by using unsteady injection rather than steady injection. In a separation control application, McManus, et al. (ref. 3) were able to achieve a 20:1 reduction in injected mass flow by using unsteady injection. Amitay and Glezer (ref. 4) showed that pulse-width modulated injection was even more efficient at conserving massflow than sinusoidal injection at a given frequency.
More recently, experiments have demonstrated that flow control applications in turbomachinery have the potential to achieve similar results. Culley, et al. (ref. 5) demonstrated suction surface flow control on two stator vanes in the third stage of a low speed multistage compressor. These results produced stator total pressure loss reduction on the order of 25 percent using approximately 1 percent of the compressor through flow. An improved injection approach using high speed solenoid valves by Culley, et al. (ref. 6) resulted in a much lower injection mass fraction with significant stator total pressure loss reductions. This was achieved by increasing the valve operating frequencies and reduction in duty cycle. The effect of this sharp pulse with minimal leakage flow through the valves reduced by an order of magnitude the amount of injected flow needed to achieve the same total pressure loss reduction.
The ability to implement any type of flow control system into turbomachinery applications is extremely complicated when hotter bleed air from downstream compressor stages must be routed to an injection system. Even though unsteady injection systems have been shown to greatly reduce the amount of bleed air required, propulsion system impacts can be significant due in large part to the tubing, valving, and increased complexity required. Synthetic jets do not require an external air source or valving to function and thus may be more practical for internal flow control applications. However, these systems are not without their own implementation challenges. Actuators must be implemented that have the authority and operating characteristics needed to provide an efficient jet. They must be robust and reliable, even when placed in difficult thermal environments which exist in the rear stages of multistage machines. Electrical power consumption must be kept to a reasonable level, and a control system must be implemented. Even with these challenges, the benefit of not having to consider bleed air removal and addition during the design phase of a compressor is significant. Therefore, the effects of reducing stator losses via zero net flow synthetic jets was explored in the research effort documented herein.
This paper will begin by describing the experimental test vehicle and its unique feature which allows easy access to a sector of four stator blades embedded within a multistage compressor. Flow controlled stator vanes and the synthetic jet systems implementation will be presented. The operation and calibration of the synthetic jets will be defined. Two-dimensional wake surveys will be used for scoping synthetic jet effects, and then a full passage survey will be conducted with and without injection to highlight the impact on a three-dimensional flow field. The effectiveness of reducing the loss by using synthetic jets will be discussed.
Experimental Setup Low Speed Axial Compressor (LSAC)
The compressor consists of an inlet guide vane and four identical stages designed for accurate low-speed simulation of the rear stages of a high-speed core compressor. Filtered air enters the facility and is conditioned for temperature and turbulence before passing through a calibrated bell mouth and into a long entrance duct where thick end-wall boundary layers typical of an embedded compressor stage develop. The first two stages are used to set up a “repeating stage” environment for the third stage where most of
NASA/TM—2008-215145 3
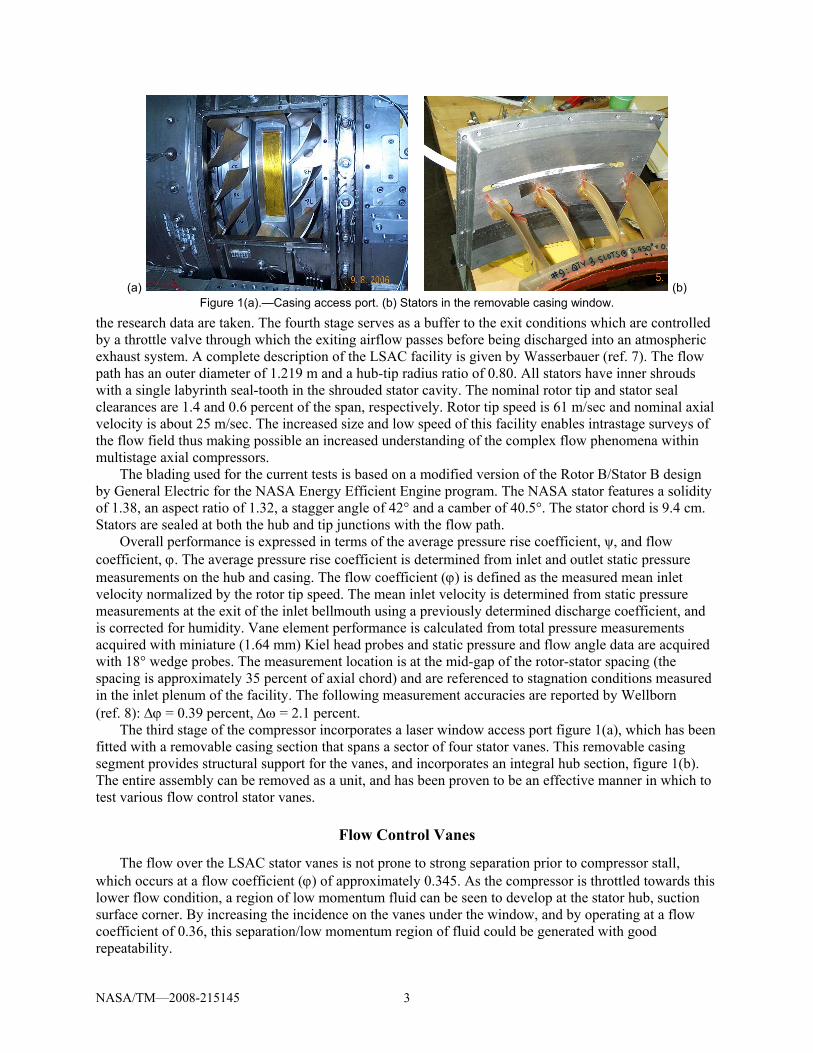
(a) (b) Figure 1(a).—Casing access port. (b) Stators in the removable casing window.
the research data are taken. The fourth stage serves as a buffer to the exit conditions which are controlled by a throttle valve through which the exiting airflow passes before being discharged into an atmospheric exhaust system. A complete description of the LSAC facility is given by Wasserbauer (ref. 7). The flow path has an outer diameter of 1.219 m and a hub-tip radius ratio of 0.80. All stators have inner shrouds with a single labyrinth seal-tooth in the shrouded stator cavity. The nominal rotor tip and stator seal clearances are 1.4 and 0.6 percent of the span, respectively. Rotor tip speed is 61 m/sec and nominal axial velocity is about 25 m/sec. The increased size and low speed of this facility enables intrastage surveys of the flow field thus making possible an increased understanding of the complex flow phenomena within multistage axial compressors.
The blading used for the current tests is based on a modified version of the Rotor B/Stator B design by General Electric for the NASA Energy Efficient Engine program. The NASA stator features a solidity of 1.38, an aspect ratio of 1.32, a stagger angle of 42° and a camber of 40.5°. The stator chord is 9.4 cm. Stators are sealed at both the hub and tip junctions with the flow path.
Overall performance is expressed in terms of the average pressure rise coefficient, ψ, and flow coefficient, ϕ. The average pressure rise coefficient is determined from inlet and outlet static pressure measurements on the hub and casing. The flow coefficient (ϕ) is defined as the measured mean inlet velocity normalized by the rotor tip speed. The mean inlet velocity is determined from static pressure measurements at the exit of the inlet bellmouth using a previously determined discharge coefficient, and is corrected for humidity. Vane element performance is calculated from total pressure measurements acquired with miniature (1.64 mm) Kiel head probes and static pressure and flow angle data are acquired with 18° wedge probes. The measurement location is at the mid-gap of the rotor-stator spacing (the spacing is approximately 35 percent of axial chord) and are referenced to stagnation conditions measured in the inlet plenum of the facility. The following measurement accuracies are reported by Wellborn (ref. 8): Δϕ = 0.39 percent, Δω = 2.1 percent.
The third stage of the compressor incorporates a laser window access port figure 1(a), which has been fitted with a removable casing section that spans a sector of four stator vanes. This removable casing segment provides structural support for the vanes, and incorporates an integral hub section, figure 1(b). The entire assembly can be removed as a unit, and has been proven to be an effective manner in which to test various flow control stator vanes.
Flow Control Vanes
The flow over the LSAC stator vanes is not prone to strong separation prior to compressor stall, which occurs at a flow coefficient (ϕ) of approximately 0.345. As the compressor is throttled towards this lower flow condition, a region of low momentum fluid can be seen to develop at the stator hub, suction surface corner. By increasing the incidence on the vanes under the window, and by operating at a flow coefficient of 0.36, this separation/low momentum region of fluid could be generated with good repeatability.

NASA/TM—2008-215145 4
1.74
1.701.66
1.62
1.581.54
1.501.461.42
80
30
506070
40
20
90100
010
% S
pan
ptC1.74
1.701.66
1.62
1.581.54
1.501.461.42
80
30
506070
40
20
90100
010
% S
pan
80
30
506070
40
20
90100
010
% S
pan
ptC
Figure 2.—A three-dimensional view of the total pressure coefficient at stator exit, across one vane pitch. A separated flow is most pronounced in the hub region, from 0 to 30 percent span.
Three of the four stator vanes in the window were installed at an increased incidence of 3° above there design value, with an accuracy of ±1°. All other vanes in the compressor are installed at their nominal design stagger. Surface pressure measurements at mid span indicate that flow separation begins near mid chord of a restaggered vane (ref. 9). Stator exit total pressure coefficients measured across the full vane passage, shown in figure 2, illustrate that the separated flow is most pronounced from the hub to about 30 percent of span, and less pronounced extending out to 50 percent of span. Although the fluid flow is evidently three-dimensional, flow control injection techniques developed on isolated airfoils and in cascades have been shown to be effective (refs. 5 and 6).
Suction surface injection on two of the three restaggered vanes is applied to address the area of low momentum fluid/separated stator flow. The surveyed vane and the adjacent vane on the pressure side employ flow control. The surveyed vane is also surrounded by restaggered vanes, thus providing a similar diffusing passage environment on both the pressure and suction sides. Stator wake surveys were used to establish the relative effectiveness of synthetic jets. Wake surveys begin at passage mid-pitch, and traverse from suction side to pressure side of the flow controlled vane. The injection is done through two span-wise slots 0.63 mm wide by 12.7 mm long located at 35 percent of chord. The total slot extent is from 10 to 36 percent of span. The slots are pitched 30° downstream relative to the surface tangent. The flow control vanes are designed with the same aerodynamic surfaces and mounting points as the standard LSAC vanes but include the slots and internal flow passages required for injection. Wake profiles, without injection, were not appreciably impacted by the addition of the slots on the blades. Additional details on vane design and how they were produced using the rapid prototyping process is described in (ref. 6). A CAD model of the vane is shown in figure 3, however, only the two slots closest to the hub were open for this experiment.
Synthetic Jet System
Figure 4 shows a schematic representation of the synthetic jet system employed for this experiment. Two acoustic drivers were employed. Each driver was connected to a flow control vane via a 9.5 mm diameter by 0.45 m long flexible tube. This approach is also documented by Zaman and Culley (ref. 10), and included investigation into the effect of tubing diameters and lengths on acoustic system responses involving slotted airfoils. Prior to installation in the compressor rig, the assembly consisting of the stators, drivers and tubing was calibrated. The measurements were performed with a single hot-wire mounted on a computer controlled probe-traversing mechanism as shown in figure 5.

NASA/TM—2008-215145 5
TIP
HUB
TIP
HUB
Figure 3.—Computer Aided Design model of the rapid prototype Low Speed Axial Compressor vane. Two slots near the hub end are used while the remaining four slots are closed.
HUB
Amplifier
Data AcquisitionAnd Control
TIP
AcousticDriver
AcousticDriver
1U
jetu
rmsVfinV
HUB
Amplifier
Data AcquisitionAnd Control
TIP
AcousticDriver
AcousticDriver
1U
jetu
rmsVfinV
Figure 4.—Experiment schematic. Each vane is externally pumped by an acoustic driver connected by flexible tubing. A common sinusoidal forcing function is provided to the amplifier while the RMS voltage is used to gauge slot exit velocity.
Hot-wireHot-wireHot-wireHot-wire
Figure 5.—In-situ hot wire calibration of the window assembly prior to compressor experiments. The inset shows the location of the hot wire with respect to the flow control slot.

NASA/TM—2008-215145 6
The hot-wire position relative to the slot exit is shown schematically in the inset. The 0.05 mm diameter by 1 mm long sensor was aligned lengthwise with the span-wise axis of the slot. It was placed carefully at the exit, by monitoring the velocity signal with the excitation on, while moving it in 0.025 mm steps. When it reached the exit, a few further steps would not make a difference in the mean and RMS readings. This placement is below the flow surface of the stator, at or close to the throat of the slot. The resonance characteristics of the system were first determined at approximately a 5 Vrms input voltage, and are shown in figure 6. At each resonant frequency, the input voltage was varied from zero to 20 V. The peak velocity during the discharge half of the perturbation cycle was obtained by carrying out phase-averaged measurements (ref. 10). Calibration results are shown in figure 7. These calibrations were used to set the test points to be investigated during compressor tests. The resonance frequencies investigated were 250, 550, 915, 1230, and 1500 Hz.
1030
1
2
3
4
5
6
7
v’(m
/sec
)
frequency (Hz)102101
0
1
2
3
4
5
6
7
1030
1
2
3
4
5
6
7
v’(m
/sec
)
frequency (Hz)102101
0
1
2
3
4
5
6
7
Figure 6.—System resonant peaks due to acoustic driver dynamics, interconnecting tubing, and vane cavity. 5 Vrms input.
0
10
20
30
40
50
60
0 5 10 15 20Volts RMS
Um
ax-m
/sec
250550915
12301500
Hz F+
0.611.342.233.003.66
0
10
20
30
40
50
60
0 5 10 15 20Volts RMS
Um
ax-m
/sec
0
10
20
30
40
50
60
0 5 10 15 20Volts RMS
Um
ax-m
/sec
250550915
12301500
Hz F+
0.611.342.233.003.66
250550915
12301500
Hz F+
0.611.342.233.003.66
Figure 7.—Peak velocity as measured at forcing frequencies with varying input power level.

NASA/TM—2008-215145 7
Experimental Results The entire test matrix was executed at a flow coefficient of 0.36 at 100 percent speed, resulting in a
Reynolds number based on stator chord of 1.66×10⁵. A transitional blade boundary layer could exist based on findings of Halstead, et al. (ref. 11) and Adamczyk, et al. (ref. 12). All single span surveys were performed at 30 percent span, which is approximately at the center of the second flow control slot. The dashed line in figure 2 at 30 percent span, illustrates that measurements will include a significant portion of the low momentum fluid region. This span location was selected based on past studies which have demonstrated it to be a reliable indicator of flow field response to flow control schemes (refs. 5, 6, and 8). At the beginning of each test day, a survey was conducted with no flow control to establish that day’s reference baseline. Baselines were repeatable within ±1.3 percent, based on loss coefficient, ω, which will be defined later. Any variances beyond this range were an indication that a system deficiency had developed and testing would only continue after the problem was located and remedied.
Test condition actuator frequencies are represented by a nondimensional forcing frequency defined as,
1/UfLF =+ In this equation the length, L, is defined as the distance from the point of injection to the trailing edge of the vane. For the test configuration investigated here, at F+ = 1 the frequency is 410 Hz. As discussed earlier, the resonance characteristics of our synthetic jet system established which forcing frequencies were viable conditions to test. The strength of the injected jet velocities can be characterized following Nishri and Wygnanski (ref. 13) as
'μμμ += ccC
where μc is the momentum coefficient of the mean injected velocity, and 'μc is the momentum
coefficient of the RMS of the harmonically oscillating velocity. For synthetic jets which produce harmonic oscillations with zero mean velocity, '
μμ = cC . Due to hot-wire rectification, measurement of the RMS velocity is sensitive to exact probe location relative to the slot exit. In comparison, the measurement of the maximum velocity is more accurate since it does not vary significantly with small differences in probe position. However, the RMS velocity is more commonly used in previous research, and will be adopted here to permit comparisons. Since the forcing function used to generate the synthetic jets is sinusoidal, an RMS velocity can be calculated using the peak measured velocity and the relation
2maxUUrms = . As previously defined in reference 5 a momentum coefficient that is adjusted for a part span injection slot can then be defined as
2
1
' 2⎟⎟⎠
⎞⎜⎜⎝
⎛== μμ U
UsLA
cC rmsjet
Those who wish to use the peak velocity as their reference scale should double our reported Cμ values.
Figure 8 shows the 30 percent span baseline wake profile of the stator vane at the separated condition. Several additional wake profiles, using synthetic jet actuation at the highest forcing frequency of F+ = 3.66, are superimposed over the baseline condition. The wake profiles are plotted as the total pressure coefficient versus percentage of stator pitch. Analysis of the wake pattern changes relative to the baseline wake can be used to gain a qualitative understanding of the effects of synthetic jet flow control. The plot shows that as the injection momentum increases a benefit can be observed as a decrease in wake deficit. This effect was similar in all cases tested.

NASA/TM—2008-215145 8
1.35
1.40
1.45
1.50
1.55
1.60
1.65
1.70
0.00 0.20 0.40 0.60 0.80 1.00Pitch
Tota
l Pre
ssur
e C
oeffi
cien
t
00.00130.00290.00580.0076
C?
00.00130.00290.00580.0076
Cµ
1.35
1.40
1.45
1.50
1.55
1.60
1.65
1.70
0.00 0.20 0.40 0.60 0.80 1.00Pitch
Tota
l Pre
ssur
e C
oeffi
cien
t
1.35
1.40
1.45
1.50
1.55
1.60
1.65
1.70
0.00 0.20 0.40 0.60 0.80 1.00Pitch
Tota
l Pre
ssur
e C
oeffi
cien
t
00.00130.00290.00580.0076
C?
00.00130.00290.00580.0076
Cµ
00.00130.00290.00580.0076
C?
00.00130.00290.00580.0076
Cµ
Figure 8.—Wake surveys. A large wake implies a greater degree of separation and loss in the diffusing passage. The application of increasing levels of forcing reduces the extent of the wake.
-25
-20
-15
-10
-5
0
5
0.000 0.002 0.004 0.006 0.008 0.010Momentum Coefficient - Cµ
% L
oss
Red
uctio
n
-25
-20
-15
-10
-5
0
5
0.000 0.002 0.004 0.006 0.008 0.010Momentum Coefficient - Cµ
% L
oss
Red
uctio
n
Figure 9.—The effectiveness of synthetic jet forcing at an F+ of 3.66
and increasing levels of momentum.
To quantify the effects that synthetic jets can provide, the measurement of loss production is utilized to compare various test conditions. The conventional definition of loss coefficient for a vane passage with no mass addition is,
11
21pPPP
−−
=ω
Here, P1 and P2 are the area averaged total pressure upstream and downstream of the vane, and p1 is the area averaged static pressure upstream of the vane.
The loss coefficient was calculated for each wake survey, and then the percent difference relative to the baseline wake loss coefficient was obtained. A set of results are shown in figure 9 for an F+ = 3.66. Uncertainties are shown with standard error bars. A second order polynomial curve fit is also shown. It is clear from this data, that an increase in Cμ yields an increase in loss reduction.

NASA/TM—2008-215145 9
Figure 10 represents the data set obtained for synthetic jets operated with a sinusoidal input voltage of 5 to 20 V RMS, resulting in Cμ ranging from 0.001 to 0.01. Actuator forcing frequencies ranged from an F+ = 0.611 to 3.66. All the frequencies investigated were at the system resonance conditions, except for F+ = 0.733. Again, it is clear from the overall data set, that loss is consistently reduced with an increasing Cμ. The maximum loss reduction achieved was approximately 22 percent, occurring at the maximum Cμ tested. This compares favorably with the maximum loss reduction of 25 percent achieved with pulsatory injection at comparable maximum injection velocities (ref. 6).
Each data set was then independently curve fit with a second order polynomial as shown in figure 11, with data symbols omitted for clarity. This highlights a trend which occurred at the lowest frequency case of F+ = 0.611 and Cμ = 0.006, yielding loss reductions comparable to those of an F+ = 3.66 at the same momentum coefficient. In general, there appeared to be weakly increasing benefit with increasing F+, but due to the scatter in the data, any detailed assessments of these effects could not be resolved.
-25
-20
-15
-10
-5
0
5
0.000 0.002 0.004 0.006 0.008 0.010Cµ
% L
oss
Red
uctio
n
Hz F+250 0.61300 0.73550 1.34915 2.23
1230 3.001500 3.66
-25
-20
-15
-10
-5
0
5
0.000 0.002 0.004 0.006 0.008 0.010Cµ
% L
oss
Red
uctio
n
Hz F+250 0.61300 0.73550 1.34915 2.23
1230 3.001500 3.66
Hz F+250 0.61300 0.73550 1.34915 2.23
1230 3.001500 3.66
Figure 10.—Loss reduction for various momentum levels and forcing frequencies.
-25
-20
-15
-10
-5
0
5
0.000 0.002 0.004 0.006 0.008 0.010Cµ
% L
oss
Red
uctio
n
250550915
12301500
Hz F+
0.611.342.233.003.66
-25
-20
-15
-10
-5
0
5
0.000 0.002 0.004 0.006 0.008 0.010Cµ
% L
oss
Red
uctio
n
250550915
12301500
Hz F+
0.611.342.233.003.66
250550915
12301500
Hz F+
0.611.342.233.003.66
Figure 11.—In general, the loss reduction is proportional to the momentum coefficient. There appears to be a slightly different trend at the lower F+ of 0.61.

NASA/TM—2008-215145 10
A measure of loss across a full passage was executed to determine what effect the synthetic jets would have on the three-dimensional flow field. The case selected was an F+ = 0.611, at a Cμ = 0.006. Figure 12 illustrates that benefits are seen from 5 to 50 percent of span. Another representation of the loss benefit is shown in figure 13 by a cross passage total pressure coefficient plot, with and without injection. A narrowing of the wake profile can be seen by focusing on the dark blue regions of the contour corresponding to Cpt < 1.46. A fairly significant narrowing is seen from about 5 to 30 percent span, with a slightly lesser effect from 30 to 50 percent span. The calculated loss for the passage produced a reduction of about 5.5 percent. These loss benefits compare well with previous pulsatory injection tests performed at an F+ = 1.22, similar maximum jet velocities, and with the same injection slot and blade restagger configuration (ref. 6). In that case, full passage survey results indicated benefits from about 10 to 50 percent of span, with a loss reduction of about 4 percent.
0
10
20
30
40
50
60
70
80
90
100
0.05 0.10 0.15 0.20 0.25 0.30 0.35 0.40 0.45
Loss Coefficient - ω
% S
pan
00.611
0250
F+Hz
0
10
20
30
40
50
60
70
80
90
100
0.05 0.10 0.15 0.20 0.25 0.30 0.35 0.40 0.45
Loss Coefficient - ω
% S
pan
00.611
0250
F+Hz
00.611
0250
F+Hz
Figure 12.—Radial plot of loss coefficients from full passage surveys. Benefits due to injection are observed from 0 to almost 50 percent span.
1.741.701.661.621.581.541.501.461.42
80
30
506070
40
20
90100
10
% S
pan
0
1.741.701.661.621.581.541.501.461.42
1.741.701.661.621.581.541.501.461.42
80
30
506070
40
20
90100
10
% S
pan
0
80
30
506070
40
20
90100
10
% S
pan
0
ptC1.741.701.661.621.581.541.501.461.42
80
30
506070
40
20
90100
10
% S
pan
0
1.741.701.661.621.581.541.501.461.42
1.741.701.661.621.581.541.501.461.42
80
30
506070
40
20
90100
10
% S
pan
0
80
30
506070
40
20
90100
10
% S
pan
0
ptC
(a) without injection (b) with injection
Figure 13.—Contour plots of total pressure coefficient at stator exit. Applying forcing reduces the separated/low momentum flow in the lower span and hub region.

NASA/TM—2008-215145 11
0
10
20
30
40
50
60
0 5 10 15 20Average Power - watts
Um
ax-m
/sec
250550915
12301500
Hz F+
0.611.342.233.003.66
0
10
20
30
40
50
60
0 5 10 15 20Average Power - watts
Um
ax-m
/sec
0
10
20
30
40
50
60
0 5 10 15 20Average Power - watts
Um
ax-m
/sec
250550915
12301500
Hz F+
0.611.342.233.003.66
250550915
12301500
Hz F+
0.611.342.233.003.66
250550915
12301500
Hz F+
0.611.342.233.003.66
Figure 14.—Power input to the acoustic drivers.
Discussion While synthetic jets can be effective in loss reduction in low speed flows, scaling to high speed
machines highlights multiple challenges. Figure 14 shows the power input to each acoustic driver necessary to produce the resultant injection velocity for the experiment. A curve fit of power input required for a given jet velocity was generated, resulting in 3/1
max Power∝U . Using this relationship, a scaling to transonic compressor conditions indicates power requirements on the order of kilowatts per blade, which is not feasible for implementation. The intent of this scaling is to highlight that electrical power requirements cannot be neglected when considering flow control system designs.
The absolute magnitude of the jet velocity also must be considered. Assuming that the flow fields respond similarly, jet velocities will need to approach transonic conditions to be effective in high speed compressors. Generating the high velocities at low power levels remains a significant challenge.
Conclusion A synthetic jet system has been developed and applied to the suction surface of stator vanes in a low
speed axial compressor. The system was capable of generating injection velocities with Cμ’s of greater than 0.01 based on RMS jet velocities. The synthetic jet system was characterized prior to testing to identify the frequency characteristics of the actuation system so as to identify its resonances. Operation at off resonance conditions yields a Cμ too low to provide effective flow control.
Synthetic jets were shown to be as effective as previous unsteady injection techniques in reducing wake losses induced by separated flows in low speed compressor flow fields. Loss reductions of up to 22 percent were demonstrated at a given span location, and loss reduction for the entire passage was 5.5 percent.
Attained loss reduction correlated directly with Cμ, and was not clearly tied to any particular forcing frequency, F+.

NASA/TM—2008-215145 12
References 1. Amitay, M., Kibens, V., Parekh, D., and Glezer A., “The Dynamics of Flow Reattachment Over a
Thick Airfoil Controlled by Synthetic Jet Actuators,” AIAA Paper 99–1001, 1999. 2. Seifert, A., Bachar, T., Koss, D., Shepshelovich, M., and Wygnanski, I., “Oscillatory Blowing: A
Tool to Delay Boundary-Layer Separation,” AIAA J., 31, No. 11, pp. 2052–2060, 1993. 3. McManus, K., Legner, H., and Davis, S., “Pulsed Vortex Generator Jets for Active Control of Flow
Separation,” AIAA Paper 99–1001, 1994. 4. Amitay, M., and Glezer, A., “Aerodynamic Flow Control of a Thick Airfoil Using Synthetic Jet
Actuators,” ASME/JSME Paper FEDSM99–6922, 1999. 5. Culley, D.E., Bright, M.M., Prahst, P.S., Strazisar, A.J., “Active Flow Separation Control of a Stator
Vane Using Surface Injection in a Multistage Compressor Experiment,” ASME Paper GT2003–38863, 2003.
6. Culley, D.E., Braunscheidel, E.P., and Bright, M.M., “Impulsive Injection for Compressor Stator Separation Control,” AIAA Paper 2005–3633, 2005.
7. Wasserbauer, C.A., Weaver, H.F., and Senyitko, R.G., “NASA Low Speed Compressor for Fundamental Research,” NASA TM4635, 1995.
8. Wellborn, S., and Okiishi, T., “The Influence of Shrouded Stator Cavity Flows on Multistage Compressor Performance,” ASME J. of Turbomachinery, 121, pp. 486–498, 1999.
9. Bright, M.M., Culley, D.E., Braunscheidel, E.P., Welch, G.E., “Closed Loop Active Flow Separation Detection and Control in a Multistage Compressor,” NASA/TM—2005-213553, 2005.
10. Zaman, K.B.M.Q. and Culley, D.E., 2006, “Transmission of Acoustic Perturbation Through Cavity/slots in an Airfoil for Stall Control,” AIAA Paper 2006–2507, May 2006.
11. Halstead, D.E., Wisler, D.C., Okiishi, T.H., Walker, G.J., Hodson, H.P., and Shin, H.W., “Boundary Layer Development in Axial Compressors and Turbines,” ASME papers, 95–GT–461, 95–GT–462, 95–GT–463, 95–GT–464, 1995.
12. Adamczyk, J.J., Hathaway, M.D., Shabbir, A., Wellborn, S.R., “Numerical Simulation of Multistage Turbomachinery Flows,” AGARD Propulsion Energetics Panel, 1998.
13. Nishri, B., and Wygnanski, I., “Effects of Periodic Excitation on Turbulent Flow Separation From a Flap,” AIAA Journal, 36, No. 4, pp. 547–556, 1998.

REPORT DOCUMENTATION PAGE Form Approved OMB No. 0704-0188
The public reporting burden for this collection of information is estimated to average 1 hour per response, including the time for reviewing instructions, searching existing data sources, gathering and maintaining the data needed, and completing and reviewing the collection of information. Send comments regarding this burden estimate or any other aspect of this collection of information, including suggestions for reducing this burden, to Department of Defense, Washington Headquarters Services, Directorate for Information Operations and Reports (0704-0188), 1215 Jefferson Davis Highway, Suite 1204, Arlington, VA 22202-4302. Respondents should be aware that notwithstanding any other provision of law, no person shall be subject to any penalty for failing to comply with a collection of information if it does not display a currently valid OMB control number. PLEASE DO NOT RETURN YOUR FORM TO THE ABOVE ADDRESS. 1. REPORT DATE (DD-MM-YYYY) 01-12-2008
2. REPORT TYPE Technical Memorandum
3. DATES COVERED (From - To)
4. TITLE AND SUBTITLE Application of Synthetic Jets to Reduce Stator Flow Separation in a Low Speed Axial Compressor
5a. CONTRACT NUMBER
5b. GRANT NUMBER
5c. PROGRAM ELEMENT NUMBER
6. AUTHOR(S) Braunscheidel, Edward, P.; Culley, Dennis, E.; Zaman, Kairul, B.M.Q.
5d. PROJECT NUMBER
5e. TASK NUMBER
5f. WORK UNIT NUMBER WBS 561581.02.08.03.21.03
7. PERFORMING ORGANIZATION NAME(S) AND ADDRESS(ES) National Aeronautics and Space Administration John H. Glenn Research Center at Lewis Field Cleveland, Ohio 44135-3191
8. PERFORMING ORGANIZATION REPORT NUMBER E-16308
9. SPONSORING/MONITORING AGENCY NAME(S) AND ADDRESS(ES) National Aeronautics and Space Administration Washington, DC 20546-0001
10. SPONSORING/MONITORS ACRONYM(S) NASA; AIAA
11. SPONSORING/MONITORING REPORT NUMBER NASA/TM-2008-215145; AIAA-2008-0602
12. DISTRIBUTION/AVAILABILITY STATEMENT Unclassified-Unlimited Subject Category: 02 Available electronically at http://gltrs.grc.nasa.gov This publication is available from the NASA Center for AeroSpace Information, 301-621-0390
13. SUPPLEMENTARY NOTES
14. ABSTRACT Flow control using synthetic jet injection has been applied in a low speed axial compressor. The synthetic jets were applied from the suction surface of a stator vane via a span-wise row of slots pitched in the streamwise direction. Actuation was provided externally from acoustic drivers coupled to the vane tip via flexible tubing. The acoustic resonance characteristics of the system, and the resultant jet velocities were obtained. The effects on the separated flow field for various jet velocities and frequencies were explored. Total pressure loss reductions across the vane passage were measured. The effect of synthetic jet injection was shown to be comparable to that of pulsatory injection with mass addition for stator vanes which had separated flow. While only a weak dependence of the beneficial effect was noted based on the excitation frequency, a strong dependence on the amplitude was observed at all frequencies. 15. SUBJECT TERMS Synthetic jet; Flow control; Separation; Stator
16. SECURITY CLASSIFICATION OF: 17. LIMITATION OF ABSTRACT UU
18. NUMBER OF PAGES
18
19a. NAME OF RESPONSIBLE PERSON STI Help Desk (email:[email protected])
a. REPORT U
b. ABSTRACT U
c. THIS PAGE U
19b. TELEPHONE NUMBER (include area code) 301-621-0390
Standard Form 298 (Rev. 8-98)Prescribed by ANSI Std. Z39-18

