applications to global climate modeling tom ackerman lecture ii.7b
Post on 19-Dec-2015
219 views
TRANSCRIPT

Applications to Global Applications to Global Climate ModelingClimate Modeling
Tom AckermanTom Ackerman
Lecture II.7bLecture II.7b
OutlineOutline
What do climate models simulate?What do climate models simulate? ParameterizationParameterization Issues for ground-based remote Issues for ground-based remote
sensingsensing Some examples Some examples Combining ground and satelliteCombining ground and satellite
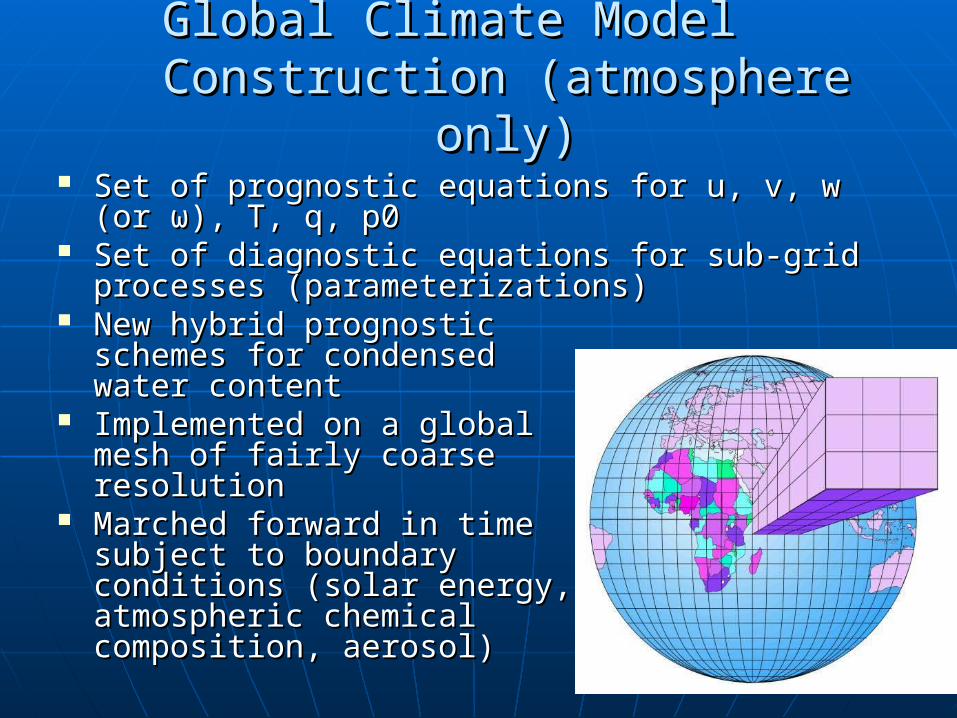
Global Climate Model Global Climate Model Construction (atmosphere only)Construction (atmosphere only)
Set of prognostic equations for u, v, w (or Set of prognostic equations for u, v, w (or ωω), T, ), T, q, p0q, p0
Set of diagnostic equations for sub-grid Set of diagnostic equations for sub-grid processes (parameterizations) processes (parameterizations)
New hybrid prognostic New hybrid prognostic schemes for condensed schemes for condensed water contentwater content
Implemented on a global Implemented on a global mesh of fairly coarse mesh of fairly coarse resolution resolution
Marched forward in time Marched forward in time subject to boundary subject to boundary conditions (solar energy, conditions (solar energy, atmospheric chemical atmospheric chemical composition, aerosol)composition, aerosol)

Climate model evaluationClimate model evaluation
Simulate current climate very wellSimulate current climate very well• Large-scale circulation patternsLarge-scale circulation patterns• TOA energy balanceTOA energy balance• Seasonal progressionSeasonal progression
What don’t we simulate well?What don’t we simulate well?• Regional climateRegional climate• Smaller scale dynamical features – MJOSmaller scale dynamical features – MJO• Cloud propertiesCloud properties
Diurnal cycle of convectionDiurnal cycle of convection Stratiform cloud properties Stratiform cloud properties
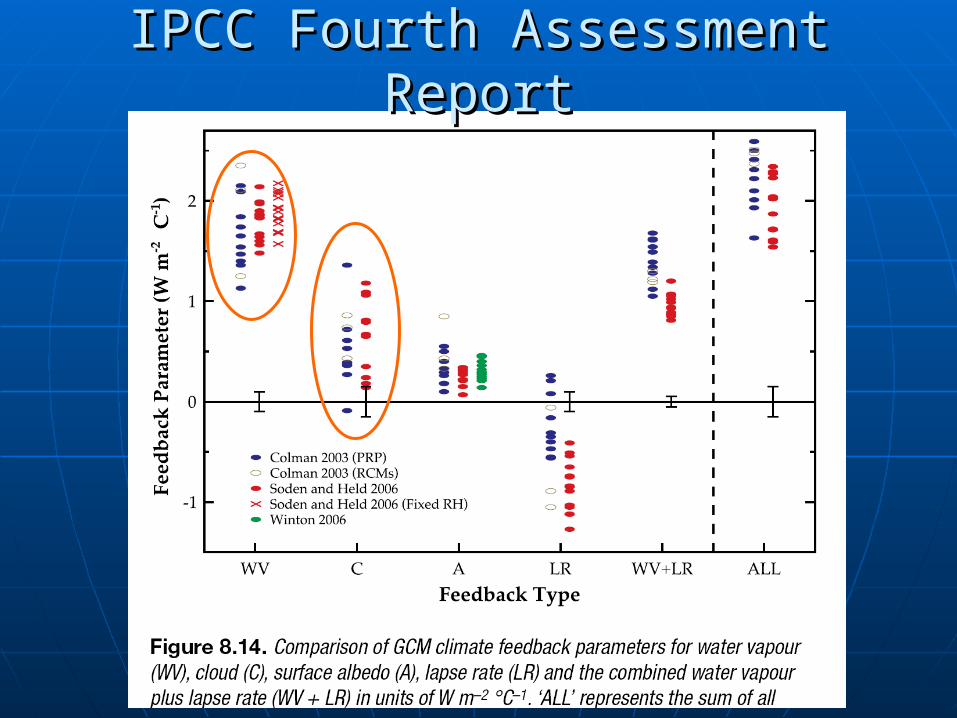
IPCC Fourth Assessment ReportIPCC Fourth Assessment Report
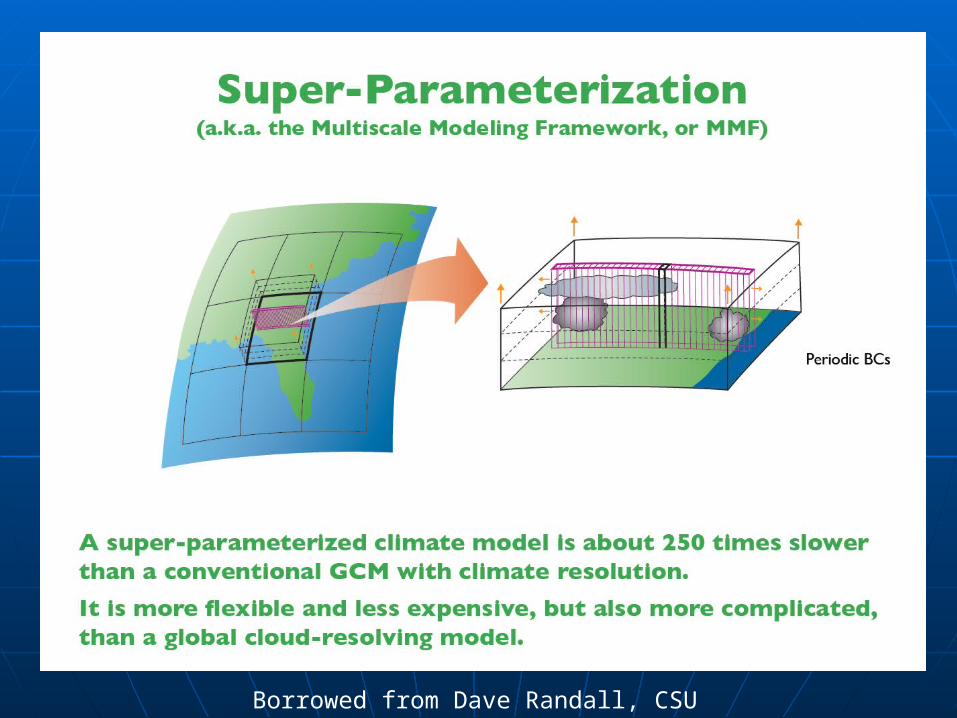
Borrowed from Dave Randall, CSU
Borrowed from Dave Randall, CSU
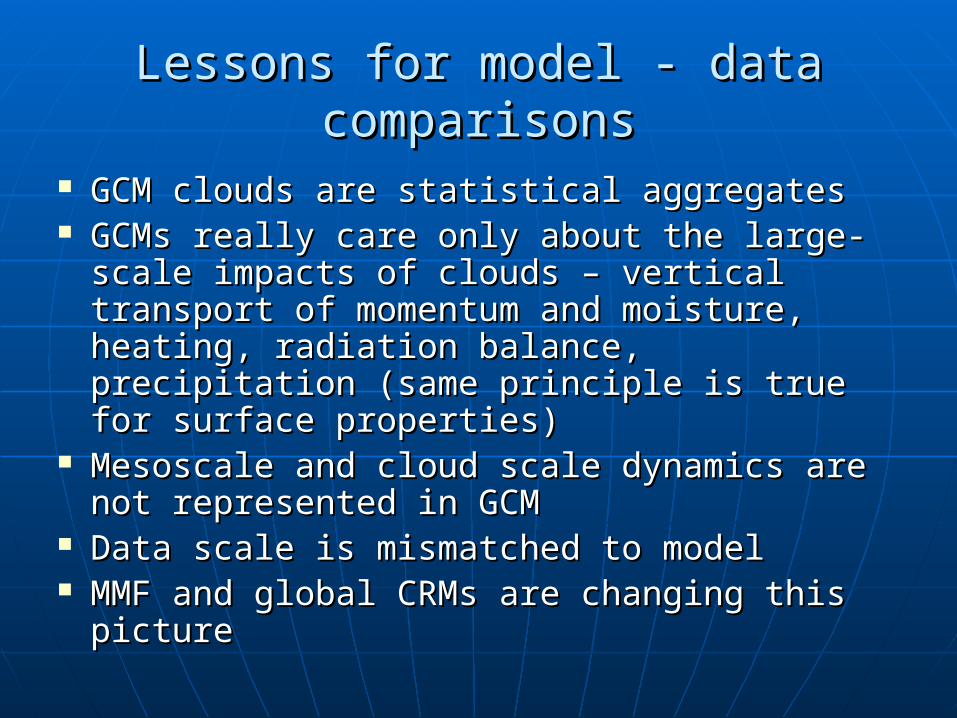
Lessons for model - data comparisonsLessons for model - data comparisons
GCM clouds are statistical aggregates GCM clouds are statistical aggregates GCMs really care only about the large-GCMs really care only about the large-
scale impacts of clouds – vertical transport scale impacts of clouds – vertical transport of momentum and moisture, heating, of momentum and moisture, heating, radiation balance, precipitation (same radiation balance, precipitation (same principle is true for surface properties)principle is true for surface properties)
Mesoscale and cloud scale dynamics are Mesoscale and cloud scale dynamics are not represented in GCMnot represented in GCM
Data scale is mismatched to modelData scale is mismatched to model MMF and global CRMs are changing this MMF and global CRMs are changing this
picturepicture

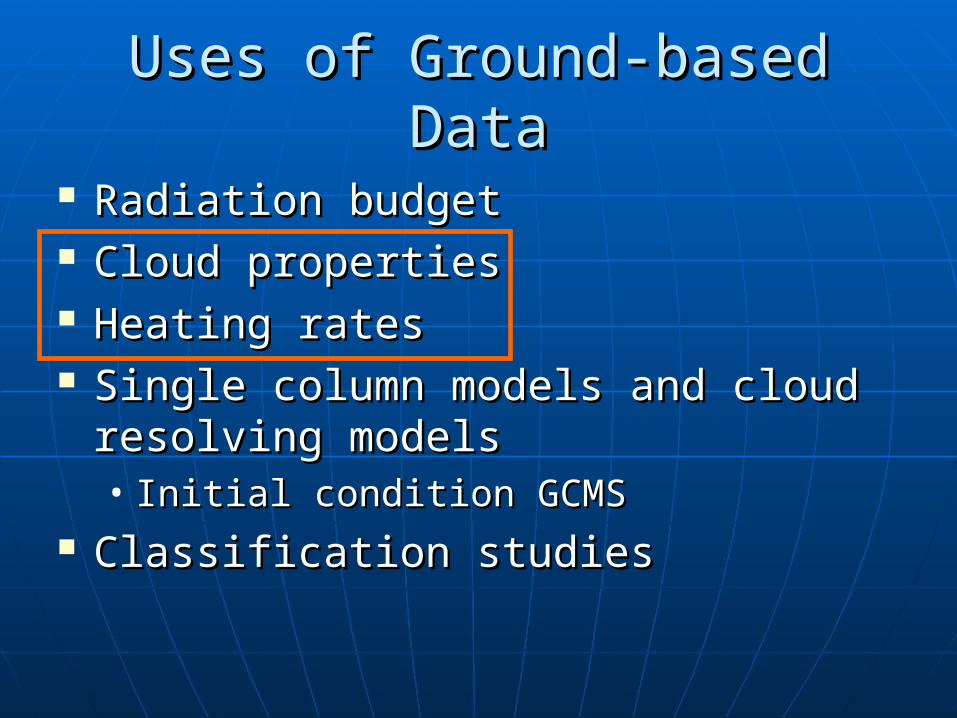
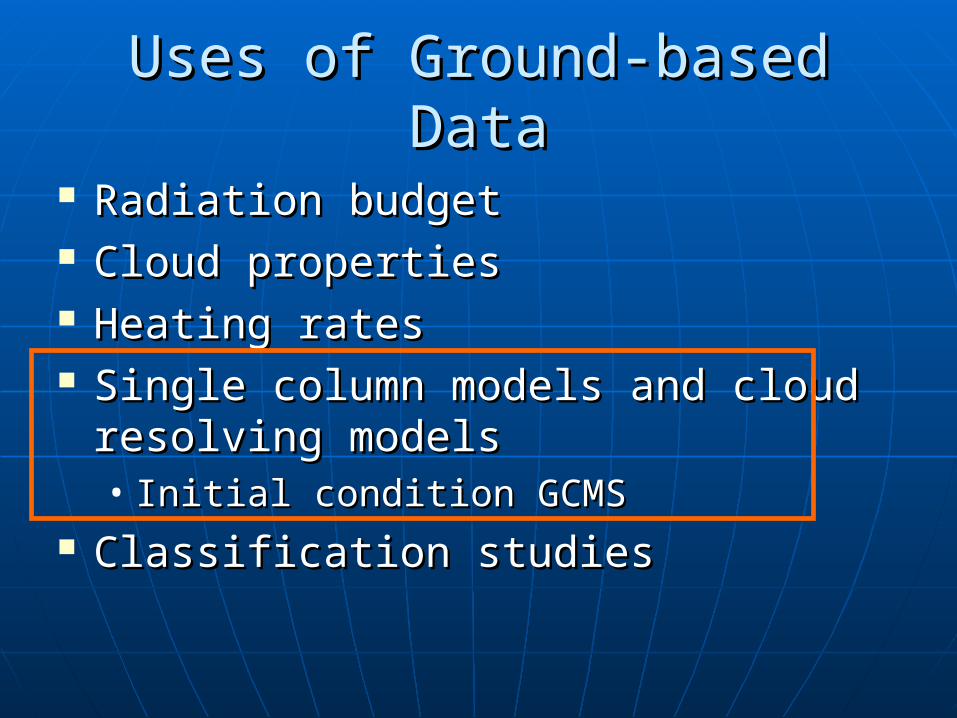
Uses of Ground-based DataUses of Ground-based Data
Radiation budget Radiation budget Cloud propertiesCloud properties Heating ratesHeating rates Single column models and cloud Single column models and cloud
resolving modelsresolving models• Initial condition GCMSInitial condition GCMS
Classification studiesClassification studies
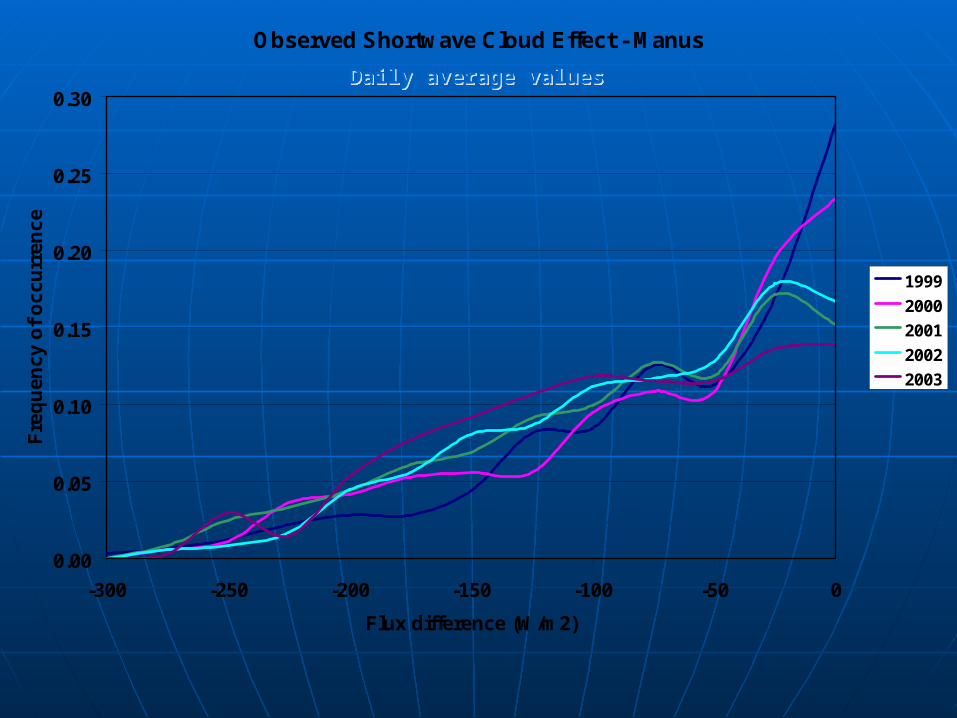
Observed Shortwave Cloud Effect - Manus
0.00
0.05
0.10
0.15
0.20
0.25
0.30
-300 -250 -200 -150 -100 -50 0
Flux difference (W/m2)
Fre
qu
ency
of
occ
urr
ence
1999
2000
2001
2002
2003
Daily average valuesDaily average values
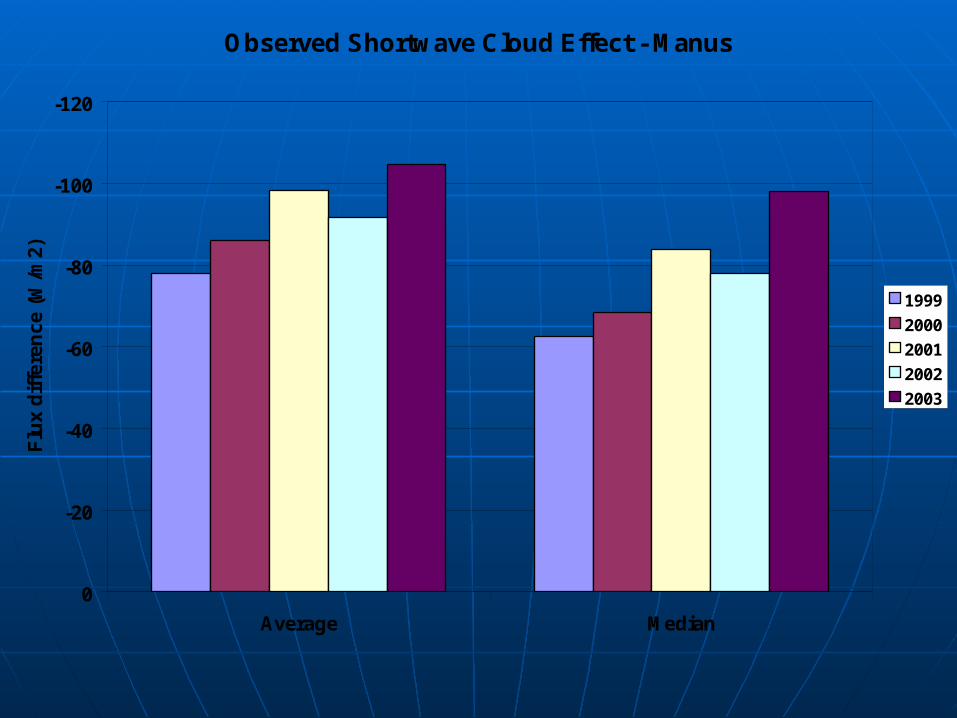
Observed Shortwave Cloud Effect - Manus
-120
-100
-80
-60
-40
-20
0
Average Median
Flu
x d
iffe
ren
ce (
W/m
2)
1999
2000
2001
2002
2003
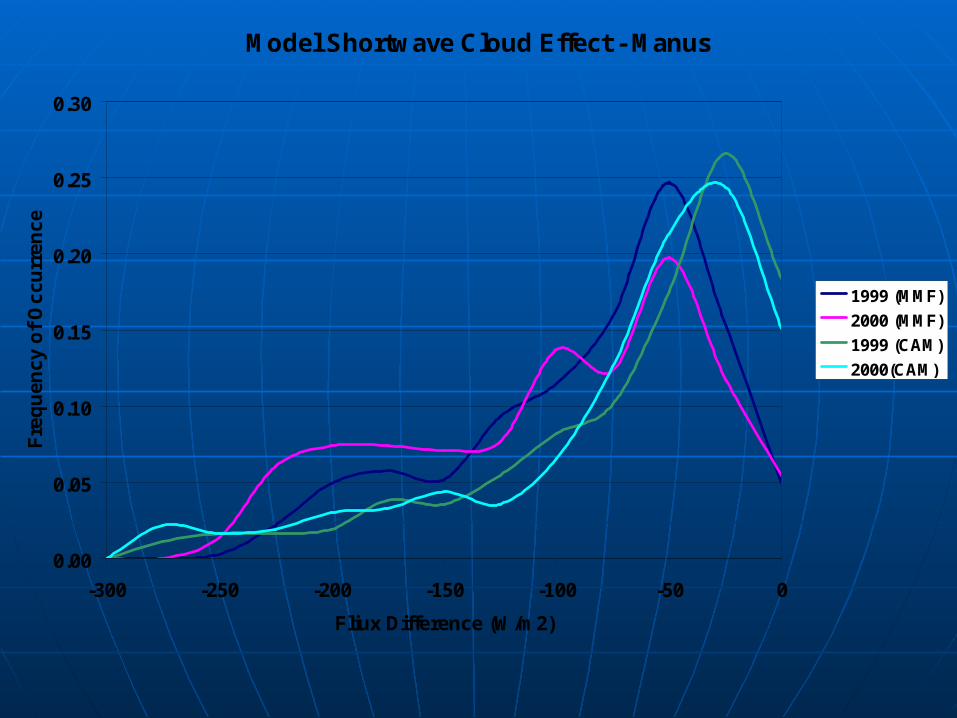
Model Shortwave Cloud Effect - Manus
0.00
0.05
0.10
0.15
0.20
0.25
0.30
-300 -250 -200 -150 -100 -50 0
Fliux Difference (W/m2)
Fre
qu
ency
of
Occ
urr
ence
1999 (MMF)
2000 (MMF)
1999 (CAM)
2000(CAM)

Shortwave Cloud Effect - Manus
0.00
0.05
0.10
0.15
0.20
0.25
0.30
-300 -250 -200 -150 -100 -50 0
Fliux Difference (W/m2)
Fre
qu
ency
of
Occ
urr
ence
1999 (MMF)
2000 (MMF)
1999 (CAM)
2000(CAM)
1999
2000

Shortwave Cloud Effect - Manus
-120
-100
-80
-60
-40
-20
0
Average Median
Flu
x d
iffe
ren
ce (
W/m
2) 1999
2000
2001
2002
2003
1999 (MMF)
2000 (MMF)
1999 (CAM)
2000 (CAM)
Uses of Ground-based DataUses of Ground-based Data
Radiation budget Radiation budget Cloud propertiesCloud properties Heating ratesHeating rates Single column models and cloud Single column models and cloud
resolving modelsresolving models• Initial condition GCMSInitial condition GCMS
Classification studiesClassification studies
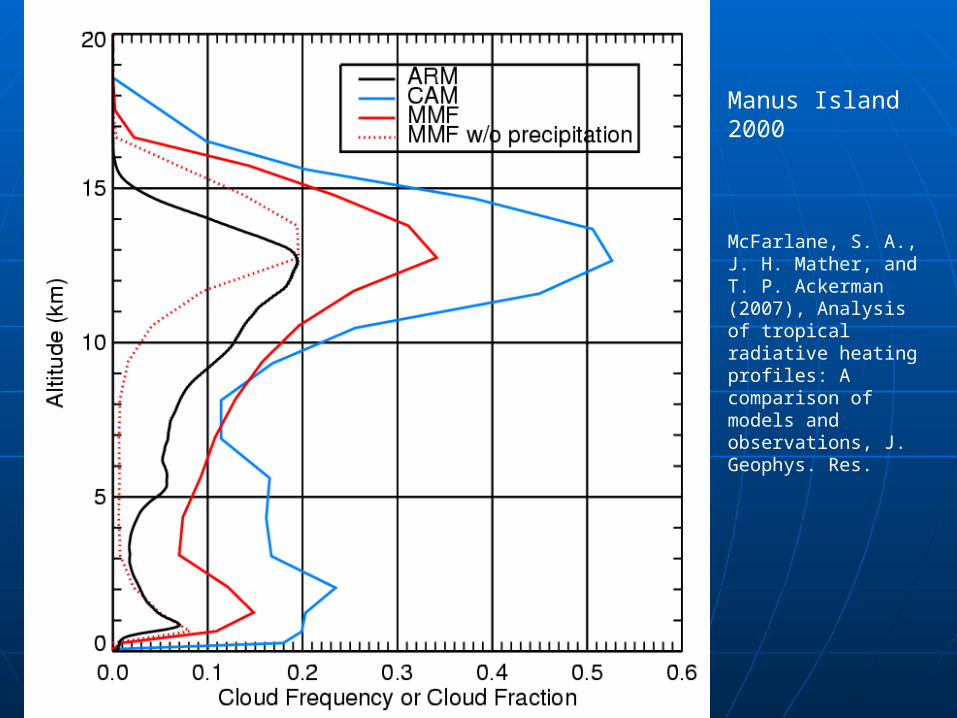
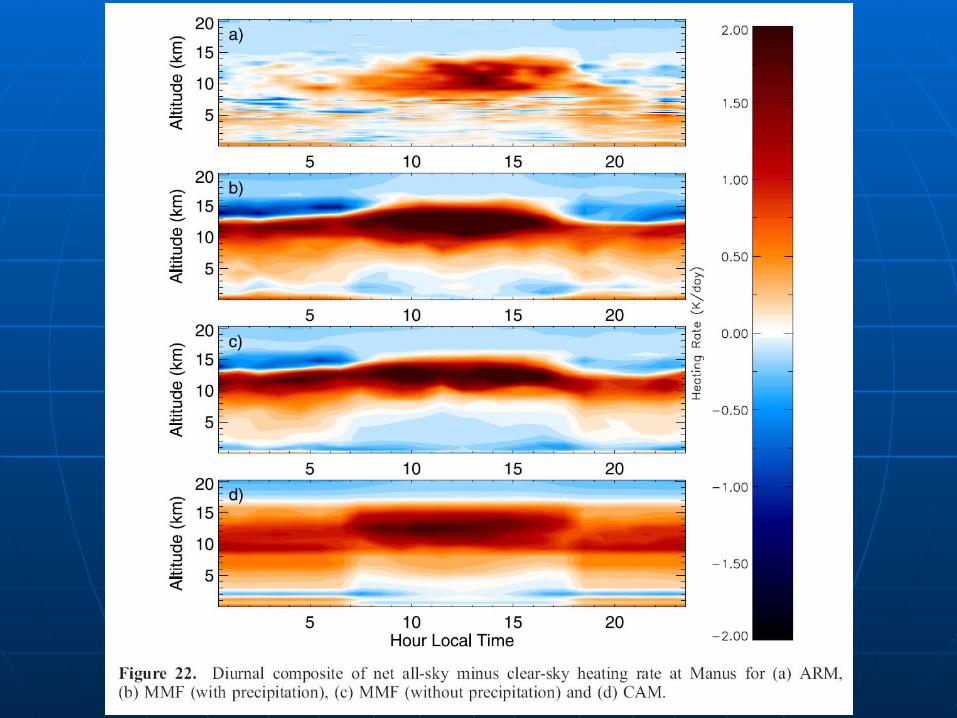
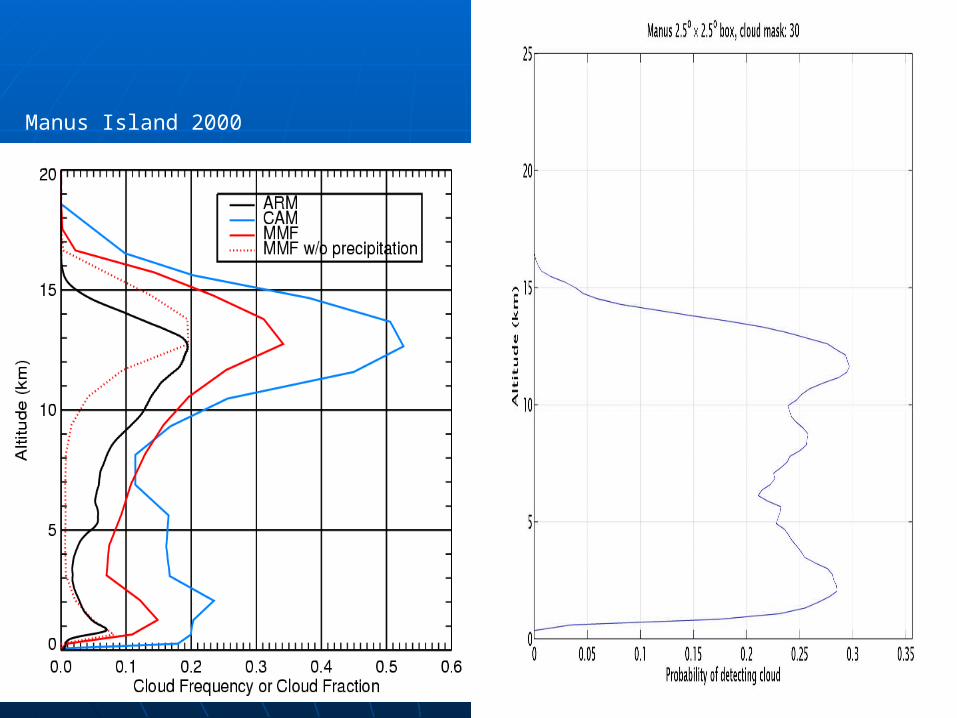
Manus Island 2000
McFarlane, S. A., J. H. Mather, and T. P. Ackerman (2007), Analysis of tropical radiative heating profiles: A comparison ofmodels and observations, J. Geophys. Res.


Uses of Ground-based DataUses of Ground-based Data
Radiation budget Radiation budget Cloud propertiesCloud properties Heating ratesHeating rates Single column models and cloud Single column models and cloud
resolving modelsresolving models• Initial condition GCMSInitial condition GCMS
Classification studiesClassification studies
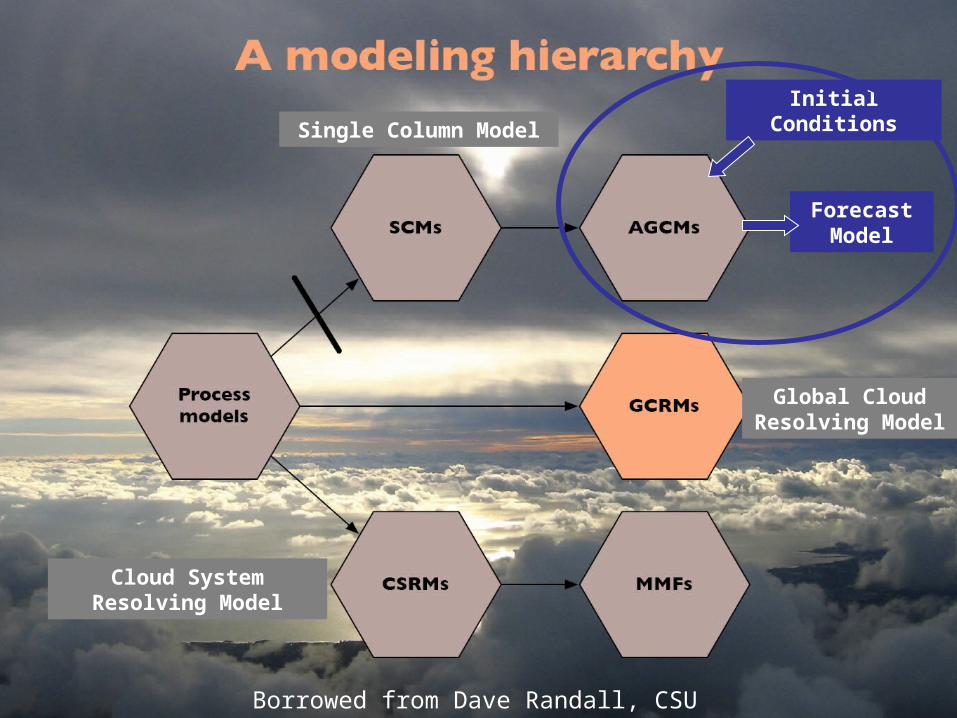
Borrowed from Dave Randall, CSU
Single Column Model
Cloud System Resolving Model
Global Cloud Resolving Model
Initial Conditions
Forecast Model
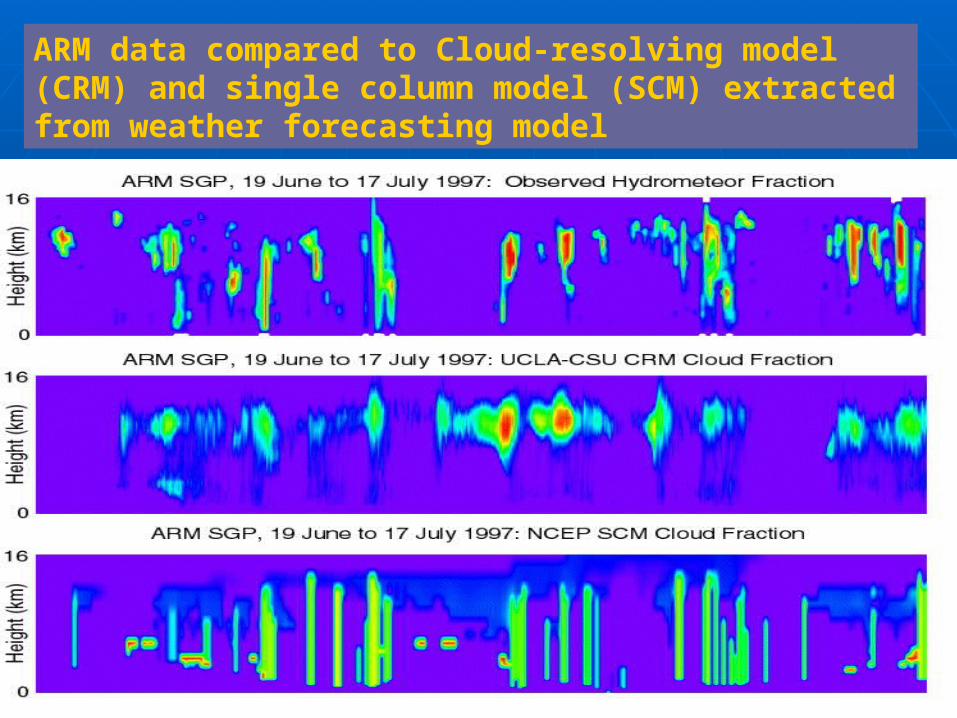
ARM data compared to Cloud-resolving model (CRM) and single column model (SCM) extracted from weather forecasting model
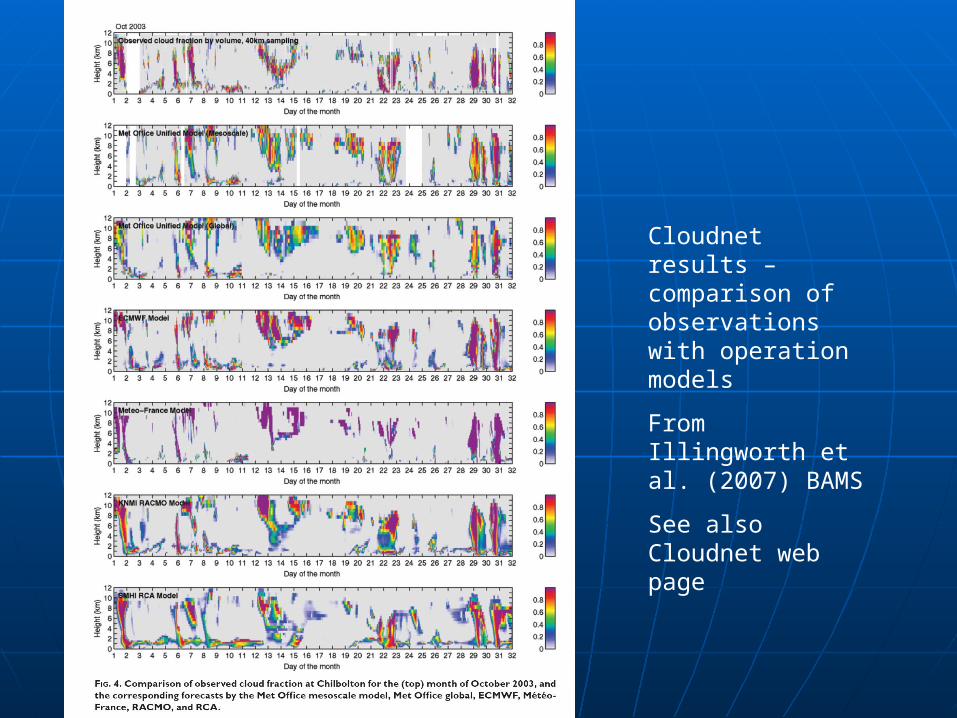
Cloudnet results – comparison of observations with operation models
From Illingworth et al. (2007) BAMS
See also Cloudnet web page
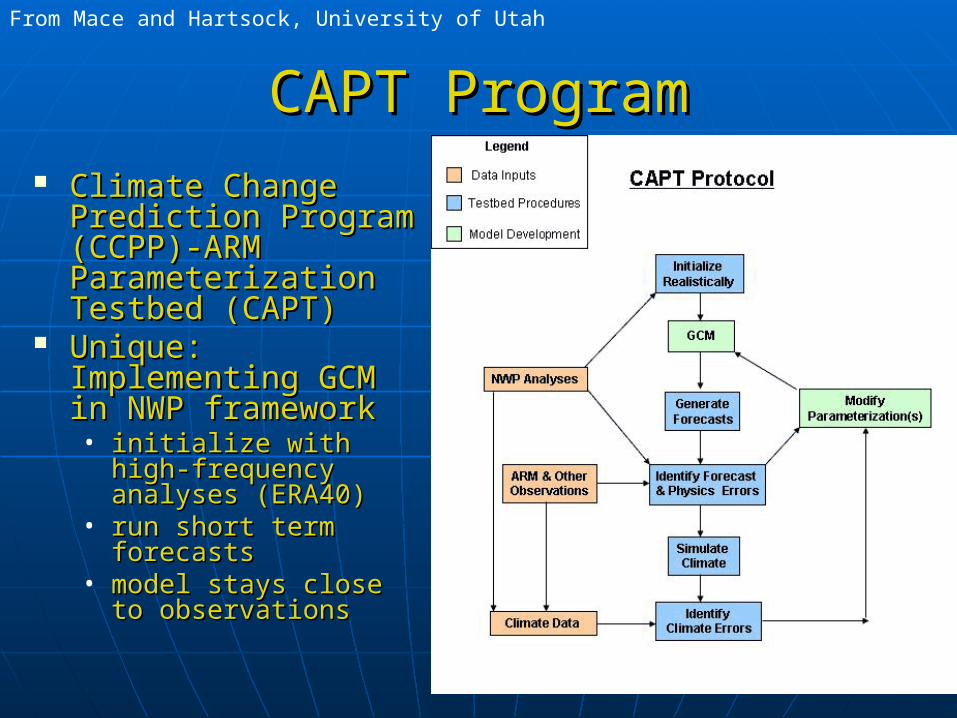
CAPT ProgramCAPT Program Climate Change Climate Change
Prediction Program Prediction Program (CCPP)-ARM (CCPP)-ARM Parameterization Parameterization Testbed (CAPT)Testbed (CAPT)
Unique: Unique: Implementing GCM in Implementing GCM in NWP frameworkNWP framework• initialize with high-initialize with high-
frequency analyses frequency analyses (ERA40)(ERA40)
• run short term run short term forecastsforecasts
• model stays close to model stays close to observationsobservations
From Mace and Hartsock, University of Utah
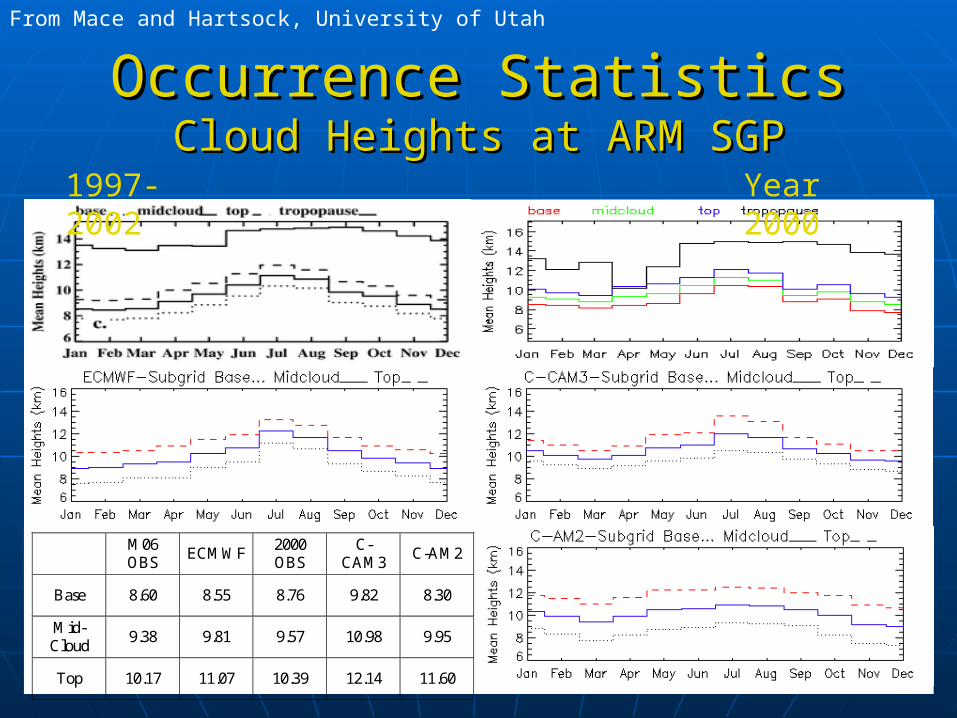
Occurrence StatisticsOccurrence StatisticsCloud Heights at ARM SGPCloud Heights at ARM SGP
Year 20001997-2002
M06 OBS
ECMWF 2000 OBS
C-CAM3
C-AM2
Base 8.60 8.55 8.76 9.82 8.30
Mid-Cloud
9.38 9.81 9.57 10.98 9.95
Top 10.17 11.07 10.39 12.14 11.60
From Mace and Hartsock, University of Utah
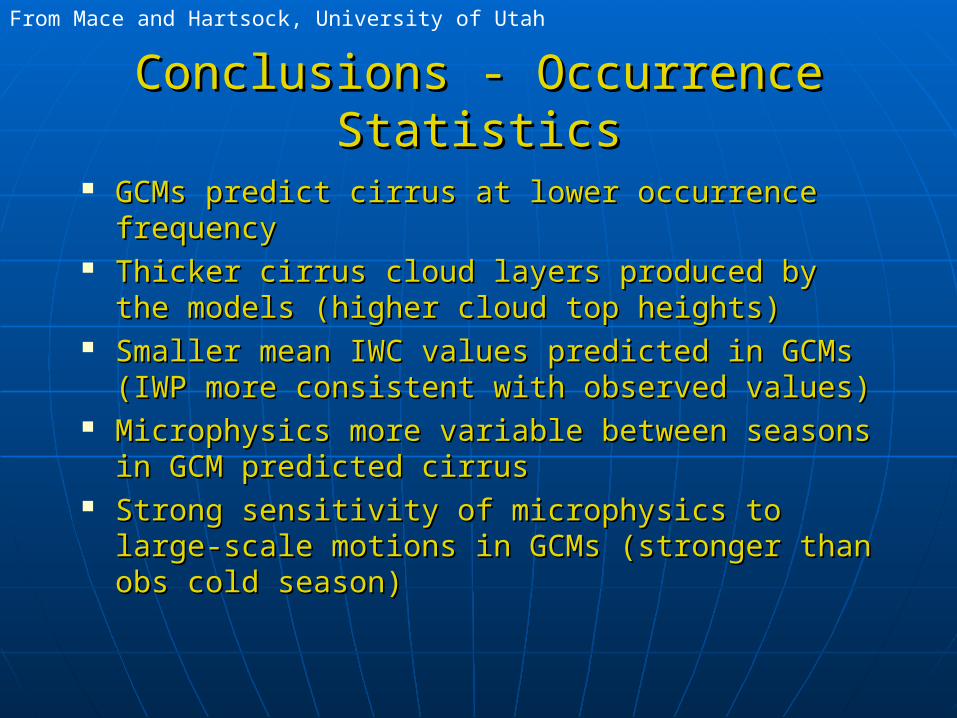
Conclusions - Occurrence StatisticsConclusions - Occurrence Statistics
GCMs predict cirrus at lower occurrence GCMs predict cirrus at lower occurrence frequency frequency
Thicker cirrus cloud layers produced by the Thicker cirrus cloud layers produced by the models (higher cloud top heights)models (higher cloud top heights)
Smaller mean IWC values predicted in GCMs Smaller mean IWC values predicted in GCMs (IWP more consistent with observed values)(IWP more consistent with observed values)
Microphysics more variable between seasons Microphysics more variable between seasons in GCM predicted cirrusin GCM predicted cirrus
Strong sensitivity of microphysics to large-Strong sensitivity of microphysics to large-scale motions in GCMs (stronger than obs cold scale motions in GCMs (stronger than obs cold season)season)
From Mace and Hartsock, University of Utah

Uses of Ground-based DataUses of Ground-based Data
Radiation budget Radiation budget Cloud propertiesCloud properties Heating ratesHeating rates Single column models and cloud Single column models and cloud
resolving modelsresolving models• Initial condition GCMSInitial condition GCMS
Classification studiesClassification studies
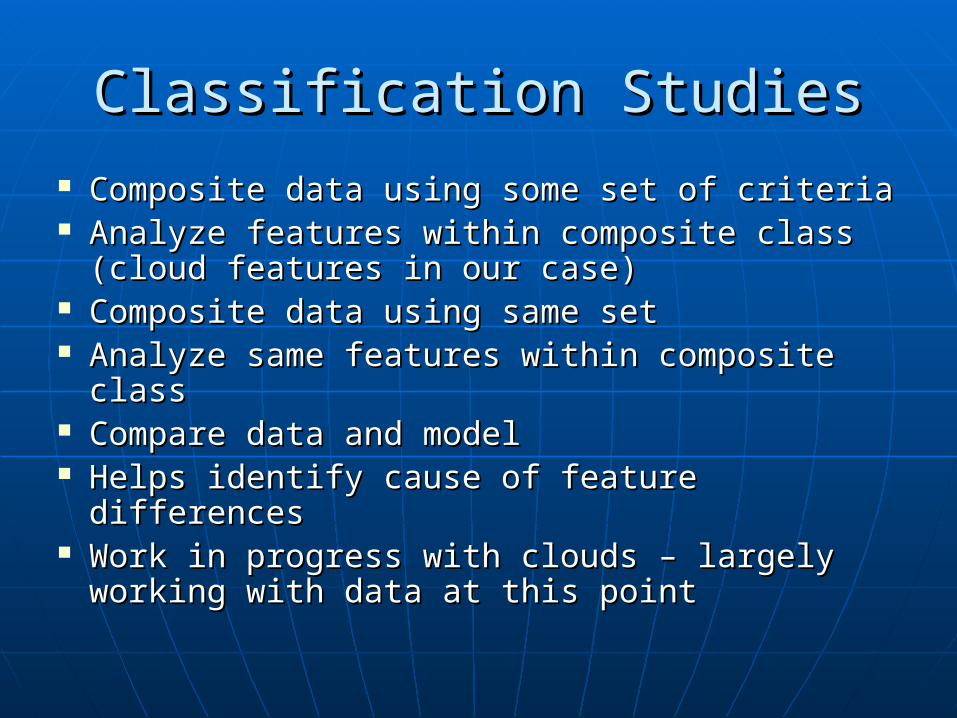
Classification StudiesClassification Studies
Composite data using some set of criteriaComposite data using some set of criteria Analyze features within composite class Analyze features within composite class
(cloud features in our case)(cloud features in our case) Composite data using same setComposite data using same set Analyze same features within composite Analyze same features within composite
classclass Compare data and modelCompare data and model Helps identify cause of feature differencesHelps identify cause of feature differences Work in progress with clouds – largely Work in progress with clouds – largely
working with data at this pointworking with data at this point
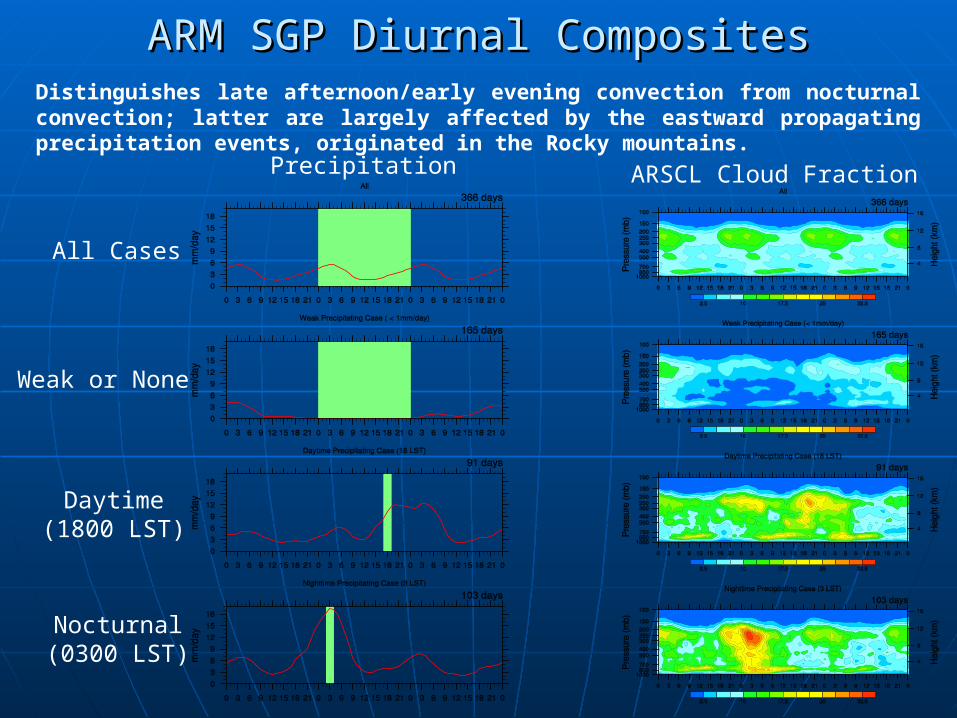
ARM SGP Diurnal CompositesARM SGP Diurnal CompositesDistinguishes late afternoon/early evening convection from nocturnal convection; latter are largely affected by the eastward propagating precipitation events, originated in the Rocky mountains.
Precipitation ARSCL Cloud Fraction
All Cases
Weak or None
Daytime(1800 LST)
Nocturnal(0300 LST)
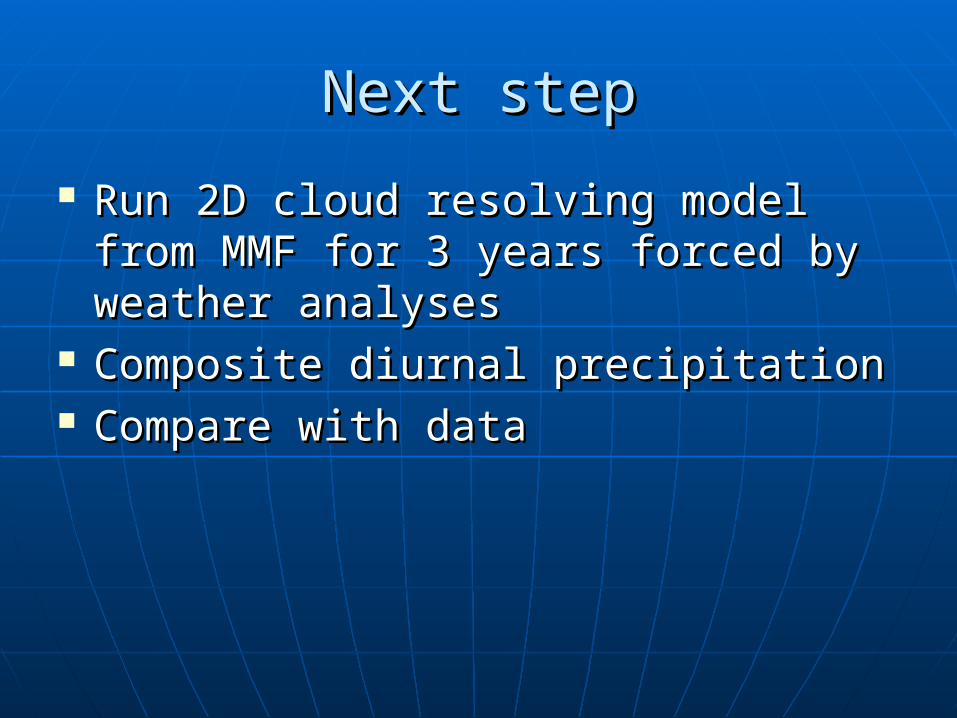
Next stepNext step
Run 2D cloud resolving model from Run 2D cloud resolving model from MMF for 3 years forced by weather MMF for 3 years forced by weather analysesanalyses
Composite diurnal precipitationComposite diurnal precipitation Compare with dataCompare with data
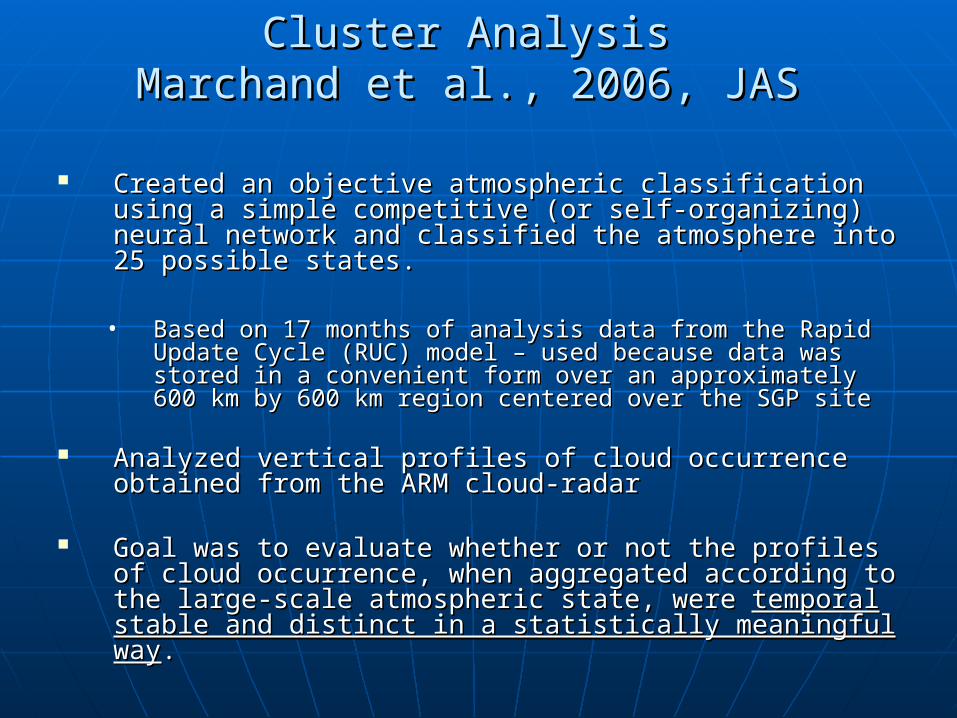
Cluster Analysis Cluster Analysis Marchand et al., 2006, JASMarchand et al., 2006, JAS
Created an objective atmospheric classification using a Created an objective atmospheric classification using a simple competitive (or self-organizing) neural network and simple competitive (or self-organizing) neural network and classified the atmosphere into 25 possible states. classified the atmosphere into 25 possible states.
• Based on 17 months of analysis data from the Rapid Update Based on 17 months of analysis data from the Rapid Update Cycle (RUC) model – used because data was stored in a Cycle (RUC) model – used because data was stored in a convenient form over an approximately 600 km by 600 km convenient form over an approximately 600 km by 600 km region centered over the SGP siteregion centered over the SGP site
Analyzed vertical profiles of cloud occurrence obtained Analyzed vertical profiles of cloud occurrence obtained from the ARM cloud-radar from the ARM cloud-radar
Goal was to evaluate whether or not the profiles of cloud Goal was to evaluate whether or not the profiles of cloud occurrence, when aggregated according to the large-scale occurrence, when aggregated according to the large-scale atmospheric state, were atmospheric state, were temporal stable and distinct in a temporal stable and distinct in a statistically meaningful waystatistically meaningful way. .
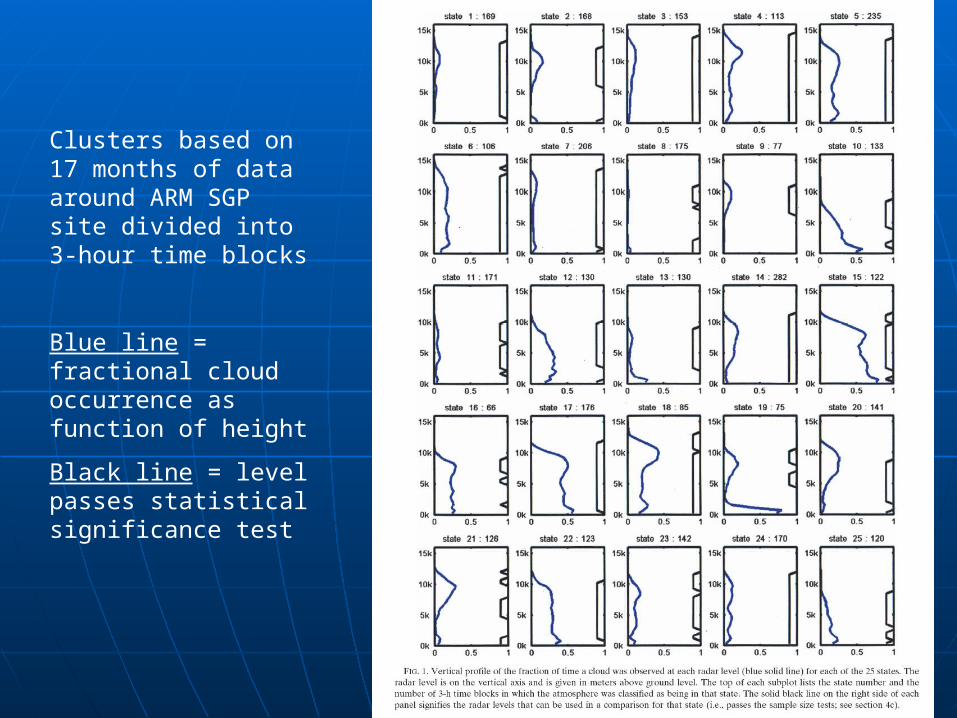
Clusters based on 17 months of data around ARM SGP site divided into 3-hour time blocks
Blue line = fractional cloud occurrence as function of height
Black line = level passes statistical significance test
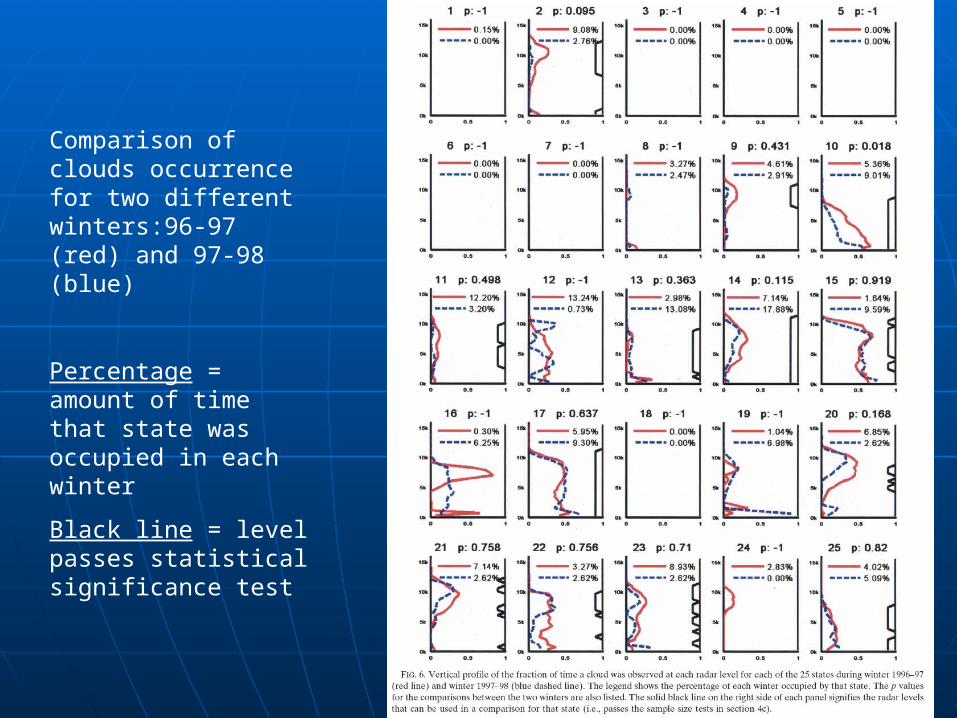
Comparison of clouds occurrence for two different winters:96-97 (red) and 97-98 (blue)
Percentage = amount of time that state was occupied in each winter
Black line = level passes statistical significance test
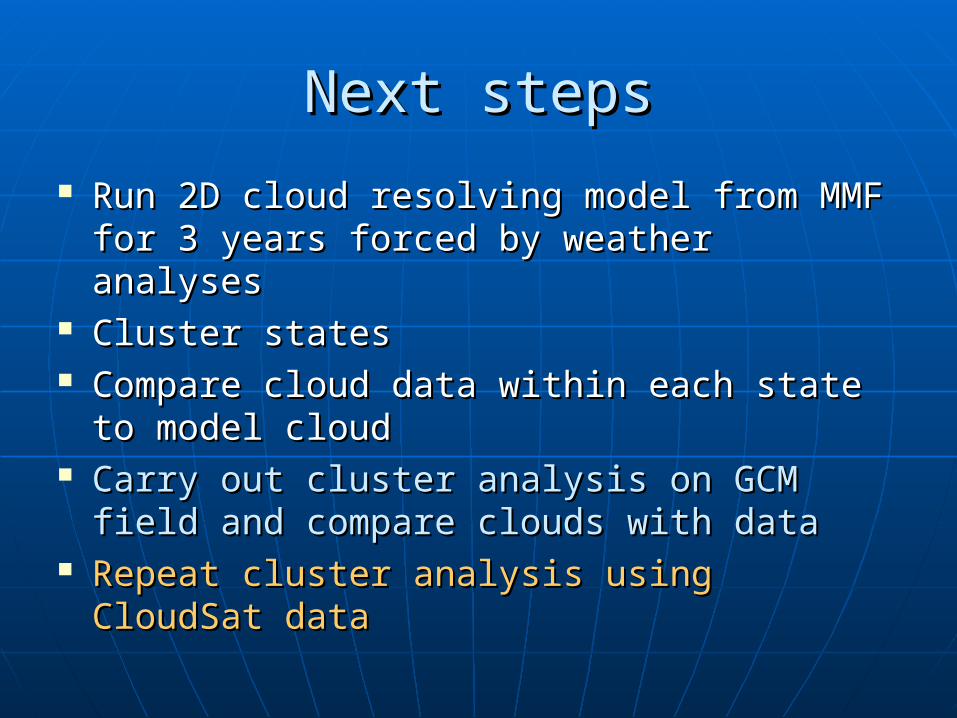
Next stepsNext steps
Run 2D cloud resolving model from MMF Run 2D cloud resolving model from MMF for 3 years forced by weather analysesfor 3 years forced by weather analyses
Cluster statesCluster states Compare cloud data within each state to Compare cloud data within each state to
model cloudmodel cloud Carry out cluster analysis on GCM field and Carry out cluster analysis on GCM field and
compare clouds with datacompare clouds with data Repeat cluster analysis using CloudSat Repeat cluster analysis using CloudSat
datadata
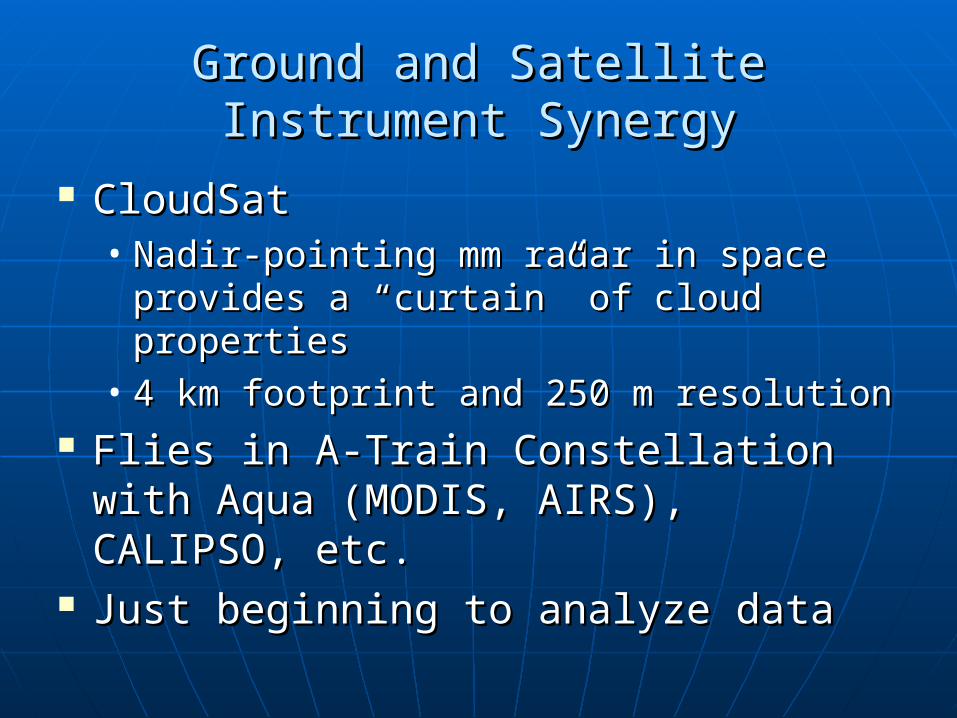
Ground and Satellite Instrument Ground and Satellite Instrument SynergySynergy
CloudSatCloudSat• Nadir-pointing mm radar in space Nadir-pointing mm radar in space
provides a “curtain” of cloud propertiesprovides a “curtain” of cloud properties• 4 km footprint and 250 m resolution4 km footprint and 250 m resolution
Flies in A-Train Constellation with Flies in A-Train Constellation with Aqua (MODIS, AIRS), CALIPSO, etc.Aqua (MODIS, AIRS), CALIPSO, etc.
Just beginning to analyze dataJust beginning to analyze data
Manus Island 2000
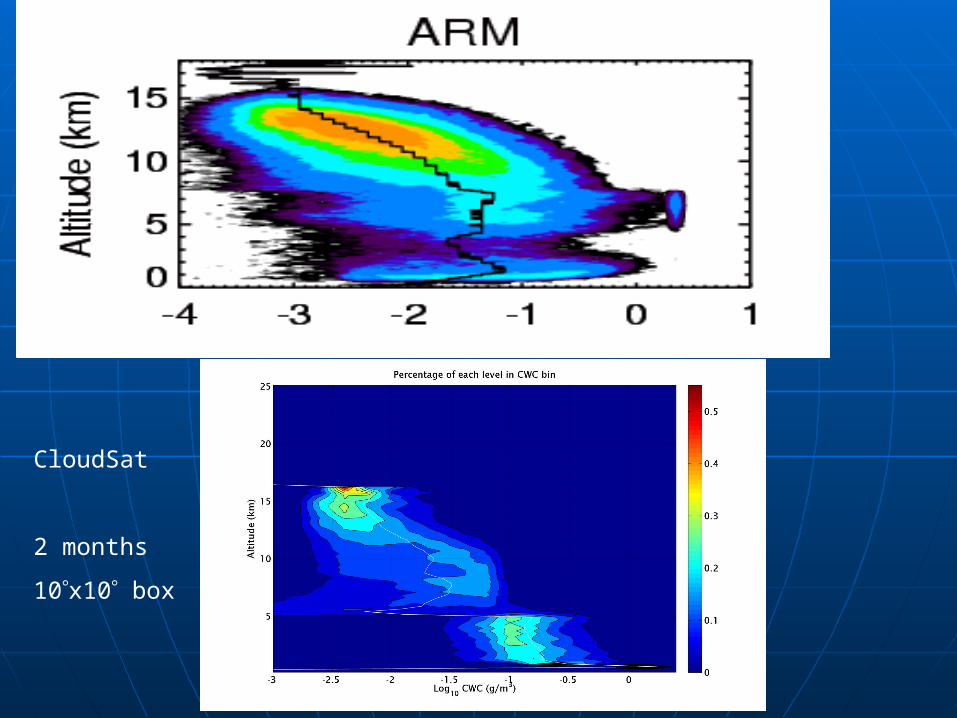
CloudSat
2 months
10x10 box
Concluding thoughtsConcluding thoughts
Using ground-based data to evaluate Using ground-based data to evaluate GCMs is a relatively new fieldGCMs is a relatively new field
Lots to learn and lots to doLots to learn and lots to do Onus is on the data community – GCM Onus is on the data community – GCM
groups too small and overworkedgroups too small and overworked Statistics, statistics, statisticsStatistics, statistics, statistics MMF and GCRM changing the paradigmMMF and GCRM changing the paradigm Most fertile research will combine ground-Most fertile research will combine ground-
based and satellite data – not really being based and satellite data – not really being done yetdone yet
Thank you for your attention!
Dave and I hope this has been useful and informative. Questions are welcome!