applying gmdh-type neural network and genetic … · the price changing of stock market is a very...
TRANSCRIPT

572
Available at http://pvamu.edu/aam
Appl. Appl. Math.
ISSN: 1932-9466
Vol. 6, Issue 2 (December 2011), pp. 572 – 591
Applications and Applied Mathematics:
An International Journal (AAM)
Applying GMDH-Type Neural Network and Genetic Algorithm for Stock Price Prediction of Iranian Cement Sector
Saeed Fallahi1, Meysam Shaverdi2 & Vahab Bashiri2
1Young Researchers Club, Shiraz Branch Islamic Azad University
Shiraz, Iran [email protected]
2Young Researchers Club, Ilam Branch
Islamic Azad University Ilam, Iran
[email protected]; [email protected]
Received: January 21, 2011; Accepted: October 05, 2011
Abstract
The cement industry is one of the most important and profitable industries in Iran and great content of financial resources are investing in this sector yearly. In this paper a GMDH-type neural network and genetic algorithm is developed for stock price prediction of cement sector. For stocks price prediction by GMDH type-neural network, we are using earnings per share (EPS), Prediction Earnings Per Share (PEPS), Dividend per share (DPS), Price-earnings ratio (P/E), Earnings-price ratio (E/P) as input data and stock price as output data. For this work, data of ten cement companies is gathering from Tehran stock exchange (TSE) in decennial range (1999-2008). GMDH type neural network is designed by 80% of the experimental data. For testing the appropriateness of the modeling, reminder of primary data were entered into the GMDH network. The results are very encouraging and congruent with the experimental results.
Keywords: GMDH; Artificial neural networks; stock price index; Genetic algorithm; stock price prediction MSC 2010 No.: 90B15, 62P30

AAM: Intern. J., Vol. 6, Issue 2 (December 2011) 573
1. Introduction
Nowadays, cement demand has increased parallel to the increase in the construction sector. This increase is based on the economic stability, decrease in the interest and exchange rates and increase in the popularity of mortgage system (Ertugrul and Karakasoglu 2009). Cement is one of the main industries in the development and progress of a community plays a vital role. Cement is one of the significant industries which plays vital role in society’s progress and development. With the potential existing, number of cement factories will be increased (www.apadanabana.com). Number of cement plants will be increased based on high existing potential. As reason of crucial progress and high impacts on economy, Iran's cement industry with 75 years experience and high potential capacity can be found special position in industry. Iran's cement industry with 75 years experience and high potential capacity to grow and for the most adequate influence in the economy has managed a special place in the country industry. At present, Iran with a production capacity of two hundred thousand tons of cement a day is the first manufacturer of the middle east and ninth of the world cement market. Currently, Islamic Republic of Iran with two hundred thousand tons capacity in per day is the largest cement producer in the Middle East. Country's production capacity in 1978 was 8 million tons a year and now with 60 million tons per year of growth equal to 750% compared to the year 1978 and 300% in recent 10 years is allocated. Thus, the cement industry is allocated the largest share of the Growth country industry. The production capacity in 1978 was 8 million tons a year and now it improves to 60 million tons, it means that it has 750% growth in comparison to 1978 and 300% growth in recent 10 years. Thus, the cement industry has allocated the largest growth share in industry. Foreign investment in cement industry has an appropriate situation and now the world's largest cement company Hlsym producers of six manufacturing units allocated to the Company and other big producers of cement in the world like Lafarzh and Smag and Smgz are under investigation process to enter the cement industry in Iran. Position of foreign investment in this industry has a good condition and now the Holcim cement company in the world is allocated largest producers in six manufacturing units and other big producers of cement in the world like Lafarj, and cemag and cemex are entering Iran's cement industry (www.Iranminehouse.org). Stock price prediction is one of the main tasks in all private and institution investors. It is an important issue in investment/ financial decision-making and is currently receiving much attention from the research society. However, it is regarded as one of the most challenging problems due to the fact that natures of stock prices/indices are noisy and non-static (Hall, 1994, Li et al 2003, Yaser and Atiya 1996). The price changing of stock market is a very dynamic system that has drive from a number of disciplines. Two main analytical approaches are fundamental analysis and technical analysis. Fundamental analysis uses the macroeconomics factors data such as interest rates, money supply, inflationary rates, and foreign exchange rates as well as the basic financial status of the company. After scrutiny all these factors, the analyst will then make a decision of selling or buying a stock. A technical analysis is based on the historical financial time-series data. However, financial time
574 Fallahi et al.
series show quite complex data (for example, trends, abrupt changes, and volatility clustering) and such series are often non-stationary, whereby a variable has no clear tendency to move to a fixed value or a linear trend (Cheng and Liu 2008). The idea of setting up in Iran a well-established stock exchange goes back to the 1930s. In 1968, Tehran Stock Exchange (TSE) established and started trading shares of a limited number of banks, industrial companies and State-backed securities. TSE is a very small exchange compared to all well established Exchanges in terms of the size, turnover, and other indicators; mainly common shares and participation securities only are being traded and there are not any derivatives; nearly impossible to hedge and the risks are very high. In TSE there is a great lack of knowledge and expertise among the TSE’s staff as well as the brokers and investors (Parchehbar, Shoghi and Talaneh 2010). The aim of this paper is application of GMDH type-neural network for prediction of stock price in cement industry. Within this work, we are using financial indices and closing prices in decennial range (1999-2008) that have taken from TSE. The new approach in this paper is using GMDH type-neural network in prediction of stock price for helping investor and financial analyst. The rest of this paper is organized as follows. Section 2 gives literature review of stock price prediction by neural network approach and GMDH methodology. The proposed forecasting model and the experimental findings from the research is thoroughly described in Section 3. The paper is concluded in Section 4.
2. Research Methodology
2.1. Literature Review
Prediction of stock price variation is a very difficult task and the price dynamism behaves more like a random walk and time varying. During the last decade, stocks and future businessman have come to rely upon different types of intelligent systems to make trading decisions. Lately, artificial neural networks (ANNS) have been applied to this task. ( Atsalakis and Valavanis 2009, Cao and Parry 2009, Chang et al 2009, Chavarnakul and Enke 2008, Enke and Thawornwong 2005, Hassan et al 2007, Kim 2006, Tsang et al 2007, Vellido et al 1999, Yudong and Lenan 2009, Zhang et al 1998, Zhu et al 2008). These approaches have their limitations owing to the prodigious noise and complicated dimensionality of stock price data and besides, the quantity of data and the input variables may also intervene with each other. Therefore, the result may not be that unpredictable (Chang and Liu 2008). Other soft computing methods are also applied in the prediction of stock price and these soft computing approaches are to use quantitative inputs, like technical indices, and qualitative factors, like political effects, to more simplify stock market forecasting and trend analysis. Kuo et al. (2001) uses a genetic algorithm base fuzzy neural network (NN) to determine the qualitative effects on the stock price. Variable selection is sensitive to the success of any network for the financial utility of a company. They applied their method to the Taiwan stock market. Aiken and Bsat (1999) applied a FFNN trained by a genetic algorithm (GA) to forecast three-month US Treasury Bill rates. They conclude that an NN can be used to truly predict these rates. Thammano (1999) used a neuro-fuzzy approach to predict future values of Thailand’s largest governmental bank. The inputs of the model were the closing prices for the current and prior
AAM: Intern. J., Vol. 6, Issue 2 (December 2011) 575
three months, and the profitability ratios. The output of the model was the stock prices for the following three months. Conclusion of this research was that the neuro-fuzzy architecture was able to identify the general traits of the stock market easier and more accurately than the basic back propagation algorithm. Also, it would obtain prediction possibility of investment opportunities during the economic crisis when statistical methods did not yield trusty results. Tansel et al. (1999) compared the ability of linear optimization, ANNs, and GAs in modeling time series data. In this study used the criteria of modeling accuracy, convenience and computational time. They concluded that the best estimates is related to linear optimization methods, although the GAs could gave the same values if the boundaries of the parameters and the resolution were selected suitably, but that the result of NNs had the worst estimations. However, they express that non-linearity could be adaptated by both the GAs and the NNs and that the latter required minimal theoretical background. Baba et al. (2000) used NNs and GAs to create an intelligent decision support system (DSS) for analyzing the Tokyo Stock Exchange Prices Indexes (TOPIX). The necessary characteristic of their DSS was that it specified the high and low TOPIX values four weeks into the future and suggested buy and sell decisions based on the average projected value and the then-current value of the TOPIX. Kim and Han (2000) combine a modified NN and a GA to predict the stock price index. In this study, the GA was used to reduce the complexity of the feature space, by optimizing the thresholds for feature discretization, and to optimize the connection weights between layers. They concluded that the result of GA approach is better than the conventional models. Abraham et al. (2001) investigated hybridized SC approaches for prediction of automated stock market and trend analysis. They used principal component analysis to preprocess the input data, a NN for prediction of one-day ahead stock and a neuro-fuzzy approach for scrutiny the trend of the predicted stock values. Abraham et al. (2003) investigate how the seemingly erratic behavior of stock markets could be well formulated using several connectionist paradigms and soft computing techniques. To prove the proposed method, they analyzed the 7 year’s Nasdaq-100 main index and 4 year’s NIFTY index values. The result of their study was that all the connectionist paradigms considered could represent the stock indices behavior very accurately (Chang and Liu 2008). The group method of data handling (GMDH) (Ivakhnenko 1966) is aimed at identifying the functional structure of a model hidden within the empirical data. The main idea of the GMDH is the use of feed-forward networks based on short-term polynomial transfer functions whose coefficients are obtained using regression combined with emulation of the self-organizing activity behind NN structural learning (Farlow 1984). The GMDH was developed for complex systems for the modeling, prediction identification, and approximation of multivariate processes, diagnostics, pattern recognition, and clustering in data samples. It has been shown that, for inaccurate, noisy, or small data sets, the GMDH is the best optimal simplified model, with a higher accuracy and a simpler structure than traditional NNs models (Ketabchi et al 2010). Hwang (2006) used a fuzzy GMDH-type neural network model for prediction of mobile communication. They used input data within a possible extends as; the amount of portion of population, amount of households and the amount of average n expenditure per households. They showed the proposed neuro-fuzzy GMDH method was excellent for the complicated

576 Fallahi et al.
forecasting problems. Srinivasan (2008) using GMDH network for prediction of energy demand. This paper presented a medium-term energy demand forecasting method that helps utilities identify and forecast energy demand for each of the end-use consumption sector of the energy system, representing residential, industrial, commercial, non-industrial, entertainment and public lighting load. In this study a comparative evaluation of various traditional and neural network-based methods for obtaining the forecast of monthly energy demand was carried out. This paper concluded GMDH very effective and more accurate in producing forecasts than traditional time-series and regression-based models.
2.2. Definition of Stock Price Iindices
In this research input data include indices of EPS, PEPS, DPS, P/E and E/P. Stock price is defined as output data. All indices are defined below. 1- Earnings Per Share (EPS). Earnings per share are one of the most important measure of companies’ strength. The significance of EPS is obvious, as the viability of any business depends on the income it can generate. A money losing business will eventually go bankrupt, so the only way for long term survival is to make money. EPS allows us to compare different companies’ power to make money. The higher the EPS with all else equal, the higher each share should be worth. To calculate this ratio, divide the company’s net income by the number of shares outstanding during the same period (http://investing-school.com). 2- Prediction Earnings Per Share (PEPS). PEPS is the last of Prediction Earnings Per Share. On the other hand, it is unrealized Earnings Per Share. 3- Dividend per share (DPS). DPS is the total dividends paid out over an entire year (including interim dividends but not including special dividends) divided by the number of outstanding ordinary shares issued (investopedia). 4- Price-earnings ratio (P/E). Value investors have long considered the price earnings ratio one of the single most important numbers available when evaluating a company's stock price. The P/E looks at the relationship between the stock price and the company’s earnings and it is the most popular metric of stock analysis. The price earnings ratio is equal to the price of the stock divided by EPS of common stock (investopedia). 5- Earnings-price ratio (E/P). E/P is a way to help determine a security's stock valuation, that is, the fair value of a stock in a perfect market. It is also a measure of expected, but not realized, growth. It may be used in place of the price-earnings ratio if, say, there are no earnings (as one cannot divide by zero). It is also called the earnings yield or the earnings capitalization ratio. E/P is equal to the EPS of common stock divided by the price of the stock (financial dictionary). 6- Stock price. The Stock price is equal to the last of Stock price which trading at the one day.

AAM: Intern. J., Vol. 6, Issue 2 (December 2011) 577
2.3. Group Method of Data Handling (GMDH)
Using the GMDH algorithm, a model can be represented as a set of neurons in which different pairs of them in each layer are connected through a quadratic polynomial and, therefore, produce new neurons in the next layer. Such representation can be used in modeling to map inputs to
outputs. The formal definition of the identification problem is to find a function, f , that can be approximately used instead of the actual one, f , in order to predict output y for a given input
vector nxxxxX ,,,, 321 as close as possible to its actual output . Therefore, given number
of observations (M) of multi-input, single output data pairs so that
Mixxxxfy iniiii ,,3,2,1,,,, 321 . (1)
It is now possible to train a GMDH-type-NN to predict the output values iy for any given input
vector iniii xxxxX ,,,, 321 , that is
Mixxxxfy iniiii ,,3,2,1,,,,ˆˆ 321 . (2)
In order to determine a GMDH type-NN, the square of the differences between the actual output and the predicted one is minimized, that is
min),,,(ˆ1
2
21
M
i iiii yxxxf . (3)
The general connection between the inputs and the output variables can be expressed by a complicated discrete form of the Volterra functional series (Ivakhnenko 1966) in the form of
n
i
n
j kji
n
k ijk
n
i ji
n
j iji
n
i io xxxaxxaxaay1 1 11 11
, (4)
where is known as the Kolmogorov-Gabor polynomial (Ivakhnenko 1966). The general form of mathematical description can be represented by a system of partial quadratic polynomials consisting of only two variables (neurons) in the form of
25
24321,ˆ jijijioji xaxaxxaxaxaaxxGy . (5)
In this way, such partial quadratic description is recursively used in a network of connected neurons to build the general mathematical relation of the inputs and output variables given in Equation (4). The coefficients ia in Equation (5) are calculated using regression techniques. It
can be seen that a tree of polynomials is constructed using the quadratic form given in Equation (5). In this way, the coefficients of each quadratic function iG are obtained to fit optimally the
output in the whole set of input–output data pairs, that is

578 Fallahi et al.
min())(
1
2
M
GyE
M
i ii . (6)
In the basic form of the GMDH algorithm, all the possibilities of two independent variables out of the total n input variables are taken in order to construct the regression polynomial in the form of Equation (5) that best fits the dependent observations Miyi ,,2,1, in a least squares
sense (Nariman-Zadeh and Jamali 2007). Using the quadratic sub-expression in the form of Equation (5) for each row of M data triples, the following matrix equation can be readily obtained as
YAa , (7)
where a is the vector of unknown coefficients of the quadratic polynomial in Equation (5)
54321 ,,,,, aaaaaaa o (8)
and
TMyyyyY ,,, 321 . (9)
Here, Y is the vector of the output’s value from observation. It can be easily seen that
22
22
222222
21
211111
1
1
1
MqMpMqMpMqMp
qpqpqp
qpqpqp
xxxxxx
xxxxxx
xxxxxx
A
. (10)
The least squares technique from multiple regression analysis leads to the solution of the normal equations in the form of
YAAAa TT 1)( . (11) 3. The Stock Price Prediction Using the GMDH-type Neural Network The feed-forward GMDH-type neural network for the stock price was constructed using an experimental data set of ten cement companies from Tehran stock exchange (TSE) in decennial range (1999-2008). For each cement companies, the data was divided into two parts: 80% was used as training data, and 20% was used as test data. The EPS, Prediction PEPS, DPS, P/E and E/P were used as inputs of the GMDH-type network. The Stock prices were used as desired outputs of the neural network.
AAM: Intern. J., Vol. 6, Issue 2 (December 2011) 579
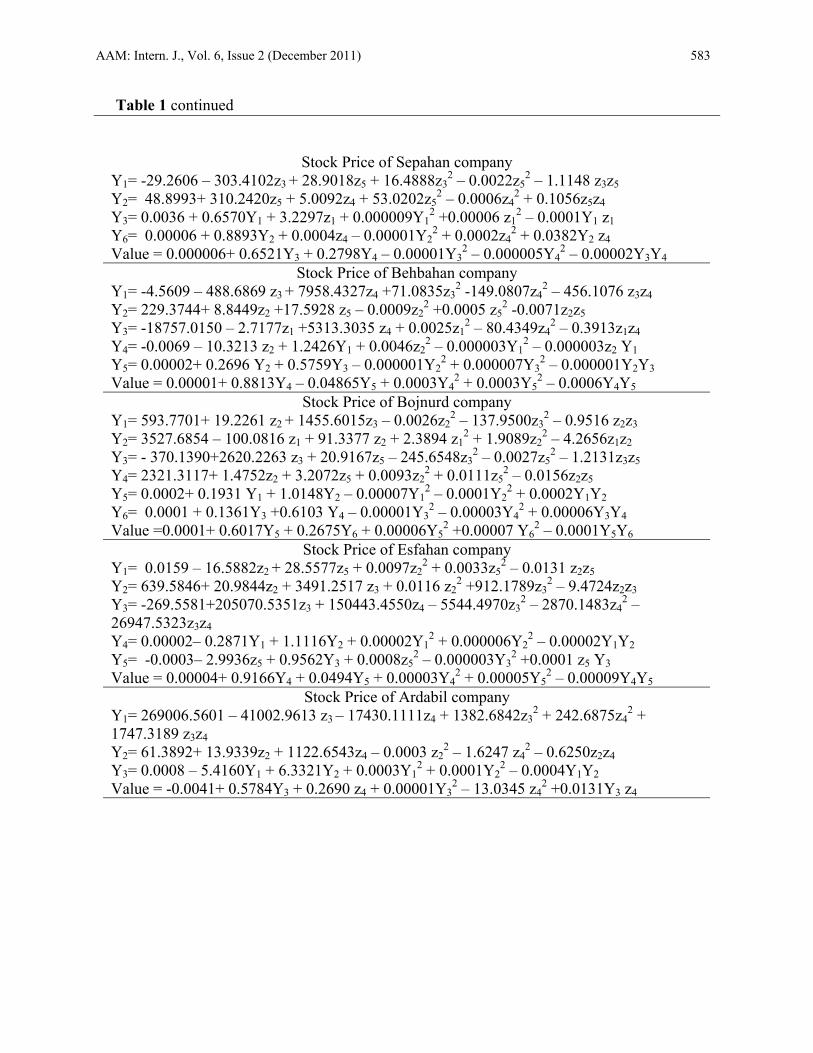
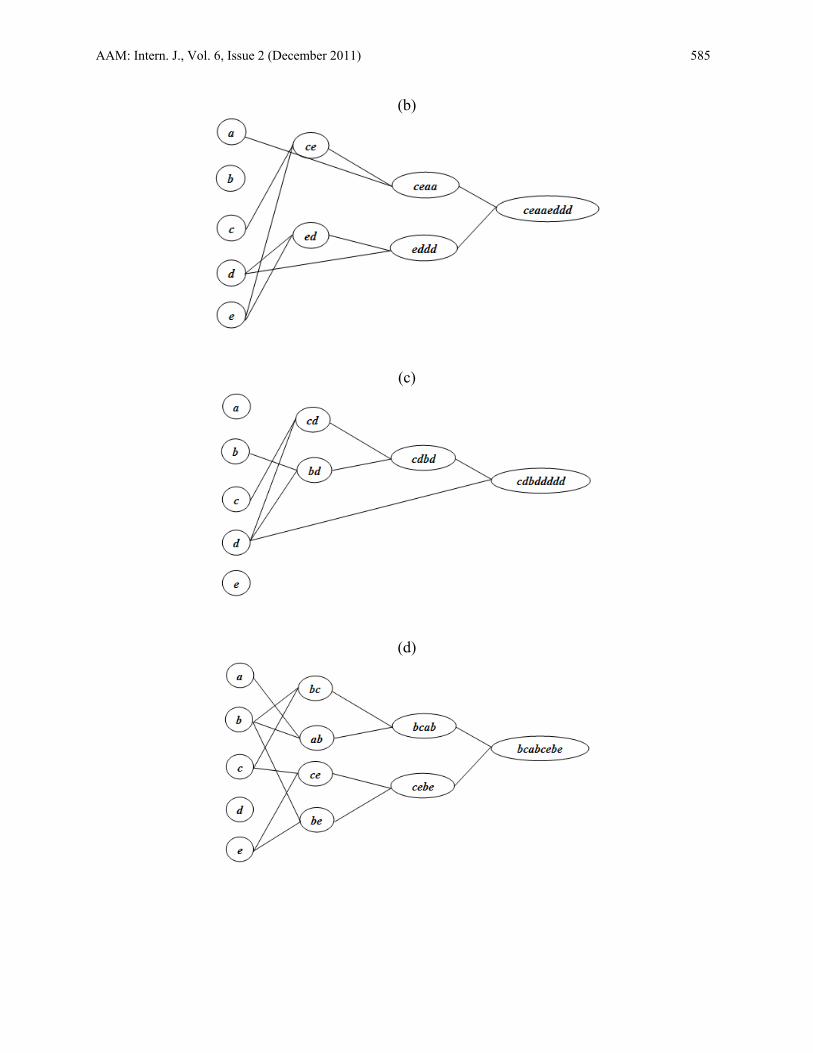
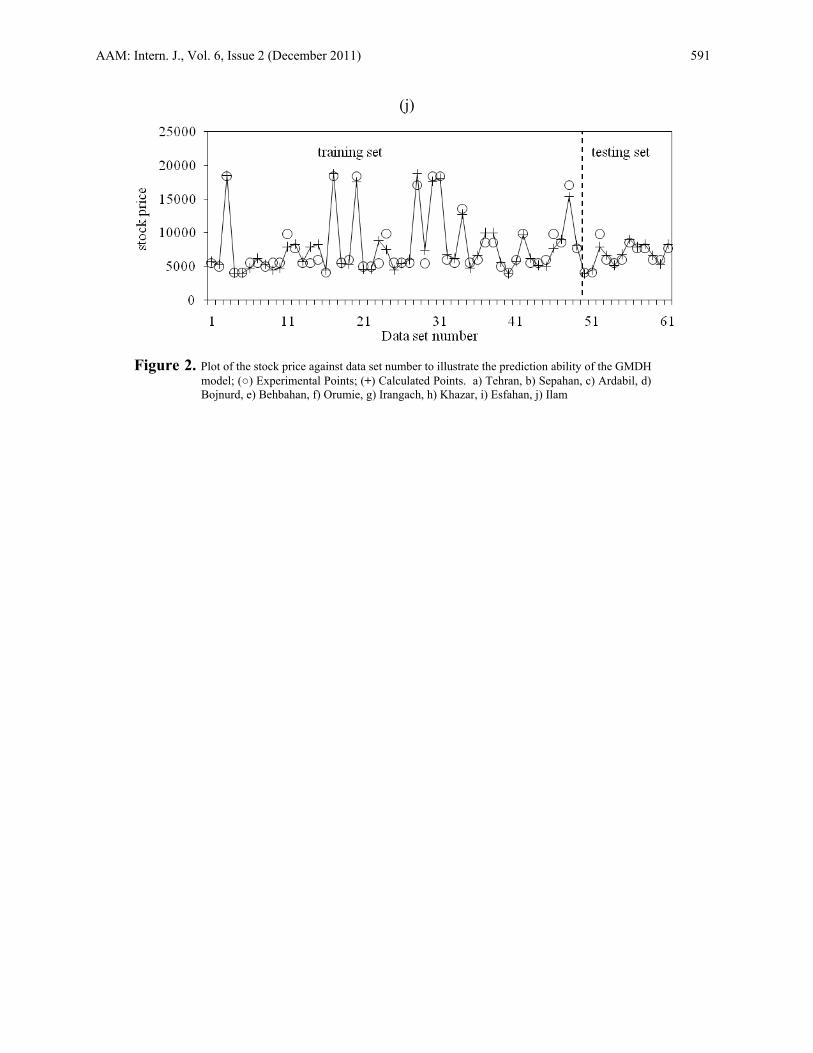
In order to estimate the stock prices for companies, using the GMDH type network, seven polynomial equations were obtained (Table 1). In this table, z1 is the DPS, and z2 , z3 ,z4 and z5 are the E/P, P/E, PEPS and EPS, respectively. The proposed model was used to calculate the stock prices (the output data). In the present study, the stock prices were predicted using GMDH-type- NNs. Such a NN identification process needs a suitable optimization method to find the best network architecture. In this way, genetic algorithm (GA) is arranged in a new approach to design the whole architecture of the GMDH-type-NNs. It provides the optimal number of neurons in each hidden layer and their connectivity configuration to find the optimal set of appropriate coefficients of quadratic expressions to model stock prices. The best structure in GMDH were reached by two hidden layers with 300 generations, cross over probability of 0.9 and mutation probability of 0.1, to model the stock prices. The developed GMDH neural network was successfully used to obtain seven models for seven companies calculate Stock prices. The optimal structures of the developed neural network with 2-hidden layers are shown in Figure1. For instance, “abdecccd” and “ceaaeddd” are corresponding genome representations for the Stock prices of Tehran and Sepahan companies, respectively. In which, a ,b ,c , d and e stand for (DPS), (E/P), (P/E), (PEPS) and (EPS), respectively. All input variables were accepted by the models. In other words, the GMDH-type-NN provides an automated selection of essential input variables, and builds polynomial equations for the Stock prices modeling. These polynomial equations show the quantitative relationship between input and output variables (Table 1). Our proposed models behavior in prediction of the Stock prices is demonstrated in Figs. 2. The results of the developed models give a close agreement between observed and predicted values of the Stock prices. In order to determine the accuracy of the models some statistical measures are given in Table 2. These statistical values are based on 2R as absolute fraction of variance, RMSE as root-mean squared error, and MAD as mean absolute deviation which are defined as follows:
M
i acutuali
M
i actualieli
Y
YYR
1
2
)(
0
2
)()(mod2 1 , 2/1
0
2
)()(mod
M
YYRMSE
M
i actualieli,
M
YYMAD
M
i actualieli
0 )()(mod.
4. Conclusion Today cement industry is an attractive market. The main reason of this is the increase in house and infrastructure investments. It is obvious that cement production will rise commensurate to the increase in the house demand. Also implementation of mortgage system, and increase in investments will affect the cement demand. The main reason of this is the increase in infrastructure investments. In this paper we examine the relationship between stock prices indices and stock prices. Modeling a soft computing system for stock price prediction in cement

580 Fallahi et al.
industry is very useful for all traders and financial consultant to decreasing investment risk kinds and rising profit of stockholders. In future study more price indices or other factor that effect on stock price can be used for accurate stock price prediction. Also other stock price prediction methods can be comparison with proposed model and the proposed model can be applied for the firms in other sectors.
REFERENCES
Abraham, A., Baikunth, N. & Mahanti, P.K. (2001). Hybrid intelligent systems for stock market analysis. Lecture Notes in Computer Science 2074: 337–345.
Abraham, A., Philip, N.S. & Saratchandran, P. (2003). Modeling chaotic behavior of stock indices using intelligent paradigms. Neural Parallel and Scientific Computations 11: 143–160.
Aiken, M. & Bsat, M. (1999). Forecasting market trends with neural networks. Information Systems Management 16(4): 42–48.
Atsalakis, G. S. & Valavanis, K.P. (2009). Surveying stock market forecasting techniques Part II: Soft computing methods. Expert Systems with Applications 36(3): 5932–5941.
Baba, N., Inoue, N. & Asakawa, H. (2000). Utilization of Neural Networks and GAs for Constructing Reliable Decision Support Systems to Deal Stocks. IEEE–INNS–ENNS International Joint Conference on Neural Networks (IJCNN’00) 5: 5111–5116.
Cao, Q. & Parry, M.E. (2009). Neural network earnings per share forecasting models: A comparison of backward propagation and the genetic algorithm. Decision Support Systems 47(1): 32–41.
Chang, P.C. & Liu, C.H. (2008). A TSK type fuzzy rule based system for stock price prediction. Expert Systems with Applications 34: 135–144.
Chang, P.C., Liu, C.H., Lin, J.L., Fan, C.Y. & Ng, C.S.P. (2009). A neural network with a case based dynamic window for stock trading prediction. Expert Systems with Applications 36(3): 6889–6898.
Chavarnakul, T. & Enke, D. (2008). Intelligent technical analysis-based equivolume charting for stock trading using neural networks. Expert Systems with Applications 34(2):1004–1017.
Enke, D. & Thawornwong, S. (2005). The use of data mining and neural networks for forecasting stock market returns. Expert Systems with Applications 29(4): 927–940.
Ertugrul, I. & Karakasoglu, N. (2009). Performance evaluation of Turkish cement firms with fuzzy analytic hierarchy process and TOPSIS methods. Expert Systems with Applications36(1):702–715.
Farlow, S.J. (1984). Self-Organizing Method in Modelling: GMDH-Type Algorithm, Marcel Dekker, New York.
Financial dictionary. http://financial-dictionary.thefreedictionary.com Hall, J.W. (1994). Adaptive selection of US stocks with neural nets. In G. J. Deboeck (Ed.),
Trading on the edge: Neural, genetic and fuzzy systems for chaotic financial markets, pp 45–65. New York: Wiley.
Hassan, M.R., Nath, B. & Kirley, M. (2007). A fusion model of HMM, ANN and GA for stock market forecasting. Expert Systems with Applications 33(1): 171–180.
Hwang, S.H. (2006) Fuzzy GMDH-type neural network model and its application to forecasting of mobile communication. Computers & Industrial Engineering 50: 450–457.

AAM: Intern. J., Vol. 6, Issue 2 (December 2011) 581
Investing-school (2008). http://investing-school.com Investopedia. www.investopedia.com Ivakhnenko, A.G. (1966). Polynomial theory of complex systems. IEEE Transactions on
Systems. Ketabchi, S., Ghanadzadeh, H., Ghanadzadeh, A., Fallahi, S. & Ganji, M. (2010). Estimation of
VLE of binary systems (tert-butanol + 2-ethyl-1-hexanol) and (n-butanol + 2- ethyl-1-hexanol) using GMDH-type neural network. J. Chem. Thermodynamics 42: 1352–1355.
Kim, KJ. (2006). Artificial neural networks with evolutionary instance selection for financial forecasting. Expert Systems with Applications 30(3): 519–526.
Kim, KJ. & Han, I. (2000). Genetic algorithms approach to feature discretization in artificial neural networks for the prediction of stock price index. Expert Systems with Applications 19: 125–132.
Kuo, RJ., Chen, C.H. & Hwang, Y.C. (2001). An intelligent stock trading decision support system through integration of genetic algorithm based fuzzy neural network and artificial neural network. Fuzzy Sets and Systems 118: 21–24.
Li, T., Li, Q., Zhu, S. & Ogihara, M. (2003). A survey on wavelet applications in data mining. SIGKDD Explorations 4(2):49–68.
Nariman-Zadeh, N. & Jamali, A. (2006). Pareto genetic design of GMDH-type neural networks for nonlinear systems. int J. Drchal, J. Koutnik (Eds.), Proceedings of the International Workshop on Inductive Modelling, Czech Technical University, Prague, Czech Republic, pp. 96–103.
Parchehbar, S., Shoghi, M. & Talaneh, A. (2010). An Analysis of Emerging Markets Returns Volatility: Case of Tehran Stock Exchange. Working Paper Series.
Srinivasan, D. (2008). Energy demand prediction using GMDH networks. Neurocomputing 72 625–629.
Tansel, I.N., Yang, S.Y., Venkataraman, G., Sasirathsiri, A., Bao, W.Y. & Mahendrakar, N. (1999). Modeling Time Series Data by Using Neural Netwroks and Genetic Algorithms. In Dagli CH, AL Buczak, J Ghosh, MJ Embrechts, O Ersoy (Eds.) Smart Engineering System Design: neural networks, fuzzy logic, evolutionary programming, data mining, and complex systems. In Proceedings of the Artificial Neural Networks in Engineering Conference (ANNIE ’99). New York ASME Press: 1055–1060.
Thammano, A. (1999). Neuro-fuzzy Model for Stock Market Prediction. In Dagli, CH, AL Buczak, J Ghosh, MJ Embrechts, O Ersoy (Eds.) Smart Engineering System Design: neural networks, fuzzy logic evolutionary programming, data mining, and complex systems. In Proceedings of the Artificial Neural Networks in Engineering Conference (ANNIE ’99). New York: ASME Press: 587–591.
Tsang, P.M., Kwok, P., Choy, S.O., Kwan, R., Ng, S.C. & Mak, J., et al. (2007). Design and implementation of NN5 for Hong Kong stock price forecasting. Engineering Applications of Artificial Intelligence 20(4): 453–461.
Vellido, A., Lisboa, P.J.G., Vaughan, J. (1999). Neural networks in business: A survey of applications (1992–1998). Expert Systems with Applications 17: 51–70.
Yaser, S.A.M. & Atiya, A.F. (1996). Introduction to financial forecasting. Applied Intelligence 6: 205–213.
Yudong, Z. & Lenan, W. (2009). Stock market prediction of S&P 500 via combination of improved BCO approach and BP neural network. Expert Systems with Applications 36(5): 8849–8854.

582 Fallahi et al.
Zhang, G., Patuwo, B.E. & Hu, M.Y.(1998). Forecasting with artificial neural networks: The state of the art. International Journal of Forecasting 14: 35–62.
Zhu, X., Wang, H., Xu, L. & Li, H. (2008). Predicting stock index increments by neural networks: The role of trading volume under different horizons. Expert Systems with Applications 34(4): 3043–3054.
Table 1. Polynomial Equations of the GMDH Model for the cement Companies
Stock Price of Ilam company Y1= 14335.1317 – 1914.5848z5 - 0.3774z4 + 91.2376z5
2 + 0.0053z42 + 0.0739z5z4
Y2= 11485.5557- 3.6704z1 – 3.8540z2 – 2.3817z12 – 2.3061z2
2 – 4.6942z1z2
Y3= 11485.5557- 3.6704z1 – 3.8540z2 – 2.3817z12 – 2.3061z2
2 – 4.6942z1z2
Y4= 0.0001 + 0.0763Y1 + 0.7900Y2 + 0.00003Y12 – 0.00003Y2
2 + 0.000008Y1Y2 Y5= 0.0090 + 0.3653z4 + 0.1142Y3 + 10.0803z4
2 – 0.00003Y32 + 0.0613z4Y3
Value = 0.0001+ 1.0292Y4 + 0.0221Y5 – 0.0003Y42 – 0.0003Y5
2 + 0.0007Y4Y5 Stock Price of Tehran company
Y1= 607.8173 - 3690.5823z1 +3545.3949z2 -3.2209z12 -4.8347z2
2 +8.1310z1z2
Y2= 2182.7494-139.1586 z4 +0.3136 z5 +53.0293 z42 +0.0005 z5
2 +0.3632 z4z5
Y3= -8.7645+3796.3023 z3 +7910.3860 z4 -50.4918 z32 -124.4239z4
2 –876.4355z3z4
Y4=0.000007+0.1018 Y1 +0.8895Y2 -0.000002Y12 +0.0000004Y2
2 –0.000002Y1Y2 Y5= -0.0111– 0.0125z3 +1.5989 Y3 +6.8815 z3
2 -0.000008Y32 –0.0576 z3Y3
Value = -0.00007+1.4419Y4 –0.4224Y5 -0.00006Y42 -0.00003 Y5
2 +0.00009Y4Y5 Stock Price of Irangach company
Y1= - 21.5977+ 1078.8286z4 – 5.7736z5 – 51.1767z42 + 0.0054z5
2 + 0.3074z4z5
Y2= 8174.0716 – 272.1459z3 – 2.1345z5 + 2.8032z32 + 0.0046z5
2 – 0.0386z3z5
Y3= - 0.4929 – 25.3797z3 + 2666.4638z4 + 1.0292z32 – 158.4473z4
2 – 49.3238z3z4
Y4= - 1573.6637+ 19.1327z3 – 49.9142z2 – 0.0066z32 + 1.6899z2
2 – 0.2814z3z2
Y5= 0.0036 + 1.9248Y1 – 0.9972Y2 – 0.0004Y12 – 0.0003Y2
2 + 0.0008Y1Y2 Y6= 0.0016 + 1.8334Y3 – 0.9274Y4 – 0.0005Y3
2 – 0.0002Y42 + 0.0008Y3Y4
Value = 0.0003 – 0.3693Y5 + 1.3992Y6 – 0.0001Y52 – 0.0003Y6
2 + 0.0005Y5Y6 Stock Price of Orumie company
Y1= 0.0126 + 12.8808z1 – 6.0043z5 – 0.0020z12 + 0.0022z5
2 – 0.0008z1z5
Y2= 3.2523 – 264.6254z1 + 275.8401z2 + 0.0383z12 – 0.0498z2
2 – 0.0130z1z2
Y3= 0.00002 + 0.0001z4 + 0.6017Y1 + 0.0006z42 – 0.000008Y1
2 + 0.0808z4Y1 Y4= 0.00002 + 0.0001z4 + 0.5418Y2 + 0.0004z4
2 – 0.000006Y22 + 0.0710z4Y2
Value = -0.000007 + 1.2552Y3 – 0.2811Y4 – 0.000002Y32 – 0.0000001Y4
2 – 0.000003Y3Y4 Stock Price of Khazar company
Y1= 9970.2069 – 1292.3273 z3 + 24.4081z5 + 56.3911z32 – 0.0020z5
2 – 1.1611z3z5
Y2= 6359.4509 – 2.2734z1 + 6.6454z2 – 0.0463z12 – 0.0278z2
2 + 0.0800z1z2
Y3= - 23820.6500 + 16.0379z1 + 2784.3134z4 – 0.0040z12 – 26.7419z4
2 – 0.06988z1z4
Y4= 4080.6252+ 26.3012z1 + 68.1696z3 + 0.0029z12 + 51.1881z3
2 – 2.4558z1z3
Y5= 0.00006 + 0.2157Y1 + 0.7616Y2 + 0.0000001Y12 – 0.00002Y2
2 + 0.00002Y1Y2 Y6= 0.00008 + 0.0006Y3 + 0.8782Y4 + 0.00001Y3
2 – 0.00002Y42 – 0.00001Y3Y4
Value = 0.00004 + 0.8815Y5 + 0.1720Y6 – 0.00002Y52 – 0.00001Y6
2 + 0.00003Y5Y6
AAM: Intern. J., Vol. 6, Issue 2 (December 2011) 583
Table 1 continued
Stock Price of Sepahan company Y1= -29.2606 – 303.4102z3 + 28.9018z5 + 16.4888z3
2 – 0.0022z52 – 1.1148 z3z5
Y2= 48.8993+ 310.2420z5 + 5.0092z4 + 53.0202z52 – 0.0006z4
2 + 0.1056z5z4
Y3= 0.0036 + 0.6570Y1 + 3.2297z1 + 0.000009Y12 +0.00006 z1
2 – 0.0001Y1 z1 Y6= 0.00006 + 0.8893Y2 + 0.0004z4 – 0.00001Y2
2 + 0.0002z42 + 0.0382Y2 z4
Value = 0.000006+ 0.6521Y3 + 0.2798Y4 – 0.00001Y32 – 0.000005Y4
2 – 0.00002Y3Y4 Stock Price of Behbahan company
Y1= -4.5609 – 488.6869 z3 + 7958.4327z4 +71.0835z32 -149.0807z4
2 – 456.1076 z3z4
Y2= 229.3744+ 8.8449z2 +17.5928 z5 – 0.0009z22 +0.0005 z5
2 -0.0071z2z5
Y3= -18757.0150 – 2.7177z1 +5313.3035 z4 + 0.0025z12 – 80.4349z4
2 – 0.3913z1z4
Y4= -0.0069 – 10.3213 z2 + 1.2426Y1 + 0.0046z22 – 0.000003Y1
2 – 0.000003z2 Y1
Y5= 0.00002+ 0.2696 Y2 + 0.5759Y3 – 0.000001Y22 + 0.000007Y3
2 – 0.000001Y2Y3 Value = 0.00001+ 0.8813Y4 – 0.04865Y5 + 0.0003Y4
2 + 0.0003Y52 – 0.0006Y4Y5
Stock Price of Bojnurd company Y1= 593.7701+ 19.2261 z2 + 1455.6015z3 – 0.0026z2
2 – 137.9500z32 – 0.9516 z2z3
Y2= 3527.6854 – 100.0816 z1 + 91.3377 z2 + 2.3894 z12 + 1.9089z2
2 – 4.2656z1z2
Y3= - 370.1390+2620.2263 z3 + 20.9167z5 – 245.6548z32 – 0.0027z5
2 – 1.2131z3z5
Y4= 2321.3117+ 1.4752z2 + 3.2072z5 + 0.0093z22 + 0.0111z5
2 – 0.0156z2z5
Y5= 0.0002+ 0.1931 Y1 + 1.0148Y2 – 0.00007Y12 – 0.0001Y2
2 + 0.0002Y1Y2 Y6= 0.0001 + 0.1361Y3 +0.6103 Y4 – 0.00001Y3
2 – 0.00003Y42 + 0.00006Y3Y4
Value =0.0001+ 0.6017Y5 + 0.2675Y6 + 0.00006Y52 +0.00007 Y6
2 – 0.0001Y5Y6 Stock Price of Esfahan company
Y1= 0.0159 – 16.5882z2 + 28.5577z5 + 0.0097z22 + 0.0033z5
2 – 0.0131 z2z5
Y2= 639.5846+ 20.9844z2 + 3491.2517 z3 + 0.0116 z22 +912.1789z3
2 – 9.4724z2z3
Y3= -269.5581+205070.5351z3 + 150443.4550z4 – 5544.4970z32 – 2870.1483z4
2 – 26947.5323z3z4
Y4= 0.00002– 0.2871Y1 + 1.1116Y2 + 0.00002Y12 + 0.000006Y2
2 – 0.00002Y1Y2 Y5= -0.0003– 2.9936z5 + 0.9562Y3 + 0.0008z5
2 – 0.000003Y32 +0.0001 z5 Y3
Value = 0.00004+ 0.9166Y4 + 0.0494Y5 + 0.00003Y42 + 0.00005Y5
2 – 0.00009Y4Y5 Stock Price of Ardabil company
Y1= 269006.5601 – 41002.9613 z3 – 17430.1111z4 + 1382.6842z32 + 242.6875z4
2 + 1747.3189 z3z4
Y2= 61.3892+ 13.9339z2 + 1122.6543z4 – 0.0003 z22 – 1.6247 z4
2 – 0.6250z2z4
Y3= 0.0008 – 5.4160Y1 + 6.3321Y2 + 0.0003Y12 + 0.0001Y2
2 – 0.0004Y1Y2 Value = -0.0041+ 0.5784Y3 + 0.2690 z4 + 0.00001Y3
2 – 13.0345 z42 +0.0131Y3 z4
584 Fallahi et al.
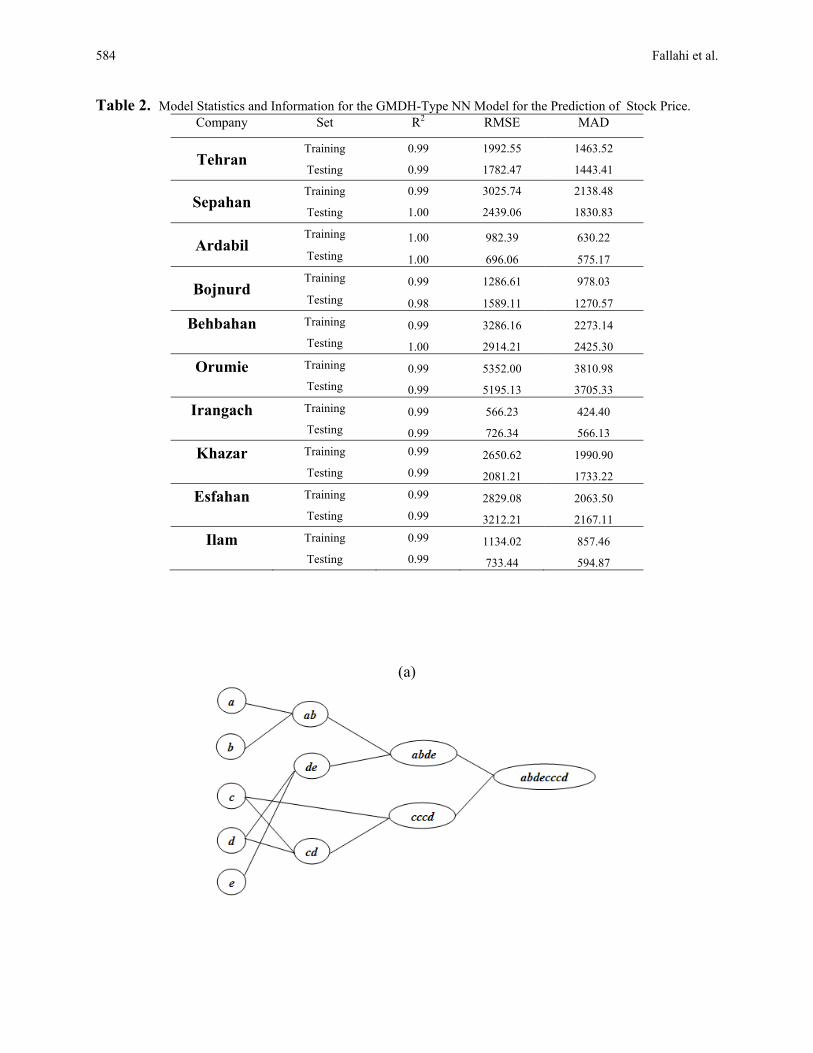
Table 2. Model Statistics and Information for the GMDH-Type NN Model for the Prediction of Stock Price. Company Set R2 RMSE MAD
Tehran Training 0.99 1992.55 1463.52
Testing 0.99 1782.47 1443.41
Sepahan Training 0.99 3025.74 2138.48
Testing 1.00 2439.06 1830.83
Ardabil Training 1.00 982.39 630.22
Testing 1.00 696.06 575.17
Bojnurd Training 0.99 1286.61 978.03
Testing 0.98 1589.11 1270.57
Behbahan Training 0.99 3286.16 2273.14
Testing 1.00 2914.21 2425.30
Orumie Training 0.99 5352.00 3810.98
Testing 0.99 5195.13 3705.33
Irangach Training 0.99 566.23 424.40
Testing 0.99 726.34 566.13
Khazar Training 0.99 2650.62 1990.90
Testing 0.99 2081.21 1733.22
Esfahan Training 0.99 2829.08 2063.50
Testing 0.99 3212.21 2167.11
Ilam Training 0.99 1134.02 857.46
Testing 0.99 733.44 594.87
(a)
AAM: Intern. J., Vol. 6, Issue 2 (December 2011) 585
(b)
(c)
(d)

586 Fallahi et al.
(e)
(f)
(g)

AAM: Intern. J., Vol. 6, Issue 2 (December 2011) 587
(h)
(i)
(j)
Figure 1. Developed Structure of GMDH-Type-NN Model ; a) Tehran, b) Sepahan, c) Ardabil, d) Bojnurd, e)
Behbahan, f) Orumie, g) Irangach, h) Khazar, i) Esfahan, j) Ilam

588 Fallahi et al.
(a)
(b)
(c)

AAM: Intern. J., Vol. 6, Issue 2 (December 2011) 589
(d)
(e)
(f)

590 Fallahi et al.
(g)
(h)
(i)
AAM: Intern. J., Vol. 6, Issue 2 (December 2011) 591
(j)
Figure 2. Plot of the stock price against data set number to illustrate the prediction ability of the GMDH
model; (○) Experimental Points; (+) Calculated Points. a) Tehran, b) Sepahan, c) Ardabil, d) Bojnurd, e) Behbahan, f) Orumie, g) Irangach, h) Khazar, i) Esfahan, j) Ilam