appraisal of shaken bioreactor mixing …mixing14.eu/p/mixing14eu_83.pdf · mixing in a shaken...
TRANSCRIPT
14th European Conference on Mixing Warszawa, 10-13 September 2012 APPRAISAL OF SHAKEN BIOREACTOR MIXING EFFICIENCY FOR
DIFFERENT OPERATING CONDITIONS
W. Weheliyea, G. Rodriguezb, T. Anderleic, M. Michelettib, M. Yianneskisa and A. Duccia
aUniversity College London, Department of Mechanical Engineering, Torrington Place, London, WC1E 7JE, UK
bUniversity College London, Department of Biochemical Engineering, Torrington Place, London, WC1E 7JE, UK
cAdolf Kühner AG, Dinkelbergstrasse 1, CH-4127 Birsfelden, Switzerland [email protected]
Abstract. Mixing in a shaken cylindrical bioreactor was studied through measurements of the mixing time, velocity characteristics and free surface inclination, employing a fast acid-base reaction with two pH indicators, PIV and laser flow visualization, respectively. The mixing times were longer when tracer was inserted inside the vortex present in the flow and insertion location affected mixing time. Transition of the flow from a pattern in-phase with the shaker rotation to an out-of-phase one was affected by the fluid viscosity; the Froude number at which transition occurs was found to decrease with increasing viscosity. The results indicate that optimization of mixing in shaken reactors might be achieved by careful selection of operating conditions. Keywords: Shaken bioreactor, mixing time, dual indicator method
1. INTRODUCTION Cell culture techniques have become increasingly important for the production of many biological materials such as vaccines, antibodies, hormones, nucleic acids. At laboratory scale, they are usually carried out in low shear devices, with shaken bioreactors being largely employed in the early stages of bioprocess development because they offer a low power consumption solution to screen several processes in parallel. Shaken bioreactors offer a reliable solution for mammalian cell cultivation as they provide a well-defined liquid-gas interface essential for cell metabolism. The process developed at lab scale is commonly implemented in a large scale industrial stirred tank with major challenges that have to be addressed in the scale-up due to the different shapes and mixing mechanisms taking place in the two scales of bioreactors. The bioprocess industry is currently moving towards extending the use of shaken technology to the industrial production scale to take full advantage of simplified scaling-up procedures based on a single agitation mechanism, of the possibility to implement more efficiently single use manufacturing processes and of the flexibility and adaptability of this technology to provide a single piece of equipment for different cell culture processes. Despite their extended use at research and lab scale, only a few publications can be found in the literature, which deals with engineering aspects of shaken bioreactors. An engineering characterization of the performances of shaken bioreactors has been attempted by flow studies mainly employing Computational Fluid Dynamics (CFD) [1-2], power consumption [3], and mixing time measurements [4]. The flow in Erlenmeyer flasks and cylindrical bioreactors was investigated by [1,2] to estimate macro-parameters such as power consumption, the liquid-gas interfacial area and the volumetric mass transfer coefficient, kLa, and assess the ensemble averaged flow variation occurring when different shaker rotational
503
speed, N, and fluid viscosity, ν, are considered. [3] identified the ‘out-of-phase’ phenomenon, where, at high N, the fluid motion lags the shaker table position along its orbit, resulting in lower volumetric power consumption. Mixing time studies have been extensively performed in stirred bioreactors, using several methodologies that assess macro-mixing dynamics on local and global scales. Local methods measure a physical parameter (pH, temperature or conductivity) at a specific point. The major drawback of such methods is often the intrusive nature of the measurement probes that disturbs the flow inside the bioreactor and affects mixing dynamics. Global methods are generally non-intrusive as they rely either on chemically based reactions and/or optical detection. The greatest benefit of global methods is that slower mixing zones within the vessel can be identified and therefore more accurate macro-mixing time estimates can be obtained. One of the most promising approaches involves fast acid-base reactions within a vessel [4–7]. pH indicators are used to visualize the mixing of the fluid and image processing to ensure a more objective measurement. Such an approach has widely been used in stirred tanks, but also in shaken vessels. Two variations of the method exist, employing either a single or a combination of two pH indicators. [4] estimated mixing times in shaken cylindrical vessels of different volumes, investigating the effects of N, internal diameter of the cylindrical bioreactor, di, orbital diameter, do, and fluid height, h. A slow mixing zone was found at low agitation rates close to the cylinder bottom, where mixing was mainly determined by diffusion whilst the region closer to the cylinder wall exhibited the fastest mixing. They also found that to achieve good mixing the height of the free-surface wave should be greater than half that of the fluid height at rest. Mixing times were found to decrease at higher Froude number, Fr, while a reduction in cylinder diameter, di, resulted in an increase of mixing times at a constant N. [4] concluded that the most important parameter for effective scaling up/down is the di/do ratio. The current work aims to redress the aforementioned lack of understanding and builds upon previous work of the group, with the aim to gain a thorough characterization of the mixing occurring in cylindrical shaken bioreactors for a range of characteristic operating conditions.
2. MATERIALS AND METHODS The experimental apparatus comprised a glass cylinder with a transparent bottom placed in a square acrylic trough to minimize refraction. A steel structure enclosed the trough and cylinder leaving the top of the cylinder open. The cylinder inner diameter, di, height, H, and wall thickness, tc, were 100 mm, 250 mm and 5 mm, respectively. A filling volume of 393mL was used, corresponding to h =50 mm, while the shaker rotational speed was varied in a range N=90-130 RPM with an orbital diameter do=25 mm. The Dual Indicator System for Mixing Time (DISMT) first developed by [6] was employed. It comprises a fast acid-base reaction in the presence of two pH indicators, Methyl Red and Thymol Blue. The Methyl Red indicator turns from red to yellow at about pH=5 and Thymol Blue turns from yellow to blue at about pH=9. The combination of such pH indicators results in the fluid being red for pH<5, blue for pH>9 and yellow for 5<pH<9. The indicators were prepared in a volume of de-ionized water at a final concentration of 4.3mg/L. The fast acid-base reaction is initiated by inserting stoichiometric amounts of base (Sodium Hydroxide) in a solution containing the pH indicators, previously acidified with 0.5M 5mL/L Hydrochloric Acid. At the beginning of the experiment the solution in the vessel was acidic (red). The base was inserted after the shaker table had completed three revolutions and the flow inside the bioreactor was fully developed. Four sets of mixing time experiments were carried out with the feeding pipe being located on the open end of the glass cylinder, at one of four different radial positions located along the diameter of the cylinder at 14 mm intervals (Figure 1).
504

Figure 1. Cross-sectional view of the cylindrical bioreactor and of the feed pipe locations.
The feeding pipe was constructed with microfluidics connectors (IDEX Health and Science) and was fed by a Harvard Apparatus syringe pump. The vessel was positioned on a Kühner AG LS-X lab shaker equipped with a 360˚ encoder. A colour NET iCube camera was fixed to the shaker table to record the experiments. The shaker table encoder and timing box allowed a full synchronization of the table motion, the camera acquisition and the syringe pump insertion. Insertion was nearly instantaneous, lasting around 2 ms (i.e. φ<2˚). One image was recorded every revolution, at a fixed phase angle φ=0˚ and the recorded images were analyzed using Matlab. The velocity characteristics were determined using PIV and the surface shape was visualized using the equipment and methodologies described in [8].
3 RESULTS AND DISCUSSION Characteristic images of four experiments are shown in Figure 2.
(a)
(b)
(c)
(d) Figure 2. Characteristic sequences of mixing time experiments for different insertion positions and rotational speed: (a) Position 3, N=100 rpm; (b) Position 3, N=90 rpm; (c) Position 3, N=100 rpm; (d) Position 4, N=130 rpm.
505

The four sequences (a-d) were selected solely to visualize different mixing paths and each sequence includes one image during injection, two during the mixing process and one close to the completion of mixing, but not at the same time intervals from insertion. In sequence (a) the toroidal vortex is clearly manifested by the entrainment of base (blue indicator), resulting in a long mixing time as little fluid exchange occurs between the vortex and the rest of the flow. Similar entrainment can be observed in sequence (b), where both acid and base are entrained in the vortex producing red and blue vortices on either side of the cylinder. Sequence (c) shows an experiment with little/no entrainment into the toroidal vortex, resulting in a shorter/faster mixing time. There are no distinct red or blue zones, just an inhomogeneous mix of red (acid), blue (basic) and yellow (well mixed) colour. Image sequence (d) shows an experiment for out-of-phase conditions, for which a different flow pattern occurs: the fluid near the centre, where a vertical precessional vortex is present [8], undergoes slower mixing than that close to the walls. To measure the mixing time the variation over time of the standard deviation of the colour of the fluid contained in a specific area (denoted as A in Figure 2 a) was determined. Figure 3 shows the standard deviation of the colour (σt - σ0) normalized by the difference between the initial and final σ for the four different insertion positions at N =100 RPM. It is noteworthy that insertion outside the vortex in position 3 results in the 95% mixing time being around 30% than for insertion inside the vortex, an opposite effect to that reported in [9] for insertion inside/outside the macroinstability (MI) vortex in tanks stirred by an impeller. The MI resulted in the tracer reaching the impeller and being dispersed more rapidly in [9] when in-vortex insertion was implemented, whereas in the present case the tracer inside the vortex remains trapped and takes longer to mix.
In Figure 4 the variation of the mixing time with Fr for the four insertion locations are shown, together with the average mixing time for all injection positions at each Fr. Each non-dimensional mixing time (NT) was calculated as the average value for a specific degree of mixing obtained for 13 homogeneity degrees varying from 92% to 98% at intervals of 0.5% [10]. Position 1 values show the greatest variation with Fr, while positions 2 and 3 exhibit values close to the averages ones, and position 4 the greatest scatter. These results indicate that reproducibility and optimization of mixing time can be affected by the insertion location. Furthermore, NT is clearly smaller when the out-of-phase flow pattern is present.
Figure 3. Time evolution of the normalised standard deviation of the acid/base concentration within the interrogation region for different insertion positions.
Figure 4. Variation of non-dimensional mixing time, NT, with Fr for different insertion positions.
506

The effect of viscosity ν on the flow patterns was also studied and characteristic vorticity and velocity vector distributions are shown in Figures 5 (a) and (b) for ν=10‐6 m2s‐1 and ν=10‐5 m2s‐1, respectively, both for N=110 rpm (Fr2=0.169). For lower ν the free surface profile is still linear and an insipient transition to out-of phase condition is in evidence [see 8] while for higher ν the surface shape is wavy and the out-of-phase pattern is well established. This indicates that Frcr becomes smaller for increasing viscosity.
(a) (b) Figure 5. Vorticity contour and velocity vector plots for increasing viscosity (ϕ=0°, do/di=0.25, h/ di =0.3, N=110 rpm, Fr2=0.169): (a) ν=10‐6 m2s‐1; (b) ν=10‐5 m2s‐1. The variation of the maximum non-dimensional surface wave amplitude with Fr2 for different h and do values presented in Figure 6 shows a linear relation; the free surface slope is independent of h/di and is constant for a given Froude number. This is consistent with the corresponding results for water of [8], but with a lower constant of proportionality of 1.27 (cf. 1.4 for water). It is evident that the critical wave height, Δh/di, decreases with increasing ν. It may be concluded that the critical Δh/di for transition is a function of viscosity and further experiments are necessary to establish this function. The variation of the constant of proportionality ao, of the free surface inclination for different normalised viscosities (ν/νwater) is shown in Figure 7. The power law variation of ao with ν/νwater can be utilized to extend the applicability of the scaling law reported by [8] for water, and the resulting modified equation that takes into account the effect of ν is: h/di=(h/Δh)cr a0water (ν/νwater)-0.0256
Fr2.
Figure 6. Variation of the maximum non-dimensional wave amplitude, Δh/di, with Fr2 for different fluid heights and orbital diameters, for ν=4.97 10-5 m2s-1.
Figure 7. Variation of the constant of proportionality, ao, of the free surface inclination for different fluid viscosity, ν.
507
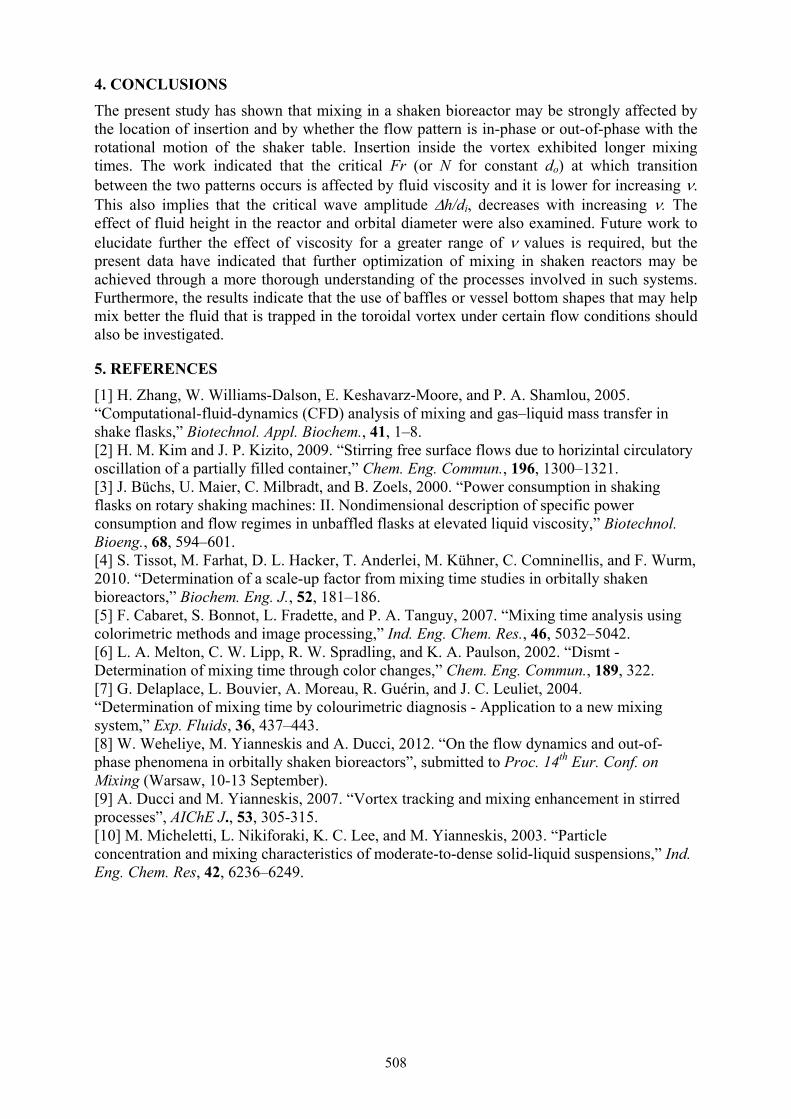
4. CONCLUSIONS The present study has shown that mixing in a shaken bioreactor may be strongly affected by the location of insertion and by whether the flow pattern is in-phase or out-of-phase with the rotational motion of the shaker table. Insertion inside the vortex exhibited longer mixing times. The work indicated that the critical Fr (or N for constant do) at which transition between the two patterns occurs is affected by fluid viscosity and it is lower for increasing ν. This also implies that the critical wave amplitude Δh/di, decreases with increasing ν. The effect of fluid height in the reactor and orbital diameter were also examined. Future work to elucidate further the effect of viscosity for a greater range of ν values is required, but the present data have indicated that further optimization of mixing in shaken reactors may be achieved through a more thorough understanding of the processes involved in such systems. Furthermore, the results indicate that the use of baffles or vessel bottom shapes that may help mix better the fluid that is trapped in the toroidal vortex under certain flow conditions should also be investigated.
5. REFERENCES [1] H. Zhang, W. Williams-Dalson, E. Keshavarz-Moore, and P. A. Shamlou, 2005. “Computational-fluid-dynamics (CFD) analysis of mixing and gas–liquid mass transfer in shake flasks,” Biotechnol. Appl. Biochem., 41, 1–8. [2] H. M. Kim and J. P. Kizito, 2009. “Stirring free surface flows due to horizintal circulatory oscillation of a partially filled container,” Chem. Eng. Commun., 196, 1300–1321. [3] J. Büchs, U. Maier, C. Milbradt, and B. Zoels, 2000. “Power consumption in shaking flasks on rotary shaking machines: II. Nondimensional description of specific power consumption and flow regimes in unbaffled flasks at elevated liquid viscosity,” Biotechnol. Bioeng., 68, 594–601. [4] S. Tissot, M. Farhat, D. L. Hacker, T. Anderlei, M. Kühner, C. Comninellis, and F. Wurm, 2010. “Determination of a scale-up factor from mixing time studies in orbitally shaken bioreactors,” Biochem. Eng. J., 52, 181–186. [5] F. Cabaret, S. Bonnot, L. Fradette, and P. A. Tanguy, 2007. “Mixing time analysis using colorimetric methods and image processing,” Ind. Eng. Chem. Res., 46, 5032–5042. [6] L. A. Melton, C. W. Lipp, R. W. Spradling, and K. A. Paulson, 2002. “Dismt - Determination of mixing time through color changes,” Chem. Eng. Commun., 189, 322. [7] G. Delaplace, L. Bouvier, A. Moreau, R. Guérin, and J. C. Leuliet, 2004. “Determination of mixing time by colourimetric diagnosis - Application to a new mixing system,” Exp. Fluids, 36, 437–443. [8] W. Weheliye, M. Yianneskis and A. Ducci, 2012. “On the flow dynamics and out-of-phase phenomena in orbitally shaken bioreactors”, submitted to Proc. 14th Eur. Conf. on Mixing (Warsaw, 10-13 September). [9] A. Ducci and M. Yianneskis, 2007. “Vortex tracking and mixing enhancement in stirred processes”, AIChE J., 53, 305-315. [10] M. Micheletti, L. Nikiforaki, K. C. Lee, and M. Yianneskis, 2003. “Particle concentration and mixing characteristics of moderate-to-dense solid-liquid suspensions,” Ind. Eng. Chem. Res, 42, 6236–6249.
508