appraising cross-national income inequality databases: an
TRANSCRIPT

Forschungsinstitut zur Zukunft der ArbeitInstitute for the Study of Labor
DI
SC
US
SI
ON
P
AP
ER
S
ER
IE
S
Appraising Cross-National Income Inequality Databases:An Introduction
IZA DP No. 9468
October 2015
Francisco H. G. FerreiraNora LustigDaniel Teles

Appraising Cross-National Income Inequality Databases:
An Introduction
Francisco H. G. Ferreira World Bank and IZA
Nora Lustig Tulane University,
CGD and Inter-American Dialogue
Daniel Teles Tulane University
Discussion Paper No. 9468 October 2015
IZA
P.O. Box 7240 53072 Bonn
Germany
Phone: +49-228-3894-0 Fax: +49-228-3894-180
E-mail: [email protected]
Any opinions expressed here are those of the author(s) and not those of IZA. Research published in this series may include views on policy, but the institute itself takes no institutional policy positions. The IZA research network is committed to the IZA Guiding Principles of Research Integrity. The Institute for the Study of Labor (IZA) in Bonn is a local and virtual international research center and a place of communication between science, politics and business. IZA is an independent nonprofit organization supported by Deutsche Post Foundation. The center is associated with the University of Bonn and offers a stimulating research environment through its international network, workshops and conferences, data service, project support, research visits and doctoral program. IZA engages in (i) original and internationally competitive research in all fields of labor economics, (ii) development of policy concepts, and (iii) dissemination of research results and concepts to the interested public. IZA Discussion Papers often represent preliminary work and are circulated to encourage discussion. Citation of such a paper should account for its provisional character. A revised version may be available directly from the author.
IZA Discussion Paper No. 9468 October 2015
ABSTRACT
Appraising Cross-National Income Inequality Databases: An Introduction*
In response to a growing interest in comparing inequality levels and trends across countries, a number of cross-national inequality databases are now available. These databases differ considerably in purpose, coverage, data sources, inclusion and exclusion criteria, and quality of documentation. A special issue of the Journal of Economic Inequality, which this paper introduces, is devoted to an assessment of the merits and shortcomings of eight such databases. Five of these sets are microdata-based: CEPALSTAT, Income Distribution Database (IDD), LIS, PovcalNet, and Socio-Economic Database for Latin America and the Caribbean (SEDLAC). Two are based on secondary sources: “All the Ginis” (ATG) and the World Income Inequality Database (WIID); and one is generated entirely through multiple-imputation methods: the Standardized World Income Inequality Database (SWIID). Although there is much agreement across these databases, there is also a non-trivial share of country/year cells for which substantial discrepancies exist. In some cases, different databases would lead users to radically different conclusions about inequality dynamics in certain countries and periods. The methodological differences that lead to these discrepancies often appear to be driven by a fundamental trade-off between a wish for broader coverage on the one hand, and for greater comparability on the other. These differences across databases place considerable responsibility on both producers and users: on the former, to better document and explain their assumptions and procedures, and on the latter, to understand the data they are using, rather than merely taking them as true because available. JEL Classification: D31, I32 Keywords: inequality comparisons, inequality databases, international inequality Corresponding author: Francisco H. G. Ferreira World Bank 1818 H Street, NW Washington, DC 20433 USA E-mail: [email protected]
* For full disclosure we should note at the outset that Ferreira is a Senior Adviser at the World Bank’s Research Department (which hosts PovcalNet), and Lustig is the Director of the Commitment to Equity (CEQ) Institute, whose data is used in this review. The authors are grateful to both the reviewers and producers of the inequality databases for engaging in a frank and constructive dialogue about the strengths and weaknesses of those data sets. We would also like to thank Kathleen Beegle, François Bourguignon, Stephen Jenkins, Christoph Lakner and Tim Smeeding for comments on an earlier version of this introduction. All remaining errors are ours alone. The views expressed here are those of the authors, and should not be attributed to the World Bank, its Executive Directors, or the countries they represent.

2
A number of databases containing summary inequality statistics for multiple countries over many years are now publicly available. These cross-national inequality databases are being used by researchers, with increasing frequency, to document global or regional trends (e.g. Atkinson and Bourguignon, 2014; Atkinson, 2015; Bourguignon, 2015; and Piketty, 2014), as well as by scholars interested in including inequality measures in cross-country regression analyses, either as dependent or independent variables (e.g. Acemoglu et al., 2013; and Ostry et al., 2014).
Yet, these different databases are often designed for different purposes, and are constructed in very different ways. They can therefore yield conflicting pictures of inequality, both in levels and in trends. In some cases, one database will include a full annual series for a given country, while another database of purportedly similar coverage will only have two data points over two decades. For example, whereas one global database (the World Income Inequality Database, WIID) includes 350 inequality observations for sub-Saharan Africa between 1960 and 2006, of which only five are labeled as high quality, another database of similar scope (the Standardized World Income Inequality Database, SWIID) includes 934 observations for that same region, between 1960 and 2012, and treats all of them as comparable in quality terms (see Jenkins, this issue). Although inequality time-series for a given country are typically closely correlated across different databases, even this rather weak consistency criterion cannot be taken for granted. Indeed, as we will see below, the pairwise correlation for Gini coefficients across different databases was lower than 0.5 in 43 out of the 254 cases (or 17%) for which such comparisons are reported (Table 4). Examples of negative correlation coefficients could be found in all of the world’s regions.
It cannot therefore be true that each and every one of these databases is perfectly accurate. If significant discrepancies occur in one out of every six pairwise country comparisons across databases, users should carefully consider which database – if any – is most suitable for their particular purposes.1
In order to assist users in these considerations, the Journal of Economic Inequality has prepared a special issue entitled “Appraising Cross-National Income Inequality Databases”. The issue is devoted to an assessment of the merits and shortcomings of what we believe are the most frequently used databases. The aim is to expose these potentially valuable resources to critical scrutiny that identifies perils, pitfalls, strengths and weaknesses.
With this objective in mind, we invited a group of leading income distribution scholars to review eight datasets. The reviews are included in the five main articles that follow this Introduction. In all cases, the parties responsible for the production of each of the databases were offered the opportunity to comment on the reviews. Although most producers did send specific comments to authors, only three ultimately accepted the invitation to publish their comments in this issue.
1 This is not novel advice: Atkinson and Brandolini (2001) discuss the issues that arise from the use of secondary sources and the need to understand the differences in the underlying data and methods, in the context of the Deininger-Squire (1996) database, an important precursor of some of the compilations reviewed below.

3
In the first article, Stephen Jenkins (LSE) reviews the World Income Inequality Database (WIID), produced by UNU-WIDER; and the Standardized World Income Inequality Database (SWIID), produced by Frederick Solt, of the University of Iowa. Comments by Badgaiyan, Pirttilä and Tarp (WIID) and Solt (SWIID), as well as a short note by Martin Wittenberg (University of Cape Town) on South African data in the SWIID, follow. Martin Ravallion (Georgetown University) then reviews the Luxembourg Income Study (LIS), produced by the LIS Cross-National Data Center in Luxembourg. A comment by Gornick, Jäntti, Munzi and Kruten follows. François Bourguignon (Paris School of Economics) reviews two databases concerned exclusively with Latin America: CEPALSTAT, produced by the Economic Commission for Latin America and the Caribbean; and the Socio-Economic Database for Latin America and the Caribbean (SEDLAC), produced by the Center for Distributive, Labor and Social Studies (CEDLAS) at Universidad Nacional de La Plata, in partnership with the World Bank. Tim Smeeding and Jonathan Latner (University of Wisconsin – Madison) review the World Development Indicators/PovcalNet, produced by the World Bank; and All the Ginis (ATG), produced by Branko Milanovic of the City University of New York. Finally, Leonardo Gasparini and Leopoldo Tornarolli (Universidad Nacional de la Plata) review the OECD’s Income Distribution Database (IDD).
At the outset, reviewers were provided with a set of common guiding questions, as well as with a description of the databases and a master dataset with all the inequality indicators organized by country, data source and year. We asked authors to comment, in particular, on the accessibility and user-friendliness of the databases; the quality of the documentation; the reliability and accuracy of reported indicators; and the transparency and replicability of how data was calculated and presented.
During the course of preparation of this special issue, a number of the datasets have been updated. We have therefore made every effort to ensure that the reviews specifically note which versions they discuss or the date on which the data was accessed and we do the same in this introduction. Unless otherwise noted, the methodologies we describe and the statistics that we present are based on the versions of the datasets available online in November 2014. In some cases, the summary statistics included in this Introduction come from a more recent version of the dataset than the version that received a full review. Most notably, our discussion of WIID refers to WIID v3b which incorporates many of Jenkins’ (this issue) suggestions for improvement (Badgaiyan et al., this issue).
Although our review covered most of the existing international datasets, we make a special note of five that have not been included: Commitment to Equity (CEQ), the World Top Incomes Database (WTID), the Gini Project, the Global Consumption and Income Project (GCIP) and the University of Texas Income Project (UTIP). Although they are not reviewed in separate articles in this special issue, this should not be taken as a judgment on their quality or relevance, and we will occasionally refer to them below.
The remainder of this Introduction is organized as follows. Section 1 presents a brief description of the eight datasets, and classifies them into three broad groups. We summarize the main methodological differences between the datasets in Section 2. In Section 3, we briefly discuss the extent to which inequality levels and trends differ across datasets. We conclude with an overall assessment and some advice for users of these databases.

4
1. A Brief Description of the Databases This special issue includes reviews of eight databases of summary inequality statistics. All contain summary statistics that describe national-level estimates of inequality in incomes or consumption expenditures in multiple countries over multiple years. As we have already suggested, however, the databases are far from identical. They vary greatly in methodology – to which we will return in greater detail in the next section – as well as in geographical coverage, purpose, and ambition.
Two of the databases focus primarily on high-income countries (LIS and IDD), although both have been expanding to include some middle-income nations. Another two cover Latin America and the Caribbean exclusively (CEPALSTAT and SEDLAC), while four are global in scope (ATG, PovcalNet, SWIID, and WIID). ATG, and SWIID are produced privately by individual researchers, while all the other datasets are institutional projects. Among the latter, LIS and SEDLAC are produced by institutions whose primary purpose is the harmonization, storage and analysis of microdata originally generated by others, whereas the IDD, WDI/PovcalNet, CEPALSTAT, and WIID are produced by large organizations with broader mandates, which also happen to produce and host these databases (the OECD, the World Bank, the UN’s Economic Commission for Latin America and the Caribbean – ECLAC – and the United Nations University’s World Institute for Development Economics Research, UNU-WIDER, respectively).
For our purposes, however, the most important distinction among the eight databases concerns the source of the summary statistics they report. Some of the databases calculate inequality directly from microdata (i.e. the underlying household surveys or other unit-record datasets), while others are secondary compilations that amalgamate indicators from a variety of other sources. In one case, the inequality statistics reported in the database are actually imputed, on the basis of an algorithm that draws on underlying secondary data. In this Introduction, we therefore classify the datasets into three main groups: Group 1 includes datasets whose producers estimate the income inequality indicators they report directly from microdata. There are five such databases, namely CEPALSTAT, IDD, LIS, PovcalNet, and SEDLAC. Group 2 includes those that are secondary sources of inequality indicators: All the Ginis and WIID. Finally, Group 3 includes the database generated by imputation methods (based on secondary source indicators of inequality) and is comprised of just one dataset: SWIID. Let us briefly consider each of the three groups in turn.
Group 1: Microdata-based Datasets
Five of the eight databases reviewed in this special issue belong to this group: CEPALSTAT, IDD, LIS, PovcalNet, and SEDLAC. Table 1 displays their aggregated spatial coverage. The first two columns report the net and gross coverage by region of the world: net coverage indicates the number of country-year cells with at least one observation, whereas gross coverage is a simple count of observations from primary sources across all databases, without netting out country-year repetitions. Columns 3 and 4 indicate the earliest and most recent observations for each region. There is a clear
5
quantitative bias towards Latin America and the Caribbean, with 832 (gross) observations spanning 378 country/year cells. North America and Western Europe comes next, with 403 observations for 316 country/year cells. Eastern Europe and Central Asia is a close third, with 334 observations for 301 country/year cells. The number of observations for East Asia and the Pacific, South Asia, Middle East and North Africa, and sub-Saharan Africa is much smaller. The bias toward Latin American is driven, at least in part, by our choice of which databases to review in this issue. We hope, however, that our choices accurately reflect the use of inequality databases by practitioners. It is interesting to note that four of these five microdata-based datasets reported in Table 1 have a purposefully limited geographical scope: two focus exclusively on Latin America and the Caribbean (CEPALSTAT and SEDLAC), and another two (mainly) on advanced countries (LIS and IDD).2 Only one of the six microdata-based datasets is global in coverage: namely PovcalNet (which feeds into WDI). Conversely, of the five datasets with global coverage, the World Bank’s is the only one that generates inequality estimates directly from countries’ household (income and/or expenditure) surveys. In other words, of the eight datasets reviewed in this special issue, only the World Bank’s PovcalNet is global in scope and derives its summary statistics (primarily) from microdata: In December 2014, WDI/ PovcalNet reported Gini coefficients, Theil indices, and shares of income by decile for 161 countries. However, it is important to note that the reliance of PovcalNet on household survey microdata is sometimes indirect. Full microdata was contained in the PovcalNet database for 52 of the 126 developing countries in the 2014 release, while the distributions used for the other 74 countries were based on grouped data (at the decile, ventile and percentile levels), which was in turn obtained either from microdata available in other World Bank servers, or from national statistical offices. In the most recent update (2015) of PovcalNet, the distributions are based on full microdata for 126 of the 132 developing countries included. Grouped data is now used for only six developing countries, but these still include China. In addition, the inclusion of high-income countries in PovcalNet is both recent and incomplete. Finally, in a good example of the coverage-comparability trade-off, PovcalNet makes virtually no effort to harmonize data across countries: it contains estimates based on both income and consumption expenditure distributions and, within those categories, on income and consumption aggregates that are widely disparate. The World Development Indicators (WDI) is a large database of country-level statistics covering a wide variety of topics, from investment rates and road density to carbon emission levels. Poverty and inequality statistics are a relatively small subset of the WDI, and it is almost entirely derived from PovcalNet, a separate online tool focusing on these topics, and featuring additional capabilities that
2 As noted, LIS has recently expanded into middle-income countries, through the associated database Luxembourg Middle-Income Countries Study (LMICS).
6
are not present in WDI.3 It is only this sub-component of the WDI which is reviewed below (Smeeding and Latner, this issue).
In addition to differences in geographical coverage, the primary databases also differ in the manner of their construction, and even in their primary purpose. LIS’s primary objective, for example, is to provide researchers with access to harmonized microdata (the Luxembourg Income Study Database and Luxembourg Wealth Study Database) through their remote execution software, LISSY. In addition, LIS does regularly publish a set of Key Figures with inequality measures for post-tax and transfer income for (mainly) high-income countries. The Key Figures report measures such as the Gini Coefficient, Atkinson Coefficient and 90/10 ratio, calculated by LIS researchers using the harmonized microdata contained in the Luxembourg Income Study Database.4 Although for the purposes of this special issue, the focus is on LIS’s Key Figures (Ravallion, this issue), it should be clear that they are not the institution’s primary focus (Gornick et al., this issue)
The IDD, on the other hand, is a dataset created by the OECD from household surveys, tax registers and administrative records received from National Statistical Offices (NSOs), ministries or research institutes of OECD member countries. Calculations are based on a standardized questionnaire, which is designed by the OECD to achieve comparability across countries. The OECD does not actually calculate these summary statistics in-house: the database is comprised of indicators sent by country data providers, who compute them using their own micro-data. The two primary databases focused mainly on rich countries – LIS and IDD – are therefore very different in purpose, construction and nature.
CEPALSTAT and SEDLAC are both focused on Latin America and the Caribbean. CEPALSTAT is the statistical database of the United Nations Economic Commission for Latin America and the Caribbean. CEPALSTAT includes a wide range of data and a variety of economic, sociodemographic, and environmental measures for the region, including inequality and poverty estimates. SEDLAC provides statistics on poverty and inequality in Latin America and the Caribbean. It is compiled by a partnership between the Center for Distributional, Labor, and Social Studies at the Universidad Nacional of La Plata (CEDLAS - UNLP) and the World Bank’s Poverty Global Practice.5 In both cases, all statistics are computed directly from microdata.
Group 2: Secondary Source Datasets
Two of the nine databases are created from inequality measures estimated by other researchers. WIID is a dataset administered by UNU-WIDER that collects inequality estimates from a number of sources,
3 A salient feature of PovcalNet is its interactive software that allows users, for example, to generate poverty rates for any country, for any chosen poverty line. 4 The LIS Key Figures website provides the STATA and SPSS code used to calculate the summary statistics, so as to enable researchers to test the sensitivity of these statistics to various parameter choices regarding, for example, weights, equivalence scales, top coding, etc. 5 Through this partnership, SEDLAC is actually the source of data from Latin America and the Caribbean into PovcalNet / WDI.

7
including published research papers and primary databases, such as those discussed above. It is global in scope, and often reports multiple entries for the same country and year, sometimes with different welfare concepts (e.g. disposable income versus consumption) and sometimes from different sources. WIID was initially created in the late 1990s, for a specific research project conducted jointly by WIDER and UNDP. It built on, incorporated and expanded the original secondary-source inequality database, due to Deininger and Squire (1996). See Badgayan et al. (this issue). Branko Milanovic’s “All the Ginis” database also collects Ginis from a variety of sources, including primary databases and published research. Unlike WIID, however, it includes a series in which the “best’’ Gini coefficient is chosen for each country/year cell for which more than one figure is available. Group 3: Imputation-based Datasets The only member of this class, SWIID is a dataset of Gini Coefficients calculated using a multiple imputations method, from a group of both primary sources, such as SEDLAC and LIS, and secondary sources, such as “All the Ginis.” Imputation of missing country/year cells gives SWIID the largest coverage of any of the datasets included in the special issue. SWIID version 5.0 provides users with 100 imputed estimates of the Gini coefficient for net and market income inequality, for each country-year cell. The SWIID imputation procedure uses LIS definitions of income as the standard. SWIID net market income is post-tax, post-transfer, and benchmarked to LIS Key Figures. SWIID market income is pre-tax, pre-transfer, and benchmarked to an income inequality series generated from LIS microdata. Stata code on the SWIID website allows users to either calculate means, standard deviations and confidence intervals, or to use the 100 values produced by multiple imputations directly. Prior versions provided the users with the mean and standard error of the multiple imputations. Datasets Not Included in Special Issue As with most undertakings of this kind, our set of reviews is not exhaustive. Three sources of cross-national inequality statistics that are different in focus from those reviewed in this issue are nevertheless worth mentioning. The first is the Commitment to Equity Database (CEQ), a project of the Center for Inter-American Policy and Research and the Department of Economics at Tulane University, the Center for Global Development and the Inter-American Dialogue. The CEQ is unique because it is designed to analyze the impact of taxation and social spending on inequality and poverty in individual countries applying a common methodology.6 In that spirit, CEQ indicators include estimates of inequality before taxes or transfers; after direct taxes but before transfers or indirect taxes; after direct taxes and transfers and before indirect taxes and transfers; after direct and indirect taxes and transfers; and after all taxes and transfers and after receipt of government services. Although the goal of CEQ is to produce estimates of fiscal redistribution over time, thus far the CEQ database
6 The CEQ is directed by Nora Lustig. For more information on the project, visit http://www.commitmentoequity.org.

8
includes estimates for one particular (similar) year. This focus makes the CEQ sufficiently distinct from the other datasets reviewed here so as to warrant exclusion. Nevertheless, in what follows we will compare its in-country estimates of various pre- and post-fisc inequality measures to analogous estimates obtained through multiple-imputation methods in SWIID. Second is the World Top Incomes Database (WTID) produced by Facundo Alvaredo, Anthony Atkinson, Thomas Piketty and Emmanuel Saez. Unlike the other datasets, WTID uses information from tax returns (mainly) to estimate the share of income earned by certain groups at the top of the distribution, such as the richest 1% of the population. It does not always include holistic inequality metrics such as the Gini coefficient. However, a number of such measures, including the Gini coefficient, were produced by researchers working on the individual country studies that fed into WTID. Jäntti, Riihelä, Sullström, and Tuomala, for example, produce a Gini series for Finland, along with a series of top income shares (Atkinson and Piketty, 2010). Third, while all of the datasets reviewed in this issue compile measures of inequality for household income or consumption (whether per capita or equivalized), the University of Texas Inequality Project (UTIP) is focused directly on individual earnings inequality. The project computes inequality statistics, chiefly Theil’s T statistic, from industrial, regional, and sectoral data. It is a rich, interesting and frequently used dataset, but its focus on earnings also makes it substantially different from the other databases reviewed here. We also note the recent development of two new sources of cross-national inequality indicators. The GINI project produced 94 discussion papers and 26 country reports on the drivers and impacts of inequality, along with a new 30-country dataset (see GINI Growing Inequalities' Impacts, 2015). This secondary-source dataset focuses on disposable income inequality (and relative poverty) for use in within-country analysis and analysis that compares trends, but not levels, between countries. The primary sources were chosen by country experts to maximize coverage and comparability within countries and include the European Union’s Survey of Incomes and Living Conditions (EU-SILC), LIS, the output of National Statistical Offices, and selected publications by Thompson and Smeeding, Atkinson and Micklewright, Milanovic, and Transmonee. The dataset was released in 2014 and has not yet been widely used beyond GINI Project discussion papers. The Global Consumption and Income Project (GCIP) was introduced in 2014, although its dataset is not yet publicly available.7 GCIP uses secondary sources to estimate monthly real consumption and income levels and shares by decile. Like the SWIID, GCIP imputes indicators for years in which survey data is unavailable (although the methodologies are different). However, unlike the secondary source and imputation-based datasets reviewed in this issue, GCIP is not concerned only with the distribution of income (and consumption), but also with levels (Lahouti et al., 2014).
7As of August, 2015 GCIP data was unavailable, but presentation and summary statistics were available online. (www.globalconsumptionandincomeproject.org )

9
2. Differences in Metrics and Methodology
To compare the metrics and methodologies of the databases reviewed in this special issue, we summarize some of their main features in Table 2. Panel A of Table 2 refers to the Group 1 datasets, and reports on which inequality measures are included; on the nature of the individual welfare indicator for which inequality is calculated; and on whether various adjustments are made to the microdata. Panels B and C refer to the three databases in Groups 2 and 3, and include additional information on, inter alia, the documentation of primary sources; on how multiple sources of information for the same country/year combination are treated during compilation; and on whether other secondary sources are also used as inputs, in addition to primary sources.
In terms of the choice of summary inequality measure, the Gini coefficient is the most common metric used to describe inequality but it is certainly not the only option. A good overview of inequality metrics can be found in Jenkins and Van Kerm (2009). CEPALSTAT, LIS, and SEDLAC all report the Gini Coefficient, the Theil Index, the Atkinson Index, and other statistics about income shares or decile ratios. WDI/PovcalNet reports both the Gini coefficient and income shares.
Summary inequality indicators are almost invariably computed from samples, rather than full populations, and are therefore subject to sampling error. It is good practice to report standard errors or confidence intervals for each estimate, as done by SEDLAC and sometimes by the IDD. CEPALSTAT and LIS’s Key Figures do not report them.
Arguably more fundamental is the choice of the individual welfare concept, for the distribution of which inequality is measured. CEPAL, IDD, LIS, and SEDLAC all focus on current income. WDI/ PovcalNet uses both income and consumption welfare concepts, depending on the country, and the secondary sources aggregate statistics regardless of welfare concept. WIID simply notes the welfare concept for each of its Gini Coefficients. ATG prioritizes measures of income inequality and SWIID’s reported Gini Coefficients are estimates of income inequality. However, it is unclear whether these choices were made because of a preference for income as a welfare concept or because of the preponderance of primary sources that use income as their welfare concept.
The prevalence of current income as the individual welfare indicator of choice is, to a large extent, a result of the fact that inequality indicators are disproportionately available in Europe and the Americas, where statistical agencies have typically preferred income to consumption as a measure of individual well-being. Conversely, in most of Asia and Africa, researchers tend to prefer measures of consumption expenditure to assess well-being. Arguably, these historical practices reflect sound judgment: In industrialized economies where most people earn wages from one or two sources, and where savings can be nontrivial, incomes may be both easier to collect accurately and more informative of total purchasing power. In predominantly agrarian economies, where an accurate computation of income would require complex valuations of many different types of output and the netting out of farm inputs, many have argued that income statistics are misleading. In addition, consumption expenditures may be argued to better approximate permanent incomes (at least for the bulk of the

10
population, for whom bequests are rare). Nevertheless, the issue is far from settled, as the debate between Ravallion and Gornick et al. in the pages that follow illustrates.
Of course, whether income or consumption is used, there are a number of additional important decisions an analyst must make before an inequality index can be computed. Should the chosen welfare concept (say, income) be measured on a per capita basis or per equivalent adult? If an equivalence scale is used, which one should be preferred? If an income concept is used, is it an estimate of monetary income only, or does it include auto-consumption and imputed rent – to name just two? Are adjustments made to the microdata to correct for underreporting, to eliminate outliers, or to address missing responses? Panel A of Table 2 summarizes the answers to some of these questions for the microdata-based datasets.
Group 1: Microdata-based Datasets
Database producers and compilers do not make these decisions in a vacuum. Researchers have been working to develop common standards for the measurement of individual income and welfare since at least the 1970s (United Nations, 1977). Today the most widely used standard is the Canberra Group Handbook on Household Income Statistics (United Nations Commission for Europe, 2011). The Canberra Group Handbook standardizes definitions of income components and aggregates, and provides best practices for measurement, quality assurance, dissemination, and analysis. The first iteration of the Canberra Group convened from December 1996 to May 2001 and included representatives of LIS, OECD, ECLAC, the World Bank and a large number of national statistics bureaus. This series of meetings led to the production of the first edition of the Handbook in 2001. The 2011 Handbook update was authored by a ‘Task Force’ that included representatives of both OECD and LIS. The OECD Framework for Statistics on the Distribution of Household Income, Consumption and Wealth (2013) expands upon this work to include standards for measuring the distributions of consumption and wealth.
Indeed the OECD’s IDD explicitly standardizes its income definitions to that of the Canberra Handbook. CEPALSTAT, SEDLAC, and LIS also appear to be influenced by this standardization effort (CEPALSTAT and LIS provide links to the Canberra Handbook on their websites), although they are less explicit about the extent to which they adhere to the guidelines. Differences arise, however, because the underlying surveys differ by country and year, and the microdata itself is imperfect. The result is that, in pursuing standardization, most dataset providers must inevitably make some choices between (internal) accuracy and (cross-country) comparability.
Table 2 also compares adjustment and harmonization procedures. These include the treatment of potentially under-reported income; imputation of rents saved by homeowners; treatment of top-coding in survey data; the treatment of autoconsumption; categorizing taxes and transfers; the treatment of domestic servants and lodgers; the choice between monthly or annual estimates; and adjustments made for inflation. CEPALSTAT, SEDLAC, and LIS use a constant methodology across all countries and years, working directly with the microdata. The IDD and WDI/ PovcalNet on the other hand, adapt the choices to the microdata that are available.

11
For those datasets built directly from the microdata, we note another dimension on which they can be examined. The efforts, either ex-post or ex-ante, to create harmonized microdata can be categorized as those for whom harmonization is the primary concern, and those for whom harmonization is only part of the process of developing comparable indicators. For LIS and SEDLAC, the creation of standardized microdata is the priority, and the ability to construct comparable indicators is merely a consequence. In the cases of CEPALSTAT and WDI/ PovcalNet, on the other hand, the microdata is standardized only insofar as is necessary to create comparable indicators.
The datasets that vary their methodology by country, do so for very different reasons. For PovcalNet, broad coverage is a necessity, arising from the World Bank’s global mandate. Indicators from PovcalNet are classified as being derived from four categories of data: grouped consumption, grouped income, unit-record income, and unit record consumption. When unit level data is available, the World Bank carries out some minimal standardization of the microdata.8 However, in an effort to expand coverage, they also calculate indicators from less-standardized grouped data. As a result, users have the choice between a smaller dataset derived from standardized microdata that is more comparable, and a less standardized dataset with broader coverage. This trade-off between comparability and coverage is a central feature of the exercise of compiling cross-national inequality databases, and we return to it below.
The statistics in CEPALSTAT and IDD are officially endorsed by the national statistical offices. Additionally, the choice to leave more responsibility with the national statistical offices implies that more work is being done by the people who are most familiar with the underlying data. The OECD’s methodological choices prioritize these two gains at the expense of greater standardization at the microdata level.
Group 2: Secondary Source Datasets
Generally, the same set of questions (as in Panel A of Table 2) cannot be asked directly of secondary-source databases. Instead, Panel B reports on questions about the criteria and procedures used to select (and rate or rank) their inputs, and whether sufficient documentation is provided for those questions to be answered with respect to the original, primary sources.
Secondary source datasets are of two types: (1) aggregation and categorization, as in WIID and (2) choice by precedence, as in AlltheGinis. In both cases, the database producers need to assess the quality and comparability of their sources. After this assessment, however, WIID’s approach is to provide this information to users with a set of variables categorizing the inequality statistics by income concept, equivalence scale, and quality. The onus is then on the users to determine which of the many data points provided should be used in their research. AlltheGinis, on the other hand, makes this decision for you, providing the users with the best available estimate of inequality in a given country and year. Milanovic uses the term “choice by precedence” to indicate that the GiniAll variable is chosen
8 But standardization of household survey data at the World Bank is carried out separately for each macro-region of the world (e.g. sub-Saharan Africa, South Asia, Latin America, etc.), and procedures differ substantially among them.

12
according to his ranking of source reliability. Fortunately, both datasets do publish the criteria through which classifications and, in the case of AlltheGinis, choices of precedence, are made.
Group 3: Imputation-based Datasets
When inequality statistics are imputed into country-year cells, our focus should be on understanding both the imputation methodology and the inputs that are used to generate the imputed values. Both will determine what type of inequality (income or consumption; household or individual; per capita or equivalized) is really being presented, and how reliable the estimates are likely to be. Panel C of Table 2 reports on some such questions for SWIID, the only imputation-based dataset under review in this special issue.
In its use of imputation to construct full annual series of inequality statistics, SWIID differs greatly from any of the other databases reviewed in this issue. We describe the series as full because an inequality measure is presented for every single year in a given interval, regardless of whether a survey, census or any other data collection exercise actually took place in that country in that particular year. One can immediately appreciate both how such series would appeal to macroeconomists running panel cross-country regressions, and how they might worry micro-economists specializing on the accurate measurement of poverty and inequality. For each country-year cell, SWIID reports annual gross and net income inequality, measured by the Gini coefficient.
The imputation procedure involves estimating ratios of Gini coefficients – sometimes across countries, and sometimes between one welfare concept (e.g. net income) and another (e.g. gross income) – incorporating all the information available to determine both an inequality estimate and a standard error in each case. Multiple imputation methods (following Rubin, 1987 and 1996) are used, which essentially rely on assuming that ratios between different inequality measures are constant, or stable, and can therefore be used to predict those variables when they are not observed. Solt (2009) describes this method in some detail, and Jenkins (this issue) reviews it. A key issue, to which we shall return, is the tension between two “competing demands” (Jenkins) faced by any such exercise. These are (i) that information be pooled from a sufficiently large group of actual observations (data inputs into the imputation), so that the Gini ratios are robustly estimated; and (ii) that information determining each particular Gini ratio be drawn only from the most comparable set of observations possible, so as to avoid polluting the prediction with ratios from extraneous countries or periods, which actually bear little resemblance to the true object being estimated. Even if all observations in a data set are used, the same tension can be rephrased in terms of the weights assigned to each observation.
At some level, these competing demands are inherent to any imputation exercise: essentially inferring ‘data’ where none is actually available, on the basis of observed relationships between other data that are actually observed. On the one hand, since the relationships (e.g. between gross and net income inequality) vary over space and time (e.g. between Europe and Africa; or between the 1970s and the 1990s in North America), constancy relationships should ideally be drawn from as close to the empty cell to be filled as possible. On the other hand, estimating relationships from very small neighborhoods

13
may be either too imprecise or downright impossible, where data is particularly scarce. As with other imputation methods, therefore, the one used by SWIID is likely to be at its most reliable precisely where it is least needed – i.e. in filling in occasional gaps in otherwise data-rich environments, such as North America, Europe and Latin America in more recent decades. Conversely, it is likely to be least reliable where actual data is most scarce, and hence constancy assumptions have to be made for countries, periods and concepts where stability is least defensible.
Both secondary-source and imputation-based datasets embody not only their own assumptions but also those of the primary sources they use as inputs. Interestingly, while the methodological frameworks for WIID, All the Ginis, and SWIID are different from one another, they rely on much of the same primary source data. Table 3 shows the overlapping nature of the sources of the secondary datasets. Inequality indicators from LIS Key Figures, SEDLAC, and the World Development Indicators are inputs to all three databases. WIID and All the Ginis additionally include data from Deininger and Squire (1996), and a number of other inequality studies. ATG then absorbs all WIID data. Finally, SWIID uses both WIID and ATG.
How a secondary-source dataset accounts for, prevents, or documents double-counting is a concern. From the publicly provided documentation alone, we were unable to determine how either ATG or SWIID address this issue. If one were to look only at ATG’s choice by precedence series, Gini All, this would not be an issue. But for a researcher looking at all of the data in ATG, it is unclear whether the observations attributed to WIID are based on statistics already previously included in the database. Similarly, a researcher would need to compare SWIID’s replication files to those obtained from the original source (or, as we did, contact the author directly) to determine that observations are removed to prevent double counting.
An alternative taxonomy
Our three-group classification, based on the source of the inequality statistics, is clearly not the only way in which these eight databases could be classified. Atkinson et al. (2010) discuss a hierarchy of methodologies employed in the standardization of income inequality data sets. “In short,” they write, “we have a ‘hierarchy’ of degrees of standardization: 1. Common survey instrument (European Community Household Panel, ECHP); 2. Ex-ante harmonized framework (EU-SILC); 3. Ex-post standardized microdata (LIS); 4. Ex-post customized results (OECD); 5. Meta-analyses of results (Kuznets)” (p. 103).
While this hierarchy places higher levels of standardization at the top, the authors note that a common survey instrument does not necessarily imply the best results. Rather, different sources of data may be better suited for some purposes, and worse for others – as in the aforementioned discussion of consumption data collected in a poor developing country, vis-à-vis income data in a rich country. It is unlikely that a questionnaire aimed at collecting the best possible information to accurately assess living standards in Malawi would look much like one designed with the same objective, but for Switzerland. One can also think of Atkinson et al.’s hierarchy as a spectrum ranging from a methodology that is internally consistent by construction, but for which broad coverage is difficult, to

14
an approach that is designed for broad coverage but for which internal inconsistencies are, in practice, inevitable. The tension reflects the trade-off between coverage and comparability to which we have already alluded.
The eight datasets reviewed in this special issue do not include any that could be classified in Atkinson et al.’s first two categories. All of the datasets reviewed in this special issue involve some level of ex-post standardization. LIS, CEPALSTAT and SEDLAC would belong to Atkinson et al.’s category 3 (ex post standardized microdata). Category 4 (ex-post customized results) would include IDD, and WDI/ PovcalNet. Category 5 (meta-analyses of results) include WIID, SWIID, and AlltheGinis.
3. How do the Estimates Differ across Datasets?
The various methodological differences among databases discussed above are only of interest to the extent that they yield different results. Our inspection of estimates of inequality levels and trends across the databases suggests that, in general, assessments of long-term trends tend be similar across databases for most countries. Nevertheless, we have found a number of instances in which different sources would lead to different conclusions, as discussed below.
Table 4 displays within-country correlation coefficients between Gini indices reported by the datasets with the most similar geographic coverage. While the correlation coefficient is a crude instrument with which to compare datasets, it provides a minimum consistency requirement, since datasets that show similar trends in inequality should be highly correlated. Panel A presents results for Eastern Europe, Africa, Asia and the Pacific, whereas Panel B concerns Western Europe and the Americas. Overall, correlation coefficients across databases are fairly high. Eighty-three percent of the pairwise correlations are above an (arbitrary) threshold of 0.5. This result of course implies that 17% – or approximately one in six – of these pairwise correlations are lower than 0.5. As noted above, there are also negative correlations coefficients in every region of the world, and between most pairs of databases.
Among the primary-source datasets, SEDLAC and CEPALSTAT have the greatest overlap in coverage. Both report Gini coefficients calculated directly from household survey microdata for Latin America and the Caribbean. Bourguignon (this issue) reviews both databases, with the noticeable takeaway that CEPALSTAT’s “more interventionist” methodology – correcting for underreporting and imputing missing data – leads to higher estimates of inequality.9 Figure 1 graphs the evolution of this discrepancy over time. From 1990 to 2010, CEPALSTAT has estimated Gini Coefficients that have been, on average, 1.6 Gini points higher than SEDLAC – a nontrivial difference. In the case of the Dominic Republic, the discrepancy is greater than 8 Gini points in 2009, 2010, and 2011.
9 CEPALSTAT is in the process of revising its methods for constructing the household income aggregates and it might stop doing the adjustments for underreporting (based on the comparison with National Accounts) altogether.

15
Despite this gap in levels, the second panel of Table 4 shows that inequality estimates from SEDLAC and CEPALSTAT are quite closely correlated when we examine within-country trends (the correlation coefficients range from 0.59 to 0.99). The average correlation between SEDLAC and CEPALSTAT across all country and year combinations is 0.86. Correlation coefficients for Latin American countries across other databases (e.g. ATG and SWIID, or WDI and SWIID) are typically lower. Nevertheless, when zooming in on a particular country and a small timeframe, there can be important differences even between CEPALSTAT and SEDLAC. For example, CEPALSTAT data shows an increase inequality in Panama from 2008 to 2011, while SEDLAC’s metrics show a decline over the same period.
LIS and IDD also have a substantial overlap in coverage, with 78 common country-year combinations. The databases produce very similar results in both levels and trends. There is never a case of the Gini coefficient diverging more than 0.04 and the average discrepancy is only 0.001. Panel B of Table 4 shows that these datasets are also highly correlated at the country level (0.630 to 0.997). Looking at the individual data, both datasets show a jump in inequality in Italy in the early 1990s, and fairly steadily increasing inequality in Germany, Israel, and the United States. Interestingly, the correlations for the same set of (Western European and North American –WENA) countries is much lower for other pairs of datasets, notably ATG and SWIID. Between these two datasets, there are four negative correlation coefficients for WENA countries, in contrast to LIS and IDD, and despite the fact that LIS is an input into both!
The picture is even less reassuring among developing countries outside Latin America. The original motivation for this special issue was the case of Sub-Saharan Africa, and its inequality dynamics over the 1990s and 2000s. Figure A1.1 in the IMF Fiscal Monitor (October 2012, p.51) displays inequality estimates for a number of countries in two periods: 1985–1995 and 2000–2010. This comparison suggested that inequality had fallen in most countries (11 out of 16) in their Sub-Saharan African sample between those two periods. Table 5 displays the change in Gini coefficient in the IMF report (in column 1) for eight of those countries, and compares it to data from PovcalNet and SWIID version 5.0.10 Of course, multiple comparisons are possible. For PovcalNet and SWIID, we compare inequality across these time periods in three ways: First by comparing the Gini in the first available year after 1985 with the Gini in the first available year after 2000; then by comparing the Gini in the last available year prior to 1995 with the Gini for the last available year prior to 2010; and finally by comparing the average Gini coefficient in each time period. As table 5 suggests, not only the levels but, more importantly, also the direction of the change is sensitive to both the choice of dataset and the starting and end points used for the comparison. The case of Madagascar is illustrative: whereas the IMF Fiscal Monitor reported a 1% decline in inequality, a comparison of average inequality in the two periods suggests a 0.2% increase (in PovcalNet) or a 4.8% increase (in SWIID). The number of negative entries in column 1 (six instances of decline for the eight countries) is higher than for any of the other possible comparisons from PovcalNet and SWIID, reported in columns 2 to 7.
10 Those eight are the countries for which we have comparable data in PovcalNet.

16
In Figure 2 we highlight the inequality estimates for Kenya. Jenkins (this issue) also highlights Kenya to compare WIID and SWIID, and to discuss the variability in the range of SWIID’s imputed values. Here, we focus on differences in trends. WDI, ATG, and WIID all agree that there was a sharp decline in inequality between 1992 and 1994. The magnitude of the decline (of about 15 Gini points), however, points to another problem facing students of inequality in Africa. A decline of inequality of that magnitude in a two-year period is highly unlikely, certainly in the absence of war, revolution, or a major disaster. More likely than not, it reflects methodological differences in the primary data collection on the ground in Kenya between two surveys. Beegle et al. (2015) discuss the severity of comparability problems between different household surveys over time in a number of African countries. While these problems due to differences in primary data collection lie beyond the scope of this special issue, they obviously carry through to the compilations we review here (as an illustration of the old adage: garbage in, garbage out). Sadly, they suggest that even where there is agreement between multiple cross-national databases, one cannot be entirely confident that one is on safe ground. While SWIID smooths this decline, the overall trend is similar.
After 1992 the trajectory is far less clear. Based on the World Development Indicators and All the Ginis, inequality rose steadily between 1994 and 2005. In both cases, however, there is no data for the years in between 1997 and 2005. SWIID estimates suggest that inequality fell over that period while WIID includes data from the Society for International Development that estimates inequality increased sharply by 1999. For a researcher studying inequality trends in Kenya in the 1990s and 2000s, this would be of great concern. If she began her analysis in 1992, every dataset would show a decline in inequality. If, however, she chose to begin the analysis in 1994, WDI would show increasing inequality, ATG would show an increase followed by a sharp decline, and SWIID would show a steady decline. In sum, inequality trends in Kenya – and a number of other countries – appear to be very sensitive to the dataset selected.11
Moving now to Asia, Figure 3 displays the Gini coefficients reported by WDI, ATG, SWIID, and WIID for Indonesia.12 All four datasets show inequality rising between 1993 and 1996, falling between 1996 and 1999, and then rising again. The extent to which inequality spiked in 1996, however, varies from a 20 percent increase in the Gini in the case of ATG, to only a 5 percent increase in the Gini in SWIID. The datasets can differ even in the direction in which inequality changed. A researcher using WIID or SWIID would come to the conclusion that inequality in Indonesia increased between 2005 and 2010, while someone using ATG would conclude that inequality fell.
Let us return to the Caribbean for a moment, to illustrate the consequences of a methodological choice by secondary source databases, namely whether or not to choose certain sources of input by precedence. Consider the erratic inequality time series for Jamaica, pictured in Figure 4. SWIID shows a fairly smooth decline in inequality from 1980 through to 1993, followed by a sharp increase in inequality over the next three years. The numbers for ATG, on the other hand, oscillate sharply
11 For an additional example, see Wittenberg (this issue). 12 The value for WIID is average of Gini Coefficients for that year, if more than one is included in the database.

17
between 1989 and 1999. Upon closer examination, the reason for this appears to be that SEDLAC – to which ATG gives precedence as a source – produced higher inequality estimates than the other sources, but published estimates for only 1990, 1996, and 1999. Jamaica is therefore an extreme example of the volatility introduced to data series created with ATG’s Choice by Precedence method. Note, however, that this sort of short-term jump (or fall) in inequality is not unique to ATG. WDI also sees a short term-jump caused by a single year outlier in 2001.
Of even greater concern may be the inability for these databases to tell a consistent story even about medium-term trends in Jamaica. The WDI data tells a story of declining inequality in the early 1990s followed by increasing inequality for the remainder of the decade. Data from WIID suggest almost exactly the opposite!
Finally, in Figure 5 we compare SWIID’s Gini coefficients for imputed market and net incomes with those obtained from CEQ, for a set of fourteen developing countries. Specifically, the figure shows the difference between the Gini for disposable (or net) incomes and the Gini for market incomes (for the same survey and country), as estimated both by CEQ and SWIID. Recall that CEQ calculates the impact of fiscal policy on inequality through a detailed fiscal incidence analysis, validated by local experts and a series of robustness checks.13 One worrisome aspect of the comparison is that the discrepancies between CEQ and SWIID are not systematic: i.e., sometimes SWIID’s estimate of the redistributive impact is higher and sometimes lower than CEQ’s. In some cases, the discrepancies are quite large (e.g. Guatemala, and Indonesia). In one extreme case, Armenia, the redistributive effect is negative in SWIID (i.e., net income inequality is higher than market income inequality) while positive (as expected) in CEQ. Such significant discrepancies suggest that caution may be needed when interpreting the results of cross-country regression analysis based on the SWIID imputation-based data, such as Acemoglu et al. (2013) and Ostry et al. (2014).
4. Concluding Remarks
Scholarly research and public debate on inequality are on the rise. Naturally, so is the demand for comparable cross-country inequality databases. The eight databases reviewed in the five articles that follow this Introduction contribute to meeting this growing demand. Some are older and well-established, others have arisen much more recently; but all are potentially useful public resources, and should in principle be welcomed. Their producers expend considerable time and resources assembling what are essentially public goods, and we owe them a debt of gratitude.
That said, the increasing number of such databases and the fact – documented in this Introduction – that they yield different results, both in levels and in trends, for a significant number of countries, suggest that it may be time to take a closer look at the objectives, inputs and procedures that shape 13 For details on the methodology see Lustig and Higgins (2013) available in http://www.commitmentoequity.org.

18
these databases. The five articles that follow do just that for eight of the most frequently used cross-national databases. As readers will notice, each dataset is its own special case, and has its own unique strengths and weaknesses. In closing this Introduction, we simply summarize six key messages, which we take away from our reading of the special issue, and from our own comparative analysis of the databases.
First, cross-national inequality databases are only as good as the underlying microdata sources on which they draw. One fundamental reason why the discrepancies between the summary statistics contained in LIS and IDD are considerably smaller than those between other databases lies in the decades of experience and considerable resources expended by National Statistical Offices in Europe and North America to improve both the accuracy and frequency of their primary data collection efforts. Conversely, the reason for considerable uncertainty about inequality trends and, occasionally, levels in sub-Saharan Africa lie in the much patchier history of primary data collection in most countries in that region. Consequently, attention to cross-national compilations must not detract from a persistent focus on more and better data collection in country - and on strengthening the national institutions in charge of that collection.
Second, the world is a diverse place, and there is an inevitable trade-off between the coverage and comparability of inequality databases. When a database is focused on a narrower subset of countries that are relatively similar in terms of their economic structure and their household survey design, harmonization efforts require less draconian impositions of internal accuracy and consistency. It is no surprise, ex post, that the only two pairwise database comparisons in Table 4 that did not return country-level correlation coefficients below 0.5 were between IDD and LIS, and between CEPALSTAT and SEDLAC. One consequence for users is that, ceteris paribus, they should choose the database with the narrowest geographical coverage consistent with their research question.
Even when using datasets with the narrowest geographical coverage, the user may prefer to rely on those which make the least number of undocumented adjustments. For example, between CEPALSTAT and SEDLAC, the user may prefer to use SEDLAC until CEPALSTAT carefully documents how the adjustment for underreporting each income component is done for each country (that is, report each adjustment coefficient) which, at the moment of writing, it did not.14
Third, secondary-source databases are subject to the same caveats and comparability concerns as microdata-based sources, plus some more. Examples of additional concerns affecting secondary-source databases include concerns about double-counting entries from different primary sources, as well as different decisions made by primary sources with respect to the choice of income concept, equivalization, treatment of outliers, etc. So, where there is a choice, we would recommend microdata-based compilations over secondary-source databases.
Fourth, imputation comes with both promises and pitfalls. Analysts of income distributions are no strangers to imputation practices. Missing items in consumption or income questionnaires are often 14 CEPALSTAT is in the process of modifying its methods of calculating inequality indicators and it might stop doing the adjustments for underreporting altogether.

19
imputed, rather than being treated as zeros. Occasionally total incomes for missing observations in household surveys are imputed in their entirety, so as to preserve statistical representativeness, as in the common practice of hot-decking. Rents not paid by home-owners are often imputed.
What is new about SWIID is the wholesale use of multiple imputation to populate country-year cells where no actual primary data collection took place at all, with values obtained from stability assumptions applied to other years for the same country, or even other (hopefully similar) countries. While this practice has obvious (apparent) benefits in terms of expanding coverage, there are serious questions as to the reliability of SWIID’s imputed estimates, in particular in data-poor regions (as indicated by Jenkins and Wittenberg in this issue). These concerns naturally extend to any downstream regression analysis based on these estimates.15 In general, the tension between the competing requirements for a sufficient number of data inputs, versus a sufficient similarity of said inputs, is more likely to be manageable in data-rich environments, such as Western Europe and the Americas. It is likely to be extremely binding, on the other hand, precisely in the data-poor environments where its benefits would have been greatest. On this basis, we endorse Jenkins’s recommendation of WIID over SWIID, when no microdata-based dataset provides sufficient coverage.
Fifth, it is clear from both the brief discussion in this Introduction and from the five articles that follow, that use of these databases places a considerable burden of responsibility on the user. The fact that the databases are readily downloadable does not excuse researchers from the need to acquire a sound understanding of the assumptions and methodological choices embodied in the data they are about to use. In some cases, we suspect, such an understanding may well result in a rethink of the research strategy.
Finally, this review also implies that database producers bear an important responsibility in documenting all their assumptions clearly and thoroughly, and making as much of their data, programs and results available to allow for replicability (whenever it applies).16 Both scholarly research and policy debate need to be based on the best evidence available. Until the micro datasets, programs, assumptions, and all the documentation become publicly available, it will be hard for users to be completely reassured that the reported inequality indicators obtained through a middle-man (i.e., the international dataset producers) are truly reliable. Furthermore, dataset producers would be wise to compare their methods and results with one another and, eventually, perhaps even agree on conventions of best-practice in the calculation of inequality indicators both from primary, secondary or imputed sources.
15 Authors who insist on using SWIID inequality estimates in regression analysis should, at a minimum, treat them as a variable measured with error, and adjust estimation methods accordingly. Where such corrections rely on consistent estimators that may still be biased in small samples, this should evidently be noted. 16 Similar recommendations likely apply to many national statistical agencies as well, although that issue lies beyond the scope of this paper.

20
References
Acemoglu, D., Naidu, S., Restrepo, P., & Robinson, J. A.: Democracy, redistribution and inequality, In: Atkinson, A.B., Bourguignon, F. (eds.) Handbook of Income Distribution, vol 2B. Chapter 21, pp. 1885–1966. Elsevier, North-Holland, Amsterdam (2014)
Afkar, R., Jellema, J., Wai-Poi, M.: Fiscal Policy, Redistribution, and Inequality in Indonesia. In: Inchauste, G. and Lustig, N., (eds): The Distributional Impact of Fiscal Policy: Experience from Developing Countries, World Bank, Washington DC (forthcoming)
All the Ginis Dataset. The World Bank http://econ.worldbank.org/WBSITE/EXTERNAL/EXTDEC/EXTRESEARCH/0,,contentMDK:22301380~pagePK:64214825~piPK:64214943~theSitePK:469382,00.html. Cited July 22, 2014 (2013)
Alvaredo, F., Atkinson, A.B., Piketty, T., Saez, E.: The World Top Incomes Database, http://topincomes.g-mond.parisschoolofeconomics.eu/ Cited July 25, 2013 (2013)
Atkinson, A. B.: Inequality: What Can Be Done? Harvard University Press, Cambridge, MA (2015)
Atkinson, A. B., Bourguignon, F.: Handbook of Income Distribution, vols. 2A-2B. Elsevier, North-Holland, Amsterdam (2014)
Atkinson, A. B., Marlier, E., Montaigne, F., Reinstadler, A.: Income poverty and income inequality. In: Atkinson, A.B.; Marlier, E. (eds.): Income and Living Conditions in Europe, pp. 101–131, Eurostat, Publications Office of the EU, Luxembourg (2010)
Atkinson, A. B., Piketty, T.: Top incomes: A global perspective. Oxford University Press, Oxford (2010)
Badgaiyan, N., Pirttila, J., Tarp, F.: Response to Professor Stephen Jenkins’ comments on the World Income Inequality Database (WIID). Journal of Economic Inequality, this issue (2015)
Beneke, M., Lustig, N., Oliva., J. A.: El impacto de los impuestos y el gasto social en la desigualdady la pobreza en El Salvador, CEQ Working Paper 26, Tulane University (2015)
Bourguignon, F.: Appraising income inequality databases in Latin America. Journal of Economic Inequality, this issue (2015)
Bourguignon, F.: The globalization of inequality. Princeton University Press, Princeton (2015)
Bucheli, M., Lustig, N., Rossi, M., Amábile, F.: Social Spending, Taxes and Income Redistribution in Uruguay. In: Lustig, N., Pessino, C., Scott, J. (eds.) The Redistributive Impact of Taxes and Social Spending in Latin America. Special Issue. Public Finance Review, 42(3), 413–33, (2014)

21
Cabrera, M., Lustig, N., Morán, H. E.: Fiscal Policy, Inequality, and the Ethnic Divide in Guatemala. World Development, 76(C), 263–279 (2015)
CEPALSTAT: About CEPALSTAT. http://estadisticas.cepal.org/cepalstat/WEB_CEPALSTAT/acercaDe.asp?idioma=i. Cited July 22, 2013 (2013)
CEPALSTAT: Estimation of Household Income. http://websie.eclac.cl/sisgen/SisGen_Badeinso_calculo_ingresos.asp?idioma=i. Cited July 22, 2013. (2013)
CEPALSTAT: Note on Household Surveys. http://websie.eclac.cl/sisgen/SisGen_Badeinso_nota_encuestas_hogares.asp?idioma=i. Cited July 22, 2013. (2013)
Deininger, K., Squire, L.: A new data set measuring income inequality. The World Bank Economic Review, 10(3), 565-591 (1996)
Expert Group on Household Income Statistics [The Canberra Group]: Final Report and Recommendations. Canberra: Statistics Canada (2001)
Gasparini, L.. Tornarolli, L.: A review of the OECD Income Distribution Database. Journal of Economic Inequality, this issue (2015)
GINI Growing Inequalities' Impacts.: http://gini-research.org/articles/home. Cited Feb 1, 2015. (2015)
Gornick, J.C., Jantti, M., Munzi, T., Kruten, T.: Response to The Luxembourg Income Study review by Martin Ravallion. Journal of Economic Inequality, this issue (2015)
Higgins, S., Pereira, C.: The Effects of Brazil’s Taxation and Social Spending on the Distribution of Household Income. In: Lustig, N., Pessino, C., Scott, J. (eds.) The Redistributive Impact of Taxes and Social Spending in Latin America. Special Issue. Public Finance Review, 42(3), 346–67 (2014)
Inchauste, G., Lustig, N., Maboshe, M., Purfield, C., Woolard, I.: The Distributional Impact of Fiscal Policy in South Africa, Policy Research Working Paper 7194, World Bank, Washington, DC (2015)
Jaramillo, M.: The Incidence of Social Spending and Taxes in Peru. In: Lustig, N., Pessino, C., Scott, J. (eds.) The Redistributive Impact of Taxes and Social Spending in Latin America. Special Issue. Public Finance Review, 42(3), 291–412 (2014)
International Monetary Fund: Fiscal Monitor Taking Stock: A Progress Report on Fiscal Adjustment. Database (October 2014)

22
Jenkins, S.P.: World Income Inequality Databases an assessment of WIID and SWIID, Journal of Economic Inequality, this issue (2015)
Jenkins, S. P., Van Kerm, P.: The measurement of economic inequality. In: Salverda, W., Nolan, B., Smeeding, T. (eds.) Oxford Handbook of Economic Inequality, Oxford University Press, Oxford (2009)
Lahoti, R., Jayadev, A., Reddy, S. G.: The Global Consumption and Income Project (GCIP): An Introduction and Preliminary Findings. Available at SSRN 2480636 (2014)
LIS: Inequality and Poverty. http://www.lisdatacenter.org/data-access/key-figures/inequality-and-poverty. Cited July 22, 2013 (2013)
LIS: Inequality and Poverty Key Figures. http://www.lisdatacenter.org/lis-ikf-webapp/app/search-ikf-. Cited July 22, 2013 (2013)
LIS: The LIS Database: Guidelines. http://www.lisdatacenter.org/wp-content/uploads/our-lis-documentation-harmonisation-guidelines.pdf. Cited July 22, 2013 (2013)
LIS: LIS Variables. www.lisdatacenter.org/wp-content/uploads/our-lis-documentation-variables-list.pdf. Cited July 22, 2013 (2013)
Milanovic, B.: Description of All the Ginis Dataset. http://worldbank.org/INTPOVRES/Resources/477227-1173108574667/Description_of_the_gini_dataset_2013.pdf. The World Bank. Cited July 22, 2013 (2013)
OECD: Income Distribution Database: Gini, poverty, income, Methods and Concepts. OECD. http://www.oecd.org/social/income-distribution-database.htm. Cited December, 22, 2014 (2014)
OECD: Metadata on OECD Income Distribution Database (IDD). http://www.oecd.org/social/soc/_README_IDD_Surveys&Years.pdf. Cited December 22, 2014 (2014)
OECD: OECD Framework for Statistics on the Distribution of Household Income, Consumption and Wealth. OECD Publishing, Paris (2013)
OECD: OECD.Stat Web Browser User Guide. http://stats.oecd.org/ModalHelp/OECD/WBOS%20User%20Guide%20(EN).pdf. Cited July 22, 2013 (2013)
OECD: Quality review of the OECD database on household incomes and poverty and the OECD earnings database Part 1. http://www.oecd.org/els/soc/OECDIncomeDistributionQualityReview_PartI.pdf. Cited July 22, 2013 (2013)

23
OECD: Quality review of the OECD database on household incomes and poverty and the OECD earnings database Part 2. http://www.oecd.org/els/soc/OECDIncomeDistributionQualityReview_PartII.pdf. Cited July 22, 2013 (2013)
Ostry, J.D., Berg, A., Tsangarides, C.G.: Redistribution, inequality, and growth, IMF Staff Discussion Note SDN1402. International Monetary Fund, Washington, DC (2014)
Paz Arauco, V., Molina, G. G., Yáñez Aguilar, E., Pozo, W.J.: Explaining Low Redistributive Impact in Bolivia. In: Lustig, N., Pessino, C., Scott, J. (eds.) The Redistributive Impact of Taxes and Social Spending in Latin America. Special Issue. Public Finance Review, 42(3), 326–345 (2014)
Piketty, T.: Capital in the 21st Century. Harvard University Press (2014)
Ravallion, M.: The Luxembourg Income Study. Journal of Economic Inequality, this issue (2015)
Sauma, P., Trejos, J. D.: Gasto Público Social, Impuestos, Redistribución del Ingreso y Pobreza en Costa Rica, CEQ Working Paper 18, Tulane University (2014)
Scott, J.: Redistributive Impact and Efficiency of Mexico’s Fiscal System. In: Lustig, N., Pessino, C., Scott, J. (eds.) The Redistributive Impact of Taxes and Social Spending in Latin America. Special Issue. Public Finance Review, 42(3), 368–390 (2014)
Smeeding, T., Latner, J.: PovcalNet, WDI and `All the Ginis’: A Critical Review. Journal of Economic Inequality, this issue (2015)
Solt, F.: On the Assessment and Use of Cross-National Income Inequality Datasets. Journal of Economic Inequality, this issue (2015)
Solt, F.: The Standardized World Income Inequality Database. Working paper. SWIID Version 5.0, October 2014 (2014)
Solt, F.: Standardizing the world income inequality database. Social Science Quarterly, 90(2), 231-242 (2009)
Socio-Economic Database for Latin America and the Caribbean (CEDLAS and The World Bank): Methodology- Documents. http://sedlac.econo.unlp.edu.ar/eng/methodology.php. Cited July 25, 2013 (2013)
Socio-Economic Database for Latin America and the Caribbean (CEDLAS and The World Bank): SEDLAC- Institutional http://sedlac.econo.unlp.edu.ar/eng/institutional.php. Cited June, 2 2013 (2013)
Socio-Economic Database for Latin America and the Caribbean (CEDLAS and The World Bank): STATS. http://sedlac.econo.unlp.edu.ar/eng/statistics-detalle.php?idE=35. Cited February 20, 2015. (2015)

24
United Nations: Provisional Guidelines on Statistics of the Distribution of Income, Consumption and Accumulation of Households. Studies in Methods M 61. New York: Department of Economic and Social Affairs, Statistical Office (1977)
United Nations Economic Commission for Europe: Canberra Group Handbook on Household Income Statistics, Second Edition, Geneva (2011)
Wittenberg, M.: Problems with SWIID: the case of South Africa. Journal of Economic Inequality, this issue (2015)
World Bank: Data. http://iresearch.worldbank.org/PovcalNet/index.htm?0,3. Cited April 18, 2013 (2013)
World Bank: Ethiopia Poverty Assessment 2014, Chapter 5, World Bank, Washington DC (2015)
World Bank: Indicators. http://data.worldbank.org/indicator/all. Cited July 22, 2013 (2013)
World Bank: Methodology. http://iresearch.worldbank.org/PovcalNet/index.htm?0,2. Cited July 22, 2013 (2013)
World Bank: PovcalNet: an online poverty analysis tool. http://iresearch.worldbank.org/PovcalNet/index.htm?0,0. Cited October 28, 2014. (2014)
World Income Inequality Database: Version 3.0b. UNU-WIDER. http://www.wider.unu.edu/research/WIID3-0B/en_GB/database/ Cited October 8, 2014 (2014)
Younger, S.D., Khachatryan, A.: Fiscal Incidence in Armenia, Background Paper for World Bank Armenia Public Expenditure Review, 2014. (http://documents.worldbank.org/curated/en/2014/05/19884965/armenia-public-expenditure-review-expanding-fiscal-envelope) (2014)

25
Table 1: Gini Coefficient Frequencies in Microdata-based Datasets (CEPAL, LIS, SEDLAC, OECD IDD, and WDI/ PovcalNet)
Region
Number of Country-Years with Primary Source Data
Total Number Primary Source
Observations Earliest
Observation Most Recent Observation
East Asia and Pacific 112 114 1981 2011
Eastern Europe and Central Asia
301 334 1984 2011
Latin America and Caribbean
378 832 1974 2013
Middle East and North Africa
51 53 1979 2010
South Asia 39 39 1978 2012
Sub-Saharan Africa 139 139 1980 2011
Western Europe and North America
316 403 1967 2010
Grand Total 1336 1914 1967 2013
NOTE: Statistics as of December 2014. WDI Ginis are derived from PovcalNet.

26
Table 2: Description of Datasets Panel A: Microdata-based Datasets
Dataset CEPAL LIS OECD IDD
SEDLAC WDI PovcalNet
Dataset Summary
Inequality Indicators (Gini (G), Theil (T), Atkinson (A), Others (O)) G,T,A,O G,T,A,O G,O G,T,A,O G,T,O
Statistical Significance Indicators (i.e., standard errors or confidence intervals) (Always (A), Sometimes (S), Never (N)) N N S A N
What is the unit of time: month (M), quarter (Q), year (A)? Are corrections made for inflation? (Yes(Y)/No(N)) M(N) A(Y) A(Y) M(Y) Varies (Y)
Description of Welfare Concept
Income (I) or consumption (C ) I I I I varies
Monetary (M) or total (T)? If ‘total’, does it include auto-consumption (Yes(Y)/No(N)) , imputed rent (Yes(Y)/No(N))? T(Y,Y) T(Y,N) M T(Y,Y) V-NS
Includes estimates before taxes and transfers? (Yes(Y)/No(N)) NS N Y N NS
Includes estimates after taxes and transfers? (Yes(Y)/No(N)) NS Y Y Y NS
Equivalization of household incomes: per capita (PC), or alternative equivalence scale (E)? PC E E PC & E PC
Are differences in prices by region (rural, urban, etc.) accounted for?(Yes(Y)/No(N)) NS N N Y V-NS
Adjustments to the original data source ( for harmonization purposes)
Correction for under-reporting (Yes(Y)/No(N)) Y N varies N N
Is documentation sufficient to replicate results? (Yes(Y)/No(N)) N N/A N N/A N/A
Adjustment for top coding? (Yes(Y)/No(N)) N Y N N NS
Is documentation sufficient to replicate results? (Yes(Y)/No(N)) N/A Y N/A N/A N
Elimination of extreme values (Yes(Y)/No(N)) N N V-NS N NS
Is microdata made available through the dataset provider? (Yes(Y)/No(N)) N Y N N N
* Consumption is the preferred welfare definition for WDI. Inequality induces based on income are also listed in certain cases.
NOTES: N/A denotes Not Applicable. NS denotes Not Stated; in these cases the information is not documented by the dataset provider. V-NS denotes Varies by observation, not stated at observation level.

27
Table 2: Description of Datasets (ctd.) Panel B: Secondary Source Datasets
Dataset ATG WIID
Dataset Summary
Inequality Indicators (Gini (G), Theil (T), Atkinson (A), Others (O)) G G, O
Statistical Significance Indicators (i., standard errors or confidence intervals) (Always (A), Sometimes (S), Never (N)) N N
Methodology for Aggregating Data
Adjusts primary source data?(Yes(Y)/No(N)) N N
Is original source of data clearly noted?(Yes(Y)/No(N)) Y Y
Are welfare concepts clearly noted? (Yes(Y)/No(N)) N Y
If multiple datapoints are available for the same country and year, are some sources of data given priority?(Yes(Y)/No(N)) Y Y
If multiple datapoints are available for the same country and year, is a "first-best" datapoint selected? (Yes(Y)/No(N)) Y N
Are secondary-source databases used as inputs? (Yes(Y)/No(N)) Y N
If secondary-source based databases are used as inputs, is a methodology in place to prevent over-representation if the same datapoint appears from both a primary and secondary source? (Yes(Y)/No(N)/Not Stated (NS))
NS N/A
Panel C: Imputation-based Datasets
Dataset SWIID
Dataset Summary
Inequality Indicators (Gini (G), Theil (T), Atkinson (A), Others (O)) G
Statistical Significance Indicators (i., standard errors or confidence intervals) (Always (A), Sometimes (S), Never (N)) A*
Methodology for Imputations
Is the description of imputation methods sufficient to replicate the dataset? (Yes(Y)/No(N)) Y
Has methodology been subject to scrutiny by experts in the field of imputation? (Yes(Y)/No(N)) Not Clear
Are secondary data sources used as inputs? (Yes(Y)/No(N)) Y
If secondary data sources are used as inputs, is a methodology in place to prevent over-representation if the same datapoint appears from both a primary and secondary source? (Yes(Y)/No(N)/Not Stated (NS))
NS
Is there a systematic validation process in place with country/region experts? (Yes(Y)/No(N)) Not Clear
If multiple datapoints are available for the same country and year, is a "first-best" datapoint selected or are all datapoints used in the imputation method? (First Best (FB)/ All)
All
Is the welfare concept clearly defined? (Yes(Y)/No(N)) Can it be deduced from the documentation on the primary sources? (Yes(Y)/No(N))
N, Y
*SWIID v5.0 provides 100 imputed values of each of its indicators. Stata code on the SWIID website allows users to either calculate means, standard deviation, and confidence intervals or to use the 100 values to multiply impute their analysis. Earlier versions of the SWIID provided the mean and standard deviation.
NOTES: N/A denotes Not Applicable. NS denotes Not Stated; in these cases the information is not documented by the dataset provider. V-NS denotes Varies by observation, not stated at observation level.
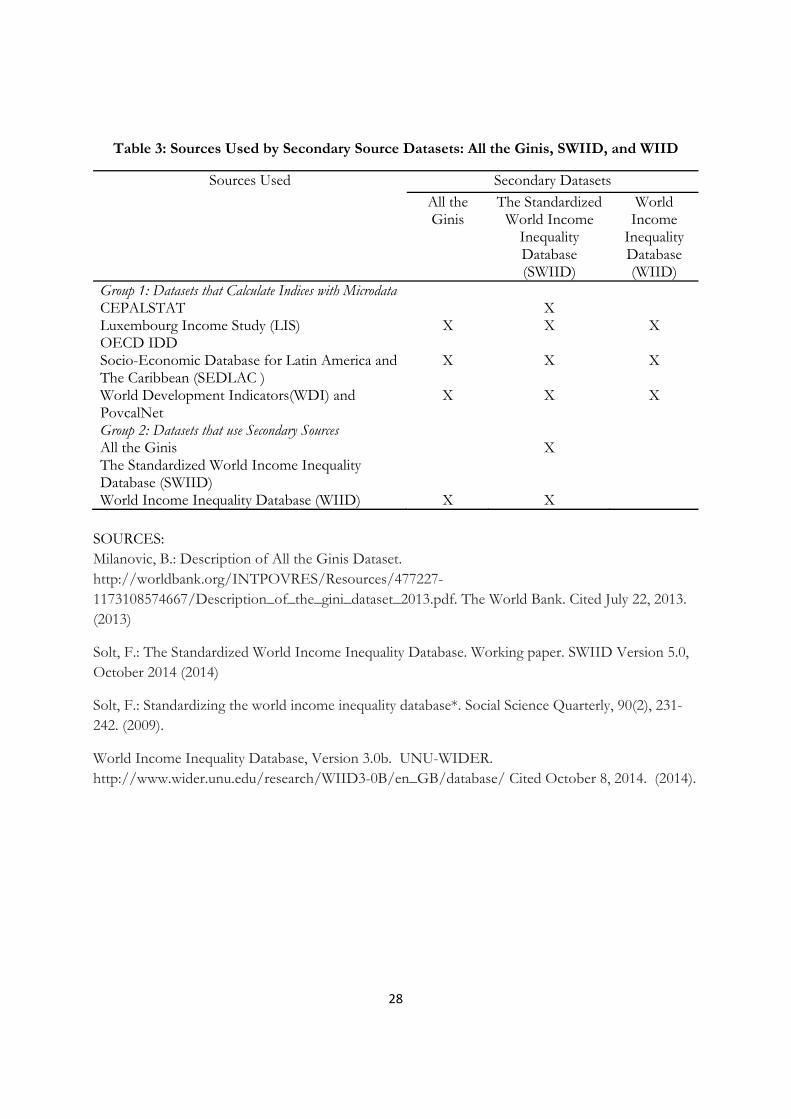
28
Table 3: Sources Used by Secondary Source Datasets: All the Ginis, SWIID, and WIID
Sources Used Secondary Datasets All the
Ginis The Standardized
World Income Inequality Database (SWIID)
World Income
Inequality Database (WIID)
Group 1: Datasets that Calculate Indices with Microdata CEPALSTAT XLuxembourg Income Study (LIS) X X XOECD IDD Socio-Economic Database for Latin America and The Caribbean (SEDLAC )
X X X
World Development Indicators(WDI) and PovcalNet
X X X
Group 2: Datasets that use Secondary SourcesAll the Ginis X The Standardized World Income Inequality Database (SWIID)
World Income Inequality Database (WIID) X X SOURCES: Milanovic, B.: Description of All the Ginis Dataset. http://worldbank.org/INTPOVRES/Resources/477227-1173108574667/Description_of_the_gini_dataset_2013.pdf. The World Bank. Cited July 22, 2013. (2013)
Solt, F.: The Standardized World Income Inequality Database. Working paper. SWIID Version 5.0, October 2014 (2014)
Solt, F.: Standardizing the world income inequality database*. Social Science Quarterly, 90(2), 231-242. (2009).
World Income Inequality Database, Version 3.0b. UNU-WIDER. http://www.wider.unu.edu/research/WIID3-0B/en_GB/database/ Cited October 8, 2014. (2014).

29
Table 4: Correlation between Datasets Panel A: Eastern Europe, Africa, Asia, and the Pacific
Correlation Coefficient Correlation Coefficient
Country ATG and SWIID
WDI and SWIID Country ATG and
SWIID WDI and SWIID
East Asia and the Pacific South Asia Australia 0.037 Bangladesh -0.087 0.913 Cambodia 0.584 0.81 Bhutan 0.987 China 0.939 0.967 India 0.347 0.321Fiji 0.365 Nepal 0.937 0.979 Hong Kong 0.701 Pakistan 0.694 0.468 Indonesia 0.303 0.869 Sri Lanka 0.71 0.724Japan -0.479 Central and South Africa Laos 0.984 0.957 Botswana 0.78 Malaysia 0.74 0.896 Burkina Faso 0.925 0.754Mongolia 0.526 -0.468 Burundi 0.999 0.999New Zealand 0.703 Cameroon 0.968 0.969 Philippines 0.51 0.952 Central African Republic 0.957 0.963Singapore 0.375 Comoros 0.902 Taiwan 0.652 Cote D'Ivoire 0.96 0.943 Thailand 0.763 0.871 Ethiopia 0.499 0.999Vietnam 0.644 0.314 Gabon 0.959 Gambia 0.162
Eastern Europe and Central Asia Ghana 0.842 0.892Albania 0.559 0.911 Guinea 0.924 0.229 Armenia 0.206 0.749 Guinea-Bissau 0.967 Azerbaijan 0.86 -0.382 Kenya 0.798 0.625Belarus 0.444 0.188 Lesotho 0.858 0.845Bosnia and Herzegovina 0.887 0.992 Madagascar 0.579 0.678Bulgaria 0.898 0.245 Malawi 0.996 0.985Croatia 0.868 0.678 Mali 0.956 0.958Cyprus -0.155 Mauritania 0.892 0.928 Estonia 0.881 0.919 Mauritius 0.982 Georgia 0.911 0.418 Mozambique 0.465 0.639Greece 0.55 Niger 0.953 0.966 Hungary 0.722 0.546 Nigeria 0.953 0.774Kazakhstan 0.853 0.827 Rwanda 0.974 0.972Kyrgyz Republic 0.82 0.906 Senegal 0.839 0.987Latvia 0.966 0.98 Seychelles -0.978 Lithuania 0.902 0.928 Sierra Leone 0.854 Macedonia 0.916 0.957 South Africa 0.778 0.745Moldova 0.901 0.932 Sudan 0.928 Montenegro 0.854 0.54 Swaziland 0.913 Poland 0.747 0.851 Tanzania 0.697 0.553Romania 0.701 0.566 Uganda 0.858 0.845Russian Federation 0.91 0.782 Middle East and North Africa Serbia 0.504 0.955 Djibouti 0.751 Slovenia 0.407 0.911 Egypt 0.79 0.492Tajikistan 0.775 0.797 Iran 0.153 0.451Turkey 0.769 0.738 Israel 0.257 Turkmenistan 0.925 0.971 Jordan 0.506 0.877Ukraine 0.915 0.936 Morocco 0.873 0.779Uzbekistan 0.808 0.996 Tunisia 0.488 0.56 Yemen, Republic of 0.919
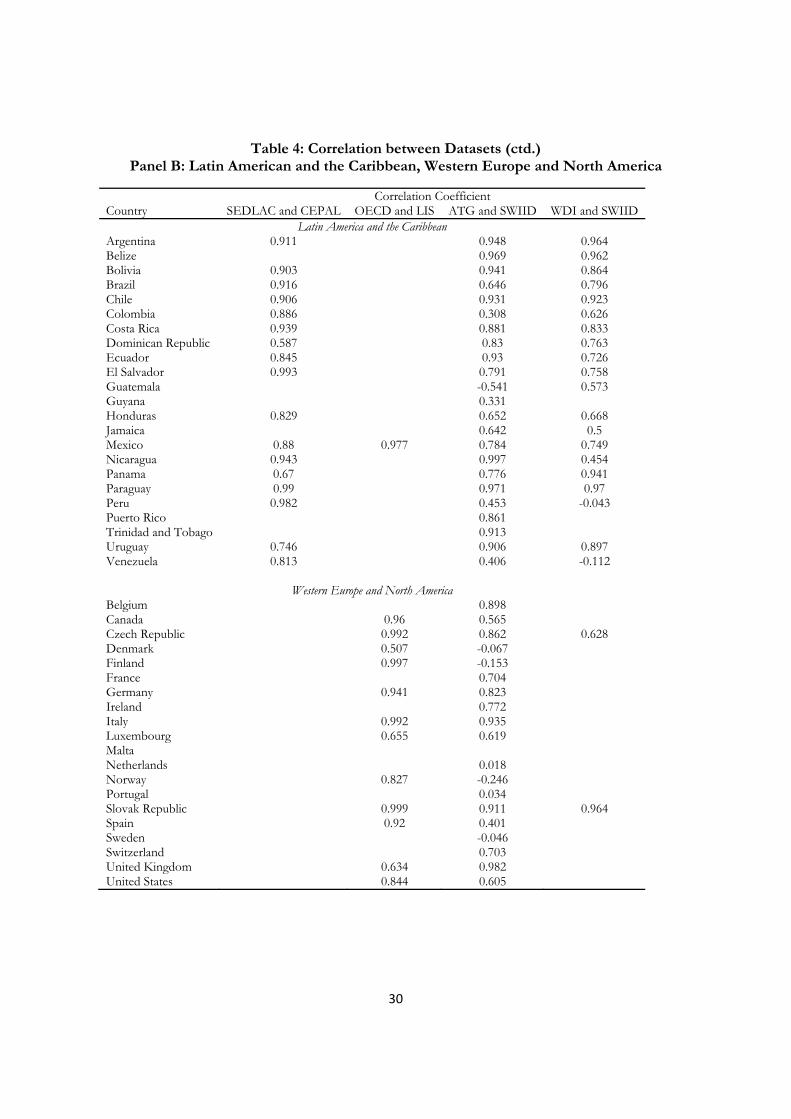
30
Table 4: Correlation between Datasets (ctd.) Panel B: Latin American and the Caribbean, Western Europe and North America
Correlation CoefficientCountry SEDLAC and CEPAL OECD and LIS ATG and SWIID WDI and SWIID
Latin America and the CaribbeanArgentina 0.911 0.948 0.964 Belize 0.969 0.962 Bolivia 0.903 0.941 0.864 Brazil 0.916 0.646 0.796 Chile 0.906 0.931 0.923 Colombia 0.886 0.308 0.626 Costa Rica 0.939 0.881 0.833 Dominican Republic 0.587 0.83 0.763 Ecuador 0.845 0.93 0.726 El Salvador 0.993 0.791 0.758 Guatemala -0.541 0.573 Guyana 0.331 Honduras 0.829 0.652 0.668 Jamaica 0.642 0.5 Mexico 0.88 0.977 0.784 0.749 Nicaragua 0.943 0.997 0.454 Panama 0.67 0.776 0.941 Paraguay 0.99 0.971 0.97 Peru 0.982 0.453 -0.043 Puerto Rico 0.861 Trinidad and Tobago 0.913 Uruguay 0.746 0.906 0.897 Venezuela 0.813 0.406 -0.112
Western Europe and North AmericaBelgium 0.898 Canada 0.96 0.565 Czech Republic 0.992 0.862 0.628 Denmark 0.507 -0.067 Finland 0.997 -0.153 France 0.704 Germany 0.941 0.823 Ireland 0.772 Italy 0.992 0.935 Luxembourg 0.655 0.619 Malta Netherlands 0.018 Norway 0.827 -0.246 Portugal 0.034 Slovak Republic 0.999 0.911 0.964 Spain 0.92 0.401 Sweden -0.046 Switzerland 0.703 United Kingdom 0.634 0.982 United States 0.844 0.605

31
Table 5: Change in Inequality 1985-1995 to 2000-2010
IMF Fiscal PovcalNet SWIID 5.0 Country Monitor First Last Average First Last Average
Côte d'Ivoire 5.0 7.2 4.8 6.5 5.6 5.0 6.5 Ghana 2.4 7.4 4.6 6.3 3.0 5.3 4.7 Kenya -6.2 -9.8 5.6 -2.1 -7.1 -6.3 -6.9 Madagascar -1.0 1.4 -2.0 0.2 3.8 4.4 4.8 Niger -6.2 4.3 -10.4 0.4 7.1 -13.0 -0.6 Senegal -7.8 -12.9 -2.3 -7.6 -12.7 -2.3 -7.0 Tanzania -3.1 0.8 3.8 2.3 -5.0 -1.0 -1.0 Zambia -13.5 -10.5 2.0 -3.5 -6.0 0.4 -2.6
NOTE: Columns labeled “First” use the first available datapoint in the time periods 1985 – 1995 and 2000 – 2010, respectively. Columns labeled “Last” use the first available datapoint in the time periods 1985 – 1995 and 2000 – 2010, respectively. Columns labeled “Average” use the average across all available years in each time period.

32
Figure 1: Difference in Estimated Gini–CEPALSTAT minus SEDLAC
NOTES: Trend line displayed (solid line). Outliers labeled with country abbreviations (BOL: Bolivia; PAN: Panama; ECU: Ecuador; ARG: Argentina; DOM: Dominican Republic).

33
Figure 2: Differing Trend Lines in Kenya
NOTES: WDI Gini is the Gini coefficient reported in the World Development Indicators. ATG Gini is All the Ginis’ GiniAll. SWIIDNMGini is the mean Net Market Gini reported by SWIID. The WIID (Average) series includes all WIID Gini coefficients, and averages coefficients together where more than one source exists in a given year.
0,30
0,35
0,40
0,45
0,50
0,55
0,60
0,65
1980 1982 1984 1986 1988 1990 1992 1994 1996 1998 2000 2002 2004 2006
Gini Coefficien
t
WDIGini ATGGini SWIIDNMGini WIID (Average)

34
Figure 3: Differing Trend Lines in Indonesia
NOTES: WDI Gini is the Gini coefficient reported in the World Development Indicators. ATG Gini is All the Ginis’ GiniAll. SWIIDNMGini is the mean Net Market Gini reported by SWIID. The WIID(Average) series includes all WIID Gini coefficients, and averages coefficients together where more than one source exists in a given year.
0,20
0,25
0,30
0,35
0,40
0,45
0,50
1980 1982 1984 1986 1988 1990 1992 1994 1996 1998 2000 2002 2004 2006 2008 2010 2012
Gini Coefficien
t
WDIGini ATGGini SWIIDNMGini WIID(Average)

35
Figure 4: Differing Trend Lines in Jamaica
NOTES: WDI Gini is the Gini coefficient reported in the World Development Indicators. ATG Gini is All the Ginis’ GiniAll. SWIIDNMGini is the mean Net Market Gini reported by SWIID. The WIID (Average) series includes all WIID Gini coefficients, and averages coefficients together where more than one source exists in a given year.
0,30
0,35
0,40
0,45
0,50
0,55
0,60
0,65
0,70
0,75
1980 1982 1984 1986 1988 1990 1992 1994 1996 1998 2000 2002 2004
Gini Coefficien
t
WDIGini ATGGini SWIIDNMGini WIID(Average)

36
Figure 5: Differences between Market Income and Net/Disposable Income Gini Coefficient
SOURCE: SWIID: V 5.0 database; CEQ: (Lustig, 2014), Armenia: Younger and Khachatryan (2014), Bolivia: Paz Arauco et al. (2014), Brazil: Higgins and Pereira (2014), Costa Rica: Sauma and Trejos (2014), El Salvador: Beneke al. (2015), Ethiopia: World Bank (2015), Guatemala: Cabrera et al. (2015), Indonesia: Afkar et al. (forthcoming), Mexico: Scott (2014), Peru: Jaramillo (2014), South Africa: Inchauste et al. (2015), Uruguay: Bucheli et al. (2014). Note: Difference is measured in Gini Points (Net/Disposable minus Market). CEQ’s Disposable Income is equivalent to SWIID's Net Income: e.g., market income after taxes and government cash transfers. Also, note that in both cases contributory pensions were classified as a government transfer (CEQ has estimates for pensions as part of market income as well). Comparisons for Bolivia, Brazil, Peru, and Uruguay are made with estimates for 2009. Comparisons for Costa Rica, Guatemala, Mexico, and South Africa made with estimates for 2010. Comparisons for Armenia and El Salvador are made with estimates for 2011. The comparison for Indonesia is made with estimates for 2012. The comparison for Ethiopia is made with the CEQ estimate for 2011 and the SWIID estimate for 2010. The CEQ estimate for South Africa includes pensions as part of market income. The only contributory pensions in South Africa are for public servants who must belong to the Government Employees Pension Fund. Since the government made no transfers to the GEPF in 2010/11, there is no scenario in which contributory pensions are treated as a transfer.
‐0,12 ‐0,10 ‐0,08 ‐0,06 ‐0,04 ‐0,02 0,00 0,02
Uruguay
South Africa*
Peru
Mexico
Indonesia
Guatemala
Ethiopia
El Salvador
Costa Rica
Brazil
Bolivia
Armenia
Net/Disposable Income Gini minus Market Income Gini(Gini Coefficient Measured from of 0 to 1)
SWIID CEQ (Pensions as Transfers)

37
Appendix A: Glossary Acronym Definition ATG
All the Ginis, a secondary source database produced by Branko Milanovic of the City University of New York
CEDLAS Center for Distributive, Labor and Social Studies, the acronym is based on the organizations Spanish name (Centro de Estudios Distributivos, Laborales, y Sociales) a research center based at Universidad Nacional de La Plata
CEPALSTAT Databases and Statistical Publications produced by ECLAC. The name CEPALSTAT is taken from the organization's Spanish acronym, CEPAL. (Comisión Económica para América Latina y el Caribe)
CEQ Commitment to Equity, a project of the Center for Inter-American Policy and Research and the Department of Economics at Tulane University, the Center for Global Development and the Inter-American Dialogue, a research project and database designed to analyze the impact of taxation and social spending on inequality and poverty
ECHP European Community Household Panel ECLAC Economic Commission for Latin America and the Caribbean EU-SILC The European Union's Survey of Income and Living Conditions GCIP The Global Consumption and Income Project, an imputation based , cross-
national dataset describing the distribution of income and consumption, produced by Arjun Jayadev of UMASS Boston, Sanjay Reddy of The New School, and Rahul Lahoti of the University of Goettingen.
GINI Project An international project that studied the economic and educational drivers and the social, cultural and political impacts of increasing inequality, produced a series of discussion papers, reports, and inequality databases.
IDD Income Distribution Database, a product of the Organisation for Economic Co-operation and Development (OECD)
IMF The International Monetary FundLIS (1) The Cross-National Data Center in Luxembourg (2) The Luxembourg Income Study Database, a product of LIS Cross-National
Data Center in Luxembourg. LISSY A remote execution system that allows users to access the Luxembourg Income
Study Database (LIS) and the Luxembourg Wealth Study Database. LSE The London School of Economics and Political ScienceNSO National Statistical OfficeOECD The Organisation for Economic Co-operation and Development PovcalNet An interactive tool that replicates and displays the World Bank's estimates of
poverty and inequality, a product of the World Bank's Development Research Group
SEDLAC Socio-Economic Database for Latin America and the Caribbean, produced by the Center for Distributive, Labor and Social Studies (CEDLAS)
SWIID The Standardized World Income Inequality Database, a multiply imputed inequality database created by Dr. Frederick Solt at the University of Iowa
UNDP United Nations Development Programme
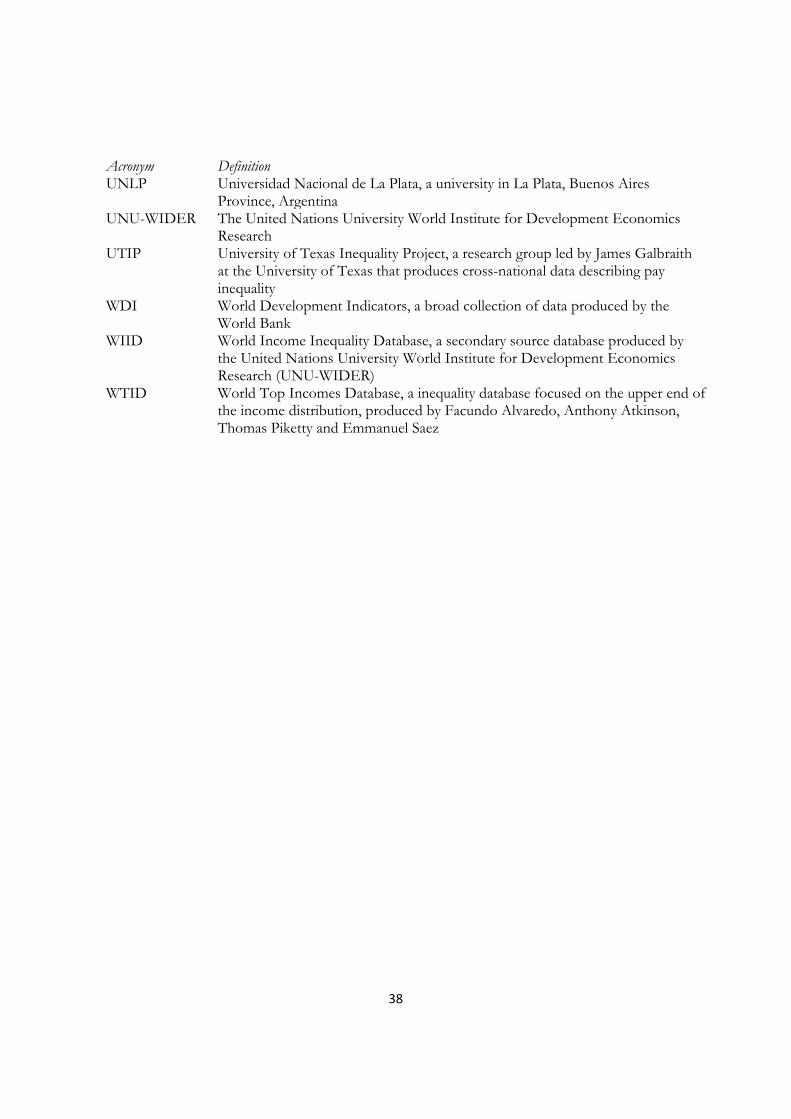
38
Acronym Definition UNLP Universidad Nacional de La Plata, a university in La Plata, Buenos Aires
Province, ArgentinaUNU-WIDER The United Nations University World Institute for Development Economics
Research UTIP University of Texas Inequality Project, a research group led by James Galbraith
at the University of Texas that produces cross-national data describing pay inequality
WDI World Development Indicators, a broad collection of data produced by the World Bank
WIID World Income Inequality Database, a secondary source database produced by the United Nations University World Institute for Development Economics Research (UNU-WIDER)
WTID World Top Incomes Database, a inequality database focused on the upper end of the income distribution, produced by Facundo Alvaredo, Anthony Atkinson, Thomas Piketty and Emmanuel Saez