approaches to arc flash hazard mitigation in 600 volt power syste
DESCRIPTION
NFPA 70e SafetyTRANSCRIPT

University of South FloridaScholar Commons
Graduate School Theses and Dissertations Graduate School
1-1-2011
Approaches to Arc Flash Hazard Mitigation in 600Volt Power SystemsCurtis Thomas LatzoUniversity of South Florida, [email protected]
Follow this and additional works at: http://scholarcommons.usf.edu/etdPart of the American Studies Commons, and the Electrical and Computer Engineering
Commons
This Dissertation is brought to you for free and open access by the Graduate School at Scholar Commons. It has been accepted for inclusion inGraduate School Theses and Dissertations by an authorized administrator of Scholar Commons. For more information, please [email protected].
Scholar Commons CitationLatzo, Curtis Thomas, "Approaches to Arc Flash Hazard Mitigation in 600 Volt Power Systems" (2011). Graduate School Theses andDissertations.http://scholarcommons.usf.edu/etd/3198

Approaches to Arc Flash Hazard Mitigation in 600 Volt Power Systems
by
Curtis T. Latzo
A dissertation submitted in partial fulfillment
of the requirements for the degree of
Doctor of Philosophy
Department of Electrical Engineering
College of Engineering
University of South Florida
Major Professor: Kenneth Buckle, Ph.D.
Ralph E. Fehr, Ph.D.
Paris H.Wiley, Ph.D.
Paul Schnitzler, Ph.D.
Thomas L. Crisman, Ph.D.
Date of Approval:
November 3, 2011
Keywords: Fault Current Analysis, Circuit Breaker Coordination, Power System
Protection, Molded Case Circuit Breaker, Low Voltage Power Circuit Breaker
Copyright © 2011, Curtis T. Latzo

ACKNOWLEDGMENTS
I would like to take this opportunity to thank my supervisor Dr. Kenneth Buckle
for his valuable guidance and support throughout my doctoral program. I would like to
thank my committee members, Dr. Ralph Fehr, Dr. Paris Wiley, Dr. Paul Schnitzler and
Dr. Thomas Crisman for their generous advice and interest.
I would like to thank my friend and professional mentor George Lewis (Hank)
Johnson. Without the input from Hank, this dissertation would not have been possible.

DEDICATION
This dissertation is dedicated to my wife, Tami, and my daughter, Lily, for giving
me endless love and support and for inspiring me to complete this task.
Also, I would like to thank my parents, Ray and Rosemarie Latzo, for supporting
me in countless ways and for giving me the greatest brothers and sister in the world -
George, Steve and RaeAnn.
Additional thanks to all of my extended families of Latzo, Donatelli, Osust, Fiore,
Ciaravino, and Bianco.

i
TABLE OF CONTENTS
LIST OF TABLES ............................................................................................................. iii
LIST OF FIGURES ........................................................................................................... iv
ABSTRACT ..................................................................................................................... viii
1. INTRODUCTION ...........................................................................................................1
1.1 Overview of Electrical Safety ............................................................................1
1.2 Importance of Arc Flash ....................................................................................4
1.3 Research Objectives ...........................................................................................6
1.4 Contribution of the Dissertation.........................................................................8
1.5 Outline of the Dissertation .................................................................................8
2. POWER SYSTEM PROTECTION ...............................................................................11
2.1 Electrical System Abnormalities......................................................................11
2.2 Electrical System Overloads ............................................................................12
2.3 Electrical System Faults ...................................................................................13
2.4 Circuit Breakers ...............................................................................................15
2.5 Circuit Breaker Testing ....................................................................................21
2.6 Fuses ................................................................................................................22
3. ELECTRICAL POWER SYSTEM STUDIES ..............................................................25
3.1 Fault Current Analysis .....................................................................................25
3.2 Protective Device Selective Coordination .......................................................35
3.3 Arc Flash Hazard Analysis ..............................................................................44
3.4 Arc Flash Hazard Risk Categories ...................................................................54
4. EXISTING ARC FLASH HAZARD MITIGATION TECHNIQUES .........................57
4.1 Changing Work Methods and Procedures .......................................................57
4.2 Temporarily Modifying Existing Protective Device Settings ..........................58
4.3 Increasing the Working Distance .....................................................................60
4.4 Arc Flash Resistant Switchgear .......................................................................61
4.5 Optical Light Sensor Technology ....................................................................62
4.6 Allowing a Lack of Circuit Breaker Selectivity ..............................................68
5. IMPACT OF ARC FLASH ANALYSIS .......................................................................70
5.1 Free Standing Ambulatory Surgery Center......................................................70
5.2 Heart Catheterization Center............................................................................79
5.3 Metal Container Manufacturer .........................................................................88

ii
6. IMPLEMENTATION OF DESIGN METHODS FOR ARC FLASH
MITIGATION ...............................................................................................................99
6.1 When Applying the National Electric Code, Article 230, Part VI,
Always Specify a Single Main Circuit Breaker for Building
Shutdown ......................................................................................................100
6.2 At the Electrical Service Entrance the Design Shall Specify Low
Voltage Power Circuit Breakers Instead of Fused Disconnect
Switches ........................................................................................................107
6.3 Specify Adjustable Low Voltage Power Circuit Breakers for
Protection of Step-Down Transformers Rated above 125kVA ....................111
6.4 Step-Down Transformers Larger than 125kVA Shall Be Replaced with
a Design Having Two Smaller Transformers ...............................................121
7. CONCLUSIONS AND FUTURE WORK ..................................................................126
7.1 Conclusions ....................................................................................................126
7.2 Further Work ..................................................................................................129
REFERENCES ................................................................................................................130

iii
LIST OF TABLES
Table 1.1: Reaction of Human Body to Electric Current............................................................ 2
Table 2.1: Test X/R Ratios for Protective Devices.......................................................................... 21
Table 3.1: Simulation Results for 1500kVA Transformer with Z=5% ......................................... 30
Table 3.2: Test X/R Ratios for Protective Devices.......................................................................... 34
Table 3.3: Classes of Equipment and Typical Bus Gaps ................................................................ 46
Table 3.4: Distance x Factors ............................................................................................................ 48
Table 3.5: Classes of Equipment and Typical Working Distances................................................ 49
Table 3.6: Hazard Risk Categories and PPE Characteristics .......................................................... 55
Table 5.1: Equipment Evaluation Table for Surgery Center .......................................................... 72
Table 5.2: Equipment Evaluation Table for Heart Catheterization Lab ........................................ 81
Table 5.3: Equipment Evaluation Table for Bus Duct Feeder ....................................................... 91
Table 7.1: Before and After Arc Flash Hazard .............................................................................. 129

iv
LIST OF FIGURES
Figure 2.1: Fault Current Waveform Profile......................................................................14
Figure 2.2: TCC Curve for 480 volt, 100 amp MCCB ......................................................17
Figure 2.3: TCC Curve for 480 volt, 100 amp MCCB with Low and High Settings ........18
Figure 2.4: TCC Curve Showing 480 volt, 100 ampere LVPCB ......................................19
Figure 2.5: TCC Curve for 480 volt, 100 ampere LVPCB with LSI Settings ...................20
Figure 2.6: TCC for 480 volt, 100 ampere Fuse ................................................................24
Figure 3.1: Series R-L Circuit ............................................................................................26
Figure 3.2: One-Line Diagram of Utility Serving Main SWBD .......................................28
Figure 3.3: Utility Contribution One-Lines .......................................................................30
Figure 3.4: Fault Current Waveform .................................................................................31
Figure 3.5: Peak Asymmetrical Current versus X/R Ratio ................................................33
Figure 3.6: Partial One-Line Diagram Showing Fault Current Values and X/R Ratios ....35
Figure 3.7: One-Line Diagram of a Two Motor Electrical System ...................................37
Figure 3.8: Time Current Curves for a Circuit Breaker and a Fuse ...................................38
Figure 3.9: Time Current Curves for a Selectively Coordinated System ..........................39
Figure 3.10: Time Current Curves with a Lack of Selective Coordination .......................40
Figure 3.11: Time Current Curves for Thermal Magnetic Breakers .................................42
Figure 3.12: Time Current Curves for LSI Circuit Breakers .............................................43
Figure 3.13: Circuit Breaker TCC Interrupting Arcing Current ........................................51
Figure 3.14: Circuit Breaker TCC Interrupting Arcing Currents ......................................52

v
Figure 3.15: Partial One-Line Showing Panel-B Incident Energy ....................................53
Figure 3.16: Partial One-Line Showing Panel-B Incident Energy and Hazard Risk
Category .......................................................................................................56
Figure 4.1: Incident Energy Before and After Temporary Setting of Breaker CB-
Main ................................................................................................................59
Figure 4.2: Incident Energy Before and After Increasing Working Distance ..................61
Figure 4.3: Typical Fiber Optic Routing in Switchgear ....................................................64
Figure 4.4: Arc Detection Relay Block Diagram...............................................................65
Figure 4.5: Arc Detection Relay Operating Times ............................................................66
Figure 4.6: Incident Energy Levels With and Without Arc Flash Relay ...........................67
Figure 4.7: Single Fiber Loop Layout................................................................................68
Figure 5.1: One-Line Diagram for Surgery Center ............................................................71
Figure 5.2: TCC Curve for Surgery Center .......................................................................73
Figure 5.3: Time Current Curve for Arcing Current at PNL-N1 .......................................74
Figure 5.4: Time Current Curve for Arcing Current at MDP ............................................75
Figure 5.5: One-Line Diagram for Surgery Center with Added Main Fuse ......................77
Figure 5.6: TCC for Arcing Current at MDP with Added Fuse ........................................78
Figure 5.7: One-Line Diagram for Heart Catheterization Lab ..........................................80
Figure 5.8: TCC Curve for Heart Catheterization Lab ......................................................82
Figure 5.9: Time Current Curve for Arcing Current at Panel H1 ......................................83
Figure 5.10: Time Current Curve for Arcing Current at Panel LDP .................................84
Figure 5.11: One-Line Diagram for Surgery Center with Added Main Breaker ...............86
Figure 5.12: TCC for Arcing Current at Panel LDP with LSI Breaker .............................87
Figure 5.13: TCC for Heart Catheterization Lab after Breaker Change ............................88

vi
Figure 5.14: Partial One-Line Diagram for Bus Duct Feeder ............................................90
Figure 5.15: TCC for PD-Bus B and PD-Bus B1 ..............................................................92
Figure 5.16: Time Current Curve for Arcing Current at Bus-B .......................................93
Figure 5.17: Time Current Curve for Arcing Current at Bus-B1 ......................................94
Figure 5.18: Partial One-Line Diagram after Implementation of Dis-Coordinated
Settings ..........................................................................................................95
Figure 5.19: TCC for Arcing Current at Bus-B after Breaker Adjustment .......................96
Figure 5.20: TCC for Arcing Current at Bus-B1 after Breaker Adjustment .....................97
Figure 6.1: Partial One-Line Diagram with 6-Hand Rule in Use ....................................101
Figure 6.2: TCC Showing Arc Flash Exposure for Six-Hand Rule .................................103
Figure 6.3: Partial One-Line Diagram with Main Breaker Installed ...............................105
Figure 6.4: TCC with Main Breaker Installed .................................................................106
Figure 6.5: One-Line Diagram Showing Main Fused Disconnect ..................................107
Figure 6.6: TCC for Main Fused Disconnect...................................................................108
Figure 6.7: Partial One-Line Diagram for Service Entrance with LSI Main Breaker .....109
Figure 6.8: TCC for Service Entrance with LSI Main Breaker .......................................110
Figure 6.9: Partial One-Line Diagram Showing Arc Flash Increase across 225kVA .....112
Figure 6.10: TCC Showing Thermal-Mag Breaker and Arcing Current at Primary
of XF-1 ........................................................................................................114
Figure 6.11: TCC Showing Thermal-Mag Breaker and Arcing Current at
Secondary of XF-1 ......................................................................................115
Figure 6.12: Partial One-Line Diagram Showing Arc Flash Mitigation across
225kVA .......................................................................................................117
Figure 6.13: TCC Showing LSI Breaker and Arcing Current at Primary of XF-1 ..........119
Figure 6.14: TCC Showing LSI Breaker and Arcing Current at Secondary of XF-1 ......120

vii
Figure 6.15: Partial One-Line Diagram with 225kVA Step-Down Transformer ............121
Figure 6.16: TCC Showing Arc Flash Hazard at Panel L1..............................................122
Figure 6.17: Partial One-Line Diagram Showing Two 112.5kVA Transformers ...........123
Figure 6.18: TCC Showing Arc Flash Hazard at Panel L2..............................................124

viii
ABSTRACT
Federal regulations have recognized that arc flash hazards are a critical source of
potential injury. As a consequence, in order to work on some electrical equipment, the
energy source must be completely shut-down. However, power distribution systems in
mission critical facilities such as hospitals and data centers must sometimes remain
energized while being maintained. In recent years the Arc Flash Hazard Analysis has
emerged as a power system tool that informs the qualified technician of the incident
energy at the equipment to be maintained and recommends the proper protective
equipment to wear. Due to codes, standards and historically acceptable design methods,
the Arc Flash Hazard is often higher and more dangerous than necessary.
This dissertation presents detailed methodology and proposes alternative
strategies to be implemented at the design stage of 600 volt facility power distribution
systems which will decrease the Arc Flash Hazard Exposure when compared to widely
used code acceptable design strategies. Software models have been developed for
different locations throughout a power system. These software model simulations will
analyze the Arc Flash Hazard in a system designed with typical mainstream code
acceptable methods. The model will be changed to show implementation of arc flash
mitigation techniques at the system design level. The computer simulations after the
mitigation techniques will show significant lowering of the Arc Flash Hazard Exposure.

1
1. INTRODUCTION
The first power systems in the early 1880s were created to provide a source of
electricity for lighting. Thomas Edison’s invention of the light bulb and the direct current
electrical system to power it was the beginning of the electrical generation industry.
Edison not only invented the light bulb, but also the distribution network, switches,
protective fuses, and insulating materials to make it all work. This was soon followed by
the invention of the electric motor in the late 1880s, which rapidly increased the demand
on the power system. Just a few years later, Nikola Tesla and George Westinghouse
would prove that their alternating current system was technically superior, since it was
able to be transformed to different voltages for transmission [1]. Soon after these electric
systems came on-line, the first electrical shock from a commercial power system
occurred. This led to the beginning of development for today’s safety codes and
standards.
1.1 Overview of Electrical Safety
People quickly learned that electric shock was not the only hazard created by
power systems. When equipment was not installed properly, a fire could erupt creating
even more danger. The novice contractors knew very little about electrical installations
making the likelihood of a disaster high. The need for some form of guidance in the
practice of electrical installation was evident. This was the beginning of what is now

2
known as the NFPA 70: National Electric Code (NEC), first published in 1897 [1]. This
code is used regularly for electrical system design standards and installation methods.
The plan review process and electrical inspections performed by building departments are
also based on the NEC.
Even with the proper electrical design and installation, accidents could possibly
occur when people make contact with energized equipment. Throughout the years, people
learned that electrical shock could cause serious injury and death. However, there was
very little knowledge on the effects of electrical shock on humans. It was not until 1956
that Charles Dalziel began performing shock experiments on animals and humans. His
quest to find out how much electrical current was needed to stop a person from breathing
or to stop a heart from working led to the information in Table 1.1 [2]. This work alerted
humans to the risk of small amounts of electricity and increased safety awareness.
Table 1.1 Reaction of Human Body to Electric Current
AC Current Effect of Current
0.7 – 1 mA Perception Threshold (tingling sensation)
1.2 – 1.8 mA Slight Shock – not painful
6 – 9 mA Shock – painful (no loss of muscle control)
15 – 23 mA Shock – severe (muscle control loss, breathing difficulty)
0.1 A Possible ventricular fibrillation (3-second shock)
0.2 A Possible ventricular fibrillation (1-second shock)
0.5 A Heart muscle activity ceases
1.5 A Tissue and organ burn

3
The industrial revolution from 1950 to 1970 created enormous growth in the
United States. With this expansion came many workplaces with little concern for
employee safety. Based on Occupational Safety and Health Administration statistics from
1970, there were 14,000 worker deaths that year from job related accidents [3]. Close to
2.5 million workers would become disabled and 300,000 individuals would contract an
occupational disease [3]. This prompted Congress to pass the Occupational Safety and
Health Act of 1970, leading to the formation of the Occupational Safety and Health
Administration (OSHA).
OSHA covers all employers and employees in the United States of America, with
a few exceptions for self-employed people and family run farms. Among other things,
OSHA, Title 29, Code of Federal Regulations addresses electrical safety. Typical of
OSHA standards, this section gives a general requirement and not specific details on how
to achieve the requirement. Initially, OSHA selected language from the NEC as a basis
for the electrical regulations [1]. However, the NEC is aimed at design and installation
practices and does not cover worker safety during equipment use. Therefore, a new code
aimed at everyday worker safety on the job was needed.
In 1976, the NFPA formed a committee at the request of OSHA to develop a new
standard for electrical safety in the workplace. This resulted in NFPA 70E: Standard for
Electrical Safety in the Workplace. The purpose of this standard is to provide a safe
workplace for employees with regard to electrical safety. This gave OSHA a reference for
electrical safety so employers could have a standard to follow.
NFPA 70E, was the first standard responsible for instructing electrical
maintenance personnel on how to work safely with regard to shock protection. This code

4
informed the worker of proper clothing, shoes, and rubber gloves. This code also gave
guidelines for proper use of voltage measuring devices and insulated tools. Furthermore,
NFPA 70E assigned given distances or boundaries from energized equipment that would
give the workers a reference of where the clothing was to be worn. The electricians now
had a strategy in place to protect themselves from electric shock.
1.2 Importance of Arc Flash
In time it became apparent that not all electrical accidents were due to electrical
shock from making contact with energized devices. When an exposed energized
conductor makes contact with the ground or another energized device, a small spark or a
large explosion could ignite. This explosion, otherwise known as an arc flash, can have
thermal energy that is dangerous from a distance of several feet away. One of the early
papers addressing the arc flash was written in 1982 by Ralph Lee [4]. In this paper, Lee
crossed the bridge between electrical shock from contact with energized devices, to
thermal burn from the radiant heat output of electrical arcs. Lee’s paper presented
theoretical methods for evaluating incident energy of an arc in open air. Additionally,
Lee’s research explained the relationship between heat transfer from hotter to cooler
objects and the importance of the distance between them. Lee’s paper goes on to develop
a relationship between heat transfer and distance with its effects on human skin tissue.
Acknowledging arc flash had several important consequences. First, electrical
workers needed to protect themselves from the dangers of both shock hazards and arc
flash thermal effects. Secondly, the workers needed to know what degree of potential
electrical hazards they were being exposed to. Thirdly, workers would need to know the

5
proper protective clothing and equipment required to ensure their safety at a particular
level of exposure.
In time, the focus of arc flash hazard research turned toward predicting and
calculating the incident energy produced. In 1998, Doughty, Neal, and Floyd did
extensive research on the measurement and calculation of arc flash [5]. Their research
detailed a testing program completed to measure incident energy from 6-cycle arcs on
600 volt power systems. The testing led to algorithms for predicting incident energy
based on available fault current and the distance from the source. These algorithms were
shown to support Ralph Lee’s research. However, this testing also showed an increase in
incident energy when the source is in an enclosure with an open door versus a source in
open air, such as an overhead conductor. This proved important because most arcs occur
when a person is standing in front of an open electrical enclosure and the arc is confined
in the panel-board or switchgear.
In 2000, the NFPA released a new version of NFPA 70E. This update recognized
the existence of the “Arc Flash Hazard” and included a new protection strategy in
addition to shock protection. There was now a section on Personal Protection Equipment
(PPE) requirements and hazard risk tables. This standard identified specific electrical
work activities and put them in five categories (0-4). Each category had a detailed
clothing arc flash rating and additional equipment to be worn, such as hard hats and
facemasks. However, this method of selecting protective equipment was based solely by
task and not on actual knowledge of the arc flash hazard level at any location in the
electrical system.

6
The findings detailed above, along with the focus of industry on electrical safety,
led to the need for guidelines and standards addressing the arc flash. In 2002, The
Institute of Electrical and Electronics Engineers published Standard 1584 “IEEE Guide
for Performing Arc-Flash Hazard Calculations” [6]. This guide was a direct result of
research conducted by the IEEE and was sponsored by large electrical corporations and
manufacturers. The standard provided the first complete set of guidelines for calculating
incident energy of the arc flash at the location of interest in a power distribution system.
This was important because it provided a standardized way to calculate the arc flash
hazard associated with working on energized equipment.
By utilizing these calculation methods, an engineer is able to predict the thermal
exposure at any location in an electrical system. The workers now have a guideline for
protection from electrical shock and arc flash hazard. This is important because the shock
protection protective equipment is made from specific materials to keep a person isolated
from touching the energized equipment. The arc flash hazard protective equipment is
made of materials that are designed to protect the worker from getting burned from the
thermal effects of the arc flash.
1.3 Research Objectives
New electrically critical facilities, including computer data centers and hospitals,
are electrically designed and constructed to have a continuous energy source. This is
accomplished by integrating the electrical utility with on-site generators and
uninterruptible power supplies. This electrical equipment must be serviced and
maintained, but de-energizing the devices is not an option. The application of arc flash

7
mitigation techniques after construction can lead to additional equipment and expenses.
Furthermore, there can be situations where an extremely high arc flash hazard is
unavoidable. Implementing design strategies as described in this paper can minimize the
arc flash hazard exposure at many locations throughout the electrical distribution system.
This research focuses on the challenges of minimizing the arc flash hazard
exposure to electricians working on energized electrical equipment in 600 volt and below
power systems. Although the electrical systems analyzed in this dissertation are at 480
volts, the 600 volt rating is important to the applicable standards for the voltage class.
This work looks at the electrical system design requirements that are currently acceptable
by the NEC and how this can expose electrical workers to a high arc flash hazard. These
systems will be modeled using an industrial grade software package, which implements
arc flash hazard calculations per IEEE-1584. Recommended design changes that include
NEC and NFPA 70E requirements will be implemented and the systems will be re-
calculated to show significant decrease of the arc flash exposure.
It is the researcher’s hypothesis that NEC acceptable design strategies can be
altered to include NFPA 70E concerns, therefore minimizing Arc Flash Hazard exposure.
This is specifically in the areas of:
1. When applying the National Electric Code, Article 230, Part VI, always
specify a single main circuit breaker for building shutdown.
2. At the electrical service entrance the design shall specify enclosed low voltage
power circuit breakers in place of fused disconnects.
3. Specify adjustable low voltage power circuit Breakers for protection of step-
down transformers rated above 125kVA.

8
4. Step-Down Transformers larger than 125kVA shall be replaced with a design
having two smaller kVA transformers.
1.4 Contribution of the Dissertation
The design techniques recommended in this dissertation are a result of 21 years of
experience as a licensed professional engineer focusing on designing electrical systems
and performing arc flash hazard studies. The outcome of this study can influence future
design techniques that would consider NEC, NFPA 70E, and Arc-Flash hazard exposure.
If the resulting information is transferred to a training environment for electrical system
design engineers it can be implemented into their future projects. The implementation of
these results can produce electrical systems with lower arc flash hazard at maintainable
areas of a building electrical system.
1.5 Outline of the Dissertation
This dissertation consists of 6 chapters, with the first chapter introducing the
development of electrical safety codes with regard to electrical shock and arc flash
hazard. The history and development of the NEC, NFPA-70E, and IEEE-1584 are briefly
discussed. The focus for conducting this research along with the hypothesis and goals are
described.
Chapter 2 will present the basics of power system protection from a time versus
current analysis. There will be discussion of electrical current overloads and short
circuits. The principles of electrical circuit breaker devices and fuses will be described.
The different types of circuit breakers and their specifications will be discussed.

9
Chapter 3 presents an overview of electrical power system studies for 480 volt
power systems. The process of a fault current calculation will be conceptually described
to show the purpose of the study, modeling approach, and the software implementation.
The utility source and its contribution into the system will be presented. The protective
device coordination will be shown and the circuit breaker options will be discussed. The
arc flash hazard analysis will be presented and shown how it applies to 480 volt systems.
Chapter 4 will explore existing methods, techniques and devices aimed at
mitigating the arc flash hazard exposure. These devices and techniques will be computer
simulated to show the arc flash hazard before and after mitigation techniques are applied.
The implemented equipment and techniques will show a decreased arc flash hazard
incident energy and category.
Chapter 5 will present the impact of arc flash hazard analysis on existing mission
critical facilities. The existing electrical systems will be described along with objectives
for the arc flash hazard analysis. The study will be performed by using computer
simulation software and the results discussed. Methods for mitigating the arc flash hazard
will be recommended and the system will be reevaluated by the software to show a
decrease in the arc flash hazard.
Chapter 6 will highlight design methods to help mitigate arc flash hazard
exposure. Each case will show part of a 480 volt electrical system that is in compliance
with the NEC and acceptable for an electrical building permit. The arc flash analysis will
be performed on the system giving an incident energy level and hazard category.
Recommendations to the system design will be made and a recalculation of the arc flash

10
hazard will be performed. The implemented design recommendations will show a
decreased arc flash hazard incident energy and category.
Chapter 7 will discuss the conclusions and future work. The results of
implementing the recommended design techniques will be reviewed. Guidelines for
future work will be discussed.

11
2. POWER SYSTEM PROTECTION
In theory, the ideal electrical system receives power from the utility distribution
system and performs exactly as the customer demands with no interruptions, voltage
sags, or outages. This would allow for a system to be designed for amperage demand
without having any concern about short term electrical transients. The practical use and
maturation of an electrical system can involve many system abnormalities, such as
overloads and short circuits. The response by the system under these transient conditions
determines the functionality, viability, safety, and long term usefulness of the electrical
distribution equipment. Power system protection is part of the design, planning and
operation of an electrical system. Some of the main objectives of the protection system
are to isolate short circuits and prevent equipment failure due to overload. This is
accomplished by detecting electrical system abnormalities with the proper application of
circuit breakers and fuses.
2.1 Electrical System Abnormalities
There are a multitude of electrical system abnormalities that can occur at any
time. Some of these disturbances are voltage related and others are current based. The
voltage related electrical system disturbances are classified as power quality issues and
usually result in the alteration of the ideal sine wave. This is an important issue because
newer generation load equipment, with microprocessor-based controls and power

12
electronic devices, is more sensitive to power quality variations than equipment used in
the past [36]. The term power quality is an umbrella concept for a multitude of individual
types of power system disturbances [36]. Some of these voltage based disturbances are
interruptions, sags, swells, under-voltages, overvoltage, voltage imbalance, and
harmonics. From a protection standpoint, these voltage disturbances are classified
separately from current disturbances.
Although voltage and current disturbances can be related through causation,
current disturbances are primarily defined by the presence of an overcurrent. The
National Electrical Code defines an overcurrent as any current in excess of the rated
current of equipment or the ampacity of a conductor. It may result from overload, short
circuit, or ground fault [17]. Therefore, from a protection standpoint, the main objective
is to avoid exposing the devices to overload conditions and isolate the equipment from
faults and short circuits.
2.2 Electrical System Overloads
One of the main objectives for the electrical protection system is to prevent
equipment failure caused by overload. Overload is defined by the National Electrical
Code as the operation of equipment in excess of normal, full-load rating, or of a
conductor in excess of rated ampacity that, when it persists for a sufficient length of time,
would cause damage or dangerous overheating. A fault, such as a short circuit or ground
fault, is not an overload [17]. Therefore, an overload occurs when the system is properly
intact, but the use of the system is not per design. An example of overload is when two
1500 watt hair dryers are attached to receptacles on the same 120 volt, 20 amp circuit. In

13
this case, the 3000 watts equates to 25 amps thus overloading the 20 amp conductor and
circuit breaker.
2.3 Electrical System Faults
A fault occurs when the use of the system is per design, but the system is not
properly intact. Some causes of faults can include weather, insulation failure, wildlife,
vehicle crashes, and vandalism. When this unintentional electrical path is created, the
system creates undesirable current paths that must be accounted for. The result is a
collapse in voltage and an extreme inrush of current toward the fault location.
During a fault, the current from all parts of the electrical system flow in the
direction of the short circuit. This fault current level can range from 6.5kA amps at a
13.2kV substation, to near 100kA at a 480 volt paralleled system. Fault levels are known
to decrease with distance from the source due to system impedance [38]. It is important to
protect the system from adverse effects that can occur from large magnitude currents.
Power system faults may be categorized as one of four types: single line-to-ground, line-
to-line, double line-to-ground, and balanced three-phase [37]. Line-to-line faults are
approximately 87% of three–phase fault currents. Line-to-ground faults can range from a
few percent to possibly 125% of the three-phase value. In industrial systems, however,
line-to-ground fault currents higher than the three-phase value are rare [49]. It is widely
recognized that line-to-line faults in equipment or cables quickly escalate into three-phase
faults [6]. In an industrial system, the three-phase fault condition is frequently the only
one considered, since this type of fault generally results in maximum current [49]. All
testing used in arc flash modeling was three-phase tested because three-phase arcs

14
produce the greatest possible arc-flash in ac equipment. Therefore, this project will focus
only on three-phase balanced faults.
It is convenient to analyze fault current as an asymmetrical waveform consisting
of a symmetrical AC wave superimposed on a DC current [12]. The resulting waveform
is shown to have an original peak value several magnitudes above the pre-fault conditions
and is asymmetrically shaped from the x-axis. The peak value occurring during the first
half cycle of the fault is known as the Available Fault Current (AFC). This can be
graphically represented as shown in Figure 2.1.
v(t) = voltage waveform
iac(t) = original current waveform before fault occurs
idc(t) = DC component of the fault
i(t) = fault current waveform
Figure 2.1: Fault Current Waveform Profile
At the moment of initiation of a fault, the fault current wave i(t) is a combination
of the original sine wave iac(t) and the DC component idc(t). The peak magnitude of i(t)
can be multiples higher than the original current, depending on system conditions such as
power factor. The magnitude decays as a result of the DC exponential, which is a
resultant of the system reactance and resistance known as the X/R ratio.

15
2.4 Circuit Breakers
Low voltage circuit protective devices include Molded Case Circuit Breakers,
Low-Voltage Power Circuit Breakers, and insulated Case Circuit Breakers [42]. A circuit
breaker is an electrical device designed to open an energized circuit under loaded
conditions. All circuit breakers have the primary function of protecting the circuit
conductors by detecting and interrupting over-currents [43]. The opening of an electrical
circuit is in response to transient current conditions, such as an overload or fault in the
system. Circuit breakers are rated by available interrupting capacity and rated continuous
current. The interrupting capacity of a circuit breaker is the maximum current a circuit
breaker is rated to safely interrupt at a specific voltage. This short-circuit current rating is
normally expressed in rms symmetrical amperes and is specified by current magnitude
only [39]. The continuous current rating is the amount of current a circuit breaker can
carry until it reaches overload conditions and opens the circuit.
Until the late 1960s the only circuit breaker trip units available were thermal-
magnetic molded case circuit breaker designs (MCCB) [39]. These circuit breakers were
designed to be bolted on or snapped-into standard breaker panels. These devices are
constructed in a solid case that is not capable of being disassembled for maintenance and
repair.
The magnetic trip element is often referred to as the instantaneous trip time and
reacts quickly in response to high level short circuit currents. The thermal element is
typically some type of bi-metal that expands due to the heat in a circuit caused by current
at overload that is less than the magnetic pickup threshold. The element then trips the
MCCB after a time delay.

16
Circuit breaker trip curves are analyzed graphically in order to understand the
time versus current application of the device. When displayed in this manner the plot is
referred to as a time current curve (TCC). A typical time TCC for a 480 volt, 100 amp,
non-adjustable thermal magnetic MCCB is displayed in Figure 2.2. Here it is shown that
the thermal element is 100 amps at 1000 seconds and the instantaneous sensor is at less
than 0.02 seconds for short circuit currents greater than 2500 amps. For a fault current
level in the range of 900-1900 amps, the interrupting time is shown to be greater than one
second.

17
Figure 2.2: TCC Curve for 480 volt, 100 amp MCCB
Thermal magnetic MCCB’s are also available with an adjustable magnetic trip
setting. This is very useful in situations where the available fault current is low and quick
interruption is important. Figure 2.3 shows a TCC for this type of circuit breaker. This
plot introduces the flexibility available for the instantaneous trip setting when using an
adjustable breaker.
0.5 1 10 100 1K 10K0.01
0.10
1
10
100
1000
CURRENT IN AMPERES
2.2.tcc Ref. Voltage: 480V Current in Amps x 1
TIM
E IN
SE
CO
ND
S100A MCCB100A MCCB
Thermal Overload Element
Instantaneous Trip Element
Thermal Overload Element
Instantaneous Trip Element

18
Figure 2.3: TCC Curve for 480volt, 100 amp MCCB with Low and High Settings
The next available circuit breakers manufactured in the late 1960’s were the low-
voltage power circuit breakers (LVPSBs). These circuit breakers were designed to be
rack mounted in switchgear, have larger frame sizes and higher current ratings than
MCCBs. These devices are maintainable and can be disassembled for cleaning of
contacts and replacing parts.
The LVPCBs have thermal-magnetic trip units that respond to overloads in a
similar manner as MCCBs: however, LVPCBs had a 30-cycle short time current rating
consistent with ANSI standards [41]. This short time current rating allows for a second
0.5 1 10 100 1K 10K0.01
0.10
1
10
100
1000
CURRENT IN AMPERES
2.3.tcc Ref. Voltage: 480V Current in Amps x 1
TIM
E IN
SE
CO
ND
S
100A MCCB-LOW MAG
100A MCCB-HI MAG
100A MCCB-LOW MAG
100A MCCB-HI MAG

19
breaker adjustment between the magnetic pickup and the long time sensor. These settings
are commonly referred to as Long-Time (L), Short-Time (S) and Instantaneous (I), hence
calling the breaker an LSI protective device. A TCC for a LVPCB is shown in Figure 2.4.
Figure 2.4: TCC Curve Showing 480 volt, 100 ampere LVPCB
The LVBCB has five adjustments in three time domains that allow for a circuit breaker
curve to be custom fitted for the application.
1. Long Time Pickup is set at the overload amperage.
0.5 1 10 100 1K 10K0.01
0.10
1
10
100
1000
CURRENT IN AMPERES
2.4.tcc Ref. Voltage: 480V Current in Amps x 1
TIM
E IN
SE
CO
ND
S
100A LVPCB100A LVPCB
Long TIme Pick-Up
Instantaneous setting 8x rating
Short time setting 2x rating
30-cycle Short-Time delay
Long TIme Pick-Up
Instantaneous setting 8x rating
Short time setting 2x rating
30-cycle Short-Time delay

20
2. Long Time Delay allows the pickup to be postponed.
3. Short Time Pickup is the trip amperage after a delay time.
4. Short Time Delay postpones the short time pickup to a designated time.
5. Instantaneous pickup is the magnetic setting for immediate response.
The TCC for two 100 ampere LVPCBs showing lowest and highest settings at all
pickups and time delays are displayed in Figure 2.5.
Figure 2.5: TCC Curve for 480 volt, 100 ampere LVPCB with LSI Settings
0.5 1 10 100 1K 10K0.01
0.10
1
10
100
1000
CURRENT IN AMPERES
2.5.tcc Ref. Voltage: 480V Current in Amps x 1
TIM
E IN
SE
CO
ND
S
100A LVPCB-LOW
100A LVPCB-HI
100A LVPCB-LOW
100A LVPCB-HI
INST-LO
INST-HI
Short Time Pick-up - LO
SHort Time Delay - LO
Short Time Delay - HI
Long Time Pick-up - 100A
Long Time Delay - LO
Long Time Delay - HI
INST-LO
INST-HI
Short Time Pick-up - LO
SHort Time Delay - LO
Short Time Delay - HI
Long Time Pick-up - 100A
Long Time Delay - LO
Long Time Delay - HI

21
The Insulated Case Circuit Breaker (ICCB) was introduced in the mid-1970s.
These devices were specially designed molded case circuit breakers that included some of
the low-voltage power circuit breaker features [39]. These features included short time
current duty cycles and a stored energy mechanism [43]. The ICCB had an instantaneous
trip element that was capable of being set at a much higher trip level than the MCCB,
which allowed some short time current ratings to be achieved.
2.5 Circuit Breaker Testing
In North America, low-voltage circuit breakers are designed and tested in
accordance with ANSI/UL standard 1066, which refers to a series of applicable ANSI
C37 standards [41,44,45,46]. Insulated case and molded case circuit breakers are
designed and tested in accordance with UL standard 489 [40]. The UL standards 1066
and 489 consist of a series of tests and construction for required ratings, trip units,
overloads, endurance, short-time current, temperature rise, and dielectric withstand. Each
standard is specific in the guidelines for an acceptable device. One of the particular
testing parameters is the X/R ratio or dc offset decay. All low voltage protective devices
are tested at pre-determined X/R ratios per the table below [17].
Table 2.1 Test X/R Ratios for Protective Devices
DEVICE Test X/R ratio
Low Voltage Power Circuit Breakers 6.6
Molded Case Circuit Breakers rated less than 10k AIC 1.7
Molded Case Circuit Breakers rated between than 10k & 20k AIC 3.2
Fuses, Insulated Case Circuit Breakers, Molded Case Circuit
Breakers rated greater then 20k AIC
4.9

22
Outside of the general construction and withstand requirements, the main
application for this project is the adjustable setting of a circuit breaker that primarily
differs in the short-time. The low-voltage power circuit breakers are manufactured to
meet the testing requirements of UL 1066 [43]. This testing requirement is different than
the UL 489 standard, mainly because the low-voltage power circuit breaker is required to
carry fault current for two 0.5 second periods and the molded case device does not have a
short time requirement.
2.6 Fuses
The term fuse is defined by ANSI/IEEE Std 100-2001 as “an overcurrent
protective device with a circuit-opening fusible part that is heated and severed by the
passage of overcurrent through it” [50]. Fuses were first introduced in the 1880s and were
used for the protection of lighting installations. They were located adjacent to lamps and
were to protect them from excess currents caused by source-voltage fluctuations [47].
Over the years, this device has improved its uses to include many different applications
throughout the electrical system. The fuse has a wide range of protection applications
from micro-electronic components up to high-voltage power system protection.
The fuses used in 480 volt electrical systems are intended to protect the system
from over-loads and fault currents. The basic operation of a fuse is a simple thermal
process; the passage of excess currents through specifically designed fuse elements
causes them to melt, and so isolate the faulty circuit [47]. The interrupting capability is
altered by the fuse element and the filler in the fuse cartridge.

23
The fuse has no moving parts and, therefore, can be extremely fast acting upon
the presence of high fault currents. The actuation of a fuse represents the end of its useful
life and therefore the reliability and accuracy is maintained when new fuses are inserted
into the circuit. The lack of moving parts leaves no ability to adjust the time domains of
the fuse, which can be costly when trying to protect a system against fault currents. The
TCC for a fuse is shown in Figure 2.6. The fuse curve shows the interrupting times for
various levels of overcurrent. These interruptions can occur over a short range of time as
shown by the minimum melt characteristic, which is the time the fuse begins to melt, and
the total clearing characteristic, which is the complete interruption of the current.

24
Figure 2.6: TCC for 480 volt, 100 ampere Fuse
The TCC for the 100 ampere fuse has similar inverse time characteristics as the
circuit breakers. This particular device is shown to have 100 amperes of over-load
protection beyond 100 seconds. For a short circuit of 2000 amperes, this device interrupts
at approximately 0.05 seconds.
0.5 1 10 100 1K 10K0.01
0.10
1
10
100
1000
CURRENT IN AMPERES
2.6.tcc Ref. Voltage: 480V Current in Amps x 1
TIM
E IN
SE
CO
ND
S
PD-100A FUSEPD-100A FUSE
Minimum Melt Characteristic
Total Clearing Characterisitc
Minimum Melt Characteristic
Total Clearing Characterisitc

25
3. ELECTRICAL POWER SYSTEM STUDIES
The electrical system must be studied with the anticipation of transients such as
overloads and faults. This is accomplished by implementing a fault current analysis,
protective device time current coordination study, and an arc flash hazard analysis.
This chapter is an overview of electrical power system studies for 480 volt power
systems. The process of a fault current calculation will be conceptually described to show
the purpose of the study and the software application. The utility source and its
contribution to the system will be presented. The protective device coordination will be
shown and the circuit breaker selections will be discussed. The arc flash hazard analysis
will be presented and the resulting personal protective equipment requirements will be
discussed.
3.1 Fault Current Analysis
The Fault Current Analysis or Short Circuit Study is an analysis of the electrical
system under fault conditions. These faults can have many causes from adverse weather
to aged insulation on conductors, to varmints chewing on the equipment. The result is a
sudden electrical path from any phase to ground or any phase to another phase. In most
cases these short circuits migrate to a three-phase fault and are studied from that
perspective.

26
Analyzing fault current on a theoretical basis is accomplished by studying the
response of the series R-L circuit shown in Figure 3.1 below.
Figure 3.1: Series RL Circuit
When the switch SW closes at time t=0, the circuit will react in the same manner
as a balanced three-phase fault with zero impedance between the phases [12]. Writing
Kirchoff’s Voltage Law for the circuit when t >0:
�������� � ��� � √2� sin��� � �� (3.1)
Solving this results in the fault current i(t):
��� � √��� �sin����∝ ��� � sin�� � �����/� (3.2)
i(t) = iac(t) - idc(t) (3.3)
Z = � � ��!�� (3.4)
� = �"#�$ %�& � �"#�$ '& (3.5)
( � �& � '%& � '�)*& +�, (3.6)
To find i(t) at its greatest value we allow α =(θ-π/2), then:

27
i(t) = √2-./�sin 0�� � )�1 � ��
234 (3.7)
The main purpose of the Short Circuit Study is to determine the available fault
current (AFC) at locations throughout the system under fault conditions. The AFC is then
compared to equipment withstand ratings and available interrupting capacity (AIC) of
protective devices. Devices with a withstand rating do not interrupt fault current but must
“ride through” a fault without damage imposed by the magnetic forces resulting from the
large currents. Therefore, each panel-board must have a withstand rating greater than the
AFC calculated at its bus. Each protective device must have an AIC greater than the AFC
in order to be capable of interrupting the maximum fault current seen at its contacts. If a
breaker or fuse is not rated to handle the maximum available fault current it might see,
the device may not operate properly and its internal parts could fuse together or buckle
under the destructive stresses of a fault condition, which can cause serious injury and/or
property damage [11].
The AFC found at any point in an electrical system is a result of the fault
contributions forced into the system and the impedances in their path to the fault location.
The contributions toward the system consist of the utility, generators, and rotating
machinery. The impedances throughout the system are supplied by conductors and
transformers. An example of a basic electrical system with a faulted bus can be displayed
as one utility serving one main circuit breaker switchboard shown in the partial one-line
diagram in Figure 3.2.
28
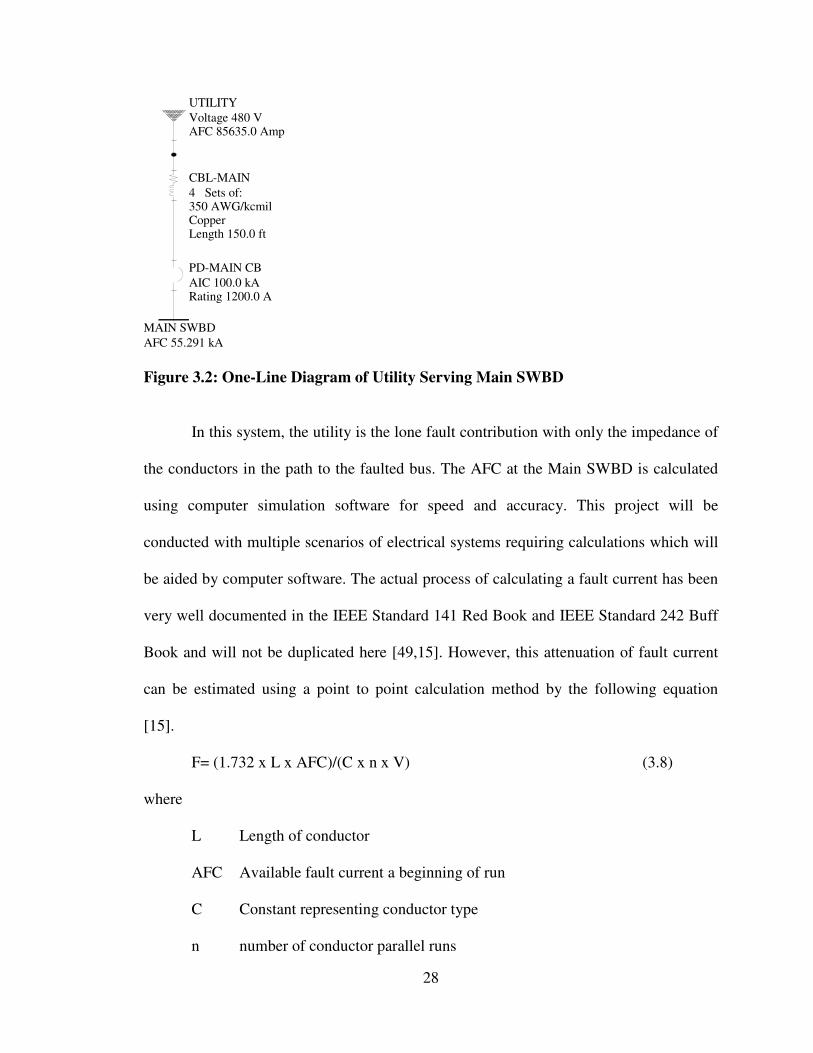
Figure 3.2: One-Line Diagram of Utility Serving Main SWBD
In this system, the utility is the lone fault contribution with only the impedance of
the conductors in the path to the faulted bus. The AFC at the Main SWBD is calculated
using computer simulation software for speed and accuracy. This project will be
conducted with multiple scenarios of electrical systems requiring calculations which will
be aided by computer software. The actual process of calculating a fault current has been
very well documented in the IEEE Standard 141 Red Book and IEEE Standard 242 Buff
Book and will not be duplicated here [49,15]. However, this attenuation of fault current
can be estimated using a point to point calculation method by the following equation
[15].
F= (1.732 x L x AFC)/(C x n x V) (3.8)
where
L Length of conductor
AFC Available fault current a beginning of run
C Constant representing conductor type
n number of conductor parallel runs
UTILITY
Voltage 480 VAFC 85635.0 Amps
CBL-MAIN
4 Sets of:350 AWG/kcmilCopperLength 150.0 ft
PD-MAIN CB
AIC 100.0 kARating 1200.0 A
MAIN SWBD
AFC 55.291 kA

29
V Voltage line to line
The AFC at the service entrance is a vital part of the calculation and is readily
provided by the local electrical utility. Historically, this value is a very conservative large
figure with the intent of evaluating the system during a worst case high fault current
scenario. Therefore, the AFC is typically given as an infinite bus calculation that depends
on the service transformer size and impedance. This results in the highest possible fault
current that can be seen on the service transformer secondary terminals. The simple form
of this calculation, based on infinite bus theory is indicated below [11]:
1. Step One: Calculate the full load current at the secondary of the transformer.
FLA (secondary) = 5�6�7�89.:;�5������√7 (3.9)
2. Step Two: Calculate the Available Fault Current at the secondary of the
transformer.
AFC (secondary) = <�6�:;/=>�.?@�A$BB
%� (3.10)
For a 13.2kV-480V, 1500kVA transformer with impedance (Z) = 5%, the resulting
infinite bus calculation for AFC = 36,085 amps.
The idea of the infinite bus value being a conservatively high AFC can be tested
as follows. Given the primary side distribution voltage of the 1500kVA transformer at a
typical 13.2kV we will simulate the secondary AFC with a range of primary side AFC
values. It is shown in Figure 3.3 and Table 3.1 that even for very high primary side AFC,
the secondary AFC does not exceed the infinite bus value. Therefore, using the infinite
bus method to calculate AFC is acceptable for evaluating AIC and withstand ratings of
equipment.

30
Figure 3.3: Utility Contribution One-Lines
Table 3.1 Simulation Results for 1500kVA Transformer with Z=5%
Primary Side Contribution Transformer Secondary AFC
5,000 amps 25,553 amps
25,000 amps 30,010 amps
65,000 amps 30,838 amps
95,000 amps 31,006 amps
UTILITY-1
Voltage 13200 VAFC 5000.0 Amps
CBL-MAIN-1
4 Sets of:350 AWG/kcmilCopperLength 150.0 ft
S
P XF-UTILITY-1
Nominal kVA 1500.0 kVAPrimary 13200 VSecondary 480 V
XF-UTILITY-1 secondary
AFC 25.553 kA
PD-MAIN-1
AIC 100.0 kARating 1200.0 A
MAIN SWBD-1
Withstand 100.0 kAAFC 22.036 kA
UTILITY-2
Voltage 13200 VAFC 25000.0 Amps
CBL-MAIN-2
4 Sets of:350 AWG/kcmilCopperLength 150.0 ft
S
P XF-UTILITY-2
Nominal kVA 1500.0 kVAPrimary 13200 VSecondary 480 V
XF-UTILITY-2 secondary
AFC 30.010 kA
PD-MAIN-2
AIC 100.0 kARating 1200.0 A
MAIN SWBD-2
Withstand 100.0 kAAFC 25.241 kA
UTILITY-3
Voltage 13200 VAFC 65000.0 Amps
CBL-MAIN-3
4 Sets of:350 AWG/kcmilCopperLength 150.0 ft
S
P XF-UTILITY-3
Nominal kVA 1500.0 kVAPrimary 13200 VSecondary 480 V
XF-UTILITY-3 secondary
AFC 30.838 kA
PD-MAIN-3
AIC 100.0 kARating 1200.0 A
MAIN SWBD-3
Withstand 100.0 kAAFC 25.818 kA
UTILITY-4
Voltage 13200 VAFC 95000.0 Amps
CBL-MAIN-4
4 Sets of:350 AWG/kcmilCopperLength 150.0 ft
S
P XF-UTILITY-4
Nominal kVA 1500.0 kVAPrimary 13200 VSecondary 480 V
XF-UTILITY-4 secondary
AFC 31.006 kA
PD-MAIN-4
AIC 100.0 kARating 1200.0 A
MAIN SWBD-4
Withstand 100.0 kAAFC 25.935 kA

31
The peak value of the first cycle is a result of the DC exponential decay value.
The rate of DC exponential decay occurs as a result of the system impedance properties
when looking from the fault back to the short circuit contribution. The DC component of
the current normally decays rapidly and reaches an insignificant value within 0.1 second
in most power systems [12]. The conductor and transformer properties of resistance (R)
and reactance (X) in calculation with the utility source system properties account for this
value. This value is known as the X/R ratio and varies throughout the system depending
on inherent properties. The protective devices must be measured against this value as
well as the AFC.
Right after a fault occurs the current is no longer a sine wave. The waveform can
now be represented as the combination of a sine wave and a decaying exponential. Figure
3.4 displays this waveform in a graphical setting.
Figure 3.4: Fault Current Waveform
At the moment of initiation of a fault the ac current wave, which is normally
symmetrical about the zero axis, BX is offset by some value, creating a waveform which
is symmetrical about another axis, CC’ [12]. The degree of the shifting is a result of the

32
circuit parameters and the location of the waveform when the short circuit was initiated.
These system parameters also determine the rate of decay of the offset which is referred
to as the DC current.
There are some important measurements shown in Figure 3.4. The value from
BA, Imc represents the asymmetrical peak value of the short circuit. This is termed
asymmetrical because the waveform is no longer symmetrical about the time axis. This is
the maximum instantaneous current in the major loop of the first cycle of short-circuit
current. The rms symmetrical value of the short circuit current at any point in time, such
as EE’, is the rms value of the ac portion of the current wave. The value of the rms ac is
equal to the ac current divided by the square root of two, and is shown graphically by the
distance from CC’ to DD’. The rms asymmetrical value of the short circuit current is the
rms value of the combined ac and dc waves, and is calculated by the formula [12]:
- � D�E6F�G� � �-HI�� (3.11)
These different parameters and nomenclature of the sine wave are important when
equipment is manufactured to meet various standards and specifications. The
specification of the standards can require performance and testing based on certain
parameters of the short circuit current.
The actual waveform of the asymmetrical fault current is hard to predict
depending on exact moment during the voltage cycle the fault occurs. However, the
largest asymmetrical fault current occurs when the fault happens at a point when the
voltage is zero [51]. Then, the asymmetrical fault current depends only on the X/R Ratio
and the magnitude of the symmetrical fault current. Figure 3.5 shows how the ratio of the
peak asymmetrical current to RMS symmetrical current varies with the X/R Ratio [52].

33
Figure 3.5: Peak Asymmetrical Current versus X/R Ratio
The devices manufactured for 480 volt systems have AIC and withstand ratings
specified in RMS amperes. Furthermore, the AFC is calculated as an RMS value for
consistency in equipment qualification and approval. Even though low voltage devices
do not have asymmetrical ratings, if the test X/R Ratio and symmetrical current rating are
known, the maximum asymmetrical fault current rating can be achieved from Figure 3.5.
The X/R value of the system is important because it determines the value of the
fault current at 3-5 cycles after the fault which corresponds to the moment in time when
the protective device will activate to isolate the fault. The higher the X/R ratio, the longer
the DC component exists [16]. If the system X/R is greater than the protective device
tested X/R, then further investigation is required to determine if the device is acceptable
for use.
When the system X/R ratio exceeds the protective device tested X/R the AIC of
the protective device shall be de-rated per the following multiplication factor [51].
(3.12)

34
If the resulting de-rated AIC is greater than the AFC, then the device is properly
rated for installation in the system at the specified location.
All low voltage protective devices are tested at pre-determined X/R ratios per the
table below [51].
Table 3.2 Test X/R Ratios for Protective Devices
DEVICE Test X/R Ratio
Low Voltage Power Circuit Breakers 6.6
Molded Case Circuit Breakers rated less than 10k AIC 1.7
Molded Case Circuit Breakers rated between than 10k & 20k AIC 3.2
Fuses, Insulated Case Circuit Breakers, Molded Case Circuit
Breakers rated greater then 20k AIC
4.9
The short circuit study qualifies the equipment by measuring it against two
parameters:
1. The AIC rating of the equipment against the calculated system AFC.
2. The X/R ratio at which the device was tested against the calculated X/R ratio
of the system.
If both of these requirements are met, then the equipment is suitable for
installation in the system at the location of calculation. Figure 3.6 shows a partial one-line
diagram with simulation results for AFC and X/R Ratio. The Figure shows that the circuit
breaker PD-MAIN CB has an AIC greater than the system AFC and a test X/R Ratio
greater than the system X/R Ration. The panel MAIN SWBD has a withstand rating
greater than the system AFC and a test X/R Ratio greater than the system X/R ratio.

35
Therefore, both the circuit breaker and switchboard are sufficient for operating at this
location within this electrical system.
Figure 3.6: Partial One-Line Diagram Showing Fault Current Values and X/R
Ratios
3.2 Protective Device Selective Coordination
Selective coordination first became a requirement in the 1996 National Electrical
Code (NEC) in Article 620, “Elevators, Dumbwaiters, Escalators, Moving Walks,
Wheelchair Lifts, and Stairway Chair Lifts” [34]. Section 620.62 required that protective
devices in each disconnect be selectively coordinated with the supply side overcurrent
protective devices, where more than one driving machine’s disconnecting means is
supplied by a single feeder. The NEC further expanded the requirement for selective
coordination in 2005 as part of Article 700, “Emergency System”, and Article 701 for
UTILITY
Voltage 480 VAFC 85635.0 Amps
CBL-MAIN
4 Sets of:350 AWG/kcmilCopperLength 150.0 ft
PD-MAIN CB
AIC 100.0 kATest X/R 4.899
MAIN SWBD
Withstand 200.0 kAAFC 55.291 kATest X/R 6.600System X/R Ratio 2.630

36
“Legally Required Standby Systems” in Sections 700.27 and 701.18 entitled
“Coordination” [33]. The 2005 NEC defines selective coordination as “Localization of an
overcurrent condition to restrict outages to the circuit or equipment affected,
accomplished by the choice of overcurrent protective devices and their ratings or
settings” [17]. These additions to the code expanded the selective coordination
requirement to ‘Essential electrical systems of Health Care Facilities”. The 2008 NEC
added the requirement for selective coordination into the new Article 708, “Critical
Operations Power Systems (COPS)” [35]. Section 708.54, “Coordination”, requires that
COPS overcurrent devices shall be selectively coordinated with all supply side
overcurrent devices [35].
Protective device selective coordination is the response of circuit breakers and
fuses during a transient, with the intent of isolating the faulted part of the system from
service. The goal is to minimize the damage to equipment and personnel in nearby
locations, while maintaining electrical service in parallel branches. This is particularly
important in mission critical systems that this project is based on. It is stated in the IEEE
Buff Book that, “Coordination is a basic ingredient of a well-designed electrical
distribution system and is mandatory in certain healthcare and continuous process
industrial systems” [15]. This coordination must be done for all protective devices in a
series from the sources to the loads. When circuit breakers are properly set and installed,
a fault at any location has minimal effect on nearby panels and feeders. A one line
diagram of an electrical system is shown in Figure 3.7. If a fault occurred at Motor-1 then
proper selective coordination would exist if circuit breaker PD-Motor-1 opened before
PD-Panel-C or any device further upstream.

37
Figure 3.7: One-Line Diagram of a Two Motor Electrical System
The protective devices responsible for system selective coordination consist of
fuses and circuit breakers. These devices have a profile of current versus time that they
will allow to pass before activating that is referred to as a time-current curve (TCC).
Figure 3.8 shows a TCC for circuit breaker PD-Breaker and fuse PD-Fuse.
UTILITY
CBL-MAIN
PD-MAIN
MDP
PD-PANEL-B
CBL-PNL-B
PANEL-B
PD-PANEL-C
CBL-PNL-C
PANEL-C
PD-MOTOR-1
CBL-MOTOR-1
MOTOR-1
PD-PANEL-D
CBL-PNL-D
PANEL-D
PD-PANEL-E
CBL-PNL-E
PANEL-E
PD-MOTOR-2
CBL-MOTOR-2
MOTOR-2

38
Figure 3.8: Time Current Curves for a Circuit Breaker and a Fuse
Since the reference voltage is 480 volt and the current is shown at times 10, a 6kA
fault current would be cleared by this circuit breaker at 0.015 seconds and by this fuse at
0.9 seconds.
The TCCs for the system above with proper selective coordination is shown
below in Figure 3.9. This plot shows all protective devices in the series from the Utility
source to Motor-1.
0.5 1 10 100 1K 10K0.01
0.10
1
10
100
1000
CURRENT IN AMPERES
bkr-fuse.tcc Ref. Voltage: 480V Current in Amps x 10
TIM
E IN
SE
CO
ND
S
PD-Fuse
PD-Breaker
PD-Fuse
PD-Breaker

39
Figure 3.9: Time Current Curves for a Selectively Coordinated System
It is clear that the breaker curves do not touch or overlap each other and therefore
proper selective coordination exists. The TCC for the system above is shown with a lack
of selective coordination in Figure 3.10.
0.5 1 10 100 1K 10K0.01
0.10
1
10
100
1000
CURRENT IN AMPERES
3.9.tcc Ref. Voltage: 480V Current in Amps x 1
TIM
E IN
SE
CO
ND
SPD-PANEL-C
MOTOR-1
PD-MOTOR-1
PD-PANEL-B
PD-MAIN
PD-PANEL-C
MOTOR-1
PD-MOTOR-1
PD-PANEL-B
PD-MAIN

40
Figure 3.10: Time Current Curves with a Lack of Selective Coordination
The overlap of breaker curves PD-Main and PD- Panel B is evidence that
selective coordination does not exist. If a fault of 2800 amps were to occur on Panel B,
then PD-Main would open before PD-Panel B. This would cause the feeder to Motor-2 to
lose power and our goal of isolating the fault without disturbing nearby devices would
not be achieved.
Selective coordination is achieved by properly selecting and setting the protective
devices. Actually, all electrical systems have a degree or some level of selective
0.5 1 10 100 1K 10K0.01
0.10
1
10
100
1000
CURRENT IN AMPERES
3.10.tcc Ref. Voltage: 480V Current in Amps x 1
TIM
E IN
SE
CO
ND
S
PD-PANEL-C
MOTOR-1
PD-MOTOR-1
PD-PANEL-B
PD-MAIN
PD-PANEL-C
MOTOR-1
PD-MOTOR-1
PD-PANEL-B
PD-MAIN
Lack of Selective CoordinationLack of Selective Coordination

41
coordination because the overcurrent protective devices closest to the source have higher
ratings than the downstream devices [18]. This project focuses on coordination with
circuit breakers because they can contain adjustable settings, where fuses do not. The
adjustable features in a circuit breaker are divided by time segments. The Long Time
(LT) is the setting of the breaker for overload conditions and is referred to as the
amperage rating. This is generally in the time period beyond 60 seconds and reacts
similarly to a thermal element. The Short Time (ST) is the setting for the breaker
typically 0.5 seconds until the long time segment. This transitional period is important for
sensing low level faults that may occur due to system impedances. The Instantaneous (I)
element is the setting for the initial transient of a fault. This is often set very high to allow
for motor and transformer inrush currents in the first few cycles of start-up but not higher
than the available fault current.
Figure 3.11 shows two thermal magnetic breakers with identical Long Time
amperage ratings and an adjustable setting in the Instantaneous region only. PD-Panel-B
is set at the lowest setting Instantaneous setting and PD-Panel-D is adjusted to the highest
setting. Therefore, they have different curve locations in the Instantaneous regions, but
overlap in the Long Time domain.

42
Figure 3.11: Time Current Curves for Thermal Magnetic Breakers
Figure 3.12 shows two electronic breakers with adjustable settings in the Long
Time, Short Time, and Instantaneous regions. When a circuit breaker is specified with
this type of setting options, it is referred to as an LSI device. PD-Main is set at the proper
overload rating for Long Time and is shown at the lowest settings for Short Time and
Instantaneous. PD-M2 is also set at the proper overload rating for the Long Time but is
adjusted to the highest settings for Short Time and Instantaneous. Therefore, they have
0.5 1 10 100 1K 10K0.01
0.10
1
10
100
1000
CURRENT IN AMPERES
3.11.tcc Ref. Voltage: 480V Current in Amps x 1
TIM
E IN
SE
CO
ND
S
PD-PANEL-B
PD-PANEL-D
PD-PANEL-B
PD-PANEL-D
Instantaneous Setting = 5 x Trip
Instantaneous Setting = 10 x Trip
Instantaneous Setting = 5 x Trip
Instantaneous Setting = 10 x Trip

43
different curve locations in the Short Time and Instantaneous regions but overlap in the
Long Time. This shows that an LSI breaker can be set to protect for Long Time overload
and still have a multitude of curve locations in the Short Time and Instantaneous regions
These curve locations can be adjusted for selective coordination with upstream and
downstream protective devices. By specifying the proper breakers and adjusting the time
domains, the goal of attaining selective coordination can usually be achieved.
Figure 3.12: Time Current Curves for LSI Circuit Breakers
0.5 1 10 100 1K 10K0.01
0.10
1
10
100
1000
CURRENT IN AMPERES
3.12.tcc Ref. Voltage: 480V Current in Amps x 10
TIM
E IN
SE
CO
ND
S
PD-MAIN
PD-M2
PD-MAIN
PD-M2
Instantaneous Region
Short Time
Long Time
Instantaneous Region
Short Time
Long Time

44
3.3 Arc Flash Hazard Analysis
Performing a fault current analysis and a protective device coordination study
allows us to proceed with the arc-flash hazard analysis. An arc-flash hazard analysis
should be performed in association with or as a continuation of the short-circuit study and
protective-device coordination study [6]. The results from the short-circuit study are used
to determine the available fault current at electrical equipment locations and therefore be
able to properly specify equipment withstand ratings and interrupting capabilities. The
results from the protective-device coordination study give us information on the time the
system takes to isolate overload or fault conditions. The results of the short-circuit and
protective device evaluation are used in combination to give us the necessary information
required to perform an arc-flash hazard analysis. The results of the arc-flash hazard
analysis are used to identify the flash-protection boundary and the incident energy at
assigned working distances throughout any position or level in the electrical system [6].
IEEE-1584 defines an empirical method to calculate the incident energy from the
arc due to heat, which is responsible for the most common effect of an arc-flash: burns
[6]. This procedure does not consider other adverse effects of the arc flash such as
pressure waves, molten metal, shrapnel or flying debris. This method is applicable over a
specified range of voltages, fault currents, and frequencies. The multiple steps taken
included calculating an arcing current, using that result to calculate incident energy, then
applying that information to determine an arc flash boundary.

45
The first step in the arc-flash analysis is to calculate the arcing current. Arcing
current is a short circuit via ionized gas between one live part and the ground or another
live part [19]. Due to the arc resistance, the arc current is not the same as the available
fault current. Arcing current is always lower than the bolted fault current [20, 21].
From the IEEE-1584 empirical derived model for a system under 1000V and
having an available fault current between 700A – 106kA, the arcing current can be
calculated as follows [6]:
lg Ia= J � 0.662 lg -P* �0.0966� � 0.000526S � 0.5588�Ulg VP*W � 0.00304S�VZVP*� (3.13)
where
lg is the log10
Ia is arcing current (kA)
K is -0.153 for open configurations and
is -0.097 for box configurations
Ibf is bolted fault current for three-phase faults (kA)
V is system voltage (kV)
G is the gap between conductors, (mm)
This project analyzed the effects of the arc-flash exposure for qualified
technicians working on electrical equipment in a mission critical facility. Therefore, the
K value is -0.097 to represent the arc occurring inside an electrical panel, switchboard, or
motor control center. The system voltage V, for this project is 480 except when a step-
down transformer is inserted to achieve a 208 volt feeder. The value for G is the gap
spacing between the conductors or bus bars, which is dependent on equipment design.

46
This research studies low voltage switchgear which equates to a value of 32 from the
IEEE-1584 table below.
Table 3.3 Classes of Equipment and Typical Bus Gaps
Classes of Equipment Typical Bus Gaps (mm)
15kV switchgear 152
5kV switchgear 104
Low-voltage switchgear 32
Low-voltage MCCs and panelboards 25
Cable 13
Other Not required
This reduces the arcing current equation (3.13) to:
Ia = 10��B.B7\]B.^77_`aEbc� (3.14)
The incident energy is a value that represents the amount of thermal energy that a
person is exposed to at a given distance. Incident energy is measured in Joules per square
centimeter (J/cm2) and is defined as a watt second [6]. The calculations in this research
are performed in the English system and, therefore, reports in the conversion
nomenclature of calories per square centimeter (cal/cm2). The incident energy,
normalized for an arc duration of 0.2 seconds and a distance of 24” can be calculated
given the arcing current above and using the following formula [6].
The Incident Energy normalized is calculated as follows:
lg En = K1 + K2 + 1.081 lg Ia + 0.0011 G (3.15)
where

47
En is normalized incident energy (J/cm2)
K1 is -0.792 for open box configurations (no enclosure) and
is -0.555 for box configurations (enclosed equipment)
K2 is 0 for ungrounded and high-resistance grounded systems and
is -0.113 for grounded systems
Ia is arcing current from above
G is the gap between conductors (mm)
The constants K1 and K2 are dependent upon the physical enclosure of the circuit
breaker. Since circuit breakers are mounted in a panel-board or switchgear it is in a box
configuration. This will give a K1 value of -0.555. The systems this project will analyze
are grounded and therefore a K2 value of -0.113 is appropriate.
This reduces the normalized incident energy equation (3.15) to:
En = 10(-0.633 + 1.081logIa)
(3.16)
For a different arc duration and/or distance from the arc, the normalized incident
energy can be converted into the actual incident energy as follows [6]:
E = CfEn � �B.��(d$Be
fe ) (3.17)
where
E is incident energy (cal/cm^2)
Cf is 1.0for voltages above 1kV and
is 1.5 for voltages at or below 1kV
En is normalized incident energy
t is arcing duration in seconds
D is the distance from possible arc point to the person (mm)
x is the distance exponent

48
This equation can be reduced by verifying system parameters. This project
analyzes systems at 480 volts and therefore Cf is 1.5. The value for the distance exponent
x, is furnished by the IEEE 1584 table below.
Table 3.4 Distance x Factors
System Voltage Equipment Type Distance x Factor
208-1kV Open Air 2.000
208-1kV Switchgear 1.473
208-1kV MCC and Panels 1.641
208-1kV Cable 2.000
The value of D represents the distance from the exposed energized electrical
conductor to the maintenance personnel working on the equipment. This value is
standardized by IEEE 1584 depending on the class of the energized electrical equipment
[6].

49
Table 3.5 Classes of Equipment and Typical Working Distances
Classes of Equipment Typical working distance (inches) D
15kV switchgear 36
5 kV switchgear 36
Low-voltage switchgear 24
Low-voltage MCC’s and panel-boards 18
Cable 18
Other TBD
Using x=1.473 and D = 18”, reduces the incident energy equation (3.16) to:
E = 2.295 En(t/0.2) (3.18)
Equations 3.14, 3.16, and 3.18 may now be combined into one equation which expresses
the incident energy E as a function on Ibf and t, as follows [22]:
E = 2.295 {10(-0.670 + 0.901 log Ibf
)} (t/0.2) (3.19)
Note that (3.19) is only valid for the assumptions made above, which are made for
a power circuit breaker in an electrical system analyzed by this project (i.e., a solidly
grounded 480 volt system, a circuit breaker mounted in a low-voltage switchgear, and at
a working distance of 18”).
The arc-flash hazard analysis provides important information that helps establish
a safety barrier for workers when exposed to energized equipment. The incident energy
level that will cause a just curable burn or a second degree burn is 1.2cal/cm2 [4]. If a
butane lighter is held 1 cm away from a person’s finger for 1 second and the finger is in
the blue flame, a square centimeter area of the finger will be exposed to about 1.2cal/cm2
[6]. The entire premise of safety and arc flash is based on a curable or second degree burn

50
and, therefore, the incident energy level of 1.2cal/cm2 is an important value. The distance
away from an exposed energized conductor that is calculated at 1.2cal/cm2 is known as
the arc-flash boundary. This can be calculated by rearranging equation (3.17) and solving
for distance at an incident energy of 1.2cal/cm2.
Db = {4.184 Cf En (�B.�)(610
x/Eb)}
1/x (3.20)
where
Db is the boundary from the arcing point or the flash protection boundary
Cf is 1.5 for voltages at or below 1Kv
En is incident energy normalized
Eb is incident energy at boundary distance
t is time in seconds
x is the distance exponent from Table 3.3
After comparing equations 3.19 and 3.20, it is clear that the determining factors
for the incident energy level are the arcing current that results from the available fault
current and the time that the arc exposure exists. These factors are controlled by the
system in which the circuit breaker is installed and the interrupting characteristics of the
circuit breaker. Figure 3.13 shows a circuit breaker time current curve with the arcing
current crossing it.

51
Figure 3.13: Circuit Breaker TCC Interrupting Arcing Current
Here it is shown that an arcing current of approximately 10.9kA is interrupted by
the circuit breaker PD-PANEL-B at a time of 0.0175 seconds. This entire process is
recalculated at a fault current level of 85% less than the reported AFC. This allows for a
worse-case scenario if the fault current is lower than anticipated. This arcing current is
simultaneously plotted against the protective device curve and the slowest interrupt time
is used in calculating the incident energy. Figure 3.14 shows both arcing currents plotted
against PD-Panel-B.
0.5 1 10 100 1K 10K0.01
0.10
1
10
100
1000
CURRENT IN AMPERES
3.13.tcc Ref. Voltage: 480V Current in Amps x 10
TIM
E IN
SE
CO
ND
S
PD-PANEL-BPD-PANEL-B
ARCING CURRENT
INTERRUPTING POINT
ARCING CURRENT
INTERRUPTING POINT

52
Figure 3.14: Circuit Breaker TCC Interrupting Arcing Currents
This information can be used in the equations above to calculate the incident
energy for Panel-B. The computer simulation output results are shown in the partial one-
line diagram in Figure 3.15.
0.5 1 10 100 1K 10K0.01
0.10
1
10
100
1000
CURRENT IN AMPERES
3.14.tcc Ref. Voltage: 480V Current in Amps x 10
TIM
E IN
SE
CO
ND
S
PD-PANEL-BPD-PANEL-B
ARCING CURRENT
INTERRUPTING POINT
ARCING CURRENT CALCULATEDAT 85% LESS AFC
ARCING CURRENT
INTERRUPTING POINT
ARCING CURRENT CALCULATEDAT 85% LESS AFC

53
Figure 3.15: Partial One-Line Showing Panel-B Incident Energy
With this information of an incident energy level of 0.6 cal/cm2, the qualified
technician can select clothing and personal protective equipment rated for arc-flash
safety. The clothing and equipment selected must always have an arc flash rating greater
than the incident energy at the electrical device to be maintained. Since the incident
energy level can have a multitude of values ranging from 0.1cal/cm2 up to over
40cal/cm2, the amount of different clothing devices could be enormous. Therefore, the
concept of grouping the incident energy levels into categories arose.
UTILITY
CBL-MAIN
PD-MAIN800.0 A MDP
IE 0.6 Cal/cm^2ArcingFault 14.081 kAProtDev PD-MAIN
PD-PANEL-B400.0 A
PANEL-BIE 0.6 Cal/cm^2ArcingFault 10.946 kAProtDev PD-PANEL-B

54
3.4 Arc Flash Hazard Risk Categories
While incident energy prediction was being researched, there were also studies
being conducted on how to protect workers in the event of an arc-flash. In 1997 and
1098, two papers on the testing of Personal Protective Equipment (PPE) for Arc-Flash
Exposure were published [8,9]. This project tested the flammability of clothing when
exposed to arc flashes of differing incident energy magnitudes. Ultimately the paper
proposed protective clothing classes based on ranges of incident energy exposure which
correlated to a fire rated clothing system and description. This project also included the
performance of safety glasses, face shields, and work gloves when exposed to an arc-
flash. This research provided the ground work for a standardized system focused on
worker safety in the event of an incident.
In parallel with the developments of the IEEE Standard, the NFPA 70E Standard
for Electrical Safety in the Workplace was created [10]. A portion of this document
covers the need for informing employees of the electrical arc flash hazard they are
exposed to when working on energized equipment. NFPA 70E divides incident energy
levels into hazard/risk categories ranging from 0-4. Each category is given a clothing
description and a required minimum arc rating of personal protective equipment. These
categories are very similar to those suggested by Neal and Bingham. [8,9].
The Arc Flash Hazard Analysis gives us an incident energy level at a specified
working distance from the source of the arc. This enables us to select Personal Protective
Equipment (PPE) that is rated above the incident energy. Although the concept of
wearing PPE that is suited for the task is simple, the different incident energy levels can

55
be numerous. Therefore, the implementation of hazard risk categories was instituted into
the PPE selection process.
There are hazard risk category levels 0,1,2,3, and 4 which correlate to maximum
incident energy levels (cal/cm2) of 1.2, 4, 8, 25, 40. This allows for an electrical device to
be labeled per category and the selection of PPE can be matched the same way.
Table 3.6 Hazard Risk Categories and PPE Characteristics
Hazard Risk Category
(HRC)
Typical Protective
Clothing Systems
Required Minimum PPE
Arc Rating
(cal/cm2)
0 Non-melting, flammable
materials(natural or treated
materials with at least 4.5
oz/yd2)
N/A (1.2)
1 FR pants and FR shirt, or
FR coverall
4
2 Cotton Underwear, plus FR
shirt and FR pants
8
3 Cotton Underwear, plus FR
shirt and FR pants and FR
coverall
25
4 Cotton Underwear, plus FR
shirt and FR pants and
multi-layer flash suit
40
The partial one-line diagram for Panel-B can now include a hazard risk category
also known as a PPE Category as shown below in Figure 3.16.

56
Figure 3.16: Partial One-Line Showing Panel-B Incident Energy and Hazard Risk
Category
Per Table 3.6, the highest hazard risk category is level 4, with a maximum
incident energy of 40cal/cm2. While PPE is certainly available in ratings well above
40cal/cm2, working near exposed energized electrical equipment above 40cal/cm
2 is
discouraged [27]. Annex D of NFPA 70E notes that, “greater than normal emphasis
should be placed on de-energizing the equipment” (Annex D.8 FPN) at such high
incident energy levels.
UTILITY
CBL-MAIN
PD-MAIN800.0 A MDP
IE 0.6 Cal/cm^2PPE Category 0ArcingFault 14.081 kAProtDev PD-MAIN
PD-PANEL-B400.0 A
PANEL-BIE 0.6 Cal/cm^2PPE Category 0ArcingFault 10.946 kAProtDev PD-PANEL-B

57
4. EXISTING ARC FLASH HAZARD MITIGATION TECHNIQUES
This chapter will present existing products, techniques and devices aimed at
mitigating the arc flash hazard exposure. These products and techniques will be computer
simulated with before and after simulations of the electrical system. The implemented
equipment and techniques will show a decreased arc flash hazard incident energy and
category.
4.1 Changing Work Methods and Procedures
The approach of changing work methods for mitigating arc flash hazards focuses
on the existing calculations and changes of the environment to decrease arc flash
exposure. Incident energy reduction approaches by changing working methods include
changing work procedures, modifying existing settings, and increasing work distances
[24].
There are multiple work procedures that can be implemented to reduce arc flash
exposure. The best work practice to avoid exposure is to work in the de-energized state
[25]. NFPA 70E devotes an entire section to de-energizing or the process of achieving an
electrically safe work condition. However, this is typically not possible in mission critical
facilities where life support equipment is dependent on a constant power supply.
Energized work shall be permitted where the employer can demonstrate that de-
energizing introduces additional or increased hazards such as the interruption of life

58
support equipment, deactivation of emergency alarms, and shutdown of hazardous
location ventilating equipment [10].
There are workmanship and technical training procedures that can be instituted to
decrease the arc-flash exposure. A specific example is by changing locations when taking
measurements with a power quality meter. Historically, measurements have been
performed by direct connection of the voltage and current probes to the primary circuit,
where incident energy can be relatively high [24]. By taking the measurements at the
potential transformers and current transformers, the arc-flash exposure can be reduced.
4.2 Temporarily Modifying Existing Protective Device Settings
One of the most common and easiest arc flash mitigation techniques is to
temporarily modify the existing settings of the first upstream protective device. This can
be accomplished by lowering the instantaneous setting of the circuit breaker that is
protecting the equipment to be worked on. An example of this is shown by the partial
one-line diagrams in Figure 4.1.

59
Figure 4.1: Incident Energy Before and After Temporary Setting of Breaker CB-
Main
Here, it is shown that by lowering the instantaneous setting of circuit breaker CB-
MAIN from 15 (24000A) to 10 (16000A) the incident energy decreases from
121.8cal/cm2 to 4.9cal/cm
2 and the PPE Category decreases from Dangerous to HRC 2.
Care must be taken when implementing this solution, as protective device coordination
may be affected when reducing the clearing time of protective devices [24]. Furthermore,
there must not be any devices downstream that could require sudden in-rush of current
that could trip the lowered instantaneous setting. The starting of a motor or energizing a
transformer could draw up to six times the operating amps for that device and therefore
cause a circuit breaker trip in the instantaneous time domain.
UTILITY SOURCEAFC 26984.0 Amps480.0 V
CBL-MAIN
CB-MAIN1600.0 A LTPU (A);LTD 1 (1600A); 8 STPU 8 (12800A) STD INST (I^2t Out) INST 15 (24000A)
MAIN SWBDIE 121.8 Cal/cm^2PPE Category Dangerous!AFC 23.858 kAArcing Current 13.782 kA
UTILITY SOURCE-2AFC 26984.0 Amps480.0 V
CBL-MAIN-2
CB-MAIN-21600.0 A LTPU (A);LTD 1 (1600A); 8 STPU 5 (8000A) STD INST (I^2t Out) INST 10 (16000A)
MAIN SWBD-2IE 4.9 Cal/cm^2PPE Category 2AFC 23.858 kAArcing Current 13.782 kA

60
4.3 Increasing the Working Distance
The calculations from IEEE-1584 for incident energy involve several unknowns
that must be collected in order to achieve an accurate result. However, the most critical
variables are the distance from the arc and the time to interrupt the fault. Since the
incident energy is proportional to the square of the distance (in open air), increasing the
working distance will significantly reduce the incident energy [23]. Care must be taken
when implementing this solution because increasing the distance could hinder a person’s
ability to work on the equipment [24]. Working distance can easily be increased by using
remote racking devices, remote operating equipment, and extension tools. Where the
equipment design permits, it is very beneficial to carry out all switching operations
remotely, away from the switch gear [25]. Racking and switching of a low voltage power
circuit breaker is probably the highest exposure that will occur in industrial facilities [27].
One way to reduce the hazard is to lengthen the tool used to rack the breaker, or use
remote racking/switching equipment that is available from manufacturers or other
suppliers [27]. The partial one-line diagrams in Figure 4.2 show the effectiveness of
increasing the working distance.
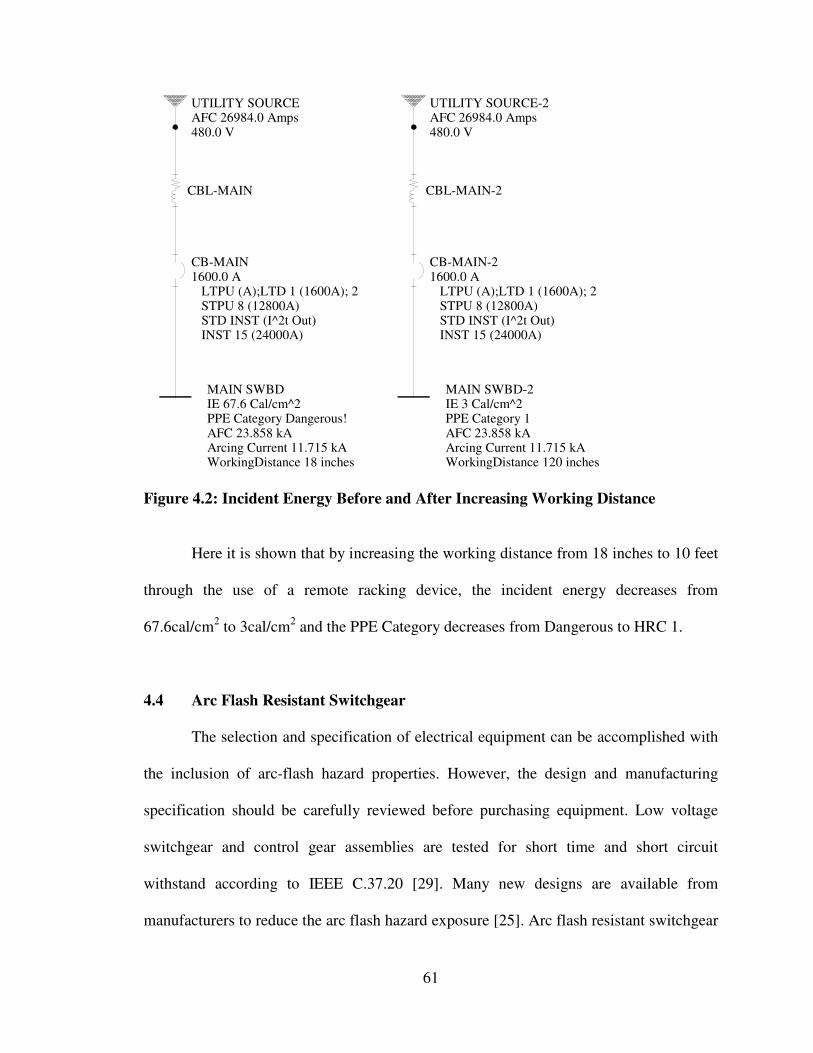
61
Figure 4.2: Incident Energy Before and After Increasing Working Distance
Here it is shown that by increasing the working distance from 18 inches to 10 feet
through the use of a remote racking device, the incident energy decreases from
67.6cal/cm2 to 3cal/cm
2 and the PPE Category decreases from Dangerous to HRC 1.
4.4 Arc Flash Resistant Switchgear
The selection and specification of electrical equipment can be accomplished with
the inclusion of arc-flash hazard properties. However, the design and manufacturing
specification should be carefully reviewed before purchasing equipment. Low voltage
switchgear and control gear assemblies are tested for short time and short circuit
withstand according to IEEE C.37.20 [29]. Many new designs are available from
manufacturers to reduce the arc flash hazard exposure [25]. Arc flash resistant switchgear
UTILITY SOURCEAFC 26984.0 Amps480.0 V
CBL-MAIN
CB-MAIN1600.0 A LTPU (A);LTD 1 (1600A); 2 STPU 8 (12800A) STD INST (I^2t Out) INST 15 (24000A)
MAIN SWBDIE 67.6 Cal/cm^2PPE Category Dangerous!AFC 23.858 kAArcing Current 11.715 kAWorkingDistance 18 inches
UTILITY SOURCE-2AFC 26984.0 Amps480.0 V
CBL-MAIN-2
CB-MAIN-21600.0 A LTPU (A);LTD 1 (1600A); 2 STPU 8 (12800A) STD INST (I^2t Out) INST 15 (24000A)
MAIN SWBD-2IE 3 Cal/cm^2PPE Category 1AFC 23.858 kAArcing Current 11.715 kAWorkingDistance 120 inches

62
is a new manufacturing procedure for the mitigation of incident energy exposure. Arc-
resistant switchgear is tested to withstand an internal arc, and ensure that the person
operating the switch or working on the equipment is not exposed to the hazard [28]. This
is typically accomplished by ventilating the energy out of the top of the switchgear or
some direction away from the worker. Although this is an excellent idea for personal
protection when the equipment is closed, the worker is generally engaged with the
devices when the enclosure is open.
4.5 Optical Light Sensor Technology
Electrical system protection is designed to interrupt the flow of electricity in the
event of an overcurrent or fault condition. When an arc flash occurs the arcing time is a
critical factor in limiting the damage and risk of personal injury resulting from an arc
flash [26]. Therefore, the faster the relay senses the arc-fault, the lesser the incident
energy will be and the safety of the worker is increased. Optical sensor technology
detects the light from the arc-flash and initiates a shutdown.
When an arc flash occurs there is a tremendous release of radiant energy that
consists of audible, thermal, light, and other energy properties. The light intensity of the
arc flash is comprised of different wavelengths than visible light. Visible light consists of
the light spectrum ranging from 400nm to 700nm wavelengths but arc flash tests have
shown to produce wavelengths in the range of 200nm to 600nm. Consequently, optical
arc flash relays are designed to operate in the lower end of the visible spectrum and
slightly lower including ultraviolet light [30].

63
An optical arc flash detection relay system requires a light sensor and a current
measuring device. The light sensor detects the sudden change in the light spectrum
wavelength and the current measuring device detects the change in instantaneous over-
current. Tripping only occurs if both light and fault current are detected [30]. These
relays are equipped with solid state technology for additional speed and they utilize peak
to peak measurements to avoid the delay associated with root-mean-square calculations.
The total operating time is typically less than 2.5ms for the relay [31]. After the relay
sends a signal to the disconnecting device, it is another 5 cycles or 84ms for circuit
breaker opening time. This equates to a total arc flash detection and interrupting time of
approximately 0.09 seconds.
This type of system is dedicated to arc-flash protection and can be viewed as a
stand-alone system. When in use, this avoids the process of coordinating with upstream
and downstream protective devices. However, if more dedicated arc flash protection was
added to the system, then time delays for trip time should be selectively coordinated.
The optical sensing device most often used is a fiber optic cable that can be up to
200 feet long. The cable is constructed of plastic fiber with a glass core and is routed
throughout all switchgear compartments where an arc flash could occur. The routing for
the fiber optic cable in two-high construction switchgear is shown in Figure 4.3.

64
Figure 4.3: Typical Fiber Optic Routing in Switchgear
The fiber is shown routed in a continuous loop to allow for the option of
continuous monitoring by the arc detection relay. This can be accomplished by sending a
test pulse through the system at periodic intervals. If the test pulse is not received as
programmed, then an alarm can be activated to alert maintenance personnel of an
equipment failure.
Unlike communication fibers, this optical sensor has no cladding to prevent
ambient light from entering the fiber [23]. This is vital to the operation because the
system depends on external light to alert of an arc flash. The lack of opaque fiber
cladding allows some of the light to enter through the exposed cylindrical exterior
surface, where it propagates back to the electronics. When arc flash occurs, the system
will detect the light and the relay will send a trip signal to the circuit breaker. The light
sensor system can be operated in automatic or manual mode. In automatic mode, the
system continually adjusts its pickup to normal slow changing background light levels
and therefore any false trips associated with opening an equipment enclosure door can be
avoided. Manual light intensity level settings may be more appropriate where some
normal low-level arcing might take place such as in older air-magnetic switchgear [23]

65
To supervise the instantaneous overcurrent change during a fault, the relay has
inputs for a signal from conventional 5 amp current transformers. These are typically
connected to the current transformers located on the source side of the main breaker and
are used to drive instantaneous phase and ground over-current elements [26]. These over-
current elements behave as fault detectors and signal the relay when a rapid change in
current is detected. Fault detector supervision is selectable but recommended by the
manufacturer for most applications [23]. When both the optical and fault detection
systems indicate an arc-flash, the relay will send a trip signal to the circuit breaker. A
block diagram is shown in Figure 4.4.
Figure 4.4: Arc Detection Relay Block Diagram
The block diagram shows two high speed solid state relays and one conventional
normally-open contact for tripping. The operating times of the solid state and contact
tripping times are illustrated below in Figure 4.5.

66
Figure 4.5: Arc Detection Relay Operating Times
The major benefit of using this style of arc flash detection relay is the ability to
limit incident energy whether the available fault current is relatively high or low. IEEE
1584 states that the worst case incident energy level may not occur at the bolted fault
current point. With the standard protection of time overcurrent and instantaneous
protection, low level fault currents can easily result in higher incident energy levels
because the clearing time is so much longer [32]. The increased clearing time from a
lower amperage fault current can offset the higher amperage from a larger fault current
and produce an incident energy that is more hazardous. Once the arcing current exceeds
the instantaneous setting, incident energy levels drop dramatically [23]. Figure 4.6 below
illustrates this.

67
Figure 4.6: Incident Energy Levels With and Without Arc Flash Relay
The arc flash relay is shown to provide instantaneous tripping across all
magnitudes of fault current. Because there is no coordination requirement, clearing time
is essentially reduced to the operating time of the back-up breaker [23]. This shows the
benefit in reducing the clearing time of the arc flash.
A typical single loop example for the fiber optic sensor is shown below in Figure
4-7. In this application the single optical fiber covers four circuit breaker feeder cubicles.
When the fault detector pickup threshold is exceeded and an optical arc flash is detected,
the arc detection relay will send a trip signal to both the high-side and low-side circuit
breakers.

68
Figure 4.7: Single Fiber Loop Layout
4.6 Allowing a Lack of Circuit Breaker Selectivity
The goal of protective device coordination is to isolate the faulted section of the
electrical system and to not interrupt nearby or parallel feeders. This process is
accomplished by the setting of protective devices as shown in Chapter 2. However, when
protecting the system for arc flash, the isolation of the faulted section must happen as
quickly as possible in order to avoid the damage to electrical equipment and maintenance
personnel. When a protective device system has been selectively coordinated with the
goal of isolating faults, the optimal arc flash protection might not be in place.
Allowing the electrical system to operate with a lack of selective coordination can
sometimes decrease the arcing current interruption time and therefore decrease the
incident energy. Although the 2008 NEC Article 708 calls for selective coordination in
all “Critical Operations Power Systems (COPS), not all electrical systems fall under this

69
categorization [35]. An example is of a manufacturing facility that produces aluminum
siding where the system is not COPS, but the company management has decided not to
de-energize for certain types of electrical system maintenance.

70
5. IMPACT OF ARC FLASH ANALYSIS
This chapter presents the impact of arc flash hazard analysis on existing facilities
and the implementation of mitigation techniques with the intent of lowering arc flash
hazards. The facilities analyzed are from a database of over one-hundred electrical
system studies completed during the last 12 years. The existing electrical systems will be
described along with owner’s objectives and goals for the arc flash hazard analysis. The
study will be performed with the assistance of computer software and the results analyzed
and discussed. Methods for mitigating areas of high arc flash hazard will be
recommended and then the system will be reevaluated by the computer software.
5.1 Free Standing Ambulatory Surgery Center
This section of the project analyzes a power distribution system located in a free
standing ambulatory surgery center located in Pinellas County that was built in 1999. The
facility contains approximately 7500 square feet of offices and surgical suites. Per the
State of Florida Statutes and the Agency for Healthcare Administration, a fault current
study and protective device coordination analysis was required for this facility before a
Certificate of Occupancy could be issued. Years after opening, an arc flash hazard
analysis was directed by ownership with the intent to comply with OSHA and NFPA.
The company goal was to achieve a hazard risk category 3 or below at all electrical
breaker panels in the system.

71
The electrical service entrance is 120/208 volts, 600 amps, 3-phase, 4-wire,
grounded Y. The distribution design consists of a main distribution panel (MDP)
specified at 800 amp main lug only with 5 feeder breakers serving as the system main
disconnects. The system design and installation is acceptable per the National Electrical
Code and all applicable building codes. The partial one-line diagram in Figure 5.1 shows
this feeder system.
Figure 5.1: One-Line Diagram for Surgery Center
By observing the output results of the computer simulation in Figure 5.1, it is
possible to verify the equipment ratings by comparing the system fault current and X/R
ratio with the equipment withstand or AIC and tested X/R ratio. This comparison is
shown in the equipment evaluation Table 5.1 and each device is shown as a pass or fail
based on this criteria. For this electrical system, all devices pass the equipment
evaluation for fault current analysis.
UTILITY
MDPBoltedFault 23.857 kAWithstand 65.0 kASystem X/R 0.006TestX/R 4.899ArcingFault 8.010 kAProtDev PD-UTILITYIncident Energy 47.42 Cal/cm^2PPE Category Dangerous!
PD-N1200.0 ATest X/R 4.899AIC 25.0 kA
PNL N1BoltedFault 13.982 kAWithstand 35.0 kASystem X/R 0.008TestX/R 4.899ArcingFault 5.504 kAProtDev PD-N1Incident Energy 0.29 Cal/cm^2PPE Category 0
PD-N2200.0 ATest X/R 4.899AIC 25.0 kA
PNL N2BoltedFault 13.982 kAWithstand 35.0 kASystem X/R 0.008TestX/R 4.899ArcingFault 5.504 kAProtDev PD-N2Incident Energy 0.29 Cal/cm^2PPE Category 0
PD-N3200.0 ATest X/R 4.899AIC 25.0 kA
PNL N3BoltedFault 13.982 kAWithstand 35.0 kASystem X/R 0.008TestX/R 4.899ArcingFault 5.504 kAProtDev PD-N3Incident Energy 0.29 Cal/cm^2PPE Category 0
PD-CH-1225.0 ATest X/R 4.899AIC 25.0 kA
CH-1BoltedFault 14.819 kAWithstand 35.0 kASystem X/R 0.008TestX/R 4.899ArcingFault 5.734 kAProtDev PD-CH-1Incident Energy 0.3 Cal/cm^2PPE Category 0
PD-E1250.0 ATest X/R 4.899AIC 65.0 kA
PNL-E1BoltedFault 14.819 kAWithstand 35.0 kASystem X/R 0.008TestX/R 4.899ArcingFault 5.734 kAProtDev PD-ATSIncident Energy 0.73 Cal/cm^2PPE Category 0
S
P XF-UTIL575.0 kVAPrimary 13200 VSecondary 208 V
PD-UTILITY30.0 ATest X/R 15.000AIC 12.5 kA

72
Table 5.1 Equipment Evaluation Table for Surgery Center
Device AFC/Bolted
Fault
Withstand/AIC System X/R Device
Tested X/R
Result
MDP 23.8kA 65kA 0.006 4.8 Pass
PD-N1,2,3 13.9kA 25kA 0.006 4.8 Pass
PD-E1 14.8kA 25kA 0.006 4.8 Pass
PD-CH-1 14.8kA 25kA 0.006 4.8 Pass
PNL-N1,2,3 13.9kA 35kA 0.008 4.8 Pass
PNL-E1 14.8kA 35kA 0.008 4.8 Pass
PNL-CH-1 14.8kA 35kA 0.008 4.8 Pass
After all devices are evaluated per fault current analysis, the system must be
analyzed for protective device coordination. Due to the design of this electrical system,
the protective device coordination can quickly be tested. Since all feeder breakers are the
same size and type, one typical TCC curve showing the selective coordination with the
utility fuse is all that is necessary.

73
Figure 5.2: TCC Curve for Surgery Center
The time current curves show that there is no overlap of the protective device
curves, hence this system is selectively coordinated.
The results of the arc flash hazard analysis are given on the one line diagram. This
shows incident energy levels for PNL-N-1,2,3 at 0.29cal/cm2, PNL-E1 at 0.73cal/cm
2,
and PNL-CH-1 at 0.3cal/cm2 which are all hazard risk category 0. A typical time current
curve with arcing current and hazard risk categories for these panels is shown below in
Figure 5.3.
0.5 1 10 100 1K 10K0.01
0.10
1
10
100
1000
CURRENT IN AMPERES
5.2.tcc Ref. Voltage: 208V Current in Amps x 10
TIM
E IN
SE
CO
ND
S
PD-N1
PD-UTILITY
PD-N1
PD-UTILITY

74
Figure 5.3: Time Current Curve for Arcing Current at PNL-N1
The arc flash hazard analysis for the main distribution panel MDP shows a much
more serious situation. The results of the simulation report an incident energy of
47.42cal/cm2,
which results in a hazard risk category of Dangerous. This is a result of the
MDP’s primary protective device being the utility fuse PD-Utility. The TCC with arcing
current for the MDP is shown below.
Category 4
Category 3
Category 2
Category 1
Category 0
0.5 1 10 100 1K 10K0.01
0.10
1
10
100
1000
CURRENT IN AMPERES
5.3.tcc Ref. Voltage: 208V Current in Amps x 1
TIM
E IN
SE
CO
ND
S
PD-N1PD-N1
Arcing Current at PNL-N1
Arcing Current Interupted at CAT 0
Arcing Current at PNL-N1
Arcing Current Interupted at CAT 0

75
Figure 5.4: Time Current Curve for Arcing Current at MDP
The time current curve for PD-Utility is shown to clear the arcing current at
approximately 8 seconds. This results in a hazard risk category of Dangerous.
The next step is to investigate arc flash hazard mitigation techniques for this
electrical system. There is one panel that has an incident energy resulting in an
unacceptable hazard risk category which is the MDP. The inherent system design and
installation does not offer any options to adjust protective device settings with the intent
Category 4
Category 3
Category 2
Category 1
Category 0
0.5 1 10 100 1K 10K0.01
0.10
1
10
100
1000
CURRENT IN AMPERES
5.4.tcc Ref. Voltage: 480V Current in Amps x 10
TIM
E IN
SE
CO
ND
S
PD-UTILITYPD-UTILITY
Arcing Current at MDPArcing Current at MDP

76
of protecting the MDP with a quicker interrupt during an arc flash. This electrical system
is a candidate for add-on equipment.
A possible solution for this surgery center is to add a main protective device
ahead of the MDP. Installing a 600 amp fuse ahead of the MDP, results in the software
analysis shown in the one line diagram below in Figure 5.5.

77
Figure 5.5: One-Line Diagram for Surgery Center with Added Main Fuse
UTILITY
MDPBoltedFault 12.591 kAWithstand 65.0 kASystem X/R 0.008TestX/R 4.899ArcingFault 4.347 kAProtDev PD-MainIncident Energy 16.89 Cal/cm^2PPE Category 3
PD-N1200.0 ATest X/R 4.899AIC 25.0 kA
PNL N1BoltedFault 9.208 kAWithstand 35.0 kASystem X/R 0.010TestX/R 4.899ArcingFault 4.105 kAProtDev PD-N1Incident Energy 0.22 Cal/cm^2PPE Category 0
PD-N2200.0 ATest X/R 4.899AIC 25.0 kA
PNL N2BoltedFault 9.208 kAWithstand 35.0 kASystem X/R 0.010TestX/R 4.899ArcingFault 4.105 kAProtDev PD-N2Incident Energy 0.21 Cal/cm^2PPE Category 0
PD-N3200.0 ATest X/R 4.899AIC 25.0 kA
PNL N3BoltedFault 9.208 kAWithstand 35.0 kASystem X/R 0.010TestX/R 4.899ArcingFault 4.105 kAProtDev PD-N3Incident Energy 0.21 Cal/cm^2PPE Category 0
PD-CH-1225.0 ATest X/R 4.899AIC 25.0 kA
CH-1BoltedFault 9.544 kAWithstand 35.0 kASystem X/R 0.010TestX/R 4.899ArcingFault 4.210 kAProtDev PD-CH-1Incident Energy 0.22 Cal/cm^2PPE Category 0
PD-E1250.0 ATest X/R 4.899AIC 65.0 kA
PNL-E1BoltedFault 9.544 kAWithstand 35.0 kASystem X/R 0.010TestX/R 4.899ArcingFault 4.210 kAProtDev PD-E1Incident Energy 0.52 Cal/cm^2PPE Category 0
S
P XF-UTIL575.0 kVAPrimary 13200 VSecondary 208 V
PD-UTILITY30.0 ATest X/R 15.000AIC 12.5 kA
PD-Main600.0 ATest X/R 4.899AIC 200.0 kA

78
The one line diagram now shows the incident energy at MDP at 16.89cal/cm2,
which results in a hazard risk category 3. The TCC for this added fuse PD-MAIN is
shown below.
Figure 5.6: TCC for Arcing Current at MDP with Added Fuse
Category 4
Category 3
Category 2
Category 1
Category 0
0.5 1 10 100 1K 10K0.01
0.10
1
10
100
1000
CURRENT IN AMPERES
5.6.tcc Ref. Voltage: 480V Current in Amps x 10
TIM
E IN
SE
CO
ND
S
PD-UTILITY
PD-Main
PD-UTILITY
PD-Main
Arcing Current at MDPArcing Current at MDP

79
The TCC shows the new main fuse PD-MAIN interrupting the arcing current at
approximately 0.4 seconds thus resulting in a hazard risk category 3.
In theory, this is a viable solution. However, implementation this could create a
number of serious issues for the facility, including:
1. The electrical service will have to be interrupted for an extended period of
time.
2. The existing electrical service conduit and conductors will have to be dug-up
and replaced.
3. The expense for this could be large and will have to be budgeted.
There are no other arc-flash mitigation options for the MDP panel of this
electrical system. As the system currently operates, they will need to have the power
company take them out of service when they maintain the MDP panel.
5.2 Heart Catheterization Center
This section of the project analyzes a power distribution system located in a free
standing ambulatory heart catheterization center located in Putnam County, FL that was
built in 2001. The facility contains approximately 8100 square feet of offices, exam
rooms, and heart catheterization suites. Per the State of Florida Statutes and the Agency
for Healthcare Administration, a fault current study and protective device coordination
analysis was required for this facility before a Certificate of Occupancy could be issued.
Years after opening, an arc flash hazard analysis was directed by ownership with the
intent to comply with OSHA and NFPA. The owner’s goal was to achieve a hazard risk
category 1 or below for all buses and electrical breaker panels in the system.
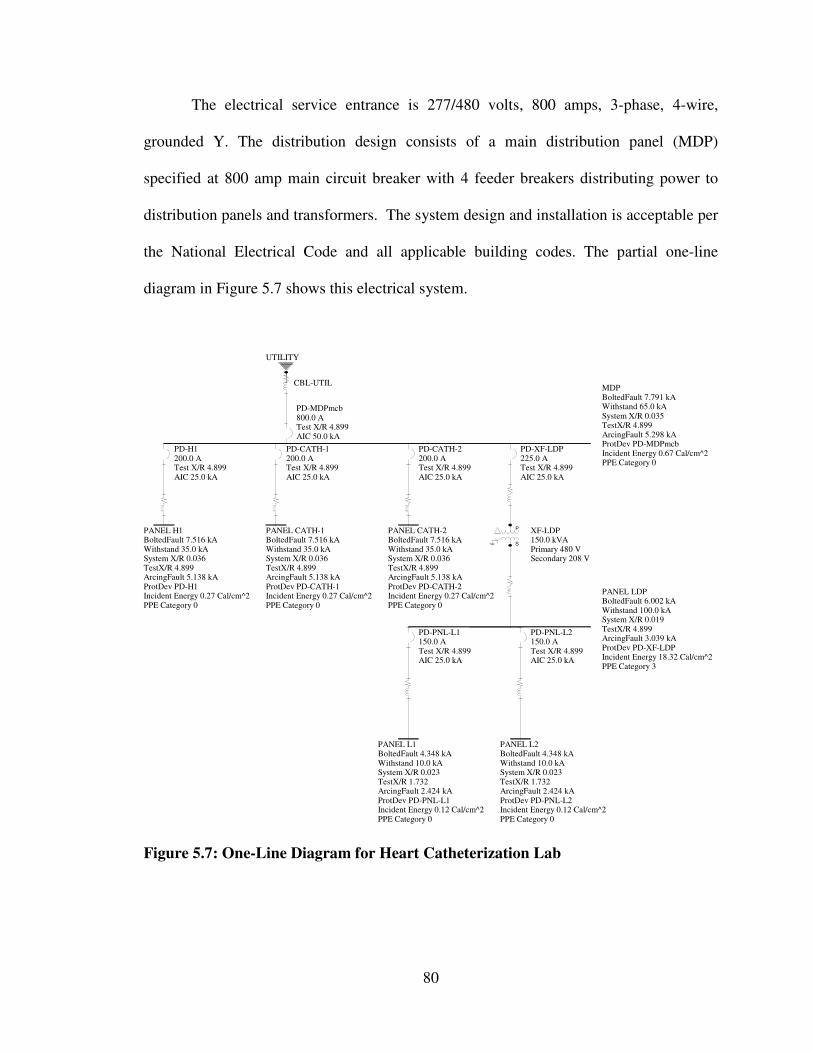
80
The electrical service entrance is 277/480 volts, 800 amps, 3-phase, 4-wire,
grounded Y. The distribution design consists of a main distribution panel (MDP)
specified at 800 amp main circuit breaker with 4 feeder breakers distributing power to
distribution panels and transformers. The system design and installation is acceptable per
the National Electrical Code and all applicable building codes. The partial one-line
diagram in Figure 5.7 shows this electrical system.
Figure 5.7: One-Line Diagram for Heart Catheterization Lab
UTILITY
CBL-UTIL
PD-MDPmcb800.0 ATest X/R 4.899AIC 50.0 kA
MDPBoltedFault 7.791 kAWithstand 65.0 kASystem X/R 0.035TestX/R 4.899ArcingFault 5.298 kAProtDev PD-MDPmcbIncident Energy 0.67 Cal/cm^2PPE Category 0
PD-H1200.0 ATest X/R 4.899AIC 25.0 kA
PANEL H1BoltedFault 7.516 kAWithstand 35.0 kASystem X/R 0.036TestX/R 4.899ArcingFault 5.138 kAProtDev PD-H1Incident Energy 0.27 Cal/cm^2PPE Category 0
PD-CATH-1200.0 ATest X/R 4.899AIC 25.0 kA
PANEL CATH-1BoltedFault 7.516 kAWithstand 35.0 kASystem X/R 0.036TestX/R 4.899ArcingFault 5.138 kAProtDev PD-CATH-1Incident Energy 0.27 Cal/cm^2PPE Category 0
PD-XF-LDP225.0 ATest X/R 4.899AIC 25.0 kA
S
P XF-LDP150.0 kVAPrimary 480 VSecondary 208 V
PANEL LDPBoltedFault 6.002 kAWithstand 100.0 kASystem X/R 0.019TestX/R 4.899ArcingFault 3.039 kAProtDev PD-XF-LDPIncident Energy 18.32 Cal/cm^2PPE Category 3
PD-PNL-L1150.0 ATest X/R 4.899AIC 25.0 kA
PANEL L1BoltedFault 4.348 kAWithstand 10.0 kASystem X/R 0.023TestX/R 1.732ArcingFault 2.424 kAProtDev PD-PNL-L1Incident Energy 0.12 Cal/cm^2PPE Category 0
PD-PNL-L2150.0 ATest X/R 4.899AIC 25.0 kA
PANEL L2BoltedFault 4.348 kAWithstand 10.0 kASystem X/R 0.023TestX/R 1.732ArcingFault 2.424 kAProtDev PD-PNL-L2Incident Energy 0.12 Cal/cm^2PPE Category 0
PD-CATH-2200.0 ATest X/R 4.899AIC 25.0 kA
PANEL CATH-2BoltedFault 7.516 kAWithstand 35.0 kASystem X/R 0.036TestX/R 4.899ArcingFault 5.138 kAProtDev PD-CATH-2Incident Energy 0.27 Cal/cm^2PPE Category 0

81
From observing the output results of the computer simulation in Figure 5.7, it is
possible to verify the equipment ratings by comparing the system fault current and X/R
ratio with the equipment withstand or AIC and tested X/R ratio. This comparison is
shown in the equipment evaluation Table 5.2 and each device is shown as a pass or fail
based on this criteria. For this electrical system all devices pass the equipment evaluation
for fault current analysis.
Table 5.2 Equipment Evaluation Table for Heart Catheterization Lab
Device AFC/Bolte
d Fault
Withstand/AI
C
System
X/R
Device
Tested X/R
Result
PD-MDPmcb 7.8kA 50kA 0.035 4.8 Pass
PD-H1,Cath1&2 7.8kA 25kA 0.035 4.8 Pass
PD-XF-LDP 7.8kA 25kA 0.035 4.8 Pass
MDP 7.8kA 65kA 0.035 4.8 Pass
PNL-H1, Cath1&2 7.5kA 35kA 0.036 4.8 Pass
PNL-LDP 6.0kA 100kA 0.019 4.8 Pass
PNL-L1&L2 4.3kA 10kA 0.024 1.7 Pass
Next, the system must be analyzed for protective device coordination. Due to the
design of this electrical system, the protective device coordination can quickly be tested.
Following the largest feeder breaker in each leg allows for one TCC diagram to show
selective coordination.

82
Figure 5.8: TCC Curve for Heart Catheterization Lab
The time current curve for the heart catheterization lab shows that there is no
overlap of the protective devices, hence this system is selectively coordinated.
The results of the arc flash hazard analysis are given on the one line diagram. This
shows incident energy levels for MDP at 0.67cal/cm2, Panels-H1, Cath1&2 at
0.27cal/cm2, and Panels-L1&2 at 0.12cal/cm
2 which are all hazard risk category 0. A
TX Inrush
180 A
0.5 1 10 100 1K 10K0.01
0.10
1
10
100
1000
CURRENT IN AMPERES
5.8.tcc Ref. Voltage: 480V Current in Amps x 10
TIM
E IN
SE
CO
ND
S
PD-PNL-L1
PD-XF-LDP
PD-MDPmcb
XF-LDP
PD-PNL-L1
PD-XF-LDP
PD-MDPmcb
XF-LDP

83
typical time current curve with arcing current and hazard risk categories for these panels
is shown below in Figure 5.9.
Figure 5.9: Time Current Curve for Arcing Current at Panel H1
The arc flash hazard analysis for the Panel LDP shows a much more hazardous
situation. The results of the simulation report an incident energy of 18.32cal/cm2 which
results in a hazard risk Category 3. This is a result of the transformer XF-LDP primary
protective device being the thermal magnetic breaker PD-XF-LDP. The TCC with arcing
current for the Panel LDP is shown below.
Category 4
Category 3
Category 2
Category 1
Category 0
0.5 1 10 100 1K 10K0.01
0.10
1
10
100
1000
CURRENT IN AMPERES
5.9.tcc Ref. Voltage: 480V Current in Amps x 10
TIM
E IN
SE
CO
ND
S
PD-H1PD-H1
Arcing current at Panel H1
Arcing current interupted
Arcing current at Panel H1
Arcing current interupted

84
Figure 5.10: Time Current Curve for Arcing Current at Panel LDP
Figure 5.10 shows the time current curve for PD-XF-LDP clearing the arcing
current at approximately 8 seconds. However, due to research results and the guidelines
of IEEE 1584, the analysis will limit the arcing duration at 2 seconds and calculate the
incident energy then. This results in a hazard risk of Category 3.
The next step is to investigate arc flash hazard mitigation techniques for this
electrical system. There is one panel that has an incident energy resulting in an
unacceptable hazard risk category which is Panel LDP. The protection device for this
Category 4
Category 3
Category 2
Category 1
Category 0
0.5 1 10 100 1K 10K0.01
0.10
1
10
100
1000
CURRENT IN AMPERES
5.10.tcc Ref. Voltage: 480V Current in Amps x 10
TIM
E IN
SE
CO
ND
S
PD-XF-LDPPD-XF-LDP
Arcing current at Panel LDPArcing current at Panel LDP

85
panel is a thermal magnetic breaker and the instantaneous adjustment does not offer
enough flexibility to interrupt the arcing current at a shorter duration.
A possible solution for this heart catheterization lab is to replace the thermal
magnetic breaker with a more flexible LSI style device. By installing a 225 amp LSI
adjustable breaker to protect the transformer XF-LDP, the system gets the results shown
in the software analysis below.

86
Figure 5.11: One-Line Diagram for Surgery Center with Added Main Breaker
The one line diagram in Figure 5.11 now shows the incident energy at Panel LDP
at 0.37cal/cm2,
which results in a hazard risk category 0. The TCC for this changed PD-
XFV-LDP is shown below in Figure 5.12. The arcing current is now interrupted at
approximately 0.085 seconds thus lowering the arc flash hazard.
UTILITY
CBL-UTIL
PD-MDPmcb800.0 ATest X/R 4.899AIC 50.0 kA
MDPBoltedFault 7.791 kAWithstand 65.0 kASystem X/R 0.035TestX/R 4.899ArcingFault 5.298 kAProtDev PD-MDPmcbIncident Energy 1 Cal/cm^2PPE Category 0
PD-H1200.0 ATest X/R 4.899AIC 25.0 kA
PANEL H1BoltedFault 7.516 kAWithstand 35.0 kASystem X/R 0.036TestX/R 4.899ArcingFault 5.138 kAProtDev PD-H1Incident Energy 0.27 Cal/cm^2PPE Category 0
PD-CATH-1200.0 ATest X/R 4.899AIC 25.0 kA
PANEL CATH-1BoltedFault 7.516 kAWithstand 35.0 kASystem X/R 0.036TestX/R 4.899ArcingFault 5.138 kAProtDev PD-CATH-1Incident Energy 0.27 Cal/cm^2PPE Category 0
PD-XF-LDP250.0 ATest X/R 4.899AIC 65.0 kA
S
P XF-LDP150.0 kVAPrimary 480 VSecondary 208 V
PANEL LDPBoltedFault 6.002 kAWithstand 100.0 kASystem X/R 0.019TestX/R 4.899ArcingFault 3.039 kAProtDev PD-XF-LDPIncident Energy 0.37 Cal/cm^2PPE Category 0
PD-PNL-L1150.0 ATest X/R 4.899AIC 25.0 kA
PANEL L1BoltedFault 4.348 kAWithstand 10.0 kASystem X/R 0.023TestX/R 1.732ArcingFault 2.424 kAProtDev PD-PNL-L1Incident Energy 0.12 Cal/cm^2PPE Category 0
PD-PNL-L2150.0 ATest X/R 4.899AIC 25.0 kA
PANEL L2BoltedFault 4.348 kAWithstand 10.0 kASystem X/R 0.023TestX/R 1.732ArcingFault 2.424 kAProtDev PD-PNL-L2Incident Energy 0.12 Cal/cm^2PPE Category 0
PD-CATH-2200.0 ATest X/R 4.899AIC 25.0 kA
PANEL CATH-2BoltedFault 7.516 kAWithstand 35.0 kASystem X/R 0.036TestX/R 4.899ArcingFault 5.138 kAProtDev PD-CATH-2Incident Energy 0.27 Cal/cm^2PPE Category 0

87
Figure 5.12: TCC for Arcing Current at Panel LDP with LSI Breaker
It is important to check with the series breakers for verification that selective
coordination still exists with the new LSI circuit breaker. This is accomplished by
plotting the upstream and downstream breakers with the new settings of PD-XF-LP.
These circuit breakers are shown to be selectively coordinated in Figure 5.13.
Category 4
Category 3
Category 2
Category 1
Category 0
0.5 1 10 100 1K 10K0.01
0.10
1
10
100
1000
CURRENT IN AMPERES
5.12.tcc Ref. Voltage: 480V Current in Amps x 10
TIM
E IN
SE
CO
ND
S
PD-XF-LDPPD-XF-LDP
Arcing current at Panel LDP
Arcing current interrupted
Arcing current at Panel LDP
Arcing current interrupted

88
Figure 5.13: TCC for Heart Catheterization Lab after Breaker Change
5.3 Metal Container Manufacturer
This section of the project analyzes a power distribution system located in a metal
container manufacturing plant located in Hillsborough County that was originally
constructed in the 1970s. The facility is approximately 2500 square feet of offices and
175,000 square feet of manufacturing. An arc flash hazard analysis was directed by upper
management with the intent to comply with OSHA and NFPA 70E. The corporate goal
was to achieve a hazard risk category 1 or below at all points in the system.
TX Inrush
180 A
0.5 1 10 100 1K 10K0.01
0.10
1
10
100
1000
CURRENT IN AMPERES
5.13.tcc Ref. Voltage: 480V Current in Amps x 10
TIM
E IN
SE
CO
ND
S
PD-MDPmcb
XF-LDP
PD-PNL-L1
PD-XF-LDP
PD-MDPmcb
XF-LDP
PD-PNL-L1
PD-XF-LDP

89
The electrical service entrance is 13.2kV at 2500 amps with step down
transformers to 277/480 volts, 3-phase, grounded Y. The distribution design consists of
an entrance switchboard with four feeder breakers serving the manufacturing sections of
the factory. Each quadrant consists of an LSI circuit breaker serving a continuous bus
duct with fused bus-taps serving the subsequent bus duct. The partial one-line diagram in
Figure 5.14 shows this feeder system.

90
Figure 5.14: Partial One-Line Diagram for Bus Duct Feeder
UTILITY-MAIN LINE
PD-MD300.0 ATest X/R 15.000AIC 50.0 kACBL-MD
PD-T2BPD-T2B100.0 ATest X/R 15.000AIC 25.0 kACBL-T2B
S
P XF-T2B1150.0 kVAPrimary 13200 VSecondary 480 V
PD-BUS B relay1600.0 ATest X/R 4.899
CBL-BUS B
PD-BUS B1800.0 ATest X/R 4.900AIC 300.0 kA
CBL-B1
BUS B1BUS B1IE 9.3 Cal/cm^2PPE Category 3BoltedFault 17.996 kAWithstand 22.0 kASystem X/R 0.015TestX/R 5.000ArcingFault 9.207 kAProtDev PD-BUS B1
BT-B-BUS-B1
BUS-BBUS-BIE 49.7 Cal/cm^2PPE Category Dangerous!BoltedFault 20.795 kAWithstand 35.0 kASystem X/R 0.013TestX/R 5.000ArcingFault 8.764 kAProtDev PD-BUS B relay
CBL-XF-T2B sec
Substation 29-PS
Substation 29-MD

91
From observing the output results of the computer simulation in Figure 5.14, it is
possible to verify the equipment ratings by comparing the system fault current and X/R
ratio with the equipment withstand or AIC and tested X/R ratio. This comparison is
shown in the equipment evaluation Table 5.3 and each device is shown as a pass or fail
based on this criteria. For this portion of this electrical system all devices are shown to
be acceptable based on fault current analysis.
Table 5.3 Equipment Evaluation Table for Bus Duct Feeder
Device AFC Withstand/AIC System
X/R
Device
Tested X/R
Result
Bus-B 20.7kA 35kA 0.013 5.0 Pass
Bus-B1 17.9kA 22kA 0.015 4.9 Pass
PD-Bus-B1 17.9kA 300kA 0.015 5.0 Pass
After all devices are evaluated per fault current analysis, the system must be
analyzed for protective device coordination. The time current curves for PD-Bus-B and
PD-Bus-B1 are shown below in Figure 5.15.

92
Figure 5.15: TCC PD-Bus-B and PD-Bus-B1
The time current curves show that although there is some overlap of the protective
device curves, selective coordination with these devices does exist because the fuse PD-
Bus-B1 will melt before the tripping of circuit breaker PD-Bus-B.
0.5 1 10 100 1K 10K0.01
0.10
1
10
100
1000
CURRENT IN AMPERES
5.15.tcc Ref. Voltage: 480V Current in Amps x 10
TIME IN SECONDS
PD-BUS B1
PD-BUS B
PD-BUS B1
PD-BUS B

93
The results of the arc flash hazard analysis are given on the partial one line
diagram. This shows incident energy levels for Bus-B and Bus-B1 at 49.7cal/cm2 and
19.3cal/cm2 respectively, resulting in hazard risk category Dangerous and 3. The time
current curves with arcing current and hazard risk categories for Bus-B and Bus-B1 are
shown below in Figures 5.16 and 5.17.
Figure 5.16: Time Current Curve for Arcing Current at Bus-B
Category 4
Category 3
Category 2
Category 1
Category 0
0.5 1 10 100 1K 10K0.01
0.10
1
10
100
1000
CURRENT IN AMPERES
5.16.tcc Ref. Voltage: 480V Current in Amps x 10
TIME IN SECONDS
PD-BUS B1
PD-BUS B
PD-BUS B1
PD-BUS B
Arcing Current at Bus BArcing Current at Bus B

94
The time current curve for PD-Bus-B relay is shown to clear the arcing current at
well beyond 10 seconds. This results in a hazard risk category of Dangerous.
Figure 5.17: Time Current Curve for Arcing Current at Bus-B1
The time current curve for PD-Bus-B1 is shown to clear the arcing current at
approximately 0.45 seconds. This results in a hazard risk category of 3.
The next step is to investigate arc flash hazard mitigation techniques for this
section of the electrical system. We have two protective devices in the fuse PD-Bus1 and
Category 4
Category 3
Category 2
Category 1
Category 0
0.5 1 10 100 1K 10K0.01
0.10
1
10
100
1000
CURRENT IN AMPERES
5.17.tcc Ref. Voltage: 480V Current in Amps x 10
TIME IN SECONDS
PD-BUS B1
PD-BUS B
PD-BUS B1
PD-BUS B
Arcing Current at Bus B1Arcing Current at Bus B1

95
the adjustable LSI breaker PD-Bus B relay. This is good news for Bus B because the
settings of the PD-Bus B relay can be adjusted downward to interrupt the arcing current
quicker. At the same time our protection options for Bus B1 are limited because there are
no possible adjustments for the fuse interrupting the arcing current there. However, Bus
B1 can be better protected by adjusting the PD-Bus B relay below the fuse melting point.
This is developing into a classic case of allowing for dis-coordination. The partial one-
line diagram if Figure 5.18 shows the results of this implementation.
Figure 5.18: Partial One-Line Diagram after Implementation of Dis-Coordinated
Settings
UTILITY-MAIN LINE
PD-MD300.0 A
CBL-MD
PD-T2BPD-T2B100.0 A
CBL-T2B
S
P XF-T2B1150.0 kVA
PD-BUS B relay1600.0 A
CBL-BUS B
PD-BUS B1800.0 A
CBL-B1
BUS B1BUS B1IE 1.8 Cal/cm^2PPE Category 1ArcingFault 9.109 kAProtDev PD-BUS B relay
BT-B-BUS-B1
BUS-BBUS-BIE 2.1 Cal/cm^2PPE Category 1ArcingFault 10.311 kAProtDev PD-BUS B relay
CBL-XF-T2B sec
Substation 29-PS
Substation 29-MD

96
The results of the arc flash hazard analysis after adjusting PD-Bus B are given on
the partial one line diagram in Figure 5.18. This shows incident energy levels for Bus-B
and Bus-B1 decreased to 2.1cal/cm2 and 1.8cal/cm
2 respectively, resulting in hazard risk
category 1 for both buses. The time current curves with arcing current and hazard risk
categories for Bus-B and Bus-B1 are shown below in Figures 5.19 and 5.20.
Figure 5.19: TCC for Arcing Current at Bus-B after Breaker Adjustment
Category 4
Category 3
Category 2
Category 1
Category 0
0.5 1 10 100 1K 10K0.01
0.10
1
10
100
1000
CURRENT IN AMPERES
5.19.tcc Ref. Voltage: 480V Current in Amps x 10 4-3-1.drw
TIME IN SECONDS
PD-BUS B1
PD-BUS B
PD-BUS B1
PD-BUS B
Lack of Coordination
Arcing Current at Bus B
Lack of Coordination
Arcing Current at Bus B

97
The time current curve for PD-Bus-B in Figure 5.19 is shown to clear the arcing
current at Bus B in approximately 0.05 seconds. This results in a hazard risk category
rating of 1.
Figure 5.20: TCC for Arcing Current at Bus-B1 after Breaker Adjustment
The time current curve for PD-Bus-B in Figure 5.20 is shown to clear the arcing
current at Bus B1 in approximately 0.05 seconds. This results in an arc flash hazard risk
category of 1.
Category 4
Category 3
Category 2
Category 1
Category 0
0.5 1 10 100 1K 10K0.01
0.10
1
10
100
1000
CURRENT IN AMPERES
5.20.tcc Ref. Voltage: 480V Current in Amps x 10
TIME IN SECONDS
PD-BUS B1
PD-BUS B
PD-BUS B1
PD-BUS B
Lack of Coordination
Arcing Current at Bus B1
Lack of Coordination
Arcing Current at Bus B1

98
This chapter has taken actual electrical power systems and analyzed them for
short circuit, protective device coordination, and arc flash hazard. The results have shown
that some existing electrical systems have been designed and constructed with inherent
properties that often create a high arc flash hazard. The arc flash hazards in these existing
systems were mitigated using after-market products and techniques that can be costly and
sometimes leave the system to operate in a less than ideal condition. It is important to
investigate ways to mitigate the arc flash hazard during the design phase of the project
because additional expense and dangerous conditions can be avoided.

99
6. IMPLEMENTATION OF DESIGN METHODS FOR ARC FLASH
MITIGATION
The previous chapters of this dissertation have focused on background
information important to understanding the arc flash hazard. Those chapters also detailed
the methods for analyzing an electrical system and the process that must occur in order to
calculate the arc flash hazard exposure of a technician performing work on energized
electrical devices. The research completed in this dissertation focused on the
recommended design practices that should be implemented with the goal of mitigating
the arc flash hazard before an electrical system is constructed.
This chapter highlights techniques developed by the researcher to be implemented
during the design phase of electrical distribution systems that will help mitigate arc flash
hazard exposure. These techniques were extracted from a database of over three hundred
case studies. The case study projects were all designed by licensed professional engineers
over the last 21 years. The analysis of the case studies has led to these techniques. For
each case study presented a 480 volt electrical system that is in compliance with the NEC
and acceptable for an electrical building permit is the starting point. The arc flash
analysis is then performed on the system giving an incident energy level and hazard
category. Recommendations for arc flash hazard mitigation to the design of the system
are made and a recalculation of the arc flash hazard performed. The implemented design
recommendations will show a decreased arc flash hazard incident energy and hazard risk
category.

100
The following sections show that NEC acceptable design strategies can be altered
to include the safety concerns of NFPA 70E and therefore will minimize the arc flash
hazard exposure. This is specifically evident in the following areas:
1. When applying the National Electric Code, Article 230, Part VI, always
specify a single main circuit breaker for building shutdown.
2. At the electrical service entrance the design shall specify enclosed low voltage
power circuit breakers in place of fused disconnects.
3. Specify adjustable low voltage power circuit Breakers for protection of step-
down transformers rated above 125kVA.
4. Step-Down Transformers larger than 125kVA shall be replaced with a design
having two smaller transformers.
6.1 When Applying the National Electric Code, Article 230, Part VI, Always
Specify a Single Main Circuit Breaker for Building Shutdown
There are several important factors that need to be included in the decisions made
during the design of the electrical service entrance and main distribution panel. The
service entrance must meet all NEC requirements for system shutdown and electrical
protection. The main distribution panel must be properly sized to carry the facility
demand load to avoid an overcurrent situation. The main distribution panel and the
protective devices installed inside it must be braced to withstand the available fault
current imposed during a short circuit. Furthermore, the main breakers and feeder
breakers in the main distribution panel must coordinate with each other and downstream
devices to ensure proper isolation of short circuits within the system. In mission critical

101
facilities the main distribution panel must be properly maintained and therefore the arc
flash hazard at this location is important.
The National Electrical Code, Article 230, Part VI addresses building main shut
down and disconnect requirements. This part of the code states that an electrical service
may be shut down by a maximum of six grouped devices. These devices can be circuit
breakers, fused switches, or disconnect switches. This is often accomplished by having a
main panel with no main circuit breaker and a maximum of six feeder breakers. A one-
line diagram of this scenario is shown in Figure 6.1. This installation is acceptable by the
NEC and is a typical installation found in 480 volt electrical distribution systems.
Figure 6.1: Partial One-Line Diagram with 6-Hand Rule in Use
The simulation in Figure 6.1 shows a utility serving a main distribution panel
MDP. This MDP is constructed with no main circuit breaker and five feeder breakers
denoted PD-MAIN#1-5. In this state the five feeder breakers are acceptable for use as the
building disconnecting means per NEC, 230, Part VI.
UTILITY
MDPBoltedFault 21.133 kAArcingFault 7.357 kAProtDev PD-UTILITYInc. Energy 47.64 Cal/cm^2PPE Category Dangerous!
PD-MAIN#1200.0 A
PNL N1BoltedFault 13.346 kAArcingFault 5.327 kAProtDev PD-MAIN#1Inc. Energy 0.28 Cal/cm^2PPE Category 0
PD-MAIN#2200.0 A
PNL N2BoltedFault 13.346 kAArcingFault 5.327 kAProtDev PD-MAIN#2Inc. Energy 0.28 Cal/cm^2PPE Category 0
PD-MAIN#3200.0 A
PNL N3BoltedFault 13.346 kAArcingFault 5.327 kAProtDev PD-MAIN#3Inc. Energy 0.28 Cal/cm^2PPE Category 0
PD-MAIN#5225.0 A
CH-1BoltedFault 14.011 kAArcingFault 5.512 kAProtDev PD-MAIN#5Inc. Energy 0.29 Cal/cm^2PPE Category 0
PD-MAIN#4250.0 A
PNL-E1BoltedFault 14.011 kAArcingFault 5.512 kAProtDev PD-MAIN#4Inc. Energy 0.7 Cal/cm^2PPE Category 0
S
P XF-UTIL575.0 kVAPrimary 13200 VSecondary 208 V
PD-UTILITY30.0 A

102
The simulation shows the fault current of the MDP calculated at 21.13kA, which
can be considered a moderate level. The arcing current is shown to be 7.35kA and is a
reasonable level for this type of facility. However, the arc flash hazard for this type of
installation is very high because the only protective device for the main panel (MDP) is
the utility fuse on the primary side of the service transformer. Figure 6.1 shows an
incident energy of 47.64 cal/cm2 at the MDP, which corresponds to a PPE Category of
Dangerous.
Studying the service entrance from a time current analysis gives another
perspective. The TCC is plotted in Figure 6.2 and this shows the utility fuse (PD-UTIL)
interrupting the arcing current beyond 10 seconds thus justifying the high exposure. The
hazard risk category lines are superimposed on the TCC allowing us to see the
justification for this scenario having a hazard risk category of Dangerous.

103
Figure 6.2: TCC Showing Arc Flash Exposure for Six-Hand Rule
This is an unacceptable scenario in a mission critical facility because the incident
energy is above 40 cal/cm2 and, therefore, a hazard risk category of Dangerous.
According to NFPA-70E: energized electrical work is not permitted on this device so
periodic maintenance or facility changes that include this panel cannot be performed
without an electrical shutdown. The feasibility of an electrical shutdown is often not
possible in a mission critical facility, thus the system must be designed and constructed
differently.
Category 4
Category 3
Category 2
Category 1
Category 0
0.5 1 10 100 1K 10K0.01
0.10
1
10
100
1000
CURRENT IN AMPERES
6.2.tcc Ref. Voltage: 480V Current in Amps x 10
TIM
E IN
SE
CO
ND
S
PD-UTILITYPD-UTILITY
Arcing Current at MDPArcing Current at MDP

104
The result of this research is a recommendation that when applying the National
Electric Code, Article 230, Part VI, always specify a single main circuit breaker for
building shutdown and do not use numerous feeder devices as main disconnects.
Furthermore, this single main breaker should be in a separate enclosed device located
away from the MDP. This will isolate the protection device of the main panel from the
technician working on the panel and therefore lowering the arc flash exposure. If the
main breaker is located within the MDP, then there is a dangerous arc flash exposure at
the entrance of the service conductors.
The recommendation for minimizing this exposure is to eliminate the
implementation of numerous main devices. This can be accomplished by installing a low
voltage power circuit breaker ahead of the MDP. This low voltage power circuit breaker
should be specified with adjustable settings in the long time, short time, and
instantaneous time domains. Adjusting the main breaker settings to mitigate the arc flash
will create a safer working environment at the MDP and will allow the facility to be
flexible if the fault contribution from the distribution were to change due to generation
plant or substation alterations.
After the implementation of this recommended circuit breaker installation, the
case study was re-simulated. The one-line diagram showing the computer simulation
results is shown in Figure 6.3. The new 1200 amp main circuit breaker is now located
ahead of the MDP and is referred to PD-MDP NEW.
At each panel the available fault current, arcing fault, incident energy, and PPE
Category are given. The available fault current and arcing current at the MDP remain at
approximately the same level. However, with the new main breaker inserted ahead of the

105
MDP, the result is an incident energy down from 47.6 cal/cm2 and Category Dangerous
to 2.38 cal/cm2 and a Category 1. This is a significant change that would allow
technicians to perform energized maintenance on this device.
Figure 6.3: Partial One-Line Diagram with Main Breaker Installed
The results of this change can be further validated by analyzing the results in the
time versus current domain. The TCC is plotted in Figure 6.4 and it shows the new main
device PD-NEW MAIN plotted with the arcing current of 7.35kA. The plot displays the
interrupting of the arcing current by PD-NEW MAIN at 0.10 seconds which is in the
range of a Category 1 exposure. This allows maintenance to be performed on the MDP
while it is energized and the facility remains in normal operation.
UTILITY
MDPBoltedFault 21.133 kAArcingFault 7.357 kAProtDev PD-NEW MAINInc. Energy 2.38 Cal/cm^2PPE Category 1
PD-MAIN#1200.0 A
PNL N1BoltedFault 13.346 kAArcingFault 5.327 kAProtDev PD-MAIN#1Inc. Energy 0.28 Cal/cm^2PPE Category 0
PD-MAIN#2200.0 A
PNL N2BoltedFault 13.346 kAArcingFault 5.327 kAProtDev PD-MAIN#2Inc. Energy 0.28 Cal/cm^2PPE Category 0
PD-MAIN#3200.0 A
PNL N3BoltedFault 13.346 kAArcingFault 5.327 kAProtDev PD-MAIN#3Inc. Energy 0.28 Cal/cm^2PPE Category 0
PD-MAIN#5225.0 A
CH-1BoltedFault 14.011 kAArcingFault 5.512 kAProtDev PD-MAIN#5Inc. Energy 0.29 Cal/cm^2PPE Category 0
PD-MAIN#4250.0 A
PNL-E1BoltedFault 14.011 kAArcingFault 5.512 kAProtDev PD-MAIN#4Inc. Energy 0.7 Cal/cm^2PPE Category 0
S
P XF-UTIL575.0 kVAPrimary 13200 VSecondary 208 V
PD-UTILITY30.0 A
Enclosed BreakerBoltedFault 23.602 kAArcingFault 7.950 kAProtDev PD-UTILITYInc. Energy 47.83 Cal/cm^2PPE Category Dangerous!
PD-NEW MAIN1200.0 A

106
Figure 6.4: TCC with Main Breaker Installed
Category 4
Category 3
Category 2
Category 1
Category 0
0.5 1 10 100 1K 10K0.01
0.10
1
10
100
1000
CURRENT IN AMPERES
6.4.tcc Ref. Voltage: 480V Current in Amps x 10
TIM
E IN
SE
CO
ND
S
PD-UTILITY
PD-NEW MAIN
PD-UTILITY
PD-NEW MAIN
Arcing Current at MDPArcing Current at MDP

107
6.2 At the Electrical Service Entrance the Design Shall Specify Low Voltage
Power Circuit Breakers Instead of Fused Disconnect Switches
The National Electrical Code, Article 230, Part IV addresses building main shut
down and proper disconnecting methods. Every facility must have a readily accessible
means of disconnecting the electrical service. This is often accomplished by installing a
main fused disconnect switch at the service entrance typically near the electrical meter. A
one-line diagram of this scenario is shown in Figure 6.5.
Figure 6.5: One-Line Diagram Showing Main Fused Disconnect
This electrical system consists of a utility 2500kVA transformer serving a main
disconnect fused at 3200 amps. The fuse is protecting a main distribution panel MDP
which contains three feeder breakers and a fuse. The arc flash hazard for this type of
installation can be high or low depending on the available fault current and the resulting
arcing current. Figure 6.5 shows an incident energy at the MDP of 136 cal/cm2 resulting
in a PPE Category of Dangerous. This is unacceptable for a mission critical facility
UTIL-1
CBL-UTIL
MDP
MDPAFC 35.627 kAArcingFault 19.413 kAIncidentEnergy 135.99 Cal/cm^2PPE Category Dangerous!
BD-1
PD-XF-1PD-XF-1800.0 A
CBL-XF-1
PD-H11
CBL-H11
PD-ATS-CR7
CBL-ATS-CR7
PD-BD
PD-UTILPD-UTIL100.0 A
S
P XF-UTIL2500.0 kVA
CBL-MAIN1
S
P XF-1225.0 kVA
3200 AMP FUSE
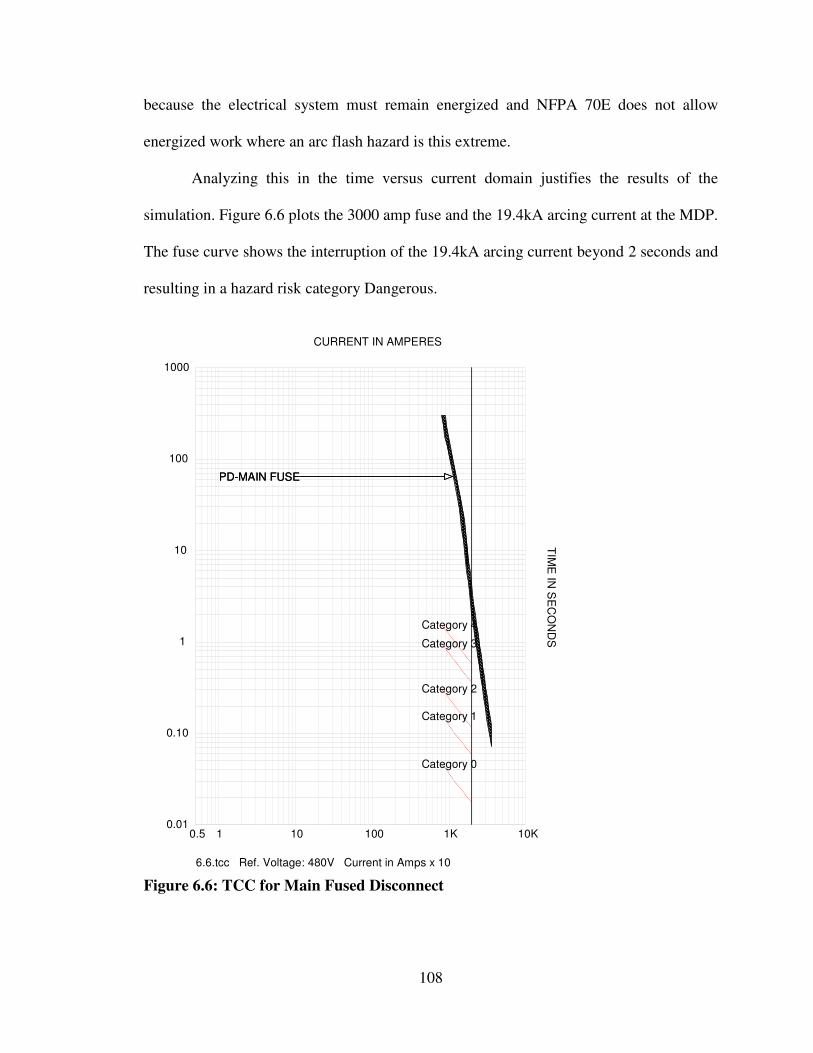
108
because the electrical system must remain energized and NFPA 70E does not allow
energized work where an arc flash hazard is this extreme.
Analyzing this in the time versus current domain justifies the results of the
simulation. Figure 6.6 plots the 3000 amp fuse and the 19.4kA arcing current at the MDP.
The fuse curve shows the interruption of the 19.4kA arcing current beyond 2 seconds and
resulting in a hazard risk category Dangerous.
Figure 6.6: TCC for Main Fused Disconnect
Category 4
Category 3
Category 2
Category 1
Category 0
0.5 1 10 100 1K 10K0.01
0.10
1
10
100
1000
CURRENT IN AMPERES
6.6.tcc Ref. Voltage: 480V Current in Amps x 10
TIM
E IN
SE
CO
ND
S
PD-MAIN FUSEPD-MAIN FUSE

109
The technique developed in this research for minimizing the exposure is to
specify a low voltage power circuit breaker with LSI adjustments instead of the fused
disconnect switch. This will allow for shaping the protection curve based on the available
fault current and arcing current. The one-line diagram showing this system is shown in
Figure 6.7. The simulation of the revised circuit shows the arcing current remaining at
19.4kA which is expected. However, the incident energy was decreased to 4.8 cal/cm2,
resulting in a PPE Category 2.
Figure 6.7: Partial One-Line Diagram for Service Entrance with LSI Main Breaker
Analyzing this in the time versus current domain validates the results of the
simulation. Figure 6.8 plots the new LSI circuit breaker PD-MCB and the arcing current
at the MDP. The breaker curve shows instantaneous interruption of the arcing current at
0.07 seconds and therefore a quicker extinguish of the arc than with the fuse. This is
UTIL-1
CBL-UTIL
MDP
MDPIE 4.8 Cal/cm^2PPE Category 2ArcingFault 19.413 kAProtDev PD-MCB
BD-1
PD-XF-1PD-XF-1800.0 A
CBL-XF-1
PD-H11
CBL-H11
PD-ATS-CR7
CBL-ATS-CR7
PD-BD
PD-UTILPD-UTIL100.0 A
S
P XF-UTIL2500.0 kVA
CBL-MAIN1
PD-MCBPD-MCB3200.0 A
S
P XF-1225.0 kVA

110
shown to occur within the hazard risk category 2 range. The simulations result of incident
energy at 4.8 cal/cm2 is consistent with this finding.
Figure 6.8: TCC for Service Entrance with LSI Main Breaker
Category 4
Category 3
Category 2
Category 1
Category 0
0.5 1 10 100 1K 10K0.01
0.10
1
10
100
1000
CURRENT IN AMPERES
6.8.tcc Ref. Voltage: 480V Current in Amps x 10
TIM
E IN
SE
CO
ND
S
PD-MCB
PD-MAIN FUSE
PD-MCB
PD-MAIN FUSE

111
6.3 Specify Adjustable Low Voltage Power Circuit Breakers for Protection of
Step-Down Transformers Rated above 125kVA
There are several important factors included in the decisions made during the
design of the electrical feeders served from the main distribution panel. The feeder
conductors and circuit breakers must be sized to carry the calculated amount of current
load to avoid an overcurrent situation. The feeder breakers must have proper available
interrupting capacity ratings to withstand the fault currents that they must interrupt during
a short circuit. The feeder breakers must be properly coordinated with the upstream and
downstream protective devices. In mission critical facilities, the transformers and
subpanels served by these feeders must be properly maintained and therefore the arc flash
hazards at these locations are important.
The service voltage in the facilities being studied is 480 volt, three-phase.
However, there are numerous loads in a building that require 120/208 volt service, such
as air conditioning equipment, service receptacles, computers, and lighting. This creates a
need for the 480 volt service voltage to be transformed down to 120/208 volts. This is
accomplished by creating a lower voltage leg in the system by inserting a large step-down
transformer fed from the main panel to serve 120/208 volt loads downstream. A one-line
diagram of this scenario with a thermal magnetic breaker (PD-XF-1) protecting a
225kVA transformer feeding Panel L1 is shown in Figure 6.9.

112
Figure 6.9: Partial One-Line Diagram Showing Arc Flash Increase across 225kVA
The challenge with this scenario is with the decrease in fault current and arcing
current that occurs across the transformer. This is expected due to the amount of
impedance that the transformer represents in this circuit. The simulation in Figure 6.9
shows the available fault current on the primary side of the 225kVA transformer at
32.17kA and the available fault current at the secondary side at 10.38kA.
Following the equations of IEEE 1584, the fault current has been shown to
directly relate to the arcing current. Therefore, the arcing current at the secondary side of
the transformer will also decrease considerably when compared to the primary side. The
simulation in Figure 6.9 shows the arcing current on the primary side of the 225kVA
transformer at 17.79kA and the arcing current at the secondary side at 3.79kA. The
UTIL-1
CBL-UTIL
MDP
PD-XF-1PD-XF-1300.0 A
PANEL L1PANEL L1AFC 10.127 kAArcingFault 3.730 kAIncidentEnergy 22.86 Cal/cm^2PPE Category 3
PD-UTIL100.0 A
S
P XF-UTIL2875.0 kVA
CBL-MAIN1
PD-MCBPD-MCB3200.0 A
S
P XF-1225.0 kVA
XF-1primaryAFC 32.175 kAArcingFault 17.794 kAIncidentEnergy 1.55 Cal/cm^2PPE Category 1
XF-1secondaryAFC 10.383 kAArcingFault 4.466 kAIncidentEnergy 27.78 Cal/cm^2PPE Category 4

113
decreased arcing current at the secondary will delay the time for the primary side breaker
to interrupt an arc flash.
The amount of time needed to interrupt the arc is directly related to the arc flash
incident energy. This leads to an increase in incident energy from 0.6 cal/cm2 on the
primary side of the transformer to 23.3cal/cm2 on the secondary side and a PPE category
change from 1 to 4. This is a significant increase in the protection equipment required to
work on this energized equipment.
Analyzing this in the time versus current domain further validates this outcome.
Figure 6.10 displays the TCC plot for the primary side of the transformer. The circuit
breaker PD-XF-1 is plotted along with the primary side arcing current of 17.79kA. It is
shown that the circuit breaker interrupts the arc at approximately 0.015 seconds which is
in the range of hazard category line 1. The calculations in the simulation calculate this at
1.55cal/cm2.

114
Figure 6.10: TCC Showing Thermal-Mag Breaker and Arcing Current at Primary
of XF-1
Figure 6.11 displays the TCC plot for the secondary side of the transformer. The
circuit breaker PD-XF-1 is plotted along with the secondary side arcing current of
4.46kA. The plot shows the decrease in fault current and therefore lowering of the arcing
current across the transformer XF-1. This moves the arcing current level inside the
instantaneous adjustable range of the thermal magnetic breaker, thus causing the long
exposure time and high arc flash hazard. It is shown that the circuit breaker interrupts the
Category 4
Category 3
Category 2
Category 1
Category 0
0.5 1 10 100 1K 10K0.01
0.10
1
10
100
1000
CURRENT IN AMPERES
6.10.tcc Ref. Voltage: 480V Current in Amps x 10
TIM
E IN
SE
CO
ND
S
PD-XF-1PD-XF-1
Arcing current at XF-1 primaryArcing current at XF-1 primary

115
arc at approximately 50 seconds, which is above all hazard category lines and therefore
considered dangerous for energized work. However, IEEE 1584 limits the maximum
exposure time for calculating incident energy at 2 seconds and therefore the calculations
in the simulation report this at 27.78kA cal/cm2 which corresponds to a hazard risk
category 4.
Figure 6.11: TCC Showing Thermal-Mag Breaker and Arcing Current at
Secondary of XF-1
Category 4
Category 3
Category 2
Category 1
Category 0
0.5 1 10 100 1K 10K0.01
0.10
1
10
100
1000
CURRENT IN AMPERES
6.11.tcc Ref. Voltage: 480V Current in Amps x 10
TIM
E IN
SE
CO
ND
S
PD-XF-1PD-XF-1
Arcing current at XF-1 SecondaryArcing current at XF-1 Secondary

116
Category 4 personal protective equipment is available, but it is preferred to lower
the exposure to a category 0 or 1 whenever possible and limit the potential exposure of
the technicians. It is the conclusion of this analysis to protect these transformers with a
low voltage power circuit breaker containing adjustable LSI adjustments in lieu of the
standard thermal magnetic circuit breaker. Although the thermal magnetic breaker has
instantaneous adjustment, this change in arcing current is shown to potentially attenuate
into the short time region and delay the interrupt time. The low voltage power circuit
breakers with LSI are adjustable in the short time and therefore can mitigate this arc flash
exposure by interrupting the arc much quicker. The simulation one-line diagram showing
this improved system is shown in Figure 6.12.

117
Figure 6.12: Partial One-Line Diagram Showing Arc Flash Mitigation across
225kVA
The simulation for the new system shows that the available fault currents on the
primary and secondary of the transformer have not changed. Hence, the arcing currents
on the primary and secondary of the transformer have not changed. However, due to the
quicker interrupting time of the LSI circuit breaker, the result is lowered incident energy
of 0.55 cal/cm2 on the primary side of the transformer and 2.85 cal/cm
2 on the secondary
UTIL-1
MDP
PD-XF-1400.0 A
PANEL L1AFC 10.127 kAArcingFault 4.389 kAIncidentEnergy 0.55 Cal/cm^2PPE Category 0
PD-UTIL100.0 A
S
P XF-UTIL2875.0 kVA
PD-MCB3200.0 A
S
P XF-1225.0 kVA
XF-1primaryAFC 32.175 kAArcingFault 17.794 kAIncidentEnergy 0.55 Cal/cm^2PPE Category 0
XF-1secondaryAFC 10.383 kAArcingFault 4.466 kAIncidentEnergy 2.85 Cal/cm^2PPE Category 1

118
side. The primary side of the transformer is decreased to a hazard risk category 0 and the
secondary side is reduced to a category 1.
Analyzing this in the time versus current domain validates the results of the
simulation. Figure 6.13 plots the new LSI circuit breaker PD-XF-1 and the arcing current
on the primary side of the transformer. The breaker curve shows instantaneous
interruption of the arcing current and therefore a quicker extinguish of the arc than the
thermal magnetic breaker. This is shown to occur in the hazard risk category 0 range. The
simulation result of incident energy at 0.055 cal/cm2 is consistent with this finding.

119
Figure 6.13: TCC Showing LSI Breaker and Arcing Current at Primary of XF-1
Figure 6.14 shows the decrease in fault current and therefore lowering of the
arcing current across the transformer XF-1. This moves the arcing current level inside the
adjustable short-time range of the LSI breaker. Setting the short time inside the arcing
current allows for short exposure time and low arc flash hazard. Circuit breaker PD-XF-1
is shown to interrupt the arcing current at approximately 0.21 seconds and therefore low
incident energy is calculated and a PPE Category 1 is calculated on the secondary of the
Category 4
Category 3
Category 2
Category 1
Category 0
0.5 1 10 100 1K 10K0.01
0.10
1
10
100
1000
CURRENT IN AMPERES
6.13.tcc Ref. Voltage: 480V Current in Amps x 10
TIM
E IN
SE
CO
ND
S
PD-XF-1PD-XF-1
Arcing current at XF-1 primaryArcing current at XF-1 primary

120
transformer. This is consistent with the simulation incident energy calculation resulting in
2.85cal/cm2.
Figure 6.14: TCC Showing LSI Breaker and Arcing Current at Secondary of XF-1
Category 4
Category 3
Category 2
Category 1
Category 0
0.5 1 10 100 1K 10K0.01
0.10
1
10
100
1000
CURRENT IN AMPERES
6.14.tcc Ref. Voltage: 480V Current in Amps x 10
TIM
E IN
SE
CO
ND
S
PD-XF-1PD-XF-1
Arcing current at XF-1 SecondaryArcing current at XF-1 Secondary
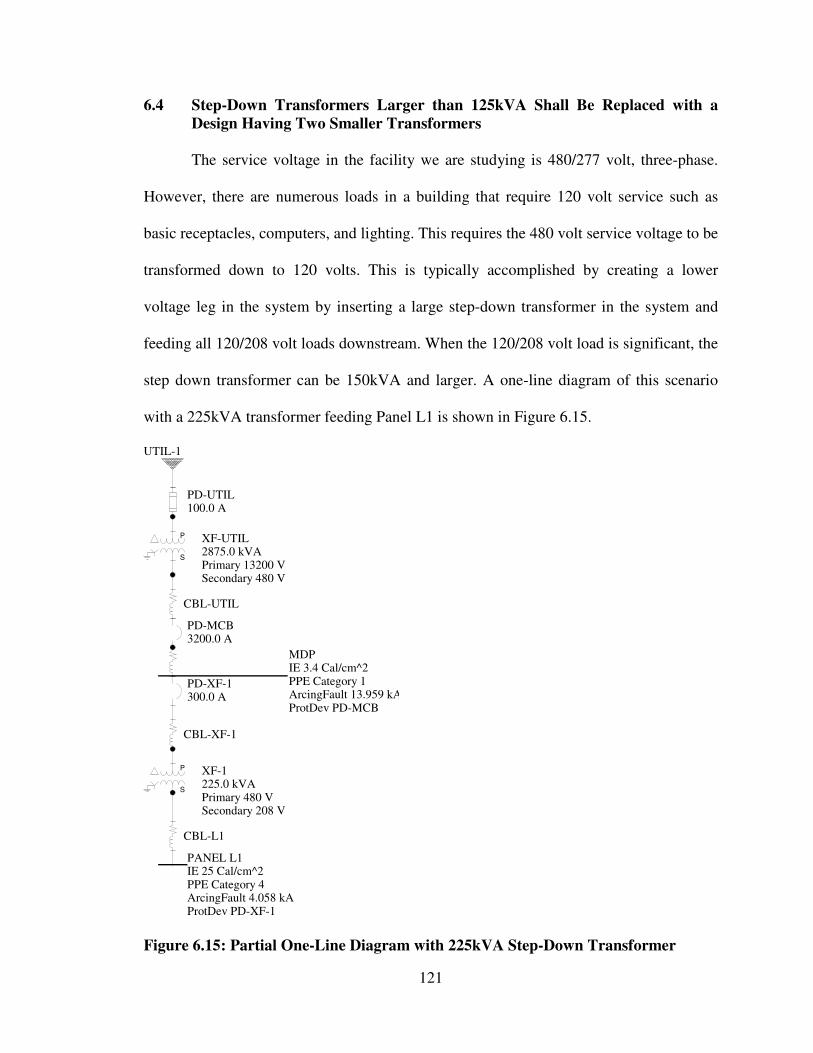
121
6.4 Step-Down Transformers Larger than 125kVA Shall Be Replaced with a
Design Having Two Smaller Transformers
The service voltage in the facility we are studying is 480/277 volt, three-phase.
However, there are numerous loads in a building that require 120 volt service such as
basic receptacles, computers, and lighting. This requires the 480 volt service voltage to be
transformed down to 120 volts. This is typically accomplished by creating a lower
voltage leg in the system by inserting a large step-down transformer in the system and
feeding all 120/208 volt loads downstream. When the 120/208 volt load is significant, the
step down transformer can be 150kVA and larger. A one-line diagram of this scenario
with a 225kVA transformer feeding Panel L1 is shown in Figure 6.15.
Figure 6.15: Partial One-Line Diagram with 225kVA Step-Down Transformer
UTIL-1
PD-UTIL100.0 A
CBL-UTIL
S
P XF-UTIL2875.0 kVAPrimary 13200 VSecondary 480 V
PD-MCB3200.0 A
MDPIE 3.4 Cal/cm^2PPE Category 1ArcingFault 13.959 kAProtDev PD-MCB
PD-XF-1300.0 A
CBL-XF-1
S
P XF-1225.0 kVAPrimary 480 VSecondary 208 V
CBL-L1
PANEL L1IE 25 Cal/cm^2PPE Category 4ArcingFault 4.058 kAProtDev PD-XF-1

122
The computer simulation of the circuit described in Figure 6.15 shows an incident
energy of 25 cal/cm2 and a PPE Category 4.
The TCC for this configuration is plotted in Figure 6.16 and this shows the circuit
breaker (PD-XF-1) interrupting the arcing current beyond 2 seconds thus confirming the
high exposure.
Figure 6.16: TCC Showing Arc Flash Hazard at Panel L1
Category 4
Category 3
Category 2
Category 1
Category 0
0.5 1 10 100 1K 10K0.01
0.10
1
10
100
1000
CURRENT IN AMPERES
6.16.tcc Ref. Voltage: 480V Current in Amps x 10
TIM
E IN
SE
CO
ND
S
PD-XF-1PD-XF-1
Arcing current at Panel L1Arcing current at Panel L1

123
The recommendation for minimizing this exposure is to replace one large step
down transformer with multiple smaller transformers that are less than 125kVA. The
increased impedance of the smaller conductors and transformers brings down the fault
current and arcing current. The smaller rated circuit breaker has the ability to stay below
this arcing value. This also allows for application of NFPA 70E option of reporting
Category 0 for any bus served by a transformer less than 125kVA and 240 volts. The
one-line diagram showing this system is shown in Figure 6.17. The 225kVA transformer
feeding Panel L1 is replaced by two 112.5kVA transformers feeding Panels L1 and L2.
The result is an incident energy of 0.2 cal/cm2 and a Category 0.
Figure 6.17: Partial One-Line Diagram Showing Two 112.5kVA Transformers
UTIL-1
PD-UTIL100.0 A
CBL-UTIL
S
P XF-UTIL2875.0 kVAPrimary 13200 VSecondary 480 V
PD-MCB3200.0 A MDP
IE 3.4 Cal/cm^2PPE Category 1ArcingFault 13.959 kAProtDev PD-MCB
PD-XF-2150.0 A
CBL-XF-2
S
P XF-2112.5 kVAPrimary 480 VSecondary 208 V
CBL-L2
PANEL L2IE 0.2 Cal/cm^2PPE Category 0ArcingFault 2.445 kAProtDev PD-XF-2
PD-XF-3150.0 A
CBL-XF-3
S
P XF-3112.5 kVAPrimary 480 VSecondary 208 V
CBL-L3
PANEL L3IE 0.2 Cal/cm^2PPE Category 0ArcingFault 2.445 kAProtDev PD-XF-3

124
The TCC for this configuration is plotted in Figure 6.18 and this shows the circuit
breaker (PD-XF-2) interrupting the arcing current at 0.027 seconds therefore reducing the
incident and PPE Category.
Figure 6.18: TCC Showing Arc Flash Hazard at Panel L2
Category 4
Category 3
Category 2
Category 1
Category 0
0.5 1 10 100 1K 10K0.01
0.10
1
10
100
1000
CURRENT IN AMPERES
6.18.tcc Ref. Voltage: 480V Current in Amps x 1
TIM
E IN
SE
CO
ND
S
PD-XF-2PD-XF-2
Arcing current at Panel L2 Arcing current at Panel L2

125
This chapter has focused on the introduction and implementation design
techniques developed during this dissertation research intended to mitigate the arc flash
hazard at specific locations in a 480 volt electrical distribution system. The four
techniques were described and simulated in locations of an electrical system where a high
arc flash hazard is typically present due to inherent properties of the system design. When
applied as shown, these methods resulted in the ability to considerably decrease the arc
flash hazard. While planning mission critical facilities, electrical design engineers can
develop systems with lower arc flash hazards by implementing these techniques.

126
7. CONCLUSIONS AND FUTURE WORK
This work has been focused on techniques for mitigating arc flash hazard
exposure in 600 volt and below electrical systems. The methodologies for fault current
calculations, protective device coordination, and arc flash hazard analysis have been
presented. Several of the mainstream arc flash mitigation products and techniques have
been described. Case studies of existing facility arc flash studies have been presented
along with the applied mitigation solutions. The theory of instituting design techniques
with the goal of mitigating the arc flash hazard was developed and tested.
7.1 Conclusions
The impact of using four design techniques to decrease the arc flash hazard at
specific locations in an electrical distribution system has been examined.
1. When applying the National Electric Code, Article 230, Part VI, always
specify a single main circuit breaker for building shutdown.
The first design technique is applied at the electrical service entrance and is aimed
at lowering the arc flash hazard at the main distribution panel. The simulation showed
that when multiple electrical disconnects are used as permitted by NEC, Article 230, Part
VI, the arc flash hazard can be extremely high. When designing the system with one main
circuit breaker the main distribution panel has an interrupting device to limit the exposure
of an arc flash.

127
The implementation of this design technique for this particular case decreased the
arc flash incident energy from 47.6cal/cm2 to 0.95cal/cm
2. This changed the PPE
category from a Dangerous level down to a category 0. This allows a qualified technician
to perform maintenance on this device with minimal arc-flash exposure.
2. At the electrical service entrance the design shall specify enclosed low voltage
power circuit breakers in place of fused disconnects.
The second design technique is applied at the electrical service entrance and is
also aimed at lowering the arc flash hazard at the main distribution panel. The simulation
showed that sometimes when fused disconnects are used as permitted by NEC, Article
230, Part VI, the arc flash hazard can be extremely high at the main distribution panel.
When designing the system with a low voltage power circuit breaker with LSI
adjustments as the main circuit breaker the exposure of an arc flash is limited.
The implementation of this design technique for the particular case analyzed
decreased the arc flash incident energy from 136cal/cm2 to 4.8cal/cm
2. This changed the
PPE category from a Dangerous level down to a category 2. This allows a qualified
technician to perform maintenance on this device with minimal arc-flash exposure.
3. Specify adjustable low voltage power circuit Breakers for protection of step-
down transformers rated above 125kVA.
The third design technique is applied at a feeder circuit from the main distribution
panel that is serving a step down transformer. The simulation showed that when a
transformer larger than 125kVA is protected by a thermal magnetic breaker, the
secondary side arc flash hazard can be extremely high. When designing the feeder with a

128
low voltage power circuit breaker with LSI adjustments the arc flash exposure can be
mitigated to a safer level.
The implementation of this design technique for this particular case decreased the
arc flash incident energy from 23.3cal/cm2 to 0.6cal/cm
2. This changed the PPE category
from a category 3 level down to a category 0. This allows a qualified technician to
perform maintenance on this device with minimal arc flash exposure.
4. Step-Down Transformers larger than 125kVA shall be replaced with a design
having two smaller kVA transformers.
The fourth design technique is applied at a feeder circuit from the main
distribution panel that is serving a step down transformer. The simulation showed that
when a transformer larger than 125kVA is protected by a thermal magnetic breaker the
secondary side arc flash hazard can be extremely high. When designing the feeder with
two smaller circuits with reduced kVA transformers the arc flash hazard is reduced
significantly.
The implementation of this design technique for this particular case studied
decreased the arc flash incident energy from 25.0cal/cm2 to 0.2cal/cm
2. This changed the
PPE category from a category 4 level down to a category 0. This allows a qualified
technician to perform maintenance on this device with minimal arc-flash exposure.
In all four cases the implementation of the recommended design technique has
shown a significant decrease in the incident energy and hazard risk category. Table 7.1
displays the cumulative results of all four methods for each particular case and
summarizes the decrease of the arc flash hazard.

129
Table 7.1 Before and After Arc Flash Hazard
Method
#
Before Incident Energy
(cal/cm2)
Before
Category
After Incident Energy
(cal/cm2)
After
Category
1 47.6 Dangerous 0.95 0
2 23.3 3 0.6 0
3 136 Dangerous 4.8 2
4 25 4 0.2 0
7.2 Further Work
The application of these design techniques are based on the interpretation of the
most current publications of NFPA-70E and IEEE-1584 and should be applied within that
framework. There is a continued joint research effort by NFPA and IEEE to further the
understanding of arc flash hazards. As this research is performed, new codes and
standards are likely to be released in the future. The design techniques described in this
work should be verified under any new releases of codes and standards.
The design techniques described in this dissertation should be offered for
continuing education to design engineers. If these methods become a part of the design
process then the constructed electrical systems will have more flexibility to control arc
flash hazards.

130
REFERENCES
[1] Jim Phillips, P.E., “The History of Arc Flash and Electrical Safety” May 2009,
Electrical Contractor Magazine.
[2] Charles F. Dalziel, “The Effects of Electric Shock on Man” 1956
[3] Jim Phillips, P.E., “Fitting the Puzzle Pieces Together to Provide Electrical Safety”
NEC Digest, February 2005.
[4] Ralph Lee, “The Other Electrical Hazard: Electric Arc Blast Burns,” IEEE Trans.
Industrial Applications, Vol. 1A-18, No. 3, p246, May/June 1982.
[5] Richard L. Doughty, Dr. Thomas E. Neal, H Landis Floyd, “Predicting Incident
Energy to Better Manage The Electric Arc Hazard on 600 V Power Distribution
Systems,” IEEE, Paper No. PCIC-96-36, 1998.
[6] IEEE Guide for Arc Flash Hazard Calculations, IEEE Standard 1584-2002.
[7] Finley Ledbetter, Scott Peterson, “Arc Flash Mitigation – Distance is Safety,” Group
CBS Inc. Technical Paper 2004.
[8] Thomas E. Neal, Allen H. Bingham, Richard L. Doughty, “Protective Clothing
Guidelines for Electric Arc Exposure,” IEEE Trans. Vol. 33, No. 4 July/August 1997.
[9] Thomas E. Neal, Allen H. Bingham, Richard L. Doughty, Terrence A. Dear, “Testing
Update on Protective Clothing & Equipment for Electric Arc Exposure,” IEEE Paper
No. PCIC-97-35..
[10] NFPA 70E, Standard for Electrical Safety in the Workplace, 2004 Edition.
[11] Keith Lane, P.E., “Beware of Simplistic Fault Current Calculations” September
2001, Electrical Contractor Magazine.
[12] Baldwin Bridger, P.E. “X/R Ratio” Tech Brief, NETA WORLD, Winter 2009-2010.
[13] J. Duncan Glover & Mulukutula S. Sarma, Power System Analysis and Design,
Brooks/Cole 2001.

131
[14] Baldwin Bridger, P.E. “Short Circuit Currents” Tech Brief, NETA WORLD, Winter
2009-2010.
[15] IEEE Recommended Practice for Protection and Coordination of Industrial and
Commercial Power Systems, IEEE std. 242-2001(Buff Book).
[16] Ralph E. Fehr III, Industrial power Distribution, Prentice Hall Inc., New Jersey,
2002
[17] 2005 National Electric Code, National Fire Protection Association, pp. 27.
[18] Ed Larson, Jim Degnan, “Selective Coordination in low-Voltage Power Distribution
Systems: Is the Level Important?” IEEE/IAS Industrial and Commercial power
Systems Technical Conference, May 2008.
[19] L. Kumpulainen, S. Dahl, J. Ma, “Mitigation of Arc-Flash Hazards and Reduction of
Coasts be Selective Arc-Flash Protection” CICED 2008 China Internal Conference on
Electricity Distribution, December 2008.
[20] M. Murphy, “How to Form a Bounding Arc Flash Study for Your Site” IEEE/IAS
Electrical Safety Workshop, Dallas, Texas, March 18-21, 2008.
[21] D M. Doan, “Designing a Site Electrical System with Arc Flash Energy under 20
cal/cm2” IEEE/IAS Electrical Safety Workshop, Dallas, Texas, March 18-21, 2008..
[22] William A. Brown, Ron Shapiro “A Comparison of Arc Flash Incident Energy
Reduction Techniques Using Low Voltage Power Circuit Breakers” IEEE/IAS
Industrial and Commercial power Systems Technical Conference, August 2006.
[23] Christopher Inshaw, Robert A. Wilson, “Arc Flash Hazard Analysis and Mitigation”.
[24] H. Wallace Tinsley III, Michael Hodder, Aidan M. Graham, “Beyond the
Calculations: Life After Arc Flash Analysis”.
[25] Catherine Irwin, Udo Kerssebaum, Helmut Eichinger, Daniel Doan, “Mitigating
Personnel Exposure to the Arc Flash Hazard”.
[26] Robert A. Wilson, Rainer Harju, Juha Keisala, Sethuraman Ganesan “Tripping With
The Speed of light: Arc Flash Protection”..
[27] Daniel R. Doan, Jennifer Slivka, Chris Bohrer, “A Summary of Arc Flash Hazard
Assessments and Safety Improvements”.
[28] G.E. Heberlein Jr., J.A. Higgins, and R.A. Epperly, ‘Report on Enclosure Internal
Arc Tests”, IEEE Industry Applications Magazine, Vol 2, Issue 3, May/June 1996, pp
35-42.

132
[29] IEEE Standard C37.20, Standard for Metal Enclosed Low Voltage Power Circuit
Breaker Switchgear.
[30] ABB Corporation, “Arc Protection Technical Aspects” January 2005.
[31] ABB Corporation Buyers Guide, REA 10_Arc Protection Relay, 1MRS750929-
MBG, May 1999.
[32] ABB Corporation Instruction Booklet, MSOC Relay, IB 7.2.1.7-16 Issue D, June
2000.
[33] Thomas A. Domitrovich, Adrian M. Graham, Charles J Nochumson “Selective
Coordination versus Arc Flash – The Great Debate”, IEEE/IAS Electrical Safety
Workshop, St. Louis, MO, February 2-6, 2009.
[34] “NFPA 70 National Electrical Code Handbook”, National Fire Protection
Association, 1996.
[35] 2008 National Electric Code, National Fire Protection Association.
[36] Roger C. Dugan, Mark F. McGranahan, Surya Santoso, H. Wayne Beaty, Electrical
Power Systems Quality, McGraw Hill 2002.
[37] Richard C. Dorf, The Electrical Engineering Handbook, CRC Press 1993.
[38] James J. Burke, Power Distribution Engineering, Fundamentals and Applications,
Marcel Dekker, Inc. 1994.
[39] David D. Roybal, P.E. “Circuit Breaker Interrupting Capacity and Short-Time
Current Ratings” IEEE Industry Applications Magazine, July/August 2005.
[40] UL489-2002, Molded Case Circuit Breakers and Circuit Breaker Enclosures,
Northbrook, IL: UL.
[41] ANSI/IEEE C37.13-1997, IEEE Standard for Low-Voltage AC Power Circuit
Breakers Used in Enclosures, Northbrook, IL: UL.
[42] IEEE Recommended Practice for Applying Low-Voltage Circuit Breakers used in
Industrial and Commercial Power Systems, IEEE Std. 1015-2005 (IEE Blue Book)
Recognized as an American National Standard (ANSI).
[43] Clive W. Kimblin, William Long, “Low-Voltage Power Circuit Breakers and
Molded Case Circuit Breakers – A Comparison of Test Requirements” IEEE Industrial
and Commercial Power Systems Technical Conference, 1999.

133
[44] UL Standard for Safety for Low-Voltage AC and DC Power Circuit Breakers Used
in Enclosures, UL 1066, Third Edition, May 30, 1997.
[45] ANSI C37.16-1997, Low-Voltage Power Circuit Breakers and AC Power Circuit
Protectors – Preferred Ratings, Related Requirements and Applications
Recommendations.
[46] ANSI C37.50-1989, Low –Voltage AC Power Circuit Breaker used in Enclosures-
Test Procedures.
[47] P.G. Newberry, “Fuse Technology – Progress to Date” Electronica and Power
Magazine, February 1976.
[48] Energy Information administration historical electrical data: ww.eia.doe.gov.
[49] IEEE Recommended Practice for Electrical Power Distribution for Industrial plants,
IEEE std. 141-2001(Red Book).
[50] IEEE Recommended Practice for Grounding of Industrial and Commercial Power
Systems, IEEE std. 142-2001(Green Book).
[51] John Merrell, “The Importance of the X/R Ratio in Low-Voltage Short Circuit
Studies. ww.powerstudies.com, 1999.
[52] GE Electrical Distribution & Control Low-Voltage Protector Application Seminar,
August 1999.