apresenta o base 13.08 - 2) · 1 bradesco presentation this presentation may contain...
TRANSCRIPT

1
Bradesco PresentationThis presentation may contain forward-looking statements. Such statements are not statements ofhistorical facts and reflect the beliefs and expectations of the Company's management. The words"anticipates”, "believes”, "estimates”, "expects”, "forecasts”, "plans”, "predicts”, "projects”, "targets"and similar words are intended to identify these statements, which necessarily involve known andunknown risks and uncertainties. Known risks and uncertainties include but are not limited to theimpact of competitive services and pricing market acceptance of services, service transactions by theCompany and its competitors, regulatory approval, currency fluctuations, changes in service mixoffered, and other risks described in the Company's registration statement and other Securities andExchange Commission filings. Forward-looking statements speak only as of the date they are madeand Banco Bradesco does not undertake any obligation to update them in light of new information orfuture developments.

2
For the complete schedule, please visit bradesco.com.br/ir
Upcoming Public Events
*Live online streaming with simultaneous translation to English
Aug 14: APIMEC – Brasília/DF*
Aug 21: APIMEC – Rio de Janeiro/RJ*
Aug 28: APIMEC – São Paulo/SP*
Sep 18: APIMEC – Recife/PE*
Oct 02: APIMEC – Uberlândia/MG*

3
Content
2010 Guidance x Realized 147 Delinquency Ratio > 90 days 88
2011 Guidance 148 Delinquency Ratio 61 to 90 days 89
Administrative Bodies 38 Distribution Network 30
Allowance for Loan Losses, Overdue Credits and
Coverage Ratio94
Distribution of borrowers by level of debt (total debt/annual
income) - 2011 20
Allowance for Loan Losses/ PLL / Write-off 92Distribution of Brazilian Families' Indebtedness: Social
Classes (2011) 19
Balance Sheet by Currency 75 Dividends 51
Balance Sheet by Maturity 76 Economic Indexes 24
Book Net Income x Adjusted Net Income 56 Efficiency Ratio 53
Bradesco Retail - Bradesco Expresso 33 EPS and Net Income 52
Bradesco Strategy 28 Evolution of Brazilian 23
Brazilian Exports (by Country of
destination)Productivity 22Expanded Loan Portfolio 81-82
Brazilian Financial System 25 Fee Income 65-66
Brazilian GDP 9 Hand-in-hand with Corporate Governance 41
Capital Markets 144-146 Highlights of Banco Bradesco 26
Cards 113-121 Impact on Efficiency 45
Client Base 35 Income Statement 55/58
Client Segmentation 36Indebtedness of Brazilian Families (% Income), Average
Maturity and Interest Rate for Individuals 18
Consolidated Balance Sheet 74 Insurance and Pension Plans 128-143
Consumer Financing 85Investments in Infrastructure, Information Technology and
Telecommunications47
Core NIM & NII 62 IT Revitalization Plan 44
CPI (IPCA) 6 Liquidity 49
Credit NII 64 Loan Portfolio 91
Credit Quality and Concentration 87 Loan Portfolio - Corporate 86
Daily transactions vs. availability 43
4
Content
Loan Portfolio – Individuals 84 Other Administrative Expenses 68
Loan Portfolio Breakdown 83 Payroll-Deductible Loans 122-127
Loan/Brazil 's GDP Ratio 16 Poverty Ratio 12
Loan/World's GDP Ratio 17 Presence Abroad 34
Loans and Funding 80 Provisioning Ratios 93
Macroeconomic Outlook 5 Real Wages 14
Main Funding 77-78 Renegotiated Portfolio 90
Main Ratings 40 Reserve Requirements and Restricted Loans 79
Market Capitalization 50 Shareholders’ Profile – Bradesco 39
Market Shares 29 Shareholders’ Structure 37
Mass of Salaries 15 Simulation of the impact of Basel 73
Mobility and Other Service Channels 32 Social Mobility in Brazil 13
Mortgage 95-102 Spread 63
Net Income and Efficiency Ratio 54 Stock Evolution 48
New System Architecture (NSA) – Profitability
Increase46 Tax Credit on Shareholders’ Equity Ratio and Capital 71
NII 59/61 Tax Expenses 70
NII- Interest /Trading Gains 60 The Top 10 Banking Brands in the World 27
Nominal and Real Interest Rates 8 Total Assets and Shareholders’ Equity 72
Nominal Interest Rates 7 Trade Balance 1991-2012 21
Operating Expenses 67 Transaction Breakdown 42
Operational Coverage Ratio 69 Unemployment Rate 10-11
Organic Growth of the Distribution Channels 31 Unrealized Gains 57
Vehicles 103-112

5
Macroeconomic Outlook
** Focus Forecast: As of 08/08/2012
* As of 08/13/2012
2013* 2012 2013
Bradesco Market Consensus**
2012 *
2.10%
5.21%
1.95
7.50%
4.00%
5.50%
2.00
8.50%
1.81%
5.11%
2.00
7.25%
2.73%
6.50%
1.88
11.00%
4.00%
5.50%
2.00
8.50%
2011
GDP
Interest Rate
(year-end Selic)
Inflation (CPI)
FX Rate
(year-end R$/US$)

6
%
CPI (IPCA)CPI (IPCA)
Prepared by / (*) Projections: Bradesco - DEPEC
As of 08/13/2012Source: IBGE
12.5
9.3
7.6
5.7
3.1
4.5
5.9
4.3
5.96.5
5.2 5.5
2002 2003 2004 2005 2006 2007 2008 2009 2010 2011 2012* 2013*

7
Nominal Interest Rates
As of 08/13/2012Source: Brazilian Central Bank Prepared by/ (*) Projections: Bradesco - DEPEC
%
11.75
13.00
13.75
12.75
11.25
10.25
9.25
8.75
9.50
10.25
10.75
11.2511.75
12.0012.25
12.50
12.00
11.50
11.00
10.50
9.75
9.00
8.50
8.00
7.50 7.758.008.25
8.50
Feb-08
Apr-08
Jun-08
Aug-08
Oct-08
Dec-08
Feb-09
Apr-09
Jun-09
Aug-09
Oct-09
Dec-09
Feb-10
Apr-10
Jun-10
Aug-10
Oct-10
Dec-10
Feb-11
Apr-11
Jun-11
Aug-11
Oct-11
Dec-11
Feb-12
Apr-12
Jun-12
Aug-12
Oct-12
Dec-12
Feb-13
Apr-13
Jun-13
Aug-13
Oct-13
Dec-13

8
Nominal(1) and Real(2) Interest Rates
As of 08/13/2012
Notes: (1) Average Nominal Selic; (2) Average Nominal Selic deflationed by IPCAPrepared by/ (*) Projections: Bradesco - DEPEC
16.2
19.0
15.1
11.912.5
9.9 9.8
11.6
8.1 7.88.0
12.611.6
7.16.2
5.4
3.74.8
2.4 2.5
2004 2005 2006 2007 2008 2009 2010 2011 2012* 2013*
Nominal Real
%

9
Brazilian GDP
Source: IBGE Prepared by / (*) Projections: Bradesco - DEPEC
As of 08/13/2012
1987
1988
1989
1990
1991
1992
1993
1994
1995
1996
1997
1998
1999
2000
2001
2002
2003
2004
2005
2006
2007
2008
2009
2010
3.5
-0.1
3.2
-4.3
1.0
-0.5
4.75.3
4.4
2.1
3.4
0.0 0.3
4.3
1.3
2.7
1.1
5.7
3.2
4.0
6.1
5.2
-0.3
7.5
2.7
2011
2.1
2012*
%
4.0
2013*
10
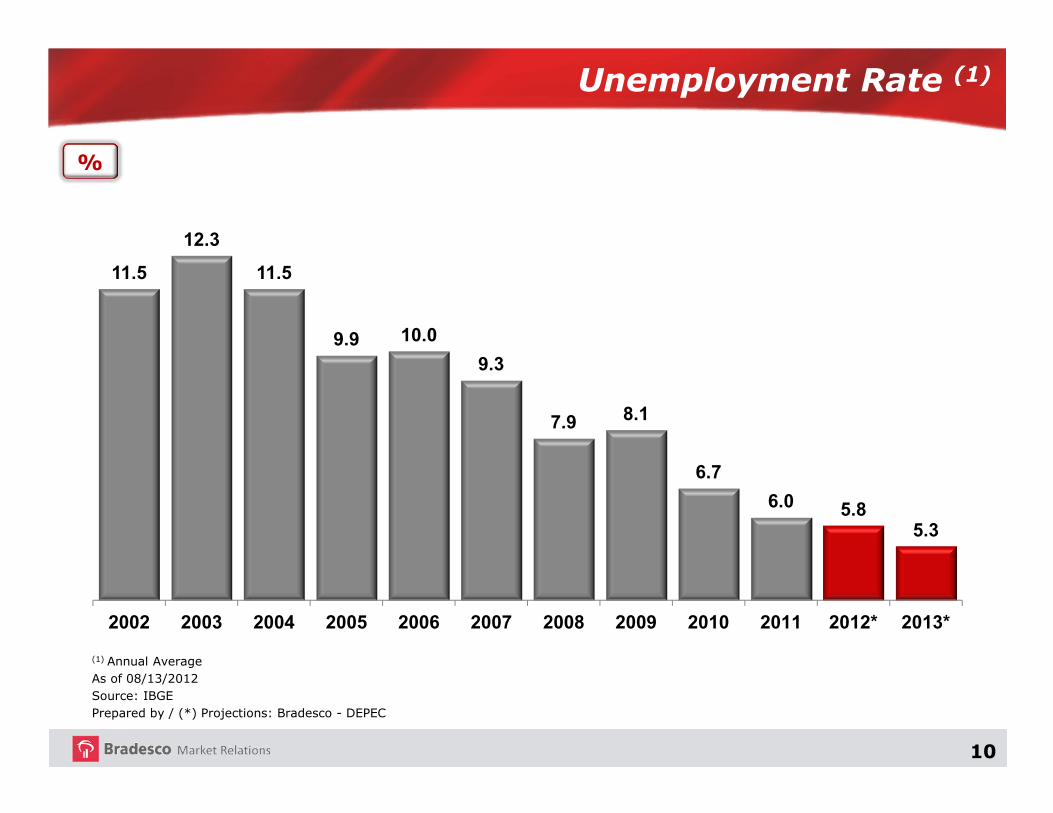
Unemployment Rate (1)
(1) Annual AverageAs of 08/13/2012Source: IBGE Prepared by / (*) Projections: Bradesco - DEPEC
11.5
12.3
11.5
9.9 10.0
9.3
7.9 8.1
6.7
6.0 5.85.3
2002 2003 2004 2005 2006 2007 2008 2009 2010 2011 2012* 2013*
%
11
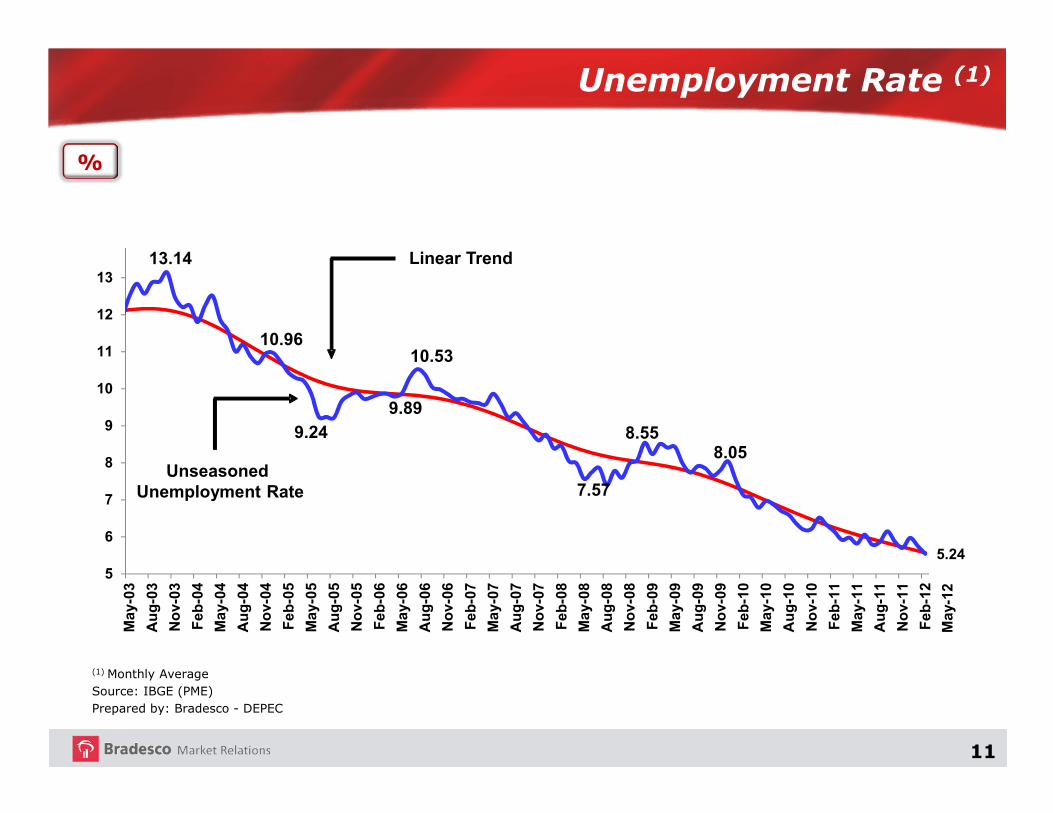
Unemployment Rate (1)
(1) Monthly AverageSource: IBGE (PME)Prepared by: Bradesco - DEPEC
Unseasoned Unemployment Rate
Linear Trend
%
13.14
10.96
9.24
9.89
10.53
7.57
8.558.05
5.245
6
7
8
9
10
11
12
13
May-03
Aug-03
Nov-03
Feb-04
May-04
Aug-04
Nov-04
Feb-05
May-05
Aug-05
Nov-05
Feb-06
May-06
Aug-06
Nov-06
Feb-07
May-07
Aug-07
Nov-07
Feb-08
May-08
Aug-08
Nov-08
Feb-09
May-09
Aug-09
Nov-09
Feb-10
May-10
Aug-10
Nov-10
Feb-11
May-11
Aug-11
Nov-11
Feb-12
May-12
12
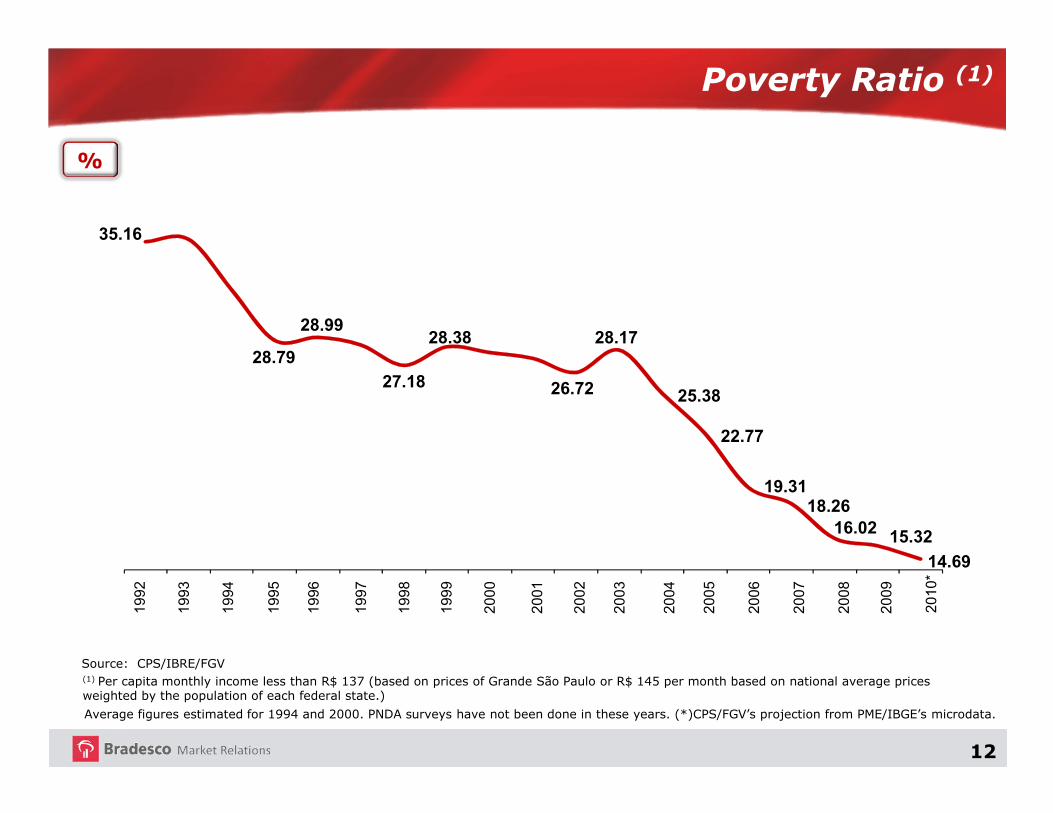
Poverty Ratio (1)
Average figures estimated for 1994 and 2000. PNDA surveys have not been done in these years. (*)CPS/FGV’s projection from PME/IBGE’s microdata.
(1) Per capita monthly income less than R$ 137 (based on prices of Grande São Paulo or R$ 145 per month based on national average prices weighted by the population of each federal state.)
Source: CPS/IBRE/FGV
35.16
28.79
28.99
27.18
28.38
26.72
28.17
25.38
22.77
19.3118.26
16.02 15.32
14.69
1992
1993
1994
1995
1996
1997
1998
1999
2000
2001
2002
2003
2004
2005
2006
2007
2008
2009
2010*
%
13
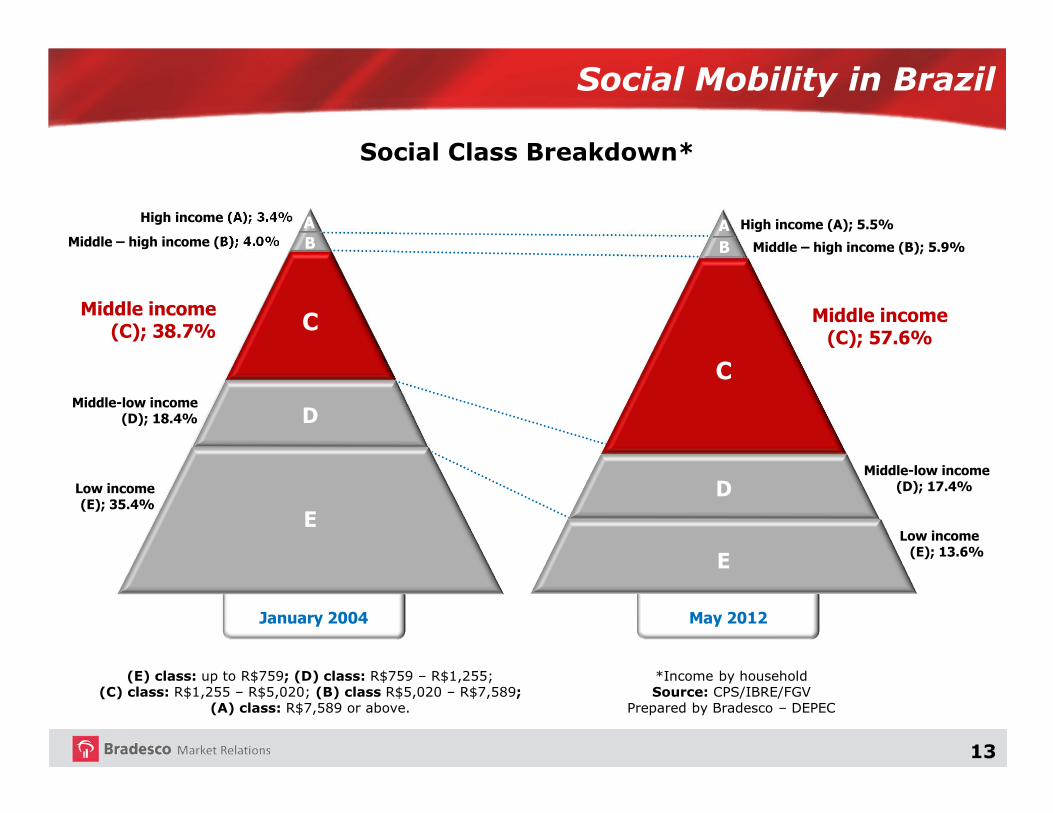
Social Mobility in Brazil
January 2004 May 2012
Social Class Breakdown*
(E) class: up to R$759; (D) class: R$759 – R$1,255; (C) class: R$1,255 – R$5,020; (B) class R$5,020 – R$7,589;
(A) class: R$7,589 or above.
*Income by householdSource: CPS/IBRE/FGV
Prepared by Bradesco – DEPEC
Middle income (C); 38.7%
Middle – high income (B); 4.0%
High income (A); 3.4% A
C
E
D
A
B
C
D
E
Low income(E); 35.4%
Middle-low income(D); 18.4%
High income (A); 5.5%
Middle – high income (B); 5.9%
Middle-low income(D); 17.4%
Low income (E); 13.6%
Middle income (C); 57.6%
B

14
As of 08/13/2012Source: IBGEPrepared by / (*) Projections: Bradesco - DEPEC
Real Wages
-1.3
1.5
4.0
3.23.4
3.2
3.8
2.7
3.8
2004 2005 2006 2007 2008 2009 2010 2011 2012*
%
15
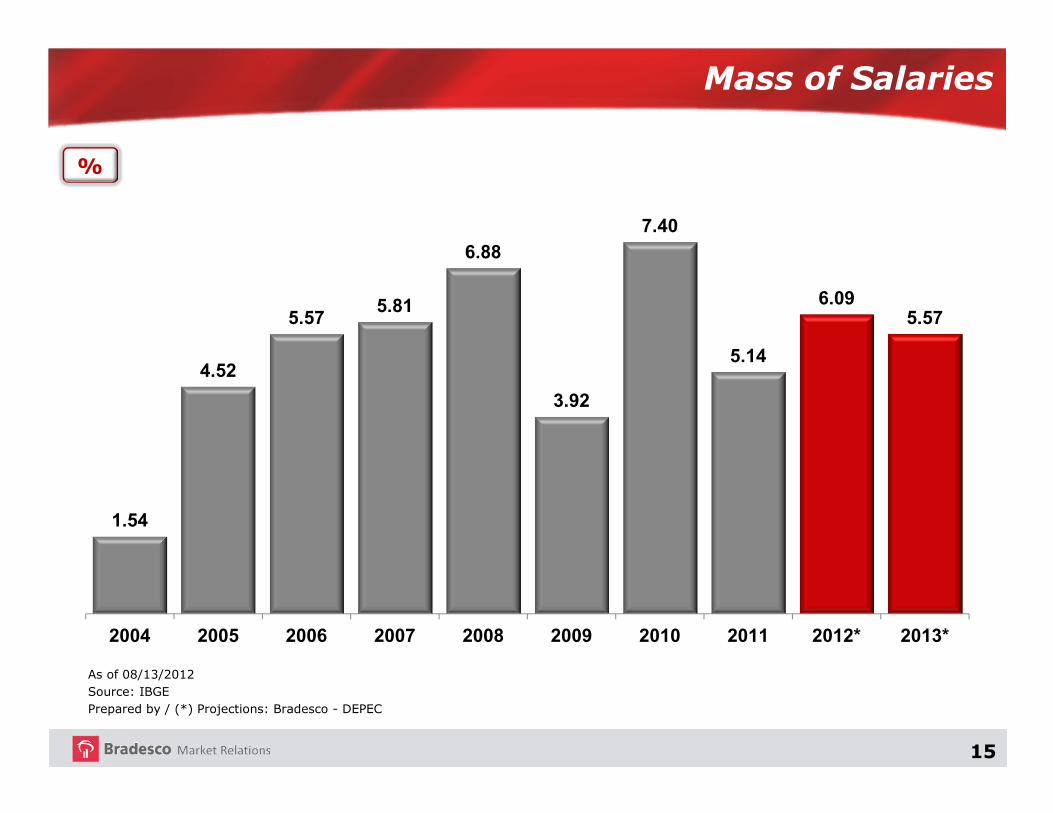
As of 08/13/2012Source: IBGEPrepared by / (*) Projections: Bradesco - DEPEC
Mass of Salaries
%
1.54
4.52
5.575.81
6.88
3.92
7.40
5.14
6.095.57
2004 2005 2006 2007 2008 2009 2010 2011 2012* 2013*
16
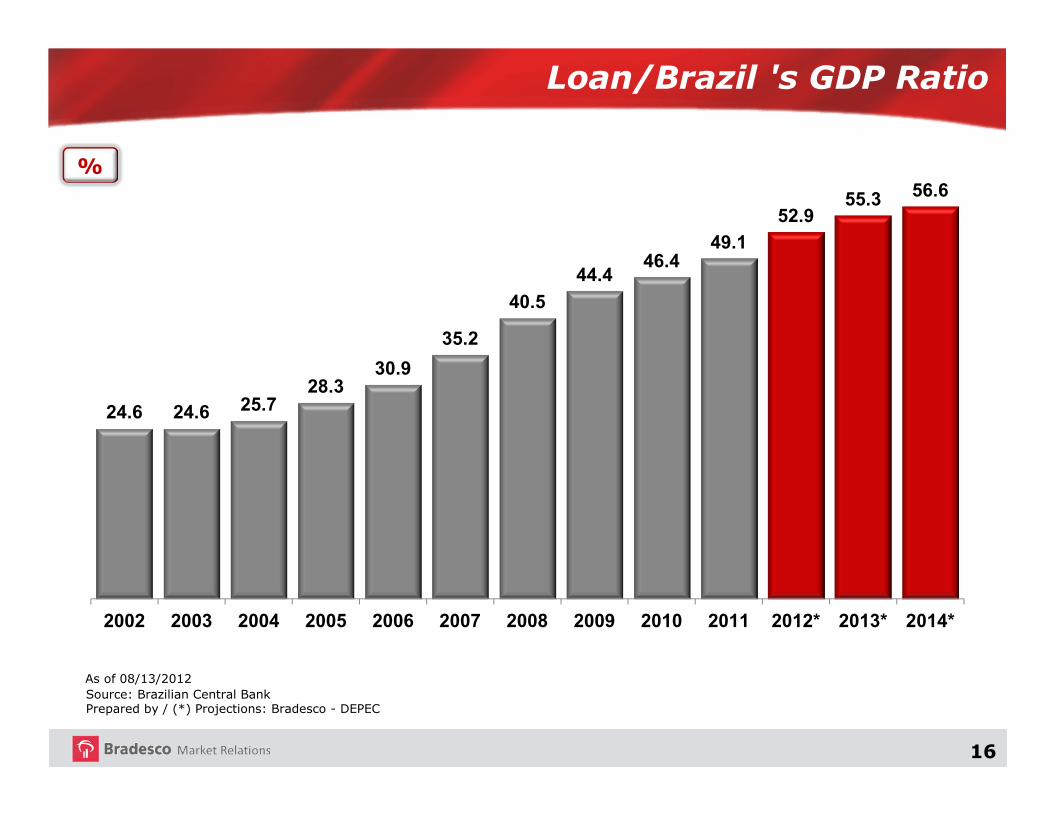
Loan/Brazil 's GDP Ratio
Source: Brazilian Central BankPrepared by / (*) Projections: Bradesco - DEPEC
As of 08/13/2012
%
24.6 24.6 25.728.3
30.9
35.2
40.5
44.446.4
49.1
52.955.3 56.6
2002 2003 2004 2005 2006 2007 2008 2009 2010 2011 2012* 2013* 2014*

17
Argentina
Ecuador
Mexico
Colombia
Brazil
Chile
Turkey
Russ
ia
Romania
Slovakia
Poland
Czech R
ep.
Bulgary
Hungary
South Africa
India
Thailand
Malays
ia
China
South Korea
Italy
Japan
Germ
any
France
Sweden
Australia
Canada
New Zealand
Portugal
Unite
d Kingdom
Spain
USA
As of: Brazil - May/11; Ecuador, South Korea – Dec/07; Colombia, Argentina, Mexico, Chile, China – Dec/09; Thailand – Sep/07; Malaysia, Hungary, India, Czech Republic, Poland – Dec/08; Others Countries – Mar/08.Source: Brazilian Central Bank, Ecowin
Loan/World's GDP Ratio
%
Latin America34.7
Emerging countriesEurope45.0
Emerging countriesAsia112.4
Developed Economies136.8
18
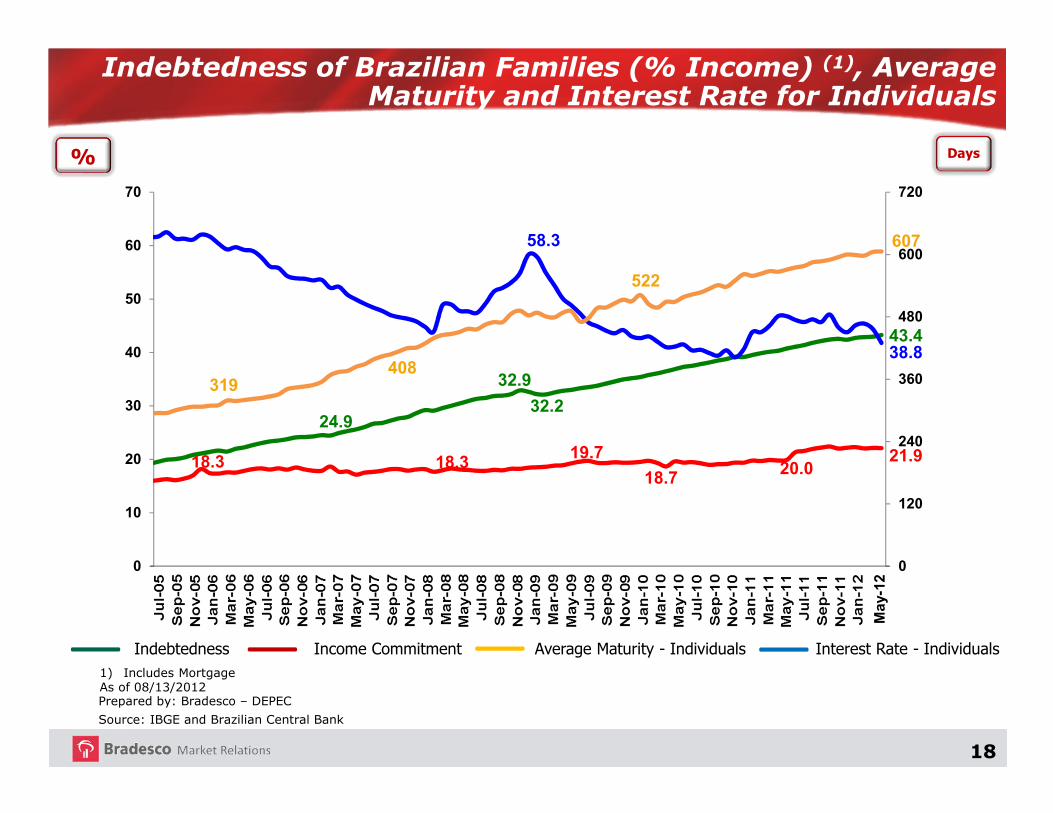
24.9
32.9
32.2
43.4
18.3 18.319.7
18.7 20.021.9
58.3
38.8
319408
522
607
0
120
240
360
480
600
720
0
10
20
30
40
50
60
70
Interest Rate - Individuals
Prepared by: Bradesco – DEPEC
Source: IBGE and Brazilian Central Bank
1) Includes MortgageAs of 08/13/2012
Indebtedness of Brazilian Families (% Income) (1), Average Maturity and Interest Rate for Individuals
Indebtedness Income Commitment Average Maturity - Individuals
Days%
May-12

19
* Disposable IncomeSource: Internal Research, Bradesco
Distribution of Brazilian Families’ Indebtedness*: Social Classes (2011)
28%
26%
28%
26%
18%
25%
38%
35%
48%
52%
36%
42%
0% 20% 40% 60%
E
D
C
B
A
Brazil 2011
2007

20
64%
13%
6%4%
2% 2% 1% 1% 1% 1% 1% 1% 0% 0% 0%3%
Até 10%
10%
- 20%
20%
- 30%
30%
- 40%
40%
- 50%
50%
- 60%
60%
- 70%
70%
- 80%
80%
- 90%
90%
- 100%
100% - 110%
110% - 120%
120% - 130%
130% - 140%
140% - 150%
> 150%
Pouco endividadoMais ou menos endividadoEndividadoMuito endividado
Distribution of borrowers by level of debt (total debt/annual income) - 2011
Source: Internal Research, Bradesco
Up
to10%
Low IndebtedMedium IndebtedIndebtedHigh Indebted
21
US$ Billion
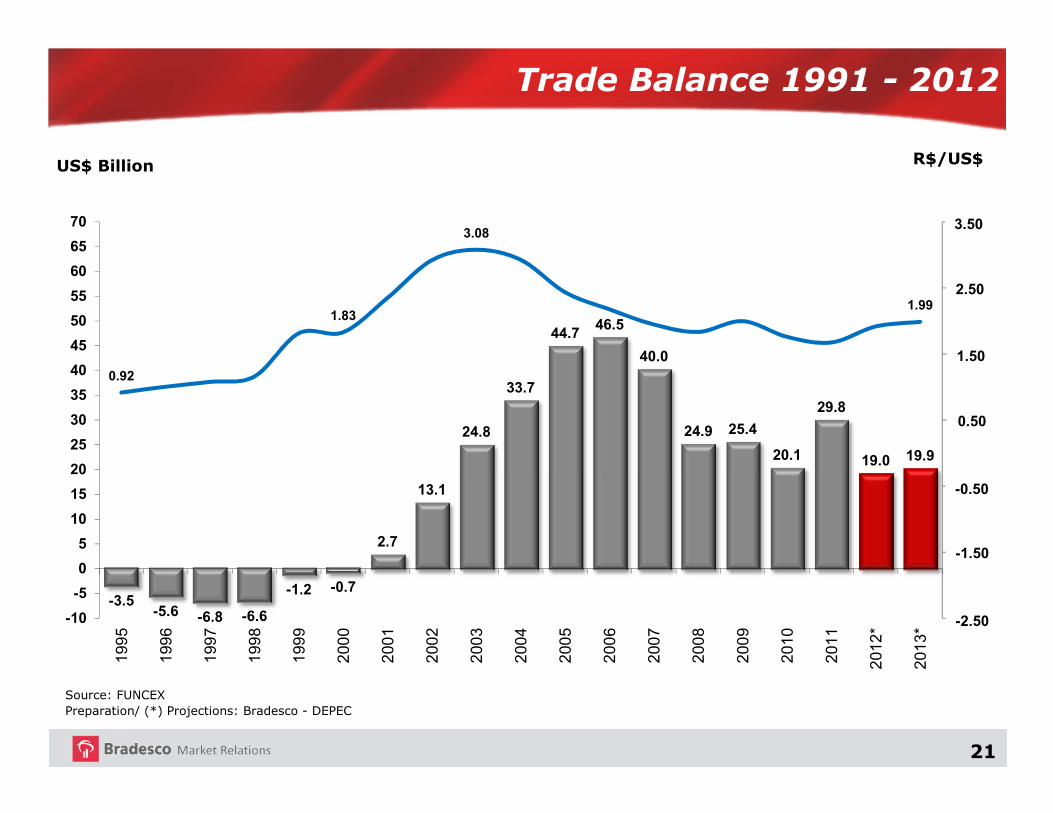
Trade Balance 1991 - 2012
Source: FUNCEXPreparation/ (*) Projections: Bradesco - DEPEC
-3.5-5.6 -6.8 -6.6
-1.2 -0.7
2.7
13.1
24.8
33.7
44.746.5
40.0
24.9 25.4
20.1
29.8
19.0 19.9
0.92
1.83
3.08
1.99
-2,50
-1,50
-0,50
0,50
1,50
2,50
3,50
-10
-5
0
5
10
15
20
25
30
35
40
45
50
55
60
65
70
1995
1996
1997
1998
1999
2000
2001
2002
2003
2004
2005
2006
2007
2008
2009
2010
2011
2012*
2013*
R$/US$
-2.50
-1.50
-0.50
0.50
1.50
2.50
3.50

22
Brazilian Exports (by most important countries(1) of destination)
* Including Puerto Rico** Including San Marino
%
15.9
12.1
7.9
6.4
3.2 3.0 2.62.1 1.9 1.8 1.8 1.8
Chin
a
USA*
Arg
entina
Net
her
lands
Ger
man
y
Japan
India
Italy*
*
Ven
ezuela
Chile
Mex
ico
Spain
(1) Other 206 countries with up to 1,7%Source: FUNCEX Preparation: Bradesco – DEPECAs of Apr12

23
Evolution of Brazilian Productivity
0.20
1.83
-0.20
1.030.89
0.69
-0.29
-0.10
-0.32
1.71
-0.27
2.07
0.42
1.45
2.12
0.85
0.24
1.24
1.00
1.50
1993 1994 1995 1996 1997 1998 1999 2000 2001 2002 2003 2004 2005 2006 2007 2008 2009 2010 2011* 2012*
Source: IBGE, FGV, Seade/DieesePrepared by / (*) Projections: Bradesco - DEPEC
%
24
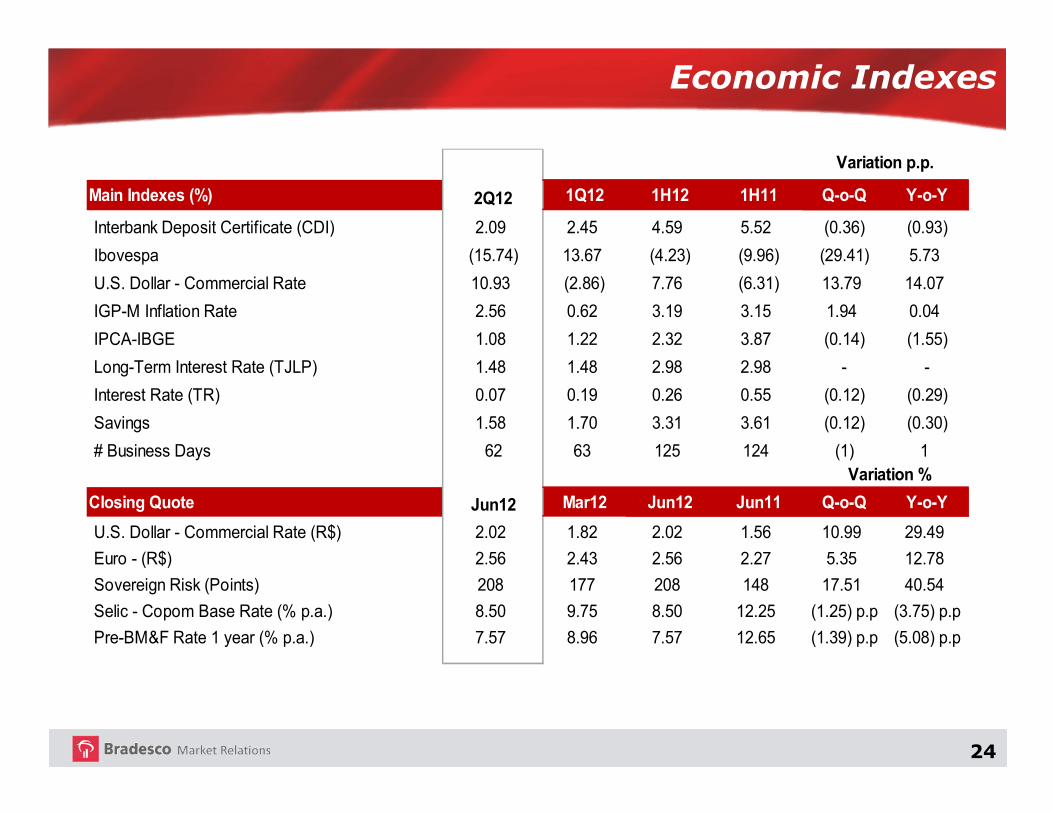
Economic Indexes
Main Indexes (%) 2Q12 1Q12 1H12 1H11 Q-o-Q Y-o-Y
Interbank Deposit Certificate (CDI) 2.09 2.45 4.59 5.52 (0.36) (0.93)
Ibovespa (15.74) 13.67 (4.23) (9.96) (29.41) 5.73
U.S. Dollar - Commercial Rate 10.93 (2.86) 7.76 (6.31) 13.79 14.07
IGP-M Inflation Rate 2.56 0.62 3.19 3.15 1.94 0.04
IPCA-IBGE 1.08 1.22 2.32 3.87 (0.14) (1.55)
Long-Term Interest Rate (TJLP) 1.48 1.48 2.98 2.98 - -
Interest Rate (TR) 0.07 0.19 0.26 0.55 (0.12) (0.29)
Savings 1.58 1.70 3.31 3.61 (0.12) (0.30)
# Business Days 62 63 125 124 (1) 1
Closing Quote Jun12 Mar12 Jun12 Jun11 Q-o-Q Y-o-Y
U.S. Dollar - Commercial Rate (R$) 2.02 1.82 2.02 1.56 10.99 29.49
Euro - (R$) 2.56 2.43 2.56 2.27 5.35 12.78
Sovereign Risk (Points) 208 177 208 148 17.51 40.54
Selic - Copom Base Rate (% p.a.) 8.50 9.75 8.50 12.25 (1.25) p.p (3.75) p.p
Pre-BM&F Rate 1 year (% p.a.) 7.57 8.96 7.57 12.65 (1.39) p.p (5.08) p.p
Variation %
Variation p.p.
25
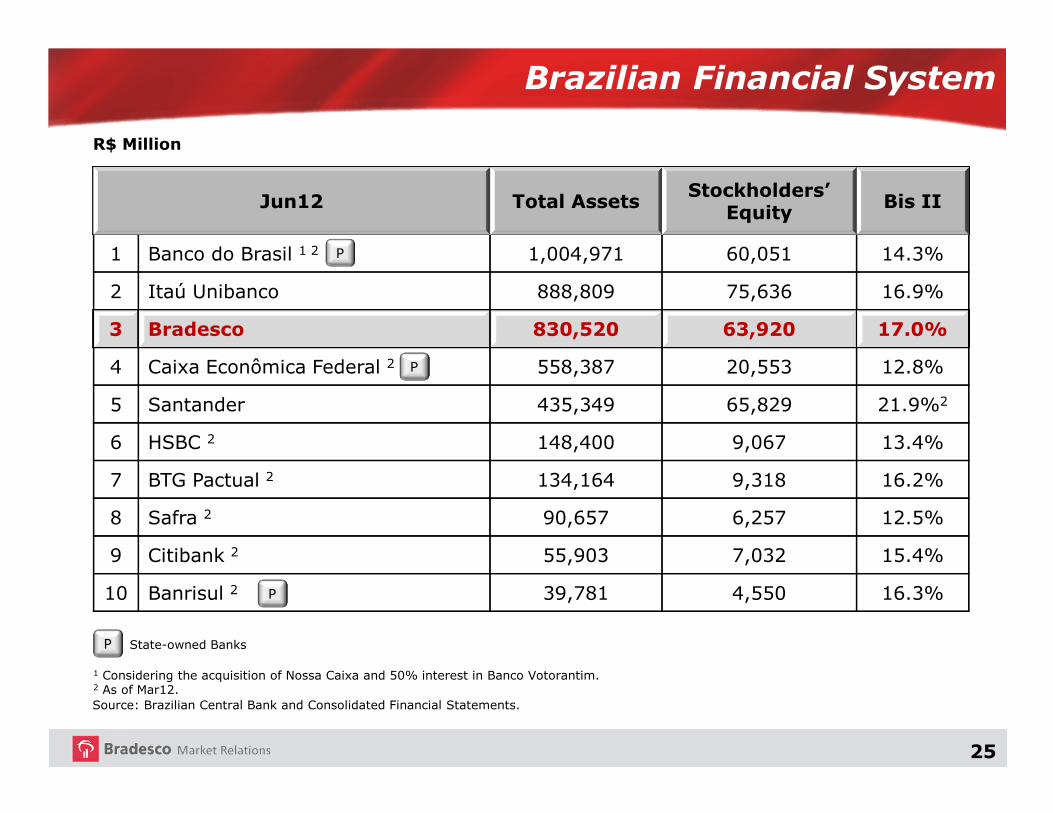
Brazilian Financial System
Source: Brazilian Central Bank and Consolidated Financial Statements.
State-owned Banks
R$ Million
P
1 Considering the acquisition of Nossa Caixa and 50% interest in Banco Votorantim.2 As of Mar12.
Jun12 Total AssetsStockholders’
EquityBis II
1 Banco do Brasil 1 2 1,004,971 60,051 14.3%
2 Itaú Unibanco 888,809 75,636 16.9%
3 Bradesco 830,520 63,920 17.0%
4 Caixa Econômica Federal 2 558,387 20,553 12.8%
5 Santander 435,349 65,829 21.9%2
6 HSBC 2 148,400 9,067 13.4%
7 BTG Pactual 2 134,164 9,318 16.2%
8 Safra 2 90,657 6,257 12.5%
9 Citibank 2 55,903 7,032 15.4%
10 Banrisul 2 39,781 4,550 16.3%
P
P
P
26
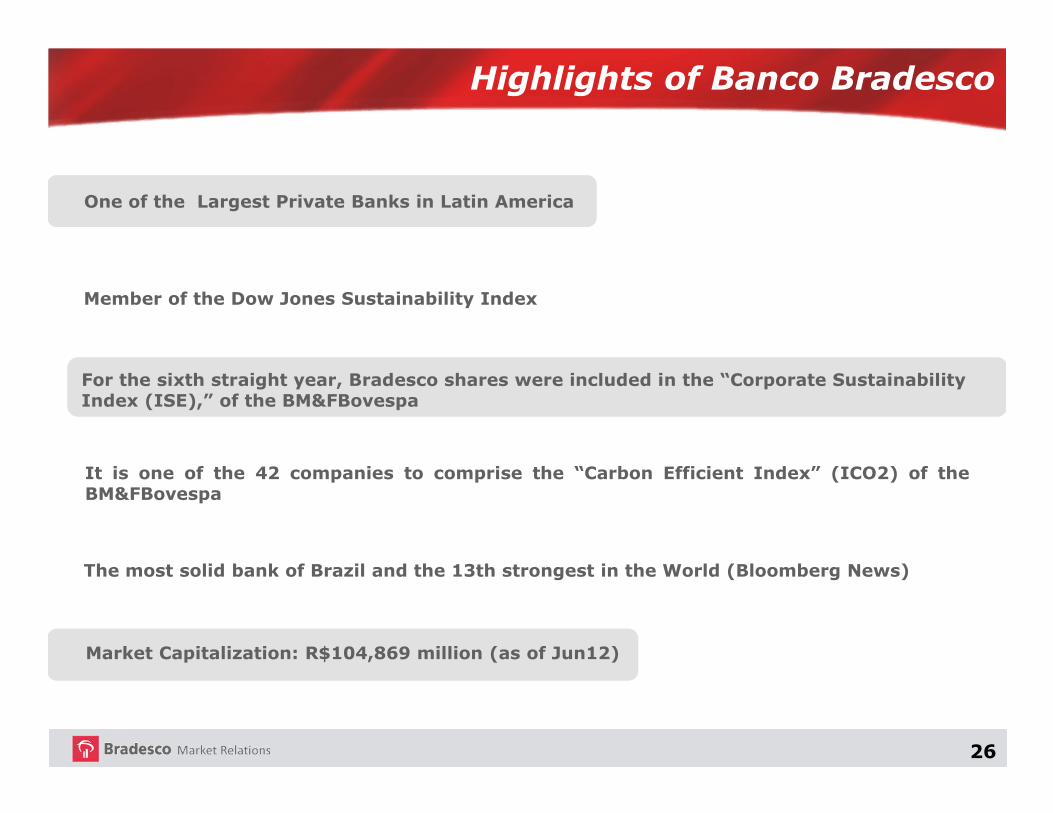
Highlights of Banco Bradesco
One of the Largest Private Banks in Latin America
Member of the Dow Jones Sustainability Index
For the sixth straight year, Bradesco shares were included in the “Corporate SustainabilityIndex (ISE),” of the BM&FBovespa
It is one of the 42 companies to comprise the “Carbon Efficient Index” (ICO2) of theBM&FBovespa
The most solid bank of Brazil and the 13th strongest in the World (Bloomberg News)
Market Capitalization: R$104,869 million (as of Jun12)

27
Bank of America
Wells Fargo
HSBC
Santander
Chase
Bradesco
Barclays
ICBC
Citi
China Construction Bank
The Top 10 Banking Brands in the World
AllSectors
BankingSector
6th1st
9th2nd
11th3rd
15th4th
26th5th
28th6th
34th7th
35th8th
36th9th
37th10th
30,619
28,944
27,632
26,150
19,150
18,678
17,358
17,194
17,133
17,092
CompanyLogo Country Brand Value(US$ Million)
Source: Brand FinanceAs of Jan11

28
Serving all social classes
Bradesco Strategy
A
B
C
D
E
Presence in all Brazilian cities

29
Market Shares
Loan Portfolio (1) (2)
Demand Deposits (2)
Savings Deposits (2)
Asset Management
Insurance, Private Pension Plans and Savings Bonds Premiums (2)
# Branches
Banking System
Private Banks
11.8%
16.5%
13.9%
18.0%
24.5%
21.9%
32.0% (3)
21.4%
30.7%
36.9%
37.2%
2Q12
Source: Brazilian Central Bank, Anbima, Susep and ANS.
(1) Bacen data for March 2012, May 2012 and June 2012 are preliminary (2) Reference date: May 2012(3) Excluding insurance’s participation of public banks
25.7%

30
▪ 66.7 million Clients▪ 104,531 Employees
Distribution Network
Branches Bradesco Expresso
Jun12
▪ 370.2 thousand Shareholders▪ 4,221 Suppliers (As of Dec11)
(1) Includes 3,243 PAs (Service Branch, a result from the consolidation of PAB, PAA and Exchange Points, according to CMN Resolution 4,072 of April26, 2012; and PAE: ATM located in the premises of a company) and 1,476 PAEs (ATM located on the premises of a company);
(2) Includes 10,459 ATMs Shared with other Banks and 1,061 Bradesco Promotora de Vendas service points.
� Branches/Subsidiaries Abroad
� Outside ATM Terminals
� ATM Terminals
� Branches
� PAs + PAEs (1)
� Bradesco Expresso
13
3,992
47,484
4,650
4,719
40,476
TOTAL DISTRIBUTION NETWORK 65,370
� Others (2) 11,520
31
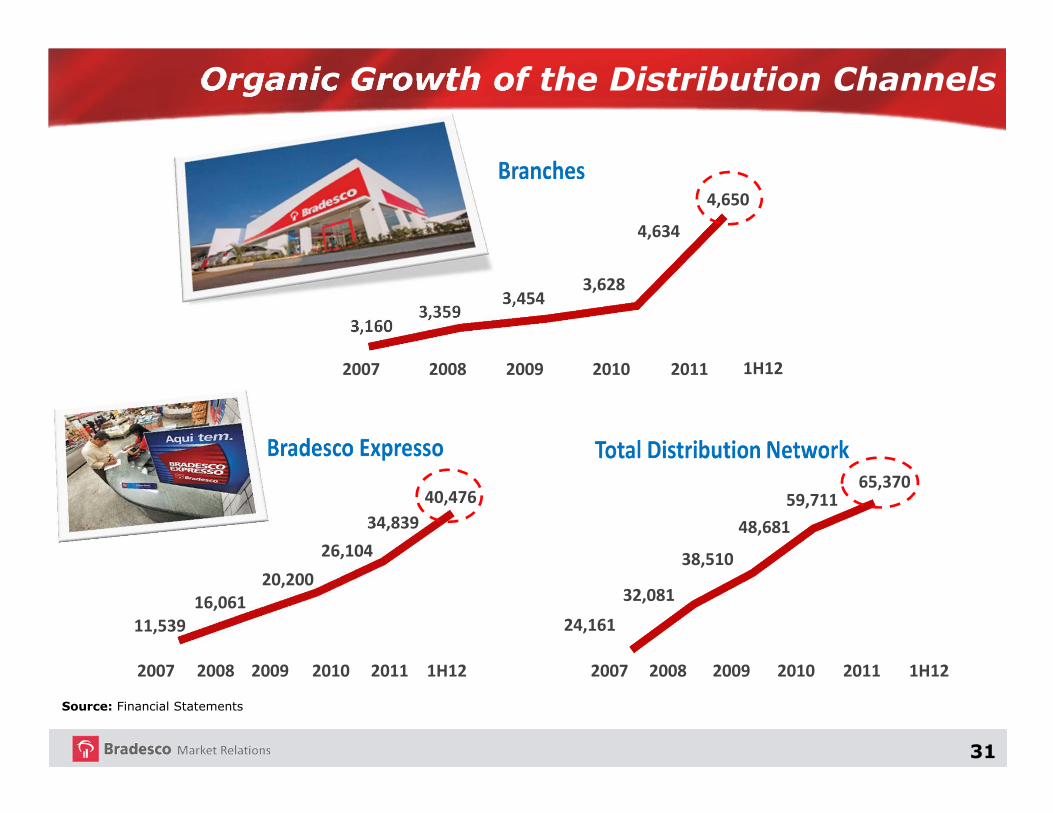
Organic Growth of the Distribution Channels
Source: Financial Statements
2007 2008 2009 2010 2011
11,539
16,061
20,200
26,104
40,476
2007 2008 2009 2010 2011
3,1603,359
3,4543,628
4,650
2007 2008 2009 2010 2011
24,161
32,081
38,510
48,681
65,370
4,634
1H12
1H121H12
34,839
59,711
32
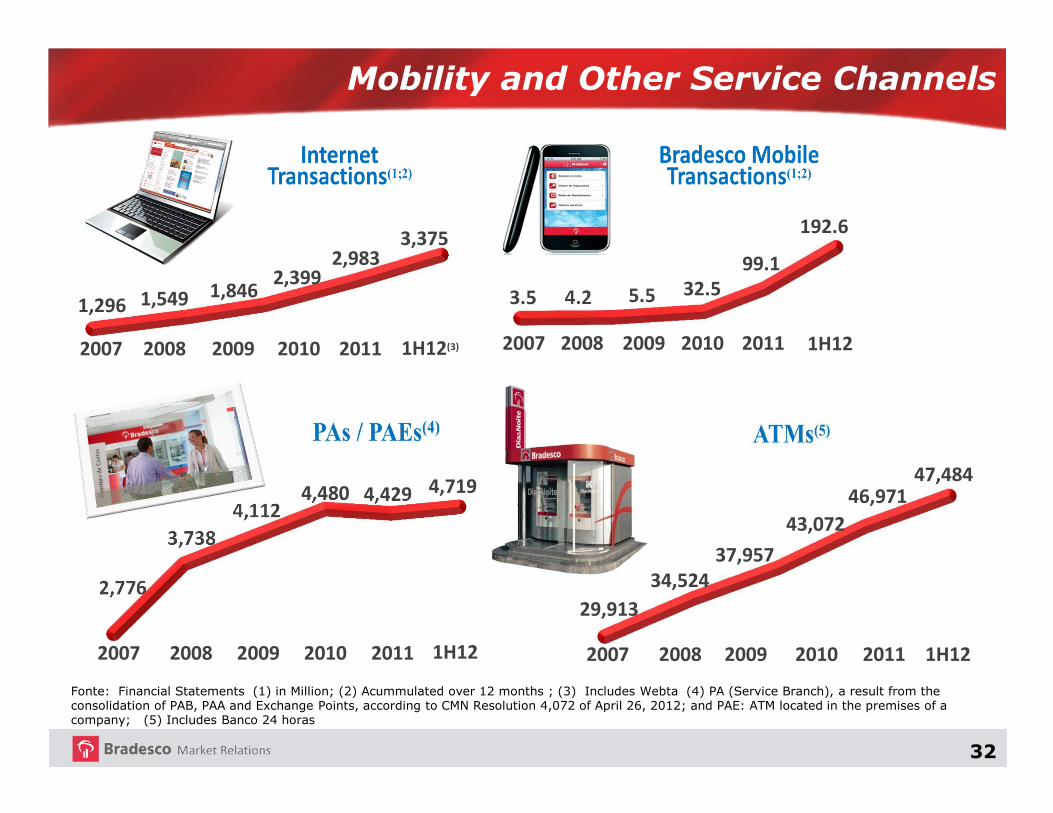
Mobility and Other Service Channels
29,913
34,524
37,957
43,072
46,971
2007 2008 2009 2010 2011 1H12
47,484
2,776
3,738
4,1124,480 4,429
2007 2008 2009 2010 2011 1H12
4,719
4.2
2007 2008 2009 2010 2011
3.5 5.5 32.5
99.1
192.6
1H122007 2008 2009 2010 2011
1,296 1,549 1,8462,399
2,983
1H12(3)
3,375
Fonte: Financial Statements (1) in Million; (2) Acummulated over 12 months ; (3) Includes Webta (4) PA (Service Branch), a result from the consolidation of PAB, PAA and Exchange Points, according to CMN Resolution 4,072 of April 26, 2012; and PAE: ATM located in the premises of a company; (5) Includes Banco 24 horas

33
Bradesco Retail - Bradesco Expresso
Bradesco has been expanding its presence in Correspondent Banks through its Bradesco Expresso
network, forming partnerships with supermarkets, drugstores, department
stores and other retail chains

34
Presence Abroad
New York
Banco Bradesco Argentina S.A.
Buenos Aires
Banco Bradesco Europa S.A.
Luxembourg
Bradesco Services Co.Ltd.
Tokyo
Grand Cayman (2)
Bradesco Securities Inc.
New York(3)
Bradesco Securities UK Ltd.
London
Cidade Capital Markets Ltd.
Grand Cayman
Bradesco Trade Services Ltd.
Hong Kong
Branch Subsidiary
Bradescard Mexico – Sociedadde Responsabilidad Limitada
(1) Holding which controls Bradesco Securities and the New York Branch. (2) Includes 2 Branches(3) Includes 2 Subsidiaries As of Jun12
Bradesco North America (1)
Mexico
Bradesco Securities Hong Kong Ltd.
35
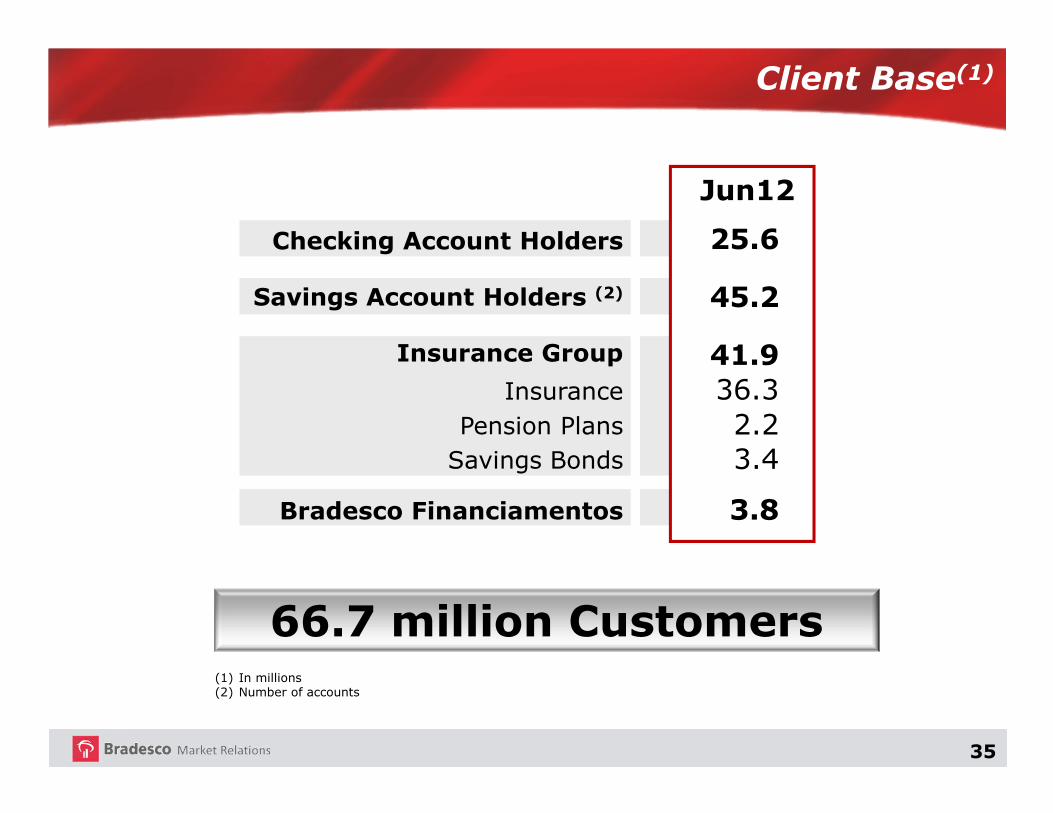
Client Base(1)
Checking Account Holders
Savings Account Holders (2)
InsurancePension Plans
Savings Bonds
Insurance Group
Bradesco Financiamentos
Jun12
25.6
45.2
41.936.32.23.4
3.8
66.7 million Customers(1) In millions(2) Number of accounts

36
Client Segmentation
Monthly income starting at
R$ 7,000 or Investment
starting at R$ 80,000
Monthly income fromR$ 3,000 to R$ 6,999.99or Investment starting atR$ 30,000
Monthly income
up to R$ 2,999.99
Annual revenue over R$ 250 million
Annual revenue from R$ 30 million to R$ 250 million
Annual revenue up to
R$ 30 million
Exclusive
Bradesco Expresso and PAA
Small Business
Minimum investment of R$ 3 million
37
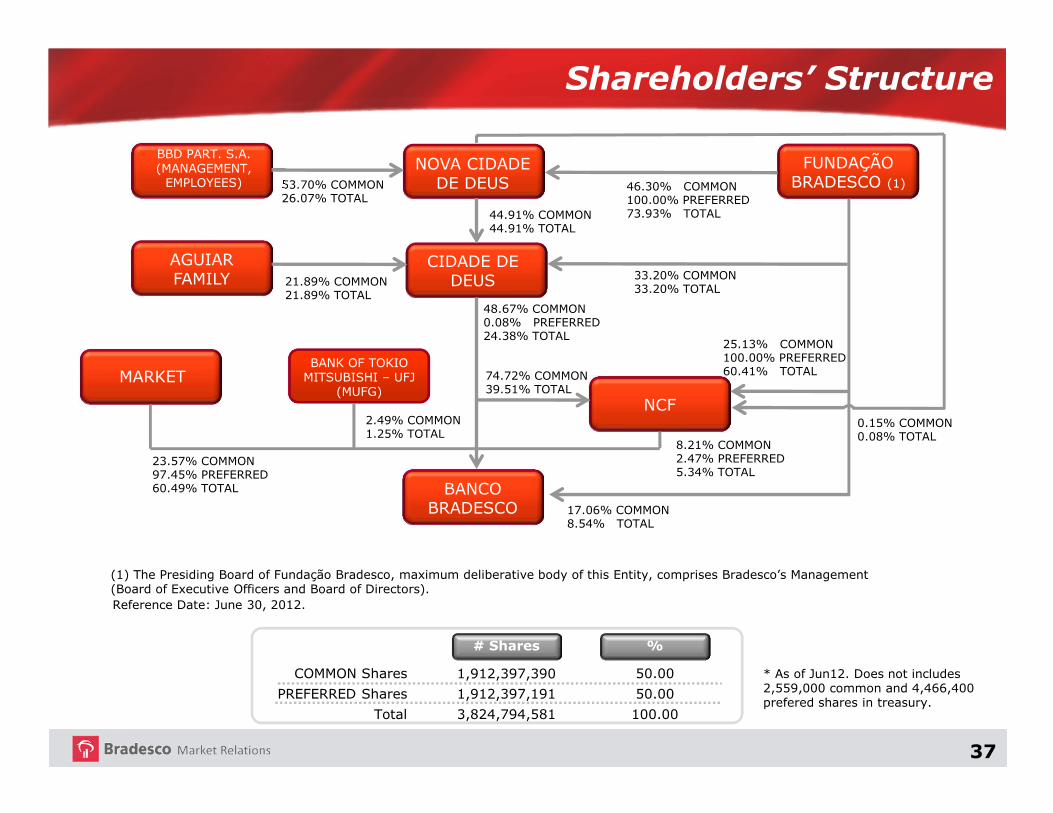
Shareholders’ Structure
100.00
50.00
50.00
3,824,794,581
1,912,397,191
1,912,397,390
Total
PREFERRED Shares
COMMON Shares
53.70% COMMON26.07% TOTAL
44.91% COMMON44.91% TOTAL
2.49% COMMON1.25% TOTAL
23.57% COMMON97.45% PREFERRED60.49% TOTAL
17.06% COMMON8.54% TOTAL
8.21% COMMON2.47% PREFERRED5.34% TOTAL
0.15% COMMON0.08% TOTAL
25.13% COMMON100.00% PREFERRED60.41% TOTAL
46.30% COMMON100.00% PREFERRED73.93% TOTAL
21.89% COMMON21.89% TOTAL
48.67% COMMON0.08% PREFERRED24.38% TOTAL
74.72% COMMON39.51% TOTAL
MARKET
BBD PART. S.A. (MANAGEMENT, EMPLOYEES)
AGUIAR FAMILY
BANCO BRADESCO
CIDADE DE DEUS
NOVA CIDADE DE DEUS
FUNDAÇÃO BRADESCO (1)
BANK OF TOKIO MITSUBISHI – UFJ
(MUFG)NCF
(1) The Presiding Board of Fundação Bradesco, maximum deliberative body of this Entity, comprises Bradesco’s Management(Board of Executive Officers and Board of Directors).
%# Shares
33.20% COMMON33.20% TOTAL
* As of Jun12. Does not includes 2,559,000 common and 4,466,400 prefered shares in treasury.
Reference Date: June 30, 2012.

38
Board of Directors
Board of Executive Officers
01
06
09
06
44
09
Chief Executive Officer
Executive Vice-Presidents
Managing Directors
Deputy Directors
Department Directors
Directors
# of Members
16 Regional Directors
Fiscal Council
03
03
01
Sitting
Deputy
Ombudsman
# of Members
Committees
07
04
10
11
14
11
Compensation Committee
Audit Committee
Compliance and Internal Controls Committee
Executive Disclosure Committee (Non-Statutory)
Ethical Conduct Committee
Integrated Risk Management and Capital Allocation Committee
# of Members
Administrative Bodies
# of Members
01
01
07
Chairman
Vice-Chairman
Members
July 10, 2012

39
Shareholders’ Profile – Bradesco
Jun12
Individuals 332,632 89.85 23.04
Companies 36,656 9.90 47.42
Foreigners 919 0.25 29.54
Total 370,207
% over Total Shareholders
ShareholdersBase
% over Total Shares

40
Main Ratings
(1) On June 27, 2012, due to changes in its methodology, the risk classifying agency Moody´s Investors Service changed three Bradesco ratings, as follows: (i) financial strength, from „B-‟ to „C-;‟ (ii) domestic currency deposits – long term, from „A1‟ to „A3;‟ and (iii) domestic currency deposit – short term, from „P-1‟ to „P-2.‟ These downgrades are due to agency‟s evaluation on the correlation between sovereign credit risk and rating of several entities in Brazil, accordingly, not referring to any change in Bank‟s financial bases.(2) On July 11, 2012, the risk classifying agency Standard & Poor´s upgraded Bradesco short-term foreign and domestic currency ratings from „A3„ to „A2,‟ as a result of the upgrade of sovereign short-term foreign currency rating after the agency changed its criteria of the connection between long and shortterm ratings attributed to sovereign governments.
Financial
Strength /
Individual Credit
Risk Profile
Foreign CurrencyDebt
Long-Term Long-Term Short-Term Long-Term Short-Term Long-Term Short-Term
Baa1 A3 P-2 Baa2 P-2 Aaa.br BR - 1
International Scale
C - / baa1
Moody's Investors Service (1)
Domestic Scale
Domestic Currency Deposit
Foreign CurrencyDeposit
DomesticCurrency
Long-Term Short-Term
Long-Term Short-Term Long-Term Short-Term Long-Term Short-Term
BBB A - 2 BBB A - 2 brAAA brA - 1
Standard & Poor's (2)
International Scale –Counterparty Rating Domestic Scale
Foreign Currency Domestic Currency Counterparty Rating
Austin Rating
AA+ AAA A -1
Domestic Scale
BBB
Issuer Rating
International Scale
R&I Inc.
Corporate Governance
Viability Support
Long-Term Short-Term Long-Term Short-Term Long-Term Short-Term
A- F1 BBB+ F2 AAA (bra) F1 + (bra)
Domestic ScaleInternational Scale
Fitch Ratings
a- 2
Domestic Currency Foreign Currency Domestic
41
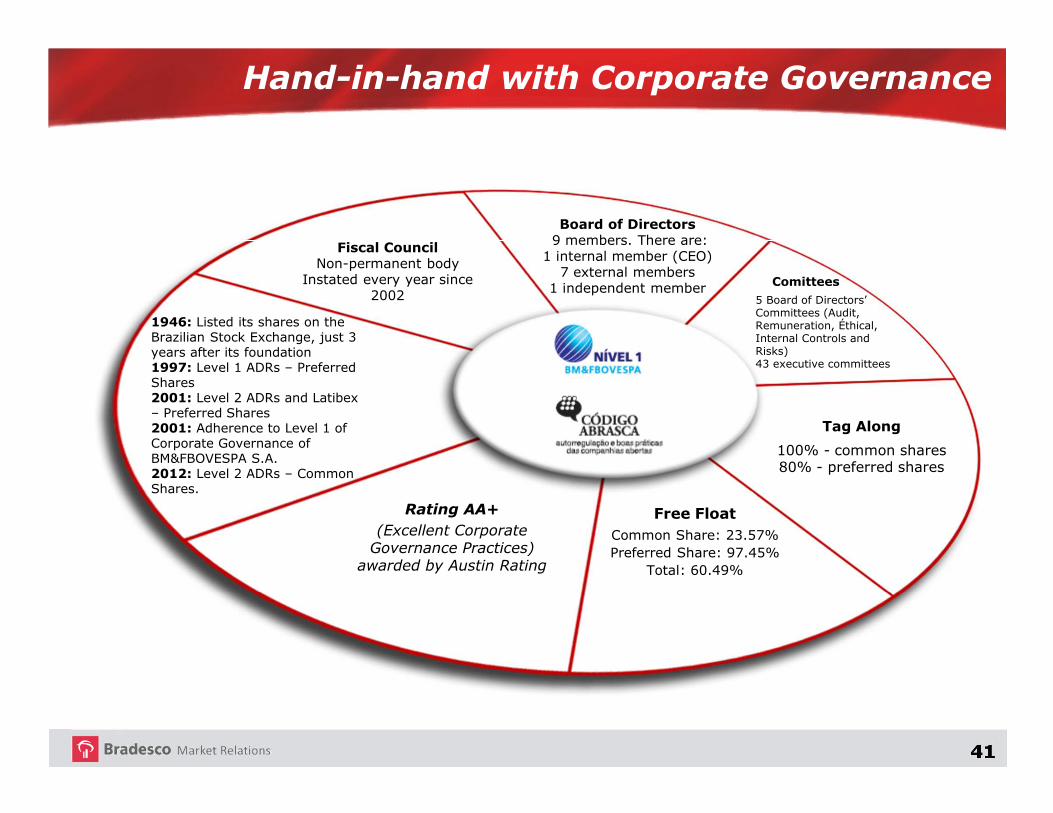
Rating AA+
(Excellent Corporate Governance Practices) awarded by Austin Rating
Tag Along
100% - common shares80% - preferred shares
1946: Listed its shares on theBrazilian Stock Exchange, just 3 years after its foundation1997: Level 1 ADRs – PreferredShares2001: Level 2 ADRs and Latibex– Preferred Shares2001: Adherence to Level 1 ofCorporate Governance ofBM&FBOVESPA S.A.2012: Level 2 ADRs – Common Shares.
Hand-in-hand with Corporate Governance
Free Float
Common Share: 23.57% Preferred Share: 97.45%
Total: 60.49%
Fiscal CouncilNon-permanent body
Instated every year since2002
Board of Directors9 members. There are:
1 internal member (CEO)7 external members
1 independent member Comittees
5 Board of Directors’ Committees (Audit, Remuneration, Éthical, Internal Controls andRisks)43 executive committees

42
Transaction Breakdown
As of 1H12
ATMs(Outside Branches)
9%
ATMs (Inside Branches)
21%
Branches8%
Call Center7%
Internet+FT50%
Automatic Debit1%
Mobile4%
43
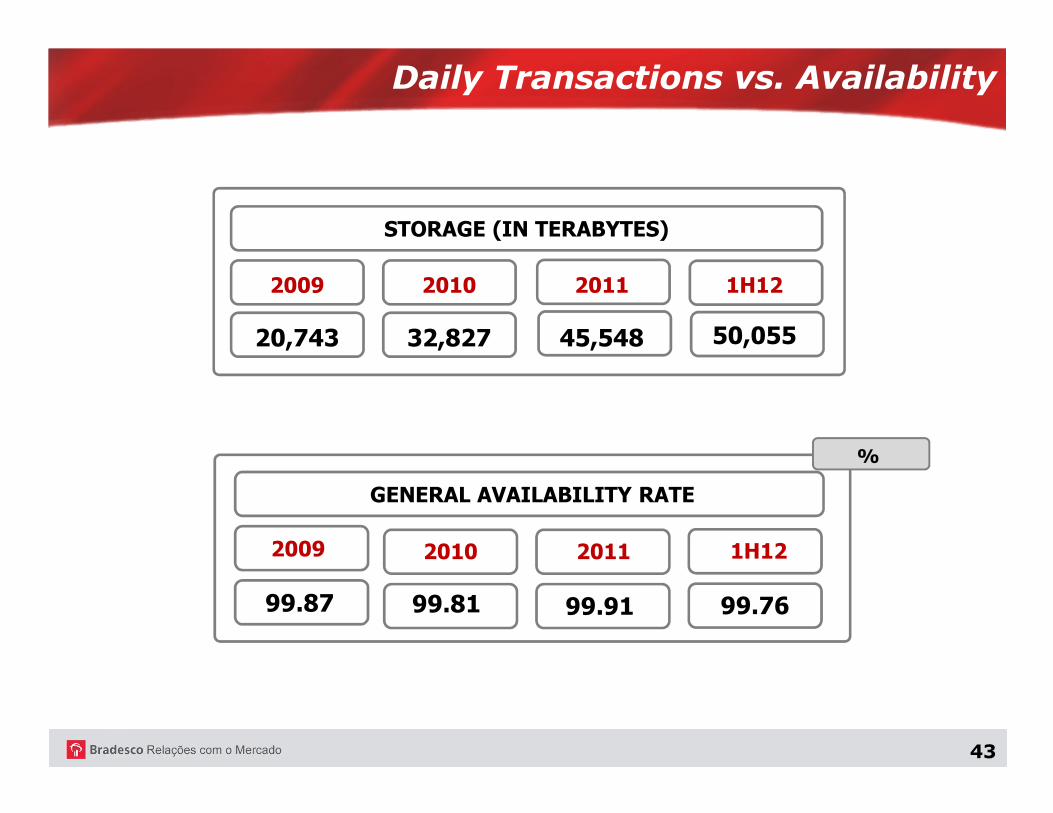
Daily Transactions vs. Availability
20,743
2009
32,827
2010
45,548
2011 1H12
STORAGE (IN TERABYTES)
%
99.87
2009
99.81
2010
99.91
2011
99.76
1H12
GENERAL AVAILABILITY RATE
50,055

44
IT Revitalization Plan
APPLICATIONS
PROCESSES
OPERATIONAL ENVIRONMENT
INFRASTRUCTURE
TECHNOLOGY
Internet
Departmental Servers
Logic Security
AUG 07
MAY 05
NOV 05
AUG 08
AUG 08
AUG 08
MAI/09
JUN/09
OCT 06
OCT 07
JUL 08
SET/09
SET/09
SET/09
SET/09
DEZ/10
DEC 05
JUN 08
JUN 08
FEB 07
FEB 08
MAY 08
IT Services Management
Profile of Competitor Channels
Capacity Management
Testing and Approval Environment
Pre-Production Environment
Channel Availability
Construction and Infrastructure
New/Brand New Site
Alphaville Site
Corporate Communication Network
Operational Centers
Contingency
MAY 09
JUN 09
SEP 09
SEP 09
SEP 09
SEP 09
DEC 10
Implem.
DEC 10
MAR 09
JUN 09
JUN 09
DEC 10
IT Governance
Information Access Management
Methods and Metrics
UN IT Alignment
Content Management
Branch Channel
Channel Certification
CI - Occupancy
Centers and Service Branches
Software Testing Environment
High Availability
Oper. Environment Management 82 Visits: BRA, USA, EUR
2,350 Allocated Professionals
3,937 Executive Meetings
43,000 Products/ Documents
9,871,941 Hours Worked
Numbers
Jun 2012
Implementing Completed
27
1
New System Architecture (NSA)

45
Management
Performance
• Enhanced satisfaction of users and clients
• Enhanced promptness to respond to the market
• Reduced rework and inefficiency
• Lower operational risks
• Costs and expenses reduction
• Better service level
• Management of factors that generate “incidents”
• Achievements in the flow of work
Medium and Long-Term Results
Short-Term Results
Impact on Efficiency
46
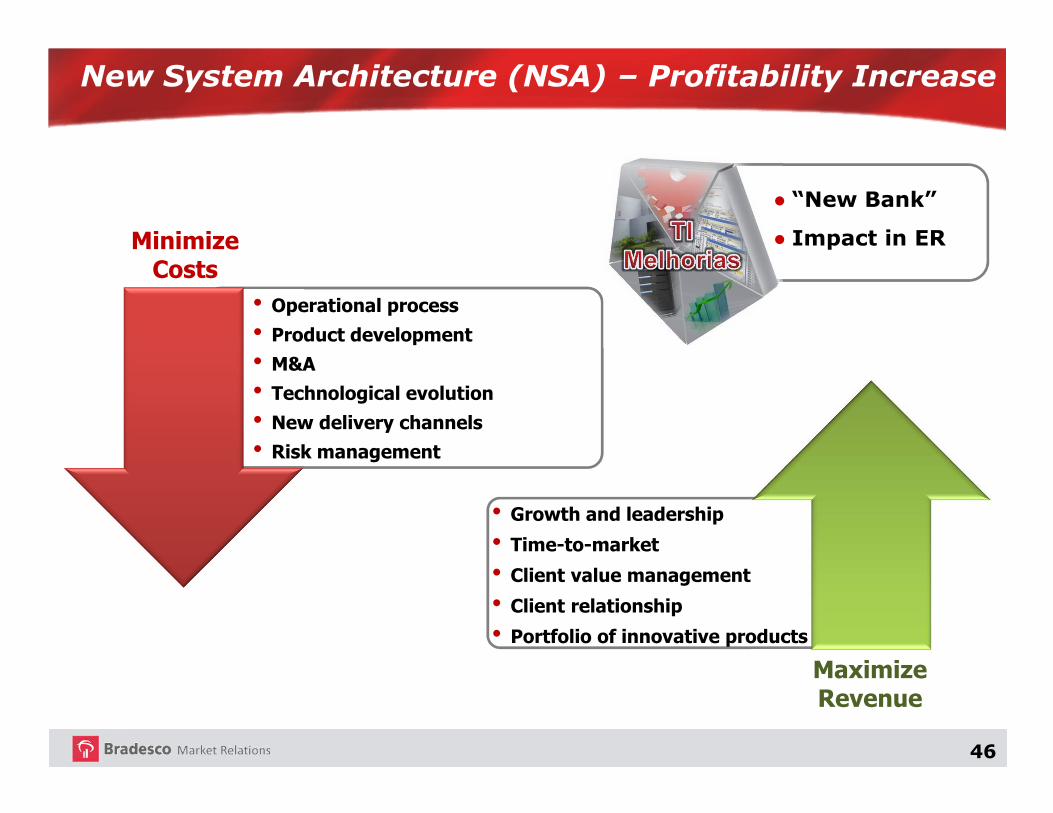
• Operational process• Product development• M&A• Technological evolution• New delivery channels
• Risk management
Minimize Costs
MaximizeRevenue
• Growth and leadership• Time-to-market• Client value management• Client relationship• Portfolio of innovative products
● “New Bank”
● Impact in ER
New System Architecture (NSA) – Profitability Increase

47
Investments in Infrastructure, Information Technology and Telecommunications
Source: Financial Statements.
Total Investments in the period(2006 through 1H12): R$ 20.3 billion
R$ Million
2006 2007 2008 2009 2010 2011 1S12
1,472 1,621 2,003
2,827 3,204 3,241
1,713
354 478
667
630
716 1,087
273
1,826 2,099
2,670
3,457
3,920 4,328
1,986
TI/Telecommunications Infrastructure
1H12

48
Stock Evolution *
Source: Economatica.
1H122007
-10%59% 46%
5%6% 3%
2008
-52%
-34%
Bradesco - ADR
Dow Jones
Accumulated
*Adjusted by dividends delivered. Calculated in US$.
2009
124%
19%
2010
13%
11%
2007 2008 2009 2010 2011
2011
-15%
6%
46%
3%
1H12

49
Liquidity
Trading Volume
R$ 352.4 Million / Day
Source: Economatica
2007
1H12
R$ 509.9 Million / Day

50
R$ Million
Market Capitalization
3.6x 1.9x
Multiple P/BV
2.5x 2.3x
15.2x 8.6x
Multiple P/E
13.6x 11.2x
1.9x
9.6x(1) Includes latest 12 months of adjusted net income.
109,463
65,354
103,192109,759 106,971
2007 2008 2009 2010 2011 2012
1.6x
9.2x (1)
1H12
104,869

51
Dividends
R$ Million
R$ 19.4 billionMore than
in dividendsover the period
2,160
2,823 2,692 2,718
3,369
3,740
1,916
31.5% 31.5%
33.1%
31.5% 31.5% 31.5% 31.5%
35.3%34.4%
37.2%
35.7% 35.4% 35.7% 35.6%
2006 2007 2008 2009 2010 2011 1H12
Dividends Net Pay Out(1) Gross Pay Out(1)
(1) Accumulated 12 months.

52
EPS (1) and Net Income
(1) For EPS comparison purposes, shares were adjusted in line with stock bonuses and splits.
R$ Million
2,738 2,825
2,864 2,771
2,845 2,867
5,563 5,712
2.722.82
2.91 2.93 2.96 2.97
2.82
2.97
1Q11 2Q 3Q 4Q 1Q12 2Q 1H11 1H12
Adjusted Net Income Earnings per Share - in the last 12 months
53
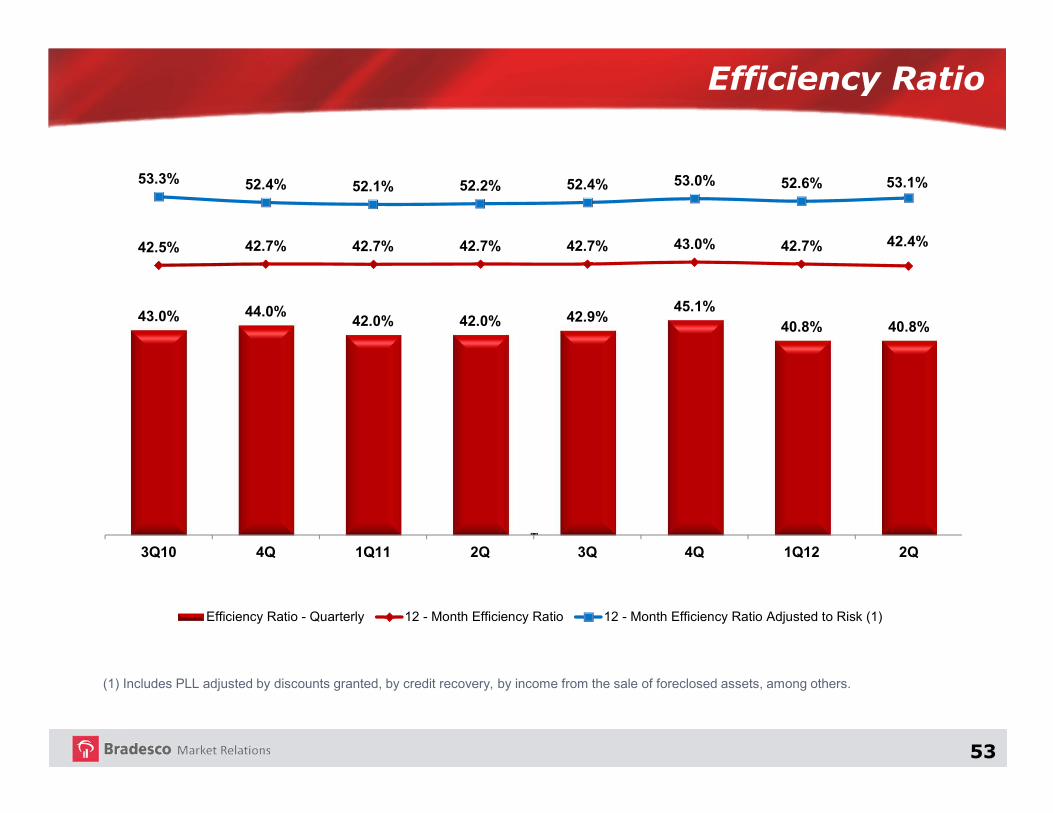
Efficiency Ratio
(1) Includes PLL adjusted by discounts granted, by credit recovery, by income from the sale of foreclosed assets, among others.
43.0% 44.0%42.0% 42.0% 42.9%
45.1%
40.8% 40.8%
42.5% 42.7% 42.7% 42.7% 42.7% 43.0% 42.7% 42.4%
53.3% 52.4% 52.1% 52.2% 52.4% 53.0% 52.6% 53.1%
3Q10 4Q 1Q11 2Q 3Q 4Q 1Q12 2Q
Efficiency Ratio - Quarterly 12 - Month Efficiency Ratio 12 - Month Efficiency Ratio Adjusted to Risk (1)

54
Net Income and Efficiency Ratio
Adjusted Net Income Efficiency Ratio (12 months)
R$ Million
43.1% 43.3%40.5%
42.7% 43.0% 42.7% 42.4%
7,210 7,625 7,586
9,804
11,198
5,563 5,712
2007 2008 2009 2010 2011 1H11 1H12

55
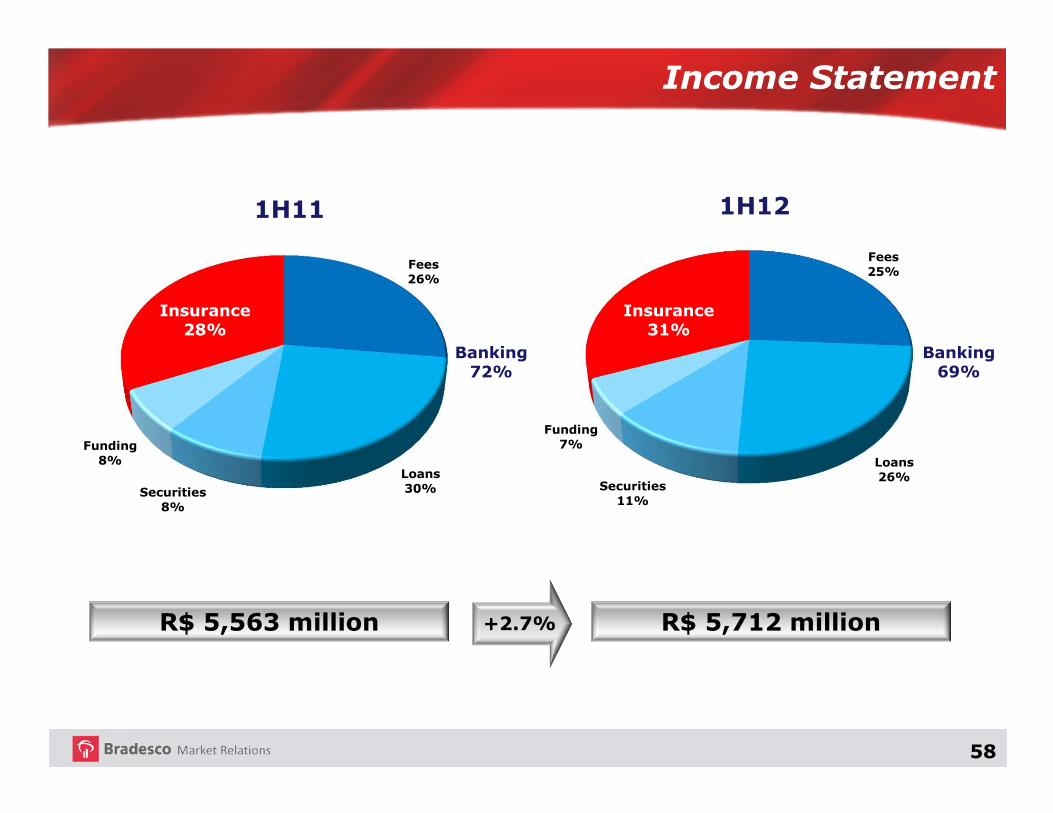
Income Statement
R$ Million
2Q12 1Q12 1H12 1H11 Q-o-Q Y-o-Y
Net Interest Income 11,034 10,695 21,729 18,833 3.2 15.4
Provision for Loan Losses (3,407) (3,094) (6,501) (4,797) 10.1 35.5
Gross Income from Fin. Interm. 7,627 7,601 15,228 14,036 0.3 8.5
Insurance, Pension Plans, Saving Bonds 953 877 1,830 1,573 8.7 16.3
Fee Income 4,281 4,118 8,399 7,261 4.0 15.7
Personnel and Administrative Expenses (6,488) (6,279) (12,767) (11,360) 3.3 12.4
Tax Expenses (991) (1,012) (2,003) (1,793) (2.1) 11.7
Equity in the Earnings and Affiliated Companies 19 40 59 50 (52.5) 18.0
Other Operating Revenues/Expenses (1,035) (996) (2,031) (1,686) 3.9 20.5
Operating Income 4,366 4,349 8,715 8,081 0.4 7.8
Non-Operating Income (22) (18) (40) (11) 22.2 -
Inc. Tax/Social Contr., Minority Interest (1,477) (1,486) (2,963) (2,507) (0.6) 18.2
Adjusted Net Income 2,867 2,845 5,712 5,563 0.8 2.7
Non-Recurring Events 34 52 86 76 (34.6) 13.2
Book Net Income 2,833 2,793 5,626 5,487 1.4 2.5
Variation %

56
Book Net Income x Adjusted Net Income
(1) Annualized.
R$ Million
2Q12 1Q12 1H12 1H11
Book Net Income 2,833 2,793 5,626 5,487
Non-Recurring Events 34 52 86 76
- Provision for Civil Contingencies 57 86 143 123
- Tax Effects (23) (34) (57) (47)
Adjusted Net Income 2,867 2,845 5,712 5,563
ROAE % (1) 20.6 21.0 20.3 22.9
ROAE % (Adjusted) (1) 20.9 21.4 20.6 23.2

57
Unrealized Gains
R$ Million
Note: Excluding the unrecorded goodwill from real estate for own use, in the amount of R$ 3,030 million;(1) Includes advances on exchange contracts, leasing operations and other receivables with credit characteristics; and(2) Includes, basically, the goodwill of interest in Cielo, Odontoprev, BM&FBovespa, Fleury and Serasa.
Jun12 Mar12 Jun11 Q-o-Q Y-o-Y
Securities - Fixed Income 9,873 6,838 3,877 44.4 154.7
Securities - Equities (1,733) (1,127) (845) 53.8 105.1
Loan Operations (1) 1,537 (160) (574) - -
Investments (2) 12,711 11,316 7,313 12.3 73.8
Others (844) (737) (394) 14.5 114.2
Total 21,544 16,130 9,377 33.6 129.8
Variation %
58
R$ 5,563 million R$ 5,712 million
Banking 72%
Banking 69%
Income Statement
+2.7%
Fees26%
Loans 30%Securities
8%
Funding8%
1H11
Insurance28%
Fees25%
Loans 26%
Securities11%
Funding7%
1H12
Insurance31%
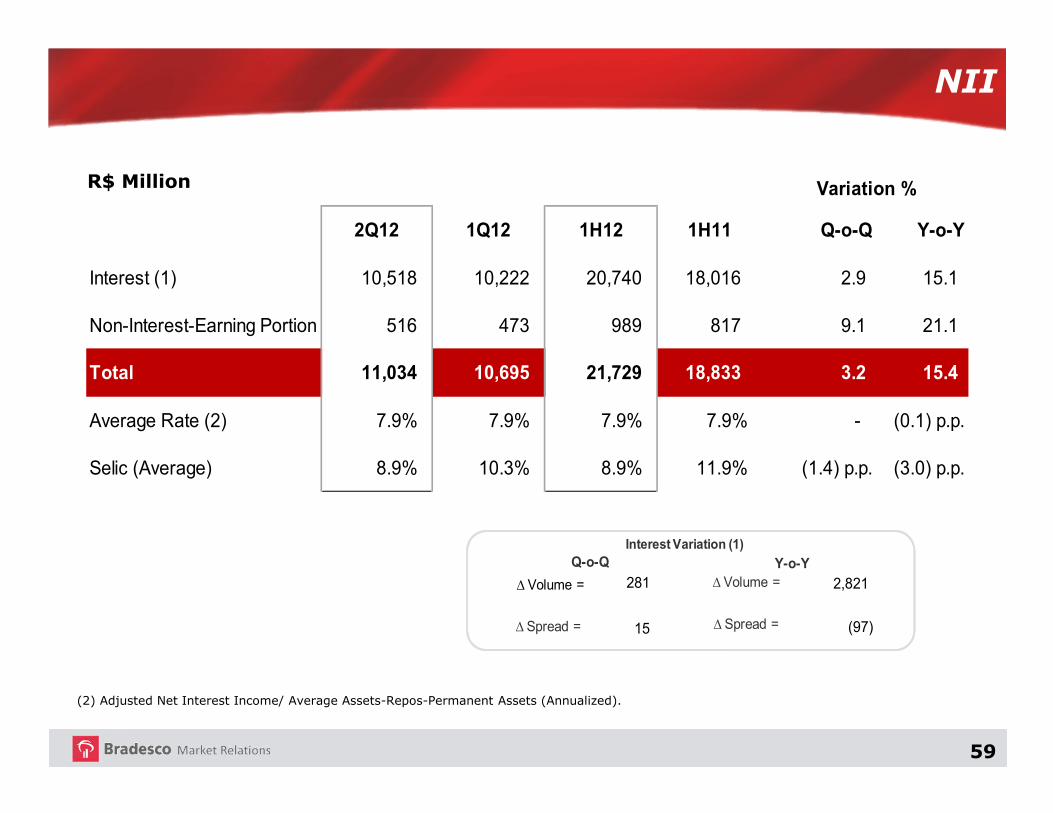
59
NII
(2) Adjusted Net Interest Income/ Average Assets-Repos-Permanent Assets (Annualized).
R$ Million
2Q12 1Q12 1H12 1H11 Q-o-Q Y-o-Y
Interest (1) 10,518 10,222 20,740 18,016 2.9 15.1
Non-Interest-Earning Portion 516 473 989 817 9.1 21.1
Total 11,034 10,695 21,729 18,833 3.2 15.4
Average Rate (2) 7.9% 7.9% 7.9% 7.9% - (0.1) p.p.
Selic (Average) 8.9% 10.3% 8.9% 11.9% (1.4) p.p. (3.0) p.p.
∆ Volume = Interest Variation (1) ∆ Spread =
281 2,821
15 (97)
Variation %
∆ Spread = ∆ Spread =
Q-o-Q
∆ Volume =
Y-o-Y∆ Volume =
Interest Variation (1)

60
NII- Interest /Trading Gains
R$ Million
7,904 8,553 8,849 9,167
9,669 9,985 10,222 10,518
398
465 513
304
561 273 473
516
8888,,,,302 302 302 302 9,018 9,018 9,018 9,018
9,362 9,362 9,362 9,362 9,471 9,471 9,471 9,471
10,230 10,230 10,230 10,230 10,258 10,258 10,258 10,258 10,695 10,695 10,695 10,695 11,034 11,034 11,034 11,034
3Q10 4Q 1Q11 2Q 3Q 4Q 1Q12 2Q
Interest-Earning Portion Non-Interest-Earning Portion

61
NII
R$ Million
2Q12 1Q12 1H12 1H11 Q-o-Q Y-o-Y
- Loans 7,362 7,181 14,543 12,728 2.5 14.3
- Funding 1,041 1,168 2,209 2,141 (10.9) 3.2
- Insurance 726 851 1,577 1,818 (14.7) (13.3)
- Securities / Others 1,389 1,022 2,411 1,329 35.9 81.4
NII - Interest-Earning Portion 10,518 10,222 20,740 18,016 2.9 15.1
Variation %
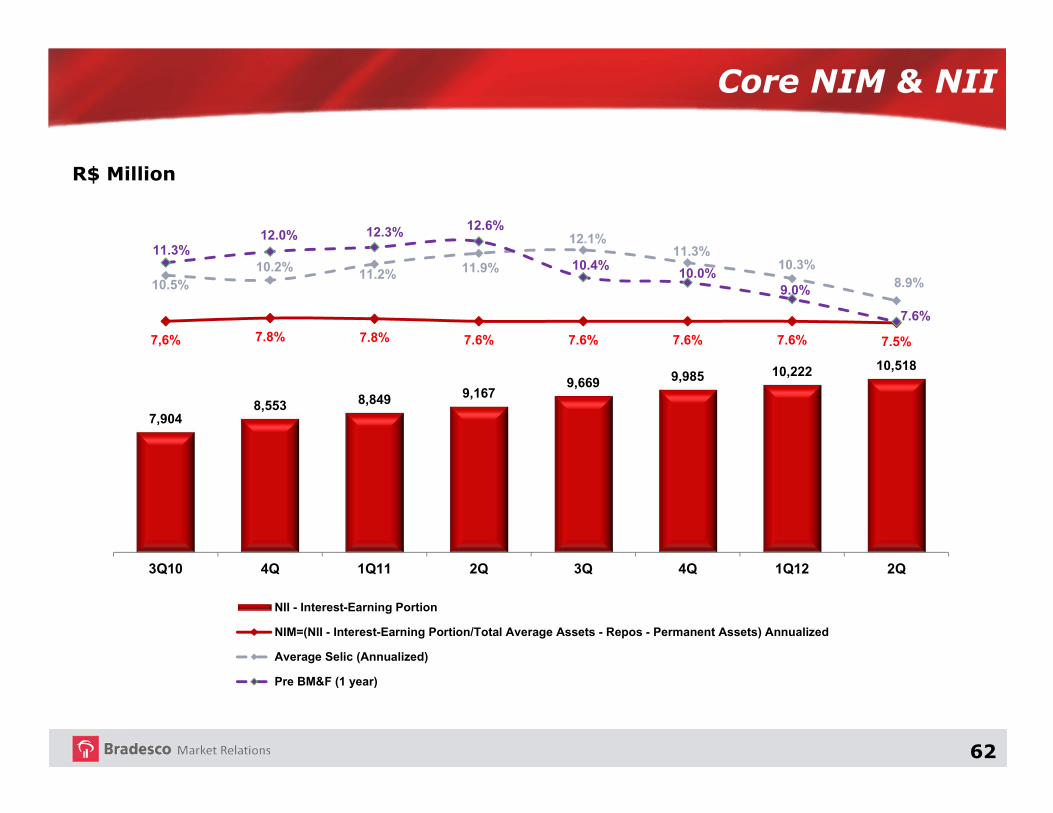
62
Core NIM & NII
R$ Million
7,904 8,553 8,849 9,167
9,669 9,985 10,222 10,518
7,6% 7.8% 7.8% 7.6% 7.6% 7.6% 7.6% 7.5%
10.5%10.2% 11.2% 11.9%
12.1%11.3%
10.3%8.9%
11.3%12.0% 12.3% 12.6%
10.4%10.0%
9.0%
7.6%
3Q10 4Q 1Q11 2Q 3Q 4Q 1Q12 2Q
NII - Interest-Earning Portion
NIM=(NII - Interest-Earning Portion/Total Average Assets - Repos - Permanent Assets) Annualized
Average Selic (Annualized)
Pre BM&F (1 year)

63
Spread
Source: Brazilian Central Bank´s Credit and Banking report 2010.
%
32.73
28.74
21.89
12.56
4.08
Net Interest Margin Deliquency Direct Taxes Administrative Costs Indirect Taxes
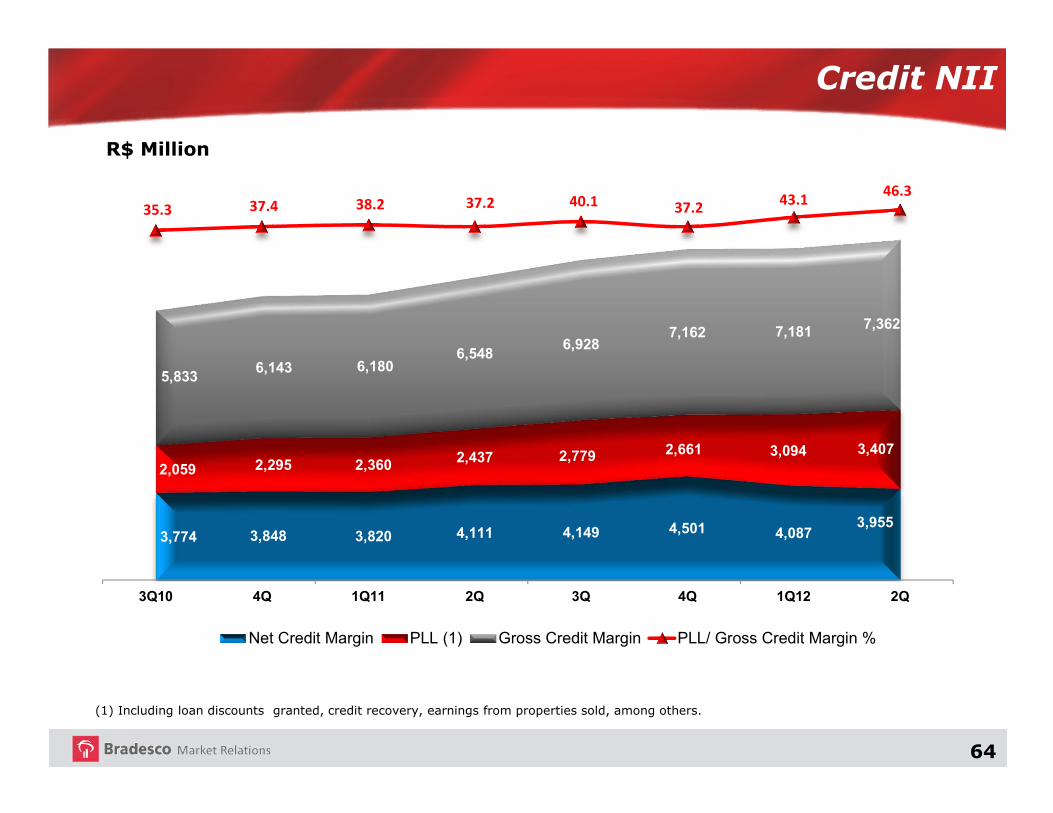
64
Credit NII
R$ Million
3,774 3,848 3,820 4,111 4,149 4,501 4,0873,955
2,059 2,295 2,360 2,437 2,779 2,661 3,094 3,407
5,8336,143 6,180
6,5486,928
7,162 7,181 7,362
35.3 37.4 38.2 37.2 40.1 37.2 43.1
46.3
3Q10 4Q 1Q11 2Q 3Q 4Q 1Q12 2Q
Net Credit Margin PLL (1) Gross Credit Margin PLL/ Gross Credit Margin %
(1) Including loan discounts granted, credit recovery, earnings from properties sold, among others.

65
Fee Income
R$ Million
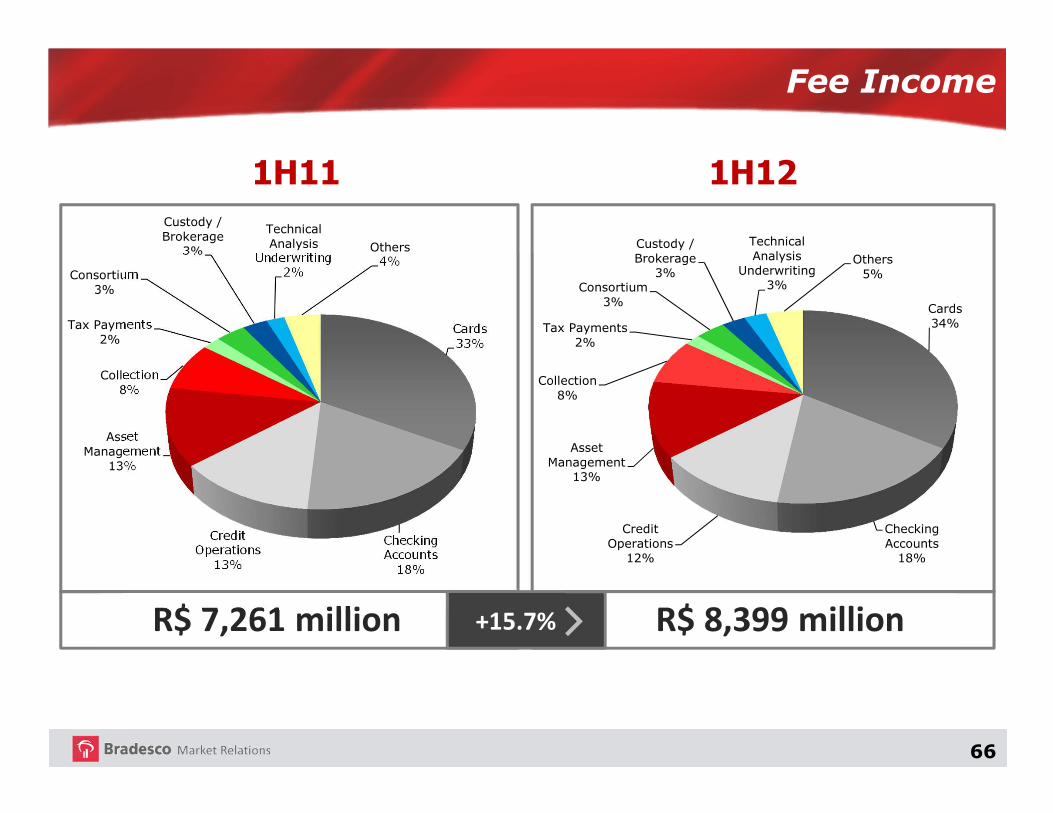
2Q12 1Q12 1H12 1H11 Q-o-Q Y-o-Y
Cards 1,456 1,389 2,845 2,391 4.8 19.0
Checking Accounts 805 748 1,553 1,330 7.6 16.8
Asset Management 535 526 1,061 945 1.7 12.3
Loan Operations 524 501 1,025 951 4.6 7.8
Collection 322 313 636 575 2.9 10.6
Consortium 150 144 293 250 4.2 17.2
Custody / Brokerage 119 117 236 210 1.7 12.4
Technical Analysis / Underwriting 115 109 224 152 5.5 47.4
Tax Payments 80 78 158 153 2.6 3.3
Others 175 193 368 304 (9.3) 21.1
Total 4,281 4,118 8,399 7,261 4.0 15.7
Variation %
66
Fee Income
1H11 1H12
R$ 7,261 million R$ 8,399 million
Cards 33%
Checking Accounts
18%
Credit Operations
13%
Asset Management
13%
Collection 8%
Tax Payments2%
Consortium3%
Custody / Brokerage
3%
Technical Analysis
Underwriting2%
Others 4%
Cards34%
Checking Accounts
18%
Credit Operations
12%
Asset Management
13%
Collection 8%
Tax Payments2%
Consortium3%
Custody / Brokerage
3%
Technical Analysis
Underwriting3%
Others 5%
+15.7%
67
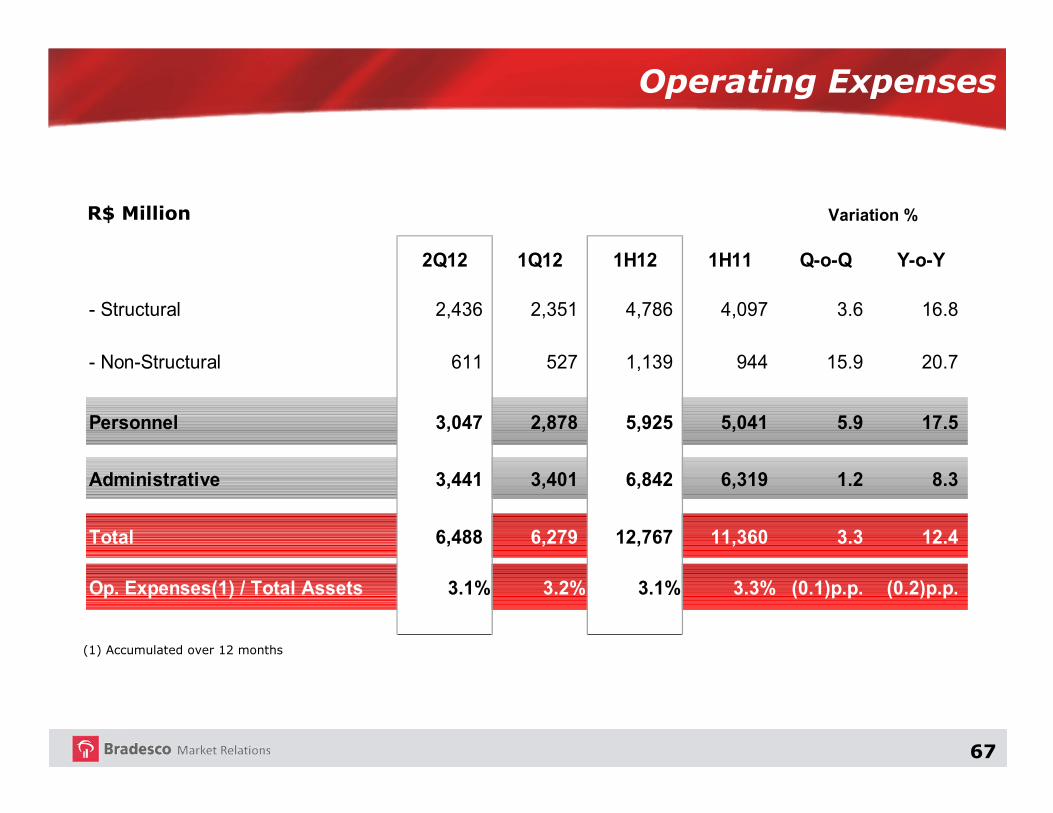
Operating Expenses
(1) Accumulated over 12 months
R$ Million
2Q12 1Q12 1H12 1H11 Q-o-Q Y-o-Y
- Structural 2,436 2,351 4,786 4,097 3.6 16.8
- Non-Structural 611 527 1,139 944 15.9 20.7
Personnel 3,047 2,878 5,925 5,041 5.9 17.5
Administrative 3,441 3,401 6,842 6,319 1.2 8.3
Total 6,488 6,279 12,767 11,360 3.3 12.4
Op. Expenses(1) / Total Assets 3.1% 3.2% 3.1% 3.3% (0.1)p.p. (0.2)p.p.
Variation %

68
Other Administrative Expenses
R$ Million
2Q12 1Q12 1H12 1H11 Q-o-Q Y-o-Y
Third-Party Services 832 832 1,664 1,713 - (2.9)
Communication 415 410 825 769 1.2 7.3
Depreciation and Amortization 308 301 609 538 2.3 13.2
Data Processing 268 262 530 444 2.3 19.4
Transports 215 212 427 358 1.4 19.3
Rental 196 183 379 320 7.1 18.4
Financial System Services 163 163 326 235 - 38.7
Advertising 162 153 315 396 5.9 (20.5)
Maintenance and Repairs 145 146 291 261 (0.7) 11.5
Leasing 96 100 196 171 (4.0) 14.6
Others 641 639 1,280 1,114 0.3 14.9
Total 3,441 3,401 6,842 6,319 1.2 8.3
Variation %

69
Operational Coverage Ratio (1)
R$ Million
3Q09 4Q 1Q10 2Q 3Q 4Q 1Q11 2Q 3Q 4Q 1Q12 2Q
16,863
11,189
66.4
17,460 18,220
19,055 19,871
20,834 21,643
22,451
23,435 24,467
25,170 25,874
11,616 12,017 12,359 12,929 13,372
13,758 14,256 14,705
15,223 15,831 16,361
66.5 66.0 64.9 65.1 64.2 63.6 63.5 62.7 62.2 62.9 63.2
Admin + Personnel Expenses (a)
Fee Income (b)
Coverage Ratio % (b/a)(1) Accumulated over 12 months.

70
Tax Expenses
R$ Million
1Q12 Q-o-Q Y-o-Y
ISSQN 225 6.4 13.6
COFINS 1,382 (2.3) 14.7
PIS 233 (2.5) 14.8
IPTU 30 (50.0) 11.1
Total Tax Expenses 2,003 (2.1) 11.7
Variation %
Other – Misc. Taxes and Fees 133 1.6 (16.9)
1H12
109
699
118
20
1,012
66
2Q12
116
683
115
10
991
67
198
1,205
203
27
1,793
160
1H11
71
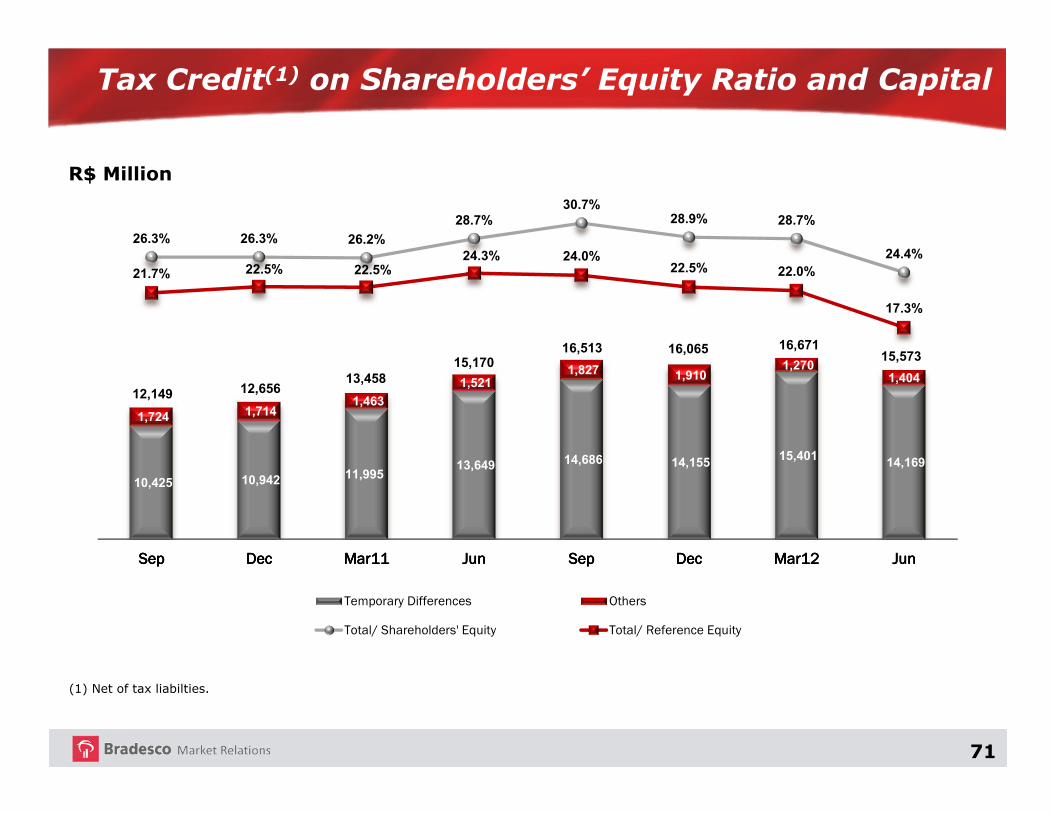
Tax Credit(1) on Shareholders’ Equity Ratio and Capital
(1) Net of tax liabilties.
R$ Million
10,425 10,942 11,995 13,649 14,686 14,155 15,401 14,169
1,724 1,714 1,463
1,521 1,827 1,910
1,270 1,404
26.3% 26.3% 26.2%
28.7%30.7%
28.9% 28.7%
24.4%
21.7% 22.5% 22.5%24.3% 24.0%
22.5% 22.0%
17.3%
12,149 12,656 13,458
15,170 16,513 16,065 16,671
15,573
SepSepSepSep DecDecDecDec Mar11Mar11Mar11Mar11 JunJunJunJun SepSepSepSep DecDecDecDec Mar12Mar12Mar12Mar12 JunJunJunJun
Temporary Differences Others
Total/ Shareholders' Equity Total/ Reference Equity

72
Total Assets and Shareholders’ Equity
R$ Million
689,307
789,550 830,520
1.7% 1.5% 1.4%
Jun11 Mar12 Jun12
Total Assets
Total Assets ROAA (1)
52,843
58,060
63,920
23.2%21.4% 20.6%
Jun11 Mar12 Jun12
Shareholders' Equity
Shareholders' Equity ROAE (1) (2)
(1) Accumulated Adjusted Net Income for the period;(2) Excludes mark-to-market effects of available-for-sale securities registered under Shareholders’ Equity; and(3) Consider the amount of R$ 7,878 million of subordinated financial bills to constitute Tier II Capital, ratified in the second quarter of 2012 by the Central Bank.
Jun11 Mar12 Jun12
Tier I 12.9 12.0 11.8
Tier II 1.8 3.0 5.2
Deductions - - -
BIS 14.7 15.0 17.0
Basel Ratio- BIS II %
73
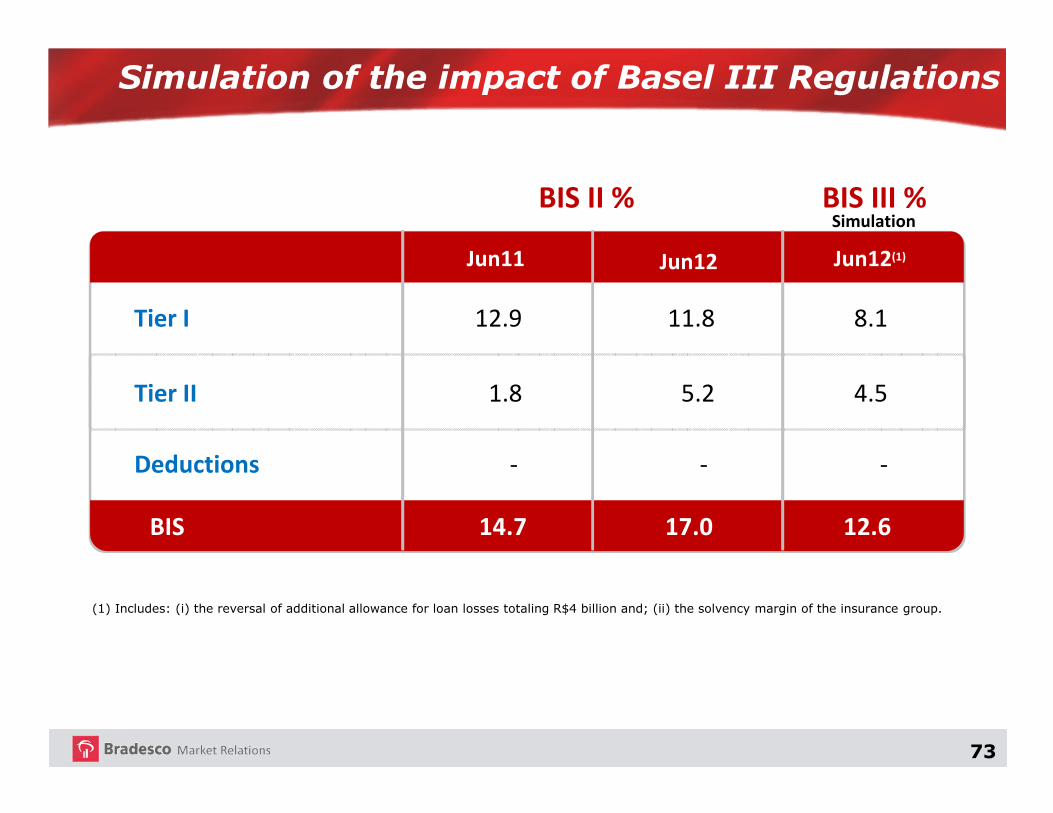
Simulation of the impact of Basel III Regulations
Simulation
Tier I 12.9 11.8 8.1
Tier II 1.8 5.2 4.5
Deductions - - -
BIS 14.7 17.0 12.6
BIS II % BIS III %
Jun11 Jun12 Jun12(1)
(1) Includes: (i) the reversal of additional allowance for loan losses totaling R$4 billion and; (ii) the solvency margin of the insurance group.
74
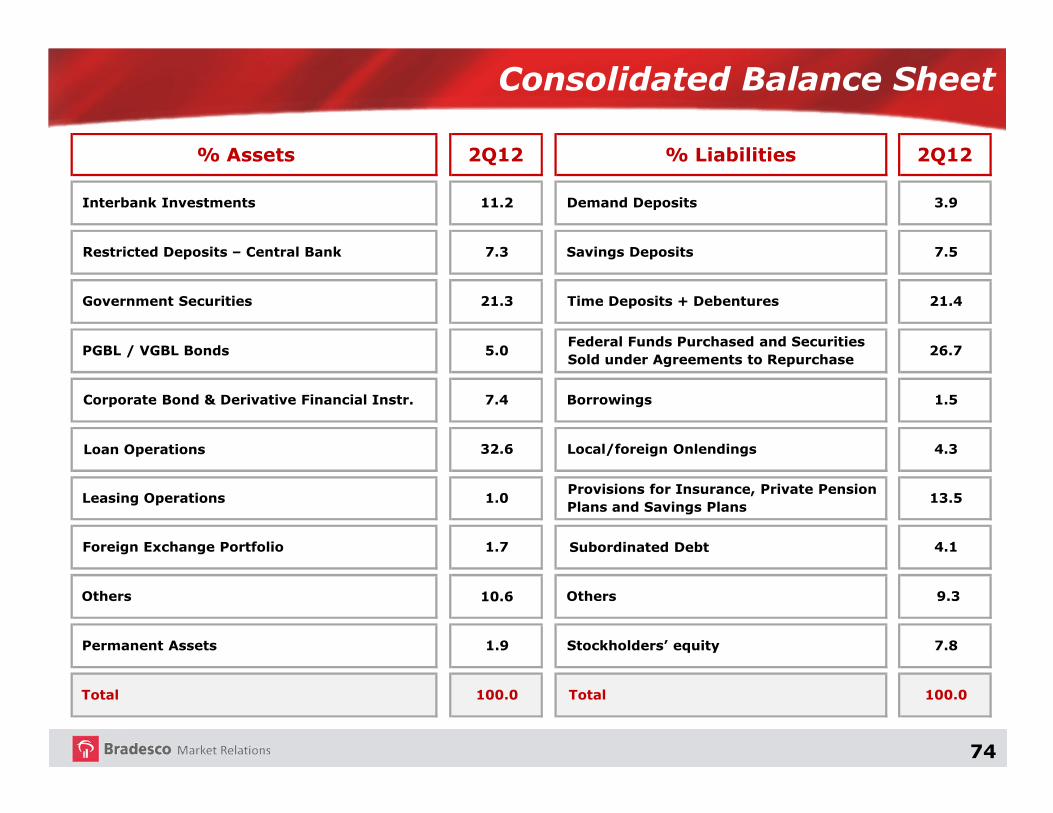
Consolidated Balance Sheet
% Assets 2Q12 % Liabilities 2Q12
Interbank Investments 11.2 Demand Deposits 3.9
Restricted Deposits – Central Bank 7.3 Savings Deposits 7.5
Government Securities 21.3 Time Deposits + Debentures 21.4
PGBL / VGBL Bonds 5.0Federal Funds Purchased and Securities
Sold under Agreements to Repurchase26.7
Corporate Bond & Derivative Financial Instr. 7.4 Borrowings 1.5
Loan Operations 32.6 Local/foreign Onlendings 4.3
Leasing Operations 1.0Provisions for Insurance, Private Pension
Plans and Savings Plans13.5
Foreign Exchange Portfolio 1.7 Subordinated Debt 4.1
Others 10.6 Others 9.3
Permanent Assets 1.9 Stockholders’ equity 7.8
Total 100.0 Total 100.0
75
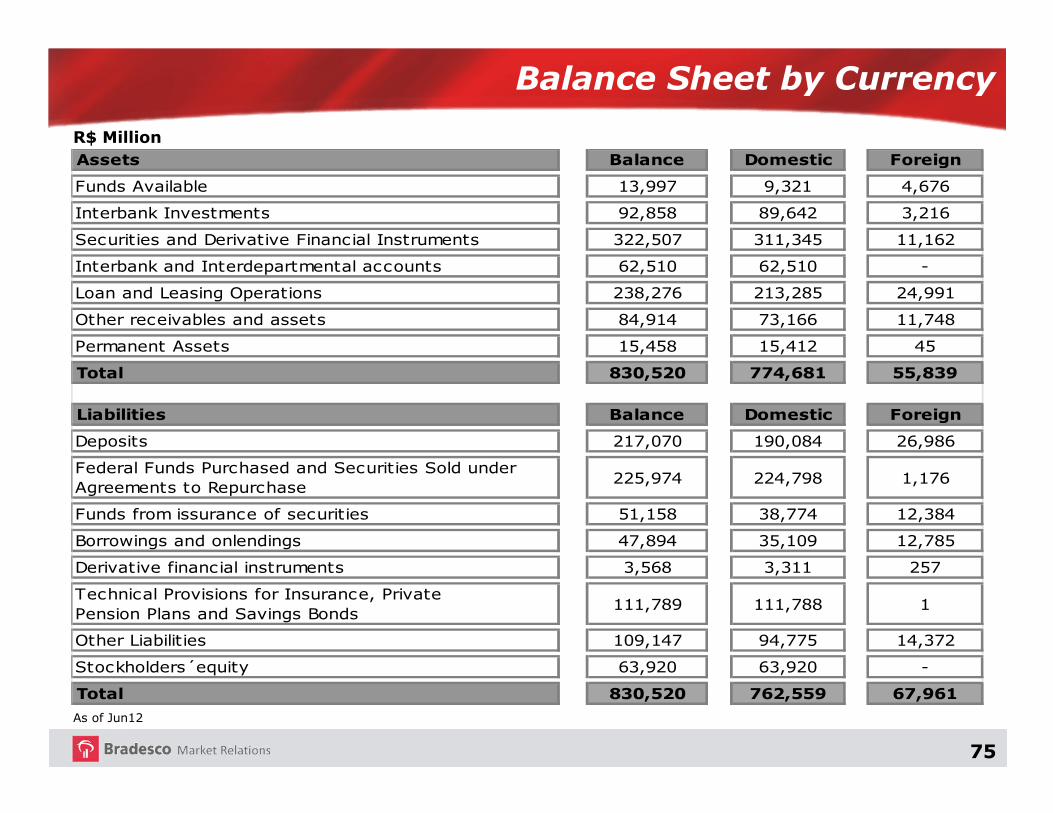
Balance Sheet by Currency
As of Jun12
R$ Million
Assets Balance Domestic Foreign
Funds Available 13,997 9,321 4,676
Interbank Investments 92,858 89,642 3,216
Securities and Derivative Financial Instruments 322,507 311,345 11,162
Interbank and Interdepartmental accounts 62,510 62,510 -
Loan and Leasing Operations 238,276 213,285 24,991
Other receivables and assets 84,914 73,166 11,748
Permanent Assets 15,458 15,412 45
Total 830,520 774,681 55,839
Liabilities Balance Domestic Foreign
Deposits 217,070 190,084 26,986
Federal Funds Purchased and Securities Sold under Agreements to Repurchase
225,974 224,798 1,176
Funds from issurance of securities 51,158 38,774 12,384
Borrowings and onlendings 47,894 35,109 12,785
Derivative financial instruments 3,568 3,311 257
Technical Provisions for Insurance, PrivatePension Plans and Savings Bonds
111,789 111,788 1
Other Liabilities 109,147 94,775 14,372
Stockholders´equity 63,920 63,920 -
Total 830,520 762,559 67,961
76
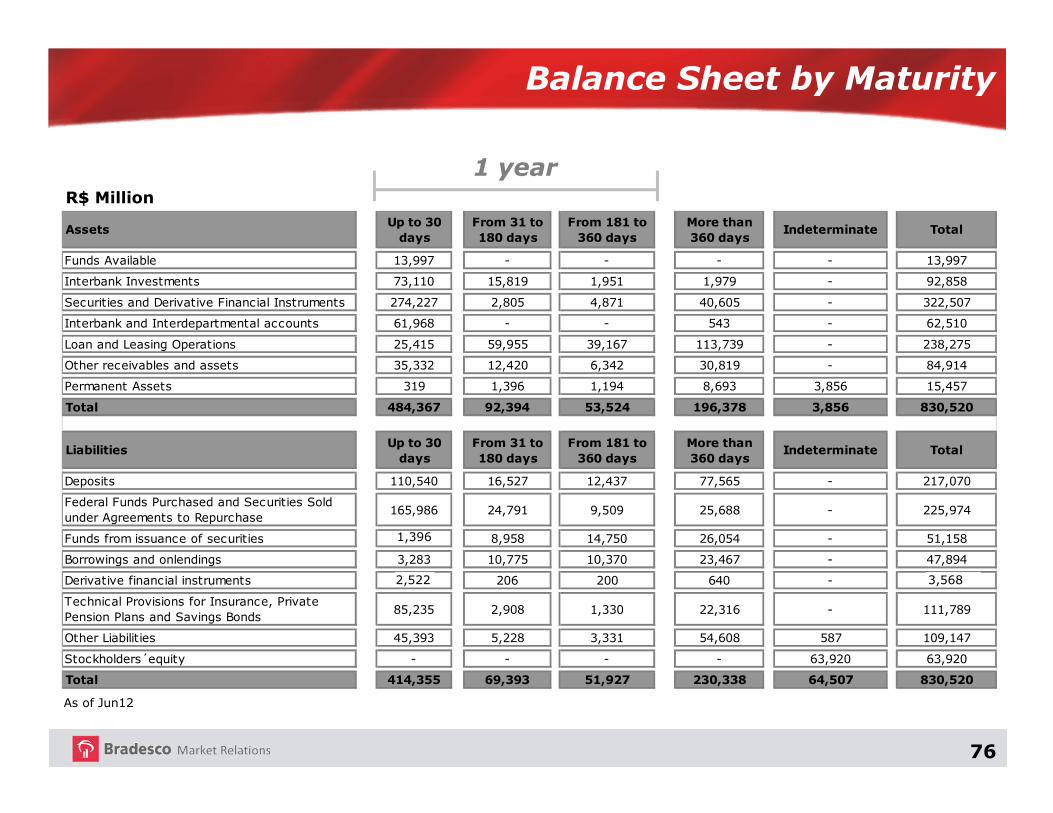
Balance Sheet by Maturity
R$ Million
As of Jun12
AssetsUp to 30
days
From 31 to
180 days
From 181 to
360 days
More than
360 daysIndeterminate Total
Funds Available 13,997 - - - - 13,997
Interbank Investments 73,110 15,819 1,951 1,979 - 92,858
Securities and Derivative Financial Instruments 274,227 2,805 4,871 40,605 - 322,507
Interbank and Interdepartmental accounts 61,968 - - 543 - 62,510
Loan and Leasing Operations 25,415 59,955 39,167 113,739 - 238,275
Other receivables and assets 35,332 12,420 6,342 30,819 - 84,914
Permanent Assets 319 1,396 1,194 8,693 3,856 15,457
Total 484,367 92,394 53,524 196,378 3,856 830,520
LiabilitiesUp to 30
days
From 31 to
180 days
From 181 to
360 days
More than
360 daysIndeterminate Total
Deposits 110,540 16,527 12,437 77,565 - 217,070
Federal Funds Purchased and Securities Sold under Agreements to Repurchase
165,986 24,791 9,509 25,688 - 225,974
Funds from issuance of securities 1396 8,958 14,750 26,054 - 51,158
Borrowings and onlendings 3,283 10,775 10,370 23,467 - 47,894
Derivative financial instruments 2522 206 200 640 - 3568
Technical Provisions for Insurance, PrivatePension Plans and Savings Bonds
85,235 2,908 1,330 22,316 - 111,789
Other Liabilities 45,393 5,228 3,331 54,608 587 109,147
Stockholders´equity - - - - 63,920 63,920
Total 414,355 69,393 51,927 230,338 64,507 830,520
1 year
1,396
2,522 3,568

77
Main Funding
R$ Billion
(*) Considers only debentures used to back purchase and sale commitments.
26.8 27.6 28.6 25.9 28.4 30.3 35.7 32.6 33.8 34.9 37.3 32.9 33.0 31.9 33.1 32.0 32.5
34.2 35.7 37.8 37.4 38.5 40.944.2 45.2 47.3 50.1 53.4 54.6 54.8 56.6 59.7 60.0 62.3
61.375.5
97.4 105.4 100.1 96.090.5 92.6 96.8
100.7102.2 116.0 125.4
135.8 124.1 121.5 121.8
16.7
17.7
19.7 20.3 20.4 22.9 23.1 23.523.4
25.726.3
24.424.6
26.2 26.9 30.1 34.1
34.0
35.0
34.6 31.7 28.5 34.0 36.9 40.840.9
43.246.0
48.447.1
47.5 49.8 55.4 55.7
24.7
32.0
32.0 30.429.1 27.0
27.330.2
35.038.0
38.2
41.545.2
49.0 53.2 47.1 47.9
5.4
6.5
9.0 9.37.7 7.1
7.58.5
12.713.7
17.7
21.7
29.1
32.941.5 48.5
51.2
203.1
230.0
259.1 260.4252.7 258.2 265.2
273.4289.9
306.3321.1
339.5
359.2
379.9388.4 394.6
405.5
Jun08 Sep Dec Mar09 Jun Sep Dec Mar10 Jun Sep Dec Mar11 Jun Sep Dec Mar12 Jun
Demand Deposits Saving Deposits
Time Deposits Debentures (*)
Borrowing and Onlending Funds from Issuance of Securities
Subordinated Debts Total
78
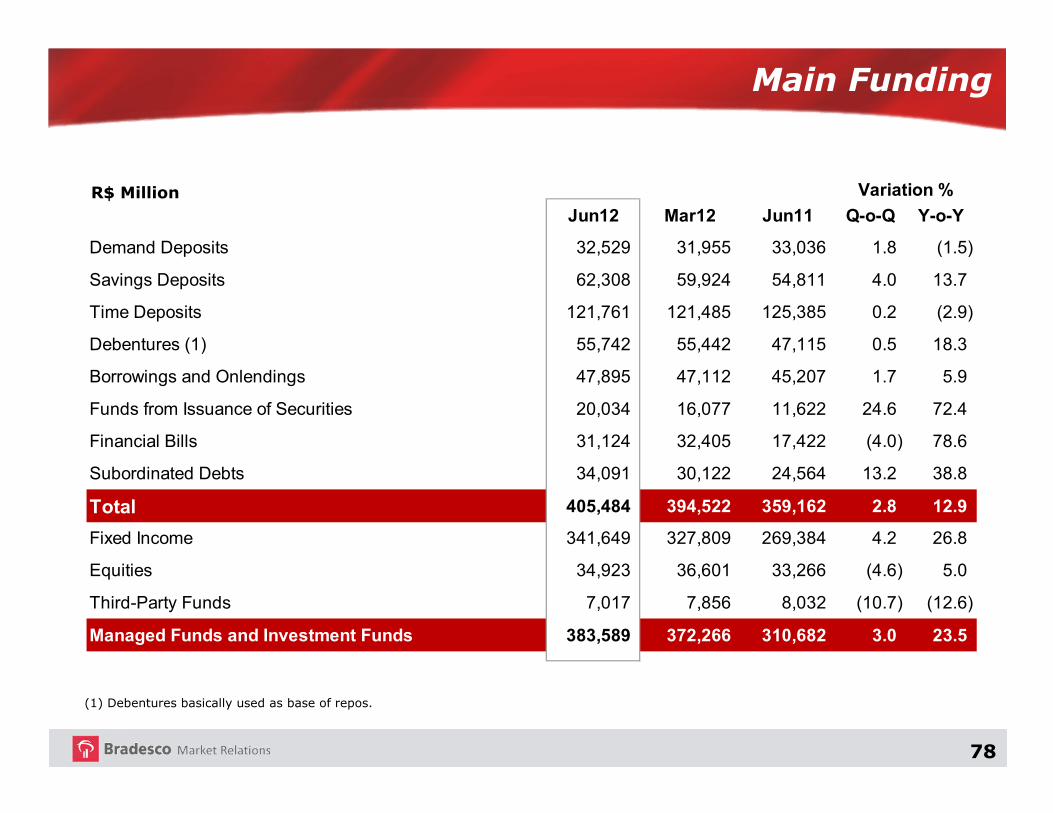
Main Funding
(1) Debentures basically used as base of repos.
R$ Million
Jun12 Mar12 Jun11 Q-o-Q Y-o-Y
Demand Deposits 32,529 31,955 33,036 1.8 (1.5)
Savings Deposits 62,308 59,924 54,811 4.0 13.7
Time Deposits 121,761 121,485 125,385 0.2 (2.9)
Debentures (1) 55,742 55,442 47,115 0.5 18.3
Borrowings and Onlendings 47,895 47,112 45,207 1.7 5.9
Funds from Issuance of Securities 20,034 16,077 11,622 24.6 72.4
Financial Bills 31,124 32,405 17,422 (4.0) 78.6
Subordinated Debts 34,091 30,122 24,564 13.2 38.8
Total 405,484 394,522 359,162 2.8 12.9
Fixed Income 341,649 327,809 269,384 4.2 26.8
Equities 34,923 36,601 33,266 (4.6) 5.0
Third-Party Funds 7,017 7,856 8,032 (10.7) (12.6)
Managed Funds and Investment Funds 383,589 372,266 310,682 3.0 23.5
Variation %
79
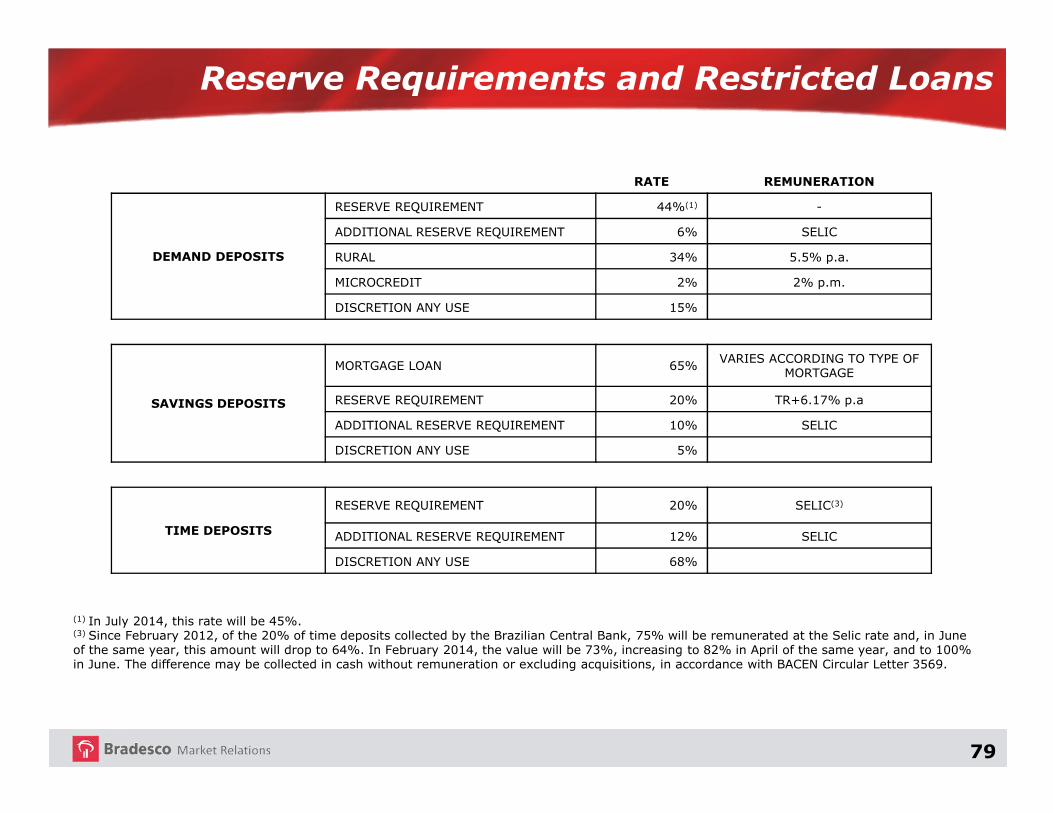
Reserve Requirements and Restricted Loans
RATE REMUNERATION
DEMAND DEPOSITS
RESERVE REQUIREMENT 44%(1) -
ADDITIONAL RESERVE REQUIREMENT 6% SELIC
RURAL 34% 5.5% p.a.
MICROCREDIT 2% 2% p.m.
DISCRETION ANY USE 15%
SAVINGS DEPOSITS
MORTGAGE LOAN 65% VARIES ACCORDING TO TYPE OF MORTGAGE
RESERVE REQUIREMENT 20% TR+6.17% p.a
ADDITIONAL RESERVE REQUIREMENT 10% SELIC
DISCRETION ANY USE 5%
TIME DEPOSITS
RESERVE REQUIREMENT 20% SELIC(3)
ADDITIONAL RESERVE REQUIREMENT 12% SELIC
DISCRETION ANY USE 68%
(1) In July 2014, this rate will be 45%. (3) Since February 2012, of the 20% of time deposits collected by the Brazilian Central Bank, 75% will be remunerated at the Selic rate and, in June of the same year, this amount will drop to 64%. In February 2014, the value will be 73%, increasing to 82% in April of the same year, and to 100% in June. The difference may be collected in cash without remuneration or excluding acquisitions, in accordance with BACEN Circular Letter 3569.

80
Loans and Funding
R$ Million
(1) Debentures basically used as base of repos;
(2) Does not include public sector’s securities linked to saving; and
(3) Comprises amounts relative to card operations (cash and installment purchases at merchants), amounts related to interbank deposit certificates (CDI) to abate from the compulsory and debenture amount.
Jun12 Mar12 Jun11 Q-o-Q Y-o-Y
Demand Deposits 32,529 31,955 33,036 1.8 (1.5)
Sundry Floating 4,122 6,948 4,308 (40.7) (4.3)
Savings Deposits 62,308 59,924 54,811 4.0 13.7
Time Deposits + Debentures (1) 177,503 176,927 172,500 0.3 2.9
Financial Bills 31,124 32,405 17,422 (4.0) 78.6
Others 19,799 18,283 15,565 8.3 27.2
Funding from Clients 327,385 326,442 297,642 0.3 10.0
(-)Reserve Requirements / Funds Available (2) (67,210) (79,159) (65,065) (15.1) 3.3
Funding from Clients - Net of Reserve Requirements 260,175 247,283 232,577 5.2 11.9
Mandatory onlendings 32,122 32,490 33,520 (1.1) (4.2)
Foreign Credit Lines 17,018 11,423 15,851 49.0 7.4
Funding Overseas 51,411 42,648 34,738 20.5 48.0
Total Funding (A) 360,726 333,844 316,686 8.1 13.9
322,962 308,251 277,371 4.8 16.4
B / A (%) 89.5 92.3 87.6 (2.8) p.p. 1.9 p.p.x
Loan Portfolio / Leasing / Cards (Other Credits) / Acquired Interbank Deposit Certificate (B) (3)
Variation %

81
Expanded Loan Portfolio (1)
R$ Billion
(1) Includes sureties, guarantees, letters of credit, and advances of credit card receivables, debentures, and promissory notes, assignment ofreceivables-backed investment funds and mortgage-backed receivables and ruracredit. Further information can be found on page 38 of the Reportof Economic and Financial Analysis.
33% 34% 34% 35% 34% 33% 33% 32% 32% 31% 31% 31%
40% 38% 38% 37% 37%38% 38% 39% 39% 38% 38%
39%27%
28%28%
28%29%
29%29%
29%29%
31% 31%30%
227.6238.8
249.8259.7
272.5
295.2306.1
319.8332.3
345.7 350.8365.0
Sep09 Dec Mar10 Jun Sep Dec Mar11 Jun Sep Dec Mar12 Jun
SMEs Large Corporates Individuals

82
R$ Million
Expanded Loan Portfolio
(1) Includes sureties and guarantees, letters of credit, anticipation of credit card receivables, debentures, promissory notes, creditassignment with recourse (FIDC - Receivables Securitization Fund and CRI - Real Estate Receivables Certificate), and rural credit.
Jun12 Mar12 Jun11 Q-o-Q Y-o-Y LARGE CORPORATES 143,830 134,451 124,057 7.0 15.9
SMEs 108,898 106,730 92,830 2.0 17.3
INDIVIDUALS 112,235 109,651 102,915 2.4 9.1
Expanded Loan Portfolio - Total (1) 364,963 350,831 319,802 4.0 14.1
Variation %

83
Loan Portfolio Breakdown
Jun12Individuals Corporate
Working Capital17%
Export Financing5%
BNDES Onlendings /
Finame12%
Operations Abroad
9%Overdraft Accounts
4%
Leasing3%
Credit Card6%
Rural2%
Vehicles - CDC2%
Mortgage (4)4%
Sureties and Guarantees (5)
21%
Commercial Portfolio(6)
11%
Others(7)4%
Vehicles - CDC26%
Leasing3%
Credit Card17%
Personal Loans13%
Payroll-Deductible Loans (1)
17%
Rural6%
BNDES Onlendings/ Finame
5%
Mortgage (2)8%
Overdraft Accounts3%
Sureties and Guarantees
1%
Others (3)3%
R$ 112,235 million R$ 252,728 million
Including:
(1) Loan assignment (FIDC): R$339 million;(2) Loan assignment (CRI): R$182 million;(3) Loan assignment (FIDC) for the acquisition of assets: R$2 million and Rural loan assignment: R$112 million;(4) Loan assignment (CRI): R$239 million;(5) 91.5% of sureties and guarantees from corporate customers were contracted by corporations;(6) Operations with debentures and promissory notes;(7) Letters of credit: R$1,779 million.

84
Loan Portfolio – Individuals
R$ Million
Includes:(1) Credit assignments (FIDC): R$ 339 million in Jun/12, R$ 420 million in Mar/12 and R$ 439 million in Jun/11;(2) Credit assignments (CRI): R$ 182 million in Jun/12, R$ 198 million in Mar/12 and R$ 248 million in Jun/11; and(3) Credit assignments (FIDC), for the acquisition of assets: R$ 2 million in Jun/12, R$ 2 million in mar/12 and R$ 3 million in Jun/11; and rural credit assignments :R$ 112 million in Jun/12, R$ 112 million in Mar/12 and R$ 121 million in Jun/11.
Jun12 Mar12 Jun11 Q-o-Q Y-o-Y
Vehicles - CDC 29,324 29,075 26,804 0.9 9.4
Payroll-Deductible Loans (1) 19,243 18,398 16,886 4.6 14.0
Credit Cards 18,545 17,903 17,141 3.6 8.2
Personal Loans 14,465 13,771 12,658 5.0 14.3
Mortgage (2) 8,768 7,994 5,521 9.7 58.8
Rural 6,367 6,599 6,009 (3.5) 6.0
BNDES/Finame Onlendings 5,515 5,494 4,930 0.4 11.9
Overdraft Accounts 3,204 3,217 3,013 (0.4) 6.4
Leasing 2,871 3,510 5,946 (18.2) (51.7)
Sureties and Guarantees 650 598 641 8.6 1.4
Others (3) 3,282 3,091 3,366 6.2 (2.5)
Total 112,235 109,651 102,915 2.4 9.1
Variation %

85
Consumer Financing
R$ Million
(1) Includes: Credit assignments (FIDC): R$ 339 million in Jun/12, R$ 420 million in Mar/12 and R$ 439 million in Jun/11.
Jun12 Mar12 Jun11 Q-o-Q Y-o-Y
CDC/ Leasing - Vehicles 32,195 32,585 32,750 (1.2) (1.7)
Credit Cards 18,545 17,903 17,141 3.6 8.2
Payroll-Deductible Loans (1) 19,243 18,398 16,886 4.6 14.0
Personal Loans 14,465 13,771 12,658 5.0 14.3
Financing of Goods 392 388 562 1.0 (30.2)
Total 84,841 83,045 79,997 2.2 6.1
Variation %

86
Loan Portfolio - Corporate
R$ Million
(1) Including loan assignments (CRI) of R$ 239 million in Jun/12, R$ 280 million in Mar/12 and R$ 304 million in Jun11;
(2) 91.5 % of Surety and Guarantee Corporate transactions are carried out with Large Corporations;
(3) Includes operations with Debentures and Promissory Notes; and
(4) Letters of Credit: R$ 1,779 million in Jun/12, R$ 1,556 million in Mar/12 and R$ 1,630 million in Jun/11.
Jun12 Mar12 Jun11 Q-o-Q Y-o-Y
Working Capital 42,533 41,551 37,863 2.4 12.3
BNDES/Finame Onlendings 29,474 29,812 28,359 (1.1) 3.9
Operations Abroad 23,615 21,670 19,650 9.0 20.2
Credit Cards 14,385 13,916 12,069 3.4 19.2
Export Financing 12,408 10,479 9,367 18.4 32.5
Mortgages - Corporate Plans (1) 11,047 10,068 7,687 9.7 43.7
Overdraft Accounts 10,437 10,631 10,073 (1.8) 3.6
Leasing 6,722 7,008 7,773 (4.1) (13.5)
Vehicles - CDC 6,245 5,965 4,568 4.7 36.7
Rural 4,539 4,358 4,738 4.1 (4.2)
Sureties and Guarantees (2) 52,226 50,334 42,802 3.8 22.0
Operations Credit Risk - Commercial Portfolio (3) 28,043 25,403 21,473 10.4 30.6
Others (4) 11,054 9,983 10,465 10.7 5.6
Total 252,728 241,181 216,887 4.8 16.5
Variation %

87
Credit Quality and Concentration
AA-C: 91.5%
Loan Portfolio BreakdownBy Rating
Concentration ofLoan Operations - % (1)
AA18.5%
A40.5%
B14.5%
C18.0%
D2.5%
E-H5.9%
0.9
5.0
8.2
13.1
17.1
LargestBorrower
10 Larg.Borrow.
20 Larg.Borrow.
50 Larg.Borrow.
100 Larg.Borrow.
Jun12
(1) Concept defined by the Brazilian Central Bank.
88
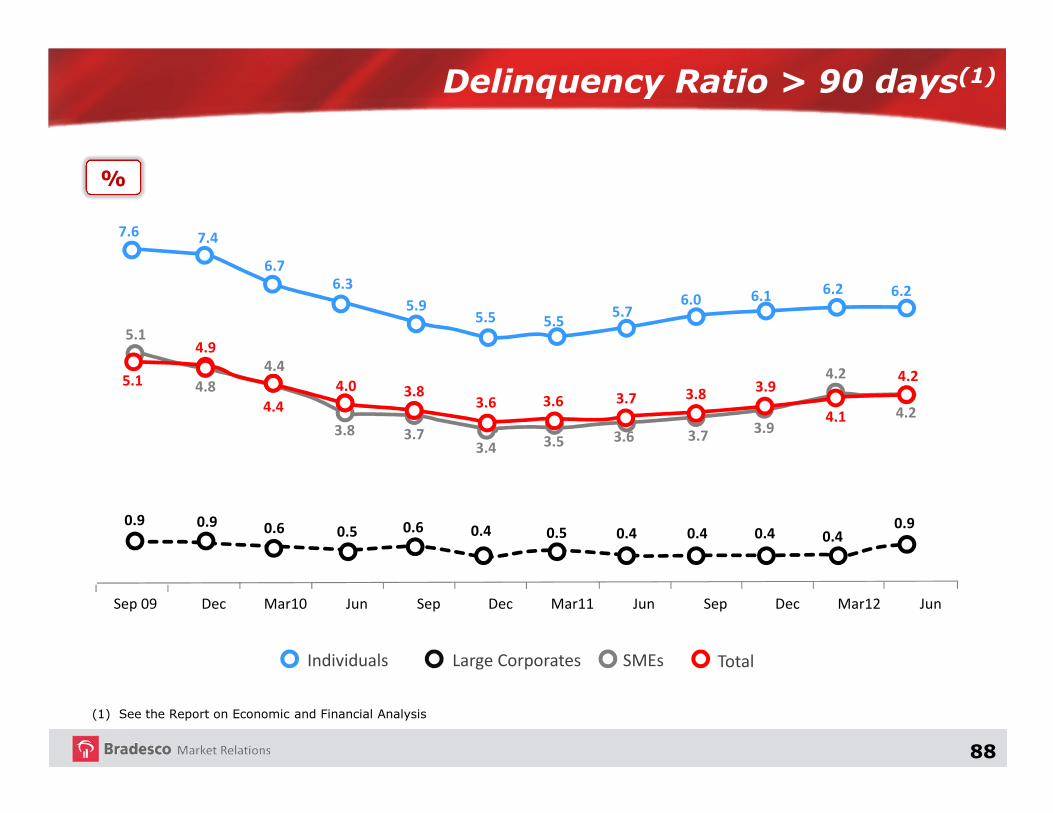
Delinquency Ratio > 90 days(1)
%
7.6 7.4
6.76.3
5.95.5 5.5
5.76.0 6.1 6.2 6.2
5.1
4.8
4.4
3.8 3.73.4 3.5 3.6 3.7
3.9
4.2
4.2
5.1
4.9
4.4
4.0 3.83.6 3.6 3.7 3.8
3.9
4.1
4.2
0.9 0.9 0.6 0.5 0.6 0.4 0.5 0.4 0.4 0.4 0.40.9
(1) See the Report on Economic and Financial Analysis
Large Corporates TotalIndividuals SMEs
Sep 09 Dec Mar10 Jun Sep Dec Mar11 Jun Sep Dec Mar12 Jun
89
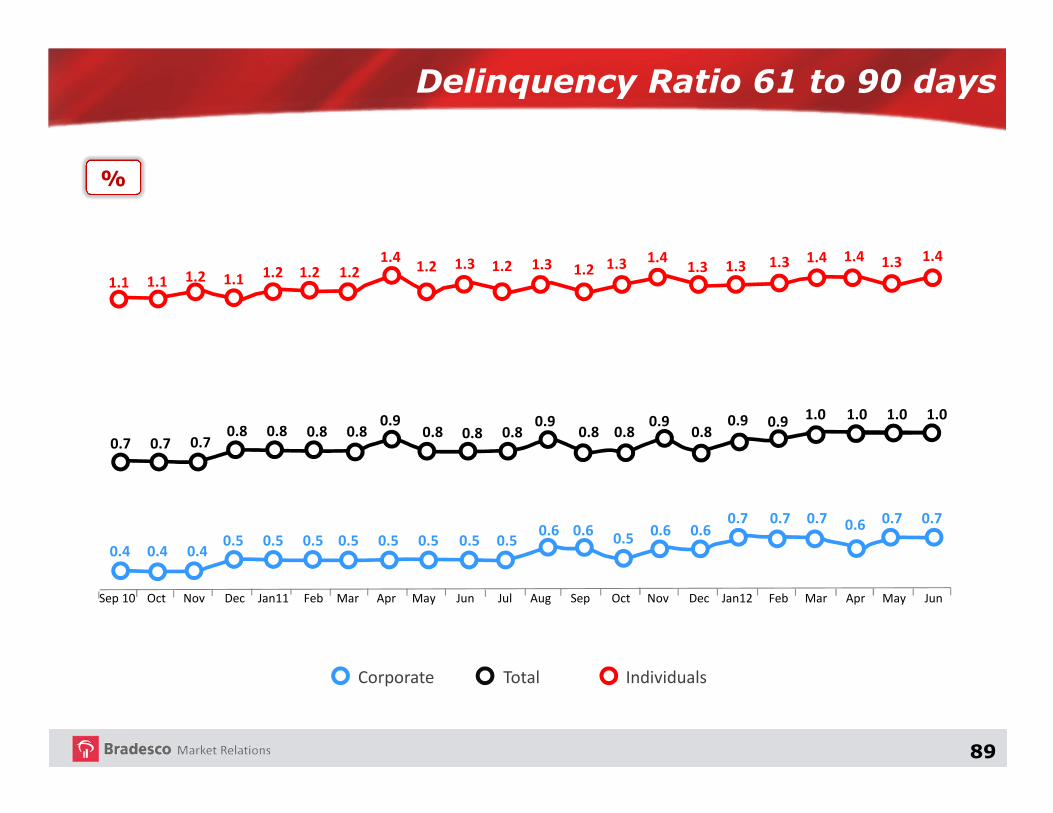
Delinquency Ratio 61 to 90 days
%
1.1 1.1 1.2 1.1 1.2 1.2 1.21.4
1.2 1.3 1.2 1.3 1.2 1.3 1.41.3 1.3 1.3 1.4 1.4 1.3 1.4
0.70.8
0.9 0.9 0.9 0.9 0.9 1.0 1.0 1.0 1.0
0.7 0.70.8 0.8 0.8 0.8 0.8 0.8 0.8 0.8 0.8
0.40.5
0.60.5
0.7 0.6
0.4 0.40.5 0.5 0.5 0.5 0.5 0.5 0.5
0.6 0.6 0.60.7 0.7 0.7 0.7
Total IndividualsCorporate
Sep 10 Oct Nov Dec Jan11 Feb Mar Apr May Jun Jul Aug Sep Oct Nov Dec Jan12 Feb Mar Apr May Jun

90
Renegotiated Portfolio
R$ Billion
Sep10 Mar11 Jun Sep Dec Mar12 JunDec
Deliquency ratio over 90 daysAllowance for Loan Losses as a % of the Renegotiated PortfolioRenegotiated Portfolio (R$ Billion)
6.7
62.9
25.724.6 26.0
24.4 24.727.6
29.2 29.4
62.8 63.0 62.2 62.363.8 64.1 63.6
6.97.3 7.8 8.3 8.7 8.9 9.1

91
Loan Portfolio(1)
(1) According to Brazilian Central Bank criteria.
Loan Portfolio excluding RenegotiationDeliquency ratio over 90 daysLoan Potfolio (1)Deliquency ratio over 90 days
excluding Renegotiation
R$ Billion
Sep10 Mar11 Jun Sep Dec Mar12 JunDec
217
231240
251261
269 270279
211
224233
243252
260 261270
3.8% 3.6% 3.6% 3.7% 3.8% 3.9% 4.1% 4.2%
3.2% 2.9% 2.9% 3.0% 3.1% 3.2% 3.3% 3.3%

92
Allowance for Loan Losses/ PLL / Write-off
R$ Million
2Q12 1Q12 1H12 1H11 Q-o-Q Y-o-Y
OPENING BALANCE 20,117 19,540 19,540 16,290 3.0 20.0
RECORDED 3,651 3,298 6,949 5,219 10.7 33.1
WRITTEN-OFF (3,086) (2,721) (5,807) (4,144) 13.4 40.1
CLOSING BALANCE 20,682 20,117 20,682 17,365 2.8 19.1
SPECIFIC PROVISION 10,809 10,576 10,809 8,669 2.2 24.7
GENERIC PROVISION 5,863 5,530 5,863 5,692 6.0 3.0
EXCESS PROVISION 4,010 4,012 4,010 3,003 - 33.5
CREDIT RECOVERY 785 653 1,438 1,318 20.2 9.1
Variation %

93
Provisioning Ratios(1)
%
(1) See the Report on Economic and Financial Analysis.
12 – Month Write-Offs (Gross)
E-H Past Dues/Loan Portfolio
12 – Month Write-Offs (Net)
Minimun Required Allowance for Loan LosssesAllowance for Loan Losses
R$ 4.0 bn
R$ 7.8 bn
R$ 11.2 bn
8.38.5
8.0
7.6 7.47.1 7.0 6.9
7.3 7.37.5 7.4
6.6
5.5
5.2
3.8
7.0
6.5
6.1 6.05.8 5.7 5.7 5.8
6.0 6.0
5.5
4.9
4.54.3
4.1 4.1 4.2
4.2
4.44.7 4.7
4.7
4.33.9 3.8 3.8
3.94.2 4.4 4.5 4.6
3.32.9 2.6 2.6 2.6
2.8 3.0 3.1 3.2 3.3 3.4
Sep09 Dec Mar10 Jun Sep Dec Mar11 Jun Sep Dec Mar12 Jun
5.8
4.3

94
Allowance for Loan Losses, Overdue Credits and Coverage Ratio
R$ Million
16,019 16,290 16,740 17,365
19,091 19,540 20,117 20,682
9,886 9,973 10,520
11,272 11,963
12,870 13,718
14,365
8,351 8,243 8,648 9,172 9,839
10,598 11,070 11,662
191.8% 197.6% 193.6% 189.3% 194.0%184.4%
181.7% 177.4%162.0% 163.3% 159.1% 154.0%
159.6%151.8% 146.6% 144.0%
Sep10 Dec Mar11 Jun Sep Dec Mar12 Jun
Allowance for Loan Losses (1)
Loan Portfolio Overdue > 60 days (2)
Loan Portfolio Overdue > 90 days (3)
Coverage Ratio > 90 days (1/3)
Coverage Ratio > 60 days (1/2)

95
High Growth Products
Payroll Deductible Loans
Vehicles Financing
Real Estate Lending and Mortgage
Cards
Insurance and Pension Plans
Capital Markets

96
Projected Share of GDP
Source: Brazilian Central BankPrepared by / (*) Projections: Bradesco - DEPEC
%
1.40 1.50 1.702.10
2.90
3.80
4.68
5.57
6.53
7.44
8.35
8.99
9.649.99
10.33 10.47
2005 2006 2007 2008 2009 2010 2011* 2012* 2013* 2014* 2015* 2016* 2017* 2018* 2019* 2020*

97
Share Of GDP
88.9
74.7
59.2
53.6
39.436.0
30.524.0
17.0 16.5
10.08.2 7.0 6.0
4.1 1.7 1.10
10
20
30
40
50
60
70
80
90
100
New
Zealand
United King
dom
USA
Portug
al
Spain
Australia
Canada
Germany
France
Japan
Hon
g Ko
ng
Korea
Thailand
Italy
Chile
Hun
gary
China
Poland
Mexico
Czech Repub
lic
Bulgaria
India
Turkey
Brazil
Colombia
Argentin
a
Russia
As of: Brazil - Jan/11; Colombia – Dec/07; Bulgaria, Czech Republic, Poland, Japan – Dec/06; Others Countries – Mar/08;
%

98
Housing Deficit (Brazil)
7.9 Million Homes
ABOVE 10MINIMUM WAGES;
1.6
BETWEEN 5 AND 10 MINIMUM WAGES;
6.9
BELOW 5 MINIMUM WAGES;
91.5
%

99
Annual Production
Market
9,340
18,283
30,032 34,017
56,198
2006 2007 2008 2009 2010
79,917
2011
29,226 29,628
1H11 1H12
R$ Million

100
Bradesco’s Annual Origination
R$ Million # homes
4,043
5,993
4,707
9,128
14,907
2007 2008 2009 2010 2011
33,673
49,252
34,627
64,449
76,346
2007 2008 2009 2010 2011
7,207 7,212
1H11 1H12
39,195 41,268
1H11 1H12
101
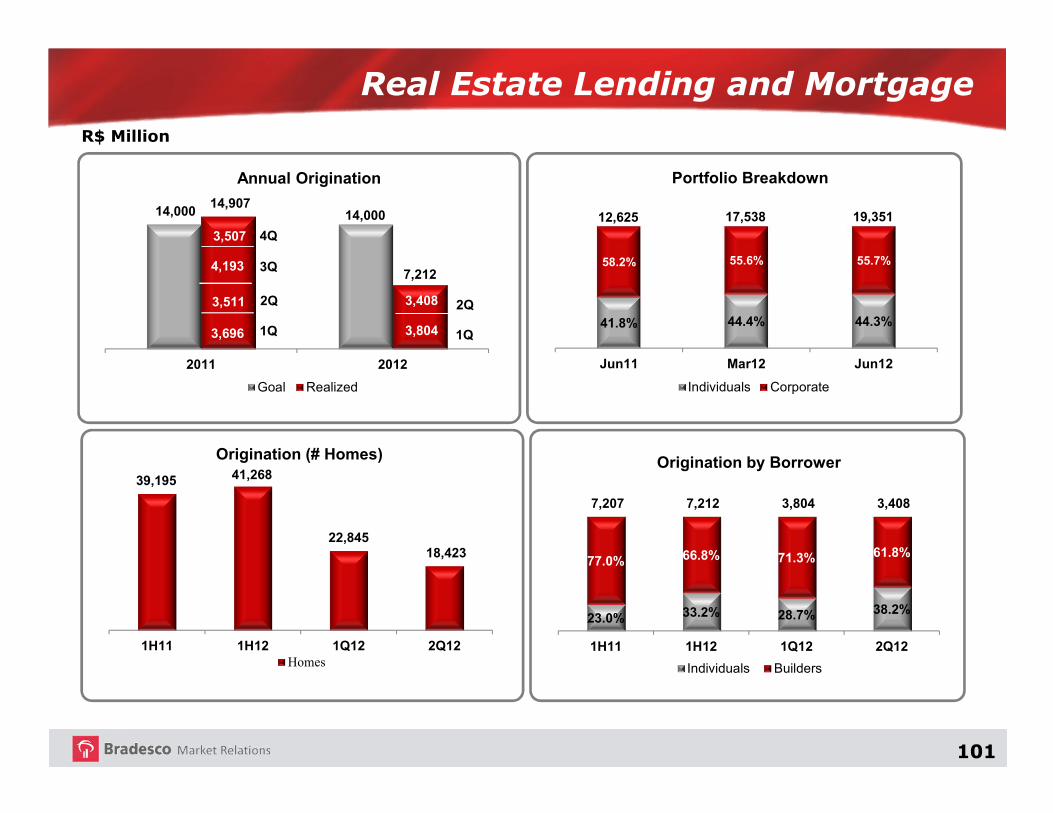
Real Estate Lending and Mortgage
R$ Million
14,000 14,000 14,907
7,212
2011 2012
Annual Origination
Goal Realized
1Q
2Q
3Q
4Q
1Q
2Q41.8% 44.4% 44.3%
58.2% 55.6% 55.7%
12,625 17,538 19,351
Jun11 Mar12 Jun12
Portfolio Breakdown
Individuals Corporate
39,195 41,268
22,84518,423
1H11 1H12 1Q12 2Q12
Origination (# Homes)
Homes
23.0% 33.2% 28.7% 38.2%
77.0% 66.8% 71.3% 61.8%
7,207 7,212 3,804 3,408
1H11 1H12 1Q12 2Q12
Origination by Borrower
Individuals Builders
3,696
3,511
4,193
3,507
3,804
3,408

102
Delinquency
Secured Fiduciary SalePre-Fixed and Post-Fixed Agreements at Bradesco
Amount % Amount % Amount %
On time 51,385 87.7% 5,298 78.4% 46,087 88.9%
1 to 3 6,042 10.3% 1,136 16.8% 4,906 9.5%
4 to 6 575 1.0% 106 1.6% 469 0.9%
7 to 12 295 0.5% 78 1.2% 217 0.4%
Over 12 325 0.6% 136 2.0% 189 0.4%
Total overdue 7,237 12.3% 1,456 21.6% 5,781 11.1%
Overall Total 58,622 6,754 51,868
1,195 2.0% 320 4.7% 875 1.7%
Total Pre PostInstallments
As of Jun12
Over 3

103
Payroll Deductible Loans
Vehicles Financing
Real Estate Lending and Mortgage
Cards
Insurance and Pension Plans
Capital Markets
High Growth Products
104
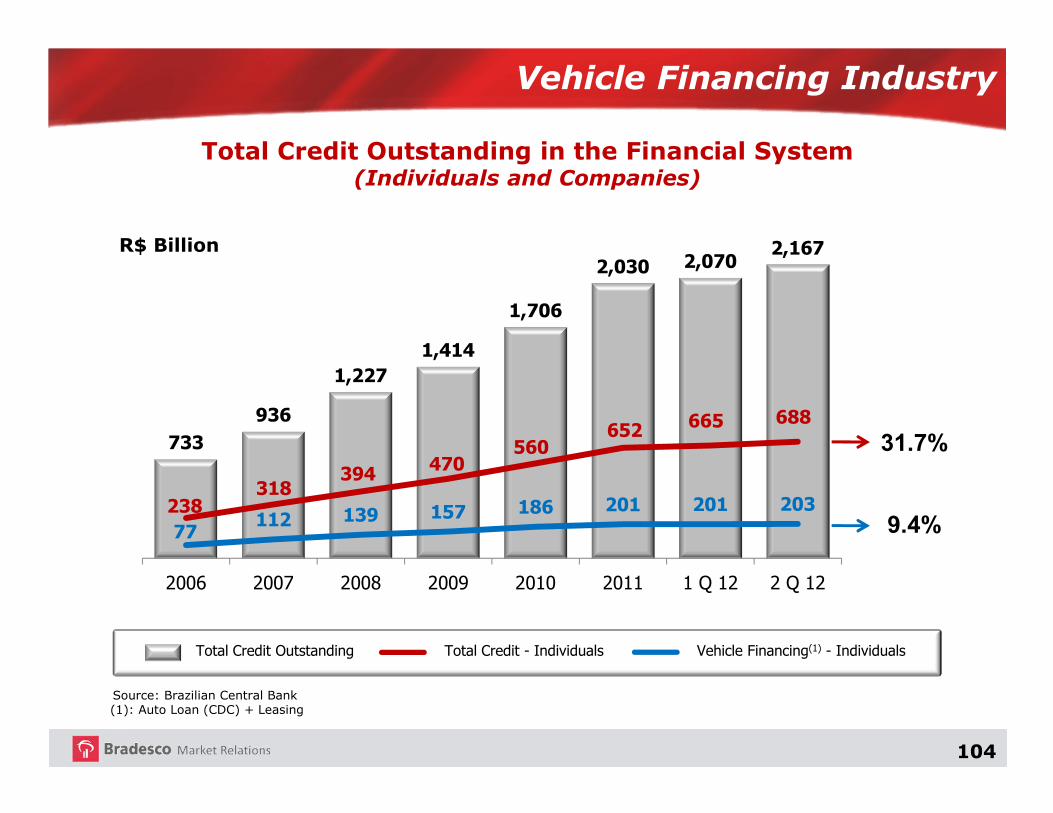
Vehicle Financing Industry
Total Credit Outstanding in the Financial System(Individuals and Companies)
Source: Brazilian Central Bank(1): Auto Loan (CDC) + Leasing
Total Credit Outstanding Vehicle Financing(1) - IndividualsTotal Credit - Individuals
31.7%
9.4%
R$ Billion
733
936
1,227
1,414
1,706
2,030 2,0702,167
238318
394470
560652
665 688
77112 139 157 186 201 201 203
2006 2007 2008 2009 2010 2011 1 Q 12 2 Q 12
105
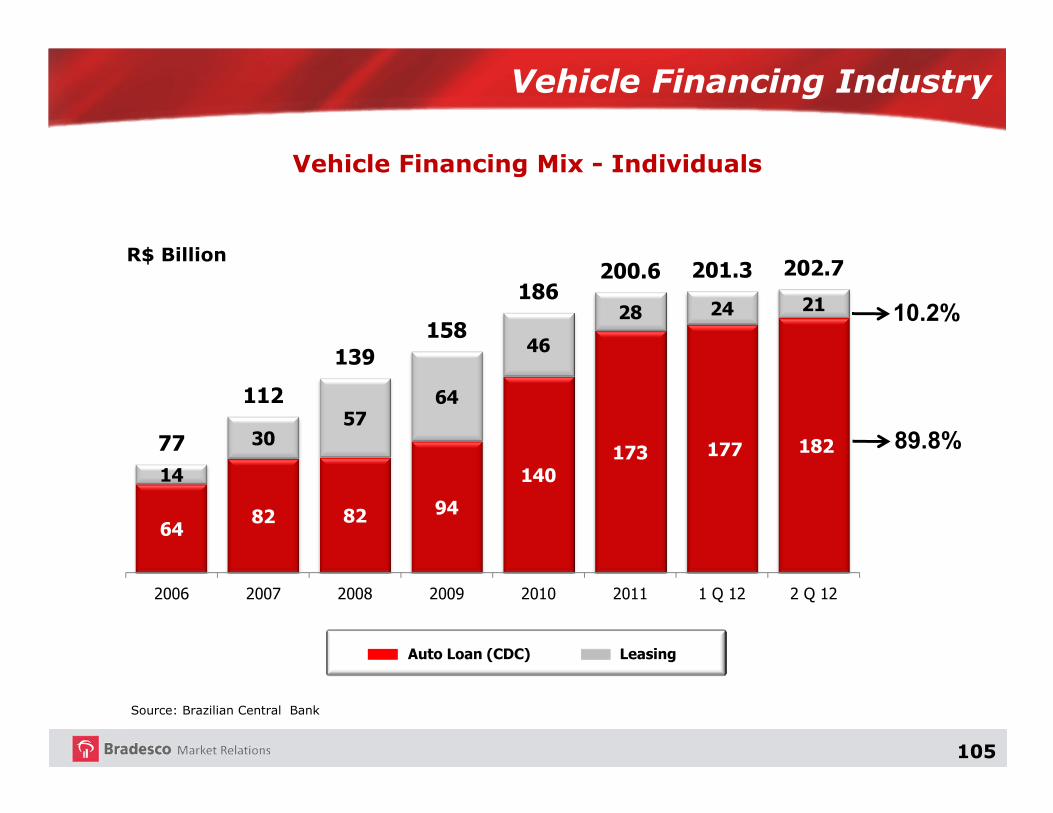
Vehicle Financing Mix - Individuals
Auto Loan (CDC) Leasing
Vehicle Financing Industry
Source: Brazilian Central Bank
R$ Billion
10.2%
89.8%
6482 82 94
140173 177 182
14
3057
64
46
28 24 21
77
112
139
158
186200.6 201.3 202.7
2006 2007 2008 2009 2010 2011 1 Q 12 2 Q 12
106
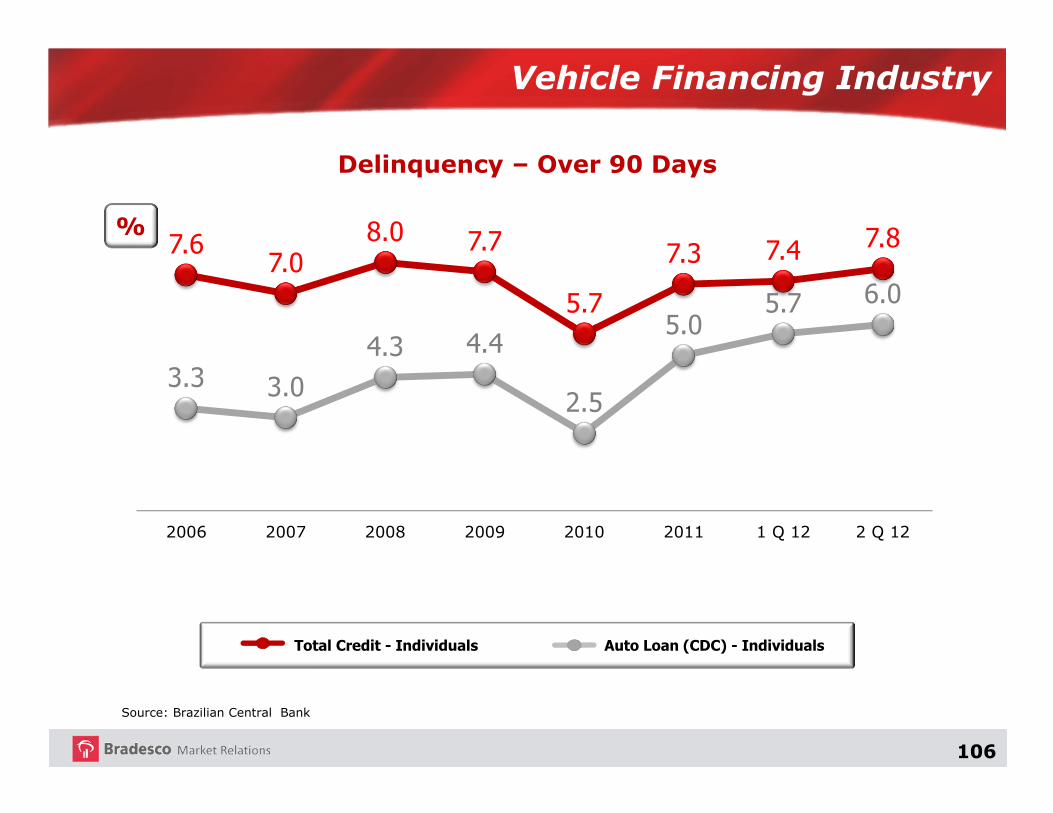
Vehicle Financing Industry
Delinquency – Over 90 Days
Source: Brazilian Central Bank
%
Auto Loan (CDC) - IndividualsTotal Credit - Individuals
3.3 3.0
4.3 4.4
2.5
5.05.7 6.0
7.67.0
8.0 7.7
5.7
7.3 7.4 7.8
2006 2007 2008 2009 2010 2011 1 Q 12 2 Q 12
107
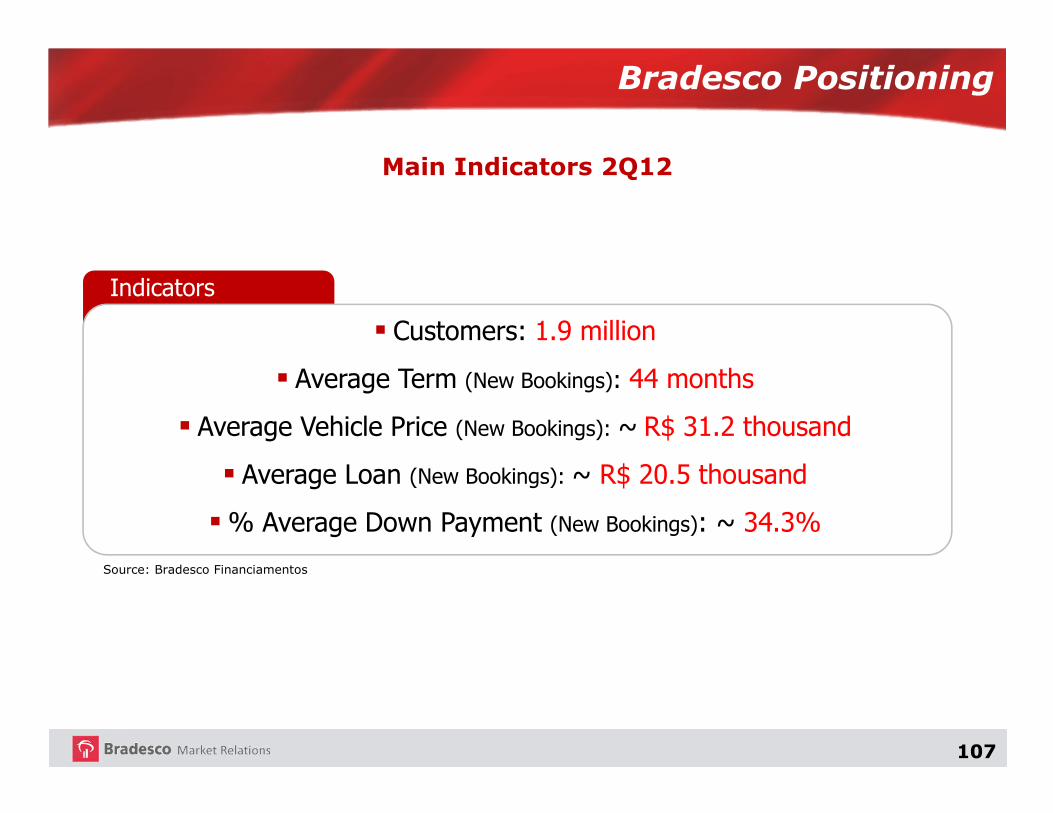
Main Indicators 2Q12
Indicators
� Customers: 1.9 million
� Average Term (New Bookings): 44 months
� Average Vehicle Price (New Bookings): ~ R$ 31.2 thousand
� Average Loan (New Bookings): ~ R$ 20.5 thousand
�% Average Down Payment (New Bookings): ~ 34.3%
Bradesco Positioning
Source: Bradesco Financiamentos
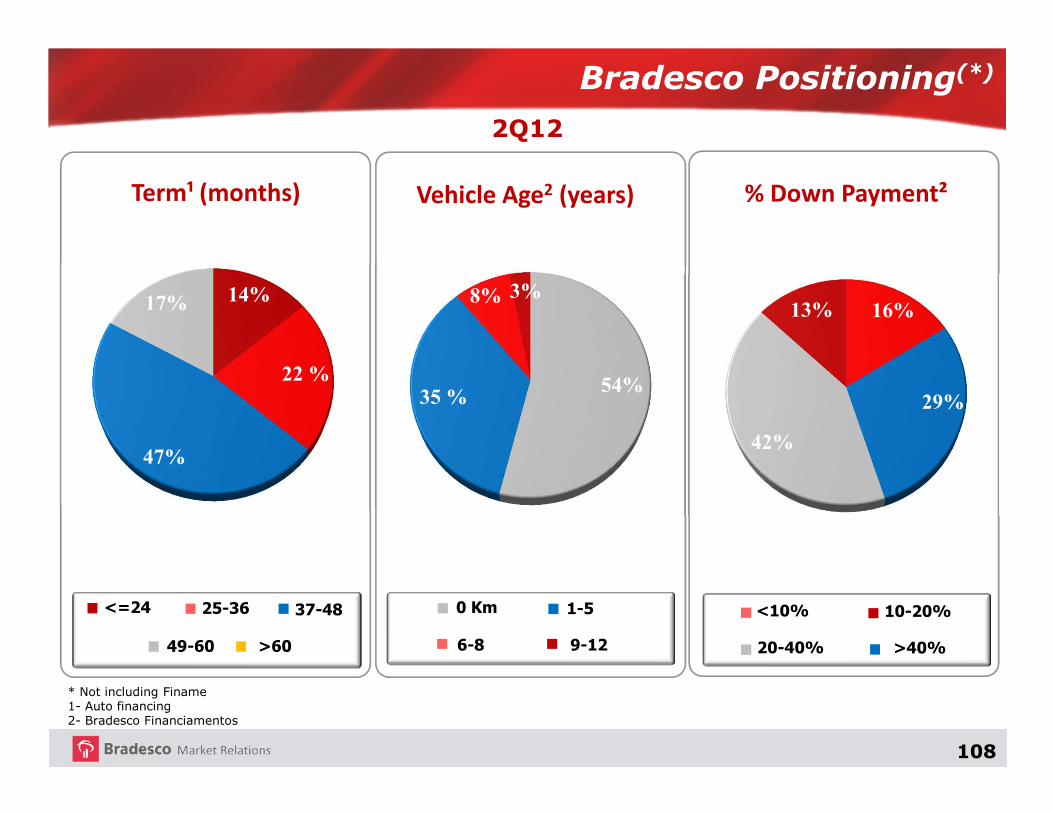
108
2Q12
<=24 37-4825-36
49-60 >60
Term¹ (months) Vehicle Age2 (years)
0 Km
6-8
1-5
9-12
<10%
20-40%
10-20%
>40%
% Down Payment²
* Not including Finame1- Auto financing2- Bradesco Financiamentos
Bradesco Positioning(*)
14%
22 %
17%
47%
54%35 %
8% 3%16%
29%
42%
13%

109
Positioning
Bradesco Portfolio (Individuals + Companies)
(R$ billion)
Individuals(R$ billion)
Vehicle Market Share – Bradesco & Bradesco Financiamentos (Auto Loan - CDC and Leasing)(1)
Source : Bacen/Bradesco/Cetip
Ranking by Segment(2)
� 1st Transportation/Agrobusiness
� 1st Motorcycle
� 3th Automobile
(1) Individuals (2) Accumulated until Jun’12(3) Not including renegociation
Bradesco & Brad. Financ.
MarketBradesco & Brad. Financ
Share~16%
(3)
(3)41.9
2Q12 2Q12
202.7
(3)
32.6
170.5

110
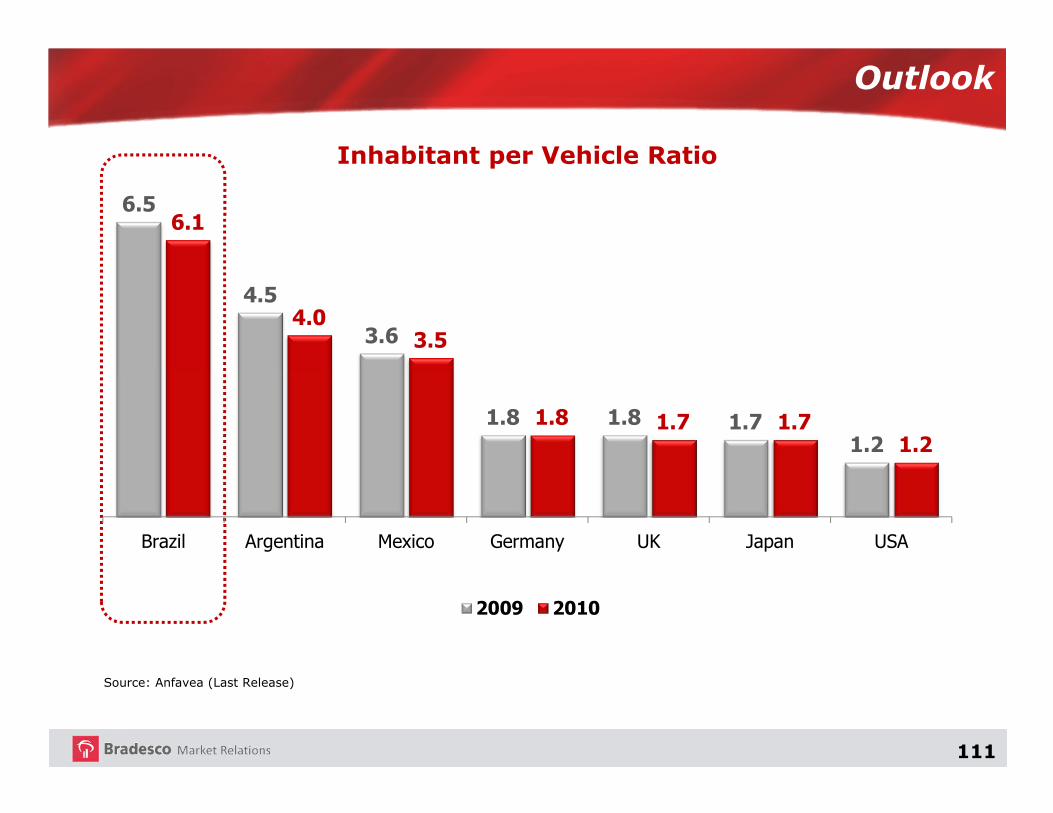
Outlook
Motorcycle(Licensed units)
2009
1.6 Million
Source: FENABRAVE
2010
1.8 Million
2011
1.94 Million
2012
1.88 Million
Decrease of -3.2%
Automobile(Licensed units)
2009
3.1 Million
2010
3.3 Million
2011
3.4 Million
2012
3.4 Million
Decrease of -0.4%
Transportation(Licensed Trucks)
2009
110 Thousand
2010
158 Thousand
2011
173 Thousand
2012
161 Thousand
Decrease of -6.9%
Forecast
111
Inhabitant per Vehicle Ratio
Source: Anfavea (Last Release)
Outlook
6.5
4.5
3.6
1.8 1.8 1.71.2
6.1
4.03.5
1.8 1.7 1.71.2
Brazil Argentina Mexico Germany UK Japan USA
2009 2010
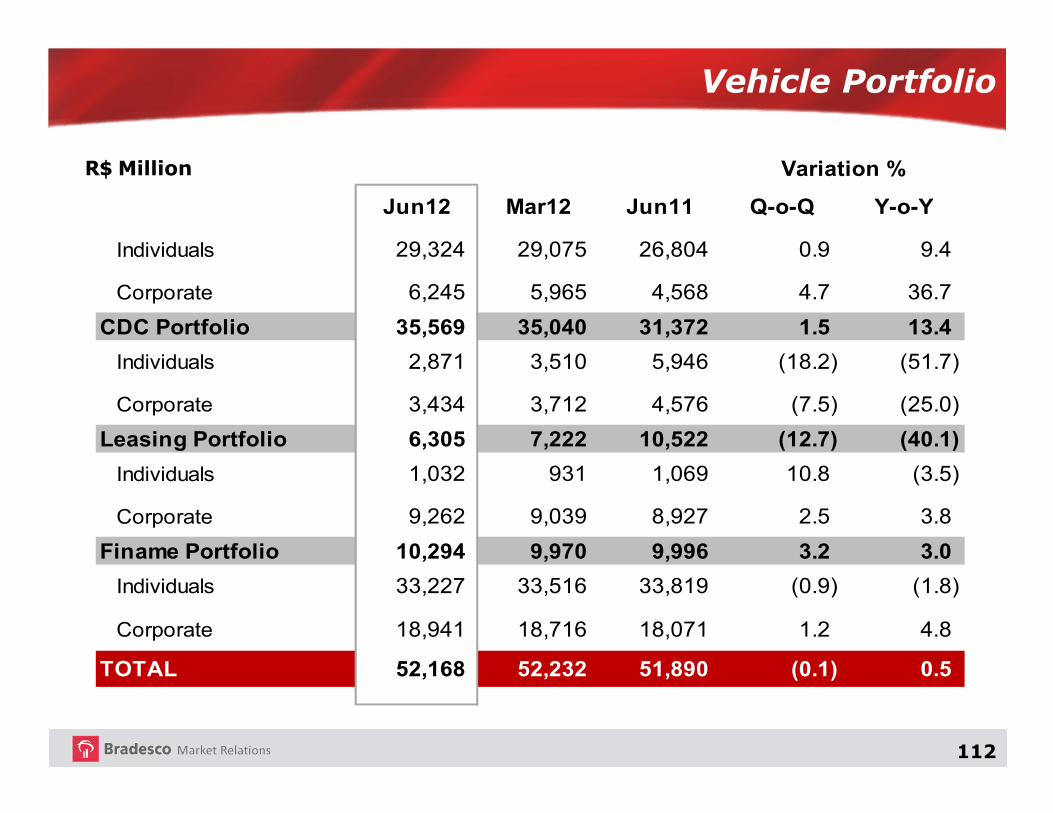
112
Vehicle Portfolio
R$ Million
Jun12 Mar12 Jun11 Q-o-Q Y-o-Y
Individuals 29,324 29,075 26,804 0.9 9.4
Corporate 6,245 5,965 4,568 4.7 36.7
CDC Portfolio 35,569 35,040 31,372 1.5 13.4
Individuals 2,871 3,510 5,946 (18.2) (51.7)
Corporate 3,434 3,712 4,576 (7.5) (25.0)
Leasing Portfolio 6,305 7,222 10,522 (12.7) (40.1)
Individuals 1,032 931 1,069 10.8 (3.5)
Corporate 9,262 9,039 8,927 2.5 3.8
Finame Portfolio 10,294 9,970 9,996 3.2 3.0
Individuals 33,227 33,516 33,819 (0.9) (1.8)
Corporate 18,941 18,716 18,071 1.2 4.8
TOTAL 52,168 52,232 51,890 (0.1) 0.5
Variation %

113
Payroll Deductible Loans
Real Estate Lending and Mortgage
Cards
Insurance and Pension Plans
Capital Markets
High Growth Products
Vehicles Financing
114
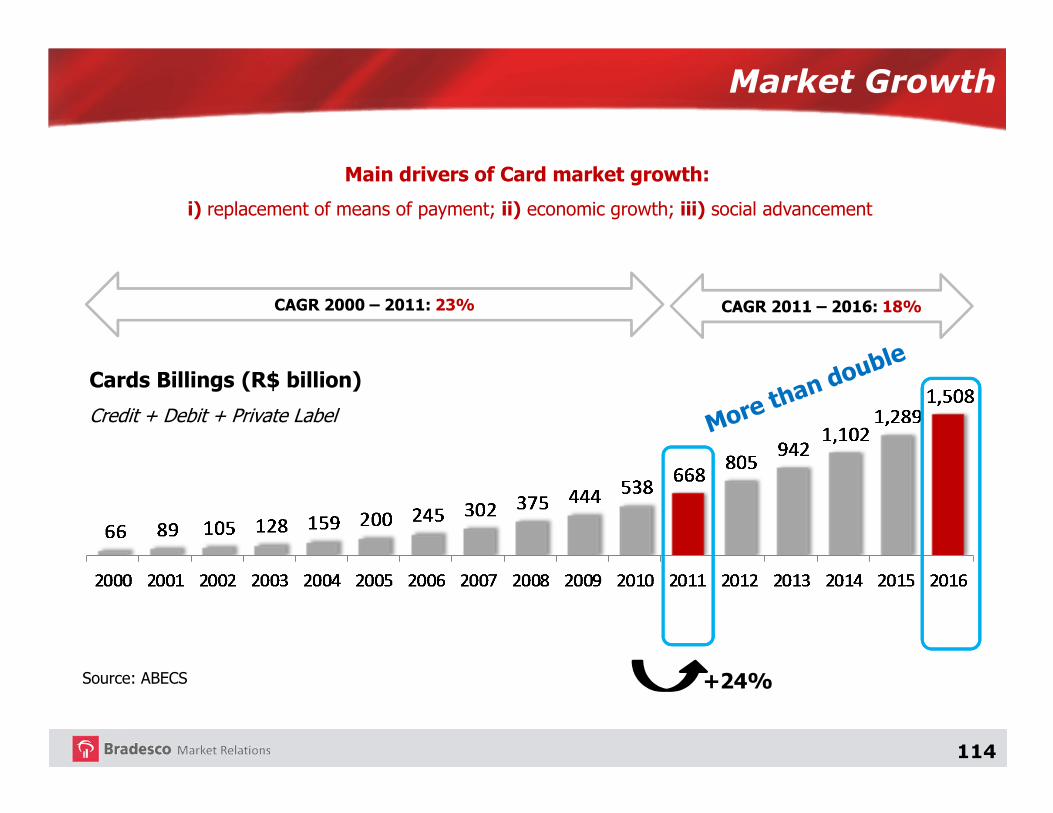
Market Growth
CAGR 2011 – 2016: 18%CAGR 2000 – 2011: 23%
Cards Billings (R$ billion)
Credit + Debit + Private Label
Source: ABECS +24%
Main drivers of Card market growth:
i) replacement of means of payment; ii) economic growth; iii) social advancement

115
1.1 1.4 1.6 1.9
2.53.2
3.74.4
5.3
6.17.1
8.1
2.6 2.6 2.4 2.2
2.1 1.9 1.7 1.5 1.4 1.2 1.1 1.0
2000 2001 2002 2003 2004 2005 2006 2007 2008 2009 2010 2011
Source: ABECS / BACEN
Cards replacing checks
Number of transactions with cards and checks (bn)
Brazilian Payments
Cards Checks

116
France
USA
Source: ABECS / IBGE / BACEN / BIS / The Nilson Report
Compared to other countries, Brazil still has a lot of room for growth. Maintaining current trend, actual level of Canada should be achieved only in 2030
International Comparison
Australia
Canada
South Korea
UK
%
117
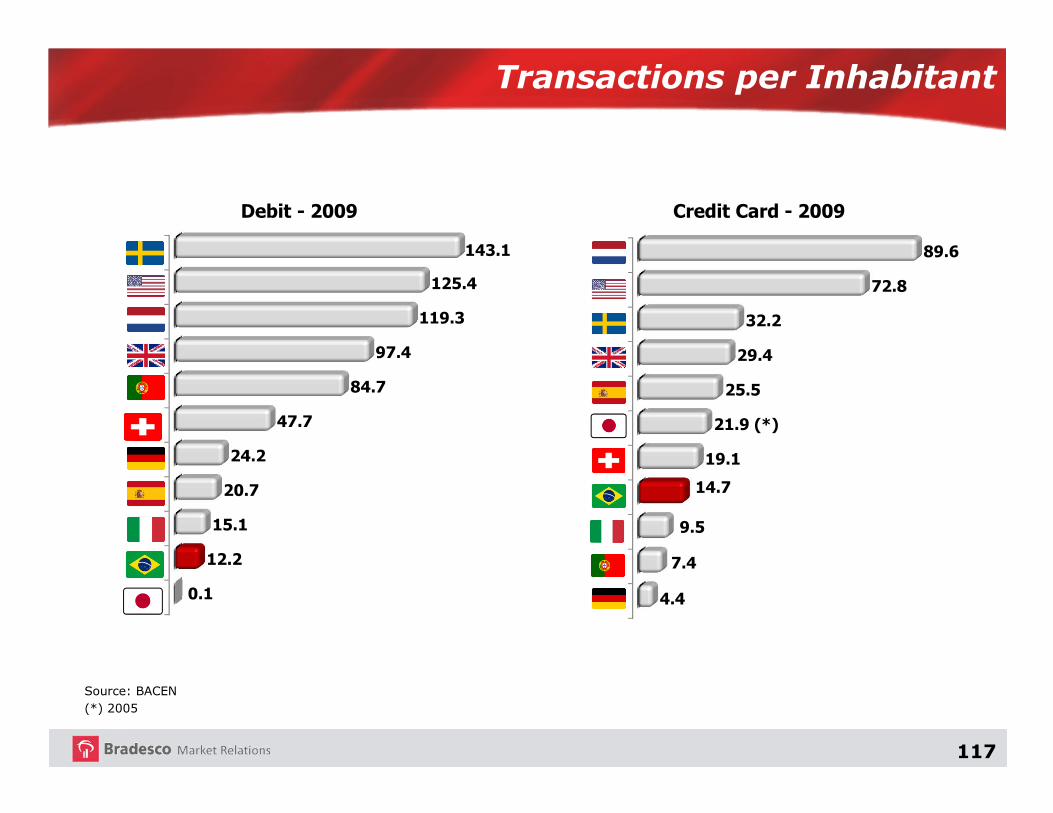
Transactions per Inhabitant
0.1
12.2
15.1
20.7
24.2
47.7
84.7
97.4
119.3
125.4
143.1
Source: BACEN (*) 2005
Credit Card - 2009
4.4
7.4
9.5
14.7
19.1
21.9 (*)
25.5
29.4
32.2
72.8
89.6
Debit - 2009
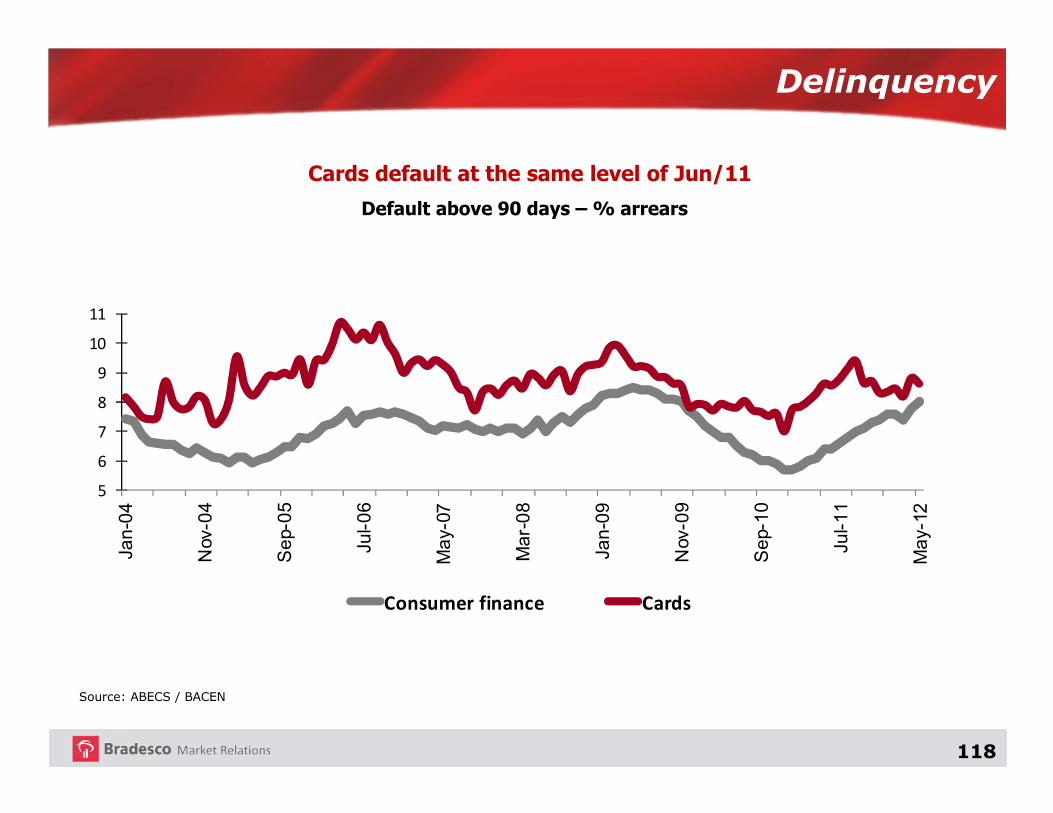
118
5
6
7
8
9
10
11
Jan-04
Nov-04
Sep-05
Jul-06
May-07
Mar-08
Jan-09
Nov-09
Sep-10
Jul-11
May-12
Consumer finance Cards
Default above 90 days – % arrears
Source: ABECS / BACEN
Cards default at the same level of Jun/11
Delinquency
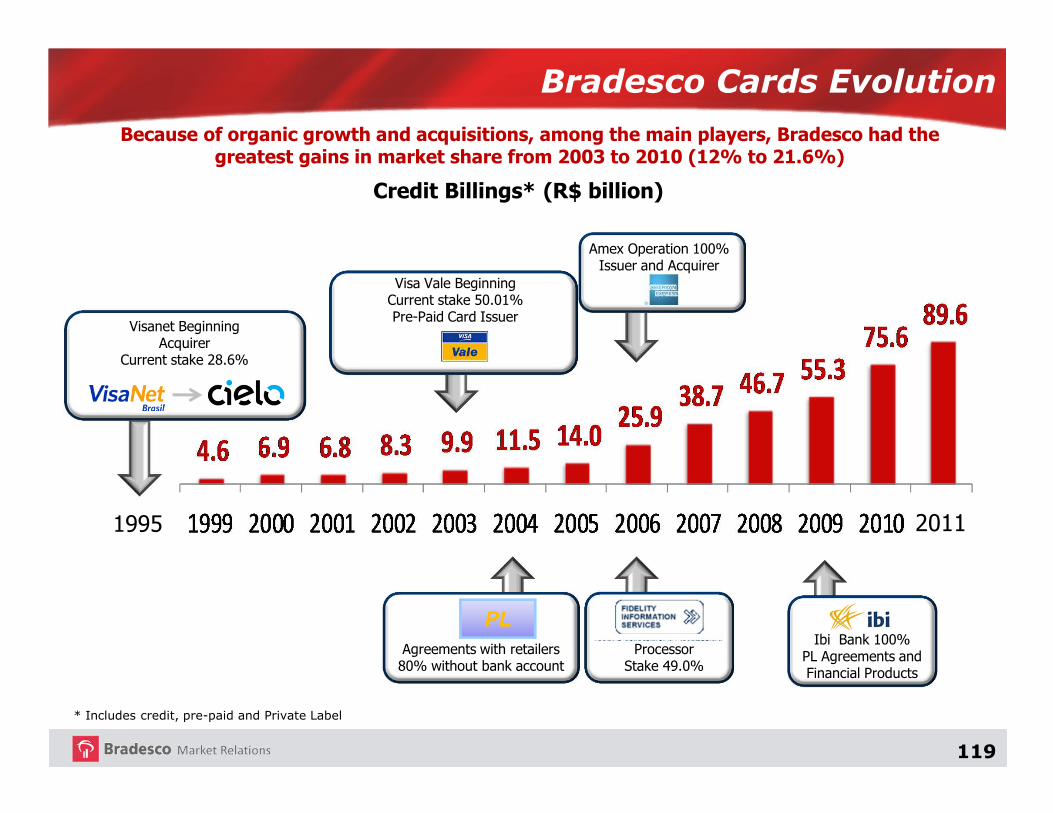
119
Because of organic growth and acquisitions, among the main players, Bradesco had the greatest gains in market share from 2003 to 2010 (12% to 21.6%)
1995
Visanet BeginningAcquirer
Current stake 28.6%
Visa Vale BeginningCurrent stake 50.01%Pre-Paid Card Issuer
Agreements with retailers 80% without bank account
ProcessorStake 49.0%
Ibi Bank 100%PL Agreements and Financial Products
Credit Billings* (R$ billion)
Amex Operation 100%Issuer and Acquirer
Bradesco Cards Evolution
* Includes credit, pre-paid and Private Label
PL
2011

120
Bradesco creates value and participates in the entire value chain of the cards industry
Integrated Card Business
150.2 MM Cards: 95.3 MM Credit | 54.8 MM Debit
ISSUER ASSOCIATED COMPANIESPRIVATE LABEL
More than 30 partners
Participation:
Bradesco Cards
Partners:
Companies that are part of
the Holding Elo
Fidelity 49.00%
50.01%
Elo bandeira 33.33%
28.65%
Elo Participações50.01%
• Ibi Promotora
• Banco CBSS (to be created)

121
Performance
Bradesco Cards Main Indicators
Total Number of Credit Cards
7%
MMCredit Card Billings
15%
R$ bn
Card Loans
13%
Service Revenue
19%
R$ MMR$ bn
89.0
95.3
42.2
48.6
2,391
2,84532.9
29.1
jun/11 jun/12 1S11 1S12
jun/11 jun/12 1S11 1S12
1H11 1H12
1H11 1H12

122
Payroll-Deductible Loans
Real Estate Lending and Mortgage
Cards
Insurance and Pension Plans
Capital Markets
High Growth Products
Vehicles Financing

123
Source: Brazilian Central Bank
Change in Nominal Stock of Payroll Loans
Payroll-deductible loans generated R$175.2 bn in Jun/12,
representing 58.8% of the personal loan market
R$ Million

124
Market Information
Credit to individuals has been strongly driven by
payroll loans
Credit to Individuals
R$ Million
Source: Brazilian Central Bank As of Jun/11 to Jun/12
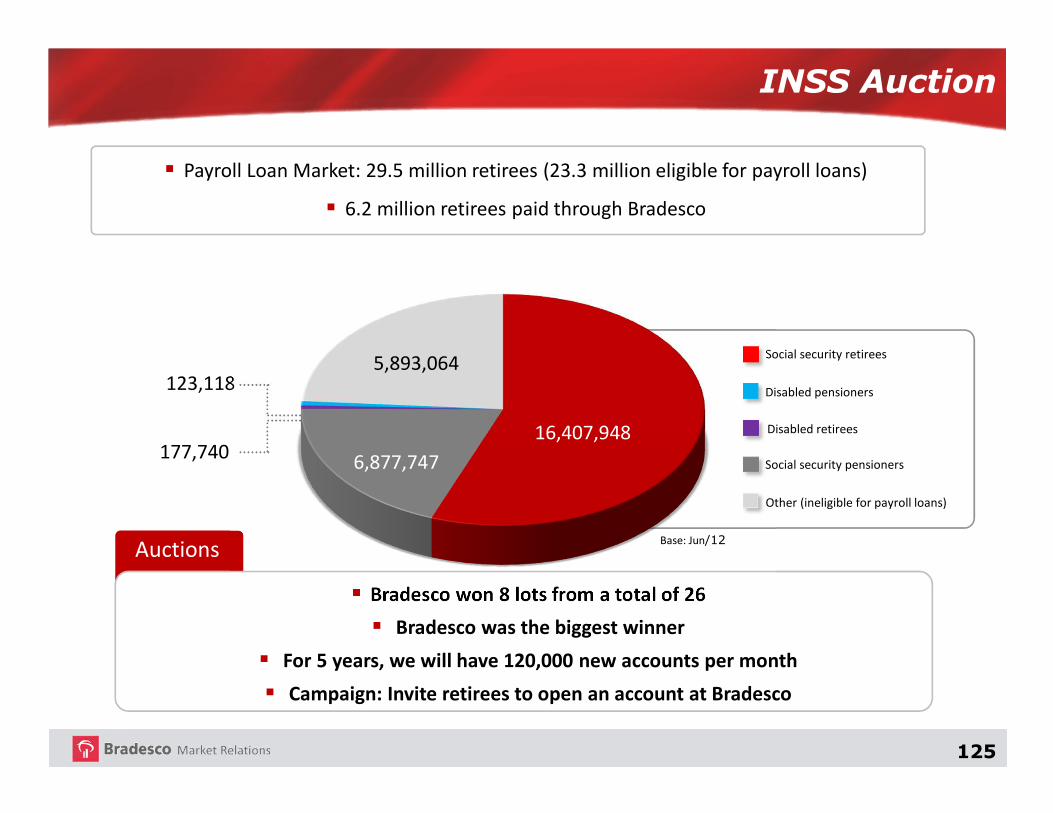
125
INSS Auction
� Payroll Loan Market: 29.5 million retirees (23.3 million eligible for payroll loans)
� 6.2 million retirees paid through Bradesco
Auctions
� Bradesco won 8 lots from a total of 26
� Bradesco was the biggest winner
� For 5 years, we will have 120,000 new accounts per month
� Campaign: Invite retirees to open an account at Bradesco
123,118
177,74016,407,948
6,877,747
5,893,064Social security retirees
Disabled pensioners
Disabled retirees
Social security pensioners
Other (ineligible for payroll loans)
Base: Jun/12

126
Market Share
Jun/11 Jun/12 Variation
R$ 149.1 Bn R$ 175.3 Bn 17.5%Market
R$ 16.5 Bn R$ 19.5 Bn 18.3%Bradesco
11.0% 11.1% 0.07 p.p.Share
127
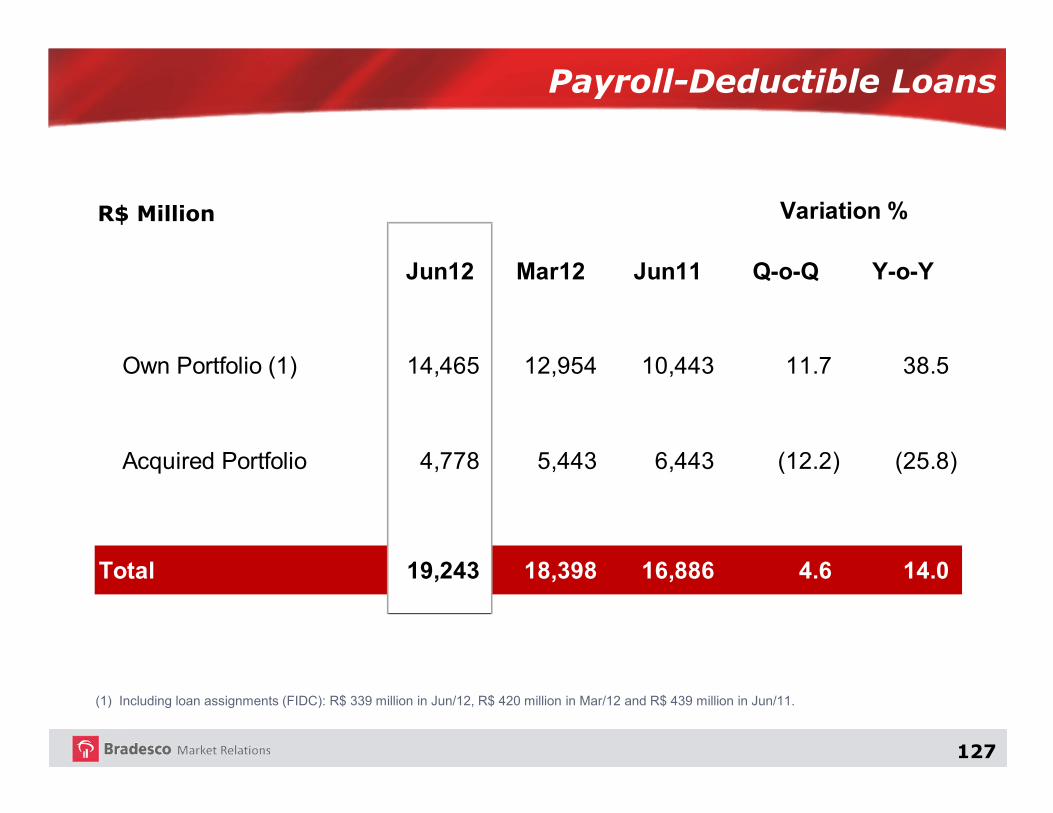
Payroll-Deductible Loans
R$ Million
(1) Including loan assignments (FIDC): R$ 339 million in Jun/12, R$ 420 million in Mar/12 and R$ 439 million in Jun/11.
Jun12 Mar12 Jun11 Q-o-Q Y-o-Y
Own Portfolio (1) 14,465 12,954 10,443 11.7 38.5
Acquired Portfolio 4,778 5,443 6,443 (12.2) (25.8)
Total 19,243 18,398 16,886 4.6 14.0
Variation %

128
Payroll Deductible Loans
Real Estate Lending and Mortgage
Cards
Insurance and Pension Plans
Capital Markets
High Growth Products
Vehicles Financing

129
ITALY
Brazil and World Insurance Market (1)
(1) Not including Savings Bonds
GDP
WRITTEN PREMIUMS% WRITTEN
PREMIUMS/GDP
1st
1st
8.1%
2nd
6th
3.0%
3rd
2nd
11.0%
4th
5th
6.8%
5th
4th
9.5%
6th
3rd
11.8%
7th
14th
3.2%
8th
7th
7.0%
Source: Swiss RE
Insured Homes: 10%
Health Plans Cover 24%
of the population
Insured vehicles: 30%
8% of the population has dental insurance
UKFRANCEGERMANYJAPANCHINAUSA
1.70%
of Global
Market
BRAZIL

130
Saving Bonds
Health
Auto
P&C
Pension Plans
Life
6.2%
47.0%
13.7%
22.2%
29.3%
17.3%
Market
Share
TOTAL 24.5%
Domestic Market Share*
6th
1st
3rd
2nd
1st
2nd
Ranking
1st
* Market Share by RevenueSource: Susep/ANS Data Base: May/12

131
Insurance Group by Region
South
NortheastNorth Midwest
Southeast
32.5%
25.5%
20.6%
26.1%
17.2%
Up to May/12Source: Susep / ANS
Written Premiums of theInsurance Group
Market Share

132
2002
Source: CNSeg /Susep/ ANS/FenaSeg
Domestic Market – Decade of Insurance
(R$ Million)
225.52%
12%
Estimated Annual Growth
(2011/ 2012)
2002 2011Pension Plans 9,705 53,577
Auto 9,621 24,700
P&C 5,958 17,756
Life 8,244 19,107
Health 6,092 16,752
Saving Bonds 5,230 14,102
44,850 145,994
2011
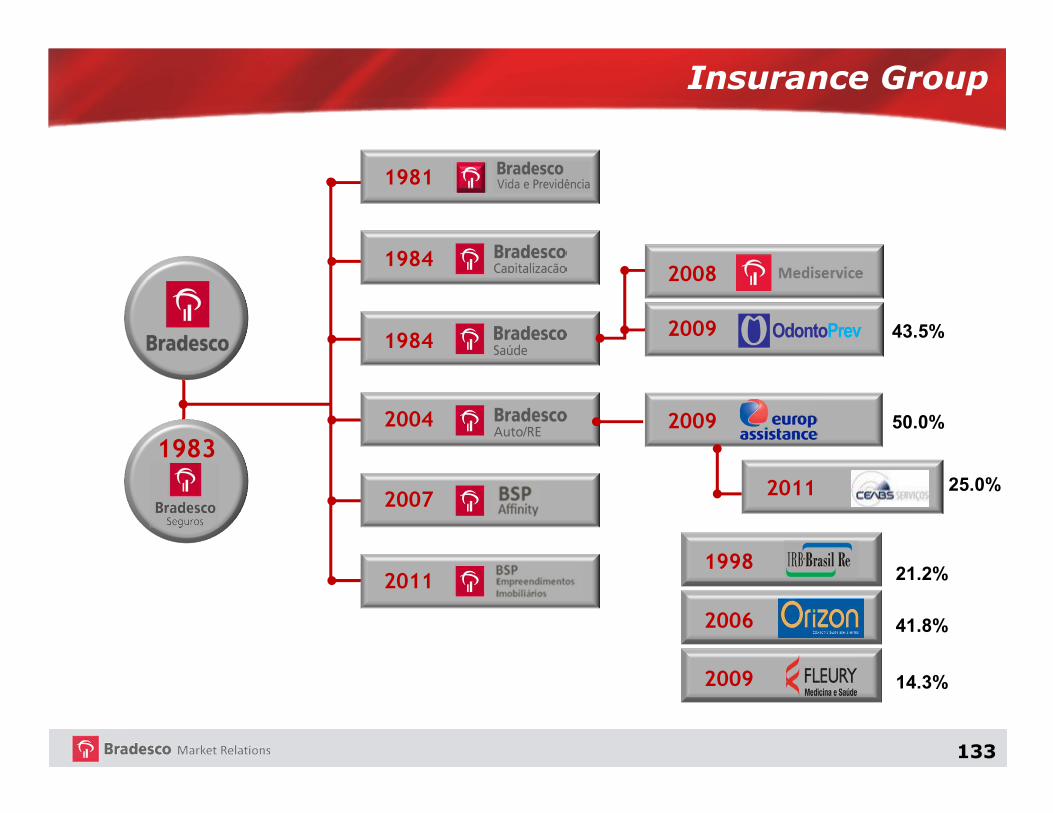
133
Insurance Group
1983
1981
1984
1984
2004
2007
2011
2009
2008
2009
1998
2009
2006
2011 25.0%
14.3%
41.8%
21.2%
43.5%
50.0%

134
Insurance and Pension Plans
R$ Million
2Q12 1Q12 1H12 1H11 Q-o-Q Y-o-Y
Insurance Written Premiums, Pension Plan Contribution and Savings Bonds Income
11,570 9,418 20,988 17,473 22.8 20.1
Insurance Realized Premiums, Pension Plans Contribution and
Savings Bonds Income 5,413 5,212 10,625 9,107 3.9 16.7
Financial Net Income 722 973 1,695 1,772 (25.8) (4.3)
Other Operating Income 356 256 612 498 39.1 22.9
Retained Claims (3,108) (3,080) (6,188) (5,442) 0.9 13.7
Savings Bonds Raffles and Redemptions (800) (709) (1,509) (1,191) 12.8 26.7
Selling Expenses (552) (546) (1,098) (902) 1.1 21.7
General and Administrative Expenses (498) (473) (971) (1,015) 5.3 (4.3)
Other Operating Expenses (47) (100) (147) (151) (53.0) (2.6)
Tax Expenses (123) (115) (238) (225) 7.0 5.8
Operating Income 1,363 1,418 2,781 2,451 (3.9) 13.5
Equity Result 90 96 186 117 (6.3) 59.0
Non-Operating Income (10) (9) (19) (18) 11.1 5.6
Income before Taxes and Minority Interest 1,443 1,505 2,948 2,550 (4.1) 15.6
Tax and Contributions (525) (561) (1,086) (858) (6.4) 26.6
Profit Sharing (19) (20) (39) (29) (5.0) 34.5
Minority Interest (18) (19) (37) (102) (5.3) (63.7)
Adjusted Net Income 881 905 1,786 1,561 (2.7) 14.4
Income Statement Summary Variation %

135
Combined Ratio and Other Information(1)
Technical Provisions
Technical Provisions
(1) Financial Assets and Technical Provisions; and (2) Excluding Additional Provisions;
R$ Billion
85.3 85.1 86.1 85.8 86.2 83.6
85.6 85.0
3T10 4T10 1T11 2T 3T 4T 1T12 2T
Índice Combinado (2)Combined Ratio (2)
106.2
122.1 128.5
Jun11 Mar12 Jun12
Ativos FinanceirosFinancial Assets
93.9
107.0 111.8
Jun11 Mar12 Jun12
Provisões TécnicasTechnical Provisions
82,0
93,9 98,2
Jun11 Mar12 Jun12
Previdência e Vida/VGBL
Pension Plans andLife/VGBL
3.9 4.1 4.2
Jun11 Mar12 Jun12
Health
3,8 4,1
4,3
Jun11 Mar12 Jun12
Auto/RE
4,1 4,7
4,9
Jun11 Mar12 Jun12
CapitalizaçãoSaving bonds
3Q10 4Q10 1Q11 2Q 3Q 4Q 1Q12 2Q

136
Revenues From Written Premiums, Pension Plan Contributions and Savings Bonds
R$ Million

137
Written Premiums (¹)
% %
Life and Pension Plans54,7
Health24,9
SavingsBonds8.0
Auto/P&C andOthers12.4
R$ 17,473 million R$ 20,988 million
1H11 1H12
Life and Pension Plans56.0
Health24.1
SavingsBonds8.3
Auto/P&C andOthers11.6
+20.1%
Note: (1) Pension Plans’ Contributions and Savings Bonds Income
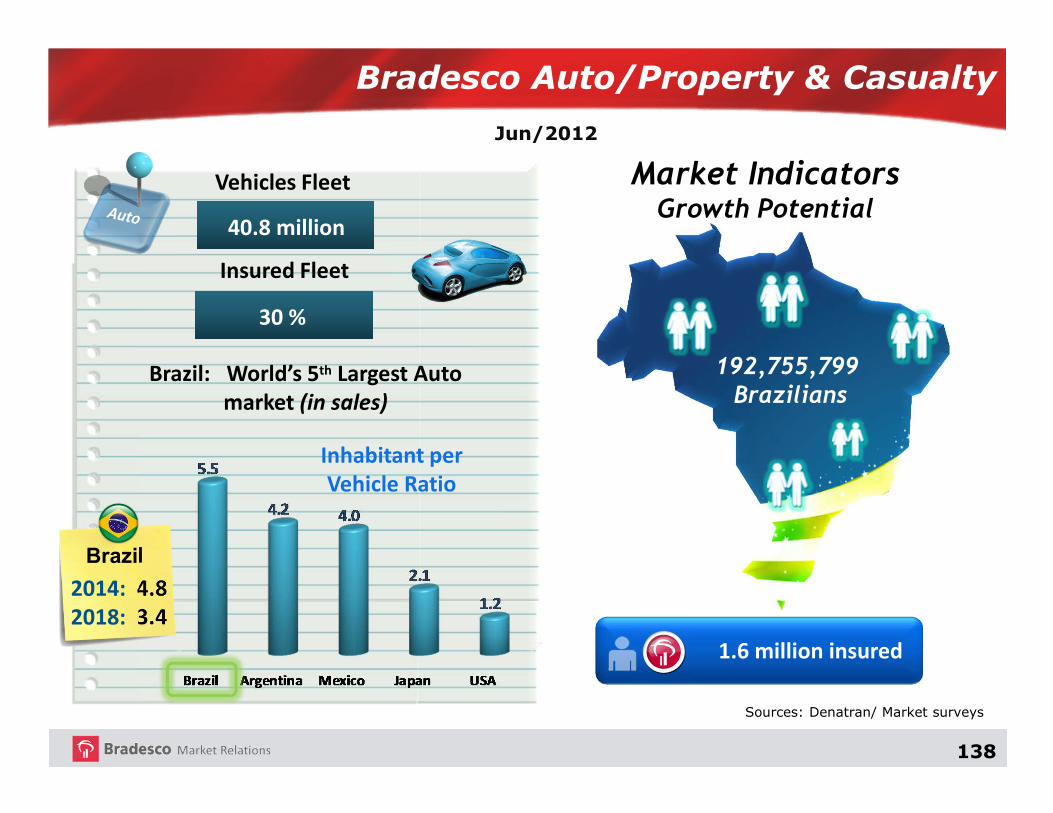
138
1.6 million insured
Market IndicatorsGrowth Potential
192,755,799 Brazilians
Vehicles Fleet
40.8 million
Insured Fleet
30 %
Brazil: World’s 5th Largest Auto
market (in sales)
2014: 4.8
2018: 3.4
Brazil
Inhabitant per
Vehicle Ratio
Jun/2012
Sources: Denatran/ Market surveys
Bradesco Auto/Property & Casualty

139
2.2 million insured
Market IndicatorsGrowth Potential
Sources: IBGE / Market surveys
Jun/2012
Number of Homes
58 million
Insured Homes
10 % 5.8 million
192,755,799 Brazilians
Bradesco Auto/Property & Casualty
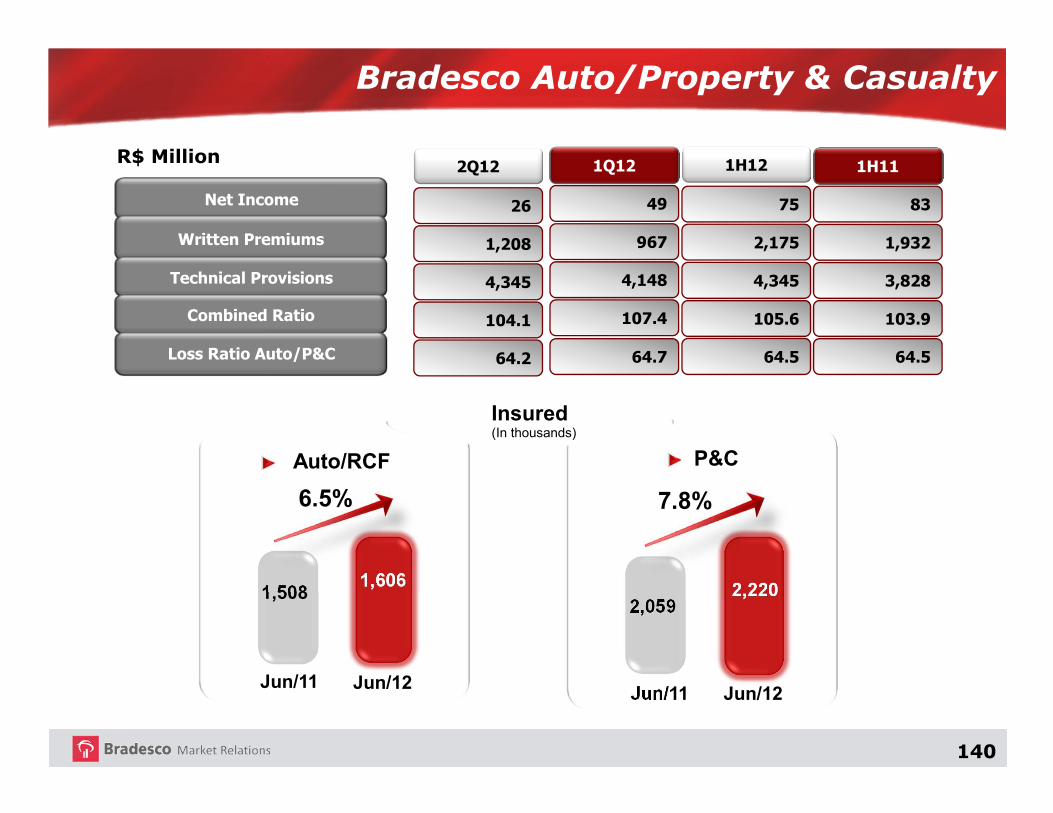
140
Bradesco Auto/Property & Casualty
Net Income
Written Premiums
Technical Provisions
Combined Ratio
Loss Ratio Auto/P&C
83
1,932
1H11
3,828
103.9
64.5
1H12
75
2,175
4,345
105.6
64.5
R$ Million
49
967
1Q12
4,148
107.4
64.7
2Q12
26
1,208
4,345
104.1
64.2
2,220
Jun/11 Jun/12
2,059
P&C
1,606
Jun/11 Jun/12
(In thousands)
Auto/RCF
1,508
6.5% 7.8%
Insured

141
Saving Bonds
Net Income
Revenues from Bonds
Technical Provisions
165
1,400
1H11
4,096
195
1,732
1H12
4,886
R$ Million
104
795
1Q12
4,663
91
937
2Q12
4,886
Clients
3,358
Jun/11 Jun/12
(In thousands)
2,888
16.3%

142
Health
Loss Ratio
Combined Ratio
Net Income
Written Premiums
87.6
99.8
401
3,956
1H11
Technical Provisions 3,848
86.3
97.4
299
4,589
1H12
4,128
86.4
97.9
151
2,251
1Q12
4,072
R$ Million
86.1
96.9
148
2,338
2Q12
4,128
3,707
Jun/11 jun/12
3,244
14.3%
(In thousands)
Insured

143
Life & Pension Plans
Loss Ratio
Combined Ratio
Net Income
Revenues
Technical Provisions
41.3
70.8
493
5,009
1Q12
93,861
42.3
69.5
987
11,746
1H12
98,199
45.5
73.7
912
9,552
1H11
81,991
R$ Million
43.5
68.4
494
6,737
2Q12
98,199
23,030
Jun/11 Jun/12
20,9862,227
Jun/11 Jun/12
(Thousands)
2,123
4.9%9.7%
Members/Insured
LifePension Planswith VGBL

144
Payroll Deductible Loans
Real Estate Lending and Mortgage
Cards
Insurance and Pension Plans
Capital Markets
High Growth Products
Vehicles Financing

145
12,727
10,210
8,873
4,743
1,937
1,828
Bradesco BBI
Itaú BBA
Banco do Brasil
BTG Pactual
HSBC
Santander
774
736
674
622
614
471
Bradesco BBI
Goldman Sachs
BofA Merrill Lynch
JP Morgan
Itaú BBA
Banco do Brasil
5,946
4,082
3,707
3,271
1,765
1,633
Bradesco BBI
BTG Pactual
BofA
Itaú BBA
Rothschild
Deutsche Bank
� Bradesco BBI is the Investment Banking arm of Banco Bradesco
� One of the leading investment banks in Brazil
� Strong presence in fixed income, equity and M&A transactions
Bradesco BBI Overview
Source: ANBIMA and BloombergNotes: (1) ANBIMA Ranking of transactions of the first half of 2012; (2) ANBIMA Equity Ranking of transactions of the first half of 2012; (3) Bloomberg Ranking of 2Q12 (announced transactions)
Ranking Equity Offerings2 (R$ Million)Ranking Fixed Income1 (R$ million)
Visanet: Largest IPO in Brazil’s history
� Deal of the Year 2009
Petrobras: Largest equity offering in history
� Deal of the Year 2010
Gerdau: Largest equity offering in Brasil in 2011
� Deal of the Year 2011
Joint Bookrunner &
Global Coordinator
Follow-on
R$ 120,248 million
Sep/2010
Joint Bookrunner
Follow-on
R$ 4,958 million
Apr/2011
Joint Bookrunner &
Global Coordinator
IPO
R$ 8.4 billion
Jun/2009
Banco do Brasil: US$ 750 million bond issue
Petrobras: CRI issue to fund the company’s
headquarter construction in Santos (São Paulo)
Grupo Serveng: Long-term project financing
for wind power project in Rio Grande do Norte
Best Investment Bankin Brazil
Ranking M&A3 (US$ million)
Sadia & Perdigão: Deal of the Year 2009
Fleury & Labs D’or: Deal of the Year 2010
OI Group Restructuring: Deal of the Year 2011
Advisor of
In acquisition of
R$ 1,190 million
Jul/2011
Advisor to
And its special independent
committee on the proposed
reorganization of Oi Companies
R$ 22,000 million
Aug/2011
Advisor to Sadia on its merger with
Perdigão, criating BRF – Brasil Foods
R$ 25,304 million
Sep/2009
Co-Lead
CRI
R$ 405 million
Jan/2012
Advisor
For the Long-Term Project Financing for Wind Power Project in Rio Grande do Niorte with 170 MW capacity and estimated capex of
754.6 million
R$ 557 million
Jan/2012
Joint Bookrunner
Bond
USD 750 million
Feb/2012

146
BRAM - Bradesco Asset Management
Management Quality rating of MQ1 since 2004
The strongest rating in the international scale assigned
by Moody’s.
BRAM became a signatory of Principles for Responsible Investment (PRI).
Note: (1) ANBIMA Ranking of Management; (2) R$ 2.00 : US$ 1.00 in 06/29/2012.
1 429,895
2 311,672
3 262,411
4 127,259
5 118,899
6 94,522
7 80,467
8 39,799
9
36,05710
39,148
BB
ITAÚ-UNIBANCO
BRAM
SANTANDER
CAIXA
BTG PACTUAL
BNY MELLON
VOTORANTIM ASSET
SAFRA
HSBC
Amount
(R$ million)Institution
03/30/2012
1 404,245
2 286,176
3 233,679
4 118,448
5 111,974
6 85,176
7 76,480
8 42,608
9 38,325
10 34,443
12/31/2011
BB
ITAÚ-UNIBANCO
BRAM
SANTANDER
CAIXA
HSBC
BTG PACTUAL
BNY MELLON
SAFRA
VOTORANTIM ASSET
Amount
(R$ million)Institution
12/31/2011
R$ 274.9 billion (US$ 137.5 billion2) in assets under management
Ranking of Assets Under Management – Domestic Market 1Ranking of Assets Under Management – Domestic Market 1
1 436,264
2 307,638
3 274,942
4 133,401
5 120,844
6 94,421
7 82,071
8 38,373
9
36,38810
36,862
BB
ITAÚ-UNIBANCO
BRAM
SANTANDER
CAIXA
BTG PACTUAL
BNY MELLON
VOTORANTIM ASSET
CREDIT SUISSE
HSBC
Amount
(R$ million)Institution
06/29/2012

147
2011 Guidance x Realized
(1) Expanded Loan Portfolio; (2) Does not include the “BNDES Cards” and “Discounts on Advances of Receivables” portfolios;(3) Under current criterion, Guidance for Financial Margin; and(4) Administrative and Personnel Expenses.
2011 Realized Status 15 to 19% 17% 13 to 17% 11%
16 to 20% 20%
20 to 24% 23%
11 to 15% 19%
10 to 14% 5%
Cards (2) 9 to 13% 10%
R$ 14.0 bn R$ 14.9 bn
30 to 34% 29%
18 to 22% 20% 10 to 14% 14%
15 to 18% 17%
15 to 18% 21%
Loan Portfolio (1)
Individuals
Corporates
SMEs
Large Corporates
Products
Vehicles
Operating Expenses (4)
Insurance Premiums
Mortgages (origination)
Payroll-Deductible Loans
Net Interest Income (3)
Fee Income

148
2012 Guidance
(1) Expanded Loan Portfolio; (2) Changed from 18% - 22% to 14% - 18%; (3) Changed from 16% - 20% to 12% - 16%; (4) Changed from 18% -22% to 14% -18%; (5) Changed from 23% - 27% to 16% - 20%; (6) Changed from 4% - 8% to 2% - 6%; (7) Changed from 13% - 17% to 10% -14%; (8) Does not include the “BNDES Cards” and “Discounts on Advances of Receivables” portfolios; (9) Changed from R$ 11.4 bn to R$ 14.0bn; (10) Under current criterion, Guidance for NII - Interest-Earning Portion; (11) Changed from 8% - 12% to 10% - 14%; (12) Administrative andPersonnel Expenses; and (13) Changed from 13% - 16% to 15% - 19%.
14 to 18% 12 to 16%
14 to 18%
16 to 20 %
13 to 17%
Vehicles (6) 2 to 6%
Cards (7) (8) 10 to 14%
Mortgages (origination) (9) R$ 14.0 bn
Payroll-Deductible Loans 26 to 30%
10 to 14%
10 to 14%
8 to 12%
15 to 19%
Loan Portfolio (1) (2)
Individuals (3)
SMEs (5)
Products
Fee Income (11)
Operating Expenses (12)
Insurance Premiums (13)
Net Interest Income (10)
Corporates (4)
LARGE CORPORATES

149

150
E-mail: [email protected]
www.bancodoplaneta.com.br
Market Relations Department
Avenida Paulista, 1450 – 1st floor
Bela Vista - São Paulo, SP
Phone : (55 11) 2178-6201 - Fax: (55 11) 2178-6215
Social and Environmental Responsibility
E-mail: [email protected]
www.bradesco.com.br/ir
Investor Relations
E-mail: [email protected]
www.bancodoplaneta.com.br
E&S Management and Monitoring of Projects
Contact Information